1. Introduction
Natural lightning is a strong instantaneous discharge process [
1]. Lightning damage is one of the main causes of faults in transmission lines [
2]. Lightning overvoltages pose a significant threat to the stability of power systems [
3]. As ultra-high voltage (UHV) and extra-high voltage (EHV) transmission lines are increasingly built, the complexity of lightning strikes and their impact on transmission systems have become more pronounced. Accurately assessing the effects of lightning impulse voltages on transmission line insulation systems is crucial for improving the reliability and safety of the power grid [
4,
5].
In recent years, discharge models based on physical mechanisms have developed rapidly. In the study of positive discharge, Xie [
6] proposed a thermal ionization model based on the streamer–leader transition to calculate the leader inception process in positive long air gaps. This model was experimentally validated and shown to effectively simulate the leader inception process. Peng [
7] developed a three-dimensional thermal-ionization model based on the streamer-to-leader transition to simulate the inception and development of positive leaders in long air gaps, which was experimentally validated and further extended through laboratory studies showing that the number of leader branches increases with applied voltage and the discharge paths become more dispersed [
8]. For negative discharge, Guo [
9] proposed an effective simplified model that successfully simulated the stepwise phenomena in negative long air gaps, and validated the model through comparison with experimental data. Wu [
10] studied the discharge characteristics of combined air gaps under positive switching impulses, focusing on the effects on discharge paths and breakdown voltages. Zhao [
11] analyzed the formation of heating segments, presenting their distinct characteristics in both positive and negative discharges, and explored the influence of different voltage types on the formation of these heating segments. Yue [
12] discussed the current waveform characteristics in long air gaps under different voltages, revealing the differences in current waveforms between positive and negative discharges.
Although numerous studies have explored the characteristics and physical mechanisms of positive and negative discharges, in practical applications, the discharge process is still significantly influenced by factors such as tower structure and gap conditions. Therefore, based on the existing research, this study will further investigate the characteristics and differences in positive and negative discharges under different tower structures and gap conditions, providing theoretical guidance for lightning protection design in high-voltage transmission lines.
2. Physical Model of Positive and Negative Polar Discharges
2.1. Positive Discharge Process Analysis
Positive long air gap discharge typically follows a streamer–leader development pattern, with the discharge process divisible into several stages [
6]:
2.2. Negative Discharge Process Analysis
Negative long air gap discharge exhibits distinct stepped characteristics compared to positive discharge. The process of negative discharge can typically be divided into the following stages [
6]:
Streamer initiation stage: Similarly to positive discharge, negative discharge also begins with streamer discharge. When the electric field strength reaches the critical value, a streamer channel is formed. However, the potential gradient Es in negative discharge is higher, approximately 750 kV/m.
Streamer development stage: Under the potential gradient Es, the streamer develops forward. The potential gradient Es of negative streamers is stronger than that of positive, and the internal electric field strength in negative discharge is higher, around 100–200 kV/m [
18,
19].
Space stem and space leader initiation stage: When the space charge accumulated in the streamer region reaches the critical value (approximately 0.5 μC), a space stem begins to form. At this point, thermal ionization occurs, and the space stem transitions into a bidirectional leader channel.
Leader Development Stage: As the space charge continues to accumulate, when the charge reaches 5.4 μC, the main negative leader begins to develop. The main negative leader then connects with the space bidirectional leader, forming a step, and subsequently develops into the next step. As the leader system develops to a certain extent, a final jump occurs, leading to the breakdown of the air gap.
2.3. Lightning Impulse Setting
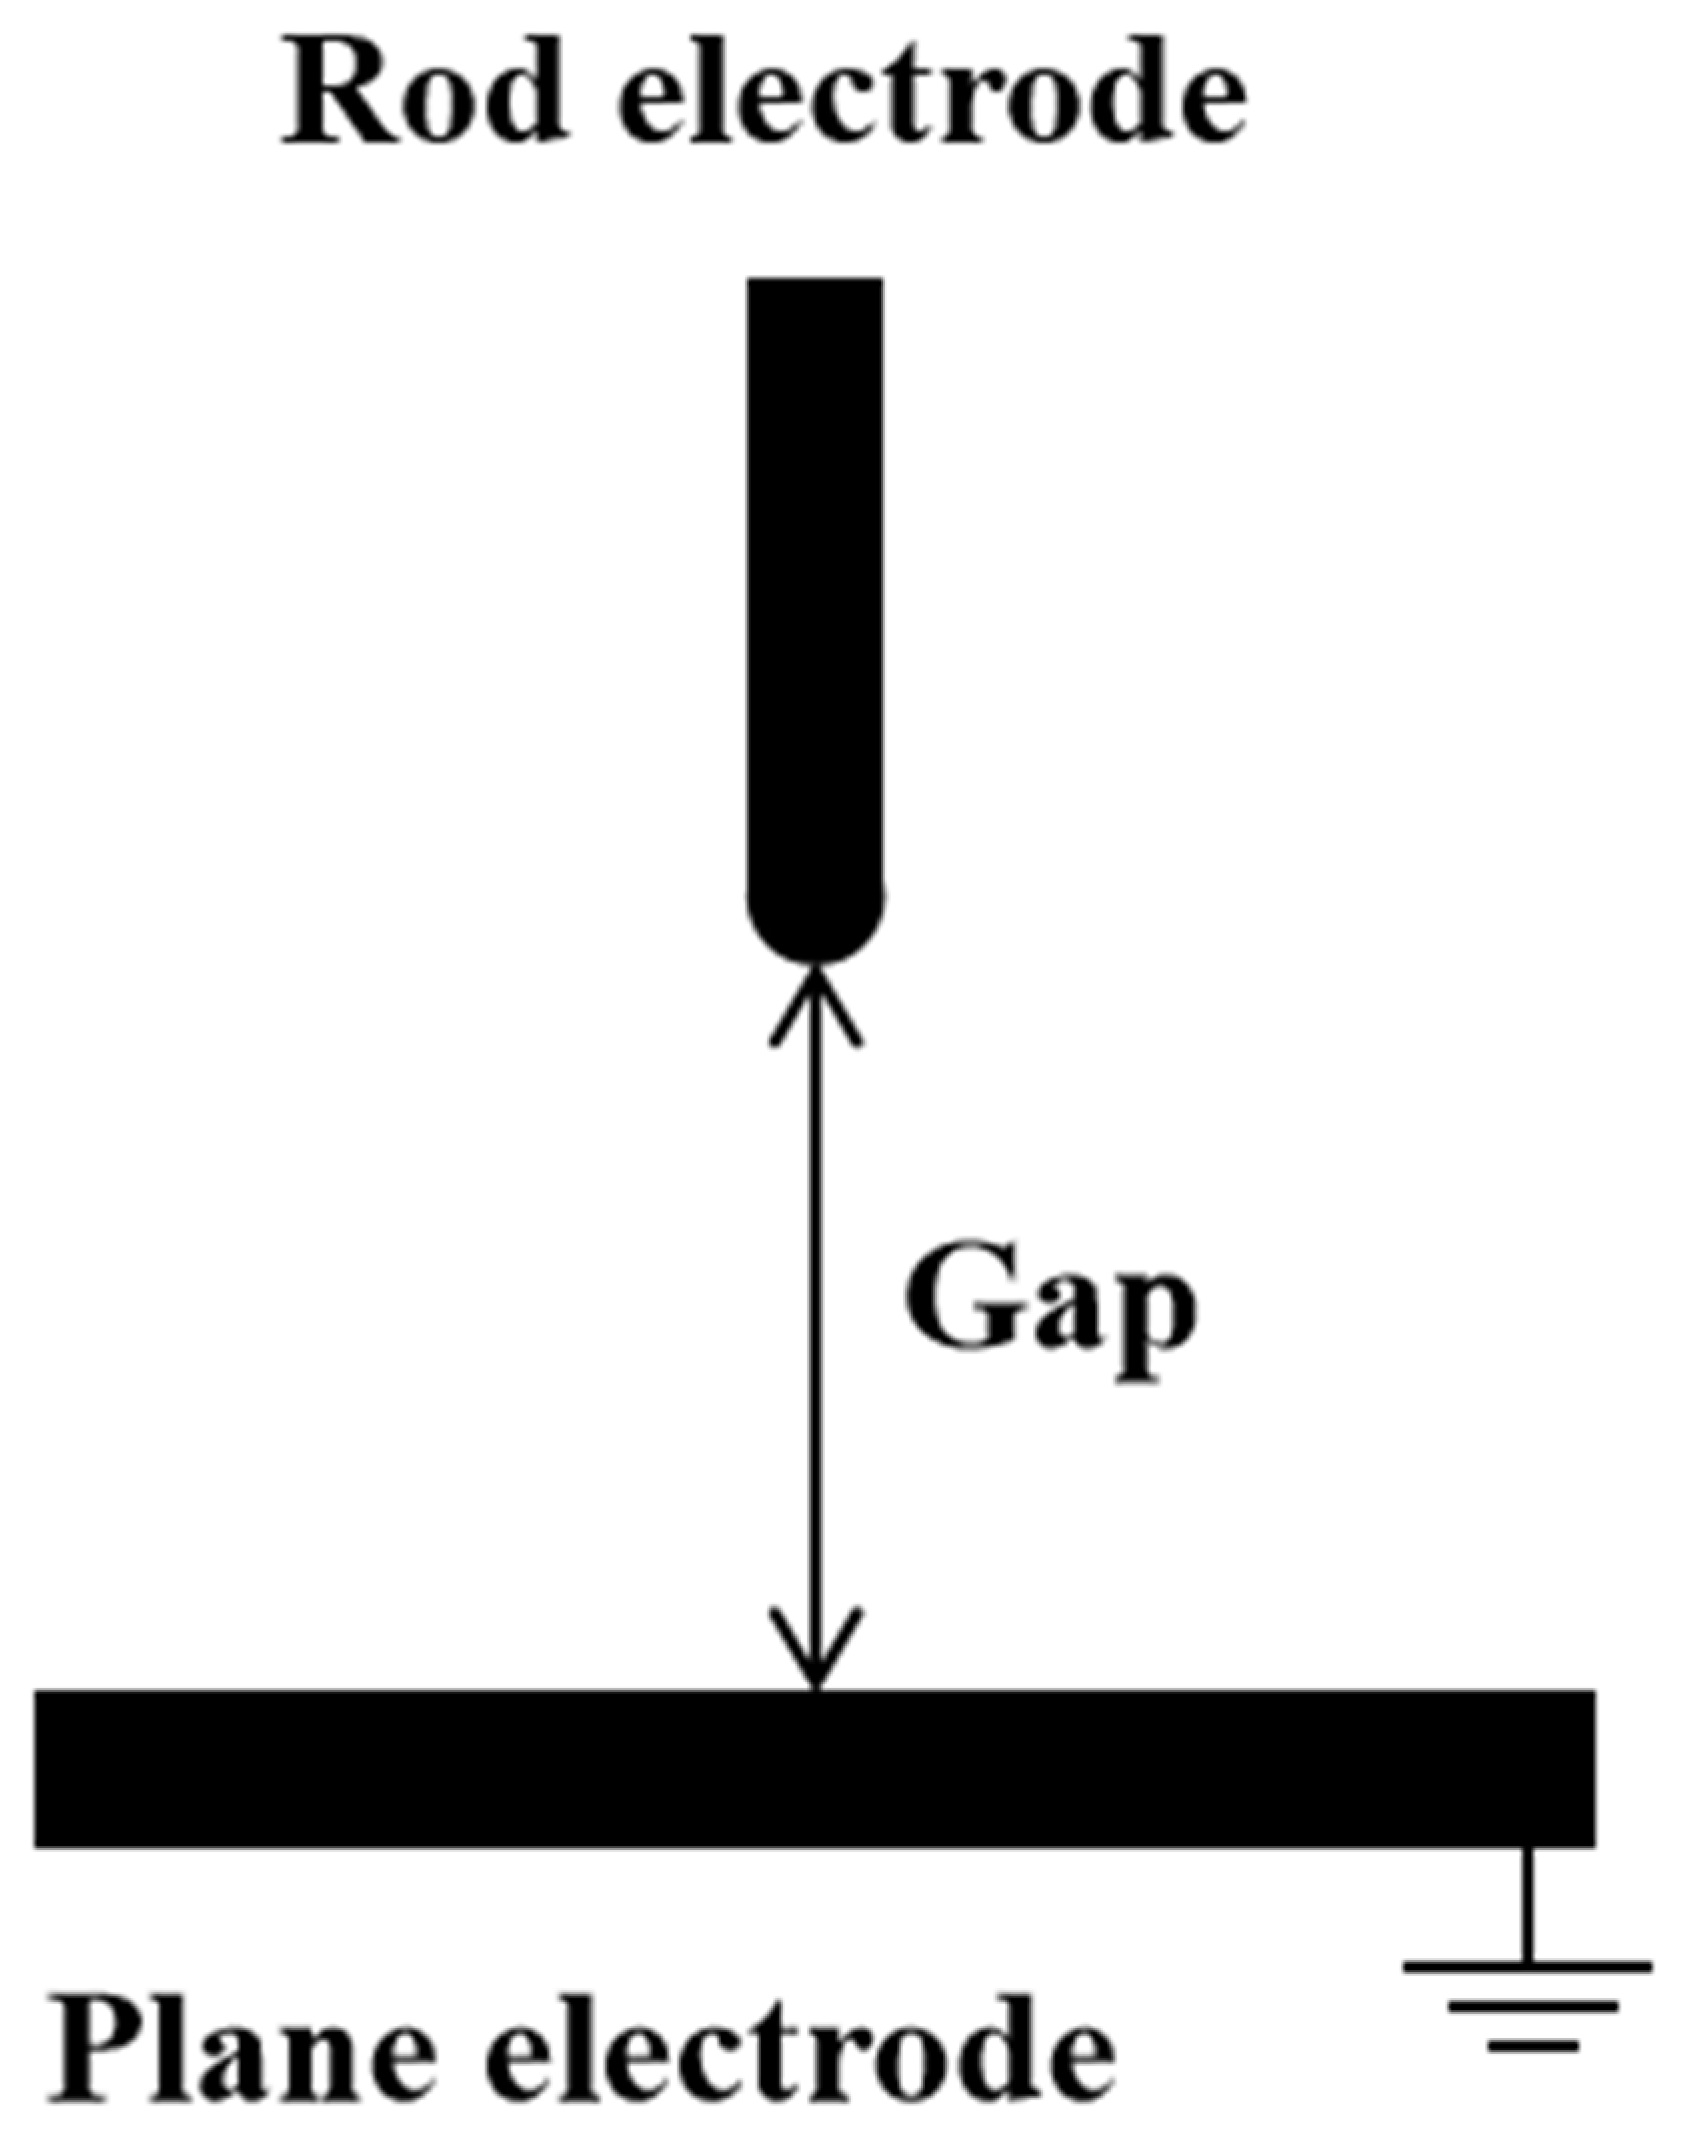
The rod-plate gap structure is established, as shown in
Figure 1. In this paper, the 1.2/50 μs standard lightning impulse voltage waveform specified in the IEC 60060-1:2010 standard [
20] is applied as the external voltage to the rod electrode. The lightning impulse voltage waveform is represented by a double-exponential function. The relationship of the 1.2/50 μs standard lightning impulse voltage is as follows:
In the equation, U(t) is the standard lightning impulse waveform, with t representing time, A is the amplitude coefficient, and τ1 and τ2 are the time constants for the wavefront and tail, respectively.
2.4. Simulation Process
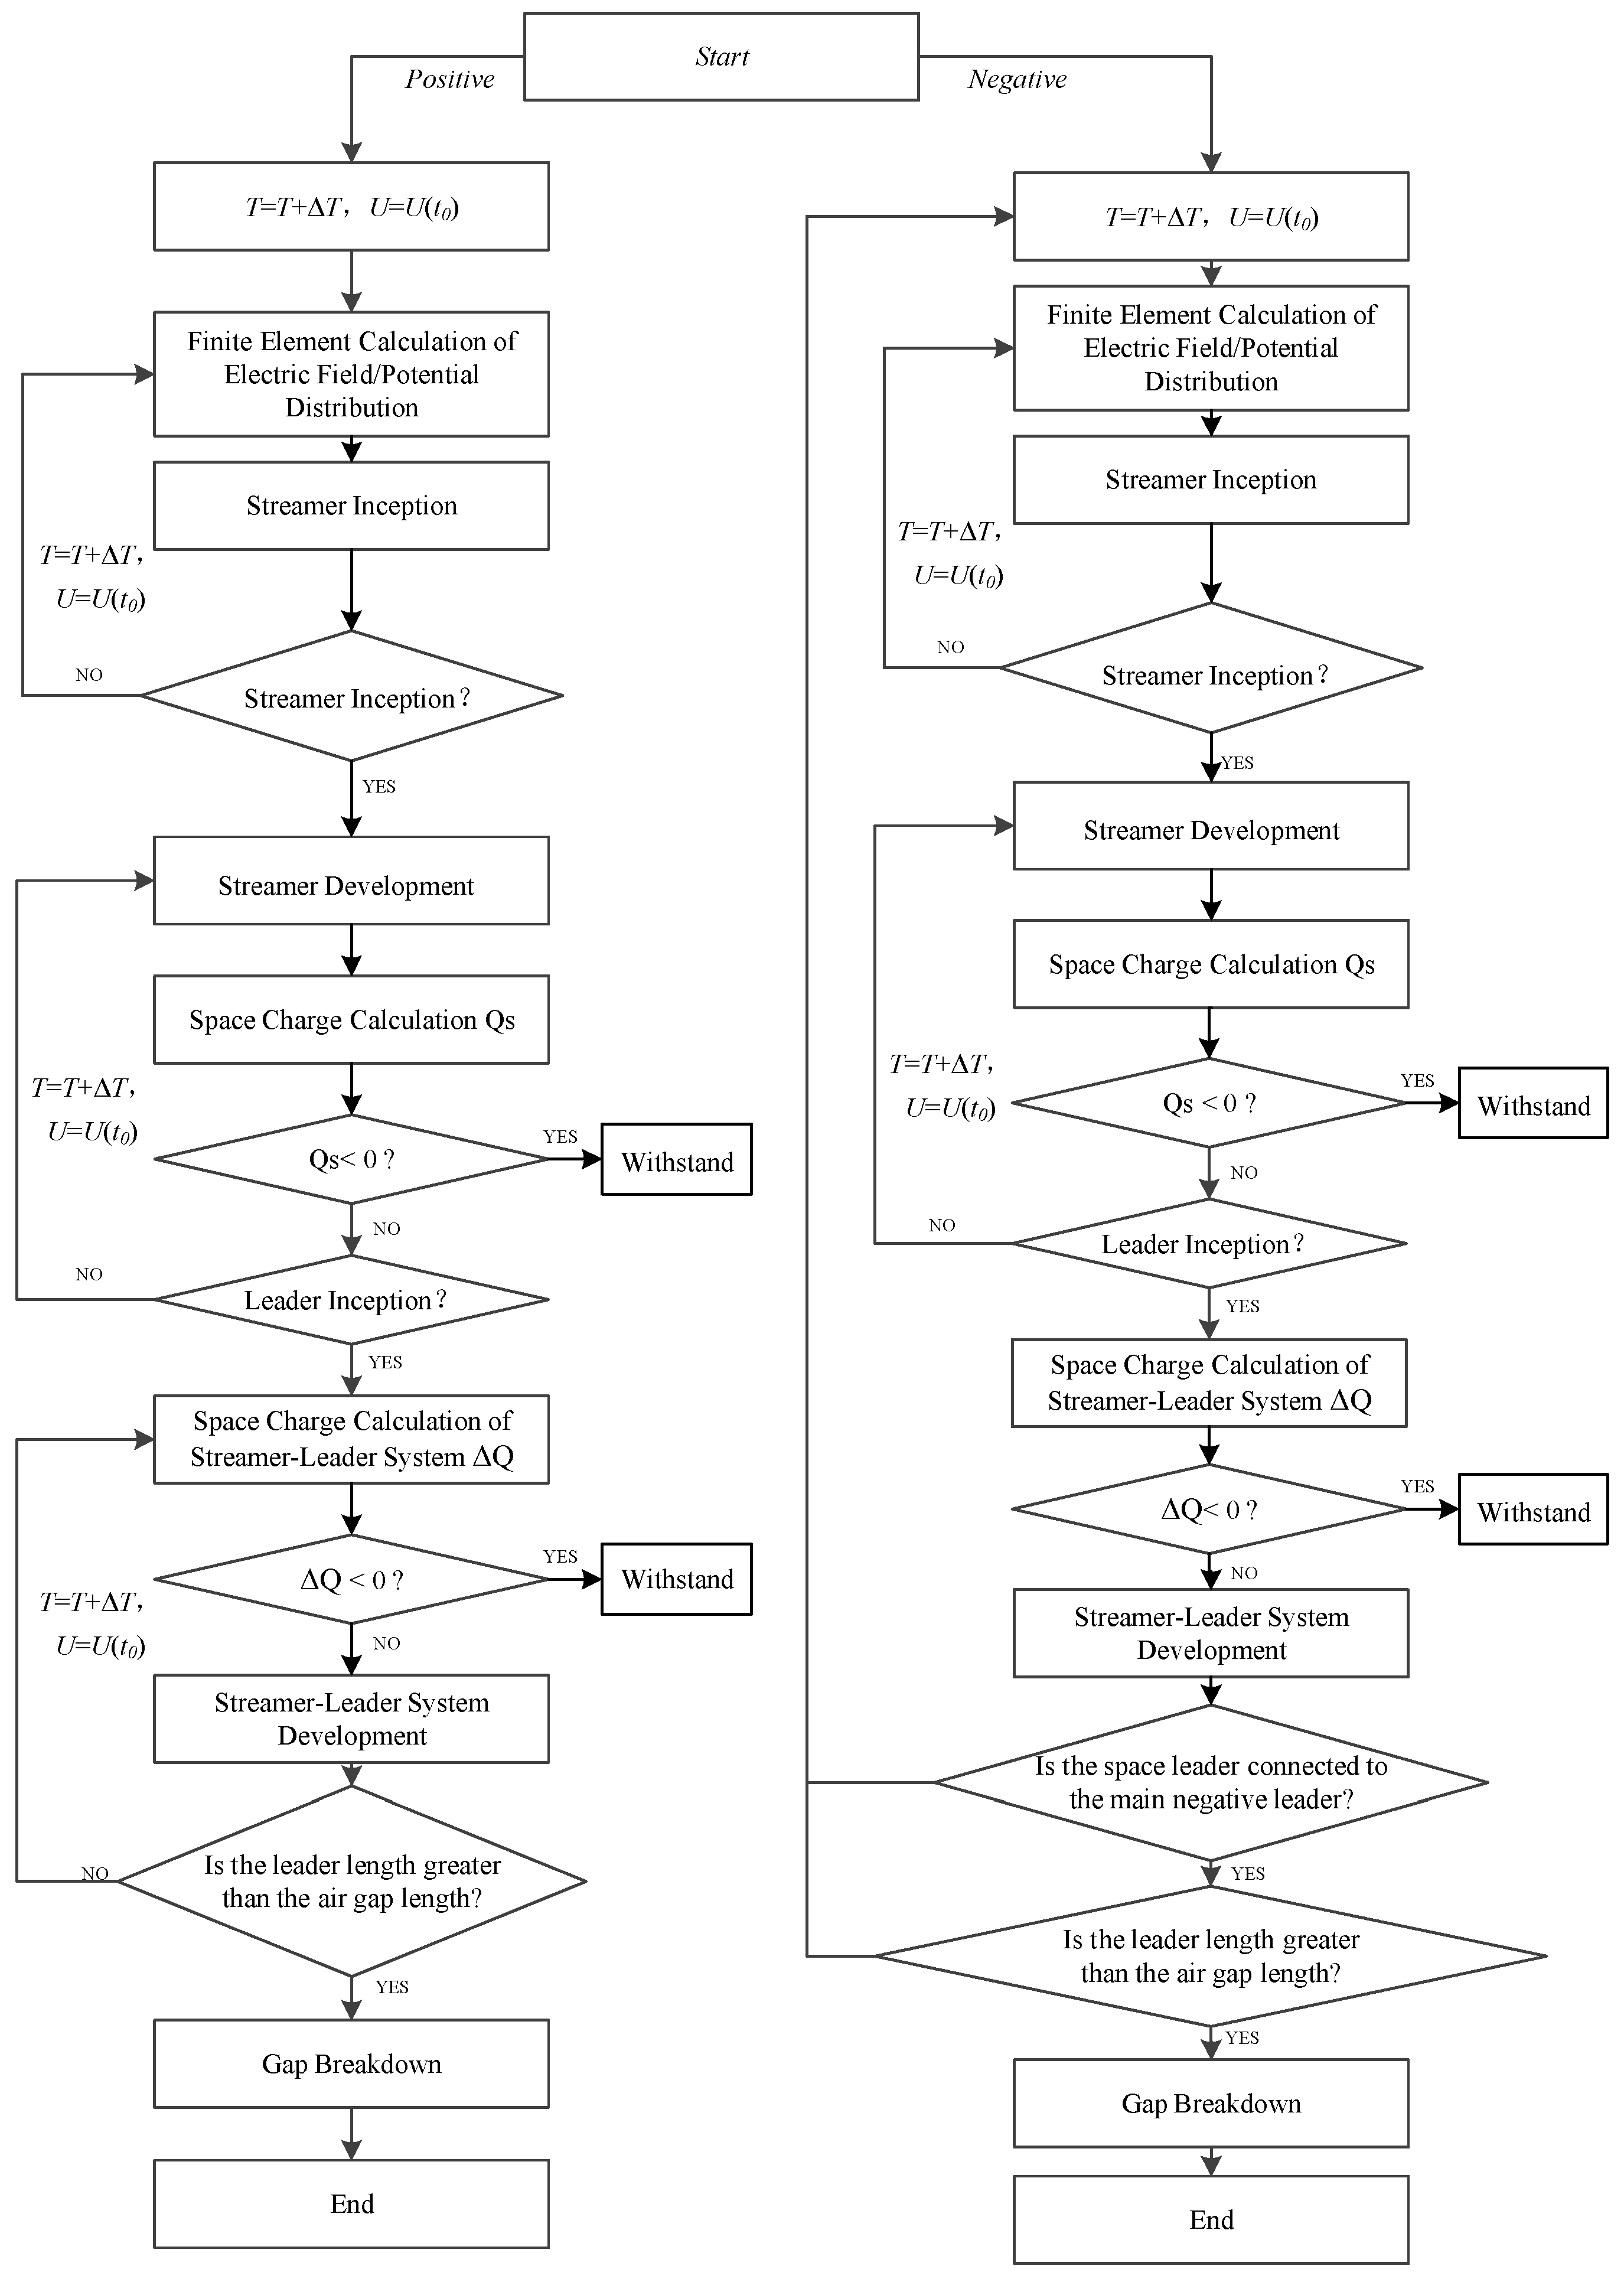
The physical process of positive and negative lightning impulse discharge characteristics in long air gaps was established, and the calculation flow chart is shown in
Figure 2.
3. Physical Discharge Model
3.1. Positive Model
3.1.1. Positive Streamer Inception Model
The streamer initiation condition can be expressed as:
where l is the ionization layer boundary,
α is the ionization coefficient, and
η is the attachment coefficient. N is the charge number,
Ncrit is the critical charge number, and
Ncrit is 1 × 10
8.
3.1.2. Positive Streamer Development Model
After the initiation of the streamer, as the applied voltage U(0) further increases, the streamer continues to develop forward. The potential gradient in the positive streamer is set at 450 kV/m [
10].
The potential gradient of the positive streamer
Es depends on the relative air density, humidity, and temperature, and is calculated as follows [
21]:
In the equation,
δ represents the relative air density, which is related to the air pressure
P and temperature
t;
H denotes the absolute humidity, which depends on the relative humidity
RH and room temperature
t. Under the conditions of 20 °C, 101.3 kPa, and an absolute humidity of 11 g/m
3,
Es is calculated using Equation (5) as 497 kV/m. Reference [
10] indicates that the typical range of
Es is 400–500 kV/m. In this study,
Es is taken as 450 kV/m.
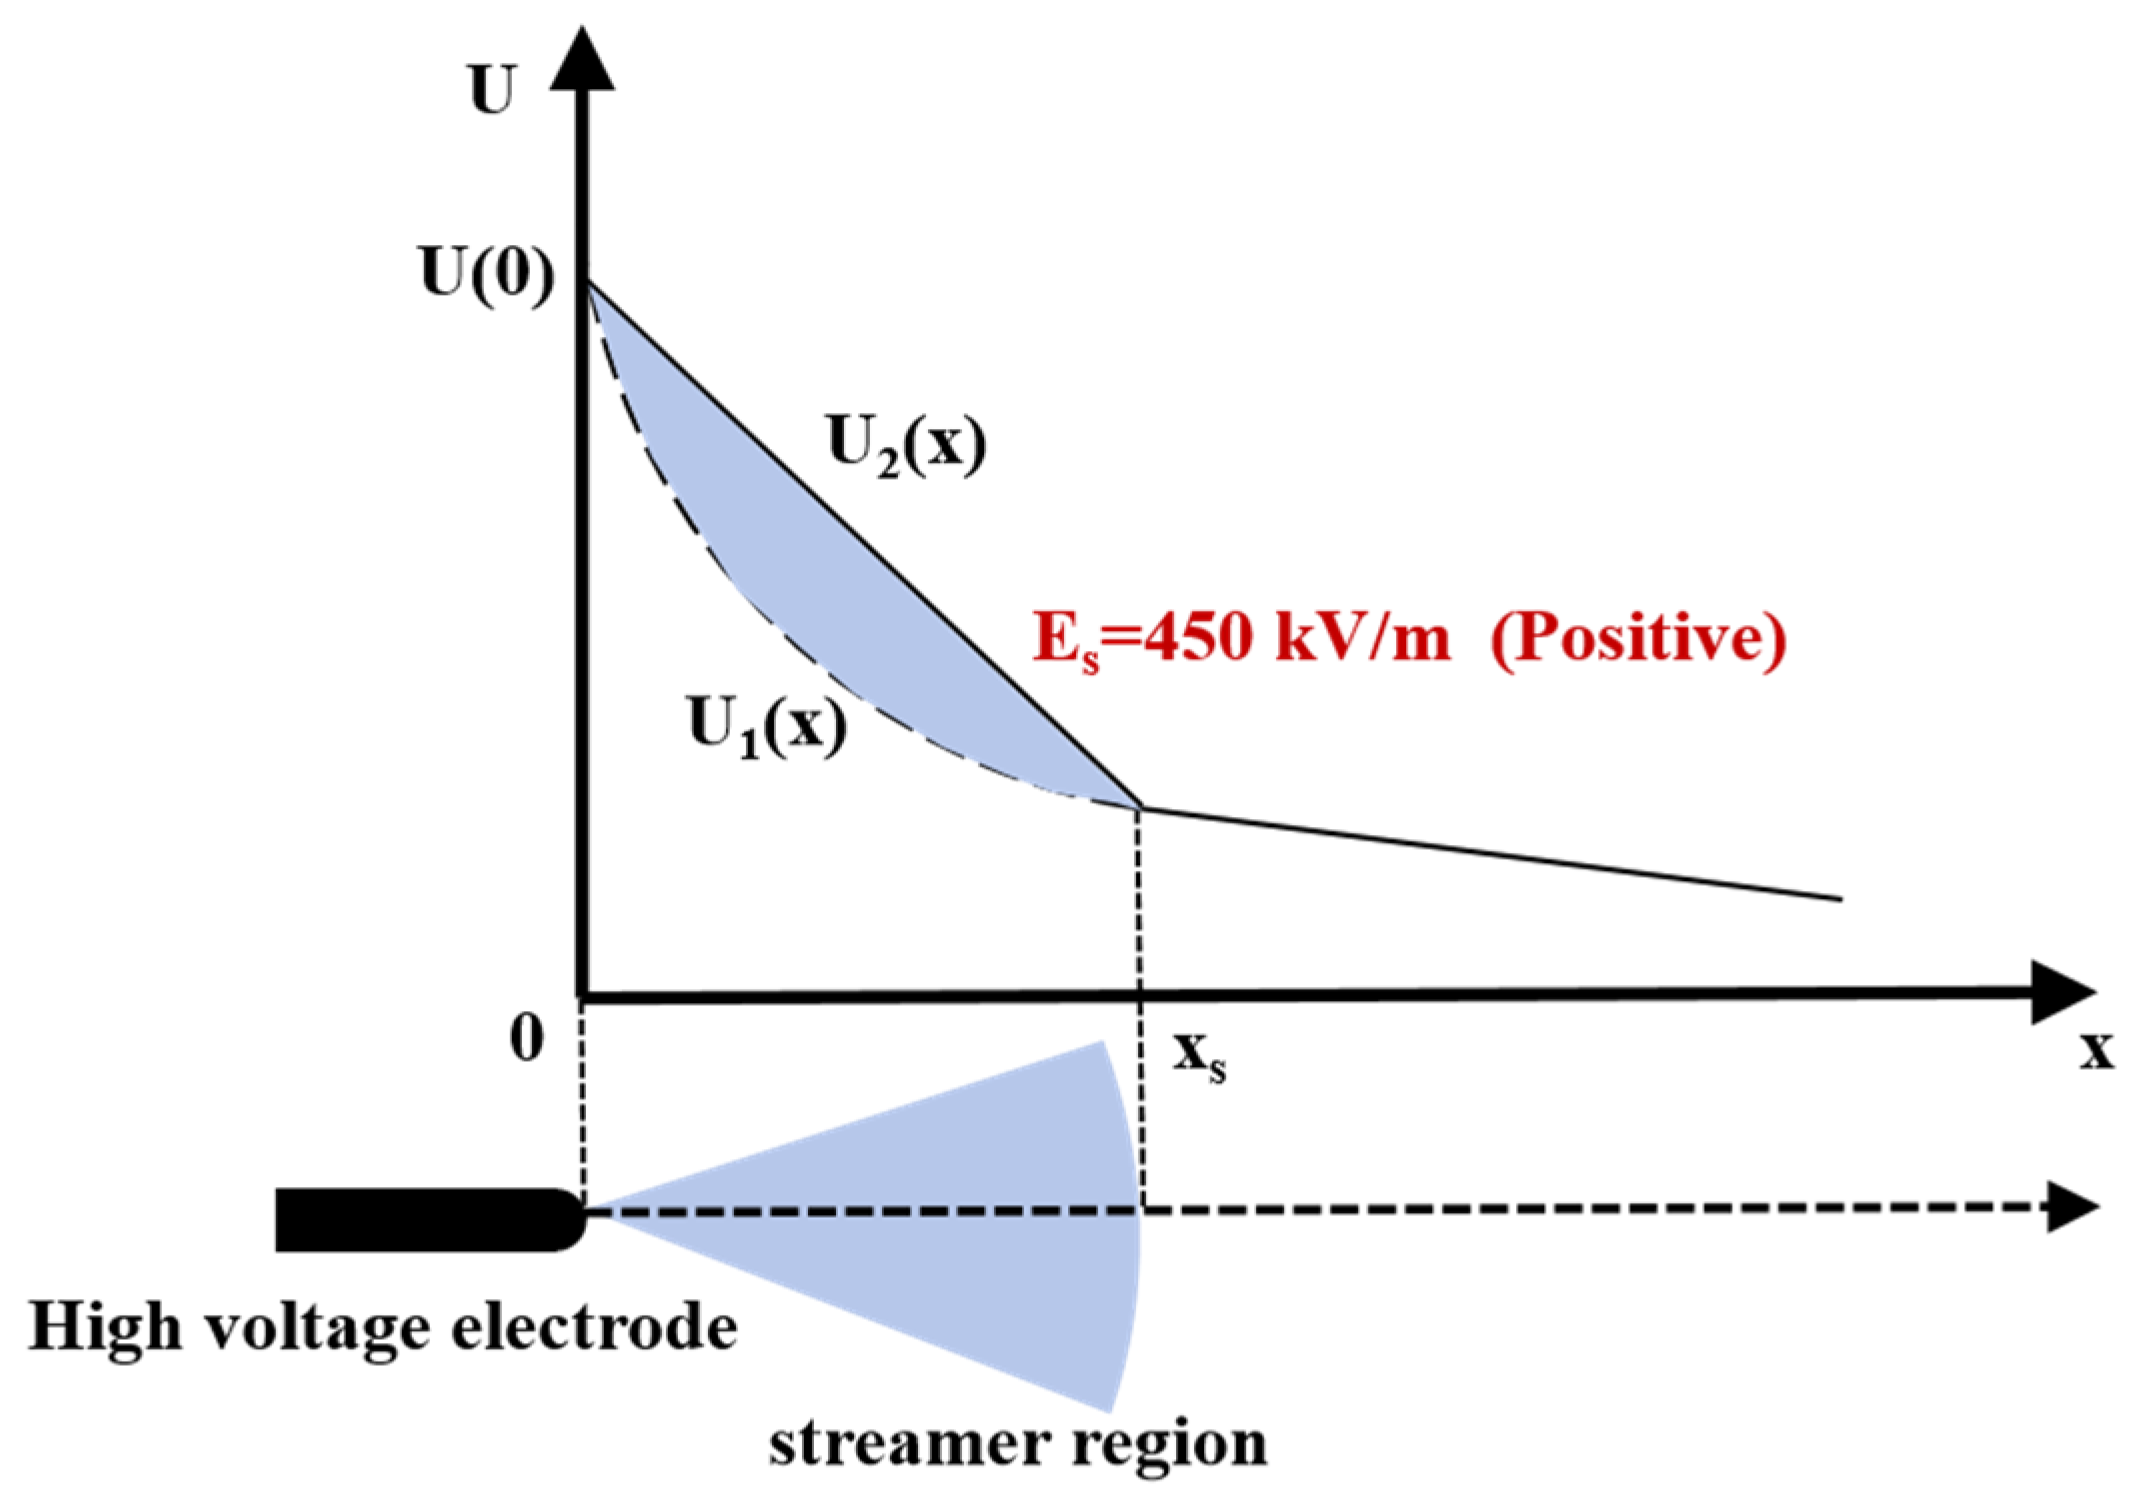
Gallimberti, Bondiou, and colleagues proposed a streamer development model that utilizes the spatial distribution of the background potential and the potential gradient in the streamer region to calculate the streamer region length [
22]. The development of the positive streamer region and the calculation of streamer length are shown in
Figure 3.
The streamer length can be calculated based on the background potential distribution as follows:
where U(x) is the spatial distribution of the background potential along the gap axis, and U(0) is the initial voltage applied to the electrode,
is the potential gradient.
The space charge in the streamer region is calculated as:
where Q
s is the space charge quantity, K
1 is the geometric constant with a value of 0.35 [
23], and
is the vacuum permittivity 8.854 × 10
−12 F/m.
3.1.3. Positive Leader Development Model
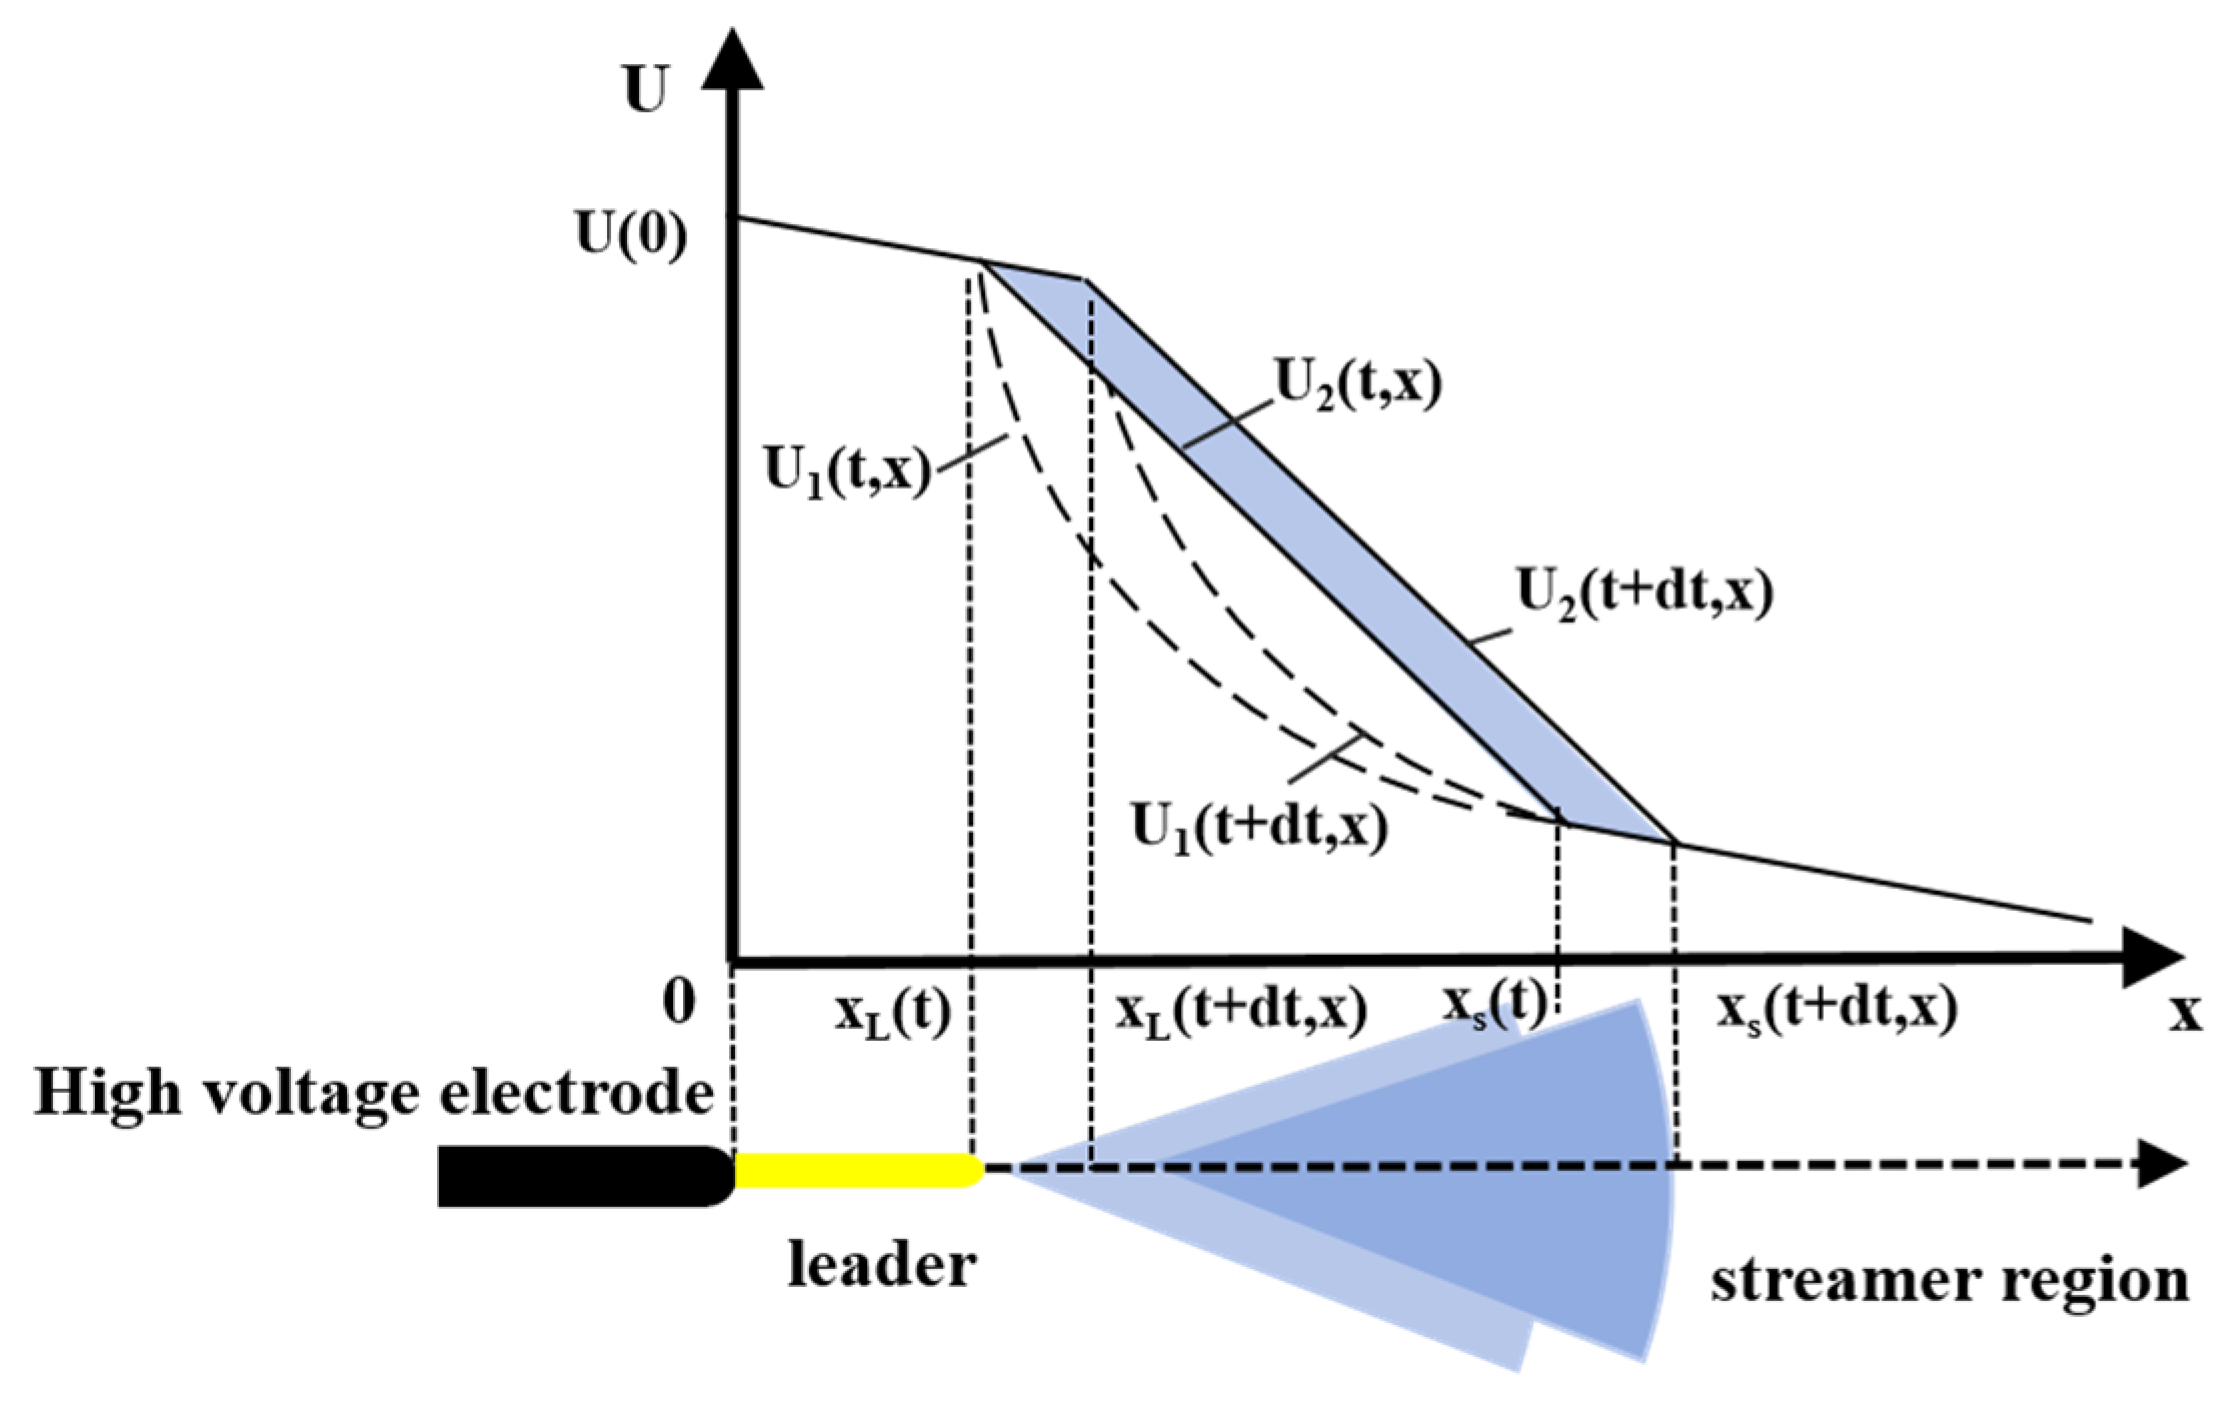
When the accumulated space charge in the streamer region reaches the critical value (1 μC), thermal ionization occurs at the root of the streamer, transforming into a leader channel.
Figure 4 shows the schematic diagram of the space charge distribution in the leader–streamer system.
The amount of charge accumulated is calculated using Equation (10) [
10]:
Lalande et al. used newly generated space charge in the streamer region to characterize the thermodynamic properties inside the leader channel [
23].
In the equation, ai is the radius of the i-th leader segment; is the ratio of the specific heat at constant pressure to the specific heat at constant volume, taken as 1.4; ELi is the internal electric field of the i-th leader segment; ΔQ is the accumulated space charge; p0 is the atmospheric pressure. For the initial leader segment transformed from the streamer, it is assumed that its radius is 0.001 m, the internal electric field is 400 kV/m, and the length is 0.02 m.
New leader segment length calculation:
where ΔQ is the newly generated space charge and q
L is the charge quantity per unit length of leader channel, taken as 50 μC/m.
After determining the internal electric field of each leader segment, the voltage drop ΔU
L across the entire leader channel at time t can be calculated:
where k is the number of leader segments and
is the length of the leader segment gap axis component.
Based on the applied voltage on the high-voltage electrode, the leader head voltage can be determined:
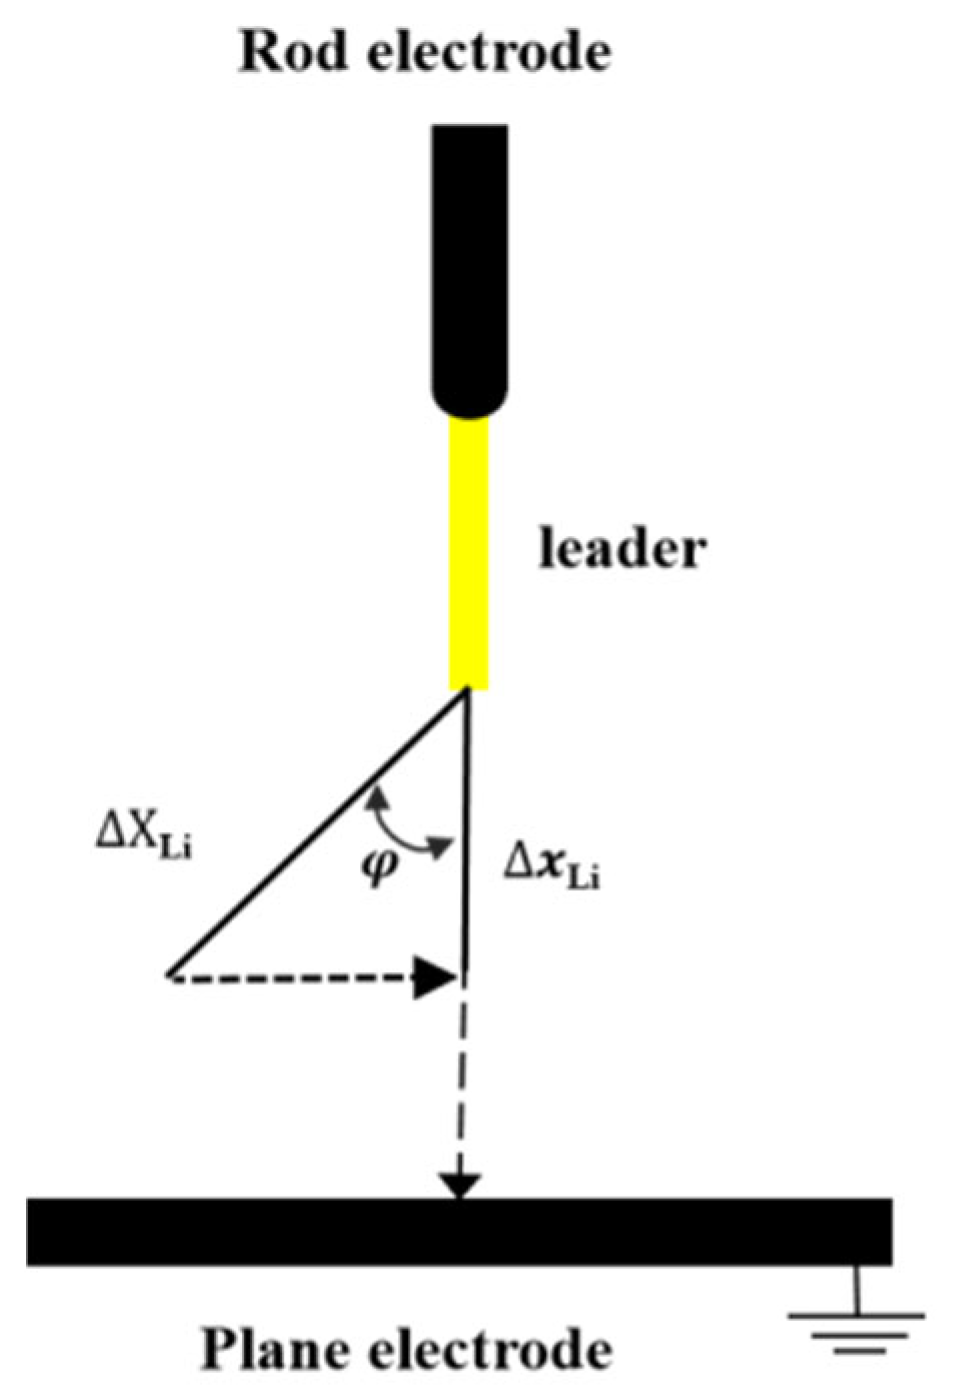
Leader channel development exhibits significant randomness, with the relationship between leader segment length Δ
and leader segment gap axis component length Δx
Li as follows:
where φ is the angle between the leader segment and gap axis, with an angle range of 0~90°, as shown in
Figure 5. Based on long air gap discharge test data, the distribution of φ is determined, with probability density function [
24]:
where, in gaps with rod-type high-voltage electrodes, a
1 = 3.67, b
1 = 0.052, c
1 = 0.289 [
10].
3.2. Negative Model
3.2.1. Negative Streamer Inception Model
Reference [
9] proves that Equation (4) can also be used to calculate corona inception in negative leaders. The critical charge number N
crit is 0.55 × 10
8.
3.2.2. Negative Streamer Development Model
In this paper, the method proposed in Reference [
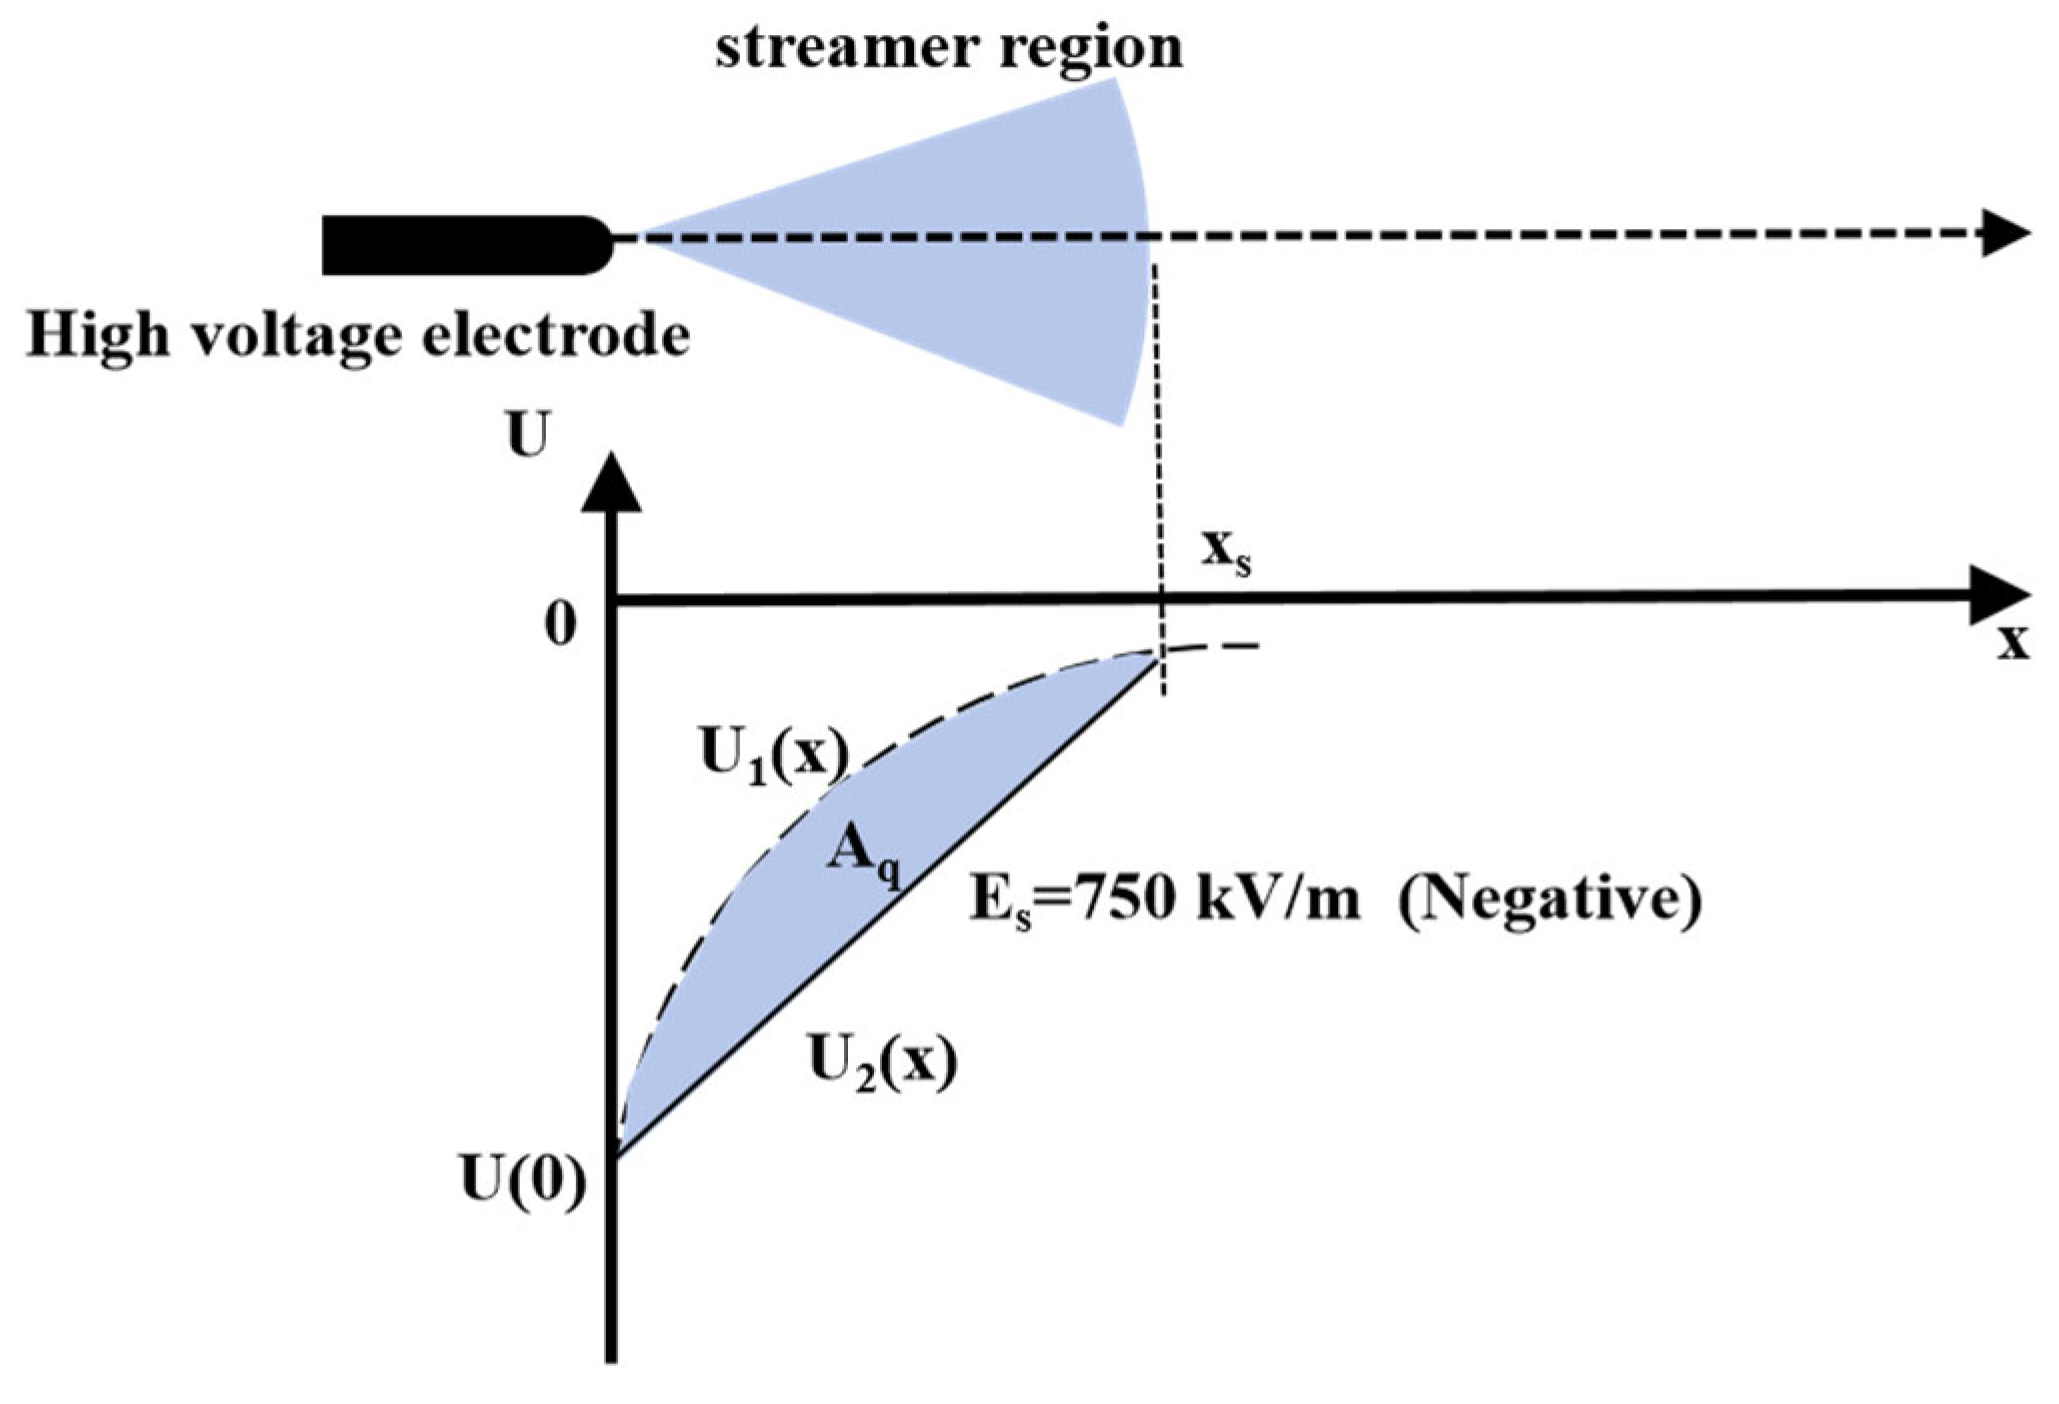
23] establishes the relationship between the change in background potential before and after the streamer starts and the charge in the streamer region, which can also be applied in the case of negative corona. The schematic diagram of the negative streamer region is shown in
Figure 6.
Following Reference [
9], we hypothesize that the charge in the streamer region is proportional to the area difference between the background potential distribution before and after the streamer starts. Based on this assumption, it can be estimated as:
where Q
s is the space charge quantity. Reference [
9] proves that the value for the positive streamer region can also be applied to negative discharge.
is the geometric constant with value 0.35, and
is the vacuum permittivity, 8.854 × 10
−12 F/m.
3.2.3. Space Stem and Space Leader
According to laboratory measurements, the charge of a single space stem with positive and negative streamers is about 0.5
[
25]. When the charge in the streamer region is equal to or greater than this value, the threshold charge for forming a spatial lead is 0.8
[
25]. Unlike the linear change in potential in the positive streamer, the potential in the negative streamer region consists of three linear parts with different slopes relative to the axis [
26], as shown in
Figure 7.
To calculate the charge in the streamer region, Reference [
27], the potential distribution curve is simplified using the following assumptions:
The potential gradient
in the positive streamer is set at 450
, and the potential gradient
in the negative streamer is 750
[
9]. The injection region between the high-voltage electrode and the space pilot consists of a negative streamer originating from the high-voltage electrode and a positive injection originating from the space leader.
The geometric factor is used to calculate charge is the same in the negative and positive flow regions.
The increment of the charge in the streamer region can be obtained by multiplying the incremental area by
where ΔQ is the newly generated space charge,
is the geometric factor.
and
are shadow areas.
New space leader segment length calculation:
where
and
are the newly generated space charges.
and
are used in this article as
and
[
9,
10].
3.2.4. Negative Leader Development Model
When the charge exceeds the threshold of
, an initial corona streamer burst near the negative electrode may lead to the formation of an initial leader channel segment [
25]. The characteristics of negative leads, such as conductivity and voltage drop along the channel, are the same as those of positive leaders [
9]. Considering that it is difficult to calculate the charge required for a negative leader to propagate, we assume that the negative lead extends at a constant speed
before the space leader is connected to it.
In this paper, Rizk’s method is used to calculate the voltage drop along the pilot channel [
9]:
where
is the length of the leader channel at step i, E
s is the potential gradient of the negative streamer region 750
, E
∞ is the final quasi-steady leader channel gradient
and x is a constant equal to
.
The step formation process is complete when the positive end of the space leader is connected to the primary negative leader channel, and a burst of negative streamer is generated at the newly formed leader tip. After that, the stepping process is repeated until the leader length develops greater than the air gap length.
4. Model Validation
A two-dimensional rod-plate air gap model was established using the COMSOL Multiphysics finite element simulation platform. A standard lightning impulse voltage waveform (1.2/50 μs) was applied to the high-voltage electrode, and the electrostatic field was solved to obtain the axial electric field and potential distribution. The simulated axial electric field and potential distribution were then incorporated into the physical discharge model developed in
Section 3 for iterative calculations of the leader propagation length. When the calculated leader length exceeded the air gap distance, the discharge channel was considered to be fully developed, and breakdown occurred. At that moment, the peak value of the applied lightning impulse voltage was taken as the breakdown voltage of the air gap.
4.1. Discharge Process Simulation
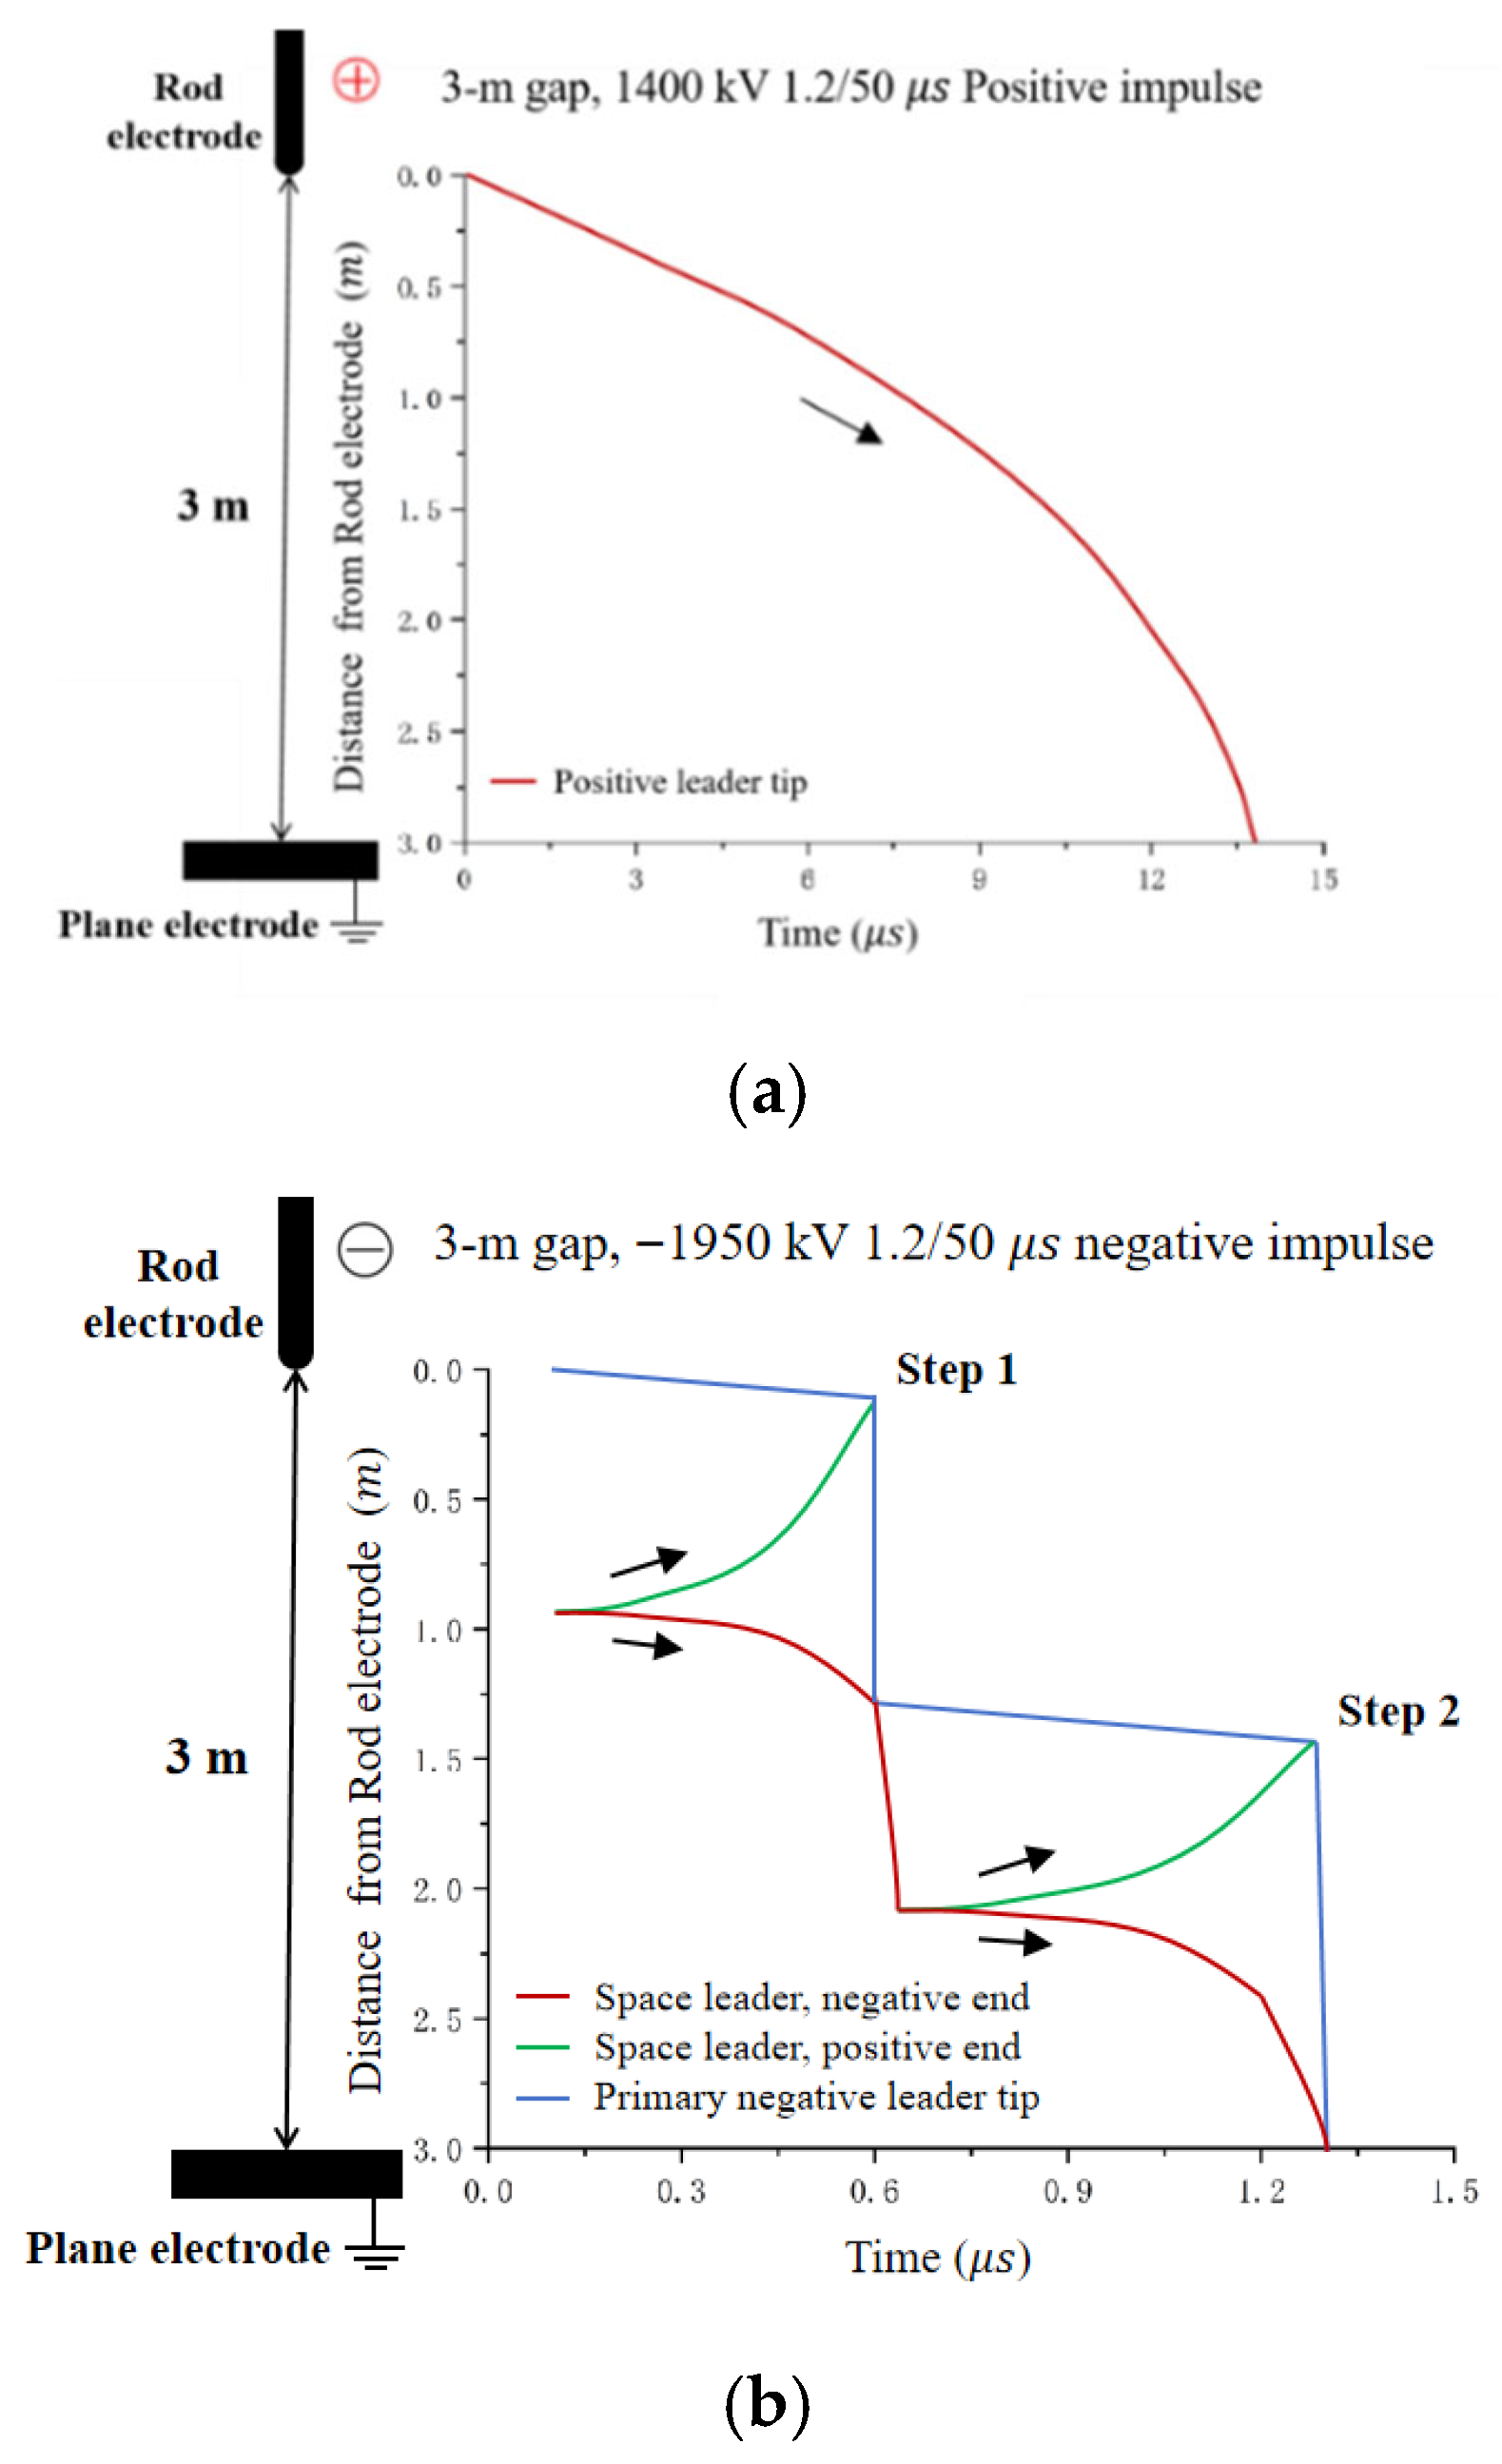
The simulation results shown in
Figure 8 demonstrate significant differences in the discharge processes under positive and negative polarities. The positive leader develops continuously, while the negative leader propagates in a stepwise manner. The physical model for the development of the negative leader used in this paper does not account for the time interval between steps, which results in a shorter breakdown time. Reference [
28] mentions, “Each step is formed in less than 1 μs, with an interstep interval of about 10–20 μs,” which is consistent with the findings in this paper.
According to the calculation results presented in
Table 1, significant differences are observed in the discharge process, breakdown voltage, and breakdown time between positive and negative discharges in the two-dimensional rod-plate gap model. Positive discharge develops continuously, while negative discharge exhibits stepwise development. The average step speed of positive discharge is relatively slower, resulting in a longer breakdown time. In contrast, negative discharge develops faster in terms of step speed and has a shorter breakdown time, with each step completed in less than 1 μs.
Specifically, for a 2 m gap, the breakdown voltage (Ub) for positive discharge is 975 kV, with a breakdown time (Tb) of 21.2 μs and a step speed of 0.08 m/μs. For negative discharge under the same gap, the breakdown voltage (Ub) is 1350 kV, and the breakdown time (Tb) is 1.6 μs. It is also evident that as the applied voltage increases, the step speed for both positive and negative discharges increases.
From the analysis, it is clear that the faster average step development speed of negative discharge results in significantly shorter breakdown times compared to positive discharge. Therefore, this difference should be given special attention in lightning protection design.
4.2. 50% Breakdown Voltage Calculation
Based on the physical models of positive and negative polarity discharges, 20 consecutive simulation runs were performed using the up-and-down method for different gap distances under positive and negative lightning impulse voltages. The average value of the calculated results was taken as the 50% breakdown voltage.
The experimental data in
Figure 9 are taken from Ref. [
29]. The experiments were conducted in the high-voltage hall of the Guangxi Electric Power Research Institute, located at an altitude of approximately 80 m. Lightning impulse discharge tests with positive and negative polarities were performed on a rod–plane gap under gap distances ranging from 1.5 m to 4.5 m. The rod electrode was made of a 6 m long, 38 mm diameter round steel bar, and the plane electrode was assembled from galvanized steel plates with a maximum size of 14 m × 14 m. The grounding conductor consisted of a bare copper strip 200 mm wide and 1 mm thick, connected to the galvanized plate. The test voltage was supplied by a 3600 kV impulse voltage generator.
During the tests, high-precision instruments—a mercury thermometer, an aneroid barometer, and a relative humidity meter—were used to measure the atmospheric parameters, including air pressure, temperature, and humidity. Measurements were taken before and after each test, and their average values were used as the meteorological parameters for that test. The tests were carried out in accordance with the procedures specified in GB/T 16927.1-1997 [
30], and the results were corrected for atmospheric conditions according to IEC 60060-1:1989 [
31]. The applied impulse voltage was the standard lightning waveform of 1.2/50 μs, and the 50% discharge voltage was determined using the up-and-down method. Each polarity test included 20 effective lightning impulse discharges. According to the calculation results in
Figure 9, the maximum error of the model is 5.86%, which can be considered within the acceptable range.
4.3. Analysis of the Impact of Conductors on Pole Towers
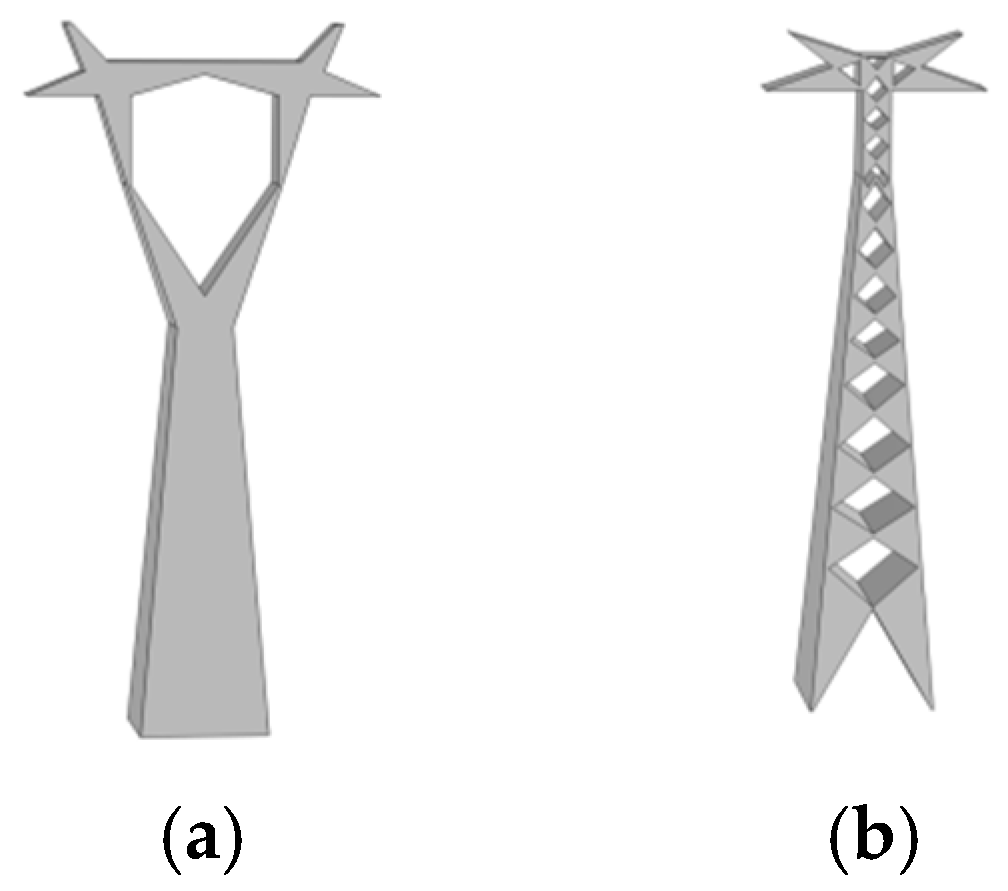
Three-dimensional models of the 220 kV Cup-Tower and the 500 kV Tangent Tower [
32] were established using COMSOL Multiphysics 6.3, as shown in
Figure 10.
The tower structure is shown in
Table 2. Standard positive and negative lightning impulse voltages (1.2/50 μs) are applied to the conductors. The potential and electric field distributions for the middle-phase conductor of the 220 kV Cup-Tower are shown in
Figure 11, while those for the side-phase conductor of the 220 kV Cup-Tower are presented in
Figure 12. The potential and electric field distributions for the side-phase conductor of the 500 kV Tangent Tower are shown in
Figure 13.
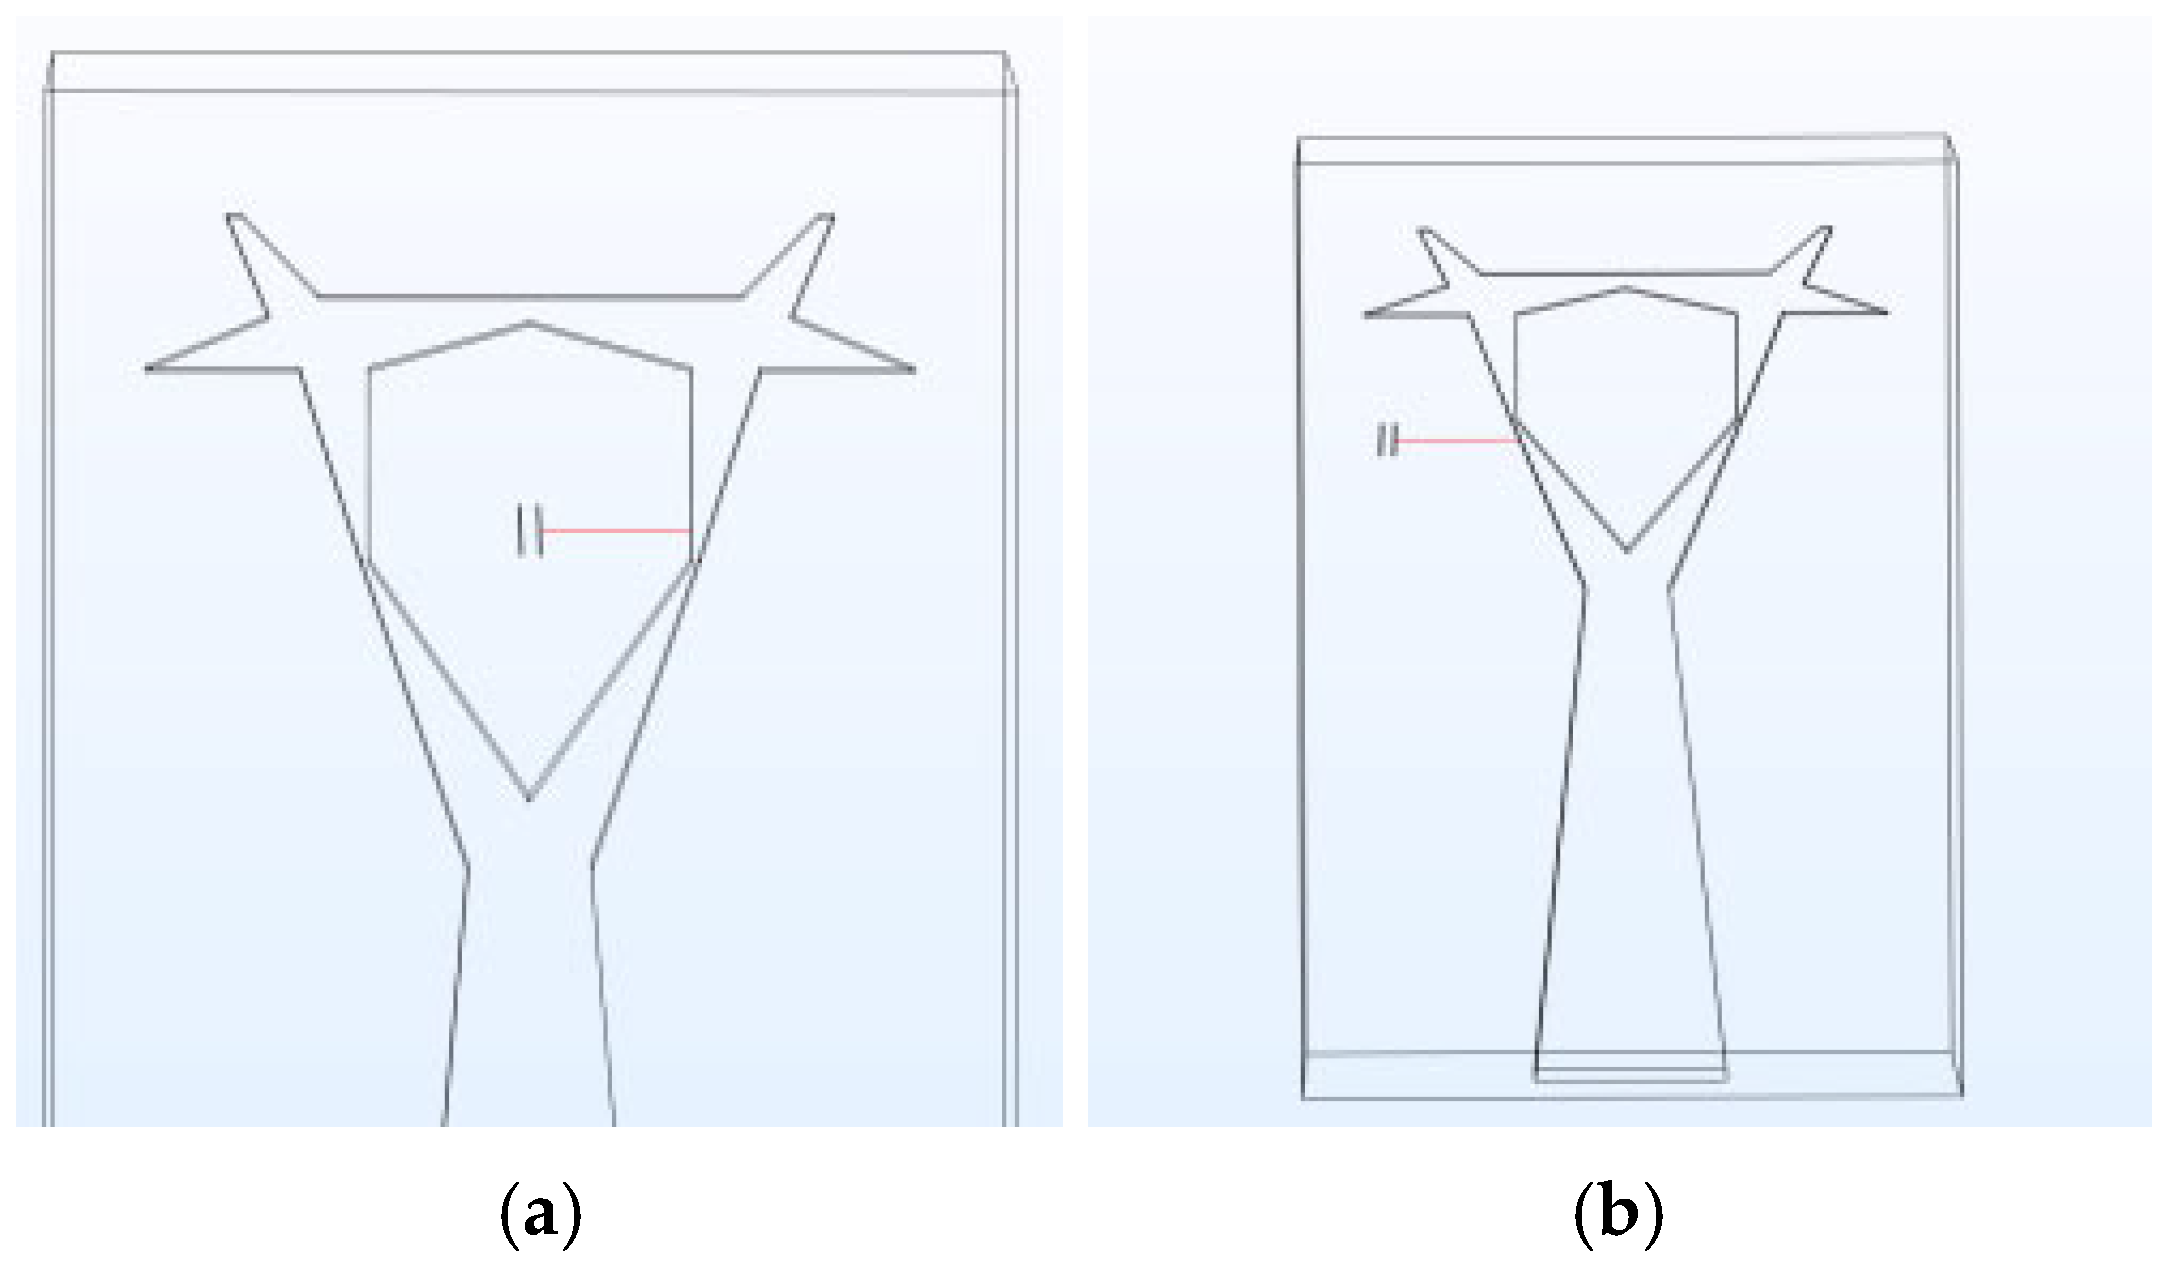
In the 220 kV Cup-Tower model, the potential and electric field distribution curves from the middle-phase conductor to the tower window and from the side-phase conductor to the tower window are extracted, as shown in
Figure 14.
In the 500 kV Tangent Tower model, the potential and electric field distribution curves from the side-phase conductor to the tower body and from the side-phase conductor to the crossarm are extracted, as shown in
Figure 15.
Based on the physical model of positive and negative discharge, simulations of the conductor–tower models are performed, with results presented in
Table 3.
Compared to the rod–plane model, the conductor–tower model more accurately reflects the impact of the tower structure. Reference [
9] mentions that for air gaps smaller than a certain distance, negative discharge may not exhibit a stepwise development. Under a 3 m gap condition, negative discharge developed only one step and directly jumped after covering more than two-thirds of the total gap. Its average step development speed is relatively fast, which is consistent with the conclusions in the reference.
By comparing the data in
Table 3, it can be seen that as the applied voltage increases, the average step development speed of positive discharge gradually increases, and the breakdown time gradually decreases. In contrast, the average step development speed of negative discharge is less affected by the applied voltage, and the breakdown time of negative discharge is primarily influenced by the step development.
The 50% breakdown voltage for the conductor–tower model under different gap conditions was calculated using the up-and-down method, as shown in
Table 4. The 50% breakdown voltage in the conductor–tower model is higher than in the rod–plane model. Specifically, under a 3.0 m gap condition, the breakdown voltages for positive and negative discharges in the conductor–tower model are 1488 kV and 1988 kV, respectively, which are 6.4% and 2.7% higher than the values in the rod–plane model.
In subsequent lightning protection design, the impact of tower structure on the potential and electric field distribution should be fully considered.
5. Discussion
5.1. Differences in Positive and Negative Discharges
In both the rod–plane and conductor–tower models, there are distinct differences between positive and negative discharges. Negative discharge has a higher breakdown voltage and develops faster in a stepwise manner, with each step forming in less than 1 μs. In contrast, positive discharge develops continuously with a slower step speed, resulting in a longer breakdown time. As the applied voltage increases, the average step development speed of positive discharge gradually increases, and the breakdown time decreases. This indicates that as the voltage amplitude rises, the background electric field strengthens, facilitating air ionization and accelerating the formation of the leader. The model used in this study does not account for the time intervals between steps in negative discharge, and negative discharge is less affected by the applied voltage, being more influenced by the development of each step.
5.2. Impact of Tower Structure
By comparing the results of the conductor–tower and rod–plane models, it is evident that in the conductor–tower model, the 50% breakdown voltage for both positive and negative discharges is significantly higher than in the rod–plane model. Furthermore, the conductor–tower model more accurately reflects the impact of the tower structure on discharge behavior. Under shorter gap conditions, negative discharge may not exhibit a stepwise development in the conductor–tower model.
6. Conclusions
This study builds on physical models of positive and negative discharges to analyze the discharge characteristic differences between the rod–plane model and the conductor–tower model, as well as the influence of different tower structures on the discharge process. The main conclusions are as follows:
Under lightning impulses of the same voltage level, negative discharge exhibits a higher breakdown voltage, with the leader developing in a stepped manner. Each step is typically completed within 1 μs, resulting in a faster development process. In contrast, the leader of positive discharge develops continuously with a slower progression rate, leading to a longer breakdown time. The average development speed of positive discharge is mainly influenced by the applied voltage, whereas negative discharge is primarily governed by the development of each step.
The conductor–tower model more accurately reflects the influence of tower structures on the discharge process, with the 50% breakdown voltages of both positive and negative discharges being significantly higher than those of the rod–plane model. Under shorter gap conditions, negative discharge may not exhibit distinct stepwise development.
In future lightning protection designs, the impact of negative discharge on system insulation should be fully considered, along with the effects of tower structures on the discharge process. Optimization of tower design and configuration is necessary to enhance the lightning withstand capability of power systems under lightning impulse voltages.
Author Contributions
R.Z.: Writing—original draft; J.N.: Writing—review & editing; Y.Z.: formal analysis; Z.Z.: Data curation; X.L.: Data curation, funding acquisition; Y.D.: investigation, software; J.G.: methodology. All authors have read and agreed to the published version of the manuscript.
Funding
This work is supported by the Technology Project of China Southern Power Grid (No. 031300KC23040015).
Data Availability Statement
The original contributions presented in this study are included in the article. Further inquiries can be directed to the corresponding author.
Conflicts of Interest
Authors Ruifeng Zhu, Yun Zhang, Zhenxin Zhong, Xinru Li and Yuxi Dong were employed by the Guangdong Power Grid Co., Ltd. The authors declare that this study received funding from Technology Project of China Southern Power Grid. The remaining authors declare that the research was conducted in the absence of any commercial or financial relationships that could be construed as a potential conflict of interest.
References
- Wang, J.; Cao, J.; Cai, L.; Su, R.; Fan, Y.; Zhou, M.; Li, Q. Thunder acoustic signature for channel reconstruction in triggered lightning. J. Appl. Phys. 2022, 132, 123301. [Google Scholar] [CrossRef]
- Wang, Y.; Huang, S.; Deng, Y.; Chen, X.; Xiang, M.; Wen, X.; Lan, L.; Zhang, T.; Liu, B.; Jiang, H.; et al. Model test on the effect of hillside on lightning shielding performance of ±1100 kV transmission lines. Int. J. Electr. Power Energy Syst. 2021, 129, 106734. [Google Scholar] [CrossRef]
- Cao, J.; Ding, Y.; Du, Y.; Chen, M.; Qi, R. Design consideration of the shielding wire in 10 kV overhead distribution lines against lightning-induced overvoltage. IEEE Trans. Power Del. 2021, 36, 3005–3013. [Google Scholar] [CrossRef]
- Cao, J.; Du, Y.; Ding, Y.; Li, B.; Qi, R.; Zhang, Y.; Li, Z. Lightning surge analysis of transmission line towers with a hybrid FDTD-PEEC method. IEEE Trans. Power Del. 2022, 37, 1275–1284. [Google Scholar] [CrossRef]
- Cao, J.; Du, Y.; Ding, Y.; Qi, R.; Li, B.; Chen, M.; Li, Z. Comprehensive assessment of lightning protection schemes for 10 kV overhead distribution lines. IEEE Trans. Power Del. 2022, 37, 2326–2336. [Google Scholar] [CrossRef]
- Xie, Y.; He, H.; He, J.; Gu, S.; Hu, J. Simplified physical model to determine leader inception for positive discharge in long air gaps. High Volt. Eng. 2014, 40, 756–762. [Google Scholar] [CrossRef]
- Peng, C.; Dong, X.; Sabariego, R.V.; Zheng, Y.; Deng, Y.; Xie, P. A full three-dimensional model for positive long air gap discharge simulation. IEEE Trans. Dielectr. Electr. Insul. 2025. [Google Scholar] [CrossRef]
- Peng, C.; Li, Z.; Pei, X.; Zhao, X.; Lu, G.; Liu, F.; Wang, Y.; Zhu, B.; Zheng, Y.; Dong, X. Effects of applied voltage on branching of positive leaders in laboratory long sparks. Geophys. Res. Lett. 2024, 51, e2024GL108804. [Google Scholar] [CrossRef]
- Guo, Z.; Li, Q.; Bretas, A.; Rakov, V.A. A simplified physical model of negative leader in long sparks. Electr. Power Syst. Res. 2019, 176, 105955. [Google Scholar] [CrossRef]
- Wu, S.C.; Wang, L.N.; Gao, J.C.; Wang, G.J.; Song, B. Physical model of combined air gaps under positive switching impulse. High Volt. Eng. 2025, 51, 1389–1401. [Google Scholar] [CrossRef]
- Zhao, X.; Gan, Q.; Du, Y.; Lee, J.; Li, Z.; Wang, X. Observation of isolated heating segments ahead of the discharge channel under positive and negative lightning impulses. In Proceedings of the 36th International Conference on Lightning Protection (ICLP), Cape Town, South Africa, 2–7 October 2022; pp. 188–193. [Google Scholar] [CrossRef]
- Yue, Y.; He, H.; Chen, W.; He, J.; Wu, C.; Zhao, X.; Huo, F. Characteristics of long air gap discharge current subjected to switching impulse. CSEE J. Power Energy Syst. 2015, 1, 49–58. [Google Scholar] [CrossRef]
- MacGorman, D.R.; Rust, W.D. The Electrical Nature of Storms; Oxford University Press: New York, NY, USA, 1998. [Google Scholar]
- Cooray, V.; Rakov, V.; Theethayi, N. The lightning striking distance—Revisited. J. Electrostat. 2007, 65, 296–306. [Google Scholar] [CrossRef]
- Diendorfer, G.; Pichler, H.; Mair, M. Some parameters of negative upward-initiated lightning to the Gaisberg Tower (2000–2007). IEEE Trans. Electromagn. Compat. 2009, 51, 443–452. [Google Scholar] [CrossRef]
- Schulz, W.; Diendorfer, G.; Pedeboy, S.; Poelman, D.R. The European lightning location system EUCLID—Part 1: Performance analysis and validation. Nat. Hazards Earth Syst. Sci. 2016, 16, 595–605. [Google Scholar] [CrossRef]
- Bazelyan, E.M.; Raizer, Y.P. Lightning Physics and Lightning Protection; CRC Press: Boca Raton, FL, USA, 2000. [Google Scholar]
- Cooray, V.; Rakov, V.A. Engineering lightning return stroke models incorporating current reflection from ground and finitely conducting ground effects. IEEE Trans. Electromagn. Compat. 2011, 53, 773–781. [Google Scholar] [CrossRef]
- Uman, M.A.; Rakov, V.A. The interaction of lightning with airborne vehicles. Prog. Aerosp. Sci. 2003, 39, 61–81. [Google Scholar] [CrossRef]
- IEC 60060-1:2010; High-Voltage Test Techniques—Part 1: General Definitions and Test Requirements. International Electrotechnical Commission: Geneva, Switzerland, 2010.
- Wang, P.; Chen, Y.; Yao, X.; Ding, Y.; Geng, J.; Lv, F.; Jiang, L.; Shi, W. Discharge conversion characteristics of large size sphere–plane gap under positive switching impulse voltage at altitude of 2200 m. Proc. CSEE 2023, 43, 6112–6124. [Google Scholar] [CrossRef]
- Bondiou, A.; Gallimberti, I. Theoretical modelling of the development of the positive spark in long gaps. J. Phys. D Appl. Phys. 1994, 27, 1252–1266. [Google Scholar] [CrossRef]
- Goelian, N.; Lalande, P.; Bondiou-Clergerie, A.; Bacchiega, G.L.; Gazzani, A.; Gallimberti, I. A simplified model for the simulation of positive-spark development in long air gaps. J. Phys. D Appl. Phys. 1997, 30, 2441–2452. [Google Scholar] [CrossRef]
- Arevalo, L.; Wu, D.; Jacobson, B. A consistent approach to estimate the breakdown voltage of high-voltage electrodes under positive switching impulses. J. Appl. Phys. 2013, 114, 083301. [Google Scholar] [CrossRef]
- Castellani, A.; Bondiou-Clergerie, A.; Lalande, P.; Bonamy, A.; Gallimberti, I. Laboratory study of the bi-leader process from an electrically floating conductor. Part 2: Bi-leader properties. IEE Proc. Sci. Meas. Technol. 1998, 145, 193–199. [Google Scholar] [CrossRef]
- Gallimberti, I.; Bacchiega, G.; Bondiou-Clergerie, A.; Lalande, P. Fundamental processes in long air gap discharges. C. R. Phys. 2002, 3, 1335–1359. [Google Scholar] [CrossRef]
- Rachidi, F.; Rubinstein, M.; Montanya, J.; Bermudez, J.L.; Sola, R.R.; Sola, G.; Korovkin, N. A review of current issues in lightning protection of new-generation wind-turbine blades. IEEE Trans. Ind. Electron. 2008, 55, 2489–2496. [Google Scholar] [CrossRef]
- Ortega, P.; Domens, P.; Gibert, A.; Hutzler, B.; Riquel, G. Performance of a 16.7 m air rod-plane gap under a negative switching impulse. J. Phys. D Appl. Phys. 1994, 27, 2379–2387. [Google Scholar] [CrossRef]
- Liao, Y.; Li, R.; Li, X.; Gao, C.; Xu, F.; Wei, J. Experimental research on typical air-gap test voltage correction. Proc. CSEE 2012, 32, 171–176+3. [Google Scholar] [CrossRef]
- GB/T 16927.1-1997; High-Voltage Test Techniques—Part 1: General Definitions and Test Requirements. Standards Press of China: Beijing, China, 1997.
- IEC 60060-1:1989; High-Voltage Test Techniques—Part 1: General Definitions and Test Requirements. International Electrotechnical Commission: Geneva, Switzerland, 1989.
- Xiong, X.; Weng, S.; Wang, J. An online early-warning method for wind swing discharge of the conductor toward the tangent tower and jumper toward the strain tower. IEEE Trans. Power Del. 2015, 30, 114–121. [Google Scholar] [CrossRef]
Figure 1.
Structure of the air gap.
Figure 1.
Structure of the air gap.
Figure 2.
Flow chart of calculation.
Figure 2.
Flow chart of calculation.
Figure 3.
Schematic diagram of streamer region development and streamer length calculation.
Figure 3.
Schematic diagram of streamer region development and streamer length calculation.
Figure 4.
Schematic diagram of space charge of leader–streamer system.
Figure 4.
Schematic diagram of space charge of leader–streamer system.
Figure 5.
Schematic diagram of the randomness of leader development path.
Figure 5.
Schematic diagram of the randomness of leader development path.
Figure 6.
Schematic diagram of streamer region.
Figure 6.
Schematic diagram of streamer region.
Figure 7.
Schematic diagram of space charge of leader–streamer system. (a) Development of space stem; (b) Development of space leader.
Figure 7.
Schematic diagram of space charge of leader–streamer system. (a) Development of space stem; (b) Development of space leader.
Figure 8.
Simulation of Positive and Negative Leader Development. (a) Simulation of positive leader development; (b) Simulation of negative leader development.
Figure 8.
Simulation of Positive and Negative Leader Development. (a) Simulation of positive leader development; (b) Simulation of negative leader development.
Figure 9.
Lightning impulse voltage discharge results.
Figure 9.
Lightning impulse voltage discharge results.
Figure 10.
Three-dimensional models of the towers. (a) Cup-Tower; (b) Tangent Tower.
Figure 10.
Three-dimensional models of the towers. (a) Cup-Tower; (b) Tangent Tower.
Figure 11.
220 kV Cup-Tower Middle Phase Potential and Electric Field Distribution. (a) Potential; (b) Electric Field.
Figure 11.
220 kV Cup-Tower Middle Phase Potential and Electric Field Distribution. (a) Potential; (b) Electric Field.
Figure 12.
220 kV Cup-Tower Side Phase Potential and Electric Field Distribution. (a) Potential; (b) Electric Field.
Figure 12.
220 kV Cup-Tower Side Phase Potential and Electric Field Distribution. (a) Potential; (b) Electric Field.
Figure 13.
500 kV Tangent Tower Side Phase Potential and Electric Field Distribution. (a) Potential; (b) Electric Field.
Figure 13.
500 kV Tangent Tower Side Phase Potential and Electric Field Distribution. (a) Potential; (b) Electric Field.
Figure 14.
Schematic Diagrams of the Gaps in the 220 kV Cup-Tower model. (a) Middle Phase; (b) Side Phase.
Figure 14.
Schematic Diagrams of the Gaps in the 220 kV Cup-Tower model. (a) Middle Phase; (b) Side Phase.
Figure 15.
Schematic Diagrams of the Gaps in the 500 kV Tangent Tower model. (a) Tower body; (b) Crossarm.
Figure 15.
Schematic Diagrams of the Gaps in the 500 kV Tangent Tower model. (a) Tower body; (b) Crossarm.
Table 1.
Calculation results of rod–plate air gap model.
Table 1.
Calculation results of rod–plate air gap model.
| Discharge | Gap (m) | Ub (kV) | Tb (μs) | Average Step Speed (m/μs) | Step Length (m) |
|---|
| Positive | 2.0 | 975 | 21.2 | 0.08 | 1.8 |
| 2.5 | 1250 | 15.2 | 0.15 | 2.26 |
| 3.0 | 1400 | 13.6 | 0.2 | 2.7 |
| 4.0 | 2000 | 12.8 | 0.28 | 3.6 |
| 5.0 | 2500 | 12.2 | 0.37 | 4.5 |
| Negative | 2.0 | 1350 | 1.6 | 1.55/1.54 | 0.93/0.92 |
| 2.5 | 1650 | 1.4 | 2.27/2.22 | 1.14/1.11 |
| 3.0 | 1950 | 1.3 | 3.18/2.90 | 1.27/1.45 |
| 4.0 | 2450 | 1.1 | 4.80/4.40 | 1.92/1.76 |
| 5.0 | 2950 | 1.0 | 7.13/6.37 | 2.14/1.91 |
Table 2.
Tower structure parameters.
Table 2.
Tower structure parameters.
| Tower Structure | Gap
(m) | Tower Width
(m) | Conductor Diameter
(mm) |
|---|
| 220 kV Cup-Tower Middle Phase Tower Window | 3.0 | 1.8 | 20 |
| 220 kV Cup-Tower Side Phase Tower Window | 3.8 | 1.8 | 20 |
| 500 kV Tangent Tower Side Phase Tower body | 4.5 | 2.7 | 20 |
| 500 kV Tangent Tower Side Phase Crossarm | 5.0 | 2.7 | 20 |
Table 3.
Calculation results of conductor–tower models.
Table 3.
Calculation results of conductor–tower models.
| Tower Structure | Gap (m) | Discharge | Ub (kV) | Tb (μs) | Average Speed (m/μs) | Step Length (m) |
|---|
| 220 kV Cup-Tower Middle Phase Tower Window | 3.0 | Positive | 1500 | 11.4 | 0.24 | 2.70 |
| Negative | 2000 | 0.5 | 9.98 | 2.02 |
| 220 kV Cup-Tower Side Phase Tower Window | 3.8 | Positive | 1750 | 8.6 | 0.42 | 3.43 |
| Negative | 2250 | 1.0 | 4.66/3.68 | 2.33/1.47 |
| 500 kV Tangent Tower Side Phase Tower body | 4.5 | Positive | 2300 | 8.9 | 0.46 | 4.05 |
| Negative | 2500 | 0.9 | 4.2/5.84 | 1.26/2.92 |
| 500 kV Tangent Tower Side Phase Crossarm | 5.0 | Positive | 2550 | 8.4 | 0.55 | 4.51 |
| Negative | 3000 | 1.2 | 4.14/5.86 | 2.07/2.93 |
Table 4.
U50% calculation results.
Table 4.
U50% calculation results.
| Tower Structure | Discharge | Gap (m) | U50% Simulation (kV) |
|---|
| 220 kV Cup-Tower Middle Phase Tower Window | Positive | 3.0 | 1488 |
| Negative | 3.0 | 1988 |
| 220 kV Cup-Tower Side Phase Tower Window | Positive | 3.8 | 1738 |
| Negative | 3.8 | 2238 |
| 500 kV Tangent Tower Side Phase Tower body | Positive | 4.5 | 2288 |
| Negative | 4.5 | 2488 |
| 500 kV Tangent Tower Side Phase Crossarm | Positive | 5.0 | 2538 |
| Negative | 5.0 | 2988 |
| Disclaimer/Publisher’s Note: The statements, opinions and data contained in all publications are solely those of the individual author(s) and contributor(s) and not of MDPI and/or the editor(s). MDPI and/or the editor(s) disclaim responsibility for any injury to people or property resulting from any ideas, methods, instructions or products referred to in the content. |
© 2025 by the authors. Licensee MDPI, Basel, Switzerland. This article is an open access article distributed under the terms and conditions of the Creative Commons Attribution (CC BY) license (https://creativecommons.org/licenses/by/4.0/).
