Abstract
The transition to low-carbon energy systems demands robust strategies that leverage existing fossil resources while integrating renewable technologies. In this work, a single-cycle Gaussian-based producibility model is developed to forecast natural gas production profiles, domestic consumption, export potential, hydrogen production and revenues, adaptive for untapped natural gas discoveries. Annual natural gas production is represented by a bell curve defined by peak year and maximum capacity, allowing flexible adaptation to different reserve sizes. The model integrates renewable energy adoption and steam–methane reforming to produce hydrogen, while tracking revenue streams from domestic sales, exports and hydrogen markets alongside carbon taxation. Applicability is demonstrated through a case study of Eastern Mediterranean gas discoveries, where combined reserves of 2399 bcm generate a production peak of 100 bcm/year in 2035 and deliver 40.71 billion kg of hydrogen by 2050, leaving 411.87 bcm of reserves. A focused Cyprus scenario with 411 bcm of reserves peaks at 10 bcm/year, produces 4.07 billion kg of hydrogen and retains 212.29 bcm of reserves. Cumulative revenues span from USD 84.37 billion under low hydrogen pricing to USD 247.29 billion regionally, while the Cyprus-focused case yields USD 1.79 billion to USD 18.08 billion. These results validate the model’s versatility for energy transition planning, enabling strategic insights into infrastructure deployment, market dynamics and resource management in gas-rich regions.
1. Introduction
Climate change and ever-increasing carbon emissions are issues that the world’s economies currently seek to address, as they pose huge environmental, social and economic implications. International agreements including the Paris and Kyoto Agreements aim to limit the increase in world temperatures by implementing carbon taxation, in order to ultimately reach the goal of reduced carbon emissions. Specifically for the Paris Agreement, a reduction of 5% in global greenhouse gas emissions from 2010 levels by 2030 is to be achieved, and by 2050, zero emissions are targeted [1]. Therefore, it is apparent that other sustainable technologies and fuels have to be taken in consideration to aid this energy transition.
Natural gas is considered the cleanest fossil-derived fuel due to its reduced emissions. It has been suggested that it can be used as a bridge fuel to aid the energy transition towards renewable resources and sustainability [2,3,4,5,6,7]. Taking the case of the new untapped natural gas field discoveries in the Eastern Mediterranean as an example, the utilization of natural gas has come to the forefront for the countries within the region, both in terms of environmental and monetary gain [8,9,10,11,12,13]. Therefore, plans for its utilization must be made, always taking in consideration the producibility of these reservoirs and the possible future utilization of the reserves. Medium- and long-term forecasting of the natural gas supply is paramount in order for a country to have a healthy gas market and avoid energy crises, both for developed and developing countries [14]. Several models have thus been developed for predicting the producibility of fossil fuel reservoirs, and a majority of them are summarized in [15,16,17]. All these models are curve-fitting models, fitted on past data to verify the mathematical model proposed. After optimizing constraints and improving fit quality, they can be used to predict future trends [16].
In this work, an adaptive mathematical model is developed to predict the sustainable utilization of untapped natural gas discoveries. The analysis comprehensively examines natural gas as both a standalone primary energy source for carbon emission reduction and as a complementary technology integrated with renewable energy systems and hydrogen production processes via steam–methane reforming (SMR). The model specifically investigates natural gas’s critical role as a bridge fuel, transitioning from today’s heavy dependence on fossil fuels toward tomorrow’s renewable-energy-integrated systems. Additionally, the research evaluates natural gas across multiple dimensions, such as domestic usage patterns, hydrogen generation potential, environmental emissions and economic revenue prospects.
In Section 2, ways for sustainable natural gas utilization, renewable energy integration and hydrogen production pathways from natural gas via SMR, with emphasis on recent Eastern Mediterranean offshore discoveries, are presented. Section 3 presents the single-cycle Gaussian-based producibility model developed, detailing its mathematical formulation, parameter definitions and validation against historical data. Section 4 describes the input data, key assumptions and scenario design, and a discussion of the scenario-based results is provided in Section 5. The conclusions are summarized in Section 6.
2. Sustainable Natural Gas Utilization
The ultimate goal of zero carbon emissions lies within the implementation of renewable resources and fuels that produce zero emissions when used. Therefore, a shift from fossil fuels is a necessity. Currently, the dependency of the global energy systems on fossil fuels is quoted as 83.2% (31.3% oil, 27.2% coal and 24.7% natural gas) [18]. Even though fossil fuel use was projected to decline [19], a complete replacement of fossil fuels even within the time frame given (2050) is evident to be very difficult, if not impossible. The implementation of other fuels with reduced carbon emissions has been presented as a solution to aid the necessary energy shift; the most prominent one being natural gas. Natural gas is a fossil fuel; however, its carbon emissions are the lowest when compared to coal and oil. Namely, natural gas emissions are 50% less of that of coal, and 25% of oil [5,7,20]. Therefore, in the quest for reduced emissions and the resultant transitional shift that has to occur, natural gas can be deemed as the bridge fuel between fossil fuel use and complete dependency on renewables for zero emissions.
Primary energy demand has been on the rise from 2000 to 2022; namely, around a 50% increase [21]. As seen in Figure 1, natural gas use as a primary energy source is expected to see an increase of about 20% until 2050 under the current trajectory scenarios. Additionally, even under “net-zero” scenarios, natural gas is seen to still play a role in primary energy production, even if it is expected to see a reduction. Renewable resources are expected to see an increase in their share as well, between 150 and 250% [22] depending on the scenario. Notably, oil and coal demand are expected to decrease in all scenarios, from 25% to 73% and 35% to 86% respectively.
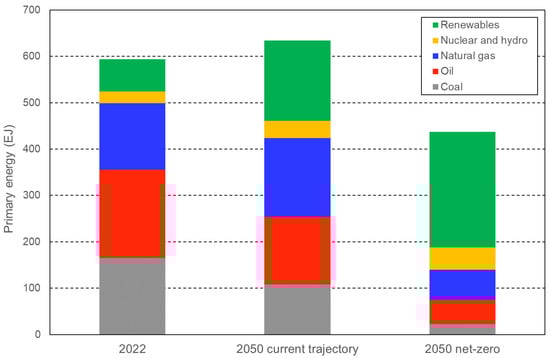
Figure 1.
Primary energy demand (%) per energy source under current trajectory and net-zero scenarios [22].
However, an increase in coal usage has been observed in 2024, approximately 1.4% (or 123 million tonnes). The main driver seems to be electricity production, due to the increasing need for air conditioning, especially in countries like China and India, which face recurring heatwaves [23]. Therefore, as these are countries with increasing population and industrial expansion, they face a lot of pressure to reduce emissions. Specifically, China is the top energy consumer worldwide, as well as the top carbon emitter [21]. This stems from the fact that China (and other countries in Asia) is currently experiencing sustained economic growth resulting in continuous energy demand. Coal is the main source of energy production (accounting for almost 57% of total fossil fuel use) due to restrictions posed by resource endowment and technological development [24]. However, several initiatives have been put into place in order to aid the switch from coal to natural gas, aiming at reducing emissions, bettering air quality and reducing dependency on fossil fuels. Namely, Beijing has been promoting the ”coal-to-gas” policy, resulting in achieving the carbon peak ahead of schedule while maintaining sustained economic growth [25]. In addition, China is aiming to reduce coal use, stabilize oil use and ultimately increase gas and renewable energy use [24]. Due to the fact that renewable resources are known to experience intermittency, and other fuels/technologies (e.g., hydrogen) are still in their primitive stage, natural gas seems to be the solution to replace coal. This will result in a reduction of emissions by 62 million tonnes, as well as tackling the variability posed by renewable energy resources [24].
Developed countries are also seen to implement natural gas in their energy production sector. In 2023, 35.3% of the USA’s total energy supply was from natural gas, and in Canada the respective percentage was 40.8% [26,27]. This is primarily due to the fact that the USA and Canada have seen an increase in domestic gas production between 2000 and 2023. Namely, the USA observed an increase of almost 100%, ranking as the top world natural gas producer in 2022, and for Canada, there was an increase of 144.7%, coming in second place [26,27]. Consequently, this also resulted in a 12.7% net export share of total 2023 gas production for the USA, and a 27.5% share for Canada. This elucidates the fact that natural gas can be a source of revenue for a country if the amount of reserves permit its export without compromising domestic use.
Natural gas can also be used as a fuel in vehicles. Natural Gas Vehicles (NGVs) are seen to reduce carbon emissions by around 25% in comparison to conventional vehicles [28]. Focusing on the transport sector is imperative in the quest of reducing emissions, as it is the sector that produces the highest amount. Namely, almost three quarters of overall transport greenhouse emissions come specifically from road transport [29,30,31]. With the EU aiming to achieve a 90% reduction in greenhouse gas emissions from transport by 2050 compared to 1990 [30], it is understood that the transport sector has to vastly reduce its emissions. Natural gas utilization via NGVs can be one of the solutions implemented to reduce emissions, if other issues in regard to their use can be tackled [28].
World natural gas production is expected to peak at 133–206 tcf/year between 2025 and 2066 [32], with projected demand also increasing for energy, both worldwide and for specific countries [14,33,34,35]. Natural gas demand (especially LNG) has shown an increase in the EU from 12% in 2010 to around 35% in 2022 [36]. Also, 270 bcm of new LNG export terminals are currently under construction, adding another 50% to the global LNG capacity [37]. It is therefore understood that natural gas will become an important asset in energy production due to its increasing availability, but also because of the continuously increasing demand for energy. This, coupled with the need to reduce emissions as soon as possible, ultimately means that natural gas has to be part of the energy transition towards sustainability.
Natural gas can also be employed alongside renewable resources to aid the energy transition [38,39,40]. As mentioned previously, natural gas is a cleaner alternative to conventional fossil fuels as it produces fewer carbon emissions. Moreover, it is highly flexible in terms of quick response to the needs of the electricity grid [41,42]. Specifically, gas turbines running on natural gas have a dynamic ramping ability that can increase or decrease electricity generation within less than an hour, allowing it to respond rapidly to fluctuations on the demand side. In addition, gas turbines using natural gas have the potential to adjust to fluctuating power produced from the intermittency of renewable energy resources, tackling issues of curtailment [39,40,42]. Curtailment is the reduction in power production or consumption when there is too much electricity within the grid or when there is not enough to match demand. In both cases, energy is not used efficiently, either by not being used when it is produced (generation curtailment) or by not being enough when needed (load curtailment). This is a common occurrence with renewable resources due to weather forecast deviations and intermittency, but also due to the inability of a grid to transport or store the excess electricity produced [43]. Therefore, natural gas and renewables can be used in conjunction in order to tackle issues of curtailment.
Natural gas can be used as a means to reduce curtailment, either by utilizing gas-to-power (G2P) or power-to-gas (P2G) methods. G2P, shown in Figure 2, is the process of converting natural gas to power, and it is usually employed when there is not enough power produced (due to curtailment, as a result of renewable resources’ intermittency). Natural gas is therefore used to produce the needed amounts of power to balance demand and supply.
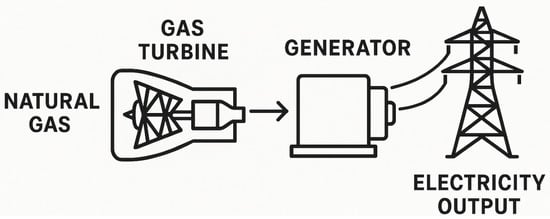
Figure 2.
Gas-to-power process.
Similarly, P2G, presented in Figure 3, is the process of converting excess power supply into gas. This gas can be hydrogen via electrolysis of water, or even methane (i.e., synthetic natural gas) via methanation of hydrogen. The concepts of G2P and P2G are often encountered as joint projects, usually called gas-to-power-to-gas (GPG), found both as conceptual plans and implemented projects [44,45,46,47], as illustrated in Figure 4.
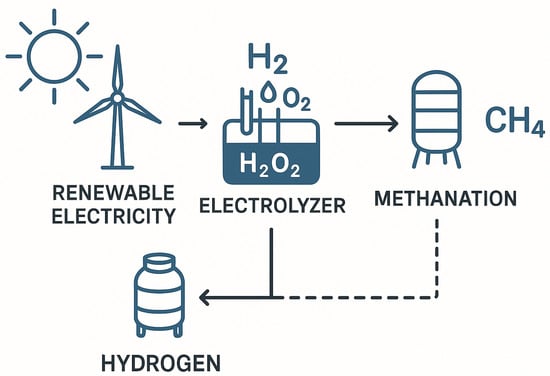
Figure 3.
Power-to-gas process.
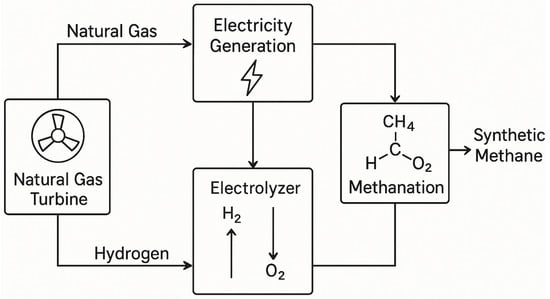
Figure 4.
Gas-to-power-to-gas process.
G2P concepts can be easily incorporated with today’s technology, as using natural gas to produce the electricity needed is a practice that is currently undertaken on a large scale. The challenging and less-implemented aspect of GPG is the P2G part, where the excess supply of power is used to produce gas. Several P2G projects undertaken in Europe were summarized by [48], with Germany having highest share of realized demonstration projects. The main products of these projects are hydrogen, which is then converted to methanol, dimethyl ether (DME), long-chain hydrocarbons and most prominently methane. The electrolyzers used are projected to increase in capacity, elucidating the fact that P2G projects are also expected to increase as a result. This is also evident in the fact that several recent studies have also been undertaken to quantify costs, financial resources and social metrics, as well as the technical aspects behind such technologies, including operation optimization [9,49,50,51,52,53].
It has been noted that the implementation of natural gas as a sole means to reduce emissions may not be enough to provide the needed amount of emissions reduction. Based on the model developed by [54] to study the dynamic effect of renewable energy consumption on emissions, it was concluded that the consumption of natural gas will have a negative impact on CO2 emissions only initially; in the long run, the reduction in carbon emissions will be “modest” and eventually show an upward trend. However, renewable energy can significantly reduce carbon emissions and has a much bigger impact in comparison to natural gas use [54]. It has also been suggested that expansion of natural gas infrastructure could delay the introduction of near-zero emission energy systems. This has been suggested to lead even to the point where there could be no near-term advantage to replacing coal energy systems with natural gas energy systems if natural gas leakages are high and the coal energy system is much more efficient than the natural gas system [55,56]. However, in many scenarios found in the literature, both renewables and natural gas observe an increase in their share within the electricity generation mix [43,57,58], with an overall increase in projected demand for energy both worldwide and for specific countries [59,60]. Therefore, using natural gas in tandem with renewable energy sources can aid in lowering emissions, as well as address the energy balance issues that come with relying solely on renewables.
Due to the growing concerns of climate change and emissions, hydrogen has come to the forefront in the recent years, as it is a fuel that produces no carbon emissions, just water vapour [3]. Research has also focused on hydrogen as a fuel in vehicles via fuel cells (FCEVs) to tackle issues of pollution through transportation. In order to achieve carbon neutrality, which is the ultimate goal, emissions from the transport sector have to be reduced substantially, with hydrogen being one of the key alternatives to conventional fuels that do emit CO2.
Natural gas can be a source of hydrogen via different reforming methods, partial oxidation and pyrolysis [61,62,63]. The most widely used method is steam–methane reforming (SMR), initially proposed in 1932 [64,65]. Hydrogen production from natural gas (also known as grey hydrogen) amounts for almost half of the total hydrogen produced [66]. Not only that, hydrogen produced from fossil fuels is dominating the world of hydrogen supply as production costs are lower, resulting in lower fuel prices [62]. However, SMR is highly emission-intensive, generating around 9 to 12 kg CO2/kg H2 [67,68,69]. Coal gasification, producing brown/black hydrogen is even more emission-intensive, with emissions over 20 kg CO2/kg H2 [70]. Blue hydrogen, produced via SMR with Carbon Capture and Storage (CCS), lowers the carbon intensity to roughly 1 to 8 kg CO2/kg H2, a decrease of up to 92% as noted in the literature [66]. The need for CCS or even CCUS (Carbon Capture Utilization and Storage) is ever-increasing, with several studies aiming to optimize the process and quantify costs, the Levelized Cost of Hydrogen (LCOH) and potential utilization routes [3,7,71,72,73,74,75]. However, blue hydrogen still carries the risk of upstream methane leakage and fugitive emissions that can affect its potential in reducing emissions [76,77,78,79]. In contrast, green hydrogen produced through water electrolysis powered by renewable energy, results in the lowest emissions, sometimes even reaching below 1 kg CO2/kg H2. Most remaining emissions are being attributed to the manufacturing stage, positioning green hydrogen as the ultimate low-carbon solution [76,80]. However, in light of the increasing production and demand for natural gas, as well as the lower cost of production of grey hydrogen, it is understood that natural gas will continue to be one of the major hydrogen sources, despite the rise in hydrogen production from renewable resources, including biomass processes and water splitting [62].
Based on the literature review conducted, it is understood that the need to reduce carbon emissions in today’s economy and climate is paramount and has to be actively sought out. The utilization of natural gas on its own is an important starting point, especially when natural gas production is forecasted to increase within the coming years and has the potential to reduce emissions in comparison to conventional fossil fuels. The potential to use natural gas in conjunction with renewable energy can be high, as well as the possibility of hydrogen production via SMR. Therefore, modeling natural gas production is paramount to creating informed utilization plans, ultimately fostering a healthy energy market.
3. Mathematical Formulation
Forecasting natural gas production based on reserve values (i.e., producibility) relies on curve-fitting models [15,16,17]. As presented in Figure 5, a mathematical model was developed for this work based on a singe-cycle Gaussian bell curve. The main aim is to provide initial estimates on natural gas production, potential revenue and exploitation timelines for untapped natural gas resources, and demonstrate the contribution of natural gas utilization to the energy transition. It is implemented in MATLAB R2024b to forecast natural gas producibility and hydrogen potential for different energy transition scenarios, focusing on newly discovered and untapped resources. The algorithm begins with comprehensive parameter setup including temporal, economic, technical and policy variables, then proceeds through iterative calculations for each year in the modeling period. The core logic involves a production profile based on a bell curve, followed by annual allocation calculations that distribute natural gas between domestic usage, exports and hydrogen production. The program accounts for increasing renewable energy adoption and hydrogen share over time, while tracking economic performance through revenue calculations and environmental impact through emissions monitoring. The final outputs include both visual representations through subplot charts and quantitative metrics summarizing total revenue, hydrogen production via SMR and remaining reserves over the 25-year modeling period.
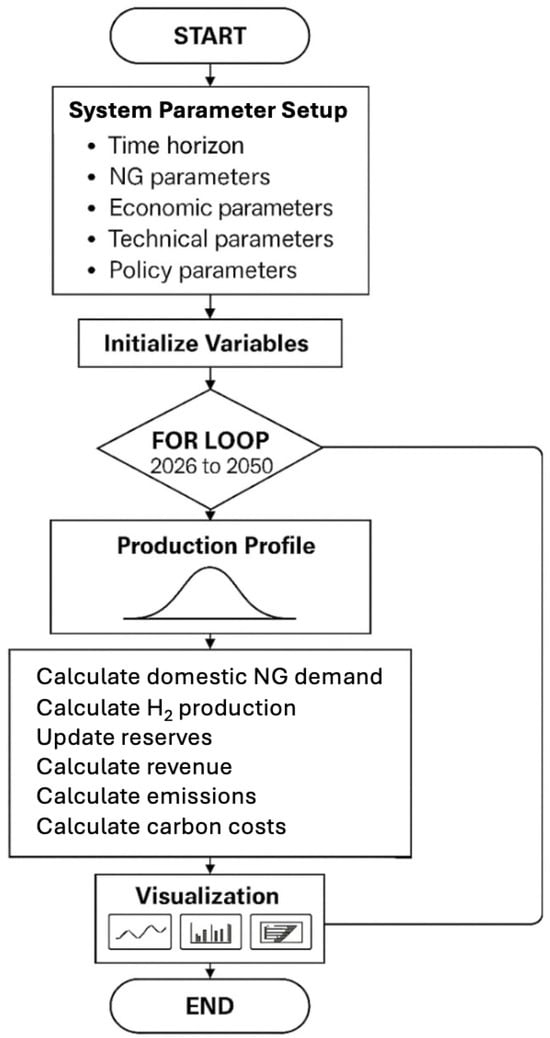
Figure 5.
Mathematical model logic.
Specifically, the annual production of natural gas, in bcm/year that is modeled using a single-cycle Gaussian bell curve, is given by
where indexes time periods (years) in the planning horizon T, is the maximum annual production in bcm/year and is the peak production year [81].
Hydrogen annual production, in kg/year, is given by the relation
where is the annual utilization of natural gas for hydrogen production in %, is the natural gas-to-hydrogen conversion ratio in kg/m3 and is the conversion of bcm to m3 (109 m3/bcm).
The annual domestic natural gas usage, in bcm/year, is calculated by
where is the natural gas base demand for domestic purposes in bcm/year, is the annual share of renewable sources in domestic energy consumption in % and is the annual utilization of natural gas for hydrogen production in %.
The annual natural gas exports, in bcm/year, can then be calculated by
where is the maximum export capacity in bcm/year. The equation uses the max constrain to ensure exports never fall below zero, and the min constrain to force exports to never exceed the maximum allowed quantity for exports, .
The annual revenue, in USD/year, is given by the relation
in USD/year is the annual revenue from domestic use, given as
where is the domestic selling price of natural gas in USD/MMBtu, is the extraction cost of natural gas in USD/MMBtu and is the conversion ratio of MMBtu to m3 (MMBtu/m3 = 0.035). , in USD/year, is the annual revenue from exports:
where is the export selling price of natural gas in USD/MMBtu. The annual revenue from hydrogen in USD/year is given by the relation
where is the selling price of hydrogen in USD/kg and is the cost of natural gas reforming to hydrogen in USD/kg. is the annual carbon emissions cost in USD/year, given by the relation
where is the carbon tax in USD/ and is the annual carbon emissions in /year, calculated by the relation
where is the natural gas emission factor (/MMBtu = 0.053) and is the hydrogen intensity for hydrogen production via SMR (/ = 0.01 [67,68,69]).
In order to test the mathematical model developed in terms of its ability to map production forecasts and peak production year, real data for annual production from China’s natural gas fields were acquired from 1970 to 2022 [21,82,83,84,85]. The model developed in this study was fit to the same timeframe as the existing data. The method of least squares by minimizing residuals was implemented, with one variable parameter: peak production year, . Peak annual production, , was a fixed parameter, based on a calculated average from previous estimates [86,87,88,89]. As illustrated in Figure 6, the estimated peak year of 2029 is very close to the lower end of estimates [86,87,88,89,90,91,92]. The coefficient of determination was then calculated (), using the total sum of squares (TSS) and the residual sum of squares (RSS), and was found to be 0.89. This means the model explains 89% of the variation in the production data, which is close to the ideal = 1.
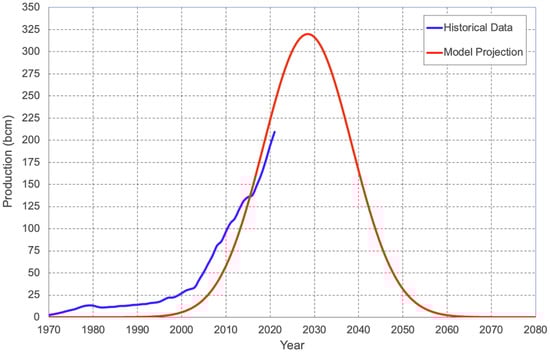
Figure 6.
China’s forecasted natural gas production.
4. Model Evaluation on a Test Case
In order to demonstrate the applicability of the model developed to a specific case study, the case of the newly discovered Eastern Mediterranean natural gas reservoirs was evaluated. Several natural gas reserve discoveries have been made in the Eastern Mediterranean area, in the exclusive economic zones of Cyprus, Israel and Egypt. These recent, untapped discoveries give the region a newfound importance in terms of energy potential. Several infrastructure projects have been in place in the area, including the Arish–Ashkelon Pipeline, the Arab Gas Pipeline (AGP) and the Trans-Adriatic Pipeline (TAP), enabling connections between Egypt, Israel, Lebanon, Syria and Jordan, as well as from Azerbaijan to Greece, Albania and Italy [93]. Due to these recent discoveries, especially concerning Cyprus and Israel, a new pipeline has been proposed; the East Mediterranean Gas (EastMed) pipeline. This pipeline is proposed to deliver natural gas from Israel’s and Cyprus’s fields to Greece, and then to central Europe via the gas interconnector of Greece–Bulgaria [93], as seen in Figure 7.
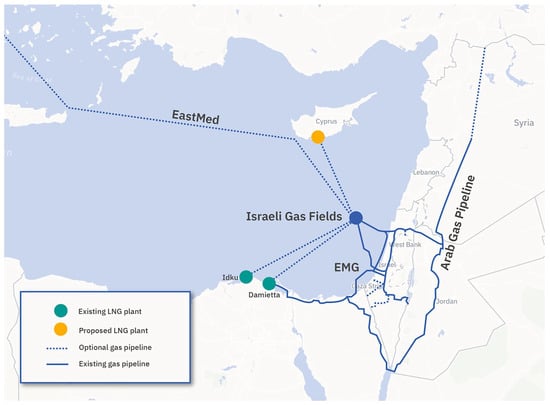
Figure 7.
A map of the geographical area of the Eastern Mediterranean sea, including existing and proposed LNG plants, as well as existing and optional gas pipelines.
Even though this pipeline is still a proposed project that could face infrastructure issues, high costs and technical challenges [94], other plans have arisen to allow the exploitation of the Cypriot fields. The Vasilikos FLNG terminal infrastructure will allow gasification of natural gas and export to Europe. In addition, plans to link Cronos gas field to Zohr gas field in Egypt are discussed, with some of its gas production to be supplied to the Egyptian market and the majority intended for liquefaction and export to Europe and global markets [95].
The case of the Eastern Mediterranean region and its new gas field discoveries shines a new light in the area in terms of natural gas production and the possibility of a new energy hub. It is understood that the exploitation of natural gas within the region is an endeavor that will allow energy interconnections to take place and achieve synergies between the neighboring countries. Exports will allow revenue generation and further exploitability of the reserves, especially in countries like Cyprus which lack the grid infrastructure to supply natural gas directly to households. A timeline of the discoveries is given in Table 1, including all the major discoveries, their reserves noted as ultimate recoverable reserves (URR) [96], defined by Figure 8, as well as peak annual production [10,12,93,97,98,99,100,101,102]. In addition, the total URR is also indicated, as well as average annual production for all discoveries. For Zeus, Karish and Cronos, maximum annual production values were not available, and were hence estimated in comparison to Glaucus which has a similar URR value. Similarly, for Tanin, Calypso was used as a basis for comparison to determine maximum annual production. For discoveries that have a range in estimated URR, an average was taken in order to calculate the total URR of the area.

Table 1.
Major gas reserves in the East Mediterranean sea.
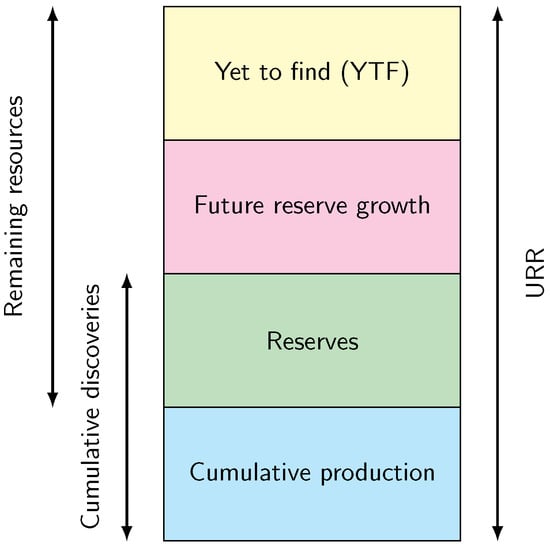
Figure 8.
Components of URR. Reproduced with permission from S. Sorrell et al., Energy Policy; published by Elsevier, 2010 [96].
To demonstrate the applicability of the model developed to the gas producibility and hydrogen potential of the Eastern Mediterranean natural gas discoveries, as well as its applicability to a country that lacks natural gas infrastructure and can benefit from regional synergies, four scenarios are examined: (a) scenario ME1: All Eastern Mediterranean natural gas discoveries with produced hydrogen selling price set at 1.5 USD/; (b) scenario ME2: All Eastern Mediterranean natural gas discoveries with produced hydrogen selling price set at 5.5 USD/; (c) scenario CY1: Only Cyprus natural gas discoveries with produced hydrogen selling price set at 1.5 USD/; (d) scenario CY2: Only Cyprus natural gas discoveries with produced hydrogen selling price set at 5.5 USD/.
The technical and economic data and assumptions employed in the model developed are presented in Table 2. The model provides forecasts over a 25-year horizon from 2025 to 2050, with natural gas production reaching its peak in 2035. To achieve long-term carbon neutrality objectives, natural gas alone cannot serve as the sole energy source. Consequently, the integration of renewable energy sources alongside natural gas utilization, coupled with hydrogen production from natural gas feedstock, constitutes a critical component of the energy transition strategy incorporated into the model framework. The renewable energy share within the energy system is parameterized to increase linearly from an initial 20% in 2025 to 60% by 2050. This trajectory aligns with European Union renewable energy targets, which were initially established at 32% in 2018 and subsequently revised upward in 2023 to a minimum of 42.5%, with aspirational goals reaching carbon neutrality by 2050 [103]. Current EU performance has already surpassed these targets, with renewable electricity generation achieving 47% in 2024 [104]. Given the extended modeling horizon to 2050, the selected endpoint of 60% renewable penetration represents an ambitious yet achievable target. The hydrogen production trajectory is modeled to scale from zero in 2025 to 25% of the energy mix by 2050. This growth pathway reflects the nascent but rapidly expanding role of hydrogen in energy systems. Current EU hydrogen consumption represents approximately 2% of total energy demand [103], with 95.5% of European hydrogen production currently derived from fossil fuel sources [105]. However, hydrogen’s versatility extends beyond direct energy applications, serving as a feedstock for chemical production including ammonia and methanol synthesis. This characteristic makes hydrogen particularly attractive as an export commodity for countries with limited domestic utilization capacity. The 25% target therefore encompasses hydrogen’s dual potential as both an energy carrier for electricity generation and a precursor for value-added chemical production.
Table 2.
Technical and economic data and assumptions.
5. Results and Discussion
The modeling framework examined four distinct scenarios differentiated by geographical scope and hydrogen market conditions. The Eastern Mediterranean scenarios (ME1 and ME2) encompass all regional gas discoveries, while the Cyprus-specific scenarios (CY1 and CY2) focus exclusively on Cypriot fields. Each scenario is evaluated under two hydrogen pricing conditions: a low price of 1.50 USD/ and a high price of 5.50 USD/. Comprehensive results for all scenarios are detailed in Table 3, which demonstrates that hydrogen pricing variations affect only economic returns while leaving physical gas allocation patterns unchanged across all scenarios.
Table 3.
Overall detailed results.
Figure 9 illustrates the characteristic Gaussian distribution observed in both natural gas production and export trajectories for the Eastern Mediterranean scenarios. Regional production capacity demonstrates robust growth from 66.70 bcm in 2026, reaching peak production of 100 bcm in 2035, followed by a systematic decline to 32.47 bcm by 2050. This production profile reflects the natural depletion characteristics of the combined regional reserves totaling 2399 bcm. Export volumes follow a similar bell-shaped pattern, exhibiting initial growth that peaks around 2035–2037, before gradually declining through the modeling period. The export trajectory closely mirrors production patterns, with domestic consumption showing a consistent downward trend over time. This declining domestic usage pattern reflects the strategic prioritization of export revenues and hydrogen production over local consumption as production capacity matures.
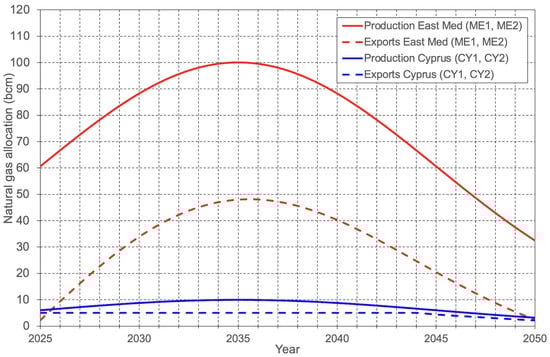
Figure 9.
Production and exports of natural gas for all scenarios.
The Cyprus scenarios, illustrated in Figure 9, present markedly different dynamics despite following the same underlying Gaussian production model. Natural gas production grows from 6.67 bcm in 2026 to a peak of 10 bcm in 2035, subsequently declining to 3.25 bcm by 2050. However, unlike the regional scenarios, Cyprus exports exhibit a distinct plateau behavior rather than following the bell-shaped production curve. Exports maintain a constant level of 5 bcm annually until 2044, at which point declining production forces export reductions. This export constraint, governed by Equation (4) in the mathematical framework, ensures exports never fall below zero while maximizing economic returns. Consequently, Cyprus must allocate approximately 80% of its natural gas production to exports throughout most of the modeling period, creating significant dependence on international market conditions and export infrastructure reliability.
Reserve tracking is paramount for economic stability and appropriate natural gas allocation. Figure 10 presents the reserve depletion trajectories, revealing substantial differences in resource longevity between scenarios. The Eastern Mediterranean scenarios demonstrate responsible resource management, with 411.87 bcm (17% of initial reserves) remaining by 2050. This reserve retention suggests potential for continued production and economic activity beyond the current modeling horizon, providing strategic flexibility for future energy transition phases. The Cyprus scenarios show more conservative depletion rates, retaining 212 bcm (53% of initial reserves) by 2050. This higher retention rate results from smaller initial reserves (411 bcm) and limited domestic natural gas consumption (1 bcm/year), creating opportunities for extended production timelines and potential export expansion in subsequent decades. The substantial remaining reserves indicate that Cyprus could maintain natural gas operations well into the second half of the 21st century under current consumption patterns.
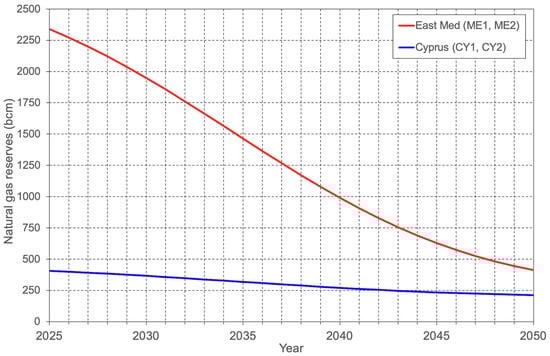
Figure 10.
Remaining reserves for all scenarios.
It is important to note that the Eastern Mediterranean area as a whole can benefit from the high remaining reserves of specific countries, even when the total reserves may be declining. Synergies created in the area can allow the use of existing interconnecting pipelines, and liquefaction and regasification infrastructure, in order for countries to assist each other in the production of natural gas as well exporting. This can lower initial investment costs as one country can have the ability to utilize another country’s infrastructure in order to produce and distribute natural gas, hence still making a profit without the initial, much higher investment. Specifically, Cyprus can also have strategic advantages, including simplified regulatory coordination within a single jurisdiction and controlled infrastructure requirements that will enable faster deployment.
Figure 11 demonstrates the hydrogen production trajectories across all scenarios, highlighting the substantial industrial development potential within the region. Eastern Mediterranean scenarios generate cumulative hydrogen production of 40.73 billion kg through 2050, with peak annual production reaching 2405 million kg/year by 2041. This production scale positions the region as a potentially significant supplier to European hydrogen markets, particularly given the 25% allocation of natural gas to hydrogen production specified in the model assumptions.
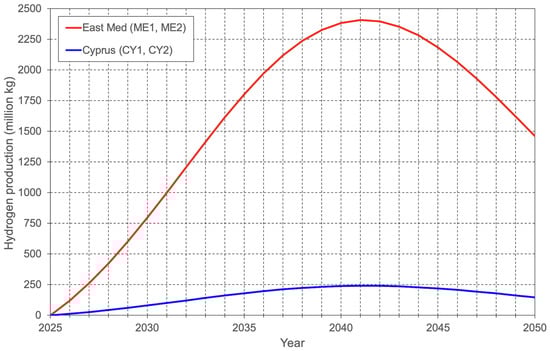
Figure 11.
Hydrogen production for all scenarios.
Cyprus-specific scenarios yield 4.07 billion kg of cumulative hydrogen production, representing substantial industrial capacity for a small island economy. Peak production occurs around 2039–2041, coinciding with maximum natural gas availability. The hydrogen production profile reflects the strategic allocation framework embedded in the model, which balances current natural gas revenues against future hydrogen economy benefits. The current modeling framework exclusively considers hydrogen production through steam–methane reforming of natural gas, without incorporating alternative hydrogen generation pathways that may emerge during the forecast period. Should renewable-based electrolysis technologies [125,126,127,128] or nuclear-powered hydrogen production systems [129,130,131,132,133] be deployed at commercial scale, natural gas reserves would experience significantly slower depletion rates, potentially enabling enhanced exports and domestic consumption patterns. Such alternative hydrogen production pathways represent increasingly viable prospects, particularly given the projected expansion of renewable energy capacity [103].
CO2 emission patterns, illustrated in Figure 12, directly correlate with production and export activities across all scenarios. Eastern Mediterranean scenarios exhibit the expected bell-curve emissions profile, peaking around 2034-2036 in alignment with maximum production periods. Total emissions reflect both domestic consumption and export activities, with the latter contributing significantly due to higher export volumes. The Cyprus scenarios demonstrate an interesting emissions discontinuity after 2044, characterized by sharp reductions coinciding with export capacity constraints. The 5:1 ratio between export volumes (5 bcm/year) and domestic consumption (1 bcm/year) underscores the disproportionate environmental impact of export-oriented strategies compared to domestic utilization.
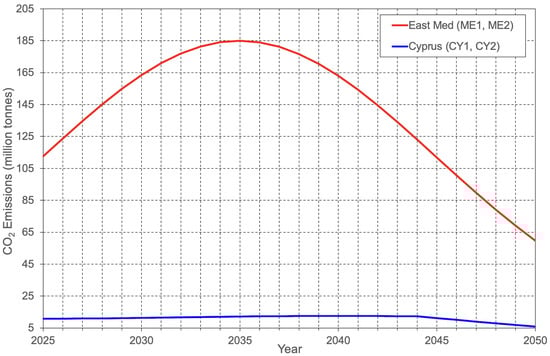
Figure 12.
CO2 emissions for all scenarios.
Table 4 reveals the transformative economic impact of hydrogen pricing on overall project viability. Eastern Mediterranean scenarios generate revenues ranging from USD 84.37 billion under conservative hydrogen pricing (scenario ME1) to USD 247.29 billion under competitive pricing (scenario ME2). This threefold revenue increase demonstrates the critical importance of hydrogen market development for project economics. Cyprus scenarios exhibit even more dramatic sensitivity to hydrogen pricing, with revenues spanning from USD 1.79 billion (scenario CY1) to USD 18.08 billion (scenario CY2), representing a ten-fold increase. The substantial revenue differential stems from the narrow profit margin at low hydrogen prices (1.50 USD/kg selling price versus 1.20 USD/kg production cost), which severely constrains profitability under conservative market conditions.
Table 4.
Overall revenue results for all scenarios.
The economic analysis reveals fundamental transformation opportunities for the Eastern Mediterranean region, with revenue potential directly linked to hydrogen market development and regional cooperation frameworks. Success in capturing these opportunities requires coordinated infrastructure development, supportive regulatory frameworks and strategic positioning within evolving European hydrogen markets.
6. Conclusions
The developed single-cycle Gaussian-based producibility model effectively captures the dynamic behavior of natural gas production and utilization, offering a versatile tool for energy transition planning. By representing annual gas production as a bell curve parameterized by peak year and maximum capacity, the model accommodates a range of reserve sizes and demand profiles while maintaining robust fit to historical data, as demonstrated by alignment with China’s production trajectory through 2022. Its modular structure seamlessly integrates renewable energy adoption and hydrogen production share via SMR practices. Revenue components for domestic sales, exports and hydrogen, as well as net of carbon taxation, are computed annually, enabling rigorous economic and environmental impact assessments under varying market conditions and policy settings.
Applying this framework to the Eastern Mediterranean test case, which encompasses 2399 bcm of proven reserves across Cyprus, Israel and Egypt, validates its capacity to simulate real-world scenarios and derive actionable insights. Under baseline assumptions, the model projects regional gas production peaking at 100 bcm in 2035 before declining to 32.47 bcm by 2050. Exports and domestic consumption evolve in correspondence, while cumulative hydrogen production reaches 40.71 billion kg, with peak annual production exceeding 2.4 billion kg in 2041. Remaining reserves amount to 411.87 bcm by 2050, providing strategic flexibility for post-2050 planning. Economic results exhibit strong dependence on hydrogen pricing: low hydrogen pricing at 1.50 USD/kg yields USD 84.37 billion in cumulative revenue, whereas a higher price of 5.50 USD/kg elevates returns to USD 247.29 billion.
When applied solely to Cyprus’s 411 bcm of reserves, the model similarly forecasts a peak production of 10 bcm in 2035, declining to 3.25 bcm by 2050, with cumulative hydrogen production of 4.07 billion kg and remaining reserves of 212.29 bcm by mid-century. Under low hydrogen pricing, Cyprus’s cumulative revenues reach USD 1.79 billion, increasing to USD 18.08 billion at the higher price level. These parallel results confirm the model’s utility for evaluating trade-offs between resource depletion, infrastructure investment and market dynamics at both regional and national scales. Early deployment of steam–methane reformers with potential carbon capture is essential to capitalize on production peaks, while robust carbon pricing and regional cooperation will maximize economic returns and emission reductions.
Author Contributions
Conceptualization, E.H. and A.P.; methodology, E.H. and A.P.; investigation, E.H. and A.P.; data curation, E.H. and A.P.; writing—original draft preparation, E.H. and A.P.; writing—review and editing, E.H. and A.P.; visualization, E.H. and A.P.; supervision, A.P. All authors have read and agreed to the published version of the manuscript.
Funding
This research received no external funding.
Data Availability Statement
The original contributions presented in this study are included in the article. Further inquiries can be directed to the corresponding author.
Conflicts of Interest
The authors declare no conflict of interest.
References
- Masson-Delmotte, V.; Zhai, P.; Pörtner, H.-O.; Roberts, D.; Skea, J.; Shukla, P.R.; Pirani, A.; Moufouma-Okia, W.; Péan, C.; Pidcock, R.; et al. Global Warming of 1.5 °C. An IPCC Special Report on the Impacts of Global Warming of 1.5 °C above Pre-Industrial Levels and Related Global Greenhouse Gas Emission Pathways, in the Context of Strengthening the Global Response to the Threat of Climate Change, Sustainable Development, and Efforts to Eradicate Poverty. 2018. Available online: https://www.ipcc.ch/sr15/download/ (accessed on 9 September 2025).
- Hausfather, Z. Bounding the climate viability of natural gas as a bridge fuel to displace coal. Energy Policy 2015, 86, 286–294. [Google Scholar] [CrossRef]
- Venizelou, V.; Poullikkas, A. The potential of green hydrogen as an alternative to natural gas power generation. Renew. Sustain. Energy Rev. 2025, 224, 116028. [Google Scholar] [CrossRef]
- Weissman, S.; Constantine, S.; Hernandez, P.; Gallagher, C. Natural Gas as a Bridge Fuel: Measuring the Bridge. March 2016. Available online: https://energycenter.org/sites/default/files/docs/nav/policy/research-and-reports/Natural_Gas_Bridge_Fuel.pdf (accessed on 9 September 2025).
- Gillessen, B.; Heinrichs, H.; Hake, J.-F.; Allelein, H.-J. Natural gas as a bridge to sustainability: Infrastructure expansion regarding energy security and system transition. Appl. Energy 2019, 251, 113377. [Google Scholar] [CrossRef]
- Acquah-Andoh, E. Energy Transition and Natural Gas: Reviewing the Role of Natural Gas in the Energy Transition—Lessons from the UK and EU. Int. J. Bus. Technol. Stud. Res. 2025, 7, 14. [Google Scholar]
- Venizelou, V.; Poullikkas, A. The effect of carbon price towards green hydrogen power generation. Renew. Sustain. Energy Rev. 2025, 211, 115254. [Google Scholar]
- Koukakis, N. ExxonMobil Makes Biggest Natural Gas Discovery in Two Years Off the Coast of Cyprus. February 2019. Available online: https://www.cnbc.com/2019/02/28/exxonmobil-makes-big-natural-gas-discovery-off-the-coast-of-cyprus.html?fbclid=IwAR2F31bp1de_7-NfnrhRy-3UFqfImirN1Ow2Pm-FEFdhZRifAfT193-6500 (accessed on 9 September 2025).
- Colelli, L.; Bassano, C.; Verdone, N.; Segneri, V.; Vilardi, G. Power-to-gas: Process analysis and control strategies for dynamic catalytic methanation system. Energy Convers. Manag. 2024, 305, 118257. [Google Scholar]
- Hazou, E. Drilling for Cyprus Gas, a Timeline. June 2016. Available online: https://cyprus-mail.com/divided-island/special-reports/natural-gas/drilling-for-cyprus-gas-a-timeline (accessed on 9 September 2025).
- Kambas, M. Cyprus Could Produce First Natural Gas as soon as 2026, Minister Says. February 2024. Available online: https://www.reuters.com/business/energy/cyprus-could-produce-first-natural-gas-soon-2026-minister-says-2024-02-14/ (accessed on 9 September 2025).
- Godwin, B. Cyprus—A European Energy Savior? January 2025. Available online: https://cepa.org/article/cyprus-a-european-energy-savior/ (accessed on 9 September 2025).
- International Gas Union (IGU). The East Mediterranean Gas Forum (EMGF). The Role of Gas in Eastern Mediterranean Economies and the Path to the Energy Transition. April 2025. Available online: https://emgf.org/assets/Docs/IGU_EMGF_Report_A4_SinglePages_PROD.pdf (accessed on 9 September 2025).
- Erdogdu, E. Natural gas demand in Turkey. Appl. Energy 2010, 87, 211–219. [Google Scholar] [CrossRef]
- Wang, J.; Feng, L.; Zhao, L.; Snowden, S.; Wang, X. A comparison of two typical multicyclic models used to forecast the world’s conventional oil production. Energy Policy 2011, 39, 7616–7621. [Google Scholar] [CrossRef]
- Wang, J.; Feng, L. Curve-fitting models for fossil fuel production forecasting: Key influence factors. J. Nat. Gas Sci. Eng. 2016, 32, 138–149. [Google Scholar] [CrossRef]
- Wang, J.; Bentley, Y. Modelling world natural gas production. Energy Rep. 2020, 6, 1363–1372. [Google Scholar] [CrossRef]
- Ediger, V.S.; Berk, I. Future availability of natural gas: Can it support sustainable energy transition? Resour. Policy 2023, 85, 103824. [Google Scholar] [CrossRef]
- BP Energy Outlook 2023. Available online: https://www.bp.com/content/dam/bp/business-sites/en/global/corporate/pdfs/energy-economics/energy-outlook/bp-energy-outlook-2023.pdf (accessed on 9 September 2025).
- GASVESSEL. Natural Gas vs. Coal—A Positive Impact on the Environment. 2025. Available online: https://www.gasvessel.eu/news/natural-gas-vs-coal-impact-on-the-environment (accessed on 9 September 2025).
- BP Statistical Review of World Energy 2022. Available online: https://www.bp.com/content/dam/bp/business-sites/en/global/corporate/pdfs/energy-economics/statistical-review/bp-stats-review-2022-full-report.pdf (accessed on 9 September 2025).
- BP Energy Outlook 2024. Available online: https://www.bp.com/content/dam/bp/business-sites/en/global/corporate/pdfs/energy-economics/energy-outlook/bp-energy-outlook-2024.pdf (accessed on 9 September 2025).
- International Energy Agency (IEA). Global Energy Review 2025. Available online: https://www.iea.org/reports/global-energy-review-2025 (accessed on 9 September 2025).
- Zhao, S.; Lu, J.; Yan, J.; Wu, H.; Guan, C. Energy transition in china: It is necessary to increase natural gas utilization. Energy Rep. 2023, 10, 2439–2447. [Google Scholar] [CrossRef]
- Huang, R.; Zhang, S.; Wang, P. Key areas and pathways for carbon emissions reduction in Beijing for the “dual carbon” targets. Energy Policy 2022, 164, 112873. [Google Scholar] [CrossRef]
- International Energy Agency. United States: Natural Gas. 2025. Available online: https://www.iea.org/countries/united-states/natural-gas (accessed on 9 September 2025).
- International Energy Agency. Canada: Natural Gas. 2025. Available online: https://www.iea.org/countries/canada/natural-gas (accessed on 9 September 2025).
- Himona, E.; Poullikkas, A. Comparative Review of Natural Gas Vehicles During the Energy Transition. Energies 2025, 18, 3512. [Google Scholar] [CrossRef]
- European Environment Agency. Greenhouse Gas Emissions from Transport. October 2024. Available online: https://www.eea.europa.eu/en/analysis/indicators/greenhouse-gas-emissions-from-transport (accessed on 9 September 2025).
- European Parliament. CO2 Emissions from Cars: Facts and Figures (Infographics). December 2024. Available online: https://www.europarl.europa.eu/topics/en/article/20190313STO31218/co2-emissions-from-cars-facts-and-figures-infographics (accessed on 9 September 2025).
- Poullikkas, A. Sustainable options for electric vehicle technologies. Renew. Sustain. Energy Rev. 2015, 41, 1277–1287. [Google Scholar] [CrossRef]
- Mohr, S.; Evans, G. Long term forecasting of natural gas production. Energy Policy 2011, 39, 5550–5560. [Google Scholar] [CrossRef]
- Ji, Q.; Fan, Y.; Troilo, M.; Ripple, R.D.; Feng, L. China’s natural gas demand projections and supply capacity analysis in 2030. Energy J. 2018, 39, 53–70. [Google Scholar] [CrossRef]
- Malzi, J. Economic, environment and demographic elasticities of natural gas demand: A review. RevistaMultidisciplinar 2024, 6, e202417. [Google Scholar] [CrossRef]
- Mohammed, H.; Okalla, C.E. Modelling Annual Natural Gas Demand Forecasting Using Non-Linear Autoregressive with Exogenous Input (NARX) Neural Networks. Improv. Oil Gas Recovery 2024, 8, 1–16. [Google Scholar]
- International Energy Agency. World Energy Outlook 2023. Available online: https://www.iea.org/reports/world-energy-outlook-2023 (accessed on 9 September 2025).
- International Energy Agency. Global Hydrogen Review 2024. Available online: https://www.iea.org/reports/global-hydrogen-review-2024 (accessed on 9 September 2025).
- Makarov, A.A.; Makarov, A.A. Laws of power industry development: Elusory essence. Therm. Eng. 2010, 57, 1085–1092. [Google Scholar] [CrossRef]
- Mac Kinnon, M.A.; Brouwer, J.; Samuelsen, S. The role of natural gas and its infrastructure in mitigating greenhouse gas emissions, improving regional air quality, and renewable resource integration. Prog. Energy Combust. Sci. 2018, 64, 62–92. [Google Scholar] [CrossRef]
- Mohammad, N.; Ishak, W.W.M.; Mustapa, S.I.; Ayodele, B.V. Natural gas as a key alternative energy source in sustainable renewable energy transition: A mini review. Front. Energy Res. 2021, 9, 625023. [Google Scholar] [CrossRef]
- Gonzalez-Salazar, M.A.; Kirsten, T.; Prchlik, L. Review of the operational flexibility and emissions of gas- and coal-fired power plants in a future with growing renewables. Renew. Sustain. Energy Rev. 2018, 82, 1497–1513. [Google Scholar] [CrossRef]
- Huang, Y.W.; Kittner, N.; Kammen, D.M. ASEAN grid flexibility: Preparedness for grid integration of renewable energy. Energy Policy 2019, 128, 711–726. [Google Scholar] [CrossRef]
- Union of Concerned Scientists. Massachusetts’s Electricity Future: Reducing Reliance on Natural Gas through Renewable Energy. April 2016. Available online: https://www.ucs.org/resources/massachusettss-electricity-future (accessed on 9 September 2025).
- Kühn, M.; Streibel, M.; Nakaten, N.; Kempka, T. Integrated Underground Gas Storage of CO2 and CH4 to Decarbonise the “Power-to-gas-to-gas-to-power” Technology. Energy Procedia 2014, 59, 9–15. [Google Scholar] [CrossRef]
- Heras, J.; Martín, M. Multiscale analysis for power-to-gas-to-power facilities based on energy storage. Comput. Chem. Eng. 2021, 114, 107147. [Google Scholar] [CrossRef]
- Li, J.; Li, G.; Ma, S.; Liang, Z.; Li, Y.; Zeng, W. Modeling and Simulation of Hydrogen Energy Storage System for Power-to-gas and Gas-to-power Systems. J. Mod. Power Syst. Clean Energy 2023, 11, 885–895. [Google Scholar] [CrossRef]
- Wang, L.; Alirahmi, S.M.; Yu, H. Development and analysis of a novel power-to-gas-to-power system driven by the allam cycle for simultaneous electricity and water production. Energy Convers. Manag. 2024, 319, 118934. [Google Scholar] [CrossRef]
- Wulf, C.; Linßen, J.; Zapp, P. Review of Power-to-Gas Projects in Europe. Energy Procedia 2018, 155, 367–378. [Google Scholar] [CrossRef]
- Sterner, M.; Specht, M. Power-to-Gas and Power-to-X—The History and Results of Developing a New Storage Concept. Energies 2021, 14, 6594. [Google Scholar] [CrossRef]
- Liang, T.; Chai, L.; Tan, J.; Jing, Y.; Lv, L. Dynamic optimization of an integrated energy system with carbon capture and power-to-gas interconnection: A deep reinforcement learning-based scheduling strategy. Appl. Energy 2024, 367, 123390. [Google Scholar] [CrossRef]
- Portillo-Tarragona, P.; Llera-Sastresa, E.; Scarpellini, S.; Benito-Bentué, D. A case study of financing zero-emission power-to-gas technologies in Spain. Util. Policy 2025, 95, 101965. [Google Scholar] [CrossRef]
- Koutalidis, H.; Pelekis, S.; Skepetari, E.; Ntanos, C.; Karakolis, E.; Michalitsi-Psarrou, A.; Blika, A.; Askounis, D. Renewable hydrogen blending into urban natural gas grids with power-to-gas: A techno-economic assessment for Greece. Int. J. Hydrogen Energy 2025, 139, 380–395. [Google Scholar] [CrossRef]
- Zou, S.; Zong, X.; Chen, Q.; Zhang, W.; Zhou, H. Optimization Scheduling of Integrated Energy Systems Considering Power Flow Constraints. Energies 2025, 18, 2442. [Google Scholar] [CrossRef]
- Li, R.; Su, M. The Role of Natural Gas and Renewable Energy in Curbing Carbon Emission: Case Study of the United States. Sustainability 2017, 9, 600. [Google Scholar] [CrossRef]
- Howarth, R.W.; Santoro, R.; Ingraffea, A. Methane and the greenhouse-gas footprint of natural gas from shale formations. Clim. Chang. 2011, 106, 679–690. [Google Scholar] [CrossRef]
- Zhang, X.; Myhrvold, N.P.; Hausfather, Z.; Caldeira, K. Climate benefits of natural gas as a bridge fuel and potential delay of near-zero energy systems. Appl. Energy 2016, 167, 317–322. [Google Scholar] [CrossRef]
- Nandakumar, N.; Annaswamy, A.M. Impact of increased renewables on natural gas markets in eastern United States. J. Mod. Power Syst. Clean Energy 2017, 5, 424–438. [Google Scholar] [CrossRef]
- ISO New England Inc. New England 2030 Power System Study. February 2010. Available online: https://www.iso-ne.com/static-assets/documents/committees/comm_wkgrps/prtcpnts_comm/pac/reports/2010/economicstudyreportfinal_022610.pdf (accessed on 9 September 2025).
- Adebayo, T.S.; Alola, A.A. Drivers of natural gas and renewable energy utilization in the USA: How about household energy efficiency-energy expenditure and retail electricity prices? Energy 2023, 283, 129022. [Google Scholar] [CrossRef]
- Cronshaw, I. World Energy Outlook 2014 projections to 2040: Natural gas and coal trade, and the role of China. Aust. J. Agric. Resour. Econ. 2015, 59, 571–585. [Google Scholar] [CrossRef]
- Khan, M.N.; Cloete, S.; Amini, S. Efficient Production of Clean Power and Hydrogen Through Synergistic Integration of Chemical Looping Combustion and Reforming. Energies 2020, 13, 3443. [Google Scholar] [CrossRef]
- Nikolaidis, P.; Poullikkas, A. A comparative overview of hydrogen production processes. Renew. Sustain. Energy Rev. 2017, 67, 597–611. [Google Scholar] [CrossRef]
- Ghoneim, S.; El-Salamony, R.; El-Temtamy, S. Review on Innovative Catalytic Reforming of Natural Gas to Syngas. World J. Eng. Technol. 2016, 4, 116–139. [Google Scholar] [CrossRef]
- Boretti, A.; Banik, B.K. Advances in Hydrogen Production from Natural Gas Reforming. Adv. Energy Sustain. Res. 2021, 2, 2100097. [Google Scholar] [CrossRef]
- Thomas, C.A.; Carmody, W.H. Synthetic Resins from Petroleum Hydrocarbons. Ind. Eng. Chem. 1932, 24, 1125–1128. [Google Scholar] [CrossRef]
- Moghaddam, A.L.; Hejazi, S.; Fattahi, M.; Kibria, M.G.; Thomson, M.J.; AlEisa, R.; Khan, M.A. Methane pyrolysis for hydrogen production: Navigating the path to a net zero future. Energy Environ. Sci. 2025, 18, 2747–2790. [Google Scholar] [CrossRef]
- Kadam, R.S.; Sutar, P.R.; Yadav, G.D. Energy and environmental assessment of industrial-scale hydrogen production: Comparison of steam methane reforming, electrolysis, and Cu–Cl cycles. Int. J. Hydrogen Energy 2025, 106, 994–1005. [Google Scholar] [CrossRef]
- The Hydrogen Newsletter. GH2 Facts. 2024. Available online: https://www.hydrogennewsletter.com/gh2-facts/ (accessed on 13 June 2025).
- The Hydrogen Newsletter. How Much CO2 is Produced from Steam Methane Reforming? 2024. Available online: https://www.hydrogennewsletter.com/how-much-co2-is-produced-from-steam-methane-reforming/ (accessed on 13 June 2025).
- Pimpale, S. Hydrogen Production Methods: Carbon Emission Comparison and Future Advancements. Int. J. Sci. Res. Eng. Manag. 2023, 7, 1–7. [Google Scholar] [CrossRef]
- Mullen, D.; Herraiz, L.; Gibbins, J.; Lucquiaud, M. On the cost of zero carbon hydrogen: A techno-economic analysis of steam methane reforming with carbon capture and storage. Int. J. Greenh. Gas Control. 2023, 126, 103904. [Google Scholar] [CrossRef]
- Su, B.; Wang, Y.; Xu, Z.; Han, W.; Jin, H.; Wang, H. Novel ways for hydrogen production based on methane steam and dry reforming integrated with carbon capture. Energy Convers. Manag. 2022, 270, 116199. [Google Scholar] [CrossRef]
- Khan, M.H.A.; Daiyan, R.; Neal, P.; Haque, N.; MacGill, I.; Amal, R. A framework for assessing economics of blue hydrogen production from steam methane reforming using carbon capture storage & utilisation. Int. J. Hydrogen Energy 2021, 46, 22685–22706. [Google Scholar]
- Sharma, I.; Friedrich, D.; Golden, T.; Brandani, S. Exploring the opportunities for carbon capture in modular, small-scale steam methane reforming: An energetic perspective. Int. J. Hydrogen Energy 2019, 44, 14732–14743. [Google Scholar] [CrossRef]
- Soltani, R.; Rosen, M.A.; Dincer, I. Assessment of CO2 capture options from various points in steam methane reforming for hydrogen production. Int. J. Hydrogen Energy 2014, 39, 20266–20275. [Google Scholar] [CrossRef]
- Roy, R.; Antonini, G.; Hayibo, K.S.; Rahman, M.M.; Khan, S.; Tian, W.; Boutilier, M.S.H.; Zhang, W.; Zheng, Y.; Bassi, A.; et al. Comparative techno-environmental analysis of grey, blue, green/yellow and pale-blue hydrogen production. Int. J. Hydrogen Energy 2025, 116, 200–210. [Google Scholar] [CrossRef]
- Alvarez, R.A.; Pacala, S.W.; Winebrake, J.J.; Chameides, W.L.; Hamburg, S.P. Greater focus needed on methane leakage from natural gas infrastructure. Proc. Natl. Acad. Sci. USA 2012, 109, 6435–6440. [Google Scholar] [CrossRef] [PubMed]
- Howarth, R.W. A bridge to nowhere: Methane emissions and the greenhouse gas footprint of natural gas. Energy Sci. Eng. 2014, 2, 47–60. [Google Scholar] [CrossRef]
- Howarth, R.W.; Jacobson, M.Z. How green is blue hydrogen? Energy Sci. Eng. 2021, 9, 1676–1687. [Google Scholar] [CrossRef]
- Garcia, G.M.; Oliva, H.S. Technical, economic, and CO2 emissions assessment of green hydrogen production from solar/wind energy: The case of Chile. Energy 2023, 278, 127981. [Google Scholar] [CrossRef]
- Darko, E. Short Guide Summarising the Oil and Gas Industry Lifecycle for a Non-Technical Audience; EPS-PEAKS Guide. October 2014; Overseas Development Institute (ODI): London, UK, 2014. [Google Scholar]
- BP Statistical Review of World Energy (2004 Data). 2024. Available online: http://mazamascience.com/OilExport/BP_2004.xls (accessed on 9 September 2025).
- BP Statistical Review of World Energy 2015. 2015. Available online: https://www.bp.com/en/global/corporate/energy-economics/webcast-and-on-demand.html (accessed on 9 September 2025).
- BP Statistical Review of World Energy 2018. 2018. Available online: https://www.bp.com/content/dam/bp/business-sites/en/global/corporate/pdfs/energy-economics/statistical-review/bp-stats-review-2018-full-report.pdf (accessed on 9 September 2025).
- Energy Institute. KPMG and Kearney. Statistical Review of World Energy 2024, 73rd ed.; Energy Institute: London, UK, 2024; Available online: https://www.energyinst.org/statistical-review (accessed on 9 September 2025).
- Zhang, N.; Wang, J.; Xue, M.; Wang, Q.; Wu, Y.; Cao, Q.; Sun, P. Research on the security of natural gas supply and demand in China under the dual carbon target. Sci. Prog. 2024, 107. [Google Scholar] [CrossRef]
- Xie, M.; Wei, X.; Chen, C.; Sun, C. China’s natural gas production peak and energy return on investment (EROI): From the perspective of energy security. Energy Policy 2022, 164, 112913. [Google Scholar] [CrossRef]
- Lao, T.; Sun, Y. Predicting the production and consumption of natural gas in China by using a new grey forecasting method. Math. Comput. Simul. 2022, 202, 295–315. [Google Scholar] [CrossRef]
- Li, L. Development of natural gas industry in China: Review and prospect. Nat. Gas Ind. 2022, 9, 187–196. [Google Scholar] [CrossRef]
- Chengzao, J.; Yongfeng, Z.; Xia, Z. Prospects of and challenges to natural gas industry development in China. Nat. Gas Ind. 2014, 1, 1–13. [Google Scholar] [CrossRef]
- Li, J.; She, Y.; Gao, Y.; Li, M.; Yang, G.; Shi, Y. Natural gas industry in china: Development situation and prospect. Nat. Gas Ind. 2020, 7, 604–613. [Google Scholar] [CrossRef]
- Zou, C.; Lin, M.; Ma, F.; Liu, H.; Yang, Z.; Zhang, G.; Yang, Y.; Guan, C.; Liang, Y.; Wang, Y.; et al. Development, challenges and strategies of natural gas industry under carbon neutral target in China. Pet. Explor. Dev. 2024, 51, 476–497. [Google Scholar] [CrossRef]
- U.S. Energy Information Administration. Eastern Mediterranean Analysis. November 2022. Available online: https://www.eia.gov/international/analysis/regions-of-interest/Eastern_Mediterranean (accessed on 9 September 2025).
- Onyango, D. EastMed Gas Pipeline Project Timeline Uncertain as Stakeholders Review Feasibility. April 2024. Available online: https://www.pipeline-journal.net/news/eastmed-gas-pipeline-project-timeline-uncertain-stakeholders-review-feasibility (accessed on 9 September 2025).
- TotalEnergies. TotalEnergies and ENI sign an agreement with Cyprus and Egypt for the export of Cyprus Block 6 gas through Egypt. February 2025. Available online: https://totalenergies.com/news/press-releases/totalenergies-and-eni-sign-agreement-cyprus-and-egypt-export-cyprus-block-6-gas (accessed on 9 September 2025).
- Sorrell, S.; Miller, R.; Bentley, R.; Speirs, J. Oil futures: A comparison of global supply forecasts. Energy Policy 2010, 38, 4990–5003. [Google Scholar] [CrossRef]
- Middle East Economic Survey (MEES). Cyprus Gas Ambitions: From Dreams to Reality in 2023. January 2023. Available online: https://www.mees.com/2023/1/27/oil-gas/cyprus-gas-ambitions-from-dreams-to-reality-in-2023/f0154a20-9e43-11ed-b50a-fbcb54be70bc (accessed on 9 September 2025).
- Charalambous, A. USA: Cyprus has right to develop resources within its EEZ, Cronos-1 discovery welcomed. August 2022. Available online: https://in-cyprus.philenews.com/local/us-welcome-significant-gas-discovery-at-crono-1-well-offshore-cyprus/ (accessed on 9 September 2025).
- Global Energy Monitor. Main Page. 2025. Available online: https://www.gem.wiki/Main_Page (accessed on 9 September 2025).
- Offshore Technology. Egypt Natural Gas Production: Data and Insights. July 2024. Available online: https://www.offshore-technology.com/data-insights/egypt-natural-gas-production/ (accessed on 9 September 2025).
- Phileleftheros. East Mediterranean: $500 Billion Gas for EU. July 2024. Available online: https://www.philenews.com/oikonomia/kosmos-ikonomia/article/1607089/anatoliki-mesogios-aerio-500-dis-dol-gia-ee/ (accessed on 9 September 2025).
- Nakhle, C. Israel’s Gas Exports in Times of War. November 2023. Available online: https://www.gisreportsonline.com/r/israeli-gas-exports/ (accessed on 9 September 2025).
- European Commission. Renewable Energy Targets. October 2023. Available online: https://energy.ec.europa.eu/topics/renewable-energy/renewable-energy-directive-targets-and-rules/renewable-energy-targets_en#the-2030-targets (accessed on 9 September 2025).
- Eurostat. Electricity from Renewable Sources Reaches 47% in 2024. March 2025. Available online: https://ec.europa.eu/eurostat/web/products-eurostat-news/w/ddn-20250319-1 (accessed on 9 September 2025).
- Espitalier-Noël, M.; Fonseca, J.; Fraile, D.; Muron, M.; Pawelec, G.; Santos, S.; Staudenmaye, O. Clean Hydrogen Monitor. 2024. Available online: https://hydrogeneurope.eu/wp-content/uploads/2024/11/Clean_Hydrogen_Monitor_11-2024_V2_DIGITAL_draft3-1.pdf (accessed on 9 September 2025).
- Carbon Solutions. CalculatorTALxAbout. Available online: https://www.carbonsolutions.com/clients/CalculatorTALxAbout.html (accessed on 13 June 2025).
- U.S. Environmental Protection Agency (EPA). Greenhouse Gas Emission Factors Hub. March 2023. Available online: https://www.epa.gov/climateleadership/ghg-emission-factors-hub (accessed on 12 October 2025).
- U.S. Energy Information Administration (EIA). CO2 Emissions: Volume and Mass. Available online: https://www.eia.gov/environment/emissions/co2_vol_mass.php (accessed on 12 October 2025).
- International Energy Agency (IEA). World Energy Outlook 2019. IEA, 2019. Available online: https://www.iea.org/reports/world-energy-outlook-2019 (accessed on 13 June 2025).
- Jean, E. Carbon Taxes in Europe, 2024. Tax Foundation, 2024. Available online: https://taxfoundation.org/data/all/eu/carbon-taxes-europe-2024/ (accessed on 13 June 2025).
- Al-Qadri, A.A.; Ahmed, U.; Jameel, A.G.A.; Zahid, U.; Usman, M.; Ahmad, N. Simulation and Modelling of Hydrogen Production from Waste Plastics: Technoeconomic Analysis. Polymers 2022, 14, 2056. [Google Scholar] [CrossRef]
- Al-Qadri, A.A.; Ahmed, U.; Ahmad, N.; Jameel, A.G.A.; Zahid, U.; Naqvi, S.R. A review of hydrogen generation through gasification and pyrolysis of waste plastic and tires: Opportunities and challenges. Int. J. Hydrogen Energy 2024, 77, 1185–1204. [Google Scholar] [CrossRef]
- Ahmed, U. Techno-economic analysis of dual methanol and hydrogen production using energy mix systems with CO2 capture. Energy Convers. Manag. 2021, 228, 113663. [Google Scholar] [CrossRef]
- Ahmed, U.; Zahid, U.; Onaizi, S.A.; Jameel, A.G.A.; Ahmad, N.; Ahmad, N.; AlMohamadi, H. Co-production of hydrogen and methanol using fuel mix systems: Technical and economic assessment. Appl. Sci. 2021, 11, 6577. [Google Scholar] [CrossRef]
- Ahmed, U.; Hussain, M.A.; Bilal, M.; Zeb, H.; Ahmad, N.; Ahmad, N.; Usman, M. Production of hydrogen from low rank coal using process integration framework between syngas production processes: Techno-economic analysis. Chem. Eng. Process. Process. Intensif. 2021, 169, 108639. [Google Scholar] [CrossRef]
- European Clean Hydrogen Alliance. Cost of Hydrogen Production. 2023. Available online: https://observatory.clean-hydrogen.europa.eu/hydrogen-landscape/production-trade-and-cost/cost-hydrogen-production (accessed on 13 June 2025).
- Stargate Hydrogen. What is Grey Hydrogen? Production Method, Carbon Footprint and More. 2024. Available online: https://stargatehydrogen.com/blog/grey-hydrogen/ (accessed on 13 June 2025).
- Trading Economics. Natural Gas. Available online: https://tradingeconomics.com/commodity/natural-gas (accessed on 13 June 2025).
- U.S. Energy Information Administration (EIA). Henry Hub Natural Gas Spot Price. 2025. Available online: https://www.eia.gov/dnav/ng/ng_pri_sum_dcu_nus_m.htm (accessed on 13 June 2025).
- H2IQ. How Much Does Hydrogen Cost? 2024. Available online: https://h2iq.org/how-much-does-hydrogen-cost/ (accessed on 13 June 2025).
- CEIC Data. Israel Natural Gas: Consumption. 2024. Available online: https://www.ceicdata.com/en/indicator/israel/natural-gas-consumption (accessed on 5 August 2025).
- Enerdata. Egypt Energy Information. 2024. Available online: https://www.enerdata.net/estore/energy-market/egypt/ (accessed on 5 August 2025).
- Enerdata. Israel Energy Information. 2025. Available online: https://www.enerdata.net/estore/energy-market/israel/ (accessed on 5 August 2025).
- Enerdata. Israel’s Gas Exports to Egypt and Jordan Increased by over 13% in 2024. 2025. Available online: https://www.enerdata.net/publications/daily-energy-news/israels-gas-exports-egypt-and-jordan-increased-over-13-2024.html (accessed on 5 August 2025).
- Anand, C.; Chandraja, B.; Nithiya, P.; Akshaya, M.; Tamizhdurai, P.; Shoba, G.; Subramani, A.; Kumaran, R.; Yadav, K.K.; Gacem, A.; et al. Green hydrogen for a sustainable future: A review of production methods, innovations, and applications. Int. J. Hydrogen Energy 2025, 111, 319–341. [Google Scholar] [CrossRef]
- Panchenko, V.; Daus, Y.; Kovalev, A.; Yudaev, I.; Litti, Y. Prospects for the production of green hydrogen: Review of countries with high potential. Int. J. Hydrogen Energy 2023, 48, 4551–4571. [Google Scholar] [CrossRef]
- Squadrito, G.; Maggio, G.; Nicita, A. The green hydrogen revolution. Renew. Energy 2023, 216, 119041. [Google Scholar] [CrossRef]
- Zhou, Y.; Li, R.; Lv, Z.; Liu, J.; Zhou, H.; Xu, C. Green hydrogen: A promising way to the carbon-free society. Chin. J. Chem. Eng. 2022, 43, 2–13. [Google Scholar] [CrossRef]
- Fernández-Arias, P.; Antón-Sancho, A.; Lampropoulos, G.; Vergara, D. Emerging trends and challenges in pink hydrogen research. Energies 2024, 17, 2291. [Google Scholar] [CrossRef]
- Incer-Valverde, J.; Korayem, A.; Tsatsaronis, G.; Morosuk, T. “Colors” of hydrogen: Definitions and carbon intensity. Energy Convers. Manag. 2023, 291, 117294. [Google Scholar] [CrossRef]
- Venizelou, V.; Poullikkas, A. Comprehensive overview of recent research and industrial advancements in nuclear hydrogen production. Energies 2024, 17, 2836. [Google Scholar] [CrossRef]
- Nevodini, D. The Role of Small Modular Reactors in Decarbonizing Hydrogen Production. Electro-Thermal integration and Economic Insights. Ph.D. Thesis, University of Padua, Padua, Italy, 2025. [Google Scholar]
- Tassone, F.; Lorenzi, S.; Ricotti, M.E.; Locatelli, G. The economics of hydrogen production: The case of a GEN-IV reactor coupled with a high-temperature electrolysis plant. Energy 2025, 335, 138222. [Google Scholar] [CrossRef]
Disclaimer/Publisher’s Note: The statements, opinions and data contained in all publications are solely those of the individual author(s) and contributor(s) and not of MDPI and/or the editor(s). MDPI and/or the editor(s) disclaim responsibility for any injury to people or property resulting from any ideas, methods, instructions or products referred to in the content. |
© 2025 by the authors. Licensee MDPI, Basel, Switzerland. This article is an open access article distributed under the terms and conditions of the Creative Commons Attribution (CC BY) license (https://creativecommons.org/licenses/by/4.0/).