Article

Opportunities and Challenges in Reducing the Complexity of the Fischer–Tropsch Gas Loop of Smaller-Scale Facilities for the Production of Renewable Hydrocarbons

1
BEST—Bioenergy and Sustainable Technologies GmbH, Inffeldgasse 21b, 8010 Graz, Austria
2
Institute of Chemical, Environmental & Biological Engineering, TU Wien, Getreidemarkt 9/166, 1060 Vienna, Austria
3
Aichernig Engineering GmbH, Löwengasse 19/1/17, 1030 Vienna, Austria
4
Engler-Bunte-Institute, Karlsruhe Institute of Technology (KIT), Engler-Bunte-Ring 1, 76131 Karlsruhe, Germany
*
Author to whom correspondence should be addressed.
Energies 2025, 18(20), 5479; https://doi.org/10.3390/en18205479
Submission received: 7 August 2025 / Revised: 10 October 2025 / Accepted: 11 October 2025 / Published: 17 October 2025

Abstract

When renewable resources such as biomass, waste, or carbon dioxide together with renewable electrical energy are used, Fischer–Tropsch (FT) synthesis is a promising option for the sustainable production of fuels and petrochemicals conventionally derived from crude oil. As such renewable resources generally do not occur in large point sources like fossil fuels, future sustainable FT facilities will likely be substantially smaller in scale than their fossil counterparts, which will have a significant impact on their design. A core topic in the reimagination of such smaller-scale facilities will be the reduction in complexity of the FT gas loop. To this end, three simple gas loop designs for the conversion of syngas from biomass gasification were conceived, simulated in DWSIM, and compared regarding their performance. Concepts only employing an internal recycle were found to be inherently limited in terms of efficiency. To achieve high efficiencies, an external recycle with a tail gas reformer and high tail gas recycling ratios (>3) were required. Thereby, the carbon dioxide content of the syngas had a considerable influence on the required syngas H2/CO ratio, making the separation efficiency of the carbon dioxide removal unit a suitable control parameter in this respect.

1. Introduction

The unprecedented development that the global economy has undergone over the last century has largely been driven by the extensive use of fossil fuels [1]. This has, on the one hand, led to a strong dependence on these energy carriers and, on the other, to the emission of greenhouse gases, which have unequivocally caused global warming [2]. Both the dependence on fossil fuels as well as the associated greenhouse gas emissions are likely to continue into the future [3], although net-zero emissions will be required in order to limit global warming. This requires a variety of measures, but a phase-out of fossil fuels and a transformation of the energy system are ultimately inevitable [2,4,5].
As part of many Feeds-to-Liquids (XTL) processes, Fischer–Tropsch (FT) synthesis produces a crude-oil-like mixture of hydrocarbons (syncrude) from a variety of feedstocks. Depending on the feedstock that is being converted, the processes are categorized into Coal-to-Liquids (CTL), Gas-to-Liquids (GTL), Biomass-to-Liquids (BTL), Waste-to-Liquid (WTL), or Power-to-Liquid (PTL) [6,7]. FT synthesis (FTS) was initially developed for reasons of energy security to use coal and natural gas as cheap and accessible alternatives to oil [8,9,10,11]. However, in view of global warming, there is increasing interest in operating FTS with renewable feedstocks such as biomass or renewable electrical energy and carbon dioxide [12], as this allows to produce carbon-neutral commodities that are otherwise exclusively obtained from crude oil (e.g., transportation fuels and chemicals) [13].
In terms of road transport, biofuels are expected to increase in the short term, as they can be introduced gradually and used in existing infrastructure. Synthetic and biofuels are expected to play a key role in both the short and long term in shipping and aviation, which are among the hard-to-abate sectors [5,14]. The fact that a wide range of petrochemicals can be obtained from syncrude also predestines FTS for the defossilization of the petrochemical industry [13,15]. Hence, FTS is expected to play a key role in future refineries [16]. In the long term, however, biofuels are predicted to only play a subordinate role to electric vehicles, as those offer a higher decarbonization potential.
FTS is a well-established process for the conversion of coal and natural gas at an industrial scale [17]. When it comes to the conversion of renewable feedstocks, however, FT facilities are still scarce and have, up to now, only been employed at a demo scale. Thus, a large part of the relevant literature covers the design of CTL and GTL plants. Since coal and natural gas generally occur in large deposits, these plants can be built on a large scale (up to 140,000 bbl/d [18]) to benefit from the economy of scale [19]. Since renewable feedstock alternatives generally do not occur in comparably large point sources as fossil deposits, feedstock logistics will be a key factor in determining the maximum feasible size of future sustainable FT facilities. It is argued that future FT facilities using renewable feedstocks will be substantially smaller in scale than their fossil counterparts (<2500 bbl/d) and will follow a decentralized approach. The smaller scale imposes vastly different boundary conditions which will have a significant effect on the design. It is thus necessary to fundamentally rethink the design of such smaller systems [20,21].
Smaller-scale industrial facilities may seem like a contradiction at first, as they go against the long-standing convention of designing facilities as large as possible to leverage the economy of scale. However, although they cannot rely on the economy of scale, the smaller scale offers other advantages that could make them cost-competitive. Firstly, the smaller scale leads to lower overall capital costs and, thus, to a lower investment risk. On the one hand, this accelerates innovation and, on the other, removes barriers for new investors, which should result in more competition. Secondly, the use of a modular design for these small-scale facilities could reduce engineering and manufacturing costs through mass production [20]. Maitlis and De Klerk [20] have proposed several opportunities to improve the design of future FT facilities. One of the key proposals is to reduce the complexity of new designs, as fossil-based FT facilities typically exhibit a high degree of integration between the individual process steps, which is not justifiable at a smaller scale. Two areas where there is potential to reduce complexity are the FT gas loop and product refining. De Klerk [15] strongly advocates for the inclusion of a complete syncrude-to-product refinery to produce on-specification transportation fuels or petrochemicals, as this is the part of an XTL plant where the highest added value is achieved. However, he also acknowledges that this is not justifiable at a small scale and that smaller-scale facilities are likely to focus on liquid intermediates and blending materials [21].
This work will focus on the reduction in complexity of the FT gas loop. The term FT gas loop describes the configuration of unit operations around the FTS and is only really found in pertinent literature [15,17,22]. The so-called gas loop is located downstream of syngas production and upstream of product refining and, in its simplest form, consists only of the FTS itself and product recovery [15]. Depending on the fate of the unconverted syngas, referred to as tail gas, gas loops may be divided into open and closed loops [15,17,23]. In an open loop, syngas passes the FTS only once. Unconverted syngas is thus virtually lost for further conversion and is typically used as fuel gas. Since syngas is rather valuable, open loops can only be justified in rare cases (e.g., exceptionally high per-pass conversion or high inert content of the syngas) [15,23]. Hence, virtually all commercial FT facilities today feature a closed loop, in which the tail gas is partially recycled to increase the overall conversion.
Numerous studies have been conducted on the simulation of whole process chains using FTS, with a particular focus on the techno-economic aspect [24,25]. The fact that modifications in the gas loop design have a positive effect on the PtL efficiency has been recognized by Pratschner [26]. Still, a comparison of various closed-loop gas configurations with regard to process optimization of an FT facility is absent.
Figure 1 shows a block flow diagram of a generic closed gas loop, illustrating different possible configurations. However, the actual gas loop design employed in commercial facilities can be drastically different [15,17]. Closed gas loops are further divided depending on the kind of tail gas recycling (TGR). In an internal recycle, the tail gas is recycled directly after the product recovery, without altering its composition. If the recycle involves modifying the tail gas by means of separation or conversion, it is referred to as external recycle. Most commercial facilities use a combination of both internal and external recycle [15,17,23]. The second essential process step of a gas loop, apart from the FTS itself, is the product recovery. This is typically achieved by cooling the product stream and thereby condensing the syncrude [15]. Methane and C2 hydrocarbons are optionally recovered by means of cryogenic separation. This expands the product slate, but requires upstream acid gas removal (i.e., a Benfield unit), to prevent the formation of dry ice due to the low temperatures. The recovered methane is typically reformed either in a dedicated tail gas reformer or, in the case of GTL, in the main reformer. As the tail gas cannot be recycled indefinitely to extinction, a certain amount must be purged from the gas loop to prevent the accumulation of inerts. Before the gas is purged, it can optionally be subjected to pressure swing adsorption (PSA) to recover hydrogen [15,17,23].
Since the gas loop design depends on a variety of factors, including the means of syngas production, the FTS, and the product recovery, there is no universal configuration. Rather, the design needs to be tailored to the specific boundary conditions. The main objective of this work was, thus, to develop an appropriate gas loop design for sustainable smaller-scale FT facilities operated with syngas from dual fluidized bed (DFB) steam gasification of biomass to produce long-chain hydrocarbons (i.e., middle distillates and waxes) for use as fuels and chemicals. To further optimize the hydrocarbon product spectrum, a non-stoichiometric H2/CO feed ratio was deliberately considered in the simulation framework. In order to reduce the complexity compared to traditional configurations, the gas loop was reduced to its essential elements. Then, three simple gas loop designs with increasing complexity were conceived, modeled with process simulation, and compared regarding their performance. In this way, this work seeks to answer the following questions:
  • How do the gas loop designs compare in terms of carbon monoxide conversion and efficiency?
  • How much tail gas recycling is required to achieve an adequate efficiency?
  • What H2/CO ratio is required for the syngas to maintain a feed gas H2/CO ratio of 1.9?
  • What influence does the syngas carbon dioxide content have on the efficiency and the required syngas H2/CO ratio?

2. Materials and Methods

2.1. Gas Loop Designs

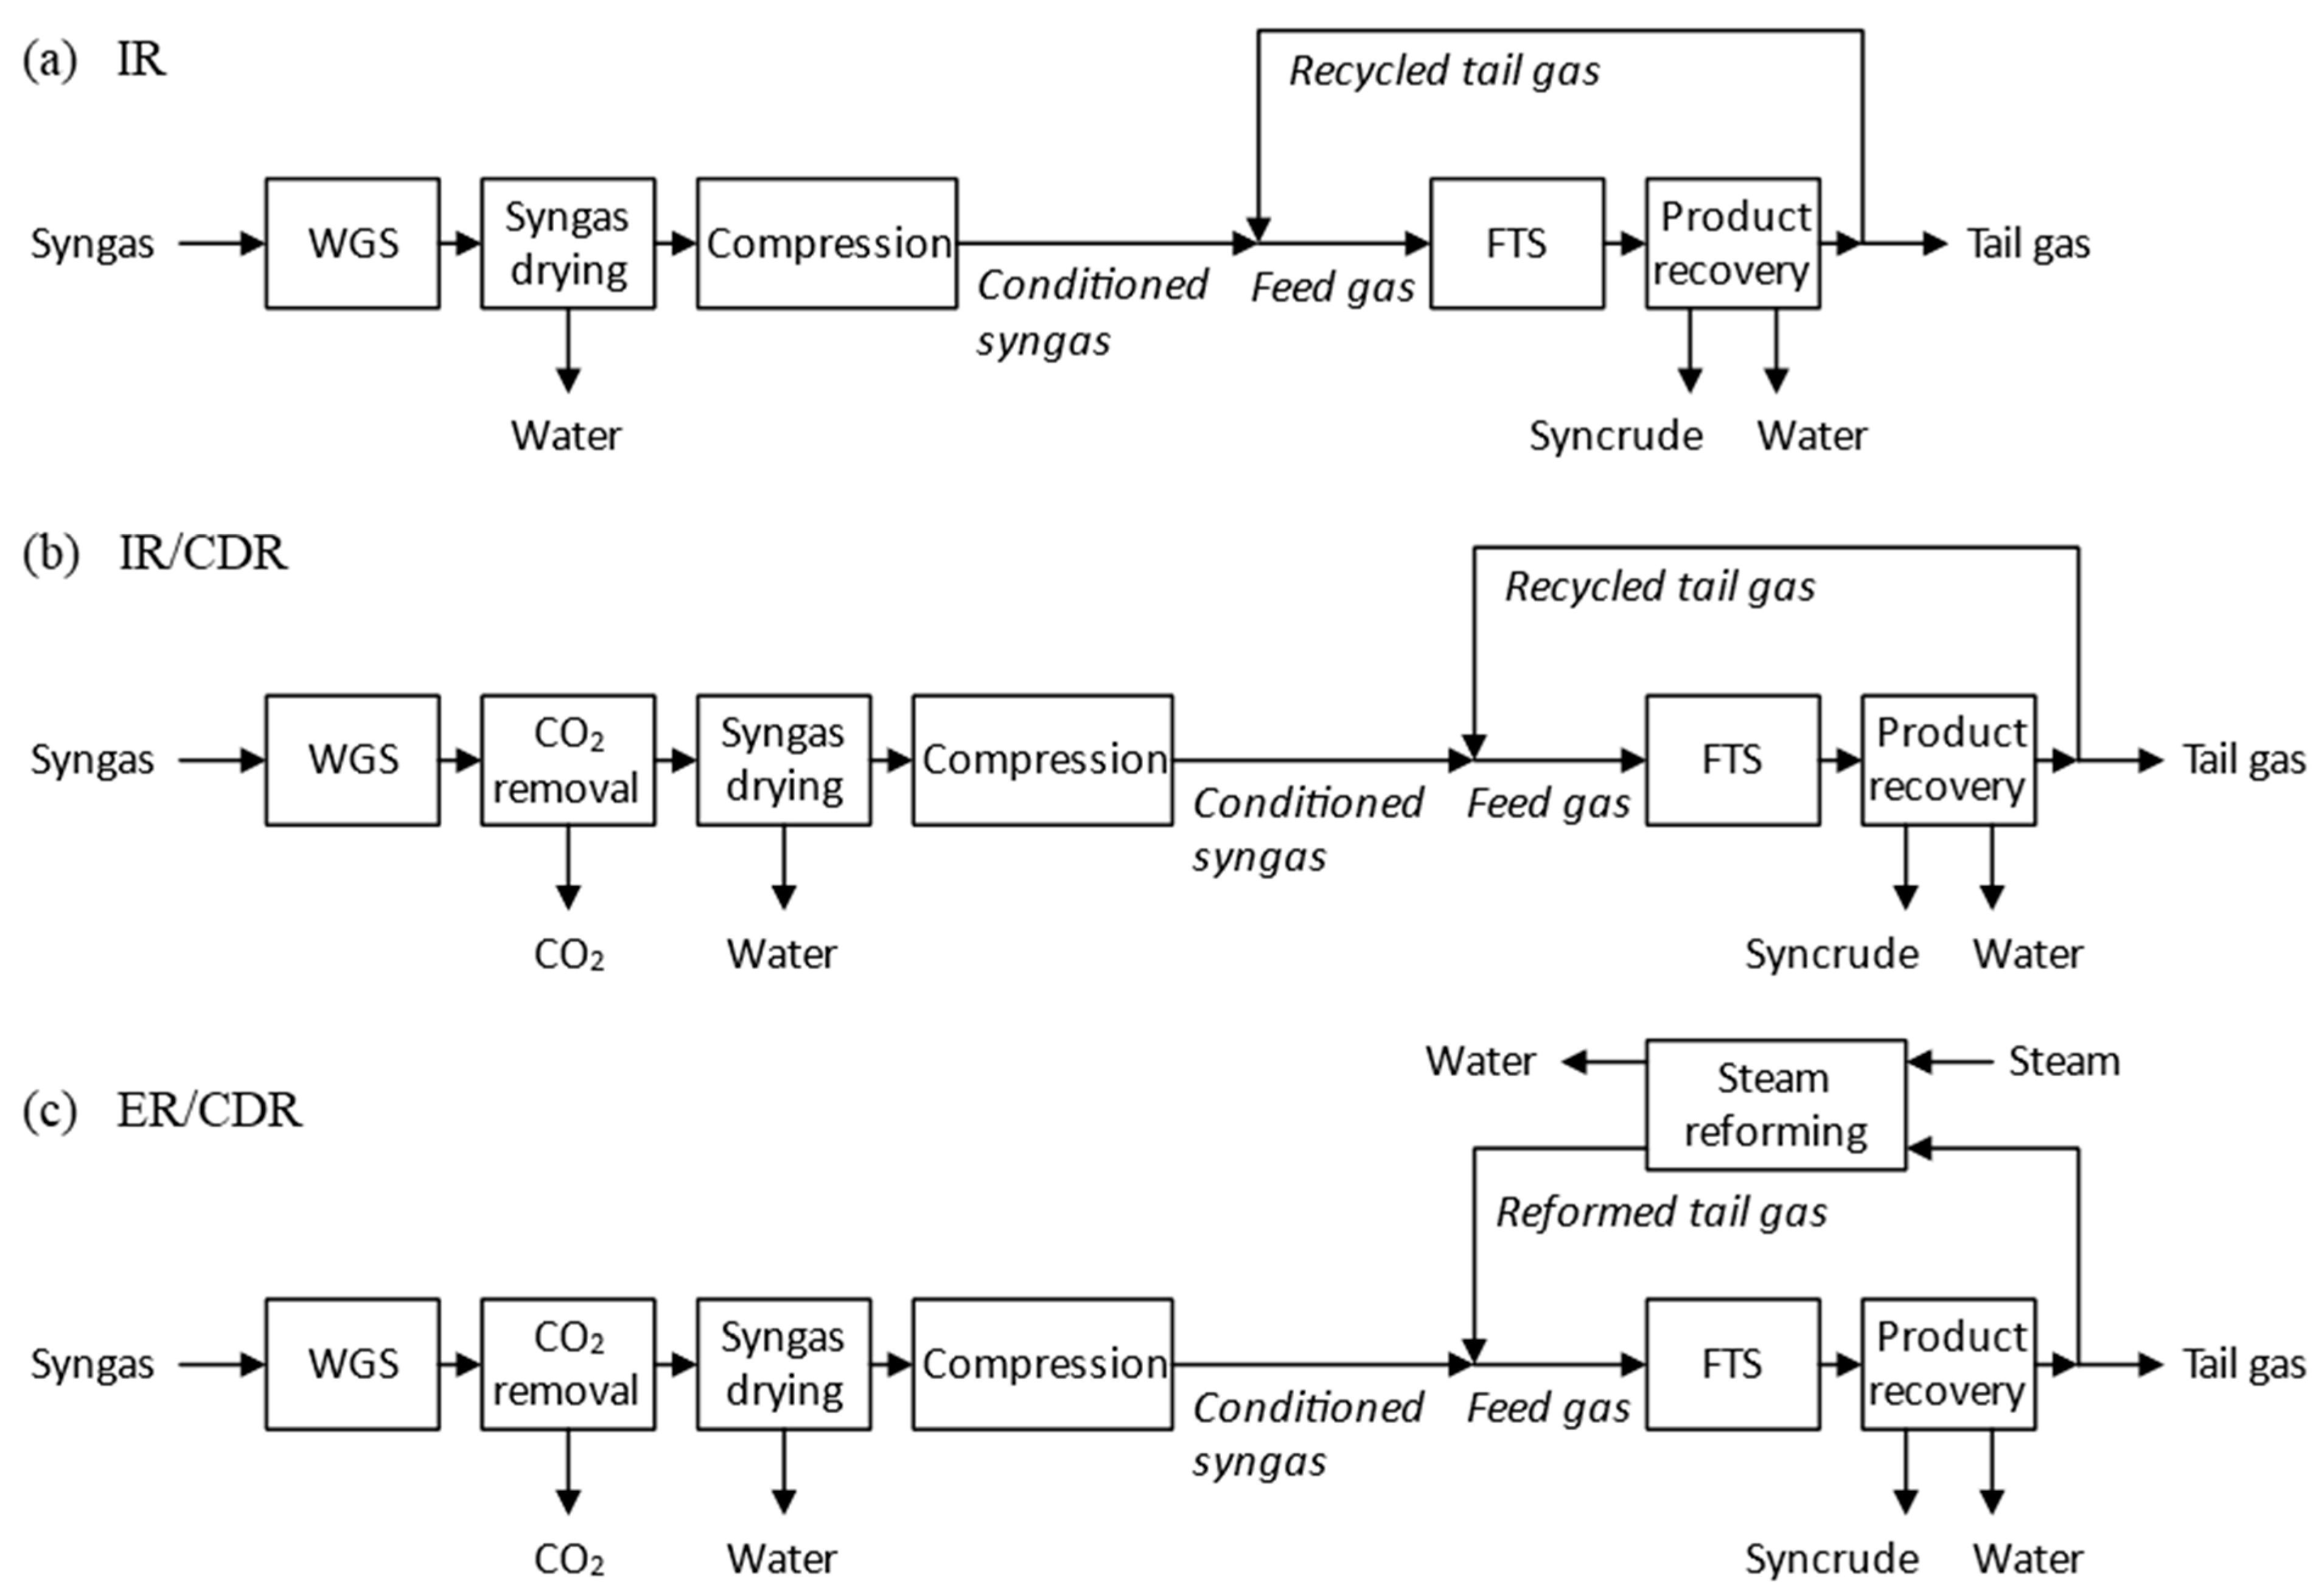
Starting from the most basic gas loop design, three different concepts of increasing complexity were conceived. Block flow diagrams of these designs are depicted in Figure 2. In its simplest form (Figure 2a), the gas loop is characterized by an internal recycle (IR) and is hereafter designated as IR. The syngas is first conditioned in a water–gas shift (WGS) unit, to adjust the syngas composition to the required H2/CO ratio. Next, the syngas is dried and compressed to operating pressure. The conditioned syngas is then mixed with recycled tail gas to provide the feed gas for the FTS. In the FTS, the feed gas is partially converted into hydrocarbons and product water. In the subsequent product recovery, syncrude and product water are separated from the tail gas. The remaining tail gas, which consists of unconverted syngas and non-condensable hydrocarbons, is partially recycled and mixed with fresh syngas. The other part of the syngas is discarded to purge inerts from the gas loop. The next more complex concept (Figure 2b) still employs an IR but also introduces upstream carbon dioxide removal (CDR) to the syngas conditioning section. Thus, this concept is henceforth referred to as IR/CDR. The most complex investigated concept (Figure 2c) employs an external recycle (ER) by introducing steam reforming into the TGR loop, while still employing upstream CDR. This concept is therefore hereafter referred to as ER/CDR. Additional steam is added upstream of the steam reformer, while the unconverted steam is condensed and withdrawn from the reformed tail gas downstream of the reformer.

2.2. Model Description

The three gas loops were modeled using the open-source process simulator DWSIM (Version 8.8.1). Nitrogen, hydrogen, water, carbon monoxide, carbon dioxide, and n-alkanes (methane to C29) were considered for the model, which are all included in the integrated compound library. Alkenes, oxygenates, and other side products were neglected. Equilibrium calculations were performed using the Peng–Robinson property package with default settings. Pressure losses were neglected across the entire gas loop.
As a means of syngas production, DFB steam gasification of woody biomass was assumed. The syngas composition that was used, shown in Table 1, was based on ranges given by Pfeifer et al. [28] with additional assumptions for ethane, nitrogen, and water. Impurities and possible catalyst poisons (i.e., sulfur) were assumed to be already removed upstream of the WGS unit and thus not considered in this model.
The WGS unit was modeled using an isothermal Gibbs reactor with hydrogen, water, carbon monoxide, and carbon dioxide considered as reactive species. No additional steam was added, the reactor was operated at atmospheric pressure and the operating temperature was controlled so that the WGS reaction (Equation (1)) would yield the required syngas H2/CO ratio to maintain a constant feed gas H2/CO ratio of 1.9.
C O + H 2 O C O 2 + H 2
CDR was implemented as a generic compound splitter for carbon dioxide with an assumed separation efficiency of 98%. Syngas drying was achieved through condensation in a heat exchanger and subsequent phase separation in a gas–liquid separator. Separation was performed in equilibrium at 10 °C and atmospheric pressure. Syngas compression was modelled in three stages with a series of compressors and heat exchangers for intermediate cooling. The syngas was pressurized to 3, 10, and 20 bar, respectively, while being cooled to 60 °C in the first and second stage. Subsequently, the conditioned syngas is mixed with recycled respectively reformed tail gas and preheated to 220 °C in a heat exchanger, which is a typical operating temperature for low-temperature FT.
The FTS was modeled as an isothermal conversion reactor considering both the FT reaction for alkanes (Equation (2)) and the WGS reaction (Equation (1)).
n   C O + 2 n + 1   H 2 C n H 2 n + 2 + n   H 2 O
The carbon number distribution of the FT product is calculated using the extended Anderson–Schulz–Flory (eASF) distribution proposed by Förtsch et al. [29]. The eASF distribution combines two independent distributions and introduces four additional parameters to account for known deviations from the ideal ASF distribution. Three different equations (Equations (3)–(5)) are used to calculate the molar fraction of methane x C 1 , ethane x C 2 , and C3+ alkanes x C 3 + , which use the two chain growth probabilities of the first and second distribution α   and α , the re-adsorption probability β , the enhancement factor γ , the molar fraction of the second distribution μ , and the carbon number n as parameters.
x C 1 = 1 μ · 1 α · 1 γ + μ · 1 α
x C 2 = 1 μ · 1 α · α · 1 β 1 β · 1 α · 1 γ + μ · 1 α · α
x C 3 + = 1 μ · 1 α · α n 1 · 1 γ 1 β · 1 α + μ · 1 α · α n 1
Since only alkanes up to C29 were considered in the model, the C29 molar fraction x C 29 was calculated as the remainder of the sum, according to the following equation.
x C 29 = 1 n = 1 28 x C n
The selectivity of the individual alkanes S C n was further calculated according to Equation (7) using the carbon number n, the molar fractions of alkanes x C n , and the carbon dioxide selectivity S C O 2 , which was defined as an input parameter.
S C n = n · x C n n = 1 29 n · x C n · 1 S C O 2
From this, the yields for the individual species Yi were then calculated using the per-pass carbon monoxide conversion XCO,per pass according to Equation (8).
Y i = X C O , p e r   p a s s · S i
The yields for the individual species were calculated in an embedded spreadsheet and then automatically exported to the reaction settings using a Python 3.12 script. All parameters used for these calculations are summarized in Table 2. They were selected to reflect the authors’ experience using commercially relevant cobalt-based catalysts in lab- and pilot-scale FT plants. Although the WGS activity of cobalt catalysts is typically negligible, it was still considered here because the formation of small amounts of carbon dioxide with cobalt catalysts was observed in the past.
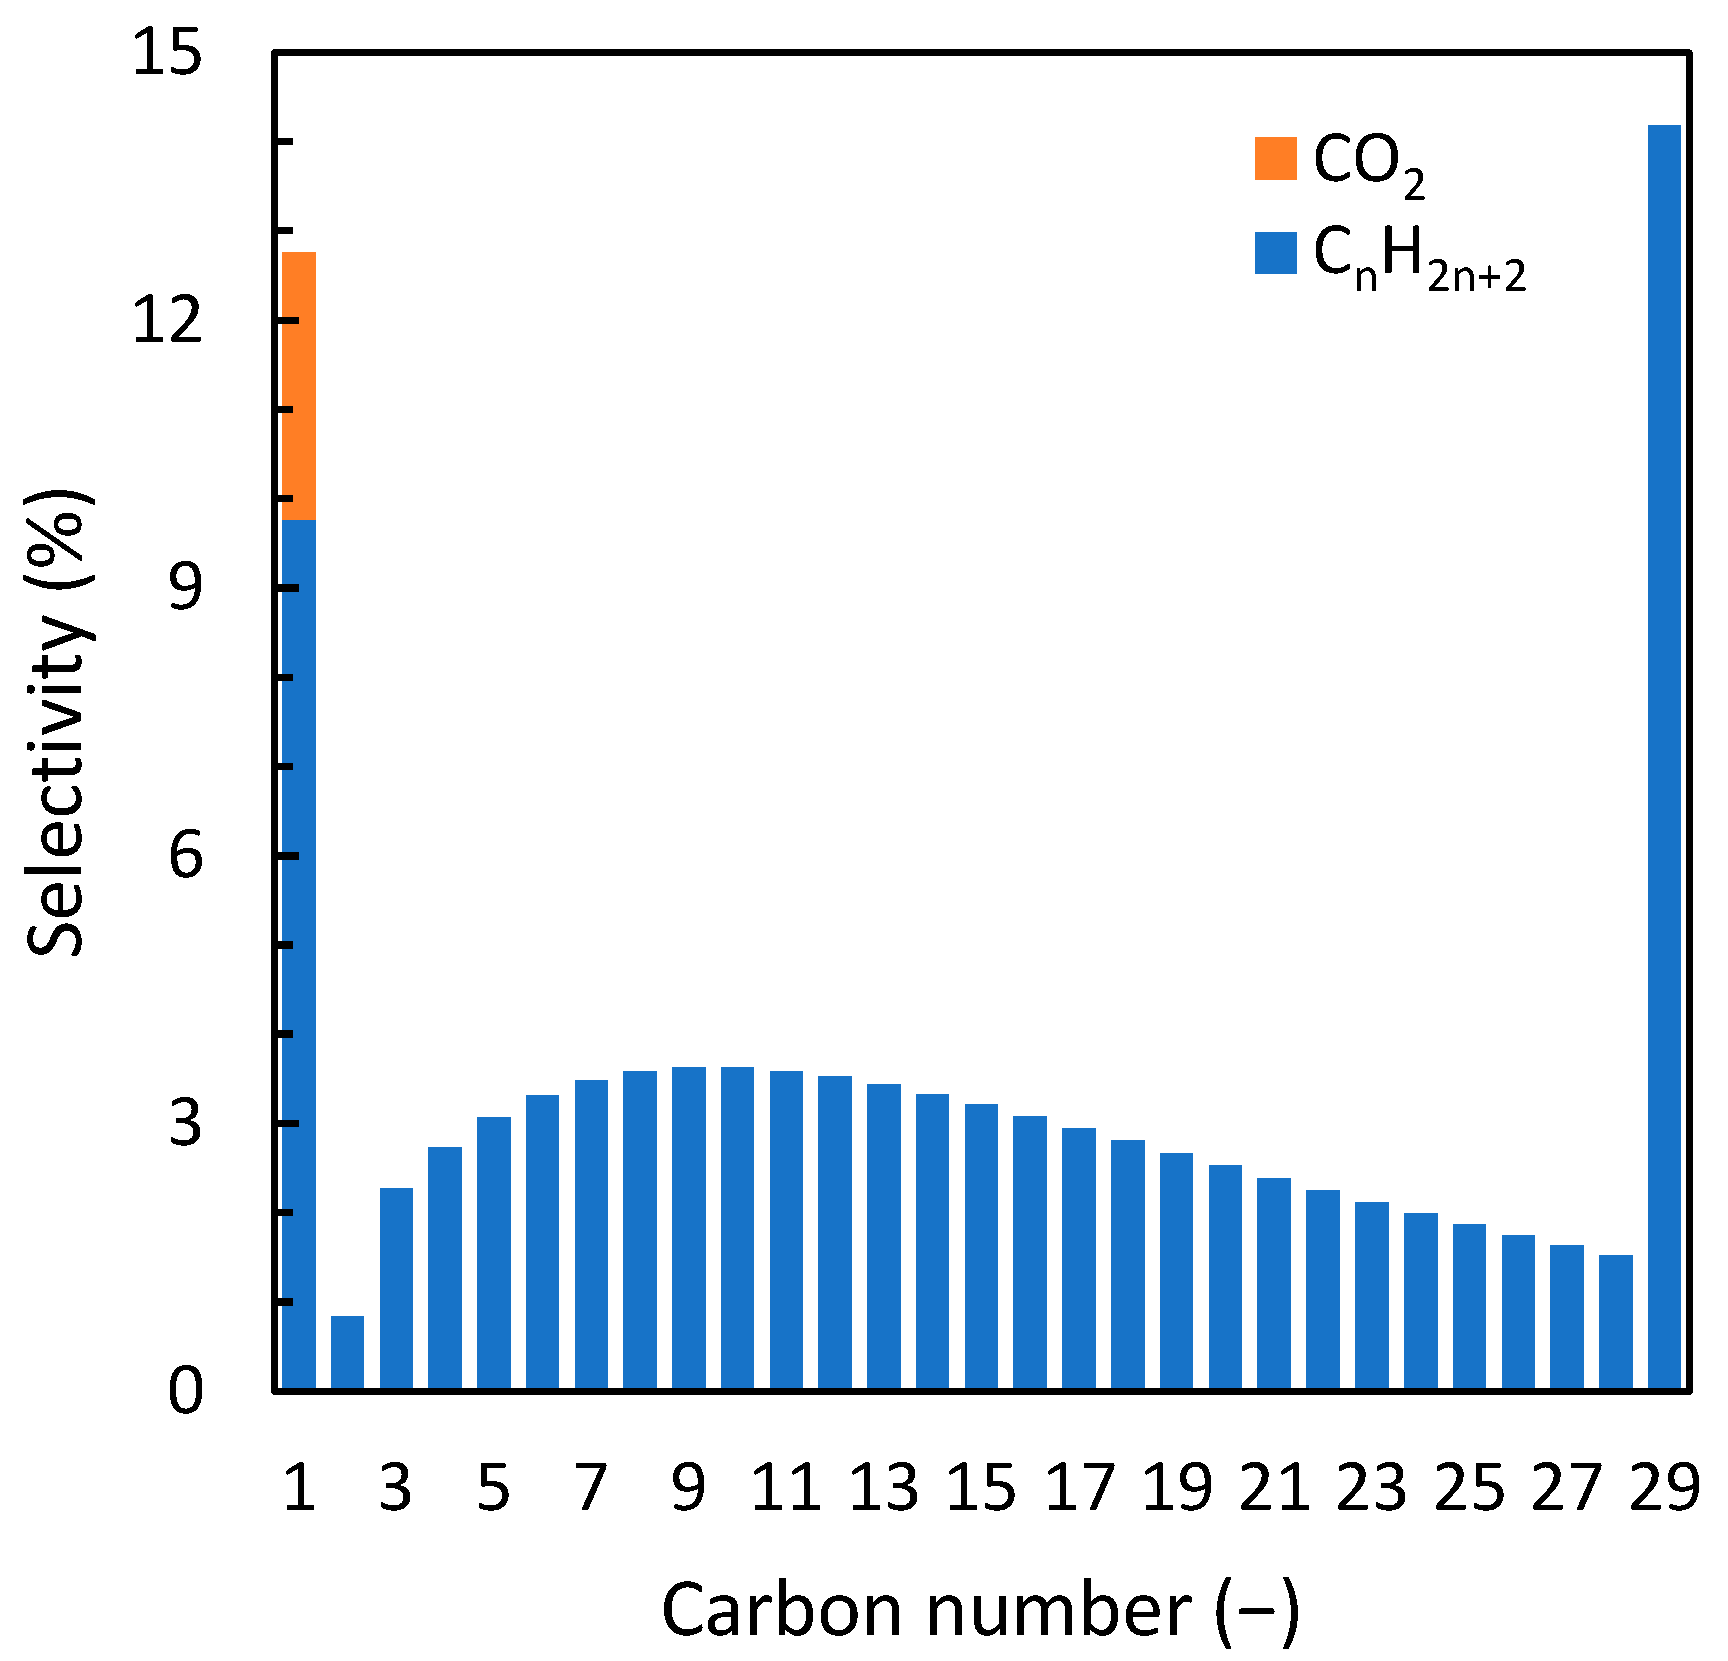
The selected parameters translate into a methane selectivity of 9.8%, a C2–4 selectivity of 5.8%, and a C5+ selectivity of 81.4%. The detailed selectivity of the FTS is depicted in Appendix A Figure A1.
Product recovery was modeled as a three-stage process with three heat exchangers and three gas–liquid separators in series. The product was cooled consecutively from the reactor temperature to 150, 60, and 10 °C, respectively, with the condensed product being withdrawn from each stage. The TGR ratio was controlled via a stream splitter in which the fraction of the tail gas which is to be recycled was specified.
Steam reforming was again modelled using an isothermal Gibbs reactor. As reactive species hydrogen, water, carbon monoxide, carbon dioxide, methane, ethane, and propane were considered, thus enabling the steam reforming reaction (Equation (9)), the dry reforming reaction (Equation (10)), and the WGS reaction (Equation (1)) [30].
C n H 2 n + 2 + n   H 2 O n   C O + 2 n + 1   H 2
C n H 2 n + 2 + n   C O 2 2 n   C O + ( n + 1 )   H 2
The reactor was operated at a temperature of 850 °C and 20 bar. Since steam reforming needs to be operated with excess steam to prevent coke formation [23], the steam-to-carbon ratio was adjusted according to the respective tail gas composition, considering the different reactive species. For alkanes, an H2O/Cn ratio of 3 n was selected, which is a common ratio for steam reforming of hydrocarbons [30]. Carbon monoxide was considered with an H2O/CO ratio of 2, as this is typical for WGS units [31,32]. As carbon dioxide can also be used to reform hydrocarbons according to Equation (10), an H2O/CO2 ratio of −1 was used, effectively reducing the overall steam-to-carbon ratio. Downstream of the steam reformer, the reformed tail gas was again dried, by cooling it to 10 °C and removing the unconverted steam as condensate in a gas–liquid separator.

2.3. Evaluation

As a measure for the extent of TGR, the TGR ratio was defined according to Equation (11) as the quotient of the molar flow rate of recycled tail gas n ˙ T G R and the molar flow rate of syngas n ˙ S G .
T G R   r a t i o = n ˙ T G R n ˙ S G
The overall carbon monoxide conversion X C O , o v e r a l l was determined from the molar flow rate of carbon monoxide in the syngas n ˙ C O , S G   and the molar flow rate of carbon monoxide in the tail gas n ˙ C O , T G according to the following equation:
X C O , o v e r a l l = n ˙ C O , S G n ˙ C O , T G n ˙ C O , S G
The chemical efficiency η c h e m was calculated based on the mass flow rate m ˙ C 5 + and lower heating value of condensable product LHVC5+ and the mass flow rate m ˙ S G and lower heating value of syngas LHVSG using the following equation:
η c h e m = m ˙ C 5 + · L H V C 5 + m ˙ S G · L H V S G
To calculate the carbon efficiency η C , the molar flow rate of carbon in the condensable product n ˙ C , C 5 +   and in the syngas n ˙ C , S G   were used according to Equation (14). It should be noted that both these key figures are syngas-to-syncrude efficiencies, which do not take the syngas production into account.
η C = n ˙ C , C 5 + n ˙ C , S G

3. Results

3.1. Comparison of Gas Loop Designs

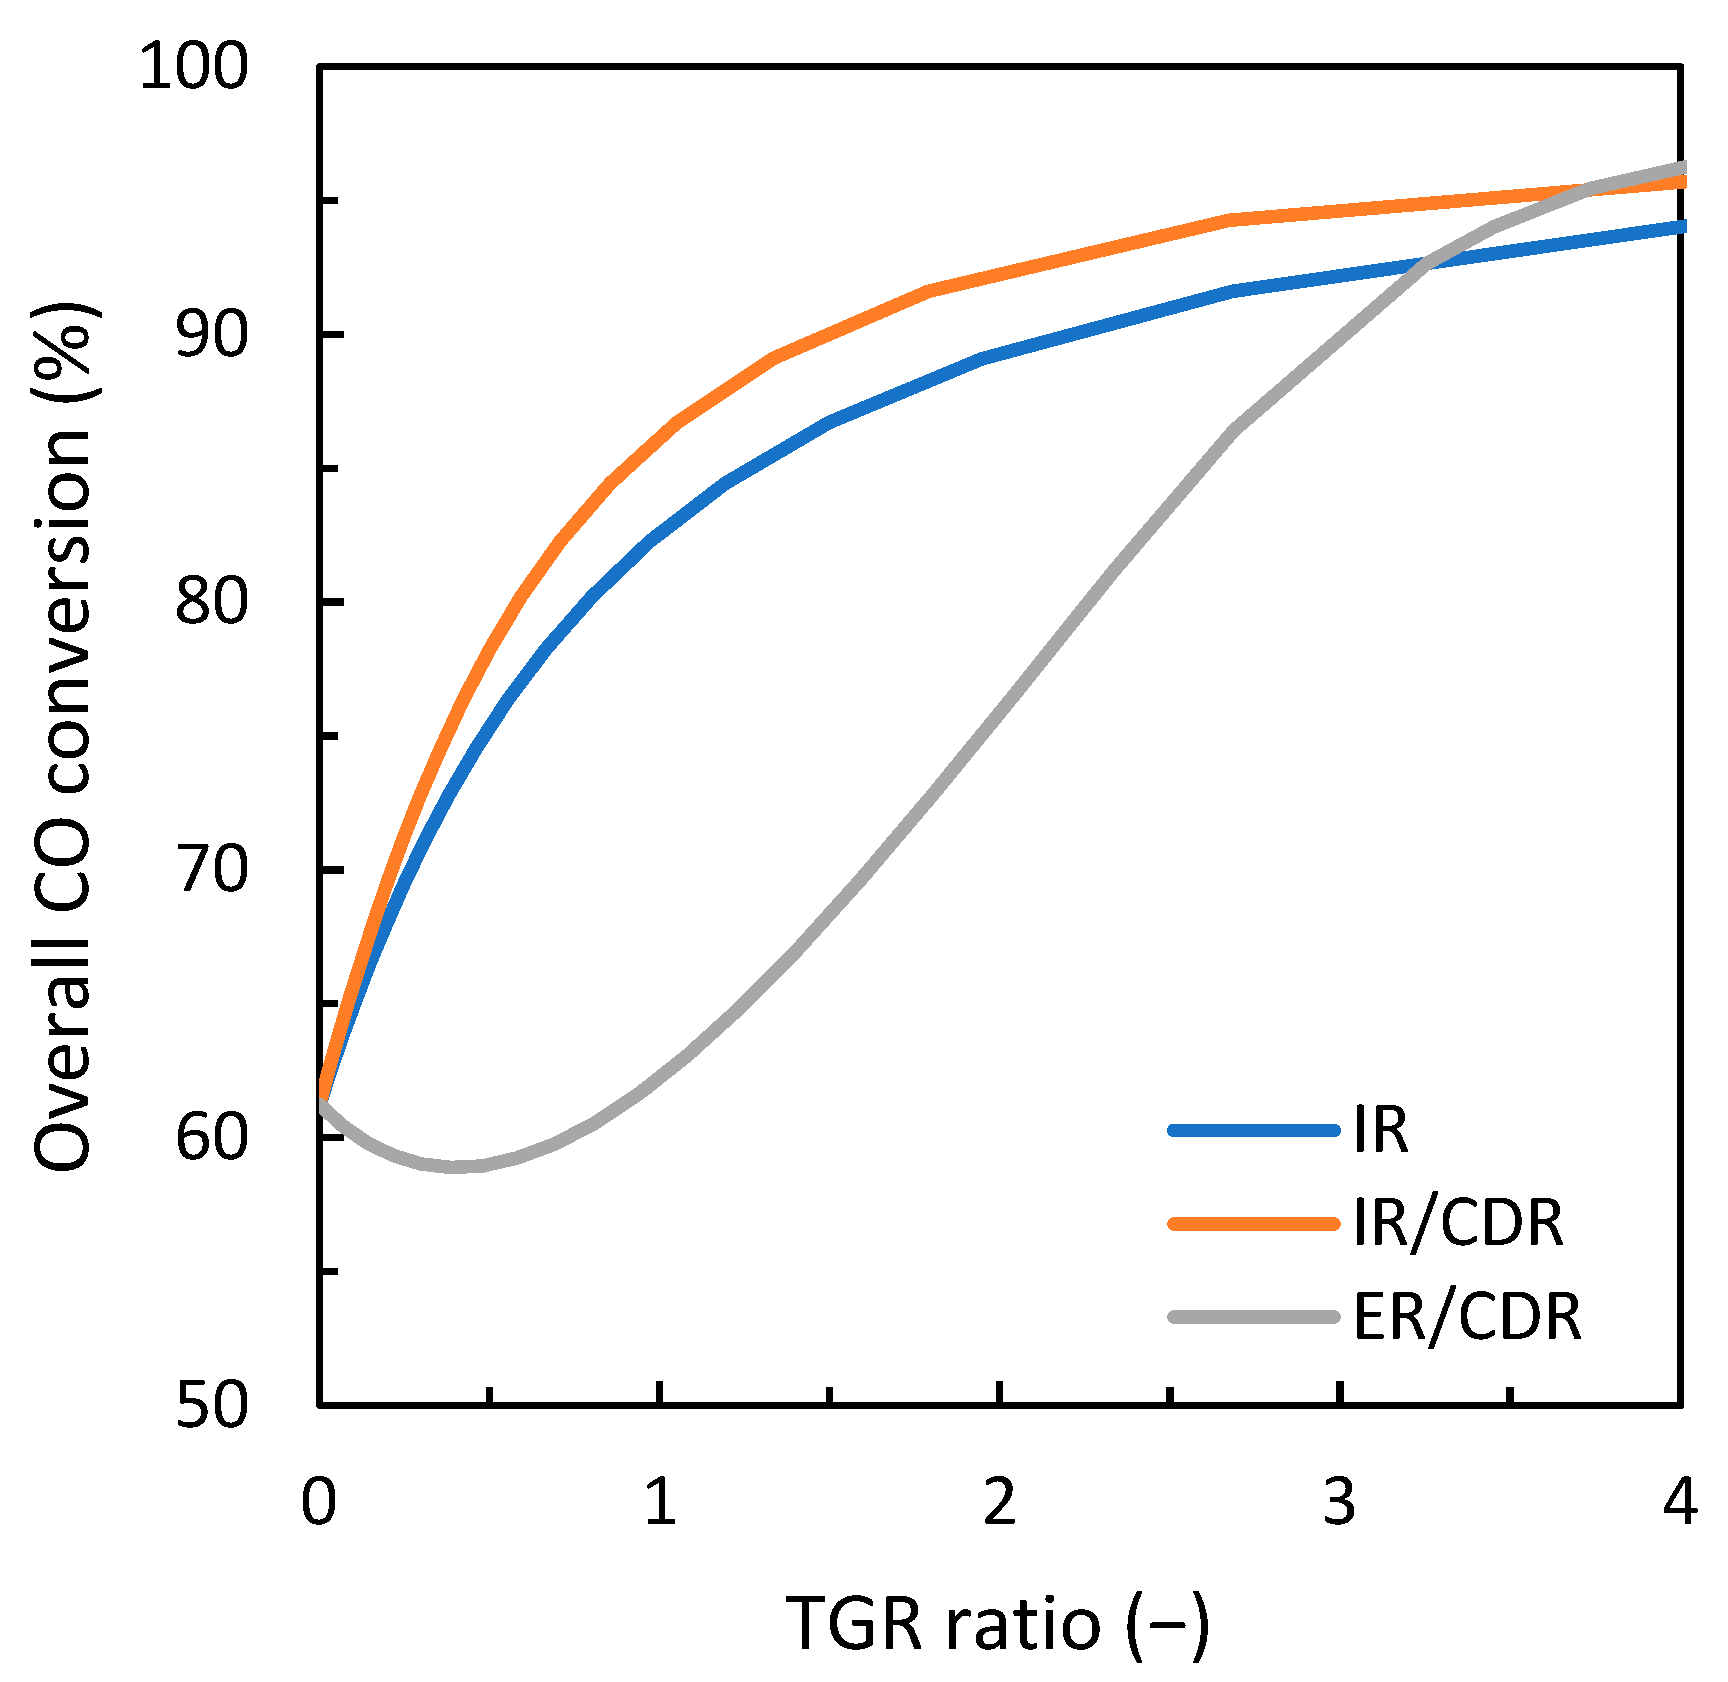
The overall carbon monoxide conversion as a function of the TGR ratio for the three gas loop designs is shown in Figure 3. At a TGR ratio of 0, which corresponds to once-through operation, the overall carbon monoxide conversion for all three configurations is naturally about equal to the per-pass conversion. For the IR, the overall carbon monoxide conversion increases approximately logarithmically to around 90% at a TGR ratio of 2.2 and only slowly thereafter. For the IR with CDR, the overall carbon monoxide conversion is slightly improved as the same conversion is achieved at a lower TGR ratio (i.e., 90% conversion at a TGR ratio of 1.5), but the relative increase again diminishes at higher TGR ratios. The overall carbon monoxide conversion for the ER with CDR exhibits a rather unexpected trend. It initially decreases and reaches a minimum at a TGR ratio of about 0.5. Then it also increases, reaches a conversion of 90% at a TGR ratio of about 3, and tapers off beyond that.
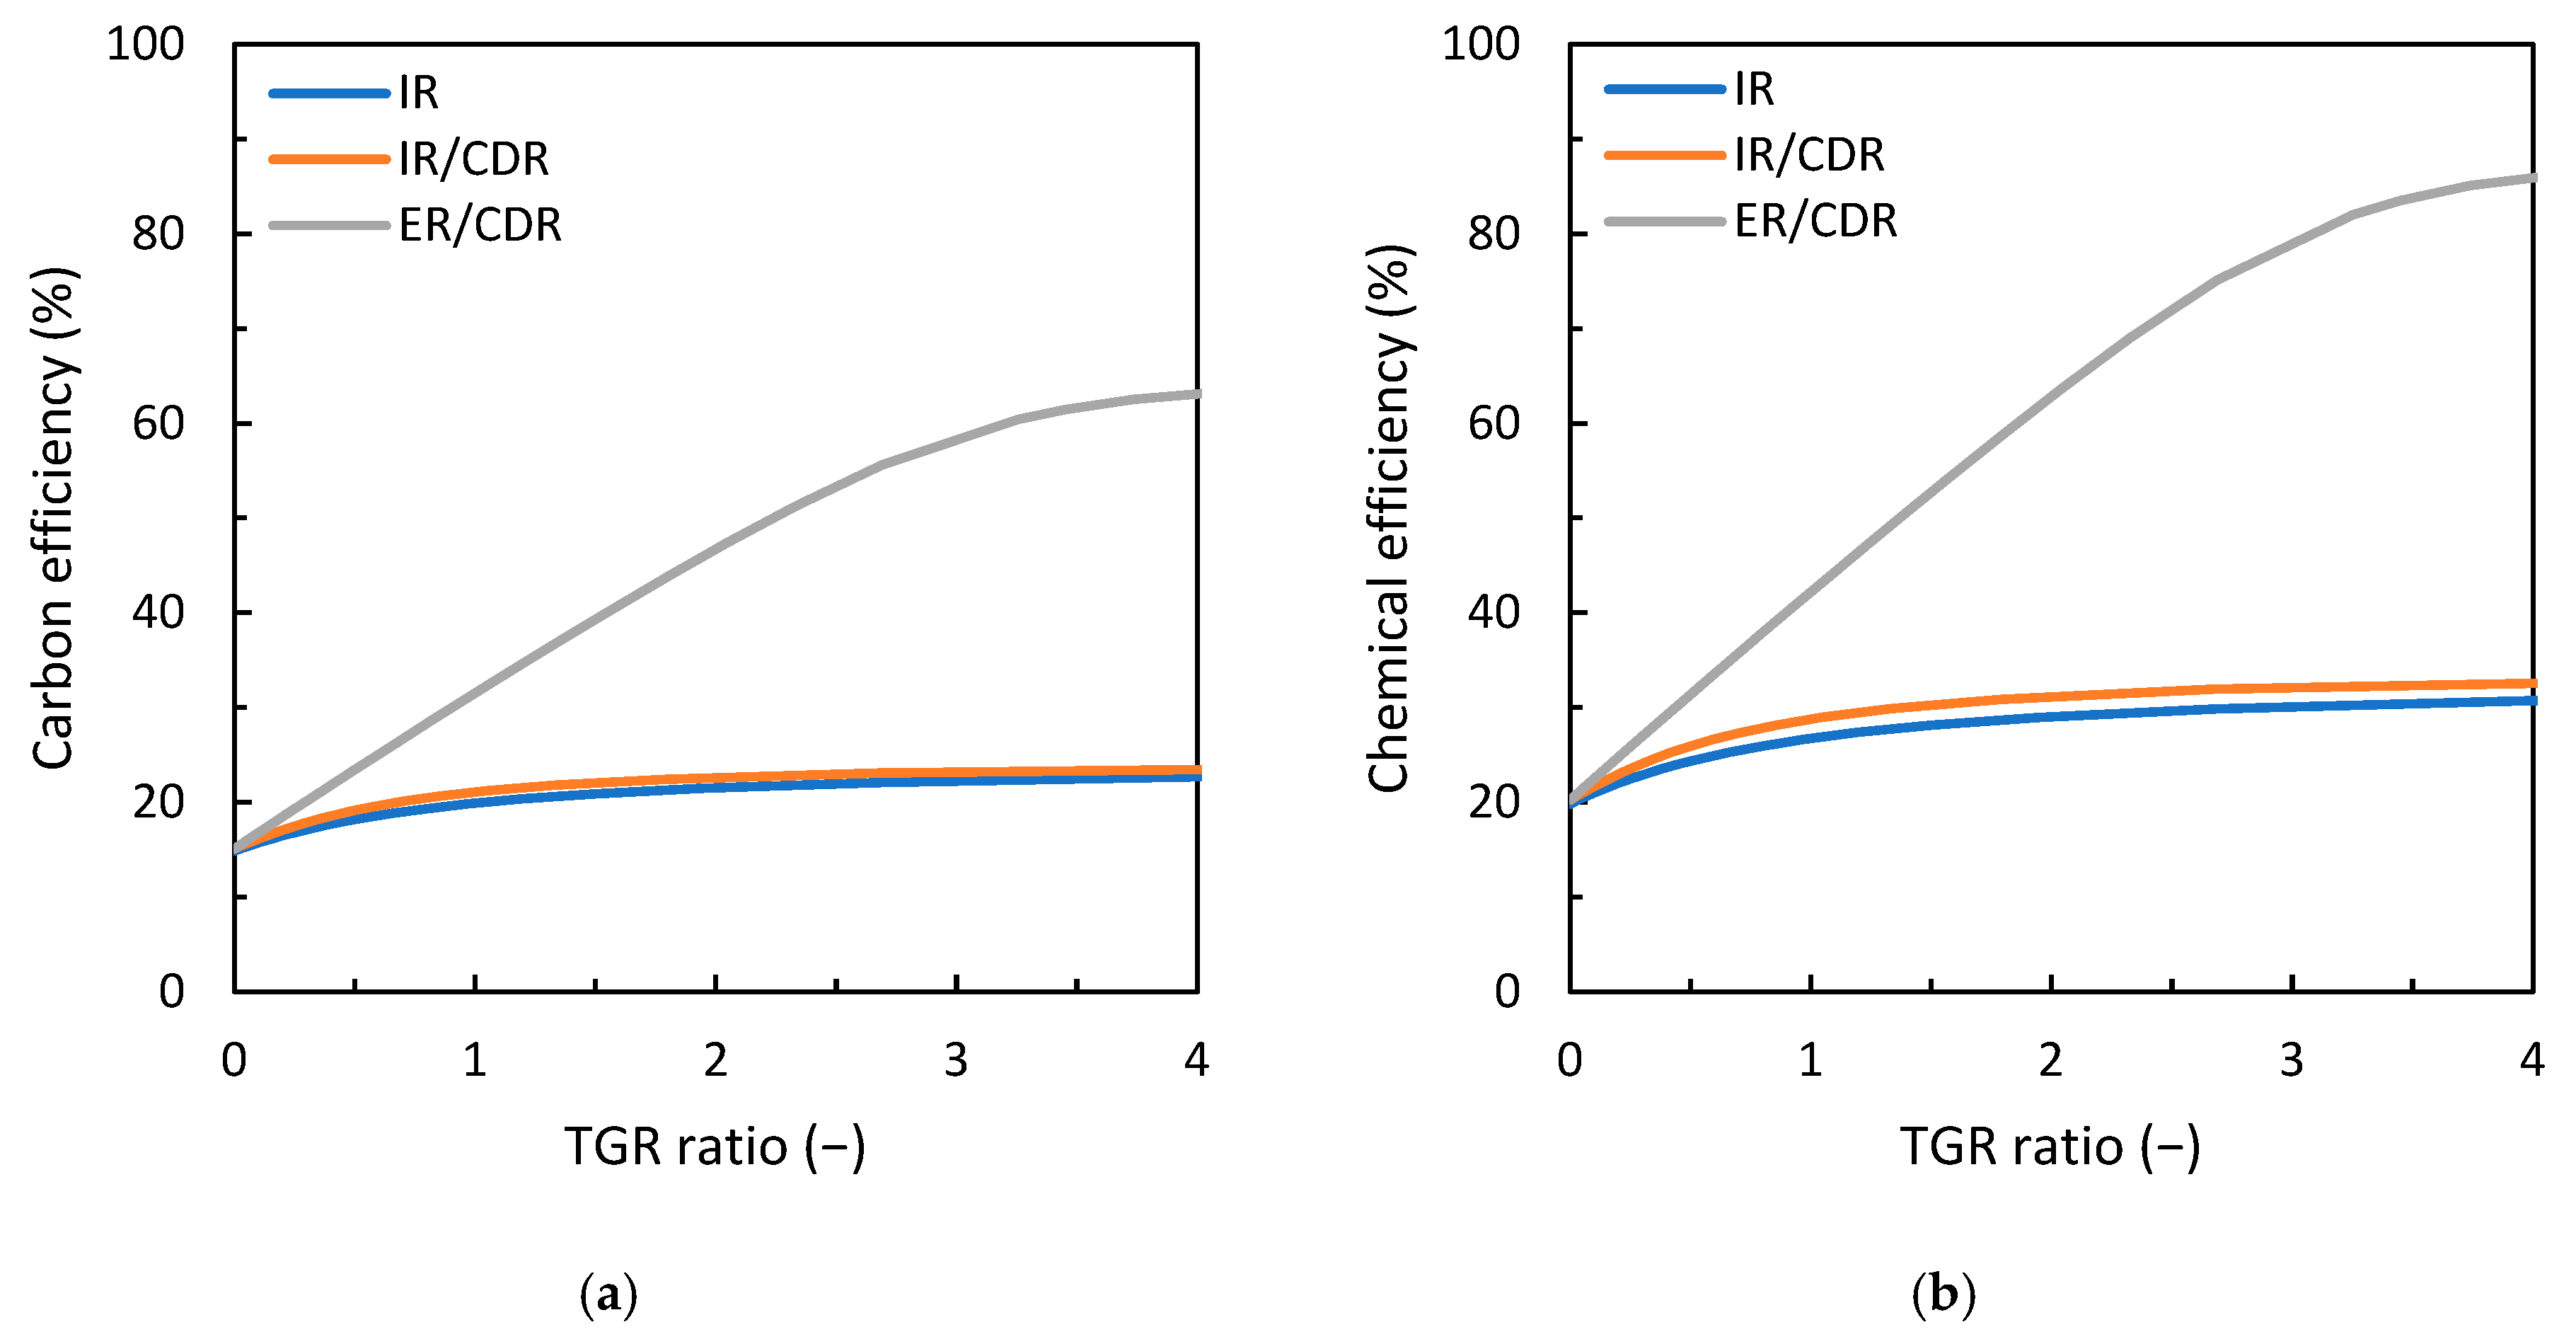
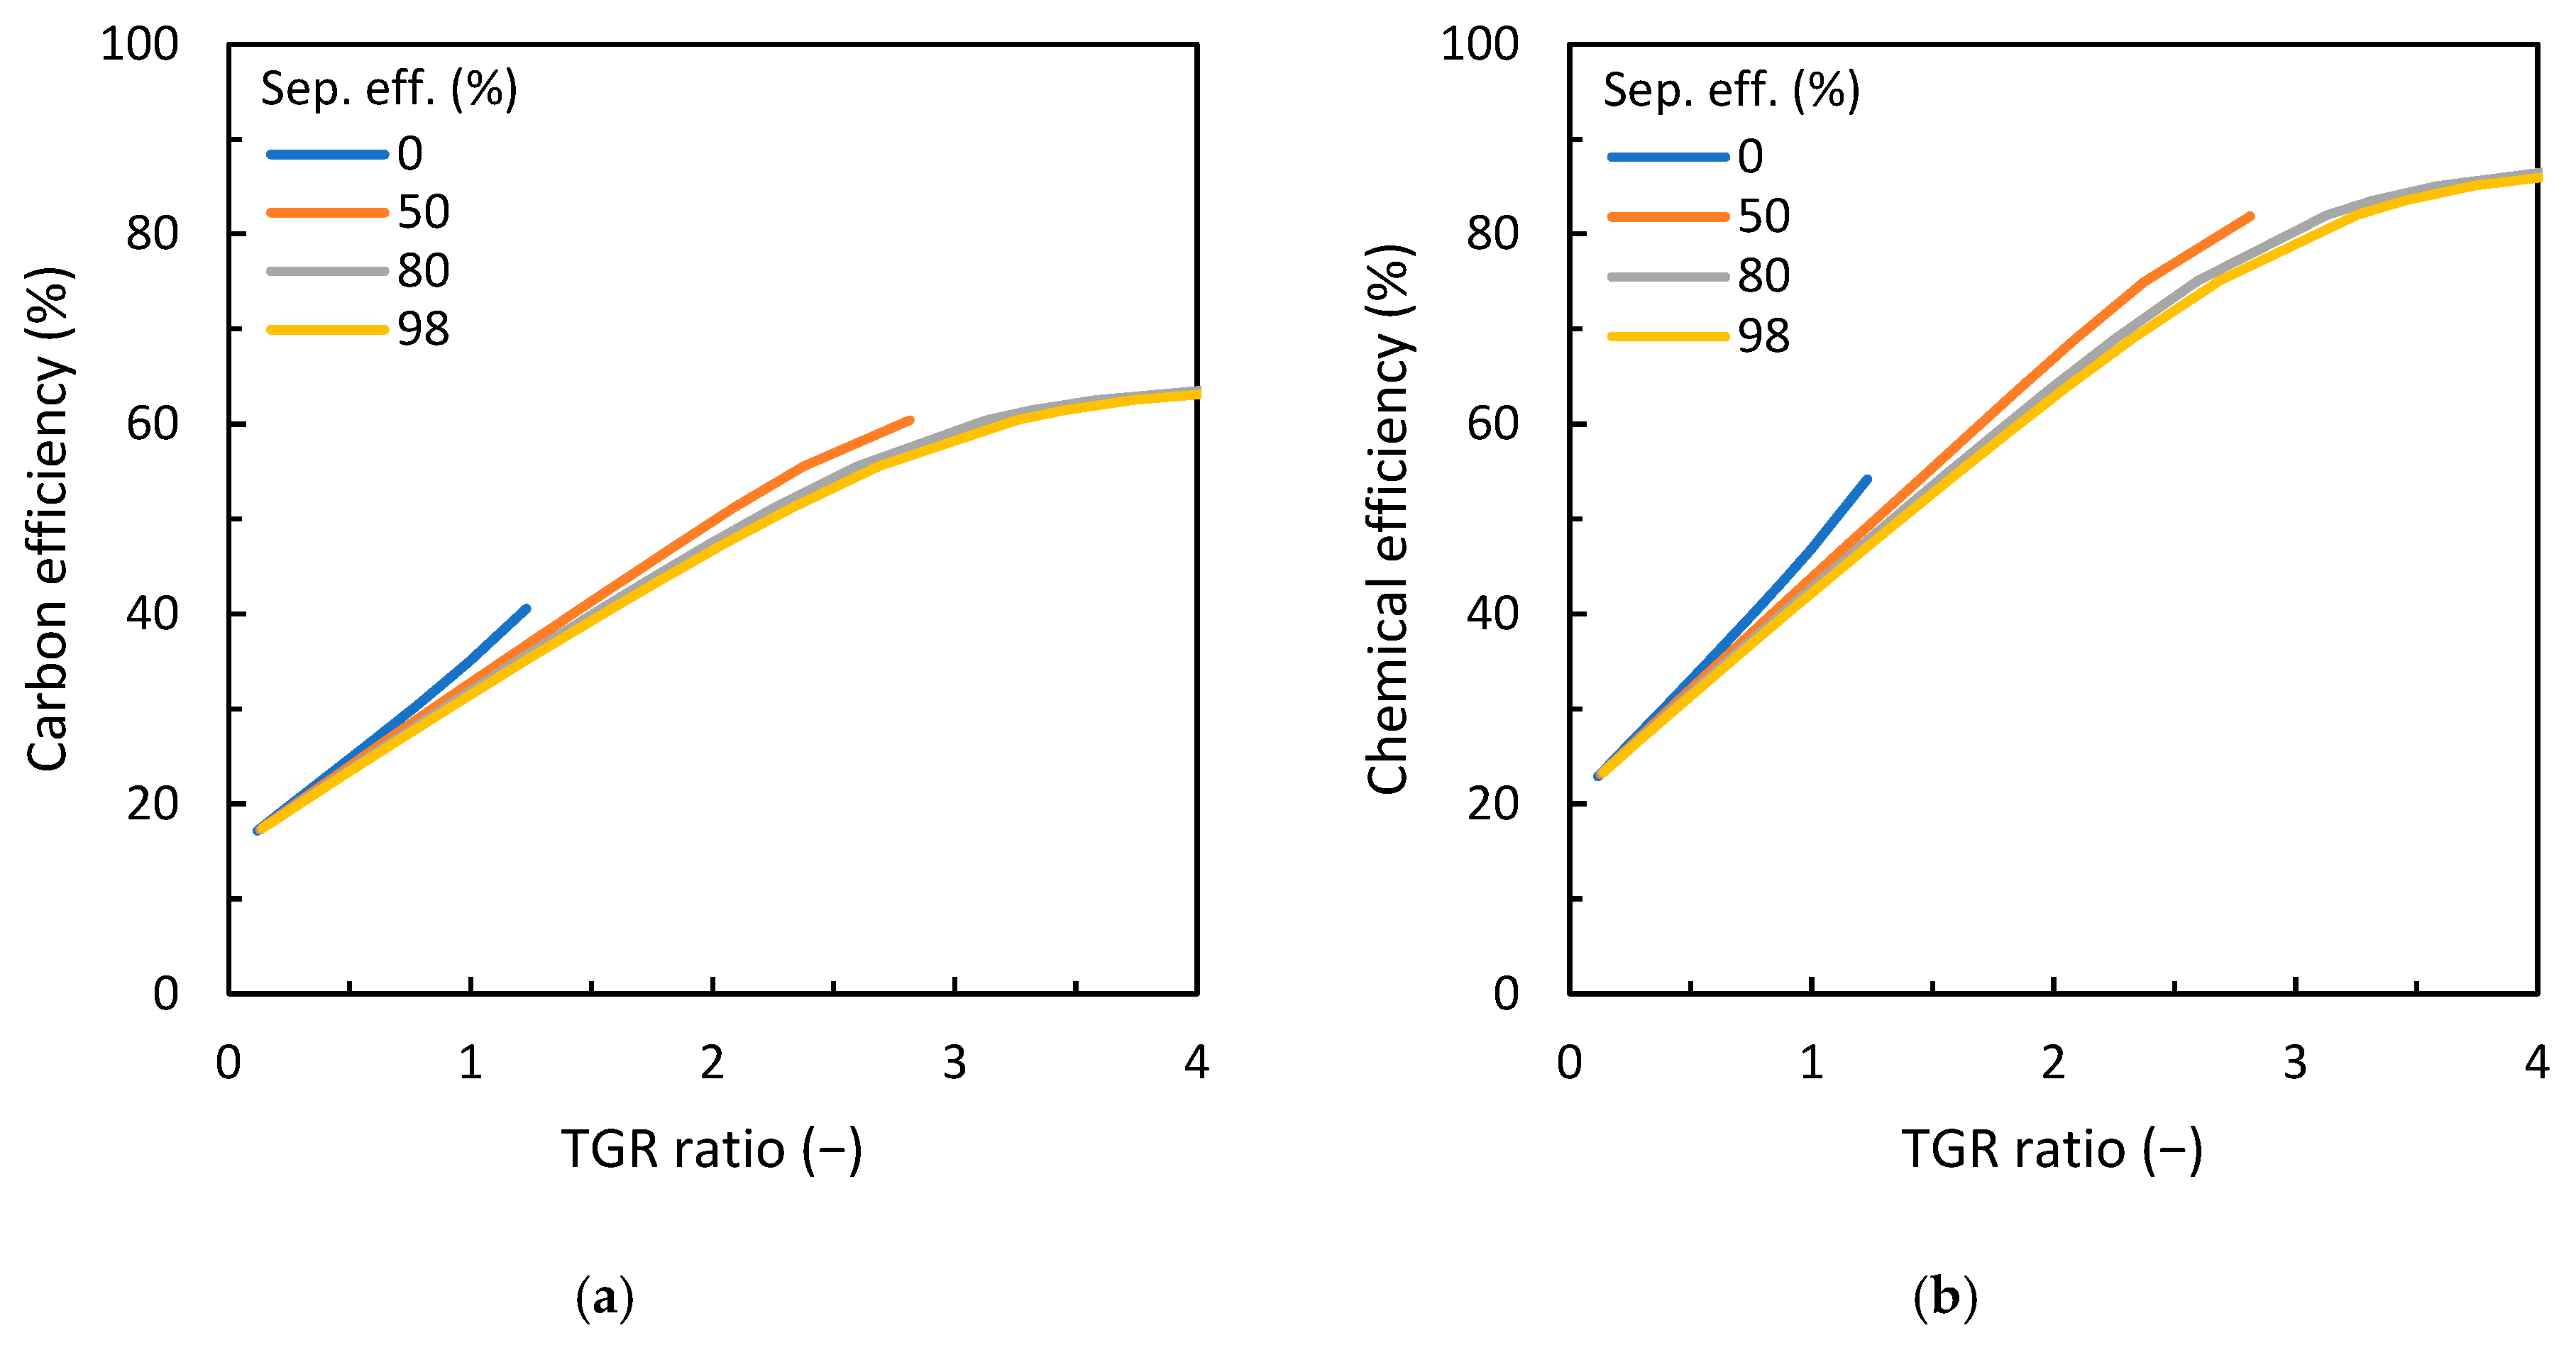
Simply comparing the three concepts in terms of the overall carbon monoxide conversion might suggest that the ER with CDR is an inferior design to the two using an IR. However, a comparison of the carbon and chemical efficiency (Figure 4) gives a different picture. At a TGR ratio of 0, the carbon and chemical efficiency are only about 15 respectively 20% for all three concepts, as this again translates to once-through operation. Increasing the TGR ratio to 2.2 again for the IR increases the carbon efficiency to about 21% and the chemical efficiency to about 29%. The introduction of CDR leads to minor improvements, as the same efficiencies are already achieved at a lower TGR ratio of around 1.2 respectively a carbon efficiency of 23% and a chemical efficiency of 32% is achieved at the same TGR ratio. However, the diagrams clearly show that an increase in efficiency beyond this is hardly possible due to the logarithmic characteristic. The gas loop using an ER with CDR shows a significant improvement. Both the carbon and chemical efficiency increase almost linearly and only start to taper off slightly at a TGR ratio greater than 2.7. Further, this concept is able to reach a carbon efficiency >60% and a chemical efficiency >80%.
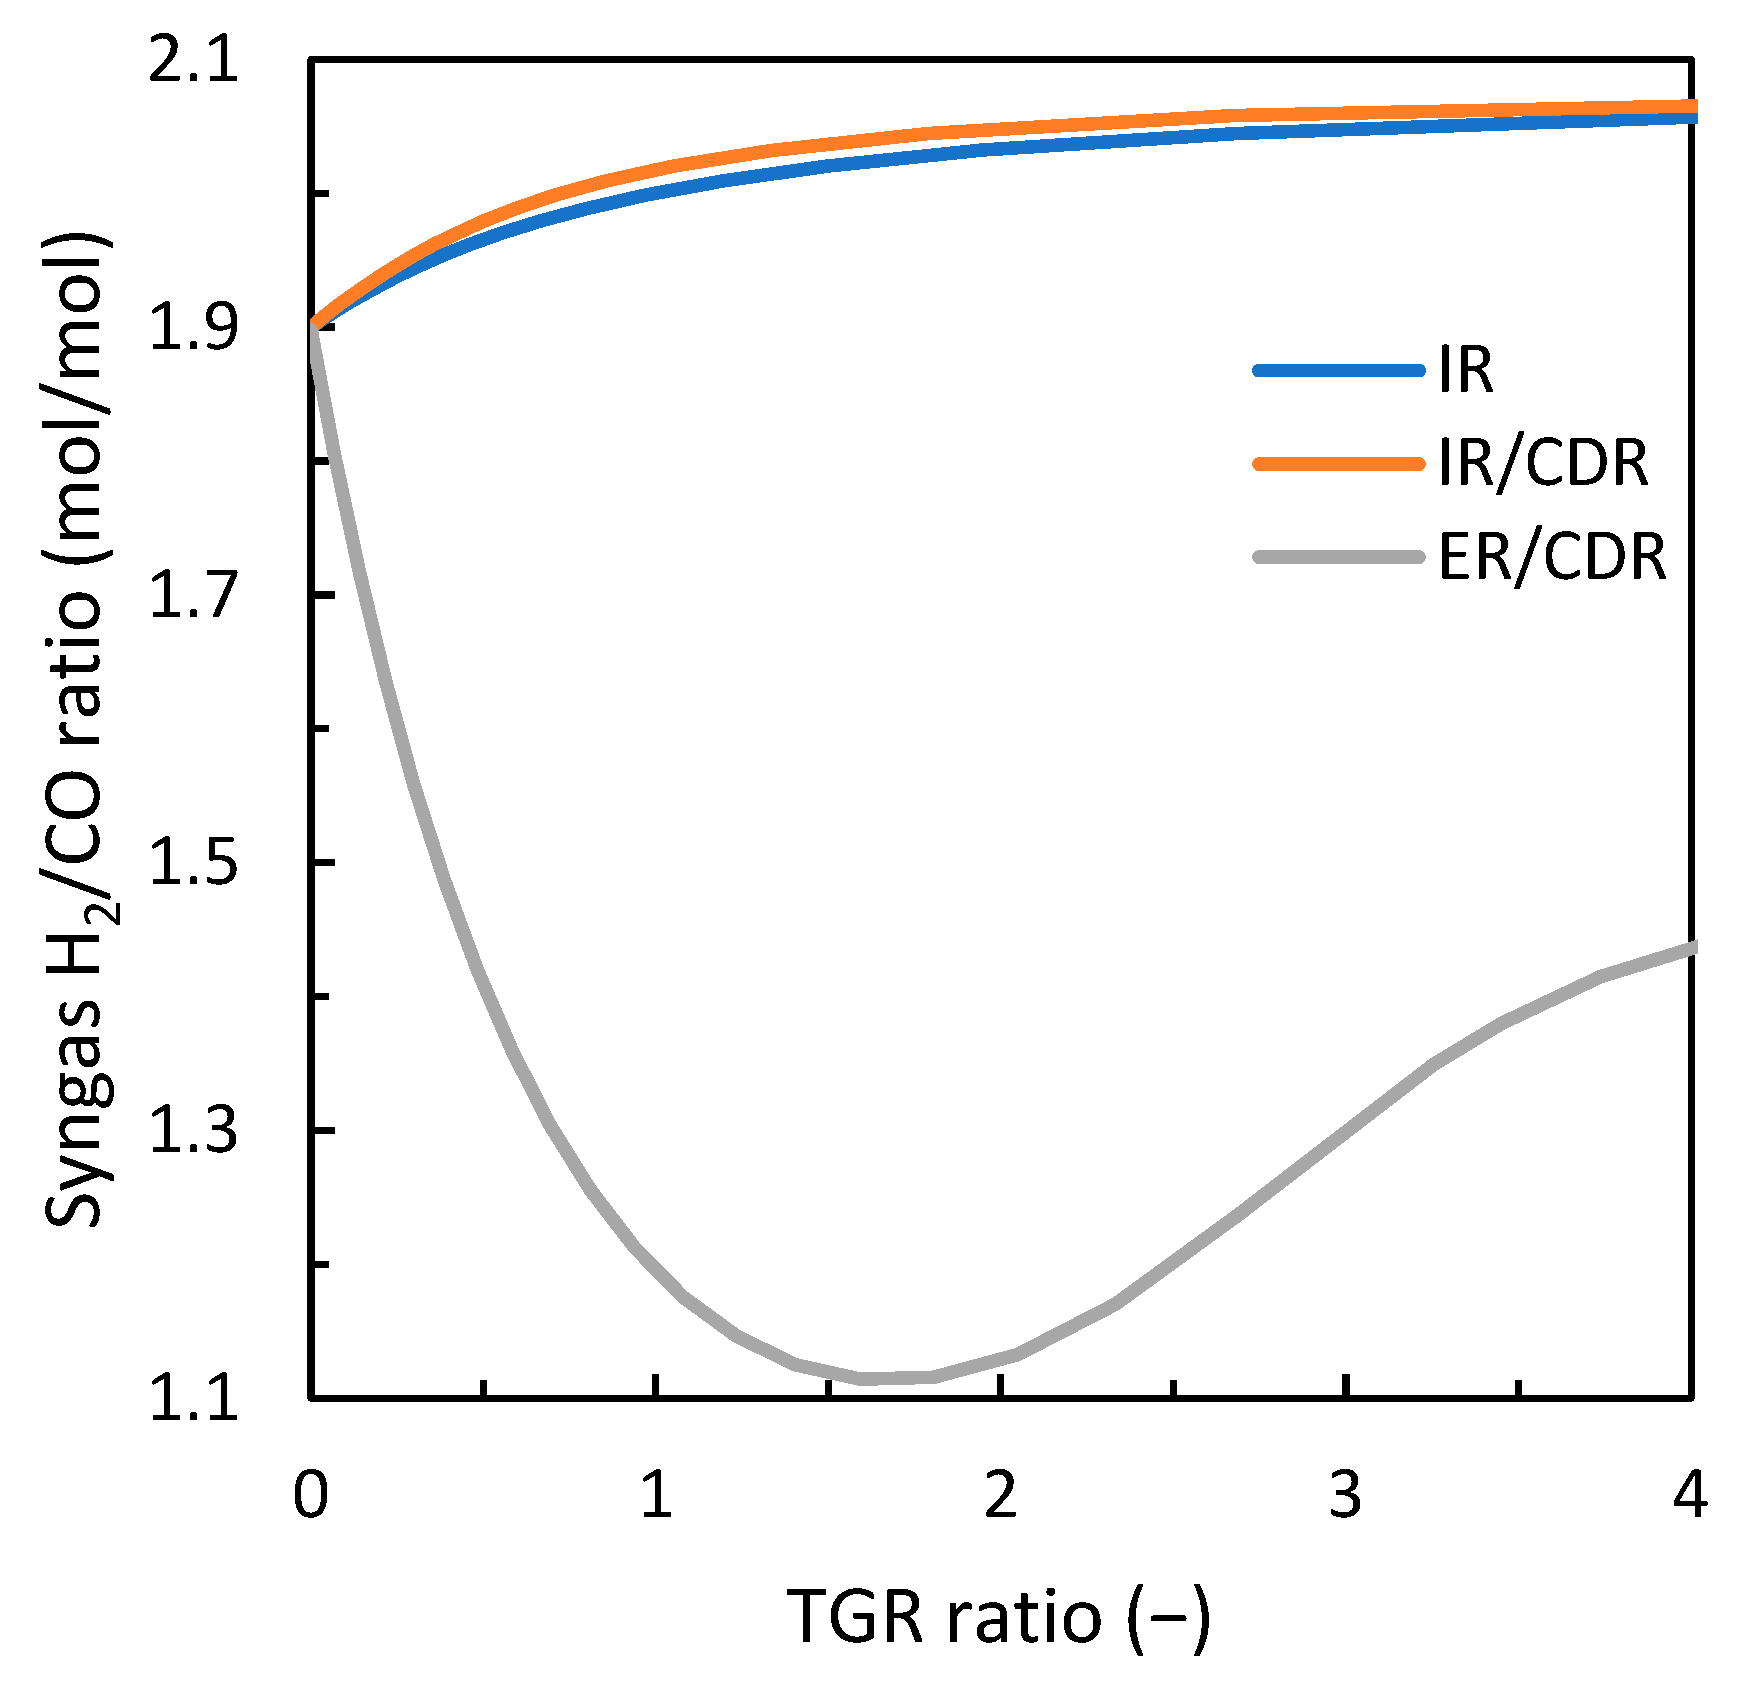
Since the desired feed gas H2/CO ratio of 1.9 is below the usage ratio, the resulting tail gas is lean in hydrogen. When employing steam reforming in the ER, the reformed tail gas is rich in hydrogen. Depending on the gas loop design and the TGR ratio, the syngas gas thus requires a certain H2/CO ratio in order to compensate for the recycled tail gas, as shown in Figure 5. At a TGR ratio of 0, the required H2/CO ratio is again the same for all three variants and corresponds to the desired feed gas H2/CO ratio of 1.9. For both the IR and the IR with CDR, the required syngas H2/CO ratio converges logarithmically towards the stoichiometric H2/CO usage ratio of 2.087 with increasing TGR ratio. When employing CDR, the required syngas H2/CO ratio again increases slightly faster. For the ER with CDR, the required syngas H2/CO ratio decreases quickly to 1.1 at a TGR ratio of 1.7, from where it increases again for higher TGR ratios.

3.2. Influence of Carbon Dioxide Content in ER/CDR Configuration

To investigate the influence of carbon dioxide in the gas loop, the separation efficiency of the CDR was varied from 0 to 98% for the gas loop configuration using an ER with CDR. The higher the separation efficiency, the lower the remaining carbon dioxide content in the syngas after syngas conditioning. A separation efficiency of 0% thus results in the highest carbon dioxide content and effectively translates to an ER without CDR. Such a variation was not conducted for the gas loop design with an IR since the two extreme cases, IR with and without CDR, were already investigated and do not show differences of a magnitude that would justify the investigation. Figure 6 shows the carbon and chemical efficiencies as a function of TGR for four different separation efficiencies. The carbon and chemical efficiencies initially increase at about the same rate for all separation efficiencies at lower TGR ratios. For the separation efficiencies of 50, 80, and 98%, the increase tapers off at higher TGR ratios but, nonetheless, reaches a carbon and chemical efficiency greater than 60 and 80%, respectively. For very high TGR ratios, the results suggest that the efficiencies converge towards a theoretical maximum. In contrast to the IR, where the introduction of CDR leads to a slight improvement, for the ER, increasing the separation efficiency of CDR actually slightly decreases both the carbon and chemical efficiency. For a separation efficiency of 0%, the TGR is limited to TGR ratios below 1.2, due to constraints, which are elaborated in the discussion. Thus, the maximum carbon and chemical efficiency is significantly lower than for higher separation efficiencies.
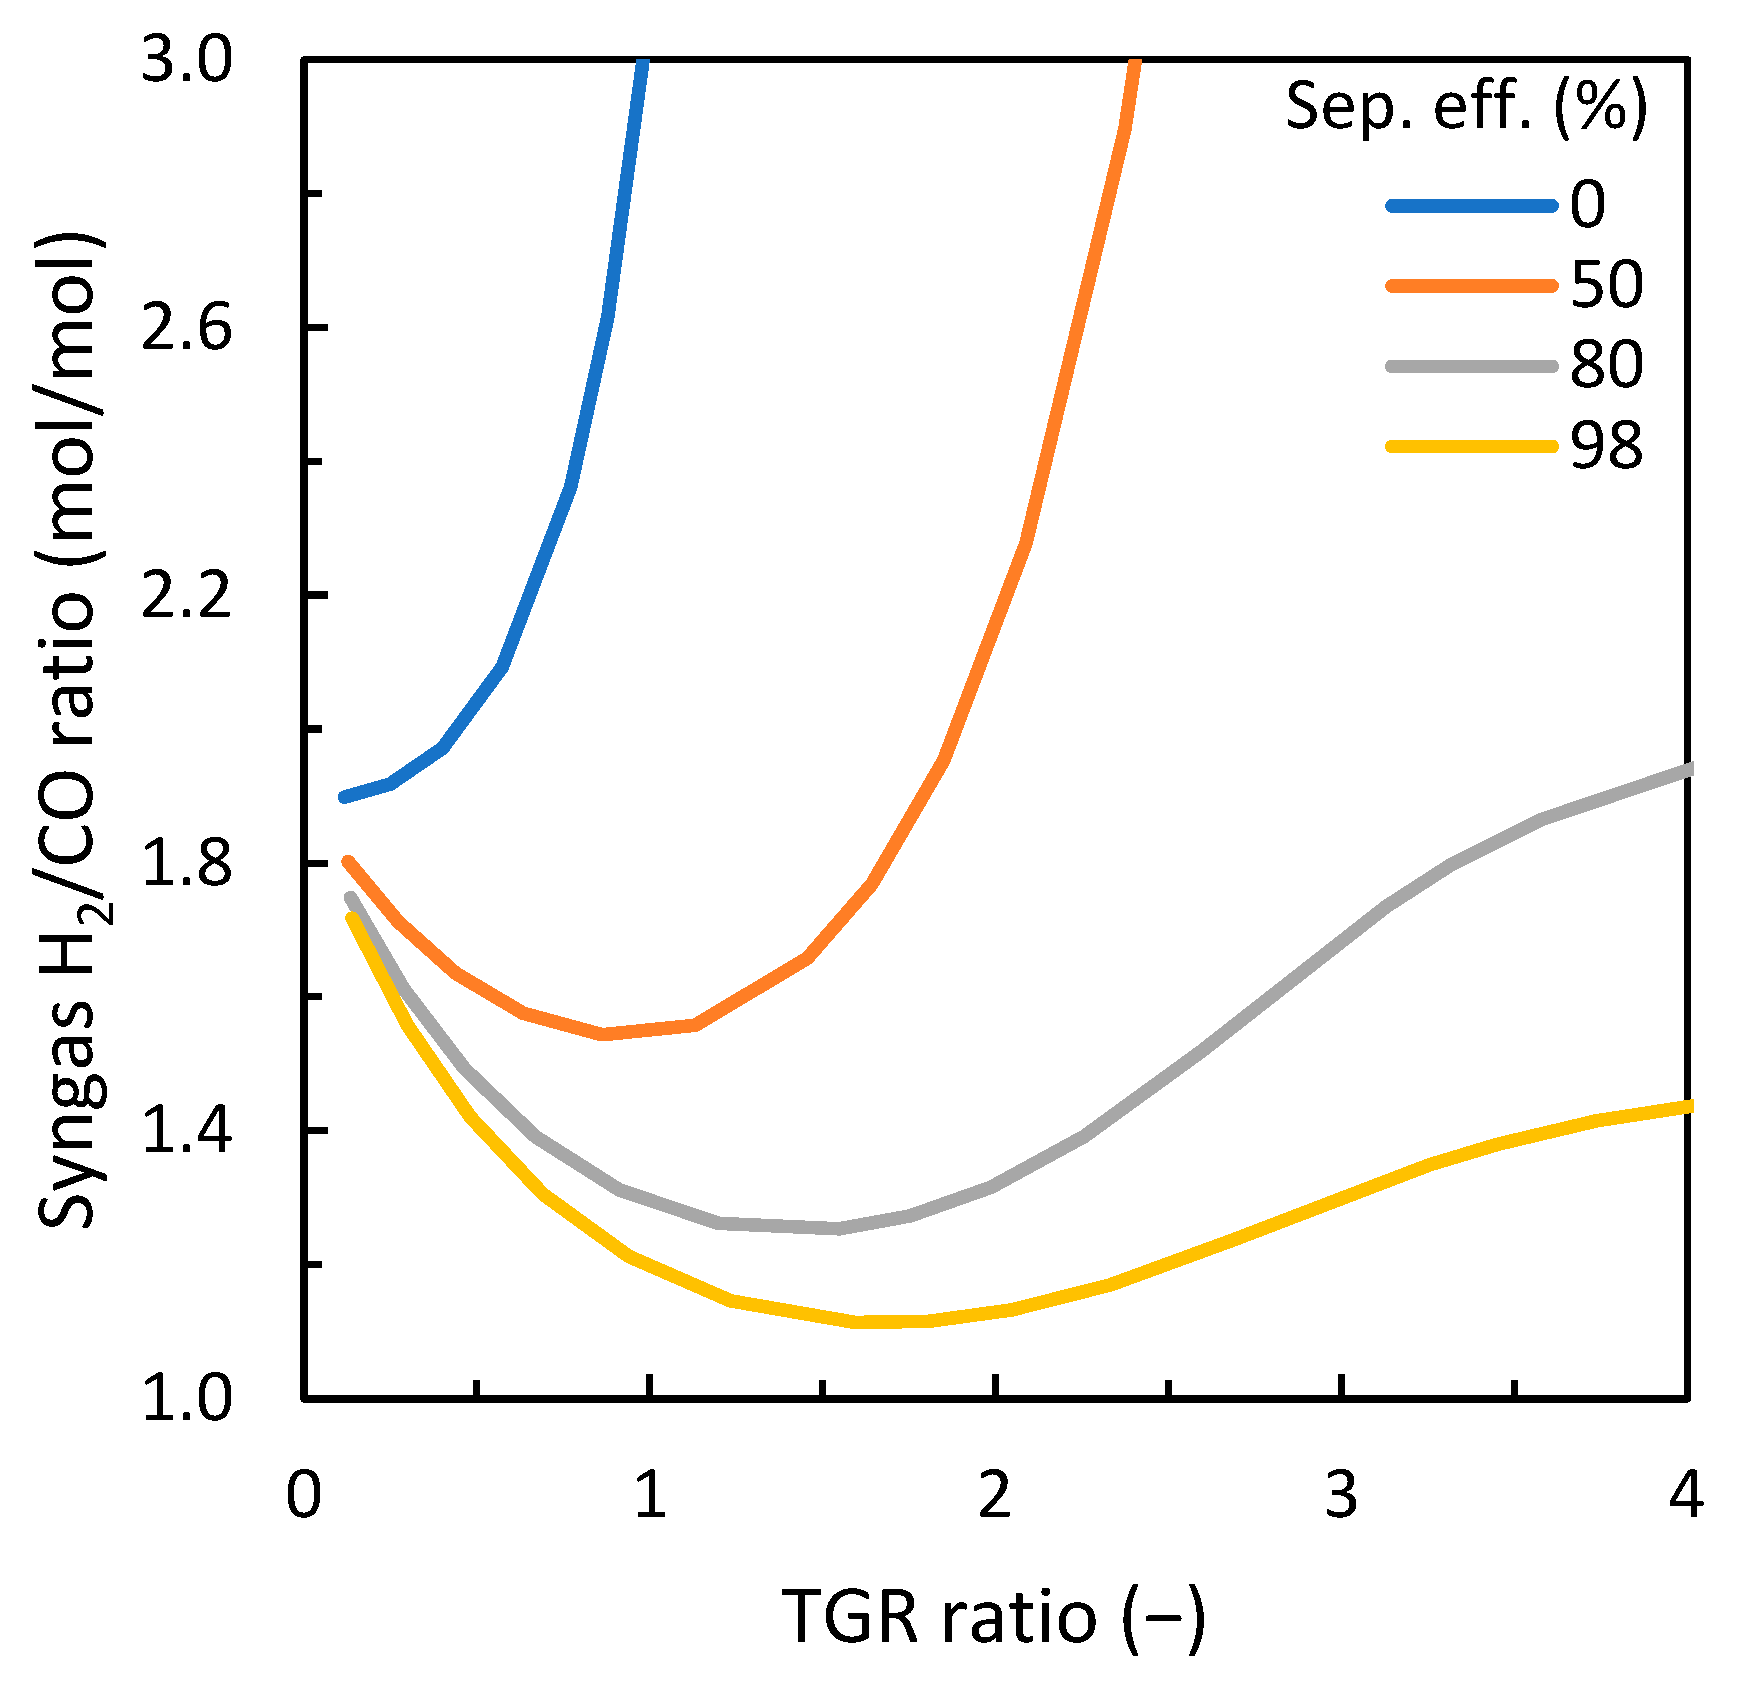
What is, however, significantly affected by the carbon dioxide content is the required syngas H2/CO ratio, as shown in Figure 7. If the separation efficiency is reduced from 98%, which was the default for the previous investigations, to 80%, the required syngas H2/CO ratio generally exhibits a similar characteristic. However, the initial decrease is not as pronounced, only decreasing to about 1.25 at a TGR ratio of 1.5. Also, at higher TGR ratios, the required syngas H2/CO ratio almost increases to the initial ratio of 1.9. Using an even lower separation efficiency of 50%, the initial drop flattens out even more, only decreasing to 1.55 at a TGR ratio of about 1.0. Beyond that, however, the required H2/CO increases dramatically to more than 3.0 for TGR ratios greater than 2.4. At a separation efficiency of 0 (i.e., an ER without CDR), there is no initial drop, but instead the required H2/CO ratio increases immediately to more than 3.0 for TGR ratios greater than 1.0.

3.3. Discussion

3.3.1. Gas Loop Design Intent

First, the design intent with which the gas loops presented in Section 2.1 were conceived will be discussed. Since a relatively modest per-pass conversion was assumed, a closed loop was considered mandatory to achieve an acceptable overall conversion. The importance of providing a syngas close to the usage ratio is widely known in literature [15,33]. This is particularly important for cobalt-based catalysts as, unlike iron-based catalysts, they have negligible WGS activity and are thus unable to “self-condition” [34]. For cobalt catalysts without WGS activity, typically an H2/CO ratio of 2.05–2.15 is recommended [35], which corresponds to the stoichiometric ratio for alkanes in the middle distillate range (cf. Equation (5)). However, in order to increase the selectivity for long-chain hydrocarbons, it can be desirable to operate the FTS at an H2/CO ratio below the usage ratio [15,36]. Thus, a desired feed gas H2/CO ratio of 1.9 was selected. This, however, once again emphasizes the need for an H2/CO adjustment, as operating the FTS below the usage ratio yields a hydrogen-lean tail gas. If TGR is employed and the syngas H2/CO ratio is not adjusted accordingly, the feed gas increasingly deviates from the usage ratio at higher TGR ratios [27], which can have a detrimental effect on conversion and selectivity. In practice, the syngas could technically be adjusted to the desired H2/CO ratio directly in the main means of syngas production (i.e., gasifier, reformer, etc.) by specifically selecting the operating conditions, provided that the H2/CO ratio can be manipulated in this way over a sufficiently wide range. However, since the adjustment of the H2/CO ratio is inherently associated with carbon losses and the required H2/CO ratio depends significantly on the gas loop design, a dedicated WGS unit was included for the sake of comparability. Syngas drying was included to remove the residual moisture after raw and fine gas cleaning. This process step was considered essential, as a high water partial pressure in the FT reactor can lead to catalyst deactivation through oxidation [37] and compression of the moist syngas to synthesis pressure would lead to condensation which can damage the compressor. Thus, under the assumed boundary conditions, the minimum required syngas conditioning consists of a WGS unit, syngas drying, and syngas compression.
The simplest version of a closed gas loop is an internal recycle, as it does not add much in terms of complexity and equipment, but still enables a higher overall conversion. However, since the syngas used contains a substantial amount of inert components (i.e., carbon dioxide, methane, etc.), a considerable dilution of the feed gas is to be expected when TGR is used. Therefore, in the next more complex design, CDR was introduced to reduce the dilution and, consequently, the volume flow and the required size of the gas loop. Since a small amount of carbon dioxide is also produced in the FTS, the CDR would have to be placed directly upstream of the FTS if the aim was to remove the entire carbon dioxide from the feed gas. However, since the volume flow to be treated, and thus the investment and operating costs of CDR, would be considerably higher, a minor accumulation of carbon dioxide is accepted as a trade-off. In order to further decrease the inert content of the syngas, steam reforming was introduced in the next more complex gas loop design. With regard to placement, the same considerations were made as for the CDR. However, since the amount of methane in the synthesis gas was lower and the amount of methane produced in the FTS was higher than with carbon dioxide, the steam reformer was placed in the tail gas recycle, as this allows both the methane introduced with the syngas and the methane produced in the FTS to be converted into additional syngas with a single reformer. As the composition of the recycled tail gas is altered in this way, this configuration is regarded as external recycle.

3.3.2. Investigation of Gas Loop Simulation Results

Continuing with the process simulation results, the criteria to achieve an overall carbon monoxide conversion of greater than 90% is often assumed as a prerequisite for economic plant design [38,39]. Comparing the three gas loop designs in terms of the overall carbon monoxide conversion suggests that all three proposed designs are viable options, as all are capable of reaching said criteria (c.f. Figure 3). The slight improvement in the overall carbon monoxide conversion achieved by adding CDR to the IR is due to the fact that, by reducing the amount of carbon dioxide introduced into the gas loop, the dilution of the feed gas is reduced and therefore a higher share of active gases is recycled and thus converted for a given TGR ratio. It further appears that the most complex design, the ER with CDR, is inferior to the two designs employing an IR, as it requires significantly higher TGR ratios to achieve the same overall carbon monoxide conversion. This is because the definition of overall carbon monoxide conversion (Equation (12)) only considers carbon monoxide passing the system boundaries of the gas loop. In the case of the ER with CDR, significant quantities of gaseous hydrocarbons enter the gas loop, which are then converted into additional carbon monoxide through steam reforming within the system boundaries, thus effectively reducing the overall carbon monoxide conversion. The initial decrease of the respective overall carbon monoxide conversion curve in Figure 3 can be attributed to this effect. At higher TGR ratios, the positive effect of TGR on the overall carbon monoxide conversion rate becomes so much more pronounced than the aforementioned effect that it increases above the initial value of no recycling and finally surpasses both concepts employing an IR.
Looking at the carbon and chemical efficiency, however, reveals that, on the contrary, the two designs using an IR are the ones that are inferior as they are severely limited, while the ER design can achieve more than twice the efficiency. The limitations originate from the fact that a considerable amount of the syngas enters the gas loop as gaseous hydrocarbons and a significant fraction of the carbon monoxide is converted to gaseous hydrocarbons and carbon dioxide in the FT reaction, which are inaccessible for further conversion in an IR and thus effectively represent a carbon loss. Although a slight improvement can be achieved through the introduction of CDR to the IR, the limitations regarding the maximum efficiency still persist. Implementing a steam reformer in the ER eliminates the limitations of IR gas cycles, as not only the gaseous hydrocarbons and carbon dioxide produced in the FT reaction can be converted to syngas, but also the gaseous hydrocarbons that enter the gas loop in the syngas. This also makes the gas loop design with an ER an especially attractive choice if a gasification technology yielding syngas with a high methane content like, for example, DFB gasification is applied [15,28]. In order to achieve a high carbon and chemical efficiency, however, TGR ratios greater than 3 are required.
The comparison of the required syngas H2/CO ratios reveals, however, that the use of an ER places high demands on the syngas. The fact that the required syngas H2/CO ratio for the IR concepts only ranges between the desired feed gas H2/CO ratio and the usage ratio is because the H2/CO ratio is, apart from the FTS, not further altered in the gas loop. In an ER, the H2/CO ratio of the recycled tail gas is significantly affected, as steam reforming generally produces a gas exhibiting a high H2/CO ratio with values usually exceeding 5 [15,23,30]. The required syngas H2/CO ratio for the ER gas cycle is, therefore, no longer around 2, but as low as 1.1. The hydrogen-lean syngas is required to compensate for the hydrogen-rich reformed tail gas. The required range lies well within the limits of what can generally be achieved via DFB steam gasification of biomass [28,40]. However, if the H2/CO ratio of the reformed tail gas is too high, this is traditionally addressed through one of the following two options:
The first option is using autothermal reforming instead of steam reforming, as it produces a gas with an H2/CO ratio that is naturally closer to that required for FTS. However, autothermal reforming requires large volumes of oxygen for reformer firing, which is industrially provided by an air separation unit. This is a viable solution for GTL and CTL plants where the air separation unit can be shared between the main method of syngas production (steam/oxygen gasification) and the tail gas reformer [15,23]. However, with DFB steam gasification, this would negate one of the main advantages of the DFB concept, i.e., the production of a largely nitrogen-free synthesis gas without the need for air separation. The second option is to purge excess hydrogen from the gas loop. In complex gas loop designs, the valuable hydrogen is typically recovered by pressure swing adsorption [15,23]. If that is not possible, the hydrogen-rich gas might simply be flared [17]. As neither of these options is particularly desirable for obvious reasons, two alternatives are proposed that are more suitable for small-scale BTL plants:
Firstly, the syngas H2/CO ratio can be deliberately decreased beyond what is possible with steam gasification by co-feeding carbon dioxide as a gasification agent. This can substantially decrease the H2/CO ratio to as low as 0.6 [41]. Secondly, the H2/CO ratio of the reformed tail gas can be decreased by co-feeding carbon dioxide to the steam reformer [15,42,43]. To a certain degree, this occurs naturally at higher TGR ratios due to the accumulation of carbon dioxide in the gas loop (see Figure 5). However, this can also be deliberately accelerated as it was demonstrated by reducing the separation efficiency of the CDR.
The variation of the carbon dioxide content (i.e., the variation of separation efficiency) showed some surprising results. This is because, unlike IR, where the introduction of CDR led to improved efficiency, ER generally achieved a higher efficiency with less or no CDR for a given TGR ratio. At low TGR ratios, this effect was almost negligible, but it became more significant with increasing TGR ratios. This is because, if carbon dioxide is removed during syngas conditioning, it is instantly removed from the gas loop and thus presents a carbon loss. If less carbon dioxide is removed during syngas conditioning, more carbon dioxide can potentially be converted to syngas and subsequently to syncrude. However, under the assumed boundary conditions, the maximum efficiency was severely limited at a separation efficiency of 0% due to the unreasonably high required syngas H2/CO ratios. To a lesser extent, this also applies to a separation efficiency of 50%.
With regard to the required syngas H2/CO ratio, reducing the carbon dioxide separation efficiency achieved the desired result of increasing the ratio. Thus, the separation efficiency respectively the carbon dioxide content in the conditioned syngas can be regarded as a parameter to control the required syngas H2/CO ratio. However, if the separation efficiency is reduced to below 50%, the carbon dioxide accumulates in the gas loop to such an extent that the tail gas reformer resembles dry reforming. The reformed tail gas is therefore so hydrogen-lean that very high syngas H2/CO ratios are required in order to operate at higher TGR ratios. Since the required syngas H2/CO ratios of greater than 3 are too high to be achieved conventionally with DFB steam gasification of biomass, some degree of CDR is required to achieve a high efficiency in the investigated scenario [44].
However, if the gas cycle is nonetheless to be operated with a low separation efficiency or without CDR at all, there are two possible approaches. Firstly, providing additional hydrogen from an external source (e.g., water electrolysis), essentially creating a hybrid Power- and Biomass-to-Liquids (PBTL) process [45,46,47,48]. As a rough estimate, a 100 MW DFB steam gasifier supplying syngas with the above composition would require an electrolyzer with a capacity of about 20 MW to increase the H2/CO ratio from the value resulting from the assumed syngas composition of 1.814 to 3, without the use of a WGS unit. If the biomass fuel capacity was matched with a 100 MW electrolyzer, theoretically an H2/CO ratio of up to 8 could be achieved. Secondly, instead of providing hydrogen from an external source, a hydrogen-richer gas can be produced in the tail gas reformer by increasing the steam-to-carbon ratio. The assumed steam-to-carbon ratios presents the most conservative estimation of the required steam to prevent carbon deposition. Within reason, it should be possible to increase this ratio at will to produce a hydrogen-richer gas.

3.3.3. Comparability of Results

Comparing the presented efficiencies with literature values, two important aspects should be considered. Firstly, as the model only included the FT gas loop and not the complete BTL process chain, the reported values have to be regarded as syngas-to-syncrude efficiencies. Losses incurred during feed preparation, and syngas production, as well as product refining and upgrading are not included. Secondly, the model did not take heat integration into account. The efficiency was, thus, calculated solely based on the chemical energy in the syngas respectively syncrude and referred to as chemical efficiency to avoid confusion with the commonly used thermal efficiency. Depending on whether additional energy input is required or surplus energy is generated, the actual thermal efficiency may be lower or higher than the chemical efficiency. For a rough estimate of the whole chain efficiency, the given values can be multiplied by the cold gas efficiency of syngas production, which, in the case of DFB steam gasification, is around 70% [49]. However, syncrude refining and upgrading, as well as heat integration, are still neglected.
To increase the reported chemical efficiency respectively the thermal efficiency, the output would have to be increased. This could be accomplished either by increasing the product range to light hydrocarbons and oxygenates or by selling surplus energy in the form of district heat and/or electricity. This, however, requires further investment costs, the availability of products in sufficient quantities, and adequate demand. This would also again increase the complexity, which is actually meant to be reduced. Carbon efficiency can be a useful indicator, especially if the products are not used as energy carriers [50]. In order to increase it, losses that are associated with the provision of energy, syngas conditioning, incomplete conversion, unselective conversion, and incomplete recovery have to be minimized [17,50].
Both the per-pass carbon monoxide conversion and the carbon number distribution were considered to be constant in the FTS model. This is a simplification, as they are known to be influenced by the H2/CO ratio of the syngas and the concentration of diluting components like methane in it [15,51]. The quantification of such effects and their incorporation should be the aim of the further development of the model.
It should finally be emphasized that the presented results are specifically valid for the assumed boundary conditions and operating parameters outlined in the Materials and Methods section. As demonstrated with the variation of the separation efficiency, if certain parameters or assumptions are changed, this can drastically alter the outcome. Further, the conducted parameter variation does neither allow to derive an optimum nor the maximum possible TGR ratio. The assumed boundary conditions do not impose any restrictions on the supply of external energy. If the process chain, however, is to be operated self-sufficiently, the TGR ratio will be limited by the amount of available tail gas, as it is typically used as fuel gas to cover the energy requirements of the process chain. This especially applies to the ER with steam reforming, as the steam reformer requires large amounts of energy at a high temperature. An accurate determination of the limit would thus require a comprehensive heat integration of the entire process. However, assuming that all of the discharged tail gas is available as fuel gas for firing the steam reformer and that the remaining energy demand of the plant can be covered by heat integration, the maximum feasible TGR ratio can be estimated to be around 2.7. As this is the point at which the energy demand of the steam reformer exceeds the chemical energy contained in the discarded tail gas. Determining the optimal TGR ratio, however, would require economic optimization. An optimization, for example, with regard to production costs would potentially reveal a point of diminishing returns at higher TGR ratios.

4. Conclusions

In order to investigate the opportunities and challenges in reducing the complexity of the FT gas loop of future small-scale facilities, three simple gas loop designs were proposed and analyzed with regard to their overall carbon monoxide conversion, and the carbon and chemical efficiencies, as well as the required syngas H2/CO ratio. Although all three gas loop designs were able to achieve an overall carbon monoxide conversion of greater than 90%, gas loops using an IR were severely limited in terms of carbon and chemical efficiencies. The introduction of CDR to the IR improved the performance only slightly, but could not overcome these limitations. To achieve adequate efficiency, a gas loop using an ER with steam reforming and a high TGR ratio greater than 3 is required.
Regarding the required syngas H2/CO ratio, the general rule of thumb that a ratio of about 2 is required for FTS was confirmed for gas loops using an IR, as the required ratio was between the desired feed gas H2/CO ratio of 1.9 and the stoichiometric usage ratio of 2.087. For gas loops featuring an ER with steam reforming, however, this rule did not hold true, since the steam reformer produced such a hydrogen-rich gas that a syngas with an H2/CO ratio as low as 1.1 was required to achieve the desired feed gas H2/CO ratio.
Carbon dioxide revealed an interesting influence in the gas loop with ER and steam reforming. In contrast to a gas loop using an IR, the use of CDR in a gas loop with an ER and steam reforming resulted in slightly decreased carbon and chemical efficiencies. However, the required syngas H2/CO ratio was strongly dependent on the carbon dioxide content respectively the separation efficiency. At low separation efficiencies, an ER with CDR was limited to low TGR ratios and, thus, low efficiencies due to an unreasonably high required syngas H2/CO ratio. Under the assumed conditions, a certain degree of CDR is therefore necessary to achieve high efficiencies. Operating the steam reformer at a higher steam-to-carbon ratio could likely also allow to operate an ER without CDR at high TGR ratios respectively high efficiencies. In any case, however, the degree of CDR can be selected at will as a parameter to control the required syngas H2/CO ratio without detrimental effects.

Author Contributions

Conceptualization, S.A. and G.W.; methodology, S.A. and R.R.; software, S.A.; validation, C.A. and R.R.; formal analysis, S.A.; investigation, S.A.; data curation, S.A.; writing—original draft preparation, S.A.; writing—review and editing, T.K., I.W., R.R., and H.H.; visualization, S.A., T.K., and I.W.; supervision, R.R. and H.H.; project administration, G.W.; funding acquisition, G.W. All authors have read and agreed to the published version of the manuscript.

Funding

The research leading to these results has received funding from the Federal Ministry for Climate Action, Environment, Energy, Mobility, Innovation and Technology (BMK), the Federal Ministry of Labor and Economy (BMAW), and the Federal States Vienna, Lower Austria, and Styria within the scope of the Austrian COMET—Competence Centers for Excellent Technologies program under the grant agreement No. 892426. The COMET program is managed by the Austrian Research Promotion Agency (FFG). Further funding was received from the Austrian Research Promotion Agency under the grant agreement No. 921965.

Data Availability Statement

The original contributions presented in this study are included in the article since all required parameters for the model are given and the results are reproducible. Further inquiries can be directed to the corresponding author.

Conflicts of Interest

Authors S.A., T.K., I.W., H.H. and G.W. were employed by the company BEST—Bioenergy and Sustainable Technologies GmbH. Author C.A. was employed by the company Aichernig Engineering GmbH. The remaining authors declare that the research was conducted in the absence of any commercial or financial relationships that could be construed as a potential conflict of interest.

Abbreviations

The following abbreviations are used in this manuscript:
BTLBiomass-to-Liquids
CTLCoal-to-Liquids
GTLGas-to-Liquids
CDRCarbon dioxide removal
CnHydrocarbon with n carbon atoms
DFBDual fluidized bed
eASFExtended Anderson–Schulz–Flory
ERExternal recycle
FTFischer–Tropsch
FTSFischer–Tropsch synthesis
IRInternal recycle
LHVLower heating value
PSAPressure swing adsorption
PTLPower-to-Liquids
PBTLPower- and Biomass-to-Liquids
SGSyngas
TGTail gas
TGRTail gas recycling
WGSWater–gas shift
WTLWaste-to-Liquids
XTLFeed-to-Liquids

Appendix A

Figure A1. Selectivity of the FTS as result of the selected process parameters.
Energies 18 05479 g0a1

References

  1. Grubler, A.; Johansson, T.B.; Mundaca, L.; Nakicenovic, N.; Pachauri, S.; Riahi, K.; Rogner, H.-H.; Strupeit, L.; Kolp, P.; Krey, V.; et al. Energy Primer. In Global Energy Assessment (GEA); Johansson, T.B., Nakicenovic, N., Patwardhan, A., Gomez-Echeverri, L., Eds.; Cambridge University Press: Cambridge, UK, 2012; pp. 99–150. ISBN 978-0-511-79367-7. [Google Scholar]
  2. IPCC. Climate Change 2023: Synthesis Report. Contribution of Working Groups I, II and III to the Sixth Assessment Report of the Intergovernmental Panel on Climate Change; Intergovernmental Panel on Climate Change: Geneva, Switzerland, 2023. [Google Scholar]
  3. IEA. World Energy Outlook 2024; International Energy Agency: Paris, France, 2024. [Google Scholar]
  4. IRENA. World Energy Transitions Outlook 2024: 1.5 °C Pathway; International Renewable Energy Agency: Abu Dhabi, United Arab Emirates, 2024. [Google Scholar]
  5. IEA. Net Zero Roadmap: A Global Pathway to Keep the 1.5 °C Goal in Reach; International Energy Agency: Paris, France, 2023. [Google Scholar]
  6. Maitlis, P.M. What Is Fischer–Tropsch? In Greener Fischer-Tropsch Processes for Fuels and Feedstocks; Maitlis, P.M., De Klerk, A., Eds.; Wiley: Weinheim, Germany, 2013; pp. 1–15. ISBN 978-3-527-32945-8. [Google Scholar]
  7. King, D.L.; De Klerk, A. Overview of Feed-to-Liquid (XTL) Conversion. In ACS Symposium Series; De Klerk, A., King, D.L., Eds.; American Chemical Society: Washington, DC, USA, 2011; Volume 1084, pp. 1–24. ISBN 978-0-8412-2681-4. [Google Scholar]
  8. Stranges, A. Germany’s Synthetic Fuel Industry, 1927–1945. In The German Chemical Industry in the Twentieth Century; Lesch, J.E., Ed.; Springer: Dordrecht, The Netherlands, 2000; pp. 147–216. ISBN 978-90-481-5529-3. [Google Scholar]
  9. Stranges, A.N. A History of the Fischer-Tropsch Synthesis in Germany 1926–45. In Fischer-Tropsch Synthesis, Catalyst and Catalysis; Davis, B.H., Occelli, M.L., Eds.; Studies in Surface Science and Catalysis; Elsevier: Amsterdam, The Netherlands, 2007; Volume 163, pp. 1–27. ISBN 978-0-444-52221-4. [Google Scholar]
  10. Schulz, H. Short History and Present Trends of Fischer–Tropsch Synthesis. Appl. Catal. Gen. 1999, 186, 3–12. [Google Scholar] [CrossRef]
  11. Dry, M.E. The Fischer–Tropsch Process: 1950–2000. Catal. Today 2002, 71, 227–241. [Google Scholar] [CrossRef]
  12. Martinelli, M.; Gnanamani, M.K.; LeViness, S.; Jacobs, G.; Shafer, W.D. An Overview of Fischer-Tropsch Synthesis: XtL Processes, Catalysts and Reactors. Appl. Catal. Gen. 2020, 608, 117740. [Google Scholar] [CrossRef]
  13. De Klerk, A.; Maitlis, P.M. What Can We Do with Fischer–Tropsch Products? In Greener Fischer-Tropsch Processes for Fuels and Feedstocks; Maitlis, P.M., De Klerk, A., Eds.; Wiley: Weinheim, Germany, 2013; pp. 81–105. ISBN 978-3-527-32945-8. [Google Scholar]
  14. Ali, S.A.; Bangash, I.A.; Sajjad, H.; Karim, M.A.; Ahmad, F.; Ahmad, M.; Habib, K.; Nasir Shah, S.; Sami, A.; Laghari, Z.A.; et al. Review on the Role of Electrofuels in Decarbonizing Hard-to-Abate Transportation Sectors: Advances, Challenges, and Future Directions. Energy Fuels 2025, 39, 5051–5098. [Google Scholar] [CrossRef]
  15. De Klerk, A. Fischer–Tropsch Refining, 1st ed.; Wiley: Weinheim, Germany, 2011; ISBN 978-3-527-32605-1. [Google Scholar]
  16. Vogt, E.T.C.; Weckhuysen, B.M. The Refinery of the Future. Nature 2024, 629, 295–306. [Google Scholar] [CrossRef] [PubMed]
  17. Dry, M.E.; Steynberg, A.P. Commercial FT Process Applications. In Fischer-Tropsch Technology; Steynberg, A.P., Dry, M.E., Eds.; Studies in Surface Science and Catalysis; Elsevier: Amsterdam, The Netherlands, 2004; Volume 152, pp. 406–481. ISBN 978-0-444-51354-0. [Google Scholar]
  18. Cornelisse, R.; Gort, R.; Westerink, P. Starting up Mega-Projects, Experiences with the Start-Up of Pearl GTL. In Proceedings of the SPE Production and Operations Symposium, Doha, Qatar, 14–16 May 2012; Society of Petroleum Engineers: Doha, Qatar, 2012; pp. 1386–1390. [Google Scholar]
  19. Zennaro, R. Fischer–Tropsch Process Economics. In Greener Fischer-Tropsch Processes for Fuels and Feedstocks; Maitlis, P.M., De Klerk, A., Eds.; Wiley: Weinheim, Germany, 2013; pp. 149–169. ISBN 978-3-527-32945-8. [Google Scholar]
  20. Maitlis, P.M.; De Klerk, A. New Directions, Challenges, and Opportunities. In Greener Fischer-Tropsch Processes for Fuels and Feedstocks; Maitlis, P.M., De Klerk, A., Eds.; Wiley: Weinheim, Germany, 2013; pp. 337–358. ISBN 978-3-527-32945-8. [Google Scholar]
  21. Li, Y.; De Klerk, A. Industrial Case Studies. In Greener Fischer-Tropsch Processes for Fuels and Feedstocks; Maitlis, P.M., De Klerk, A., Eds.; Wiley: Weinheim, Germany, 2013; pp. 107–129. ISBN 978-3-527-32945-8. [Google Scholar]
  22. De Klerk, A. Fischer–Tropsch Fuels Refinery Design. Energy Environ. Sci. 2011, 4, 1177. [Google Scholar] [CrossRef]
  23. Zennaro, R.; Ricci, M.; Bua, L.; Querci, C.; Carnelli, L.; d’Arminio Monforte, A. Syngas: The Basis of Fischer–Tropsch. In Greener Fischer-Tropsch Processes for Fuels and Feedstocks; Maitlis, P.M., De Klerk, A., Eds.; Wiley: Weinheim, Germany, 2013; pp. 17–51. ISBN 978-3-527-32945-8. [Google Scholar]
  24. Habermeyer, F.; Weyand, J.; Maier, S.; Kurkela, E.; Dietrich, R.-U. Power Biomass to Liquid—An Option for Europe’s Sustainable and Independent Aviation Fuel Production. Biomass Convers. Biorefinery 2024, 14, 16199–16217. [Google Scholar] [CrossRef]
  25. Klüh, D.; Gaderer, M. Integrating a Fischer Tropsch Process into a Pulp Mill—A Techno-Economic Assessment. Energy 2023, 285, 129015. [Google Scholar] [CrossRef]
  26. Pratschner, S.; Hammerschmid, M.; Müller, F.J.; Müller, S.; Winter, F. Simulation of a Pilot Scale Power-to-Liquid Plant Producing Synthetic Fuel and Wax by Combining Fischer–Tropsch Synthesis and SOEC. Energies 2022, 15, 4134. [Google Scholar] [CrossRef]
  27. Arlt, S. Renewable Carbon Refinery Based on Fischer–Tropsch Synthesis for Industrial Applications. Ph.D. Dissertation, Technische Universität Wien: Vienna, Austria, 2025. [Google Scholar] [CrossRef]
  28. Pfeifer, C.; Koppatz, S.; Hofbauer, H. Steam Gasification of Various Feedstocks at a Dual Fluidised Bed Gasifier: Impacts of Operation Conditions and Bed Materials. Biomass Convers. Biorefinery 2011, 1, 39–53. [Google Scholar] [CrossRef]
  29. Förtsch, D.; Pabst, K.; Groß-Hardt, E. The Product Distribution in Fischer–Tropsch Synthesis: An Extension of the ASF Model to Describe Common Deviations. Chem. Eng. Sci. 2015, 138, 333–346. [Google Scholar] [CrossRef]
  30. Reimert, R.; Marschner, F.; Renner, H.-J.; Boll, W.; Supp, E.; Brejc, M.; Liebner, W.; Schaub, G. Gas Production, 2. Processes. In Ullmann’s Encyclopedia of Industrial Chemistry; Wiley-VCH Verlag GmbH & Co. KGaA, Ed.; Wiley-VCH Verlag GmbH & Co. KGaA: Weinheim, Germany, 2011; pp. 423–482. ISBN 978-3-527-30673-2. [Google Scholar]
  31. Carbo, M.C.; Jansen, D.; Boon, J.; Dijkstra, J.W.; Van Den Brink, R.W.; Verkooijen, A.H.M. Staged Water-Gas Shift Configuration: Key to Efficiency Penalty Reduction during Pre-Combustion Decarbonisation in IGCC. Energy Procedia 2009, 1, 661–668. [Google Scholar] [CrossRef]
  32. Bartholomé, E.; Biekert, E.; Hellmann, H.; Ley, H.; Weigert, W.M.; Weise, E. Wachse bis Zündhölzer. In Ullmanns Encyklopädie der technischen Chemie; Verl. Chemie: Weinheim, Germany, 1983; ISBN 978-3-527-20024-5. [Google Scholar]
  33. De Klerk, A.; Li, Y.; Zennaro, R. Fischer–Tropsch Technology. In Greener Fischer-Tropsch Processes for Fuels and Feedstocks; Maitlis, P.M., De Klerk, A., Eds.; Wiley: Weinheim, Germany, 2013; pp. 53–79. ISBN 978-3-527-32945-8. [Google Scholar]
  34. De Klerk, A. Fischer–Tropsch Process. In Kirk-Othmer Encyclopedia of Chemical Technology; Kirk-Othmer, Ed.; Wiley: Weinheim, Germany, 2013; pp. 1–20. ISBN 978-0-471-48494-3. [Google Scholar]
  35. Dry, M.E. Chemical Concepts Used for Engineering Purposes. In Fischer-Tropsch Technology; Steynberg, A.P., Dry, M.E., Eds.; Studies in Surface Science and Catalysis; Elsevier: Amsterdam, The Netherlands, 2004; Volume 152, pp. 196–257. ISBN 978-0-444-51354-0. [Google Scholar]
  36. LeViness, S.; Deshmukh, S.R.; Richard, L.A.; Robota, H.J. Velocys Fischer-Tropsch Synthesis Technology—New Advances on State-of-the-Art. Top. Catal. 2014, 57, 518–525. [Google Scholar] [CrossRef]
  37. Dry, M.E. FT Catalysts. In Fischer-Tropsch Technology; Steynberg, A.P., Dry, M.E., Eds.; Studies in Surface Science and Catalysis; Elsevier: Amsterdam, The Netherlands, 2004; Volume 152, pp. 533–600. ISBN 978-0-444-51354-0. [Google Scholar]
  38. LeViness, S. Velocys Fischer-Tropsch Synthesis Technology—New Advances on the State of the Art. In Proceedings of the 245th ACS National Meeting, New Orleans, LA, USA, 7–11 April 2013. [Google Scholar]
  39. Steynberg, A.P.; Dry, M.E.; Davis, B.H.; Breman, B.B. Fischer-Tropsch Reactors. In Fischer-Tropsch Technology; Steynberg, A.P., Dry, M.E., Eds.; Studies in Surface Science and Catalysis; Elsevier: Amsterdam, The Netherlands, 2004; Volume 152, pp. 64–195. ISBN 978-0-444-51354-0. [Google Scholar]
  40. Hofbauer, H.; Rauch, R. Stoichiometric Water Consumption of Steam Gasification by the FICFB-Gasification Process. In Progress in Thermochemical Biomass Conversion; Bridgwater, A.V., Ed.; Wiley: Weinheim, Germany, 2001; pp. 199–208. ISBN 978-0-632-05533-3. [Google Scholar]
  41. Mauerhofer, A.M.; Fuchs, J.; Müller, S.; Benedikt, F.; Schmid, J.C.; Hofbauer, H. CO2 Gasification in a Dual Fluidized Bed Reactor System: Impact on the Product Gas Composition. Fuel 2019, 253, 1605–1616. [Google Scholar] [CrossRef]
  42. Jager, B. Developments in Fischer-Tropsch Technology. In Natural Gas Conversion V; Parmaliana, A., Sanfilippo, D., Frusteri, F., Vaccari, A., Arena, F., Eds.; Studies in Surface Science and Catalysis; Elsevier: Amsterdam, The Netherlands, 1998; Volume 119, pp. 25–34. ISBN 978-0-444-82967-2. [Google Scholar]
  43. Aasberg-Petersen, K.; Christensen, T.S.; Dybkjaer, I.; Sehested, J.; Østberg, M.; Coertzen, R.M.; Keyser, M.J.; Steynberg, A.P. Synthesis Gas Production for FT Synthesis. In Fischer-Tropsch Technology; Steynberg, A.P., Dry, M.E., Eds.; Studies in Surface Science and Catalysis; Elsevier: Amsterdam, The Netherlands, 2004; Volume 152, pp. 258–405. ISBN 978-0-444-51354-0. [Google Scholar]
  44. Fuchs, J.; Schmid, J.C.; Müller, S.; Hofbauer, H. Dual Fluidized Bed Gasification of Biomass with Selective Carbon Dioxide Removal and Limestone as Bed Material: A Review. Renew. Sustain. Energy Rev. 2019, 107, 212–231. [Google Scholar] [CrossRef]
  45. Müller, S.; Groß, P.; Rauch, R.; Zweiler, R.; Aichernig, C.; Fuchs, M.; Hofbauer, H. Production of Diesel from Biomass and Wind Power—Energy Storage by the Use of the Fischer-Tropsch Process. Biomass Convers. Biorefinery 2018, 8, 275–282. [Google Scholar] [CrossRef]
  46. Hillestad, M.; Ostadi, M.; Alamo Serrano, G.d.; Rytter, E.; Austbø, B.; Pharoah, J.G.; Burheim, O.S. Improving Carbon Efficiency and Profitability of the Biomass to Liquid Process with Hydrogen from Renewable Power. Fuel 2018, 234, 1431–1451. [Google Scholar] [CrossRef]
  47. Ostadi, M.; Rytter, E.; Hillestad, M. Boosting Carbon Efficiency of the Biomass to Liquid Process with Hydrogen from Power: The Effect of H2/CO Ratio to the Fischer-Tropsch Reactors on the Production and Power Consumption. Biomass Bioenergy 2019, 127, 105282. [Google Scholar] [CrossRef]
  48. Gruber, H.; Groß, P.; Rauch, R.; Reichhold, A.; Zweiler, R.; Aichernig, C.; Müller, S.; Ataimisch, N.; Hofbauer, H. Fischer-Tropsch Products from Biomass-Derived Syngas and Renewable Hydrogen. Biomass Convers. Biorefinery 2021, 11, 2281–2292. [Google Scholar] [CrossRef]
  49. Benedikt, F.; Müller, S.; Hofbauer, H. 1 MW Scale-up of the Advanced Fuel Flexible Dual Fluidized Bed Steam Gasification Process by Process Simulation. In Proceedings of the ICPS 19, Vienna, Austria, 18–20 November 2019; Technische Universität Wien: Vienna, Austria, 2019; pp. 131–139. [Google Scholar]
  50. De Klerk, A. Indirect Liquefaction Carbon Efficiency. In ACS Symposium Series; De Klerk, A., King, D.L., Eds.; American Chemical Society: Washington, DC, USA, 2011; Volume 1084, pp. 215–235. ISBN 978-0-8412-2681-4. [Google Scholar]
  51. Gibson, E.J.; Hall, C.C. Fischer-tropsch Synthesis with Cobalt Catalysts. II. The Effect of Nitrogen, Carbon Dioxide and Methane in the Synthesis Gas. J. Appl. Chem. 1954, 4, 464–468. [Google Scholar] [CrossRef]
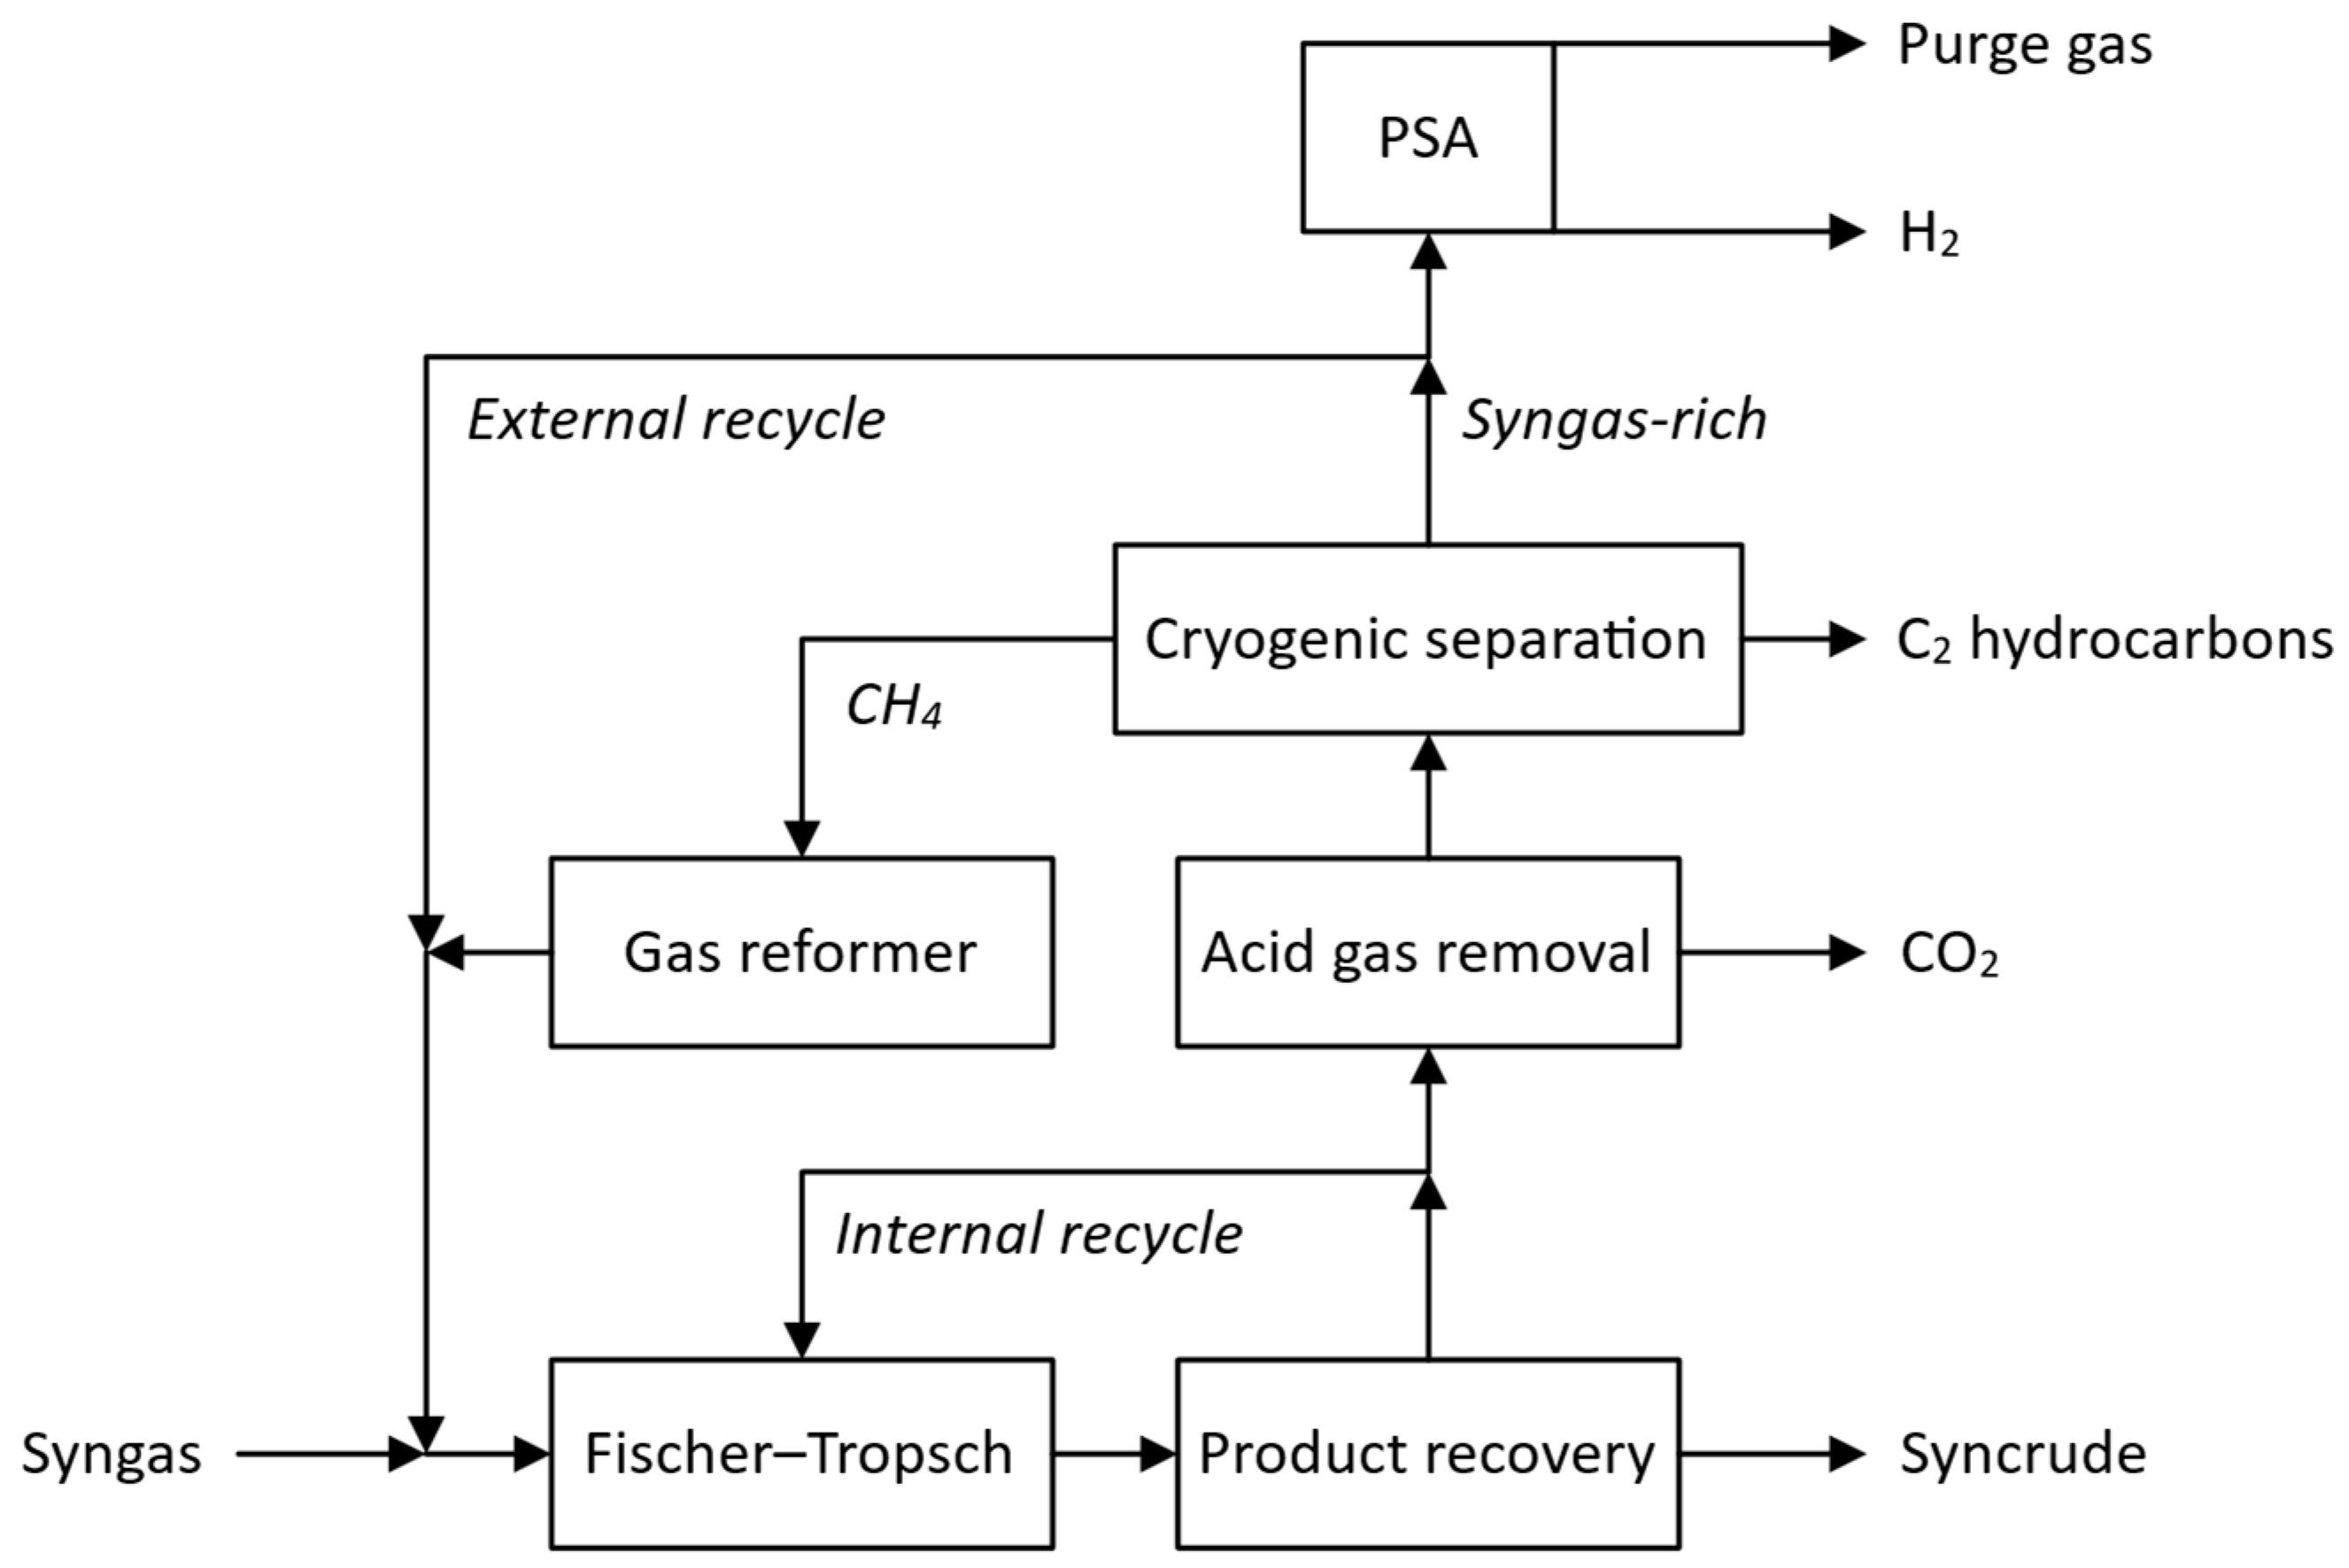
Figure 1. Generic closed FT gas loop featuring an internal and external recycle [15].
Energies 18 05479 g001
Figure 2. Gas loop designs with (a) an internal recycle (IR), (b) an internal recycle with upstream carbon dioxide removal (IR/CDR), and (c) an external recycle with steam reforming and upstream carbon dioxide removal (ER/CDR) [27].
Energies 18 05479 g002
Figure 3. Overall CO conversion as a function of TGR ratio for the three different gas loop designs.
Energies 18 05479 g003
Figure 4. Carbon (a) and chemical efficiency (b) as a function of TGR ratio for the three different gas loop designs.
Energies 18 05479 g004
Figure 5. Required syngas H2/CO ratio as a function of TGR ratio for the three different gas loop designs.
Energies 18 05479 g005
Figure 6. Carbon (a) and chemical efficiency (b) as a function of TGR ratio for different CO2 separation efficiencies in ER/CDR configuration.
Energies 18 05479 g006
Figure 7. Required syngas H2/CO ratio as a function of TGR ratio for different CO2 separation efficiencies in ER/CDR configuration.
Energies 18 05479 g007
Table 1. Reference ranges and assumed syngas composition [27].
CompoundVolume fraction (%)
Reference [28]Assumed (Dry)Assumed
Hydrogen36–4239.0032.01
Carbon monoxide19–2421.5017.65
Carbon dioxide20–2522.5018.47
Methane9–1210.508.62
Ethene2.0–2.6aa
Ethane1.3–1.83.853.16
Propane0.3–0.60.450.37
Nitrogen2.20 b1.80
Water17.92 c
a Included as ethane. b Assumed as the remainder of the sum to 100%. c Saturation at 60 °C and 1.013 bar.
Table 2. Summary of process parameters for the FTS.
ParameterSymbolValueUnit
Per pass CO conversion X C O , p e r   p a s s 60.00%
Chain growth probability of first distribution α 0.90
Chain growth probability of second distribution α 0.90
Re-adsorption probability of C2 β 0.50
Enhancement factor of C1 γ 0.50
Molar fraction of second distribution μ 0.00
CO2 selectivity S C O 2 3.00%
Disclaimer/Publisher’s Note: The statements, opinions and data contained in all publications are solely those of the individual author(s) and contributor(s) and not of MDPI and/or the editor(s). MDPI and/or the editor(s) disclaim responsibility for any injury to people or property resulting from any ideas, methods, instructions or products referred to in the content.