Article

Impact of Short Circuit Ratio on Harmonic Distortion in Offshore Wind Farm Integration

1
School of Electrical Engineering, Korea University, Seoul 02841, Republic of Korea
2
HD Hyundai Electric, Seongnam-si 13553, Republic of Korea
*
Author to whom correspondence should be addressed.
Energies 2025, 18(20), 5480; https://doi.org/10.3390/en18205480
Submission received: 5 September 2025 / Revised: 1 October 2025 / Accepted: 10 October 2025 / Published: 17 October 2025

Abstract

Offshore wind energy is rapidly expanding as a critical resource for global carbon neutrality, with 10.8 GW of new capacity added in 2023, raising the worldwide total to 75.2 GW. However, large-scale integration of offshore wind farms introduces power quality challenges due to the characteristics of inverter-based resources, particularly harmonic distortion, which can threaten system stability. This study quantitatively investigates the influence of short circuit ratio (SCR) on voltage and current harmonic distortion during offshore wind farm integration. A 500 MW offshore wind farm was modeled, and MATLAB/Simulink simulations were performed for 345 kV and 154 kV systems to evaluate the impact of varying SCR on total harmonic distortion (THD) and individual harmonic orders. Furthermore, the harmonic assessment based on the IEC 61400-21-2 summation method was compared with the simulation results, demonstrating the limitations of the simple summation approach and underscoring the importance of simulation-based evaluation. The results reveal that, under certain SCR conditions, parallel resonance caused by system impedance and line parameters produces unexpectedly high distortion in the 345 kV system, contrary to expectations based solely on voltage level. This resonance phenomenon and SCR dependency were also validated using short circuit capacity data from actual offshore wind farm candidate sites. Overall, the study emphasizes the necessity of comprehensive power quality assessments that account for SCR conditions, voltage levels, and harmonic emission characteristics, providing practical guidance for site selection, substation design, and harmonic mitigation in offshore wind integration.

1. Introduction

Offshore wind has become one of the fastest-growing renewable energy sources, driven by global decarbonization initiatives and policies support renewable energy deployment [1,2,3,4]. In 2023 alone, 10.8 GW of new offshore wind capacity was installed worldwide, raising the cumulative total to 75.2 GW [5]. This rapid expansion not only strengthens the global energy supply but also introduces technical challenges related to grid stability and power quality. Offshore wind farms are categorized as inverter-based resources (IBRs), which differ fundamentally from conventional synchronous machine–based systems. They are characterized by low inertia, delayed reactive power response, and harmonic emissions [6,7].
As offshore wind farms increase in scale and distance from shore, power collection, step-up, and transmission via offshore substations have become widely adopted. Some farms connected to the grid at extra-high voltages that exceed conventional interconnection levels [8,9]. Offshore substations are increasingly incorporating HVDC converters, high-reliability protection and control systems, and remote monitoring functionalities. While these technologies enhance operational stability and grid integration efficiency, they also add to system complexity [10,11,12]. High-voltage interconnections and long-distance transmissions require sophisticated grid-operation strategies and thorough impact assessments. In particular, the power quality of offshore wind farms can directly affect system robustness, potentially leading to voltage distortions, power losses, or frequency fluctuations. Therefore, a comprehensive power quality analysis that accounts for both wind farm design and grid operating conditions is essential before site selection and operation. In this study, interconnection voltages of 154 kV and 345 kV are selected as representative HV/EHV levels. These are the most common for large-scale offshore wind farm integration and thus serve as the focus of our analysis of system power quality and stability.
Power quality issues such as harmonics and voltage fluctuations are strongly influenced by the short circuit ratio (SCR). Previous studies have shown that when offshore wind farms connect to weak or moderately strong grids, voltage variations and stability challenges can occur depending on substation robustness and transmission configurations [13,14]. For example, Monjo [15] demonstrated that parallel resonance phenomena can amplify specific harmonic orders, thereby increasing voltage distortion. This indicates that systems with lower SCRs are more vulnerable to harmonic instabilities, underscoring the need for a systematic evaluation of SCR-dependent harmonic behavior. Related studies [16,17] analyzed harmonic instabilities and resonance effects under low-SCR conditions, while others [18,19] examined methods to enhance system strength. Under low-SCR conditions, phenomena such as harmonic instabilities and overvoltage events were documented, along with resonance phenomena that magnified particular harmonic orders [16,17]. Additionally, the use of system strength indices, including weighted short circuit ratio (WSCR) and composite short circuit ratio (CSCR), enabled a more precise evaluation of voltage stability under multiple wind farm integrations into weak grids. Previous studies also demonstrated that the system strength could be enhanced through the deployment of synchronous condensers or flexible AC transmission system (FACTS) devices [18,19].
Power quality in offshore wind farms fundamentally evaluated according to the IEC 61400-21 series and the associated IEC and IEEE guidelines. IEC 61400-21 specifies evaluation criteria for the voltage fluctuations, flicker, harmonics, and reactive power characteristics of wind turbines and wind farms [20], whereas IEC 61000-4-7, -4-15, and -4-30 provide guidelines for measurement methodologies and data accuracy [21,22,23]. Furthermore, IEC 61000-3-6 and IEC 61000-3-7 establish permissible thresholds for the measured parameters [24,25], and IEEE Std 519 prescribes acceptable limits of harmonic current and voltage distortion [26]. IEEE Std 2800 recommends harmonic current limits based on the rated current of wind farms [27], and IEEE Std 1547 delineates the grid interconnection requirements for distributed energy resources and serves as a reference for evaluating wind farm interconnection processes [28].
Although international standards mainly specify standard limits at the point of common coupling (PCC), they do not adequately address how interconnection conditions, particularly variations in SCR, affect power quality. Furthermore, many previous studies, including Monjo [15], did not systematically examine the effects of SCR variation on harmonic distortion in large offshore wind farms. Existing research predominantly concentrated on assessing power quality characteristics at the wind farm or turbine level, or on comparing simulation results with international standards. For instance, Both Alfalahi et al. [29] and Li et al. [30] evaluated harmonic distortion in wind farms by assessing whether voltage and current THD levels comply with IEEE 519 limits, with Alfalahi focusing on an on-grid system and Li on an offshore wind farm system. In addition, Lu et al. [31], Magesh et al. [32], Kocatepe et al. [33], and Xia et al. [34] examined field measurements and simulation outcomes from actual wind farms to determine the compliance with grid regulations concerning frequency, voltage fluctuations, voltage flicker, and harmonics at the PCC. Liang [35] and Shao et al. [36] explored the power quality issues associated with renewable energy integration, including voltage fluctuations, frequency variations, and harmonic emissions, and conducted relevant analyses and evaluations. However, these studies primarily focused on wind farm characteristics rather than systematically exploring how interconnection conditions such as SCR influence power quality. While it has been hypothesized that systems with lower SCR are more prone to severe voltage distortion even under identical harmonic current emissions, quantitative validation of this relationship remains limited.
Previous studies have primarily investigated the influence of grid strength on harmonic distortion in power systems. Hoseinzadeh et al. [37] analyzed how variations in grid impedance affect harmonic emissions of grid-connected inverters, showing that lower SCR generally leads to higher THD. Nakhodchi and Bollen [38] evaluated the safe harmonic hosting capacity, demonstrating that higher grid impedance can cause harmonic voltages to reach their limits more quickly under the same harmonic current, thereby reducing the number of devices that can be safely connected. ABB’s Technical Guide No. 6 [39] describes the causes and effects of harmonics in AC drives and provides methods for assessing and mitigating harmonic impact while considering grid impedance. Cobben et al. [40] discussed updating harmonic voltage limits considering both network characteristics and inverter behavior.
While these studies show the general trend that weaker grids or higher grid imped-ance lead to elevated harmonic levels, they largely overlook the effects of parallel resonance, which can selectively amplify specific harmonic orders independently of the overall grid impedance. As a result, the relationship between grid impedance and THD is not strictly monotonic, particularly in systems prone to resonance phenomena. This study addresses this gap by investigating harmonic behavior in the presence of parallel resonance. Unlike prior works, the analysis demonstrates that higher grid impedance does not necessarily correspond to higher THD, highlighting the critical role of network resonance in shaping voltage and current harmonic profiles in modern power systems with high penetration of inverter-based resources.
Accordingly, we quantitatively analyze the impact of harmonic current emissions from offshore wind farms on system voltage distortion, including the THD and individual harmonic components, under various SCR conditions. This analysis clarifies how changes in the SCR affect compliance with IEC and IEEE standards and provides a practical basis for offshore wind farm site selection and grid impact assessment. Multiple scenarios are examined to comprehensively capture the correlation between SCR variations and harmonic impacts.
The contributions of this paper are briefly summarized as follows:
  • This study investigates the relationship between SCR and THD in offshore wind farms at 154 kV and 345 kV through detailed simulations. In the 345 kV system, THD shows non-monotonic variations due to shifting resonance bands. Approximate SCR ranges that minimize resonance effects are identified: above ~14 for 154 kV and above ~71 for 345 kV, providing practical guidance for wind farm design.
  • Harmonic levels from the IEC 61400-21-2 summation method are compared with simulation results under various SCR conditions. Significant deviations, particularly around the 11th to 13th harmonics, indicate that simulations are necessary in low- to medium-SCR systems for accurate harmonic assessment.
  • Seasonal load variations are used to estimate SCR distributions for 66 candidate offshore wind farm sites, enabling evaluation of voltage THD across actual sites and highlighting the importance of SCR and harmonic interactions in integration planning.
The remainder of this paper is organized as follows. Section 2 describes the standard framework for harmonic assessment and details of the simulation model. Section 3 presents the simulation results under various SCR conditions, and Section 4 analyzes the THD distributions based on the actual SCR data. Section 5 discusses the results, and Section 6 concludes the paper with the major findings.

2. Proposed Methodology

This study aims to quantitatively analyze the impact of harmonic current emissions from offshore wind farms on voltage and current harmonic distortion under different SCR conditions. To achieve this, a simulation-based analytical framework was established, and power quality performance was evaluated across a range of system strength scenarios. This section introduces the standard framework for harmonic measurement and analysis, followed by a detailed description of the simulation model configuration and procedures.

2.1. Simulation Model Configuration

To analyze the impact of the SCR on harmonic distortion, a 500 MW offshore wind farm was modeled. The wind farm consisted of 25 identical 20 MW wind turbines, each represented as an equivalent current source injecting harmonic currents from the 2nd to the 50th order into phases A, B, and C. For simplicity, all turbines were assumed to be identical in ratings and harmonic behavior, providing a baseline scenario for system-level harmonic assessment. Each turbine was connected to the feeder through a 66 kV/8.27 kV transformer, and the distance between the turbines was set to 200 m. The infinite bus was modeled with an adjustable short circuit capacity, enabling simulations under varying SCR conditions, while the X/R ratio was fixed at 7 for consistency. According to IEEE classification, the 154 kV and 345 kV systems fall into the high- and extra-high-voltage categories, respectively, and were modeled with identical line parameters. In contrast, the 66 kV medium-voltage system was assigned different line parameters. The parameters of the infinite bus, transmission lines, and transformers are summarized in Table 1, Table 2 and Table 3.
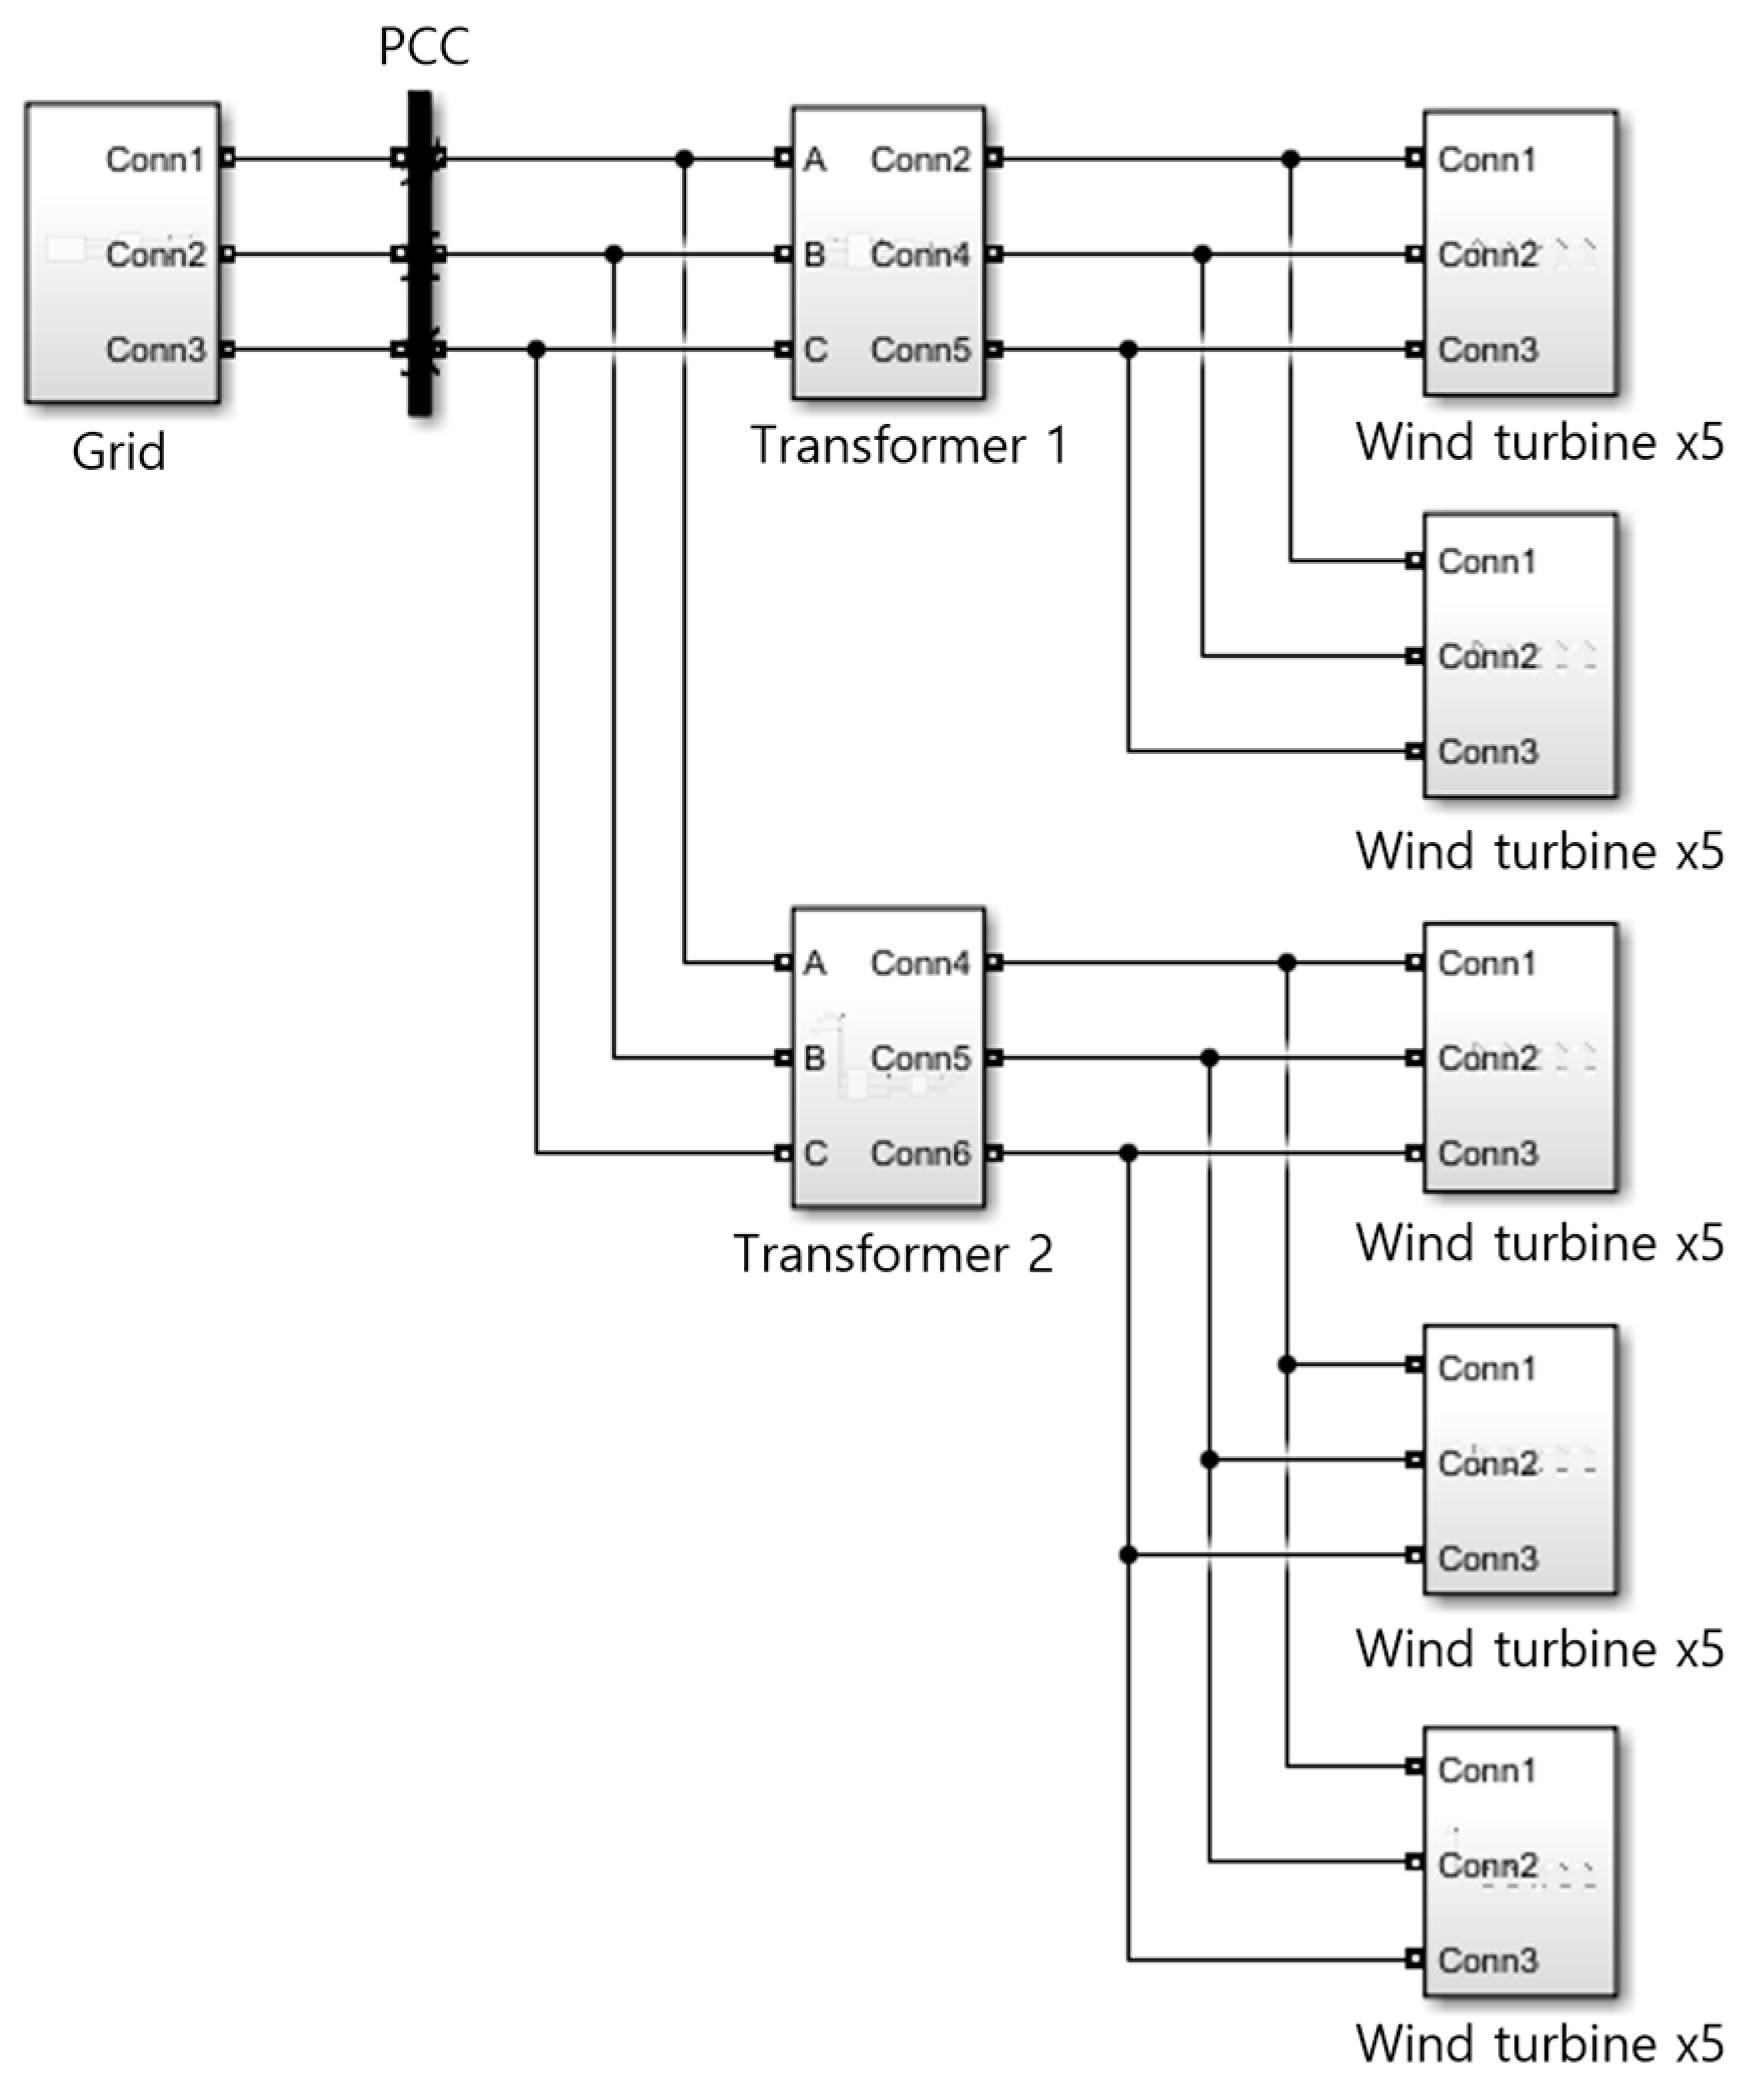
The wind farm was divided into five feeders, two of which were connected in parallel to 300 MVA transformers, and three were connected in parallel to 400 MVA transformers. The distance from each transformer to its respective feeder was 1.5 km, and the distance from the transformer to the main grid was 10 km. All transformers were assumed to have a turns ratio of 1:1. Figure 1 presents the single-line diagram of the modeled wind farm, and Figure 2 shows its Simulink implementation.
The harmonic current spectrum of each turbine is shown in Table 4. The 11th, 12th, and 13th harmonics were particularly dominant. The harmonic levels were based on the WTG spectrum reported in Wind Farm and System Modelling Evaluation in Harmonic Propagation Studies, with minor adjustments for missing harmonics (e.g., the 3rd harmonic was set equal to the 2nd) to ensure representation up to the 50th order. This approach is consistent with IEC 61000-4-7, IEC 61400-21, and IEEE Std 519, which recommend including harmonics up to the 50th order for practical assessment of high-order components affecting system voltage distortion.
The model was implemented in a MATLAB/Simulink R2024a, and an FFT-based analysis tool was employed for harmonic analysis. The voltage levels were set to 345 kV and 154 kV, reflecting real-world offshore wind integration cases. The simulations were repeated for SCR values of 1, 10, 50, and 100. For each scenario, the harmonic voltage and current components at the PCC were calculated, and compliance with the previously defined IEEE standards was assessed to determine any exceedances of the standard limits.

2.2. Concept of the Summation Method

In addition to simulation analysis, harmonic estimation was also performed using the summation method defined in IEC 61400-21-2. This method approximates the total harmonic current of the entire wind farm by aggregating the harmonic currents of individual turbines with weighting factors. Specifically, each turbine’s h-th-order harmonic current is first adjusted according to its transformer turns ratio and then combined with the contributions from all turbines. Higher-order harmonics are assigned higher weighting factors, with 1.0 for harmonics below the 5th order, 1.4 for harmonics from the 5th to 9th order, and 2.0 for the 10th order and above. The harmonic current spectrum of each turbine was derived from pre-existing test reports, and this aggregation approach thus represents a widely used standard predictive method in the industry. It is important to note that the summation method accounts only for integer-order harmonics in accordance with IEC 61400-21-2, and interharmonics are excluded.

3. Simulations

The harmonic impact of the offshore wind farm model introduced in Section 2 was evaluated using the harmonic current data of individual wind turbines. The test system consisted of a 500 MW wind farm with 25 identical 20 MW turbines connected through 66 kV/8.27 kV transformers and aggregated at the 345 kV and 154 kV levels, as detailed in Table 1, Table 2, Table 3 and Table 4, and Figure 1. A preliminary assessment was performed using the summation method, and detailed time-domain simulations in MATLAB/Simulink with FFT analysis were conducted to determine THD and the contribution of each harmonic order.

3.1. Standard Framework for Harmonic Assessment

The measurement and frequency-domain analysis of the harmonic voltages and currents were conducted in accordance with the IEC standards. The measurement methodologies and spectral analysis procedures adhered to the provisions of IEC 61400-21-1, IEC 61400-21-2, and IEC 61000-4-7, whereas the assessment of voltage flicker and measurement accuracy was based on IEC 61000-4-15 and IEC 61000-4-30. The obtained harmonic data were subsequently evaluated against the standard limits established by the IEEE standards.
IEEE Std 519 and IEEE Std 2800 were adopted as the reference standards for voltage and current harmonics, respectively. For voltage harmonics, the standard limits are a THD of up to 1.5% and individual harmonic components not exceeding 1.0% at the 345 kV level, while at 154 kV the limits are 2.5% for THD and 1.5% for individual components [24]. For current harmonics, the maximum total rated distortion (TRD) is 2.0% at 345 kV and 2.5% at 154 kV. In addition, IEEE Std 2800 defines limits for individual harmonic orders. The 2nd, 4th, and 6th harmonics are restricted to 1.0%, 2.0%, and 3.0%, respectively, while for odd harmonics the limits are 2.0% for orders below the 11th and 1.0% for orders between the 11th and 50th at 154 kV, and 1.5% and 1.0% for the corresponding ranges at 345 kV [25]. It is noted that IEC 61000-3-6 and the KEPCO Grid Code specify similar limits, with the main difference being that at 154 kV the permissible THD is 2.0% rather than 2.5%. Therefore, the application of IEEE Std 519 in this study remains broadly consistent with both international and Korean standards.

3.2. Comparison Based on the Summation Method

First, the harmonic currents for each order were predicted using the summation method defined in IEC 61400-21-2, with the results summarized in Table 5. Although the summation method is easy to apply, it cannot fully capture the factors affecting the harmonics in an actual power system, as shown in simulation studies. Therefore, although it can help evaluate the risk of specific harmonic orders, it is not suitable for detailed offshore substation design, such as filter implementation. The 11th, 12th, and 13th harmonic currents exceeded the standard limit of 1% by 1.46%, 1.46%, and 1.85%, respectively.
A simulation-based assessment of individual harmonics was conducted for the 345 kV and 154 kV systems. Results indicate that the 11th, 12th, and 13th harmonic currents exceeded allowable thresholds under all SCR conditions. Comparison between the predictions obtained using the summation method and the simulation results confirmed that the exceedances were consistent. The individual current distortion, expressed as a percentage of the rated current, was largely unaffected by variations in the SCR, suggesting that SCR modifications exert only a limited influence on the harmonic levels of the current. This can be explained by the fact that harmonic current levels are mainly determined by the characteristics of the wind turbine converters, whereas voltage distortion is more sensitive to changes in SCR due to its effect on grid impedance.
To supplement this analysis, Table 6 summarizes the harmonic current amplitudes at representative SCR values for both the 154 kV and 345 kV systems. The comparison shows that while both methods indicate exceedances at the 11th–13th orders, the summation method slightly overestimates the harmonic amplitudes due to phase dispersion effects, whereas simulation reflects more accurately the reduction in total harmonic current. This highlights the importance of considering phase dispersion when predicting harmonic currents in actual offshore wind farm systems.

3.3. Harmonic Assessment Based on SCR

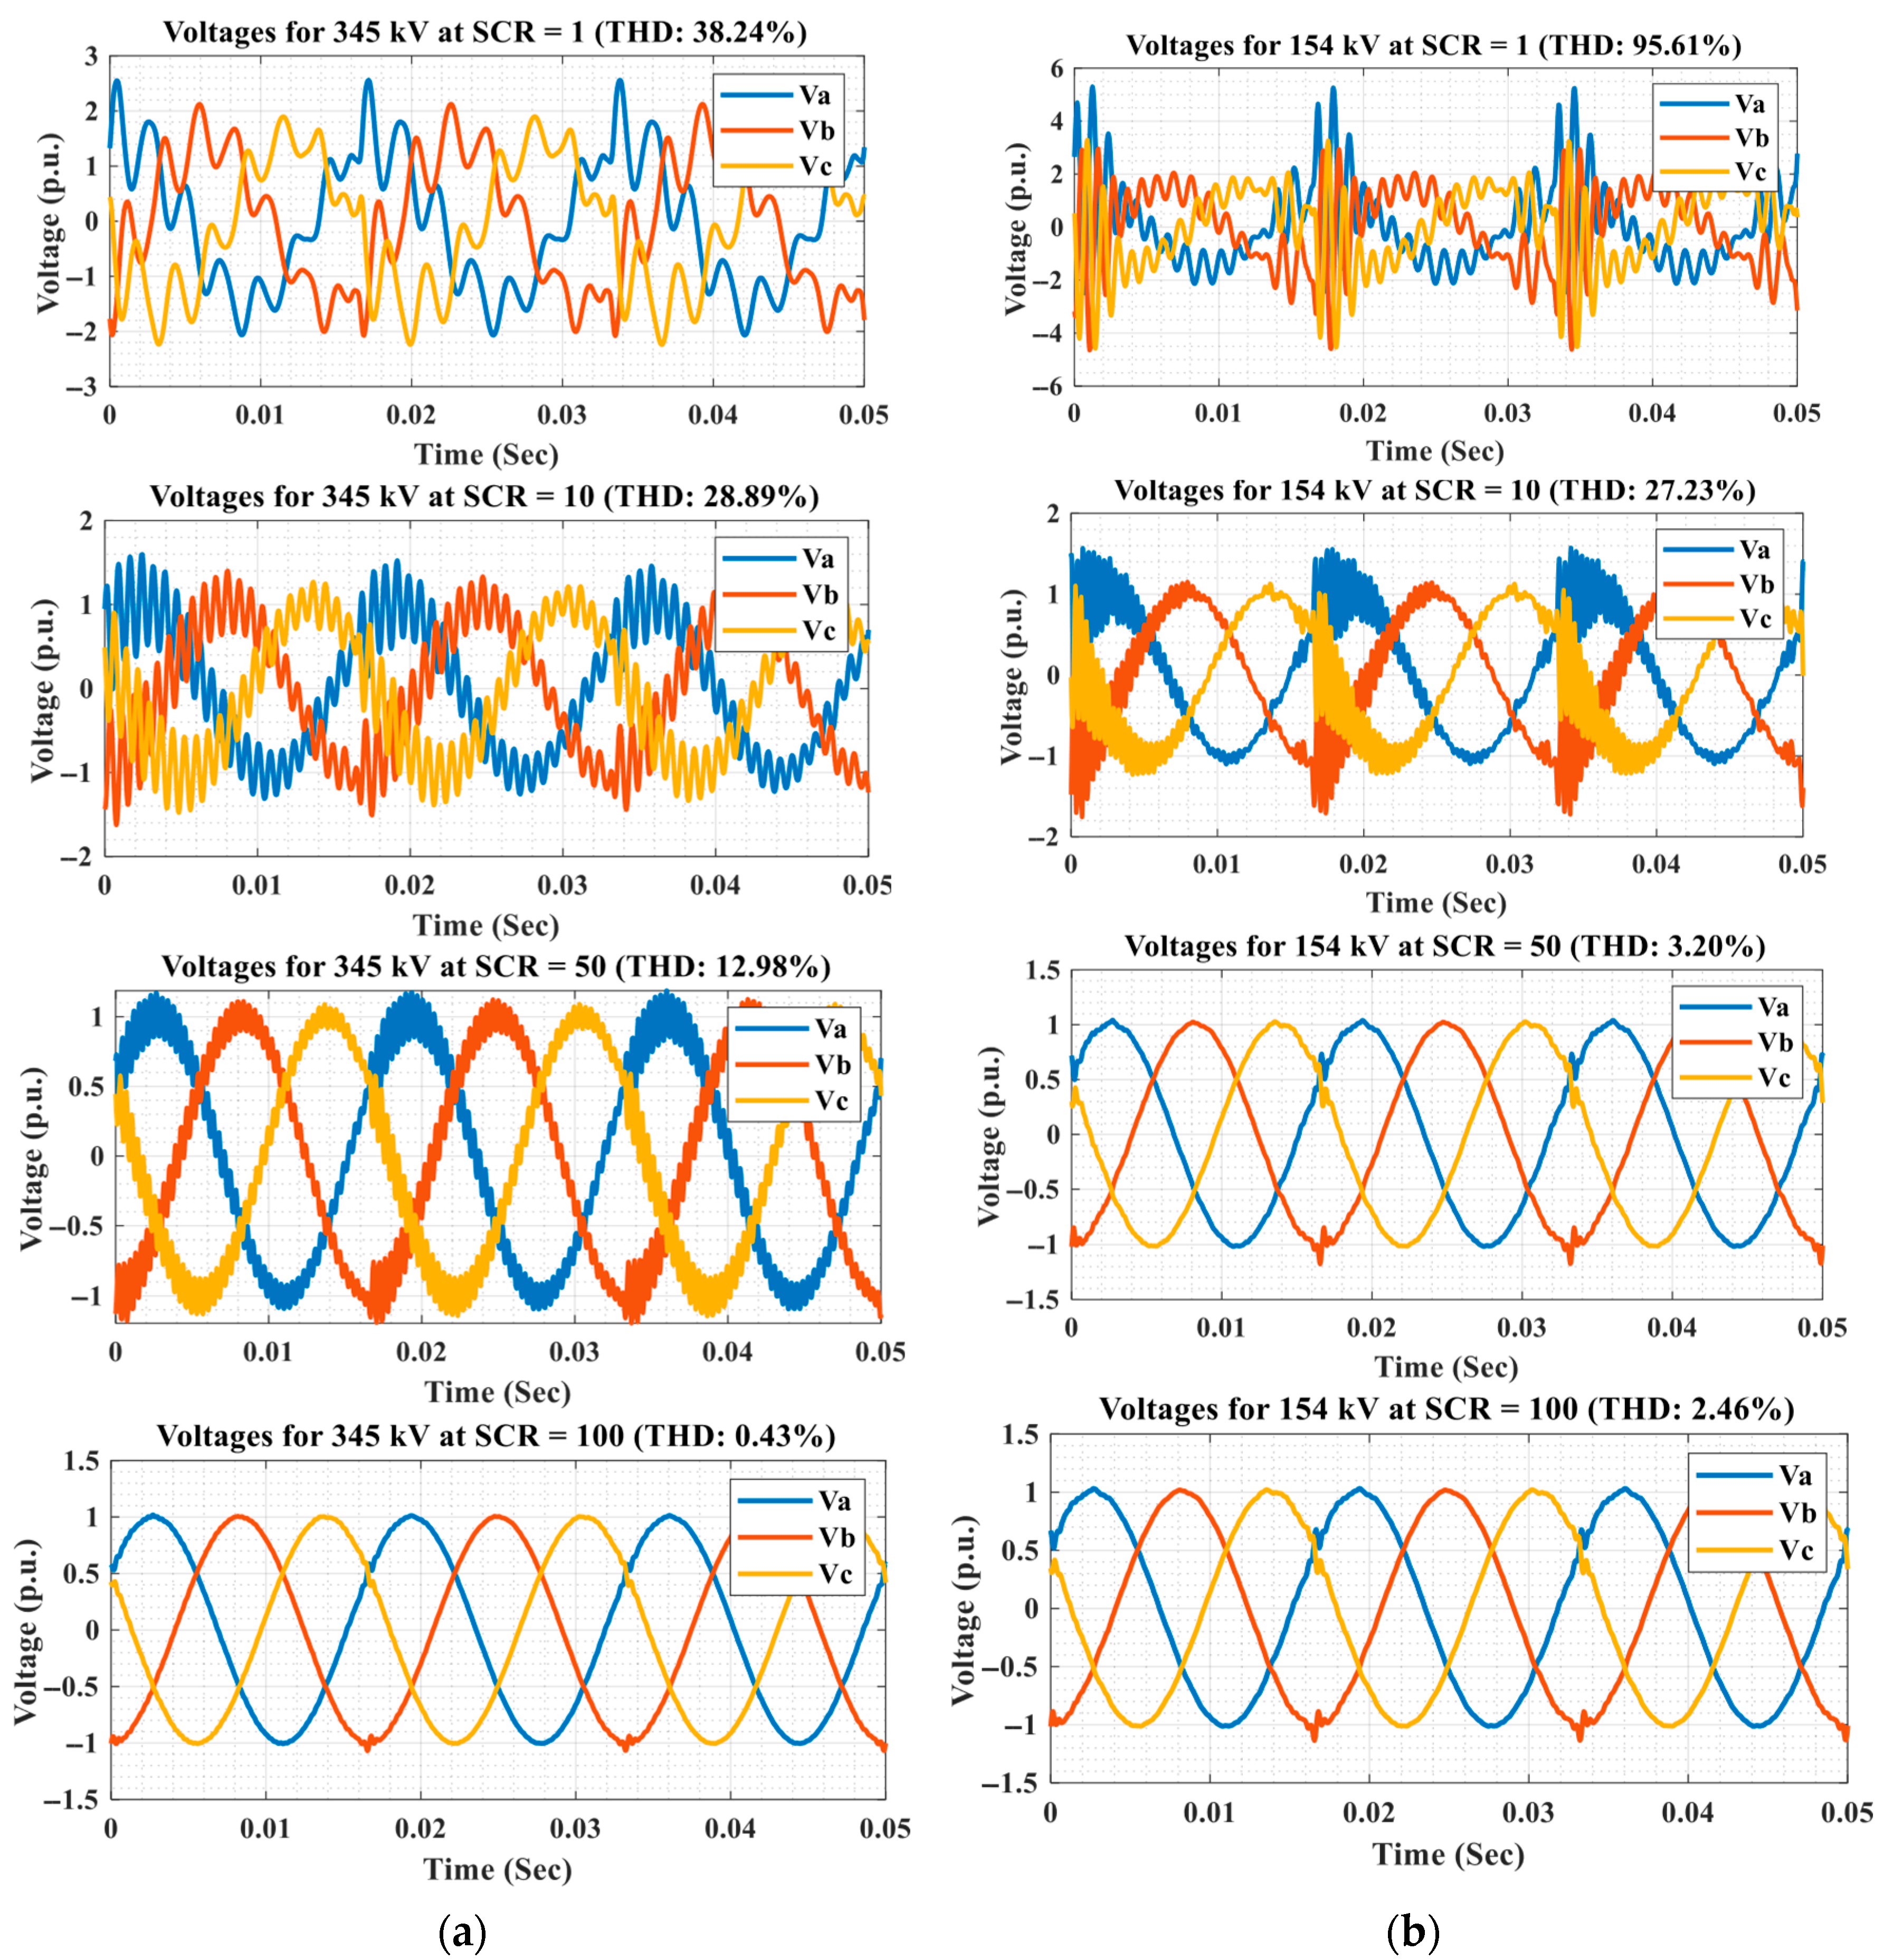
Voltage waveforms at the PCC under various SCR conditions for the 345 kV and 154 kV systems are shown in Figure 3. Additionally, the corresponding THD analysis results under these identical conditions are presented in Table 7.
As the SCR increases, voltage THD decreases across all voltage levels. In particular, only when the SCR reached 100 did the 345 kV system comply with the limit of 1.5%, whereas the 154 kV system adhered to the limit of 2.5%. Under low-SCR conditions, both systems exceeded the permissible thresholds. Higher SCR indicates a more robust grid with a greater ability to maintain voltage stability, and the voltage distortion caused by harmonic current sources is relatively lower in such resilient systems. Although higher voltage levels are generally expected to reduce harmonic distortions, the simulation results show that at SCR values of 1 and 100, the 345 kV system had lower THD, whereas at SCR values of 10 and 50, it had higher THD. These results suggest the possible influence of the parallel resonance phenomena arising from the infinite bus and transmission lines.
In this simulation, harmonics were modeled as current sources connected to the system. Their impact depends on the Thevenin impedance of the transmission line and the infinite bus. The total series reactance, L t o t , was defined as the sum of the transmission line and infinite bus reactances, where the infinite bus reactance was calculated based on its short circuit capacity and nominal voltage, considering an X/R ratio of 7. The total capacitance, C , was taken from the transmission line capacitance only, while shunt conductance was considered negligible. Using these parameters, parallel resonance frequencies were calculated according to (1) and (2), and the resulting harmonic orders are presented in Table 8. The admittances of both can be computed as follows:
Y h = 1 R t o t + j ω 1 h L t o t + j ω 1 h C
In this context, R t o t represents the total series resistance of the transmission line and infinite bus, and L t o t represents the total series reactance. Only the line capacitance was taken into account. The shunt conductance is negligible compared to the shunt susceptance and thus was not included in the admittance calculation. The potential for parallel resonance was assessed using the admittance calculation method. The parallel resonance frequency, denoted as h r   , can be expressed as follows:
h r = 1 ω 1 L t o t L t o t C R t o t 2
According to (2), the harmonic orders associated with the parallel resonance for the 345 kV and 154 kV systems under varying short circuit capacities are presented in Table 8. At high SCR, the effective grid inductance is smaller, shifting the parallel resonance to higher orders, whereas larger capacitance lowers the resonance order. Consequently, even small variations in the X C   / X L   ratio can move the resonance band across dominant emission orders (e.g., 11th–13th), causing THD to fluctuate significantly.
By combining these resonance orders with the harmonic current magnitudes per wind turbine shown in Table 8, it is observed that the 345 kV system is more susceptible to resonance within the harmonic order range of approximately 13.89 to 43.84. In particular, the 17th and 18th harmonics exhibit relatively high current injections of 0.761%, while the 14th–16th, 23rd and 24th, and 35th and 36th harmonics show moderate injections. These align closely with the resonance orders, amplifying the voltage distortion. In contrast, for the 154 kV system, the resonance orders range from approximately 29.81 to 71.52 and do not coincide as well with high-magnitude harmonic currents, resulting in lower resonance-induced voltage distortion.
Due to the variability in resonance locations, harmonic effects can be more sensitively observed in the 345 kV system within certain frequency ranges. When assessing harmonic effects up to the 50th order, the 154 kV system requires an SCR above 14.16 to avoid resonance across the full range, whereas the 345 kV system requires an SCR above 71.08. These SCR- and voltage-dependent harmonic effects cannot be accurately captured using the summation method, and therefore a precise simulation-based assessment is essential to evaluate the resulting harmonic impact.

4. Case Study

In this section, the previously reviewed results are extended to investigate the influence of SCR and harmonics across a broader range of scenarios, and the outcomes are analyzed.

4.1. SCR-Based Harmonic Assessment Considering Parallel Resonance Harmonic Orders

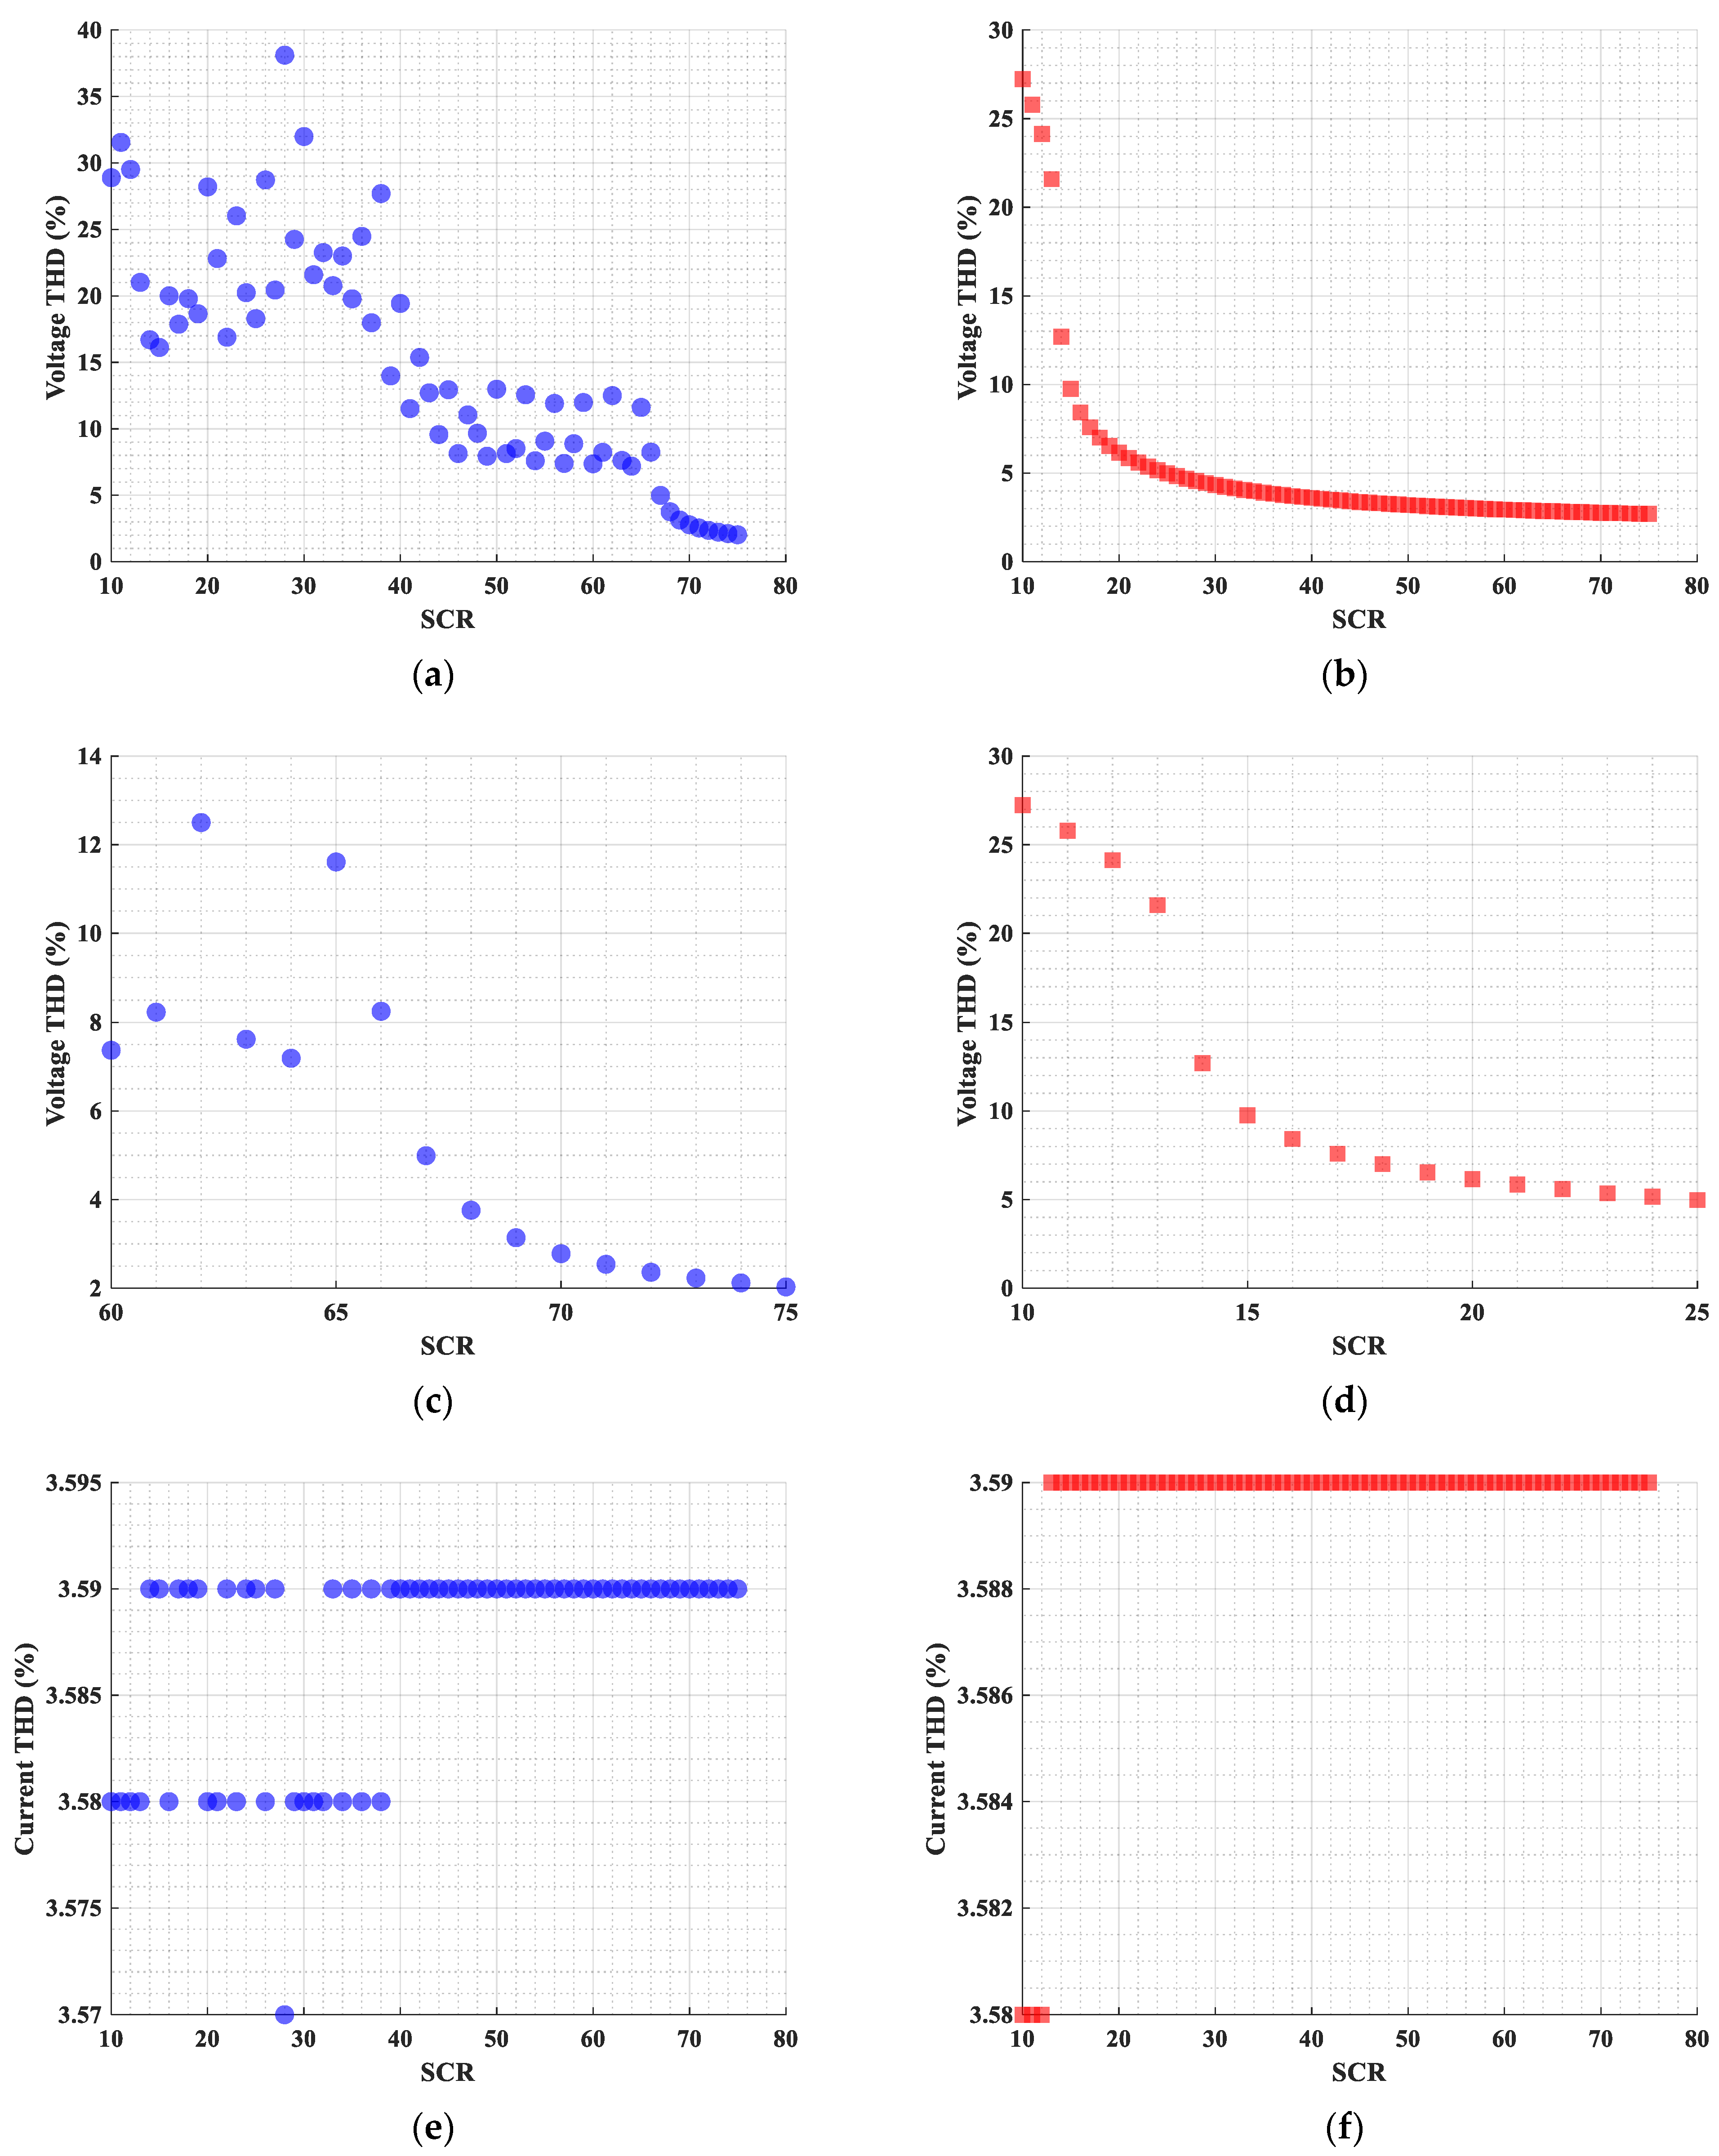
Initially, simulations were conducted across the full SCR range from 10 to 75 for both voltage levels to examine the harmonic orders associated with parallel resonance. Subsequently, the SCR ranges were refined to focus on the resonance bands, with SCR varied from 10 to 25 for the 154 kV system and from 60 to 75 for the 345 kV system. Simulations were repeated to highlight the resonance effects.
As shown in Figure 4, for the 154 kV system, THD significantly decreases for SCR values above the expected threshold of approximately 14, indicating a general inverse correlation between SCR and THD. In contrast, for the 345 kV system, the inverse trend is less pronounced, likely due to the resonance frequencies not aligning exactly with integer multiples and the corresponding harmonic current magnitudes within those bands. No harmonic mitigation measures were applied.
The nonlinear THD–SCR behavior observed in the 345 kV system arises from resonance point shifts. Under high SCR conditions, the effective inductance decreases, pushing the resonance order upward, while capacitance changes act in the opposite direction. When this resonance band approaches the 11th–13th harmonics with significant turbine emissions, PCC voltage distortion increases locally, but when it moves away, distortion decreases. Thus, although THD generally decreases as SCR increases, small variations in the X C   / X L   ratio can cause localized fluctuations at high SCR.

4.2. SCR-Based Harmonic Assessment at Offshore Wind Farm Candidate Sites

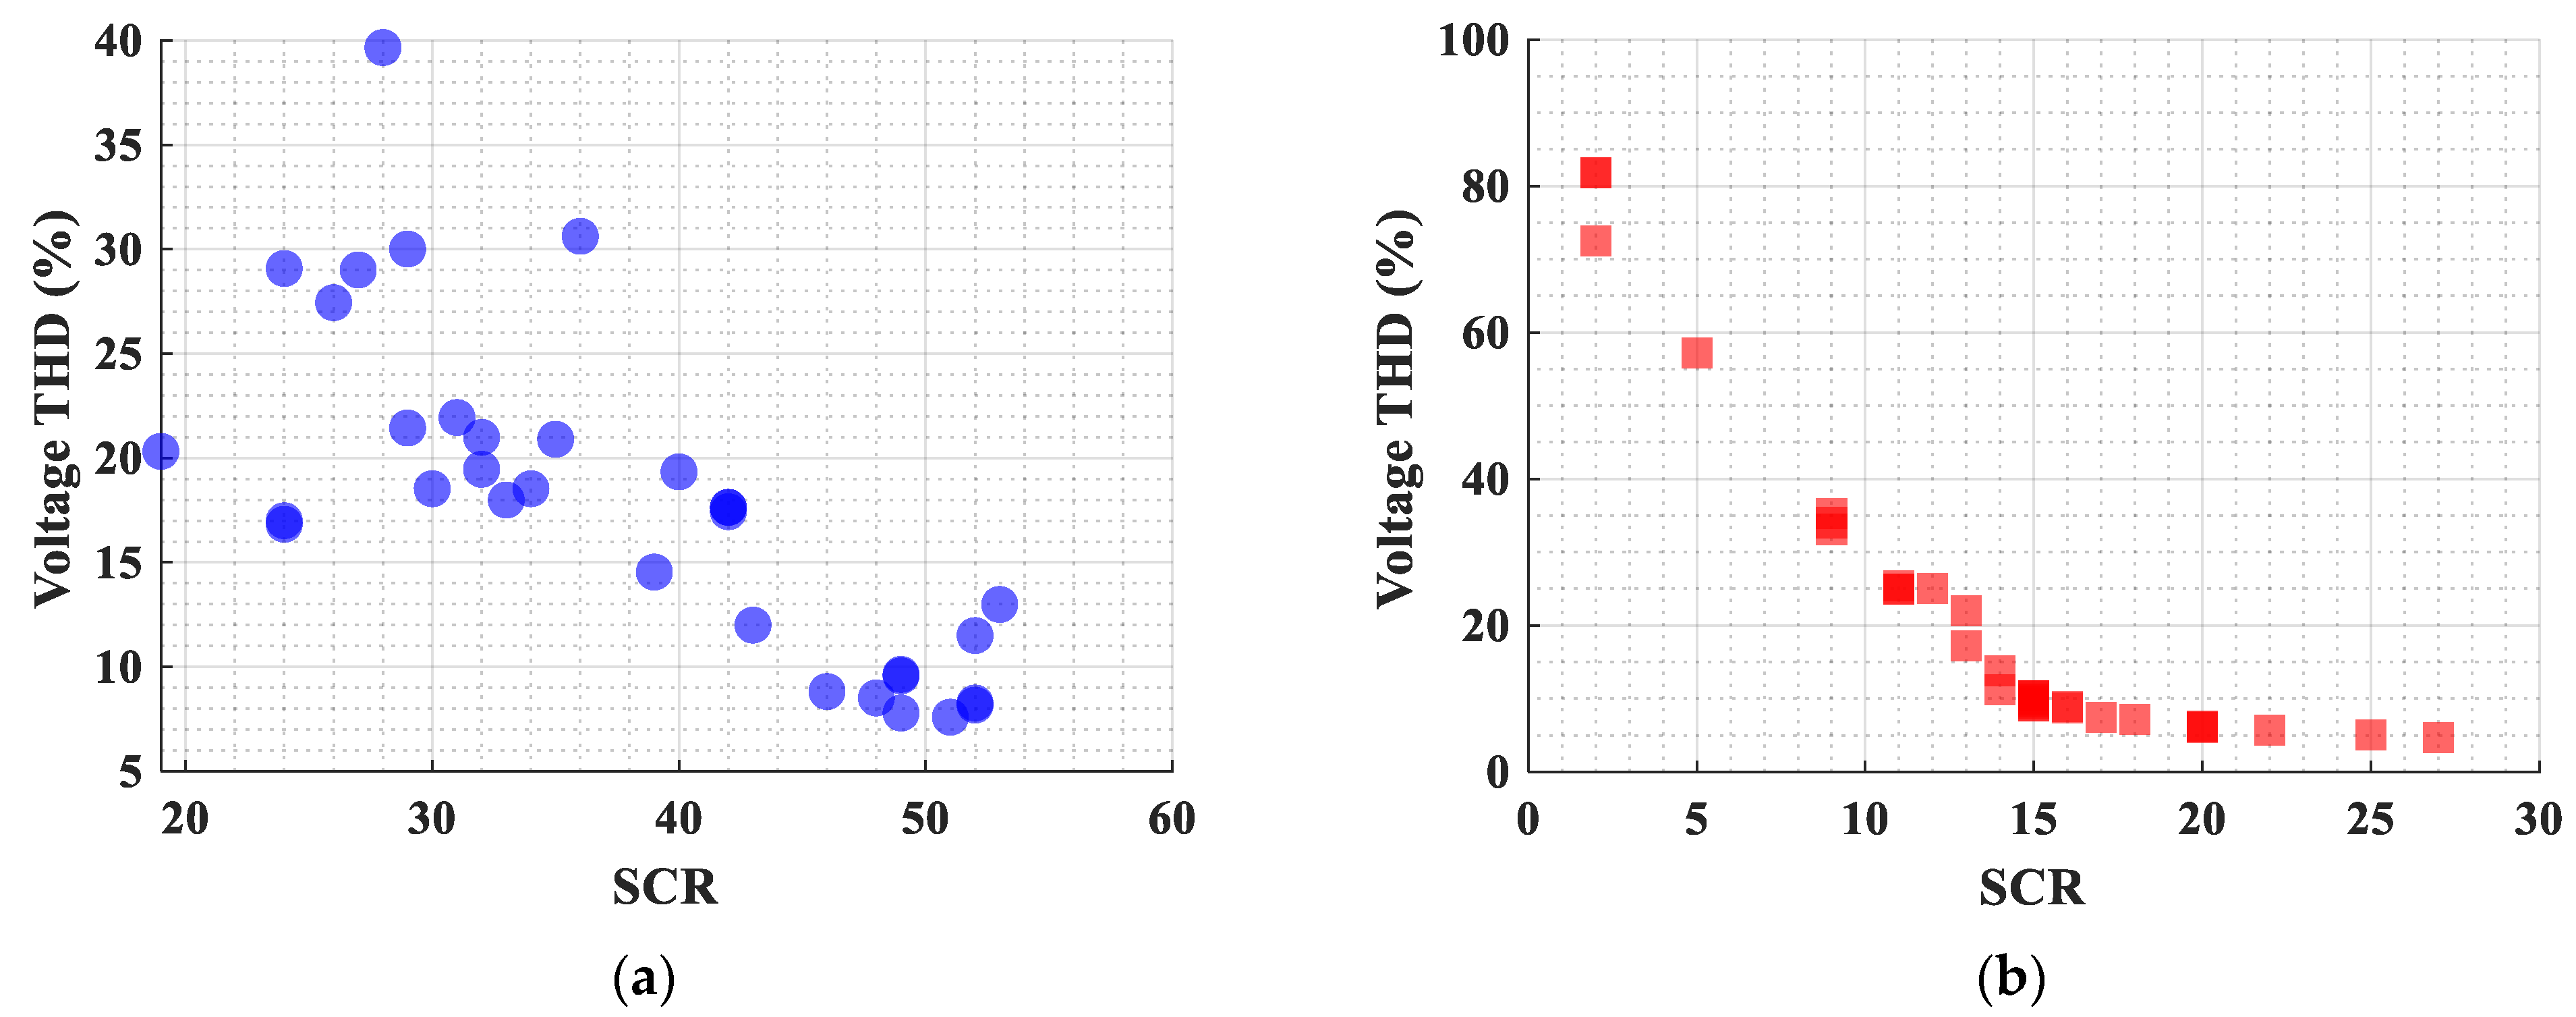
For practical applicability, 66 candidate sites that have high potential for offshore wind integration were selected, comprising 33 sites at 345 kV and 33 sites at 154 kV. These sites were selected from buses located in areas of the actual Korean power grid where large-scale offshore wind farms are planned for connection. Employing PSSE, the short circuit capacities of the 345 kV and 154 kV systems were computed for each site, followed by a comprehensive evaluation of the harmonic influence of the wind farm under three representative load conditions which include off-peak, summer peak, and winter peak. The simulation results are presented in Figure 5.
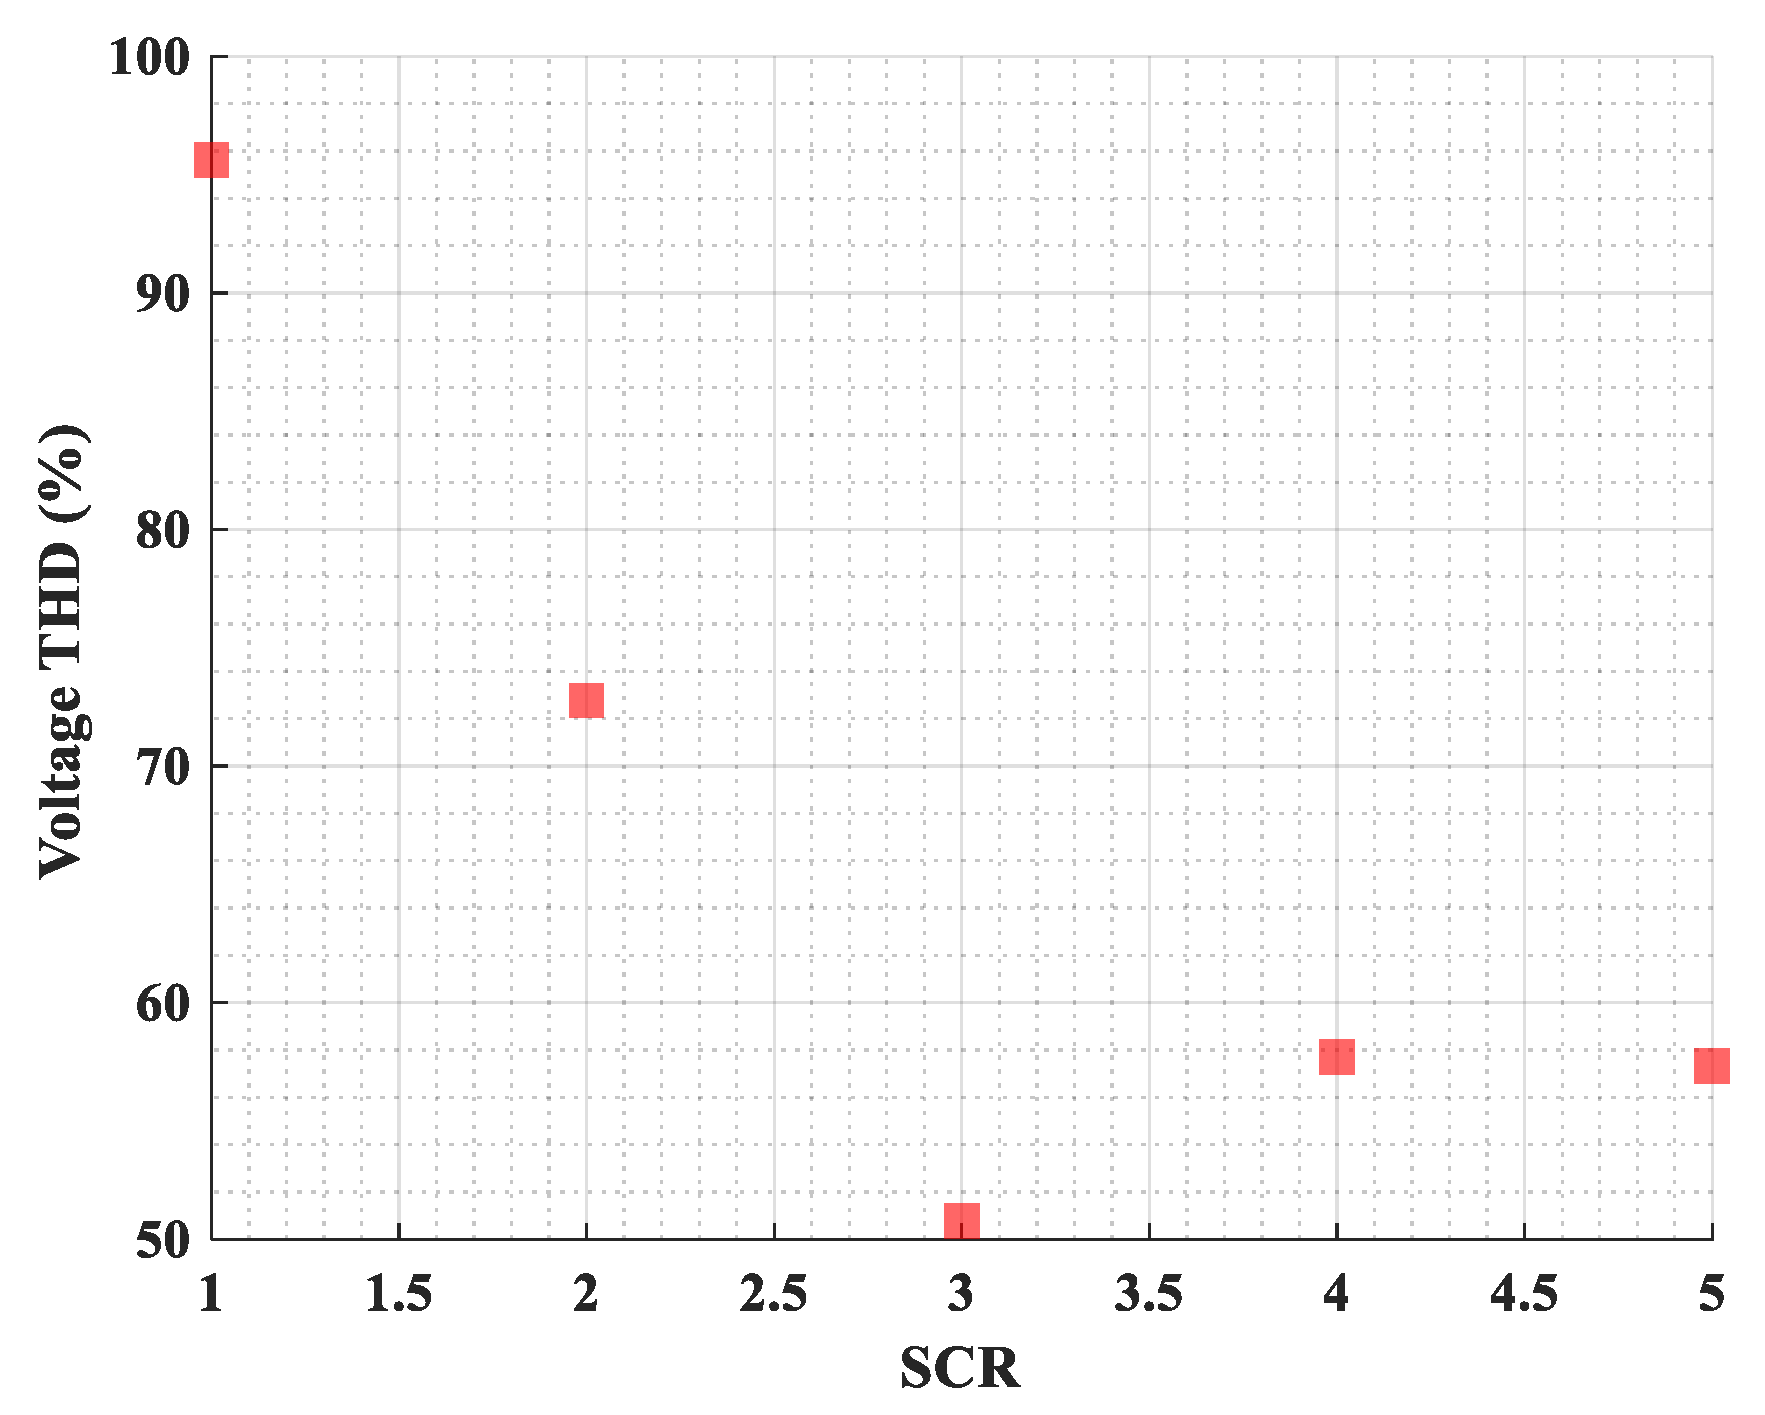
The analysis results indicate that, in most cases, the THD significantly exceeds the standard limits. This can be attributed to the current high harmonic output of the wind turbines and the absence of harmonic mitigation measures, such as filters, resulting in relatively high THD distributions. Generally, the 345 kV candidate sites exhibit relatively high SCR values, whereas the 154 kV sites exhibit comparatively lower SCRs. To further illustrate the behavior under extremely weak grid conditions, additional simulations were conducted for the 154 kV system at SCR values 1–5, and the results are presented in Figure 6. The THD is extremely high under these low SCR conditions, reaching 95.61% at SCR 1 and remaining above 50% for SCR 2–5, confirming that the very weak grid is the main cause of the high harmonic distortion. However, regardless of the grid strength, the 345 kV sites display a very high voltage harmonic distortion owing to the influence of the resonant bands. These findings highlight that a comprehensive impact assessment that simultaneously considers the harmonic output, SCR, and voltage level is essential for the selection of offshore wind farm candidate sites.

5. Discussion

This study systematically analyzed the impact of the SCR on voltage harmonic distortion during the grid integration of offshore wind farms. A 500 MW offshore wind farm was modeled, and simulations were conducted for system voltages of 345 kV and 154 kV under various SCR conditions. The results were compared with harmonic assessments based on the IEC 61400-21-2 summation method, highlighting the differences between simplified predictive approaches and detailed simulation-based analyses that account for actual system characteristics.
The analysis confirmed that SCR is a critical factor affecting voltage harmonic distortion. Under low-SCR conditions, the system’s ability to mitigate harmonic currents is limited, leading to THD levels that significantly exceed standard limits. Conversely, higher SCR values correspond to more robust grids, where voltage distortions are effectively controlled, often within international standard limits. Among the harmonic orders, the 11th to 13th were identified as predominant, suggesting that interaction between wind turbine inverter characteristics and system resonance can significantly exacerbate power quality issues. These findings underscore the importance of managing specific harmonic orders in the design of offshore wind farms.
Furthermore, the influence of system voltage on harmonic distortion cannot be considered advantageous at higher voltages. Although lower distortion was theoretically expected for the 345 kV system, resonance phenomena occurred within certain SCR ranges, leading to increased distortion. This finding highlights that factors such as line impedance, transformer characteristics, and capacitance interact, making it challenging to assess power quality based solely on voltage levels.
Although the IEC summation method is straightforward to implement, it does not fully account for the distortion amplification caused by resonance or system characteristics. This limitation suggests that the existing international standards may be insufficient for extensive IBR integration, thereby highlighting the need for comprehensive simulation analyses that incorporate specific system conditions.
In addition, the results were compared with recent studies to contextualize the findings. Previous works, such as [38,39], generally indicate that higher grid impedance, i.e., weaker grids, leads to higher harmonic levels. While this trend aligns with the overall observation of our study, these works do not fully address the impact of parallel resonance. Parallel resonance can selectively amplify specific harmonic orders, meaning that the relationship between total system impedance and THD is not always monotonic. Unlike previous studies, the present work explicitly analyzes harmonic behavior under the presence of parallel resonance, demonstrating that high system impedance does not necessarily lead to higher THD. This highlights the critical role of system resonance in shaping the harmonic profile of inverter-based resources in modern power systems.
Simulations using short circuit capacity data from prospective offshore wind farm sites revealed multiple instances in which the THD exceeded the standard limits. Notably, the 154 kV system exhibited persistently elevated harmonic distortion due to a low SCR, whereas the 345 kV system experienced significant distortion within specific resonance bands despite a high-SCR. These findings underscore the necessity for thorough evaluations that consider SCR, harmonic emission characteristics, and resonance risks during site assessments.

6. Conclusions

This study quantitatively assessed the impact of SCR on voltage harmonic distortion in offshore wind farm grid integration. Under low-SCR conditions, the system’s ability to suppress harmonics is reduced, leading to THD levels that exceed acceptable standards, with the 11th to 13th harmonics being the primarily contributors to power quality deterioration. Furthermore, the system voltage alone is insufficient for accurately predicting distortion because factors such as line impedance, transformer characteristics, and capacitance can induce resonance phenomena.
Although the IEC 61400-21-2 summation method is straightforward to apply, it does not fully account for the distortion amplification caused by resonance or specific system characteristics. Simulations for actual candidate sites demonstrated that THD can exceed regulatory limits under low-SCR conditions or within certain resonance frequency bands. These results underscore the necessity for thorough site evaluations and designs that comprehensively consider the SCR levels, harmonic emission profiles, and resonance risks.
Overall, the findings offer practical insights for offshore wind farm site selection, substation design, and harmonic mitigation strategies. Future research will extend this work by analyzing dynamic resonance phenomena under time-varying loads and other system dynamics, thereby further advancing the understanding of harmonic behavior in offshore wind farm integration.

Author Contributions

Conceptualization, K.L. and S.C.; methodology, K.L., M.Y., J.L. and S.C.; software, M.Y. and S.G.; validation, K.L., M.Y. and S.C.; formal analysis, M.Y., J.L. and S.G.; investigation, S.C.; resources, K.L.; data curation, K.L. and M.Y.; writing—original draft preparation, K.L.; writing—review and editing, M.Y. and S.C.; visualization, K.L. and M.Y.; supervision, S.C.; project administration, S.C.; funding acquisition, S.C. All authors have read and agreed to the published version of the manuscript.

Funding

This research was funded by the Korea Institute of Energy Technology Evaluation and Planning (KETEP) and the Ministry of Trade, Industry & Energy (MOTIE) of the Republic of Korea, grant number RS-2023-00301692.

Institutional Review Board Statement

Not applicable.

Informed Consent Statement

Not applicable.

Data Availability Statement

The datasets generated and/or analyzed during the current study are not publicly available but are available from the corresponding author on reasonable request.

Conflicts of Interest

Authors Jonghyun Lee and Seungjun Gham were employed by HD Hyundai Electric. The remaining authors declare that the research was conducted in the absence of any commercial or financial relationships that could be construed as a potential conflict of interest.

References

  1. Kaldellis, J.K.; Kapsali, M. Shifting towards offshore wind energy—Recent activity and future development. Energy Policy 2013, 53, 136–148. [Google Scholar] [CrossRef]
  2. Esteban, M.D.; Diez, J.J.; López, J.S.; Negro, V. Why offshore wind energy? Renew. Energy 2011, 36, 444–450. [Google Scholar] [CrossRef]
  3. Bilgili, M.; Yasar, A.; Simsek, E. Offshore wind power development in Europe and its comparison with onshore counterpart. Renew. Sustain. Energy Rev. 2011, 15, 905–915. [Google Scholar] [CrossRef]
  4. Ullah, T.; Sobczak, K.; Liśkiewicz, G.; Khan, A. Two-Dimensional URANS Numerical Investigation of Critical Parameters on a Pitch Oscillating VAWT Airfoil under Dynamic Stall. Energies 2022, 15, 5625. [Google Scholar] [CrossRef]
  5. Williams, R.; Zhao, F. Global Offshore Wind Report 2024; Global Wind Energy Council: Brussels, Belgium, 2024. [Google Scholar]
  6. Samanta, S.; Yang, B.; Seo, G.-S. Stability analysis of power systems with high penetration of state-of-the-art inverter technologies. Energies 2025, 18, 3645. [Google Scholar] [CrossRef]
  7. Santamaria, K.S.; Rios, M.A. Challenges of power systems with IBR-dominated in specific regions: Analysis of transient stability and SCR. In Proceedings of the 2025 IEEE Workshop on Power Electronics and Power Quality Applications (PEPQA), Cartagena, Colombia, 4 June 2025. [Google Scholar]
  8. Rodrigues, S.; Restrepo, C.; Kontos, E.; Teixeira Pinto, R.; Bauer, P. Trends of offshore wind projects. Renew. Sustain. Energy Rev. 2015, 49, 1114–1135. [Google Scholar] [CrossRef]
  9. Higgins, P.; Foley, A. The evolution of offshore wind power in the United Kingdom. Renew. Sustain. Energy Rev. 2014, 37, 599–612. [Google Scholar] [CrossRef]
  10. Woo, H.; Choi, S.; Kim, S.; Kim, S.; Kwak, J. Hybrid AC/DC transmission expansion planning considering offshore windfarms in Korea. In Proceedings of the 2024 IEEE Power & Energy Society General Meeting (PESGM), Seattle, WA, USA, 21–25 July 2024. [Google Scholar]
  11. Muyeen, S.M.; Takahashi, R.; Tamura, J. Operation and control of HVDC-connected offshore wind farm. IEEE Trans. Sustain. Energy 2010, 1, 30–37. [Google Scholar] [CrossRef]
  12. Bresesti, P.; Kling, W.L.; Hendriks, R.L.; Vailati, R. HVDC connection of offshore wind farms to the transmission system. IEEE Trans. Energy Convers. 2007, 22, 37–43. [Google Scholar] [CrossRef]
  13. Wang, L.; Yeh, C.-J.; Hsieh, M.-H.; Wu, C.-T.; Lu, C.-L. Analysis of voltage variations and short-circuit ratios of a large-scale offshore wind farm connected to a practical power system. In Proceedings of the 2013 IEEE Power & Energy Society General Meeting, Vancouver, BC, Canada, 21–25 July 2013. [Google Scholar]
  14. Schmall, J.; Huang, S.-H.F.; Li, Y.; Billo, J.; Conto, J.; Zhang, Y. Voltage stability of large-scale wind plants integrated in weak networks: An ERCOT case study. In Proceedings of the 2015 IEEE Power & Energy Society General Meeting, Denver, CO, USA, 26–30 July 2015. [Google Scholar]
  15. Monjo, L.; Sainz, L.; Liang, J.; Pedra, J. Study of resonance in wind parks. Electr. Power Syst. Res. 2015, 128, 30–38. [Google Scholar] [CrossRef]
  16. He, X.; Chen, C. The harmonic stability analysis of HVDC system based on short-circuit ratio. In Proceedings of the 2012 Asia-Pacific Power and Energy Engineering Conference, Shanghai, China, 27–29 March 2012. [Google Scholar]
  17. Zhou, Y.; Nguyen, D.D.; Kjær, P.C.; Saylors, S. Connecting wind power plant with weak grid—Challenges and solutions. In Proceedings of the 2013 IEEE Power & Energy Society General Meeting, Vancouver, BC, Canada, 21–25 July 2013. [Google Scholar]
  18. Zhang, Y.; Huang, S.-H.F.; Schmall, J.; Conto, J.; Billo, J.; Rehman, E. Evaluating system strength for large-scale wind plant integration. In Proceedings of the 2014 IEEE PES General Meeting|Conference & Exposition, National Harbor, MD, USA, 27–31 July 2014. [Google Scholar]
  19. Zhou, J.; Zhao, F.; Wu, H.; Wang, X. Comparison analysis of short circuit ratio variants on the indication of power system voltage stability. In Proceedings of the 2024 IEEE 15th International Symposium on Power Electronics for Distributed Generation Systems (PEDG), Luxembourg, 23–26 June 2024. [Google Scholar]
  20. IEC 61400-21; Wind Turbines—Part 21: Measurement and Assessment of Power Quality Characteristics of Grid Connected Wind Turbines. International Electrotechnical Commission: Geneva, Switzerland, 2008.
  21. IEC 61000-4-7; Electromagnetic Compatibility (EMC)—Part 4–7: Testing and Measurement Techniques—General Guide on Harmonics and Interharmonics Measurements and Instrumentation, for Power Supply Systems and Equipment Connected Thereto. International Electrotechnical Commission: Geneva, Switzerland, 2002.
  22. IEC 61000-4-15; Electromagnetic Compatibility (EMC)—Part 4–15: Testing and Measurement Techniques—Flickermeter—Functional and Design Specifications. International Electrotechnical Commission: Geneva, Switzerland, 2010.
  23. IEC 61000-4-30; Electromagnetic Compatibility (EMC)—Part 4–30: Testing and Measurement Techniques—Power Quality Measurement Methods. International Electrotechnical Commission: Geneva, Switzerland, 2015.
  24. IEC 61000-3-6; Electromagnetic Compatibility (EMC)—Part 3–6: Limits—Assessment of Emission Limits for Fluctuating Loads in MV and HV Power Systems. International Electrotechnical Commission: Geneva, Switzerland, 2008.
  25. IEC 61000-3-7; Electromagnetic Compatibility (EMC)—Part 3–7: Assessment of the Emission Limits for the Connection of Fluctuating Installations to MV, HV and EHV Power Systems. International Electrotechnical Commission: Geneva, Switzerland, 2008.
  26. IEEE Std 519; IEEE Recommended Practices and Requirements for Harmonic Control in Electric Power Systems. IEEE: New York, NY, USA, 2014.
  27. IEEE Std 2800; IEEE Recommended Practices for Wind and Solar Power Plant Integration with Electric Power Systems: Harmonic Current Limits and System Impact Assessment. IEEE: New York, NY, USA, 2022.
  28. IEEE Std 1547; IEEE Standard for Interconnection and Interoperability of Distributed Energy Resources with Associated Electric Power Systems Interfaces. IEEE: New York, NY, USA, 2018.
  29. Alfalahi, S.T.Y.; Saeed, M.N.; Alsammarraie, R.M.; Abdulhadi, M.; Nouh, A.; Alkahtani, A.A.; Al-Shetwi, A.Q. Harmonic Distortion Analysis and Mitigation in an On-Grid Wind Farm Using Passive Filters: A Case Study on the Shahat Distribution Network. J. Inf. Syst. Eng. Manag. 2025, 10 (Suppl. S44), 8661. [Google Scholar] [CrossRef]
  30. Li, G.Y.; Yen, H.J.; Wu, J.W.; Huang, W.Y.; Chang, G.W. A Comparative Study of Harmonic Distortion Assessment for an Offshore Wind Farm System. In Proceedings of the 2024 21st International Conference on Harmonics and Quality of Power (ICHQP), Chengdu, China, 18 October 2024; pp. 451–456. [Google Scholar]
  31. Lu, S.-Y.; Wang, L.; Ke, S.-C.; Chang, C.-H.; Yang, Z.-H. Evaluation of measured power-quality results of a wind farm connected to Taiwan power system. In Proceedings of the 2014 IEEE Industry Application Society Annual Meeting, Vancouver, BC, Canada, 5–9 October 2014. [Google Scholar]
  32. Magesh, T.; Devi, G.; Lakshmanan, T. Measurement and simulation of power quality issues in grid connected wind farms. Electr. Power Syst. Res. 2022, 210, 108142. [Google Scholar] [CrossRef]
  33. Kocatepe, C.; İnan, A.; Arıkan, O.; Yumurtacı, R.; Kekezoğlu, B.; Baysal, M.; Bozkurt, A.; Akkaya, Y. Power quality assessment of grid-connected wind farms considering regulations in Turkey. Renew. Sustain. Energy Rev. 2009, 13, 2553–2561. [Google Scholar] [CrossRef]
  34. Xia, Q.; Wang, Z.; Liu, F.; Li, Y.; Peng, Y.; Xu, Z. Study on power quality issues of wind farm. In Proceedings of the 2017 36th Chinese Control Conference (CCC), Dalian, China, 26–28 July 2017. [Google Scholar]
  35. Liang, X. Emerging power quality challenges due to integration of renewable energy sources. IEEE Trans. Ind. Appl. 2017, 53, 855–866. [Google Scholar] [CrossRef]
  36. Shao, H.; Henriques, R.; Morais, H.; Tedeschi, E. Power quality monitoring in electric grid integrating offshore wind energy: A review. Renew. Sustain. Energy Rev. 2024, 191, 114094. [Google Scholar] [CrossRef]
  37. Hoseinzadeh, B.; Bak, C.L.; Blaabjerg, F. Impact of grid impedance variations on harmonic emission of grid-connected inverters. In Proceedings of the 2017 IEEE Manchester PowerTech, Manchester, UK, 18–22 June 2017; pp. 1–5. [Google Scholar]
  38. Nakhodchi, N.; Bollen, M.H.J. Estimation of safe harmonic hosting capacity. In Proceedings of the CIRED 2021—The 26th International Conference and Exhibition on Electricity Distribution, Online, 21–24 June 2021; pp. 693–697. [Google Scholar]
  39. ABB. Technical Guide No. 6: Guide to Harmonics with AC Drives; ABB: Zürich, Switzerland, 2022. [Google Scholar]
  40. Cobben, J.F.G.; Geldtmeijer, D.A.M.; Almering, A.F.J.; van Waes, J.B.M. Evaluation and updating of harmonic voltage limits. In Proceedings of the 2015 IEEE Eindhoven PowerTech, Eindhoven, The Netherlands, 29 June–2 July 2015; pp. 1–5. [Google Scholar]
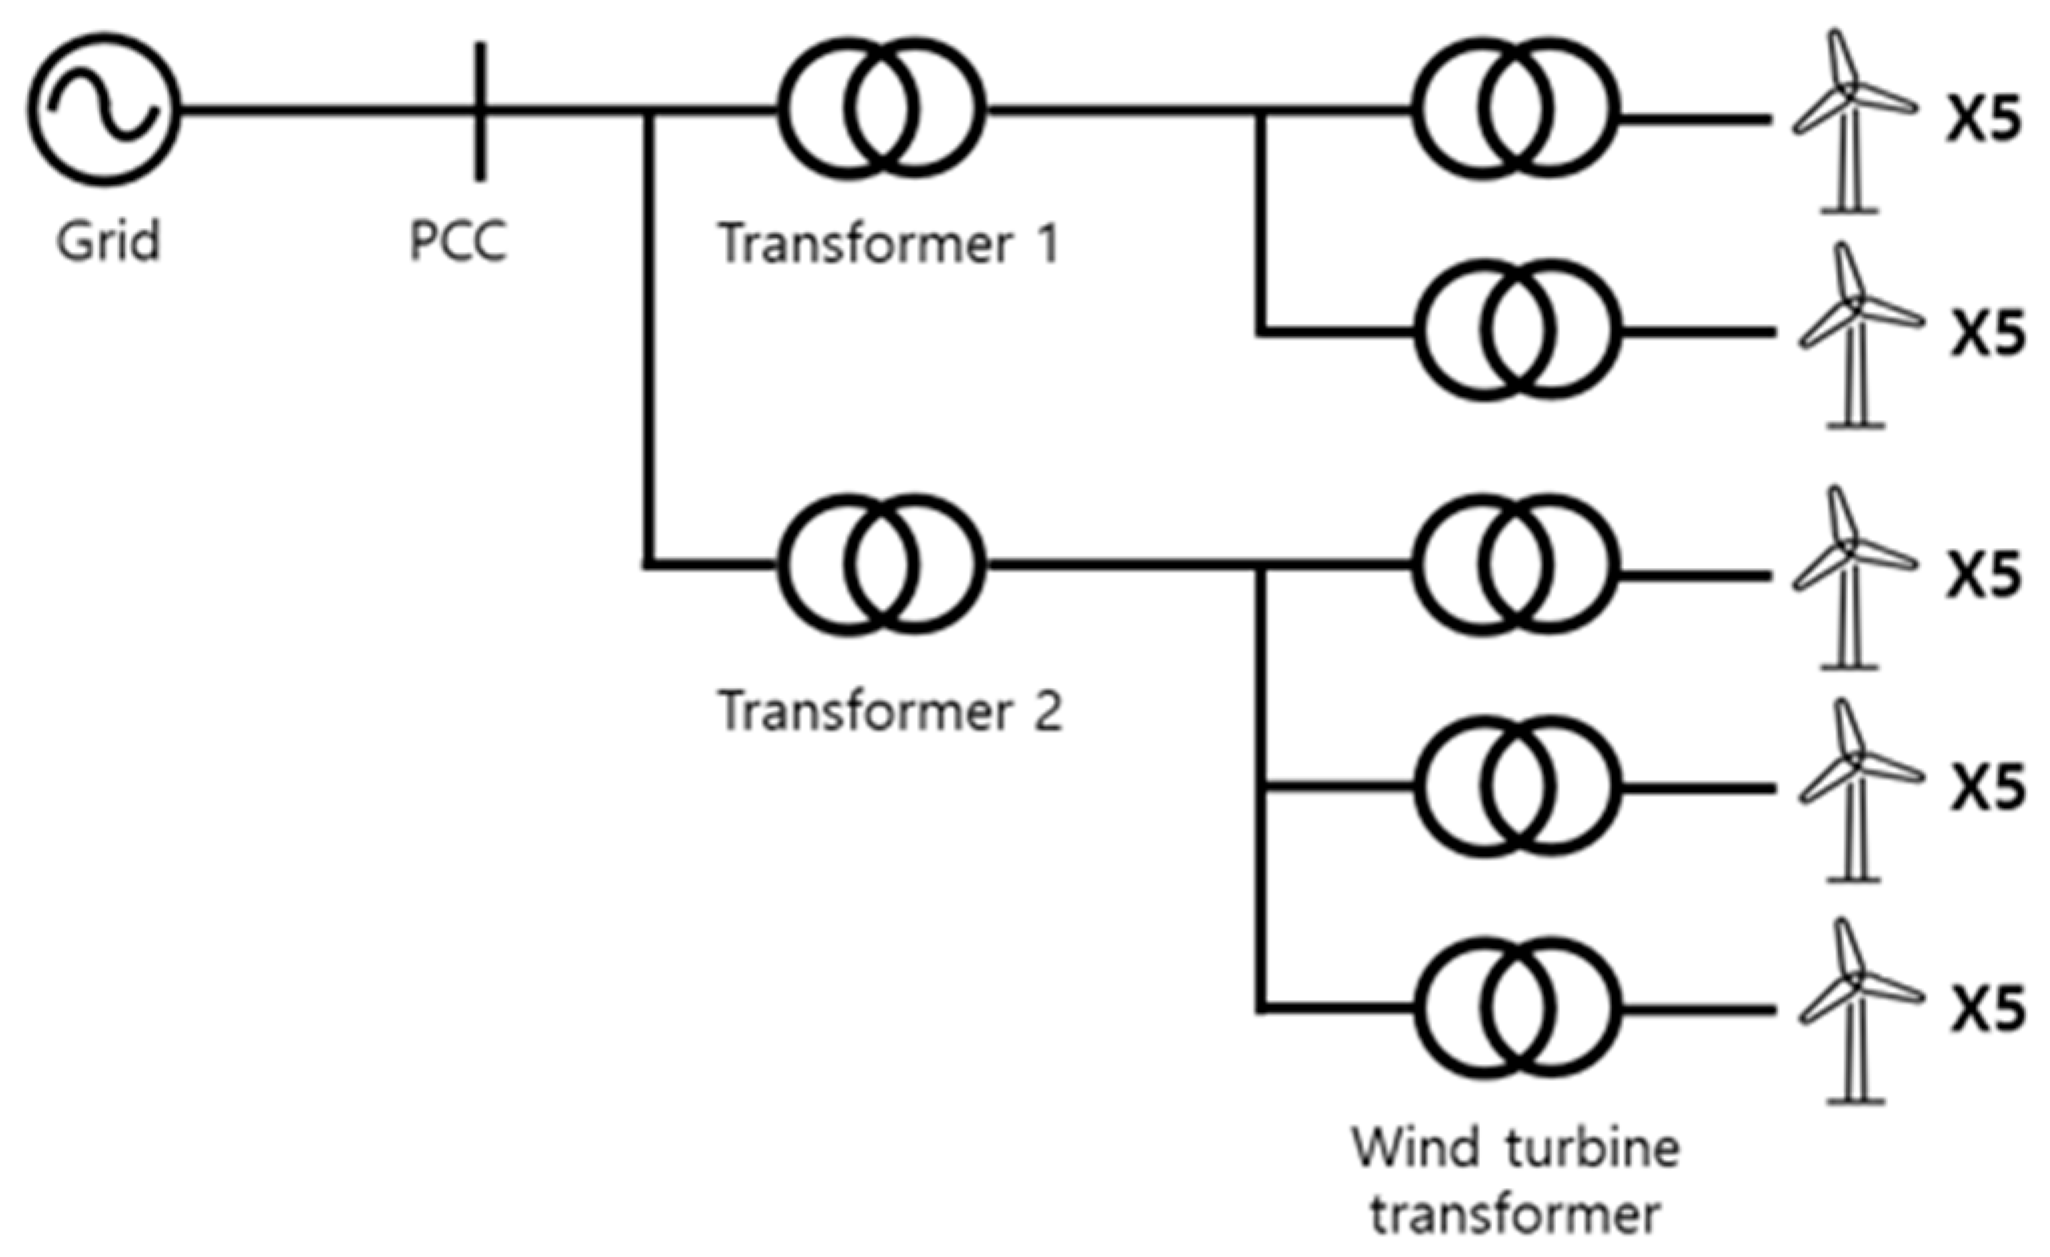
Figure 1. Single-line diagram of the offshore wind farm.
Energies 18 05480 g001
Figure 2. Simulink model of the offshore wind farm.
Energies 18 05480 g002
Figure 3. Voltage waveforms for various SCR values: (a) 345 kV system; (b) 154 kV system.
Energies 18 05480 g003
Figure 4. Voltage THD versus SCR: (a) 345 kV system (voltage, full SCR range 10–75); (b) 154 kV system (voltage, full SCR range 10–75); (c) 345 kV system (voltage, resonance band 60–75); (d) 154 kV system (voltage, resonance band 10–25); (e) 345 kV system (current, full SCR range 10–75); (f) 154 kV system (current, full SCR range 10–75).
Energies 18 05480 g004
Figure 5. Voltage THD versus SCR at offshore wind farm candidate sites: (a) 345 kV system; (b) 154 kV system.
Energies 18 05480 g005
Figure 6. Voltage THD versus SCR for the 154 kV system at low SCR values (SCR = 1–5).
Energies 18 05480 g006
Table 1. Infinite bus parameter.
ConfigurationPhase Angle of Phase a (Degrees)Frequency (Hz)X/R Ratio
Y g 0607
Table 2. Line parameter.
MV Line
Resistive (Ohms/km)0.2745
Reactive (H/km)0.001186
HV/EHV Line
Resistive (Ohms/km) r 1 r 0
0.04540.0113
Reactive (H/km) l 1 l 0
3.57 × 10−41.17 × 10−3
Capacitive (F/km) c 1 c 0
2.26 × 10−81.44 × 10−8
Table 3. Transformer parameter.
Transformer 1
Rated power300 MVA
Voltage345 kV/66 kV
154 kV/66 kV
ConnectionYg/D1
Transformer 2
Rated power400 MVA
Voltage345 kV/66 kV
154 kV/66 kV
ConnectionYg/D1
Wind Turbine Generator Transformer
Rated power30 MVA
Voltage66 kV/8270 V
ConnectionD11/Yg
Table 4. Harmonic current injection per wind turbine ( I n % of fundamental current).
Harmonic
Order
Magnitude
(% of Fundamental Current)
Harmonic
Order
Magnitude
(% of Fundamental Current)
20.343270.200
30.343280.133
40.201290.271
50.435300.271
60.435310.240
70.471320.240
80.401330.240
90.401340.240
100.545350.350
111.456360.350
121.456370.259
131.854380.259
140.475390.259
150.475400.259
160.371410.157
170.761420.157
180.761430.108
190.420440.108
200.324450.108
210.324460.108
220.330470.108
230.369480.108
240.369490.108
250.235500.106
260.200--
Table 5. Results of the summed harmonic current based on the summation method.
Harmonic
Order
Summed
Harmonic
Current
(A)
Magnitude
(% of Rated Current)
Harmonic
Order
Summed
Harmonic
Current
(A)
Magnitude
(% of Rated Current)
2239.4570.3427139.6250.20
3239.4570.342892.8510.13
4140.3230.2029189.1920.27
5303.6850.4430189.1920.27
6303.6850.4431167.5500.24
7328.8170.4732167.5500.24
8279.9490.4033167.5500.24
9279.9490.4034167.5500.24
10380.4790.5535244.3440.35
111016.4721.4636244.3440.35
121016.4721.4637180.8150.26
131294.331.8538180.8150.26
14331.6100.4839180.8150.26
15331.6100.4840180.8150.26
16259.0050.3741109.6060.16
17531.2740.7642109.6060.16
18531.2740.764375.3980.11
19293.2130.424475.3980.11
20226.1930.324575.3980.11
21226.1930.324675.3980.11
22230.3820.334775.3980.11
23257.6090.374875.3980.11
24257.6090.374975.3980.11
25164.0600.245075.3980.11
26139.6250.20---
Table 6. Comparison of harmonic current between summation method and simulation.
SystemSCRHarmonic OrderSummation
(% of Rated Current)
Simulation
(% of Rated Current)
154 kV111th1.461.42
12th1.461.40
13th1.851.74
1011th1.461.45
12th1.461.45
13th1.851.85
5011th1.461.45
12th1.461.45
13th1.851.85
10011th1.461.45
12th1.461.45
13th1.851.85
345 kV111th1.461.46
12th1.461.46
13th1.851.85
1011th1.461.45
12th1.461.45
13th1.851.84
5011th1.461.45
12th1.461.45
13th1.851.85
10011th1.461.45
12th1.461.45
13th1.851.85
Table 7. Voltage THD under varying SCR conditions.
Voltage THD (%)
SCR11050100
345 kV38.2428.8912.980.43
154 kV95.6127.233.202.46
Table 8. Harmonic orders corresponding to parallel resonance under varying short circuit capacity.
154 kV345 kV
SCR h r SCR h r
429.81413.89
1043.901021.60
2056.192029.76
3063.323035.56
5071.525043.84
Disclaimer/Publisher’s Note: The statements, opinions and data contained in all publications are solely those of the individual author(s) and contributor(s) and not of MDPI and/or the editor(s). MDPI and/or the editor(s) disclaim responsibility for any injury to people or property resulting from any ideas, methods, instructions or products referred to in the content.