Abstract
The economic viability of solar drying mainly depends on the appropriate design of air collectors, which are the main parts of a solar dryer. Although the V-groove collector has been reported to have one of the highest efficiencies, no comprehensive parameter analysis on this collector has been reported in the literature. This detailed study investigates the influence of different operating and design variables on the outlet temperature and the efficiency of the air collector. The parameter analysis also contributed to the development of the most effective design guidelines. The parameters examined include solar radiation, airflow rate, incoming air temperature, collector length, height of the vee, the spacing between the top of the vee and the transparent cover, number of such covers, and the thickness of the back insulation. The airflow rate is identified to be the essential operating parameter that affects the efficiency, and a better heat transfer rate is noticed in the intermediate flow state. It is also found that to achieve the best performance, it is necessary to maintain a mass airflow rate between 0.015 and 0.055 kg/m2s, to have incoming air at a near-atmospheric temperature, and to have two transparent covers on top.
1. Introduction
Solar air collectors (SACs) are widely used in applications such as space heating, agricultural drying, and industrial process heating. Their simplicity of construction, low cost, and ability to directly produce hot air without the need for an intermediate heat exchanger make them particularly attractive for drying and heating purposes. In these systems, the solar collector is the central component responsible for converting incident solar radiation into usable thermal energy. Therefore, the cost-effectiveness and overall performance of solar drying systems are critically dependent on the efficiency of the air collector [1,2]. Designing highly efficient and durable collectors remains one of the most important challenges in solar drying system development.
Over the years, several collector configurations have been developed, including flat-plate, finned, v-corrugated, perforated, and porous media absorbers. Flat-plate collectors, though simple in design and construction, generally exhibit lower performance due to limited heat transfer area. In contrast, geometries that enhance surface area or turbulence, such as v-corrugated and finned collectors, typically deliver superior thermal performance. Desisa and Shekata [3] and Karim et al. [4] demonstrated that v-corrugated absorbers achieve higher efficiencies, primarily due to their increased heat transfer surface and multiple reflections of solar radiation within the grooves. More recently, An et al. [5] reported improved thermal performance in solar air heaters equipped with sequential rectangular obstacles, while Prasopsuk et al. [6] showed that fractal cylindrical pin extensions further enhanced collector effectiveness. Other innovative studies have explored roughened and ribbed surfaces [7,8], as well as hybrid energy integration, to achieve higher heat transfer rates.
The fundamental factors influencing SAC performance include collector geometry, air mass flow rate, solar radiation, and inlet air temperature. Heat loss is strongly affected by the collector cover, back insulation, and flow path design. Close [9] highlighted that most thermal losses occur through the front glazing, while Wijeysundera et al. [10] and Karim and Hawlader [11] introduced the double-pass concept, where air flows sequentially above and below the absorber plate, thereby improving both outlet temperature and thermal efficiency. Studies have demonstrated that double-pass systems with modified geometries, such as V-groove, W-ribs, or roughened surfaces, can substantially improve heat transfer and exergy performance [12,13].
Despite these advancements, the progress in solar air collector technology has been slower compared to solar water heaters. In particular, the V-groove configuration, which has been recognized for its high efficiency, remains underexplored, especially in double-pass counterflow designs.
Mathematical models of a two-pass parallel flow flat plate [14], single-pass V-groove [12], and double-pass counterflow flat plate [13,15] are reported in the literature. Karim et al. [4] proposed a mathematical model for the counter-pass V-groove collector, and Labed et al. [16] conducted a comparative study on single and double-pass solar collectors. Ho et al. [8] and Dhiman et al. [17] have also shown improved results for double-pass flow. As mentioned earlier, air collector performance depends on many design and operating variables, including collector geometry, absorber plate design, air mass flow rate, solar radiation, and inlet air temperature. A comprehensive investigation into the exact influence of these variables is necessary. Liu et al. [12] examined single-pass V-groove performance, but a comprehensive parameter analysis of double-pass counterflow V-groove collectors remains absent in the literature. Given that key variables such as solar radiation, mass flow rate, collector length, V-groove height, cover spacing, number of transparent covers, and insulation thickness strongly influence efficiency, there is a clear need for detailed parametric investigations. A parametric analysis will help in designing cost-effective, optimal air collectors for solar dryers. Recent work by Hassan et al. [18] emphasizes the importance of techno-economic and performance assessments in guiding practical solar drying system design.
This study addresses this gap by performing a comprehensive experimental and theoretical analysis of a double-pass counterflow V-groove solar air collector. The relationships of mass airflow rate, exit air temperature, and efficiency with the following five design parameters were investigated: (1) length of solar collector, (2) V-groove height, (3) gap between the glass cover and heat absorbing panel, (4) number of glass covers, and (5) back insulation thickness. Moreover, the efficiency also depends on the incoming air temperature. Investigation of these critical parameters of the double-pass V-groove air collector on the outlet temperature and efficiency is expected to play a key role in determining the most effective design and operating conditions for a particular drying operation. The panel temperature was also monitored to relate it to the exit air temperature and observe how it interacts within the system. Additionally, the influence of Reynolds number on design parameters was analyzed. Finally, a design guideline for an efficient V-groove solar collector was developed. The parametric insights based on validated models and practical design guidelines can aid engineers in developing efficient, low-cost, and sustainable drying systems.
2. Mathematical Formulations
Instantaneous efficiency of a collector can be defined as the ratio of the useful thermal energy transferred to the heat transfer fluid to the total incident solar energy on the collector plate, averaged over a time interval. Mathematically, the efficiency of a collector is represented as follows (steady/quasi-steady ASHRAE 93 approach) [19]:
The development of the mathematical model is formulated under the following assumptions:
- Heat conduction through the insulated rear section is assumed to be one-dimensional and perpendicular to the direction of airflow.
- Both the front and rear surfaces are exposed to identical ambient conditions.
- The effects of dust, dirt, and shading on the collector’s performance are considered negligible.
- Temperatures within the collector components and the average air temperature within the flow channels are considered uniformly distributed.
- Thermal radiation losses from the insulation are considered negligible.
The following section introduces the key mathematical expressions used to characterize the thermodynamic behavior of each component. The corresponding thermal network of the V-corrugated collector is illustrated in Figure 1.

Figure 1.
Cross section and the heat-related network of a double-pass V-groove solar thermal air unit.
The energy balance equations corresponding to the thermal network illustrated in Figure 1—for the transparent panel, first-pass fluid, heat-absorbing panel, second-pass fluid, and back plate—are presented in Equations (2)–(6).
The energy balance in the top plate is given by
Energy balance for the heat transfer fluid in the top channel of the collector is
Energy balance in the absorber plate is
For the fluid’s second pass,
For the bottom plate,
The overall top heat loss coefficient is calculated using an empirical equation developed by Klein [20]:
The radiation heat transfer coefficient between the glass cover and absorbing plate can be expressed by [12]
The conductive heat transfer coefficient between the glass cover and the first-pass fluid is determined by the equation developed by Hollands and Shewen [21]:
The heat loss coefficient for the back plate is given by [22]
By rearranging the energy balance above all equations in terms of temperature, the following expressions can be obtained.
The above equations have been arranged into a 5 × 5 matrix in the form
The mean temperatures () can be determined by using the array division
Here, are the mean temperatures of surfaces and are mean fluid temperatures.
Each newly computed temperature value will be compared with the preceding one, and the process continues until the difference between consecutive values falls below 0.01 °C. Detailed formulations and associated thermal exchange coefficients are available in the authors’ earlier publication [4].
3. Experiments
3.1. Experimental Facility
While indoor testing is more convenient and faster, evaluating solar thermal air units under outdoor conditions is preferred, as replicating actual environmental conditions in an indoor situation is challenging. Hence, an outdoor testing configuration was established in compliance with ASHRAE Standard 93-2010 [19]. The V-groove collector experimentally investigated in this paper forms part of a bigger research project titled ‘Development of Integrated Solar Drying System.’ The overall system includes a V-groove solar collector, conical-shaped rock-bed heat-related storage, auxiliary heater, a dehumidifier, and a drying chamber. The system was designed and constructed at Queensland University of Technology, Brisbane, Australia, and is shown in Figure 2. The heated air from the collector is either directed to the conical-shaped rock-bed thermal storage for charging or bypassed towards the drying chamber for food drying operation. As the heated air leaves the drying chamber, the moist air is dehumidified for recirculating within the system. When needed (i.e., no sun and low solar radiation), the heat from the storage tank can be extracted to heat the drying air.
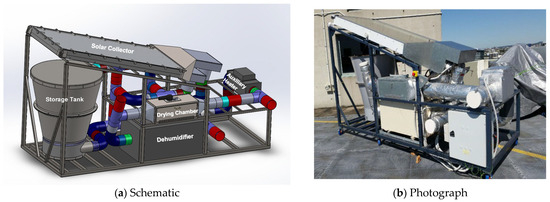
Figure 2.
Solar drying system with components.
The collector was positioned at an inclination angle of 10°, which complies with the ASHRAE recommendation of a minimum tilt to prevent dust accumulation and water stagnation on the glazing surface. The inclination angle is determined based on the latitude of the location and the season in that location [22]. For Brisbane, Australia, the summer-optimized tilt is between 10 and 15° facing the north; the experimental facility was developed mostly to conduct tests in the summer season. The 10° tilt chosen here, therefore, reflects a summer-optimized configuration, ensuring adequate radiation capture while maintaining structural simplicity and ease of integration with the drying setup. Several experimental studies on solar air collectors in Australia and other subtropical climates have employed shallow tilts (5–15°) for testing purposes, particularly when experiments were short-term and conducted during high-sun-angle summer months [3,6].
Temperature and pressure readings were obtained from rigid duct segments placed near the collector, following the recommendations of ASHRAE Standard 93-2010 [19]. The experimental system was designed to operate in both closed-loop and open-loop modes by adjusting dampers at various points. Inlet air temperature was regulated using an auxiliary heater governed by a temperature control unit. Air velocity—and thus the flow rate through the collector—was measured using an anemometer.
3.2. Collector Design
To ensure uniform airflow distribution across the collector channel, perforated sheets were installed within the flow paths of both the front and rear plenums. The base of the V-groove structure was positioned directly on the collector’s back plate. The detailed specifications of the test collector are as follows:
- Absorber material: Mild steel coated with black paint;
- Absorber plate type: V-corrugated with an included angle of 60°;
- V-groove height: 10 cm;
- Dimension of heat absorbing panel: 2 m × 1 m;
- Absorber plate thickness: 1 mm;
- Back and side insulation: Fiberglass wool (Thickness 60 mm);
- No. of glazings: 2;
- Collector mainframe material: Stainless steel (Thickness 3 mm);
- Collector Tilt: 100.
3.3. Instrumentation
The experimental measurements included the inlet and outlet air temperatures, absorber plate temperature, airflow rate, wind speed and direction, solar radiation on the collector surface, and pressure drop across the collector. The setup incorporated both RTDs and T-type thermocouples to monitor temperatures at various points. RTDs were specifically used for measuring inlet and outlet air temperatures, while thermocouples monitored the absorber plate temperature. In order to ensure thermocouple accuracy within the limits specified by ASHRAE [19], these were calibrated. A standard weather station (XC0400 Mini LCD Display Weather Station, by Digitec), which was sources from a local supplier in Brisbane, Australia, was used to record key ambient parameters, including wind speed and direction, air temperature, and relative humidity. The airflow rate was derived using the air velocity—measured by an anemometer at the collector outlet—and the known cross sectional area of the duct.
3.4. Test Procedure
The experiments were conducted at Queensland University of Technology on days forecasted to be clear. Paired tests were carried out to evaluate the reproducibility of results. Data were recorded using a data acquisition system at fixed time intervals. Prior to data collection, the collector was allowed to stabilize thermally for at least one hour. During each test run, both the airflow rate and incoming air temperature were kept constant. The collector was first checked for air leakage across a range of operating pressures. In order to determine the efficiency, the ASHRAE test procedure requires four different values of inlet fluid temperature to be used to obtain the values of ΔT/It. An acceptable distribution of inlet temperatures for flat-plate collectors is to set the ΔT at 10, 30, 50, and 70% of the stagnation temperature rise obtained under given conditions of solar intensity and ambient temperature.
4. Results and Discussions
4.1. Model Validation
Predicted efficiencies at different air flow rates are compared with the experimental data. The comparison of the experimental results to the simulation results is displayed in Figure 3, and it can be seen that the simulation results closely agree with measured outcomes, and hence validate the model proposed. The average difference between experimental and simulated efficiencies is 3%. The instrument uncertainties are ±0.1 °C for RTDs, ±0.2 °C for calibrated thermocouples, ±1.0% for airflow rate (from the anemometer), and ±1.0% for irradiance (pyranometer).
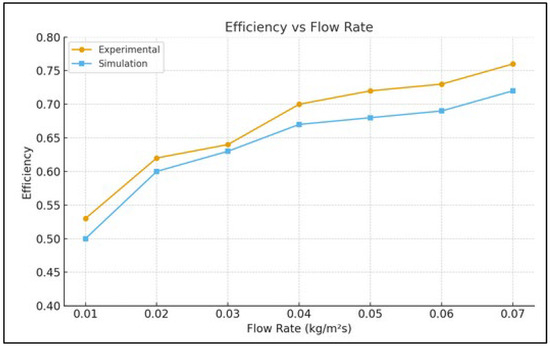
Figure 3.
Variation of efficiency with flow rate: predicted and measured values.
The results of the current double-pass counterflow V-groove collector were compared with reported results of conventional flat-plate and V-groove double-pass solar air collectors available in the literature [8,12,15,16]. Table 1 presents the comparison between the present study (experimental and simulation data) and representative published values for double-pass flat-plate and V-groove collectors at comparable mass flow rates.

Table 1.
Comparison of thermal efficiency of the present study with the literature.
As seen in the table, the efficiency of the present collector increases with flow rate and is comparable to the values reported for V-groove collectors, which are generally superior to flat-plate designs due to enhanced surface area and multiple reflections of incident solar radiation. For example, at a mass flow rate of 0.04 kg/m2s, the experimental efficiency in this study reached 0.70, compared to 0.60 for flat-plate collectors and 0.66 for V-groove collectors reported in the literature. These results confirm that the developed collector not only performs within the expected range of V-groove collectors demonstrates a clear improvement over conventional flat-plate collectors.
This comparative analysis validates the robustness of the present collector design and highlights its suitability for drying applications where high thermal efficiency at moderate mass flux is required. The agreement between experimental data, simulation predictions, and literature benchmarks provides additional confidence in the reliability of the proposed model and its practical application.
Experimental Error Analysis
Measurement uncertainties were propagated using the first-order Taylor series (RSS). Instrument accuracies were as follows: RTDs (air) ±0.1 °C; calibrated thermocouples (plate) ±0.2 °C; anemometer (airflow) ±1.0% of reading; pyranometer (irradiance) ±1.0% of reading. For ΔT = Tout − Tin, .
The useful heat gain is with . The instantaneous efficiency is with . For representative temperature rises in ΔT = 10, 15, and 20 K, the combined uncertainties in η are approximately 2.00%, 1.70%, and 1.58%, respectively; the uncertainties in Qu are 1.73%, 1.37%, and 1.23%. These levels reflect the improved instrumentation and are consistent with good-practice outdoor testing.
4.2. Parameter Analysis of the Solar Air Collector
For the parameter analysis, one parameter was changed at a time, keeping all other parameters constant. Initial parameters considered in this study are presented in Table 2 below.
Table 2.
Initial input parameters.
4.2.1. Solar Radiation
The initial parameter examined was the influence of solar radiation on outlet air temperature and efficiency at various airflow rates. Solar irradiance was varied from 0 to 1000 W/m2, and the simulation results are shown in Figure 4. The figure demonstrates a linear rise in both heat-absorbing panel temperature and outlet air temperature as solar radiation increases. However, at higher mass airflow rates, the outlet temperature decreases, indicating that lower airflow rates yield higher outlet temperatures. Conversely, solar radiation has a minimal impact on efficiency, except at low airflow mass rates. Unlike temperature, efficiency demonstrates a positive correlation with increasing airflow rate.
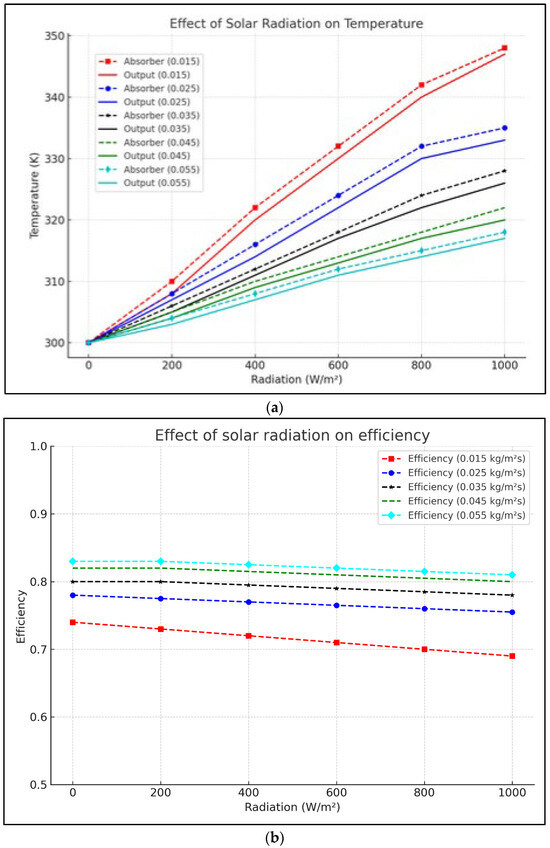
Figure 4.
Effect of solar radiation on (a) output temperature and (b) efficiency.
4.2.2. Inlet Air Temperature
The influence of incoming air temperature on the outlet temperature and the efficiency is displayed in Figure 5. It can be observed from Figure 5a that both the heat-absorbing panel temperature and exit air temperature consistently increase with the rise in incoming air temperature. The outlet temperature is higher at a low mass flow rate. Additionally, it is noticed that at a higher incoming air temperature with a lower mass flow rate, there is a large gap between the plate temperature and the exit air temperature. This is due to higher heat loss through to the ambient. Thus, when the incoming air temperature is high, the operating flow rate should be raised to have better performance. On the other hand, the incoming air temperature has a reverse relation with efficiency as observed in Figure 5b. This indicates that the higher incoming air temperature has a notable influence on air functional output efficiency. Hence, in choosing the most effective operation, caution must be taken to ensure that the inlet temperature is as close to atmospheric temperature.
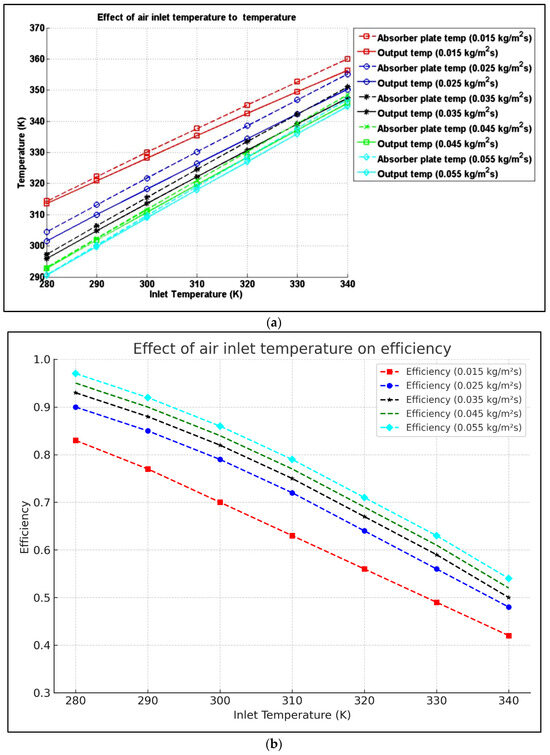
Figure 5.
Effect of inlet air temperature on the (a) absorber temperature, output temperature, and (b) collector efficiency.
4.2.3. Length of Solar Collector
The relationship between the lengths of the collector to the heat transfer coefficient is shown in Figure 6. In the figure, changes in the heat transfer coefficient with the collector length in the first and second passes are shown. As can be seen, the heat transfer increases as the length increases. It is confirmed that turbulence increases heat transfer. Thus, increasing the length has the benefit of improved performance. It can be seen that at the laminar regime, the heat transfer coefficient remains nearly constant. From close observation of the figure, it can be found that the increment of heat transfer rate is higher in the transitional regime than in the fully developed turbulent region. García et al. [23] and Meyer and Oliver [24] support the fact that it is better to operate in the transitional regime. García et al. [23] showed that within the transition region, the heat transfer rate can be increased up to 200% while maintaining a constant pumping power. Thus, it is recommended to choose a combination of solar collector length and air airflow mass rate in such a way that the notable part of the collector is in the transitional regime. It can also be found from Figure 6 that the suggested airflow mass rate range is between 0.025 and 0.055 kg/m2s. This is also justified in the next section with the parametric analysis of the airflow rate.
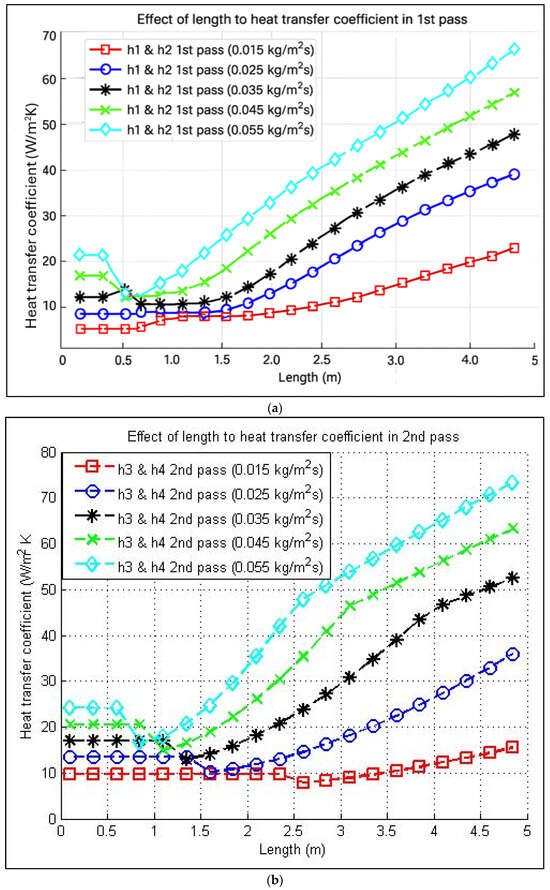
Figure 6.
Change of heat transfer coefficient with length in the (a) first pass and (b) second pass.
From the figures, as shown in Table 3, a relationship between the flow rate and collector length (maximum and minimum length) can be established for keeping the air in a transitional state.
Table 3.
Relationship between mass flow rate and collector length.
4.2.4. Mass Flow Rate
The influence of airflow rate on the exit air temperature and efficiency is displayed in Figure 7. It can be observed that initially, the efficiency rapidly increases with flow rate, but the influence of the airflow rate becomes less and less notable after a certain point. On the other hand, exit air temperature decreases with flow rate, but again, after a specific flow rate, the temperature decrease is low. Close observation of the curves reveals that collector efficiency is low at low air flow rates. The reason is that, at low flow rate, the airflow inside of the collector remains mostly in the laminar regime, causing lower heat transfer coefficients, as referred to in Figure 6. Also, at the lower mass flow rate, there is a greater heat-related loss to the surrounding environment. On the other hand, once the airflow mass rate exceeds the mark, the efficiency is almost the same while the exit air temperature continues to drop. This is because the flow is already in the turbulent regime, and there is not much scope to increase the heat transfer rate. Thus, the most effective operating flow range will be between 0.015 and 0.055 kg/m2s, where transitional flow ensures higher efficiency while maintaining manageable outlet temperatures.
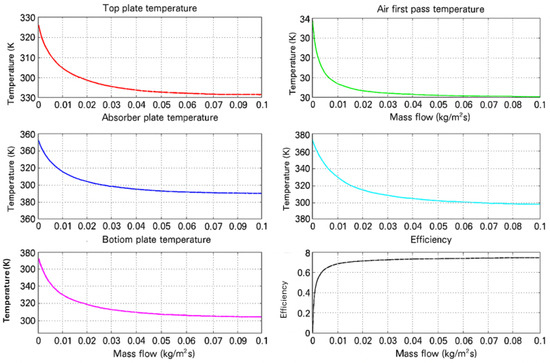
Figure 7.
Effect of mass flow rate on temperature and efficiency.
As solar radiation and airflow rate play essential roles in the performance, a comparative relationship of these two parameters with exit air temperature is represented in Figure 8. As can be seen in the figure, the radiation has a positive impact, whereas the flow rate has an opposite influence on exit air temperature. It is additionally observed that the flow rate has more influence on the exit air temperature compared to solar radiation, as the slope for ‘Output Temperature vs. Mass Flow rate’ is steeper than ‘Output Temperature vs. Radiation’.
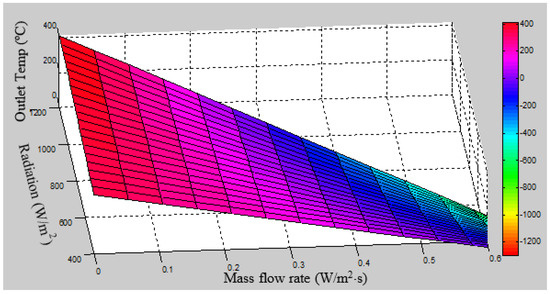
Figure 8.
Variation of output temperature with radiation and mass flow rate for V-groove collector.
4.2.5. V-Groove Height
The impact of the height of the V-groove on the output temperature and efficiency when the (height of V-groove) value ranges from is shown in Figure 9. As shown in Figure 9a, increasing the V-groove height leads to a greater temperature difference between the heat-absorbing panel and the exit air, with this effect being more pronounced at lower flow rates. This phenomenon can be attributed to the decreasing heat transfer coefficient occurring as the V-groove height increases, referenced in Figure 10 and Figure 11. The efficiency is also affected by the groove height. As can be seen in Figure 9, at low values of groove height, the flow is turbulent, then approaches laminar flow as the height increases. Consequently, the heat transfer coefficient is higher at low V-groove heights.
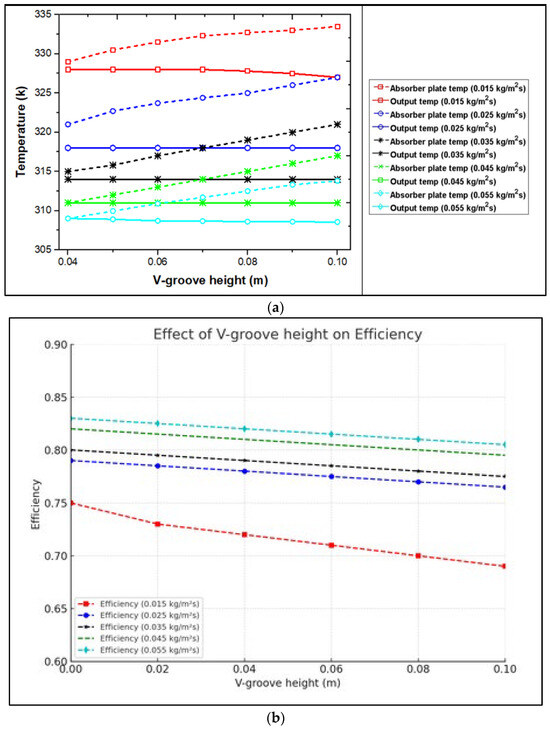
Figure 9.
Effect of V-groove height on (a) temperature and (b) efficiency.
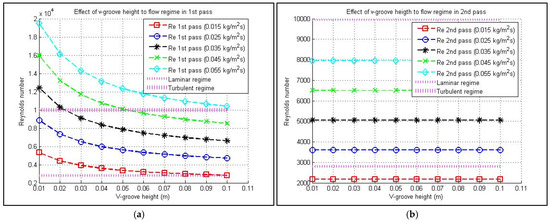
Figure 10.
Flow regime in the (a) first and (b) second passes as the V-groove height increases.
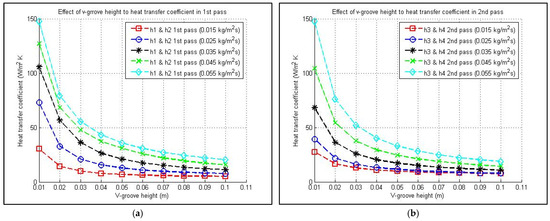
Figure 11.
Heat transfer coefficients in the (a) first and (b) second passes as the V-groove height increases.
4.2.6. Gap Between Transparent Panel and Heat-Absorbing Panel
Figure 12 demonstrates how changes in the gap , ranging from 0 to 0.1 m, between the V-groove absorber and the transparent cover, influences outlet temperature and efficiency. The results indicate that this spacing has minimal impact on both parameters. A slight change in heat-absorbing panel temperature was observed as the gap widened, primarily due to altered flow dynamics within the channel. These variations stem from differences in configuration. Hence, for a dual-pass V-groove solar thermal air unit, the gap between the absorber and the transparent cover does not significantly influence the performance. Nevertheless, the gap should be maintained within a practical range to minimize excessive pressure loss.
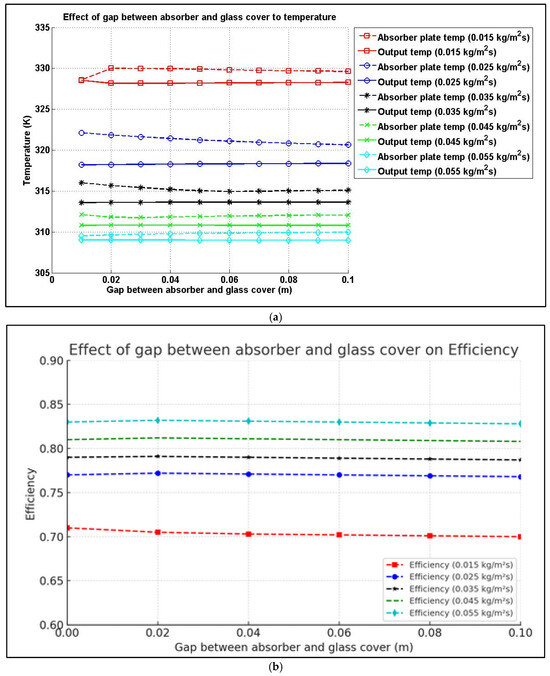
Figure 12.
Effect of the V-groove gap on (a) outlet temperature and (b) efficiency.
Figure 13 displays the evolution of flow regimes in the first and second passes as the V-groove gap increases. While the flow regime in the first pass is impacted by the gap height, the Reynolds number in the second pass does not change. Figure 14 demonstrates how the heat transfer coefficient varies with V-groove height in both flow passes. The data reveal that in the intermediate flow state, the coefficient increases notably in the first pass, whereas the second pass demonstrates no notable variation.
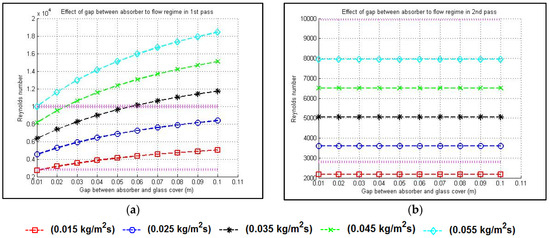
Figure 13.
Flow regime in the (a) first and (b) second passes as the V-groove gap increases.
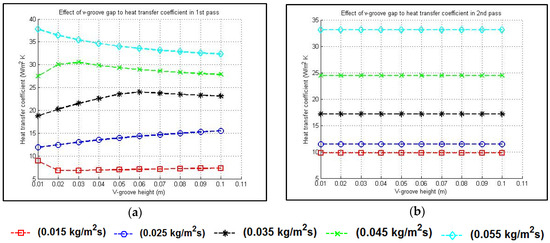
Figure 14.
Heat transfer coefficient in the (a) first and (b) second passes as the V-groove gap increases.
4.2.7. Number of the Glass Cover
The influence of the number of top transparent covers on the output temperature and collector efficiency is shown in Figure 15. It can be seen that the number of transparent covers has a significant effect on the performance of the solar collector. As the number of glass covers increases, the output temperature and efficiency improve. However, this improvement diminishes as more glass cover is added. The number of the glass cover is directly related to the initial cost, and from this study, it can be observed that having two glass covers is best since it provides a significant improvement in thermal performance, but without much increase in cost. It can also be noted that the rise in output temperature and efficiency is more significant at the lower mass flow rate. Thus, if the operation of the solar collector has a low mass flow rate, increasing the number of glass covers can increase the collector’s efficiency by about 20%.
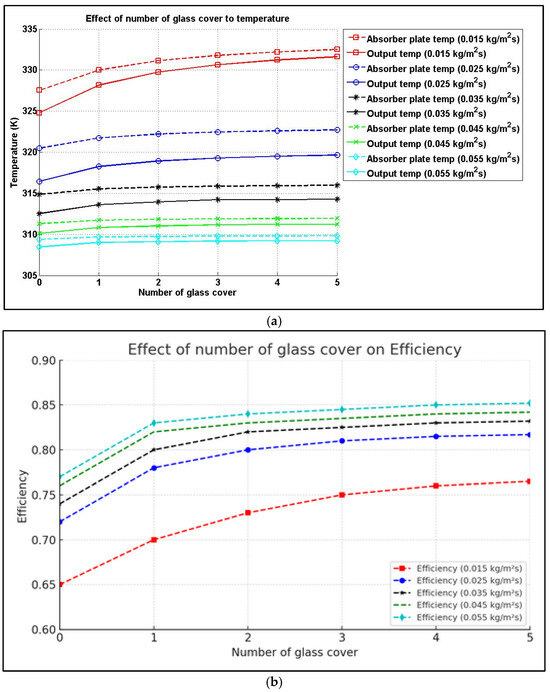
Figure 15.
Effect of number of glass covers on (a) outlet temperature and (b) efficiency.
4.2.8. Back Insulation Thickness
The influence of insulation thickness on the temperature and efficiency is displayed in Figure 16. The insulation improves the efficiency of the solar collector, and it can be observed that both exit air temperature and efficiency increase as thicker insulation is applied. However, the rate of improvement quickly diminishes, although increases in temperature and efficiency continue to increase at a slower rate.
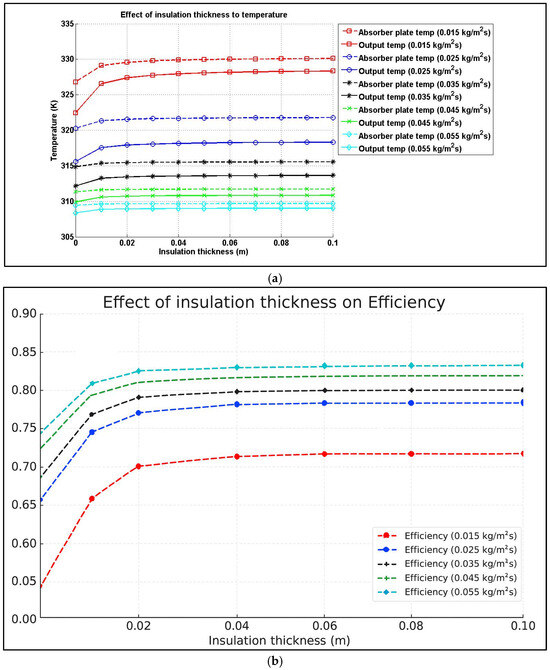
Figure 16.
Effect of insulation thickness on (a) outlet temperature and (b) efficiency.
5. Design Guidelines
The solar thermal system is a cost-effective and environmentally attractive energy solution. The design of an efficient system, however, is intricate. Research carried out has shown that there is a range of seemingly subtle design decisions that can impact the efficiency of solar systems significantly. To reduce the risk of errors in the design process, current comprehensive parameter analysis can provide detailed and precise engineering design information. From the above graphs, some design guidelines are prepared and presented in Table 4.
Table 4.
Design Guide.
By following the guidelines for solar double-pass systems, the designer can expect to achieve a robust, energy-saving solution reliably. It is also vital to have an operation guide and know the trends outlined in Table 5.
Table 5.
Most effective Operating Parameters and Trends.
6. Conclusions
A comprehensive analysis of the impact of operating and design parametrics on the counterflow V-groove air collector was conducted. It was found that incoming air temperature and airflow mass rate have notable impacts on the efficiency and exit air temperature of the air collector. Other parameters studied include the solar radiation, collector length, V-groove height, gap between the absorber and transparent panel, number of transparent panels, and insulation thickness. It was discovered that the airflow rate is a critical operating parameter. The Reynolds number was found to significantly impact the collector’s performance, with optimal heat transfer observed in the intermediate flow regime. Furthermore, dimensional limitations are recommended for the proper sizing and selection of the collector’s key components. The designers should carefully select a combination of solar collector length and air airflow mass rate, so that the principle of the solar collector exposed area is in the transitional regime.
Author Contributions
Conceptualization, A.K.; Methodology, Z.A.; Formal analysis, A.K.; Investigation, A.K. and Z.A.; Resources, A.K.; Writing—original draft, A.K. and Z.A.; Writing—review & editing, S.F.; Project administration, A.K.; Funding acquisition, A.K. All authors have read and agreed to the published version of the manuscript.
Funding
This research received no external funding.
Data Availability Statement
The original contributions presented in this study are included in the article. Further inquiries can be directed to the corresponding author.
Conflicts of Interest
The authors declare no conflict of interest.
Nomenclature
| Specific heat of air | |
| Hydraulic diameter of first and second pass | |
| Gravitational constant | |
| Convection heat transfer coefficient | |
| Glass-cover-to-sky radiative heat transfer coefficient | |
| Radiative heat transfer coefficient | |
| Wind convection heat transfer coefficient | |
| Gap between the V-groove absorber and glass cover | |
| Height of the V-groove | |
| Solar radiation | |
| Thermal conductivity of air | |
| Insulation thermal conductivity | |
| Length of the collector | |
| Air mass flow rate ( | |
| Efficiency of the collector | |
| N | Number of the glass cover |
| Heat transferred to the air in the first and second pass | |
| Solar radiation absorbed by the glass cover and absorber plate | |
| Mean temperatures of surfaces | |
| Ambient temperature | |
| Mean fluid temperature | |
| Sky temperature | |
| Initial air temperature | |
| Output air temperature | |
| Bottom heat loss coefficient | |
| Top heat loss coefficient | |
| Air velocity in the collector | |
| Wind velocity | |
| Width of the collector | |
| Insulation thickness | |
| Absorptivity of the glass cover | |
| Absorptivity of the absorber | |
| Emissivity of the glass cover | |
| Emissivity of the absorber | |
| Emissivity of the bottom plate | |
| Transmittance of the glass cover | |
| Boltzmann constant | |
| Air density | |
| Tilt angle of the collector (degrees) | |
| Dynamic viscosity |
References
- Lingayat, A.; Das, P.; Chandramohan, V.P. A detailed review on performance enhancement of solar air collector systems. Appl. Therm. Eng. 2025, 279, 127530. [Google Scholar] [CrossRef]
- Mkhize, M.M. Review of Solar Crop Drying Efficiency and Its Interconnection with Meteorological Factors. Discov. Energy 2025, 5, 22. [Google Scholar] [CrossRef]
- Desisa, D.G.; Shekata, G.D. Performance Analysis of Flat-Plate and V-groove Solar Air Heater Through CFD Simulation. Int. J. Renew. Energy Dev. 2020, 9, 369–381. [Google Scholar] [CrossRef]
- Karim, M.A.; Perez, E.; Amin, Z.M. Mathematical modelling of counter flow v-grove solar air collector. Renew. Energy 2014, 67, 116–123. [Google Scholar] [CrossRef]
- An, B.-H.; Moon, K.-A.; Kim, S.-B.; Choi, H.-U. Analysis of Heat Transfer and Fluid Flow in a Solar Air Heater with Sequentially Placed Rectangular Obstacles on the Fin Surface. Energies 2025, 18, 3811. [Google Scholar] [CrossRef]
- Prasopsuk, C.; Sutthivirode, K.; Thongtip, T. Performance Enhancement of a Solar Air Heater Equipped with a Tree-like Fractal Cylindrical Pin for Drying Applications: Tests Under Real Climatic Conditions. Energies 2025, 18, 2230. [Google Scholar] [CrossRef]
- Ho, C.-D.; Chang, H.; Hong, Z.-S.; Huang, C.-C.; Chen, Y.-H. Increasing the Device Performance of Recycling Double-Pass W-Ribs Solar Air Heaters. Energies 2020, 13, 2133. [Google Scholar] [CrossRef]
- Ho, C.-D.; Tien, Y.-E.; Chang, H. Performance improvement of a double-pass V-corrugated solar air heater under recycling operation. Int. J. Green Energy 2016, 13, 1547–1555. [Google Scholar] [CrossRef]
- Close, D.J. Solar Air Heaters for Low and Moderate Temperature Applications. Sol. Energy 1963, 7, 117–124. [Google Scholar] [CrossRef]
- Wijeysundera, N.E.; Ah, L.L.; Tjioe, L.E. Thermal Performance study of Two-Pass Solar Air Heaters. Sol. Energy 1982, 28, 263–270. [Google Scholar] [CrossRef]
- Karim, M.A.; Hawlader, M.N.A. Performance investigation of flat plate, v-corrugated and finned air collectors. Energy 2006, 31, 452–470. [Google Scholar] [CrossRef]
- Liu, T.; Wang, R.; Zhang, L.; Yuan, W. A Parametric Study on the Thermal Performance of a Solar Air Collector with a V-Groove Absorber. Int. J. Green Energy 2007, 4, 601–622. [Google Scholar] [CrossRef]
- Quinonez, J.E.; Hernandez, A.L. Analytical models of thermal performance of solar air heaters of double-parallel flow and double-pass counter flow. Renew. Energy 2014, 55, 380–391. [Google Scholar] [CrossRef]
- Ong, K.S. Thermal performance of solar air heaters: Mathematical model and solution procedure. Sol. Energy 1995, 55, 93–109. [Google Scholar] [CrossRef]
- Gupta, A.; Kumar, R.; Ramani, B.M. Performance of a double pass solar air collector. Sol. Energy 2010, 84, 1929–1937. [Google Scholar] [CrossRef]
- Labed, A.; Moummi, A.; Benchabane, A.; Nouacer, S. Performance investigation of single- and double-pass solar air heaters through the use of various fin geometries. Int. J. Sustain. Energy 2012, 31, 423–434. [Google Scholar] [CrossRef]
- Dhiman, P.; Singh, S. Thermal performance assessment of recyclic double-pass flat and V-corrugated plate solar air heaters. Int. J. Sustain. Energy 2017, 36, 78–100. [Google Scholar] [CrossRef]
- Hassan, A.; Nikbakht, A.M.; Welsh, Z.; Yarlagadda, P.; Fawzia, S.; Karim, A. Experimental and thermodynamic analysis of solar air dryer equipped with V-groove double pass collector: Techno-economic and exergetic measures. Energy Convers. Manag. X 2022, 16, 100296. [Google Scholar] [CrossRef]
- ASHRAE Standard 93-2010; Methods of Testing to Determine the Thermal Performance of Solar Collectors. ASHRAE: Atlanta, GA, USA, 2010.
- Klein, S.A. Calculation of Flat Plate Collector Loss Coefficients. Sol. Energy 1975, 17, 79–80. [Google Scholar] [CrossRef]
- Hollands, K.G.T.; Shewen, E.C. Optimization of flow passage geometry for air-handling, plate type solar collectors. J. Sol. Energy Eng. 1981, 103, 323–330. [Google Scholar] [CrossRef]
- Duffie, J.A.; Beckman, W.A. Solar Engineering of Thermal Processes, 2nd ed.; Wiley: New York, NY, USA, 1991. [Google Scholar]
- García, A.; Vicente, P.G.; Viedma, A. Experimental study of heat transfer enhancement with wire coil inserts in laminar-transition-turbulent regimes at different Prandtl numbers. Int. J. Heat Mass Transf. 2005, 48, 4640–4651. [Google Scholar] [CrossRef]
- Meyer, J.P.; Olivier, J.A. Transitional flow inside enhanced tubes for fully developed and developing flow with different types of inlet disturbances: Part II—Heat transfer. Int. J. Heat Mass Transf. 2011, 54, 1598–1607. [Google Scholar] [CrossRef]
Disclaimer/Publisher’s Note: The statements, opinions and data contained in all publications are solely those of the individual author(s) and contributor(s) and not of MDPI and/or the editor(s). MDPI and/or the editor(s) disclaim responsibility for any injury to people or property resulting from any ideas, methods, instructions or products referred to in the content. |
© 2025 by the authors. Licensee MDPI, Basel, Switzerland. This article is an open access article distributed under the terms and conditions of the Creative Commons Attribution (CC BY) license (https://creativecommons.org/licenses/by/4.0/).