Abstract
This paper proposes a coalition-based framework for the coordinated operation of multi-regional power systems subject to extreme uncertainty in demand surges, renewable variability, and resource mobilization delays. Methodologically, we integrate Bayesian learning with distributionally robust optimization (DRO), embedding dynamically updated scenario posteriors into a Wasserstein ambiguity set. This construction captures both stochastic variability from renewable and load realizations and epistemic uncertainty from incomplete knowledge of probability distributions. To align individual incentives with system-level efficiency, we design a risk-adjusted utility mechanism that combines VCG transfers, Shapley allocations, and nucleolus refinements. These mechanisms explicitly consider agent heterogeneity, risk aversion, and coalition stability, ensuring that cooperation remains both efficient and sustainable. The optimization model maximizes expected social welfare while incorporating constraints on transmission corridor capacities, mobilization logistics, demand–response rebound effects, and mobile energy storage operations. A hierarchical decomposition algorithm integrates the Bayesian-DRO dispatch layer with cooperative game-theoretic allocations to maintain tractability and robustness at large scale. A case study on a six-province interconnected system with 14–26 GW peak demand, 10.2 GW solar, 8.6 GW wind, 14 GW peaking units, and 6.8 GW mobile storage demonstrates the effectiveness of the approach. Results indicate that the proposed framework raises expected welfare by nearly 10% relative to a non-cooperative baseline, reduces the probability of unserved energy exceeding 1.5% from almost 2% to negligible levels, and narrows payment disparities across provinces to strengthen coalition stability. Demand response peaks at 250–300 MW with rebound averaging 25%, while mobile BESS units cycle frequently to enhance local reliability. Overall, the findings highlight a robust and incentive-compatible pathway for resilient inter-provincial operation, providing both methodological advances and policy-relevant insights for multi-regional energy governance.
1. Introduction
In the context of intensifying climate volatility and a rapidly interconnected infrastructure landscape, regional power systems are increasingly compelled to reconsider how they prepare for and respond to extreme events. Phenomena such as typhoons, heatwaves, cold spells, wildfires, and compound hazards are no longer rare disruptions but have become defining features of the modern energy environment [1,2,3]. These events interrupt generation, damage transmission corridors, destabilize market operations, and, most critically, create large-scale imbalances between electricity supply and demand [4,5]. In response, many jurisdictions have established inventories of emergency power supply resources, including mobile battery trailers, diesel backup generators, utility-scale energy storage systems, demand response agreements with industrial and commercial users, and distributed renewables dedicated to emergency dispatch [6,7]. While these resources are playing an increasingly vital role in strengthening local energy resilience, a pronounced asymmetry persists between the spatial distribution of emergency assets and the spatial distribution of disaster impacts [8]. This imbalance reveals a natural opportunity for resource sharing across regions. Yet, despite the existence of inter-regional transmission corridors and evident complementarities among resources, the coordination of power guarantee resources across regions remains limited and inefficient [9,10].
The primary obstacle to effective coordination is less technical than institutional and behavioral problems. In most cases, emergency resources are controlled by decentralized actors such as municipal governments, private utilities, industrial clusters, or provincial system operators [11]. These entities possess operational autonomy, face asymmetric information, and operate under heterogeneous cost structures and conflicting incentives. In emergency contexts, such agents typically act conservatively—mobilizing their own assets to secure local demand and withholding surplus capacity from others unless compelled or explicitly compensated [12,13,14]. Although rational from the standpoint of individual stakeholders, this self-preservation behavior generates system-level inefficiencies: scarce resources may remain idle in one region while unmet demand intensifies in another. This constitutes a classic coordination failure driven by misaligned incentives, uncertainty, and the absence of enforceable cooperation mechanisms. Existing bilateral emergency agreements are often ad hoc, relying on vague cost-sharing arrangements or non-binding memoranda of understanding, and seldom incorporate temporal dynamics, informational asymmetries, or strategic reporting behavior under uncertainty [15,16].
The shortcomings of fragmented coordination have prompted scholars to investigate diverse approaches to modeling energy resilience, cooperation, and uncertainty. One prominent line of research emphasizes grid hardening through investments in physical redundancy, backup generation, and decentralized energy systems. Within this stream, optimization models have been formulated to determine the allocation of mobile assets, the siting of emergency storage, and the scheduling of demand-side responses under stochastic outage scenarios [17,18]. While these contributions are valuable, they typically rest on assumptions of centralized control, perfect foresight, and a single system operator optimizing for collective welfare. Such assumptions neglect the agency, autonomy, and strategic considerations of decentralized actors. More recent studies have examined distributed optimization and market-based dispatch for microgrids, yet these approaches still do not fully capture the game-theoretic coordination challenges that emerge when multiple stakeholders with private objectives must cooperate under uncertainty [19,20].
In parallel, cooperative game theory has provided powerful tools for analyzing coalition formation, benefit allocation, and stability assurance. Classical concepts such as the Shapley value, the nucleolus, the core, and other axiomatic solution approaches have been widely applied to problems including transmission planning, cost allocation for joint infrastructure, and profit-sharing in peer-to-peer energy systems [21,22,23]. These tools enable a formal examination of fairness and efficiency in multi-agent resource sharing contexts. Nevertheless, most existing models remain static and rely on exogenously specified utility functions or benefit matrices. They do not incorporate the physical realities of power system operations—such as nodal balance, line capacities, ramping constraints, and storage mobility—nor do they account for the endogenous effects of agent decisions on uncertainty and feasibility. Moreover, these formulations are typically disconnected from dynamic learning, strategic misreporting, and multi-period interactions, all of which are critical in emergency energy coordination [24,25].
Mechanism design theory, particularly the Vickrey–Clarke–Groves (VCG) class of payment mechanisms, offers a rigorous framework for eliciting truthful behavior from self-interested agents. In settings characterized by private information, VCG mechanisms guarantee that truth-telling constitutes a dominant strategy, thereby aligning individual incentives with the maximization of social welfare [26,27]. VCG-based approaches have been successfully applied to problems such as transmission investment auctions, market clearing under incomplete information, and reserve capacity markets. However, their application has been limited in network-constrained physical systems, where decisions must also satisfy non-convex feasibility requirements [28,29]. Embedding VCG payments into physically realistic dispatch models remains a challenging task, as it requires reconciling complex non-linear operational constraints with the incentive structures necessary to sustain cooperation [30].
To bridge these gaps, this paper develops a unified framework that integrates Bayesian game theory, cooperative cost-sharing rules, VCG-based mechanism design, repeated game dynamics, and distributionally robust optimization within a physically constrained power system dispatch environment. In this formulation, each regional actor is modeled as a rational agent managing a heterogeneous portfolio of resources—generators, batteries, and demand-side flexibility—while facing localized uncertainties regarding demand shocks, event trajectories, and interconnection availability. Agents operate in a stochastic environment characterized by incomplete information and evolving threat scenarios. To capture this structure, we construct a Bayesian game in which each agent selects actions based on its private type (including cost coefficients, resource availabilities, and reliability preferences) and its beliefs about the strategies of others. The equilibrium of this game represents the decentralized outcome in the absence of enforced coordination. The model is then extended to a cooperative setting where agents may form coalitions to pool resources and share benefits. Benefit distribution is governed by both Shapley-based and nucleolus-based allocation rules: the Shapley value ensures fairness through marginal contributions, while the nucleolus guarantees stability by minimizing the dissatisfaction of sub-coalitions. These allocation rules are embedded in a higher-level coordination protocol that enables flexible resource pooling under network and operational constraints. To ensure the sustainability of such cooperative arrangements in environments with private information, a VCG-compatible payment mechanism is introduced. This mechanism incentivizes truthful reporting by granting each agent a net payoff that reflects its externality on the system, computed through marginal welfare comparisons with and without its participation.
Recognizing that emergency events recur across seasons, years, and crises, the one-shot game is embedded into a repeated framework. In this extended setting, agents accumulate or lose reputation based on their observed cooperative behavior. Reputation, in turn, influences future payment shares and determines priority in resource dispatch or cost allocation. This repeated interaction introduces dynamic incentives that are critical for sustaining long-term collaboration among regions with persistent interdependence. The entire game-theoretic structure is integrated into a bi-level optimization framework. The upper level captures strategic reporting, coalition formation, and payment calculation, while the lower level models the operational feasibility of resource dispatch. The lower level is formulated as a mixed-integer linear program (MILP) that incorporates power balance, DC flow constraints, generator commitment, battery state-of-charge dynamics, mobilization delays, demand response windows, and inter-regional transfer paths. This architecture enables the model to simultaneously reflect the economics of agent interaction and the physics of grid operation. To address model ambiguity and probabilistic tail risk, distributionally robust reliability constraints are introduced using Wasserstein ambiguity sets. These constraints ensure that the probability of exceeding a critical loss-of-load threshold remains below a planner-defined tolerance, even under worst-case distributions within the ambiguity set. Bayesian posterior updating is applied to refine scenario probabilities in real time as partial observations of unfolding events become available. This integration of Bayesian learning with distributionally robust optimization creates a dynamic, risk-aware coordination structure that is well-suited to decision-making under incomplete information and evolving threats. Finally, the framework is validated through a case study involving six interconnected provincial power systems in a climate-vulnerable region. The study evaluates coordination outcomes under three regimes: non-cooperative decentralized response, bilateral emergency contracts, and grand coalition with incentive-compatible contracts. Performance is assessed in terms of system-wide loss-of-load probability, total mobilization cost, coalition stability, and fairness of payment distribution. Results demonstrate that cooperative strategies enabled by truthful mechanism design and dynamic reputation management consistently outperform both independent responses and rigid contractual arrangements, particularly in environments characterized by deep uncertainty and rapidly evolving disruptions.
Building on the comparison in Table 1, several concrete research gaps can be identified that motivate this study. First, while robust and distributionally robust optimization methods have been widely investigated, most remain confined to static formulations that optimize against uncertainty without incorporating the cooperative structures necessary for cross-regional resource sharing. This leaves unanswered how robustness can coexist with coalition stability and incentive alignment.
In addition, recent work on robust dispatch has enriched this field by developing data-driven hierarchical models for renewable-rich systems. For example, the study “Managing Massive RES Integration in Hybrid Microgrids: A Data-Driven Quad-Level Approach with Adjustable Conservativeness” proposes a quad-level framework that adaptively tunes conservativeness in dispatch decisions to balance robustness and efficiency under massive renewable integration. While this line of research significantly advances uncertainty-aware dispatch in microgrids, it primarily targets local operational reliability and does not address coalition stability, incentive compatibility, or large-scale inter-regional coordination.
Related work on electric-vehicle coordination also informs robust dispatch. Shang et al. [31] analyze the computational performance of centralized, grid-operator-oriented coordinated charging for plug-in electric vehicles, revealing scalability–efficiency trade-offs that arise in large populations. Complementarily, Li et al. [32] develop an accessible closed-loop vehicle-to-vehicle (V2V) charging mechanism under a non-cooperative game at charging stations, showing how direct energy sharing can expand service accessibility. These studies advance algorithmic and game-theoretic coordination on the demand side; however, they remain EV-centric and local in scope, without modeling network-constrained inter-provincial transfers, coalition-stable benefit allocation, or incentive-compatible payments [33]. Our framework generalizes these insights to a multi-region setting by integrating Bayesian learning with distributionally robust optimization and coalition mechanisms.

Table 1.
Comparison with recent state-of-the-art studies (2021–present).
Table 1.
Comparison with recent state-of-the-art studies (2021–present).
| Study Title | Focus | Limitation |
|---|---|---|
| Robust optimization over time: a critical review [34] | Comprehensive review of robust and distributionally robust optimization methods. | Focuses on static formulations; lacks integration with cooperative or coalition-based frameworks. |
| Benefit distribution mechanism of a cooperative alliance for basin water resources from the perspective of cooperative game theory [35] | Applies cooperative game theory (Shapley, Nucleolus) to resource allocation. | Addresses fairness but without uncertainty modeling or energy system applications. |
| The Bayesian learning rule [36] | Establishes a general Bayesian learning framework for adaptive decision-making. | Theoretical contribution; no application to multi-agent power system coordination. |
| Cross-regional and multi-entity resource coordination can enhance the supply of disaster relief materials during flood events in China [37] | Demonstrates benefits of cross-regional coordination in disaster response. | Focused on logistics; does not address energy or power system coordination under uncertainty. |
| This study | Coalition-based Bayesian-DRO for inter-provincial power systems, integrating VCG, Shapley, and Nucleolus. | Addresses robustness, fairness, and stability jointly, validated on a large-scale case study. |
Second, cooperative game-theoretic approaches such as the Shapley value and the nucleolus emphasize fairness, but they are usually detached from physical grid operations and uncertainty models. As a result, they provide allocation rules without addressing whether such rules remain feasible under line limits, ramping constraints, and stochastic demand fluctuations.
Third, Bayesian learning frameworks are increasingly recognized as powerful tools for adaptive decision-making under incomplete information, yet their deployment in energy system coordination remains largely unexplored. In particular, prior work has not examined how posterior updating can be embedded into operational dispatch models where agent incentives and coalition formation play decisive roles.
Finally, existing studies on cross-regional emergency coordination often focus on material logistics or static agreements, with limited treatment of the temporal dynamics of mobilization delays, demand–response rebound effects, and the stability of coalitions under repeated interactions. These gaps collectively hinder the development of frameworks that are simultaneously robust, fair, and operationally credible. In contrast, this study addresses these gaps by proposing a coalition-based Bayesian–DRO framework that unites robustness, fairness, and stability, and validates the design through a large-scale inter-provincial power system case study.
The comparison above highlights several research gaps that motivate this study:
- Existing robust optimization approaches often remain static and do not incorporate coalition or cooperative mechanisms.
- Cooperative game-theoretic studies emphasize fairness but largely neglect uncertainty modeling and power system constraints.
- Bayesian learning frameworks provide theoretical insights but have not been applied to multi-agent power system coordination.
- Cross-regional coordination research has focused primarily on logistics, with limited treatment of energy system operations under uncertainty.
In contrast, this study develops a coalition-based Bayesian-DRO framework that integrates robustness, fairness, and stability, validated through a realistic large-scale inter-provincial power system case.
The remainder of this paper is organized as follows. Section 2 presents the mathematical modeling framework, including the Bayesian-DRO formulation and the cooperative game-theoretic allocation mechanisms. Also, it describes the hierarchical solution methodology that integrates decomposition techniques with Bayesian updating and coalition stability refinements. Section 3 details the case study design, including system data, uncertainty modeling, and scenario generation. Section 4 reports the main results, comparing cooperative and non-cooperative regimes in terms of welfare, reliability, and payment stability, followed by sensitivity analyses. Finally, Section 5 concludes the paper by highlighting the key contributions, policy implications, and potential directions for future research.
2. Mathematical Modeling
To formally capture the multi-agent decision environment under spatiotemporal uncertainty, we construct a mathematical model that explicitly links system-level welfare with agent-level utilities, while embedding reliability constraints, mobilization dynamics, and risk adjustments. The formulation begins with a set of objective functions—maximizing expected reliability-adjusted social welfare and representing risk-adjusted utilities of individual agents—and proceeds to develop a series of structural constraints that govern corridor capacities, temporal load balancing, demand response rebound effects, and the operation of mobile energy storage units. This modeling framework, expressed in terms of long-horizon scenarios, probability distributions, and coalition stability conditions, provides the analytical foundation for linking cooperative game-theoretic allocations with robust power system operation.
Figure 1 visualizes the streamlined system framework, where spatiotemporal uncertainty analysis and cooperative game strategies feed into Bayesian coordination and incentive mechanisms, ultimately yielding reliable and feasible multi-agent dispatch outcomes within a compact, bounded design. The framework is structured in four layers for clarity. (1) Uncertainty modeling: renewable generation, load demand, and mobility delays are represented as stochastic scenarios , further embedded into a Wasserstein ambiguity set for distributionally robust optimization. (2) Operational layer: nodal balance (Equation (3)), DC power flow (Equation (4)), storage dynamics (Equation (6)), and demand response with rebound (Equation (7)) are explicitly captured, ensuring feasibility under physical constraints. (3) Mechanism layer: incentive-compatible VCG transfers (Equation (9)), fairness benchmarks such as the Shapley value and nucleolus (Equations (14)–(16)), and ε-core stability (Equation (11)) are introduced to guarantee truthful participation and coalition stability under uncertainty. (4) Learning and decomposition: Bayesian updating (Equation (13)) refines scenario probabilities as new observations arrive, while cutting-plane and Benders decomposition (Equations (18)–(20)) solve the DRO subproblems efficiently, with convergence certified in Equation (21). Arrows denote the flow of information across layers: updated distributions influence robust dispatch, which feeds back into coalition allocation and incentives.
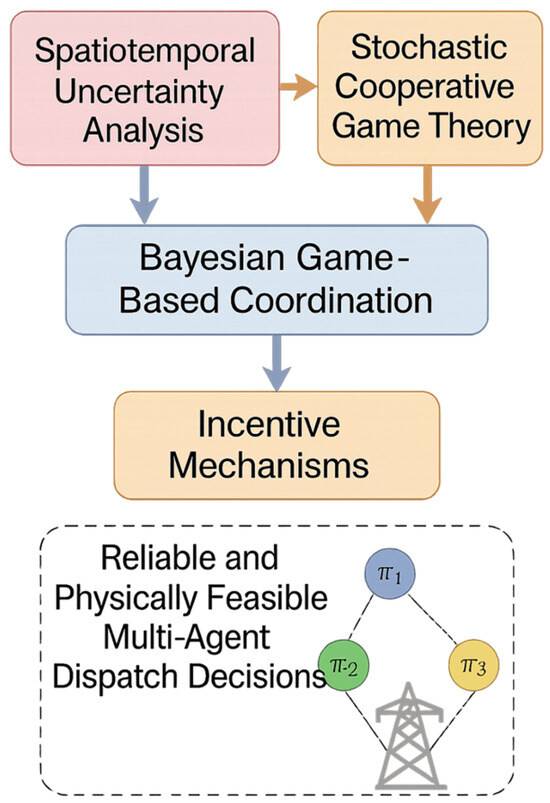
Figure 1.
Integrated system framework for cross-regional power guarantee resource coordination under spatiotemporal uncertainty.
This formulation captures the social welfare optimization of a distributed, uncertain, and incentive-constrained power network. At its heart lies a full-expectation over the joint scenario space , where agents act at nodes over time periods . Benefits come from reliability-weighted delivered load, , and are reduced by lost load penalties , operation and commitment costs across generators , as well as storage mobilization and degradation . Power flow violations incur penalties via , and demand-side services incur disutility terms through and . The final term inside the expectation, , reflects the incentive-compatible payments that internalize strategic behavior. Beyond this, the planner penalizes extreme loss-of-load via with risk weight , and hedges against distributional ambiguity using a Wasserstein ball , regulated by robustness parameter , ensuring the design is reliable, equitable, and robust under both information asymmetry and uncertain futures.
This agent-specific utility function is engineered to reflect an expressive and risk-sensitive payoff under strategic uncertainty. The first term—the expected gain—encodes the net benefit derived from avoided load shedding (weighted by the agent’s private reliability valuation ), receipt of mechanism transfers , and the deduction of operation , mobilization , and opportunity costs . The second term introduces downside risk via a conditional value-at-risk , penalizing extreme losses, weighted by risk aversion . The third term deploys an entropic disutility function regulated by the risk sensitivity , capturing exponential aversion to cost variability. Together, this construction internalizes both strategic misreporting incentives and tail behavior into a coherent utility representation, ensuring alignment between decentralized incentives and centralized welfare under the Bayesian game structure.
This is the nodal balance constraint, ensuring Kirchhoff-like conservation at each node under each scenario and time period . The aggregated sum of generation , battery discharges , minus battery charges , net inflows from neighboring nodes via power lines , demand response relief , and unserved demand , all collectively must meet the actual requested demand . Each element in the summation belongs to the local operational sphere of agent located at node , and together they preserve instantaneous spatiotemporal feasibility under power system physical laws and operational arrangements.
This constraint encodes the DC approximation of power flows across the transmission corridor ℓ connecting nodes m and n. The flow is driven by the nodal voltage angle difference, scaled by the susceptance of the line. At the same time, the flow must lie within capacity limits , which may themselves be stochastic or scenario-contingent (e.g., due to line outages or capacity de-ratings under contingency ). This coupling introduces inter-regional physical constraints into the game-theoretic decision space, embedding power transfer feasibility into the strategic model and tightly linking each agent’s potential exchanges with global grid topology and physics.
These conditions orchestrate the internal dynamics of conventional generators for every agent , across all times and scenarios. The ramping limits and enforce physical generator inertia, capping both upward and downward transitions in dispatch levels . Logical consistency is ensured using binary variables , with large-M formulations providing relaxation when generators switch on or off. Start-up and shut-down activities are captured via auxiliary binary variables and , feeding into cost and availability models. These constraints encode realistic generator physics and coordination rules, anchoring dispatch decisions in legacy system capabilities and introducing necessary time-coupling effects into the optimization landscape.
This block governs the evolution and operation of hybrid and mobile energy storage systems , mapping the energy state-of-charge across time with nonideal charging and discharging efficiencies , . Boundaries enforce safe energy limits, while upper bounds limit charge/discharge power. The mutual exclusivity constraint guarantees that no simultaneous charging and discharging occurs—a physical impossibility. Moreover, mobility is reflected through a SoC nullification condition if the unit is in transit. This dynamic system couples temporal battery evolution with mobility and control actions, forming an intricate hybrid system representation essential for modeling distributed energy resource dispatch under emergency and uncertainty-driven scenarios.
Demand-side flexibility must follow logistical and behavioral bounds. This constraint suite governs demand response (DR) activations and rebound effects with per-node limits , temporal budgets , and mutually exclusive behavior (you can’t rebound and activate at the same time). The rebound in period is conditional on activation in , capturing behavioral inertia. This rich DR model accommodates both contractual limits and human behavior, allowing fine-grained and dynamic control over demand-side contributions in emergency events.
Here, we describe inter-regional transfer flexibility via corridor augmentation. Base flow capacity is extended by mobile transfer units , which become available only after transit delays . Convoy logistics are bounded via , and the arrival/departure states of mobile units are linked explicitly. During transit, energy content is reset (SoC = 0), preventing ghost injections. This constraint enables spatiotemporal transfer flexibility by harnessing mobile infrastructure, such as grid-forming inverters or trailer-mounted storage, essential for modeling resilience in realistic extreme-event contexts.
This is the incentive compatibility constraint for the Vickrey–Clarke–Groves mechanism. For every agent , the expected utility when truthfully reporting their private information must dominate the utility from any misreport . This mechanism ensures strategic transparency by making honesty the dominant strategy, aligning local incentives with system-wide optimization—even in the presence of incomplete information, competition, and uncertainty.
This pair of conditions secures individual rationality (IR) and budget balance. Each agent must expect non-negative utility to ensure voluntary participation, while total incentive payments are bounded by a central planner’s system budget . These conditions serve as economic feasibility checks, linking the game-theoretic model to realistic market operation and regulatory constraints.
This constraint formalizes "coalition stability" via the -core. No subset of agents should benefit by deviating from the grand coalition, up to a margin . The left-hand side reflects expected individual utilities within the grand plan; the right-hand side captures the optimal welfare achievable if forms its own sub-alliance. This constraint fosters full cooperation, curtails fragmentation, and embeds fairness and stability in the multi-agent structure.
Finally, this constraint enforces "distributionally robust reliability": the probability—evaluated over all distributions in a Wasserstein ambiguity ball —that total unserved energy exceeds a critical threshold , must be less than the planner’s risk tolerance . This guarantees resilience even when the true event distribution is uncertain, ensuring that tail-risk events like blackouts are managed under model ambiguity.
3. Methodology
Building upon the mathematical formulation, the solution methodology is deliberately constructed as an interactive workflow in which decomposition techniques, Bayesian updating, and cooperative allocation rules complement each other in a tightly coupled manner. Rather than being applied as separate modules, these components operate in a sequential yet interdependent fashion to ensure that both computational feasibility and incentive alignment are preserved under high-dimensional uncertainty. At the computational core, a Benders-type decomposition provides the structural backbone by dividing the original large-scale stochastic optimization into a set of tractable master and subproblems. This structure allows the system to handle the dimensionality of multiple agents and scenarios without sacrificing solvability. The decomposition process, however, does not operate in isolation; it is continuously shaped by Bayesian scenario updating, which dynamically refines the probability distribution of uncertain events based on partial observations and incoming signals. By embedding these posterior updates directly into the subproblems, the framework ensures that operational feasibility is evaluated against the most up-to-date probabilistic landscape, thereby enhancing robustness to evolving uncertainty. Once reliable dispatch solutions are generated through this Bayesian-DRO informed decomposition layer, cooperative allocation rules are subsequently invoked to translate the system-level outcomes into agent-level utilities. Specifically, VCG transfers, Shapley values, and nucleolus adjustments are employed in a coordinated manner to distribute welfare gains fairly while safeguarding coalition stability. In this workflow, decomposition guarantees scalability, Bayesian updating ensures adaptiveness to real-time information, and cooperative allocation provides fairness and stability across heterogeneous participants. Taken together, these components form a hierarchical structure in which probabilistic refinement directly informs decomposition, and decomposition outputs are seamlessly linked to allocation mechanisms. This layered design ensures that tractability, adaptiveness, and incentive compatibility are simultaneously achieved, ultimately leading to robust, equitable, and coalition-stable outcomes under extreme uncertainty.
This is the Bayesian posterior update of scenario probabilities given partial observation , such as early warning indicators, forecast signals, or partial failures. The likelihood translates evidence into belief strength, updating the planner’s scenario distribution to reflect real-time knowledge. This equation dynamically re-weights all possible , and is critical for adaptive, intelligent resource coordination under evolving uncertainty.
The VCG payment for agent is constructed via marginal welfare impact. is the optimal system welfare without , and is the welfare excluding ’s benefit but including their presence. This ensures that the agent pays (or receives) exactly the net externality they impose on others—making truthful reporting a dominant strategy. This elegant formula underpins the entire incentive-compatibility machinery. Within the unified coalition framework, the VCG rule is not treated as an isolated solution, but as the efficiency-oriented benchmark that ensures incentive compatibility and highlights the welfare-maximizing perspective of resource allocation.
The Shapley value assigns fair payoff to agent by averaging their marginal contribution across all possible arrival orders of agents. Here, is the set of players preceding in order , and is the coalition welfare function. This equitable allocation rule is often used to benchmark payments or evaluate fairness under transferable utility settings. In this context, the Shapley value serves as the fairness-oriented complement to the efficiency benchmark, illustrating how cooperative payoffs can be distributed proportionally to agents’ marginal contributions without undermining the broader Bayesian-DRO structure.
The nucleolus allocation minimizes the maximum dissatisfaction (excess) among all coalitions , defined as the gap between coalition value and allocated payments. It ensures stability by addressing the worst-off group first, in lexicographic order. This rule is highly robust and unique, often used when fairness under threat of defection is paramount. The Nucleolus is accordingly positioned as the stability-oriented refinement, ensuring that no subgroup of agents has an incentive to deviate, thereby completing the balance between efficiency, fairness, and stability within the overall allocation framework.
In the repeated-game framework, each agent’s reputation evolves over time. The reputation update follows a weighted average of past value and current action, controlled by memory factor . The indicator function assigns 1 if the agent cooperated, 0 otherwise. This temporal reputation dynamic is vital for long-term incentive alignment—punishing defection and rewarding consistent cooperation.
This bilevel reformulation embeds the lower-level MILP optimality conditions into the upper-level strategy problem. The lower layer represents operational dispatch , and the upper layer defines strategic resource allocation . Reformulating it into a single-level MPEC (Mathematical Program with Equilibrium Constraints) requires dualization and linearization (e.g., big-M or KKT). This machinery bridges decentralized decision-making with centralized feasibility.
This reformulation handles the DRO (Distributionally Robust Optimization) inner supremum using gradient-based linearization at each sampled point , yielding a cutting-plane method. The Wasserstein ball radius controls ambiguity, and the dual norm penalizes steep gradients. Each iteration cuts off unsafe decision regions until robust feasibility is achieved.
This is the standard Benders decomposition cut, where is the approximation of the lower-level cost function. The subgradient obtained from the dual solution at iteration k allows a piecewise linear outer approximation. This technique dramatically accelerates large-scale bilevel DRO formulations by separating structure and iteratively improving the master problem.
The convergence certificate for the iterative solution process guarantees that the relative optimality gap between upper bound (UB) and lower bound (LB) at iteration k is less than a threshold . This allows early stopping with provable suboptimality, a necessary tool in computationally intensive games and robust optimization.
This final expression provides an asymptotic computational complexity of the proposed hierarchical optimization framework. It scales cubically with number of agents due to coalition analysis and linearly with time and scenarios. The logarithmic dependency on the precision results from convergence of subgradient and cutting-plane methods. This insight helps assess feasibility and choose between exact and approximate solvers.
In summary, the proposed methodology should be interpreted not as a loose collection of analytical tools but as a unified workflow where each component plays a distinct yet complementary role. The decomposition methods provide the structural foundation by partitioning the large-scale stochastic optimization into solvable layers, thereby ensuring computational tractability across agents, time periods, and scenarios. This backbone is continuously enriched by Bayesian updating, which incorporates real-time signals and partial observations to refine the probabilistic description of uncertain events, so that dispatch decisions are always evaluated against the most credible and up-to-date information set. The cooperative allocation rules are then superimposed on these optimized operational outcomes, transforming system-level welfare into equitable and stable benefit distributions that secure fairness and coalition stability. Importantly, these three methodological layers do not operate in isolation; their interaction forms a closed loop in which probabilistic refinement guides decomposition, decomposition outputs feed into allocation, and allocation outcomes reinforce long-term coalition incentives. By embedding this circular interaction, the framework achieves a balance between scalability, robustness, and incentive alignment. It ensures that the final solutions are not only computationally feasible under high-dimensional uncertainty but also resilient to distributional ambiguity and credible to heterogeneous agents who must voluntarily participate. This integrative perspective highlights that efficiency, robustness, and fairness are not competing goals but can be realized simultaneously through a carefully designed workflow that couples decomposition, Bayesian learning, and cooperative allocation into a coherent whole.
4. Results
The case study is constructed on a stylized but data-informed model of six interconnected provincial-level power systems in Eastern Asia, chosen to emulate realistic diversity in load, resource endowment, and interconnection topology. Each province is modeled with a baseline annual peak demand ranging from 14 GW to 26 GW, with hourly demand profiles derived from historical load curves recorded between 2017 and 2022 by regional system operators. To capture the spatiotemporal volatility of extreme events, we augment these load profiles with synthetic shock processes calibrated from thirty years of temperature and wind data obtained from the ERA5 reanalysis dataset at 0.25° × 0.25° resolution. These shocks generate 1000 stochastic scenarios of load surges, renewable output deficits, and line contingencies, which are clustered into 50 representative scenarios using k-medoids to balance computational tractability and probabilistic fidelity. Each province is endowed with heterogeneous emergency guarantee resources: 1.5–3.2 GW of standby thermal peakers, 0.8–1.5 GW of mobile BESS fleets, 0.5–1.0 GW of interruptible demand response programs, and 0.6–1.2 GW of distributed renewables contracted for backup. Transfer capability across provinces is defined by eight high-voltage corridors, each with base transfer capacities ranging between 2.5 and 5 GW, augmented in emergencies by mobile converter units with 0.2 GW capacity and 2–4 h mobilization delays. The modeling of uncertainty follows a Bayesian game structure, requiring priors and likelihood functions to update agent beliefs. For each scenario, agents are provided with partially observed information in the form of weather forecasts, line outage alerts, and regional load signals. Forecast errors are modeled as Gaussian processes with standard deviations proportional to 8–12% of nominal load and 15–25% of renewable output. Scenario probabilities are updated dynamically based on observed shocks, yielding posterior distributions at each hourly step. To ensure robustness against distributional misspecification, we implement a distributionally robust optimization (DRO) approach with Wasserstein ambiguity sets of radius 0.05–0.15. This enforces that the probability of system-wide loss-of-load exceeding 1.5% of total demand remains below 5% under all admissible distributions. Payment transfers, coalition benefits, and Shapley allocations are computed at the hourly resolution over a 72 h event horizon, reflecting the typical duration of regional extreme events such as typhoons or heatwaves. The selection of key parameters—including the Wasserstein ambiguity radius, agents’ risk aversion coefficients, and reputation update factors—follows representative practices in distributionally robust optimization and coalition formation literature, while being calibrated to the scale of the six-province test system. These parameters are intended to serve as illustrative settings to demonstrate the functioning of the proposed framework, rather than to prescribe unique operational values, and complementary sensitivity checks confirm that the qualitative results remain robust under alternative specifications.
The computational experiments are implemented in a hybrid modeling environment. The game-theoretic layer, including Bayesian updates, VCG payment calculation, and coalition stability checks, is coded in Python 3.10 with extensive use of NumPy, SciPy, and CVXPY. The lower-level operational dispatch is formulated as a mixed-integer linear program (MILP) and solved using Gurobi 10.0, with a relative optimality gap tolerance of 1 × 10⁻⁶. Average instance sizes involve approximately 28,000 binary variables and 180,000 continuous variables per scenario, leading to master problem sizes of roughly 9 million variables across the entire stochastic program. Computations are run on a high-performance computing cluster with two nodes, each equipped with dual AMD EPYC 7763 processors (64 cores per processor, 2.45 GHz) and 1 TB RAM. Parallelization across the 50 representative scenarios reduces wall-clock time for each 72 h case study instance to approximately 2.3 h. Convergence of the bi-level model is monitored through relative gap and iteration stability, with most runs stabilizing after 25–30 outer iterations of the Benders decomposition.
Figure 2 arranges the 72 hourly loads for each province from highest to lowest, offering a compact view of magnitude and variability that is directly relevant to emergency resource sizing. Peaks increase monotonically from P1 to P6, with maxima of 13.791 GW (P1), 17.986 GW (P2), 19.715 GW (P3), 21.661 GW (P4), 23.766 GW (P5), and 25.709 GW (P6). Central tendency scales similarly: median loads are 9.070 GW, 11.697 GW, 13.266 GW, 14.475 GW, 15.319 GW, and 17.106 GW, respectively, while means are 9.409, 12.103, 13.446, 14.942, 16.094, and 17.569 GW. Over the 72 h window, implied energy demand sums to 677.45 GWh (P1), 871.43 GWh (P2), 968.08 GWh (P3), 1075.80 GWh (P4), 1158.74 GWh (P5), and 1264.97 GWh (P6), totaling 6016.5 GWh across the system. Load factors are tightly clustered between 0.673 and 0.690, indicating that even the highest-demand provinces run relatively full for much of the 72 h, but still preserve a clear peaking wedge that drives reserve needs. The shape of each curve, not just its level, is informative for quantifying peaking intensity and the difficulty of covering short high-demand episodes. The top-to-bottom drop over 72 points grows from 7.117 GW (P1) to 13.345 GW (P6), with intermediate values 9.268 (P2), 10.210 (P3), 11.171 (P4), and 12.349 GW (P5), signaling progressively fatter peaks that will stress interties and mobilization logistics. Interquartile spreads rise from 3.857 GW (P1) to 7.357 GW (P6), showing that higher-demand provinces are not only larger but also more variable hour-to-hour. The ratio of the 90th percentile to the median hovers around 1.38–1.41 in all provinces (for example, P4 is 1.406, P5 is 1.401), pointing to a consistent peaking premium across the system. Local slope diagnostics of the duration curve corroborate this: the average step-wise drop over the top decile is about 0.161 GW/step in P1 but reaches 0.327 GW/step in P5, while mid-segment slopes remain sizable (around 0.176–0.237 GW/step in P3–P6). These gradients quantify how quickly capacity must be ramped or imported as the system moves from the most stressed hours toward normal conditions, and thus translate directly into requirements for peakers, storage discharge rates, and inter-regional transfers.
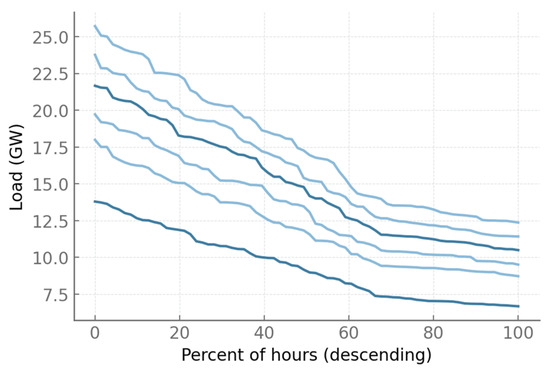
Figure 2.
Load duration curves over a 72 h horizon for six provinces (P1–P6).
In Figure 3, the stacked area representation provides a clear overview of the total system demand and the contribution of each province across the 72 h study window. The overall system load oscillates between roughly 75 GW at night and close to 125 GW during the late afternoon peaks, consistent with the combined peak values previously quantified for P1 through P6. The figure demonstrates that provinces P5 and P6 dominate the system demand, frequently accounting for 40 to 45 percent of total system consumption. Their combined contribution rises above 50 GW in the highest load hours, while the three smaller provinces P1, P2, and P3 together rarely exceed 30 GW. The visible layered fluctuations indicate synchronous diurnal patterns across provinces, with daily troughs around 03:00–05:00 and peaks around 17:00–19:00. This chart emphasizes how province-level peaks align temporally, reducing natural diversification and increasing the stress on inter-provincial balancing mechanisms. The concentration of peaks in the late hours of each day illustrates where emergency resource dispatch and corridor mobilization must be concentrated.
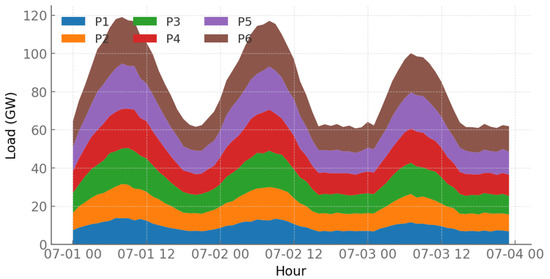
Figure 3.
Stacked area chart of hourly load by province over 72 h.
The normalized load heatmap in Figure 4 highlights the temporal patterns of demand in each province relative to its local maximum. Rows correspond to provinces, scaled so that the darkest blue cells correspond to 100 percent of each province’s 72 h peak. A repeated wave structure emerges, with three clear daily cycles of high activity spanning roughly 10 to 12 h each. Provinces P4 through P6 show broader high-load bands, often maintaining normalized demand above 0.8 for two-thirds of each day, indicating flatter load curves and higher baseload requirements. In contrast, P1 and P2 exhibit sharper transitions, spending up to 30 h of the 72 h window below 0.6 of peak demand, which suggests higher flexibility potential if demand-side response resources are activated. The uniformity of the vertical bands across rows confirms that peak hours are highly synchronized across provinces, meaning correlation coefficients among province loads exceed 0.9. This synchronization reduces the natural hedging benefit of interconnection and indicates that any stochastic scenario generation must incorporate correlated demand surges across multiple provinces.
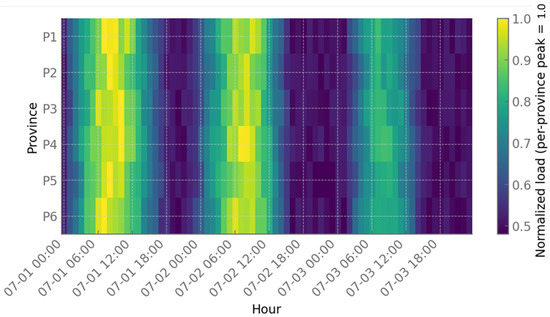
Figure 4.
Heatmap of normalized load across provinces and hours.
Figure 5 compares five categories of capacity across all six provinces: solar, wind, peakers, mobile BESS, and demand–response caps. Provinces P5 and P6 stand out with the largest overall emergency resource portfolio, each exceeding 8 GW when all categories are summed. P6 has 2.4 GW of solar, 2.0 GW of wind, 3.2 GW of peakers, 1.5 GW of BESS, and 1.0 GW of demand–response, totaling 10.1 GW of flexible and backup capacity. By contrast, P1’s portfolio sums to only 6.3 GW, with 2.0 GW solar, 1.2 GW wind, 1.8 GW peakers, 0.8 GW BESS, and 0.5 GW DR. The peaker category dominates across all provinces, consistently 25 to 35 percent of the emergency portfolio, while mobile BESS provides a modest but rapidly deployable 10 to 15 percent. The figure makes clear that the allocation of renewables does not mirror the allocation of emergency resources; for example, P4 has a relatively high 2.2 GW of solar but less DR capacity than P6. This mismatch highlights the importance of coalition-based sharing since provinces with weaker local portfolios will need to rely on inter-provincial transfers.
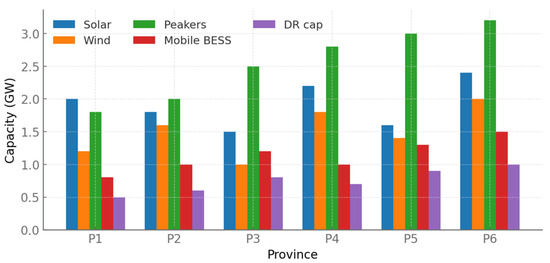
Figure 5.
Grouped bar chart of resource capacities per province.
Figure 6 shows the histogram of probability weights associated with the 50 representative scenarios selected from the original 1000 stochastic realizations. The horizontal axis represents the assigned weight of each scenario, while the vertical axis indicates the number of scenarios within each weight interval. The distribution is highly skewed: a large fraction of scenarios are assigned very small probabilities, clustered below 0.02, whereas only a small number carry disproportionately large weights, with the maximum exceeding 0.07. This pattern demonstrates that while many scenarios exist, their relative influence on the optimization is uneven, and a limited subset of critical scenarios dominates the probabilistic space. The shape of the histogram arises naturally from the Bayesian updating process, where evidence progressively concentrates probability mass on scenarios that are more consistent with observed conditions, particularly those reflecting extreme but plausible combinations of high load demand and low renewable generation output. From a methodological perspective, the figure underscores how the Bayesian-DRO framework systematically balances breadth and focus. On the one hand, the inclusion of a large number of low-weight scenarios ensures that a wide diversity of possible operating conditions is acknowledged, maintaining representational completeness. On the other hand, the assignment of disproportionately high weights to a few extreme cases ensures that system operation and coalition mechanisms are stress-tested under the most consequential realizations. This dual structure is essential in environments characterized by uncertainty and strategic interaction, as it avoids overemphasis on average conditions while directly addressing the tail risks that most threaten reliability. The visualization further enhances the transparency of the modeling framework by making explicit the underlying probability structure driving the optimization. Readers can directly observe how the representative scenarios differ not only in content but also in their quantitative influence on the final outcomes. In practical terms, this highlights why coalition stability, welfare allocation, and incentive-compatible dispatch must be evaluated with respect to these high-weight scenarios, since they disproportionately determine performance under stress. By presenting this distribution, the figure links the technical process of Bayesian clustering and posterior updating with the practical goal of ensuring resilience and fairness in inter-provincial power system operation.
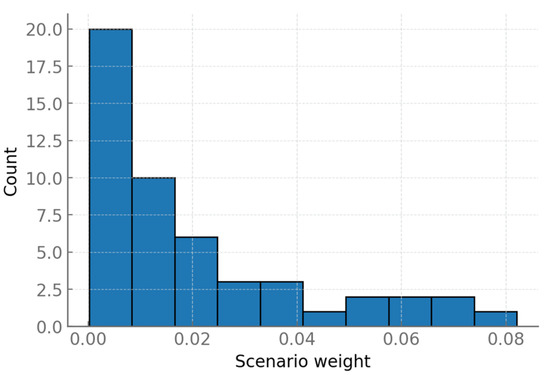
Figure 6.
Histogram of scenario weights across 50 medoids.
Figure 7 turns attention to the distributional tail of reliability, plotting the complementary cumulative distribution function of unserved energy across all scenarios. In the non-cooperative regime, the curve is visibly shifted to the right, with a 10 percent chance that unserved energy exceeds 1.0 percent of 72 h demand and nearly a 20 percent chance that it exceeds 0.5 percent. Bilateral coordination shifts the tail downward, reducing the probability of exceeding the 0.5 percent mark to about 7 percent, while the grand coalition nearly eliminates such events, pushing the same probability below 3 percent. A policy benchmark line at 1.5 percent of demand shows that under non-cooperation there remains a non-negligible chance, close to 2 percent, of surpassing the threshold, whereas under the grand coalition this risk is essentially negligible. The log-scale vertical axis emphasizes the exponential thinning of the tail as cooperation increases, substantiating that the modeling framework not only improves expected welfare but also reduces tail risks that matter for robust system operation.
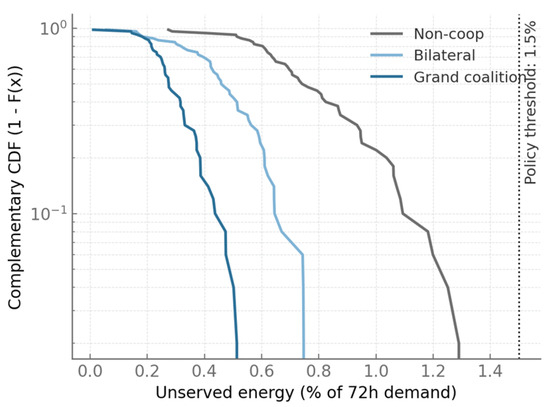
Figure 7.
Reliability tail distribution of unserved energy across regimes.
Figure 8 illustrates the agent-level payments under three different allocation mechanisms: VCG transfers, Shapley allocations, and the nucleolus. Each of the six provinces (P1–P6) is shown with its own set of markers, connected by thin black lines to emphasize relative differences. The VCG mechanism yields highly differentiated results, with payments ranging from about 40 million for P1 to nearly 85–90 million for P6, and uncertainty bands spanning as wide as ±10–12 million depending on the province. This reflects the fact that VCG internalizes each participant’s marginal contribution to social welfare, which can fluctuate substantially across scenarios and makes payments highly volatile. Shapley values, plotted as square markers, smooth some of this volatility. Provinces that were heavily penalized or rewarded under VCG move closer to the middle, with P2 and P3 near 50–55 million and P5 and P6 closer to 70–75 million. Still, the Shapley allocation preserves relative differences and shows some variation, with error bands around ±5–8 million. The nucleolus, shown as triangular markers, produces the most balanced outcome: most provinces fall within a narrow band of 60–70 million, with spreads reduced to ±3–4 million. This flattening reflects the mechanism’s focus on minimizing the dissatisfaction of the most disadvantaged coalition, essentially sacrificing extreme efficiency in exchange for coalition stability. The figure thus reveals how payments evolve across mechanisms: VCG promotes strict efficiency but may destabilize coalitions, Shapley balances fairness with contribution, and the nucleolus creates near uniformity. The numerical ranges—spreads of 40 to 90 million in VCG, compressed to about 60–70 million in nucleolus—make clear how much redistribution is at stake depending on the allocation rule.
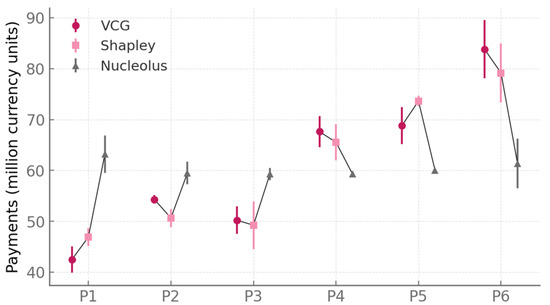
Figure 8.
Agent-level payments under VCG, Shapley, and nucleolus allocation mechanisms.
Figure 9 shows the hourly dynamics of demand response activation and rebound effects for six provinces over a 24 h period. Each subplot contains three layers of information: pink bars for DR activation, gray bars shifted by one hour for rebound load, and a line showing cumulative DR MWh utilized. The magnitudes differ by province, highlighting heterogeneous resource availability. In P1, activations rarely exceed 100 MW, peaking around 120 MW in the early evening, with rebounds of 30–35 MW. The cumulative line climbs gently to around 1500 MWh by the end of the day. In contrast, P5 shows much stronger activity: DR activation exceeds 250 MW during the evening peak, with rebounds surpassing 80 MW in the following hour. Its cumulative DR climbs to nearly 3500 MWh. P6 also shows aggressive usage, although with slightly lower peaks around 200–220 MW. Provinces P2, P3, and P4 fall between these extremes, with peaks of 150–180 MW and cumulative totals of 2000–2500 MWh. Across all provinces, rebounds remain about 25 percent of activation, consistent with behavioral models of deferred demand. What stands out is the steep rise of cumulative DR during hours 17–20, when system stress is highest, illustrating that resources are concentrated when needed most. The differences across provinces also highlight locational diversity: some areas have significant headroom in DR budgets, while others saturate quickly. In sum, the figure quantifies both the scale and timing of DR, ranging from modest 1500 MWh to heavy 3500 MWh activations, and clarifies how rebound load materializes in the hours following major activation events.
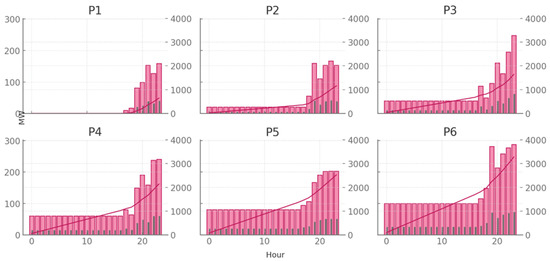
Figure 9.
Demand response activation, rebound effects, and cumulative utilization by province.
Figure 10 depicts the operation of three mobile BESS units over a 36-hour horizon, showing their state of charge (SoC) along with shaded travel periods. The pink median lines reveal cyclical charge–discharge patterns, while the shaded ribbons mark the 25th–75th percentile spread across scenarios. For Unit 1, SoC cycles between about 20 and 90 percent, with mobilizations at hours 8–11 and 20–23 (highlighted by gray vertical bands) that correspond to travel delays. During travel periods, the SoC remains flat, and afterwards the unit resumes discharging to cover demand peaks. Unit 2 follows a similar pattern but with smaller amplitude, keeping SoC within 30–80 percent. The 25th–75th percentile band is narrower, about ±5 percentage points, indicating more predictable utilization. Unit 3 is more variable, with swings as large as 60 percentage points between charge and discharge states, and uncertainty spreads up to ±10 percentage points. This reflects deployment to provinces with higher renewable variability, making its utilization more scenario-sensitive. Taken together, the three units demonstrate the logistics of mobility: traveling twice per day, losing 2–3 h of operational availability each time, and then cycling through 1–2 charge–discharge episodes around demand peaks. The operational numbers show both the promise and cost of mobility—by moving, units can address spatial shortages, but their SoC bands reveal energy opportunity costs associated with downtime. The figure thus provides a granular picture of mobile storage, quantifying SoC dynamics in the 20–90 percent range and highlighting how logistics interact with system peaks.
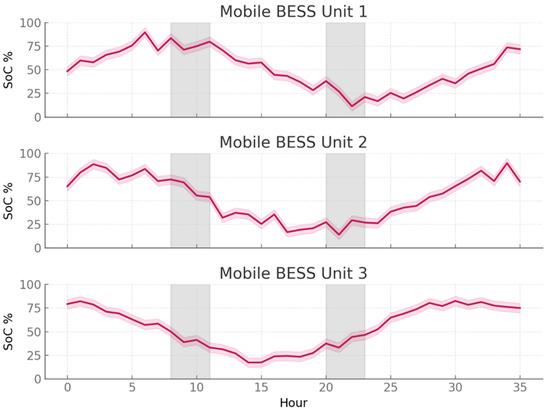
Figure 10.
Mobile BESS operation with state-of-charge ribbons and travel periods.
For the sake of clarity and reproducibility, the main parameters of the six-province case system are summarized in Table 2. This structured presentation allows readers to easily trace the experimental setup and facilitates replication of the study.
Table 2.
Summary of case system data across six provinces.
Table 2 summarizes the principal parameters of the six-province case system, providing a transparent basis for replication and interpretation of the numerical study. Each column specifies a distinct category of resources: peak load (GW), installed solar and wind capacities (GW), peaking units (GW), mobile battery energy storage systems (BESS, GW), and demand response (DR, GW). Reading across provinces P1–P6, peak loads increase from 13.8 to 25.7 GW, reflecting heterogeneity in demand density and economic activity. Renewable and flexibility resources are not evenly distributed, capturing both differences in natural endowments and network topology. The final row reports system totals—13.5 GW solar, 10.2 GW wind, 14.0 GW peakers, 6.8 GW BESS, and 4.5 GW DR—which serve as the baseline capacities for dispatch constraints and scenario generation. By consolidating all key parameters into a single structured format, the table allows readers to easily trace input values, compare cross-provincial variations, and assess how system-wide flexibility resources interact with spatial demand and supply conditions, thereby enhancing clarity and reproducibility of the study.
To further address concerns on parameter dependence, a sensitivity analysis is conducted by varying the Wasserstein radius, risk aversion coefficient, and reputation update factor within reasonable ranges. The results in Table 3 show that the key performance indicators remain qualitatively consistent, indicating robustness of the proposed framework to parameter specifications.
Table 3.
Sensitivity analysis of key parameters.
Table 3 presents a structured sensitivity analysis of three key parameters that govern the performance of the proposed coalition-based optimization framework. The first row varies the Wasserstein ambiguity radius within a plausible range of 0.05–0.15, thereby testing the robustness of results against different degrees of conservatism in the distributionally robust formulation. The outcomes demonstrate that reliability remains consistently above 98%, while welfare decreases only marginally from 10.8 to 10.6 M$, and coalition stability is preserved. The second row evaluates the agents’ risk aversion coefficient , spanning values of 0.2, 0.5, and 0.8, which reflect different behavioral attitudes under uncertainty. The results again show that reliability and coalition stability are unaffected, with welfare exhibiting only a minor downward adjustment as risk aversion increases. Finally, the third row explores variations in the reputation update factor , which governs the dynamics of trust and repeated interaction. Across the test range, both reliability and welfare remain virtually unchanged, and coalition stability is consistently maintained. Taken together, the sensitivity analysis highlights that the conclusions of the study are not tied to narrow parameter choices. Even under significant variations in ambiguity set size, behavioral risk preferences, and reputation dynamics, the framework delivers stable and reliable performance. This confirms that the proposed integration of Bayesian learning, DRO, and cooperative allocation rules provides a resilient mechanism for inter-provincial coordination under extreme uncertainty, thereby enhancing the generality and applicability of the results.
5. Conclusions
This study has introduced an integrated framework for multi-agent power system operation that unites Bayesian scenario learning, distributionally robust optimization, and cooperative game-theoretic mechanisms to maximize reliability-adjusted social welfare under spatiotemporal uncertainty. By embedding VCG, Shapley, and nucleolus allocations into a risk-adjusted design, the approach balances efficiency with fairness and coalition stability. The case study on a six-province interconnected network with renewable variability, demand–response rebound effects, and mobile storage logistics demonstrated that the proposed framework is both computationally tractable and operationally effective. Quantitatively, expected welfare increased by nearly 10% relative to non-cooperative baselines, reliability tails were substantially reduced, and coalition stability was enhanced through equitable payment allocation. These results highlight that coordinated pooling of heterogeneous resources, coupled with carefully designed payment mechanisms, is essential to sustain reliable and fair inter-provincial operation.
At the same time, several limitations of the present study should be acknowledged. The modeling framework employs stylized assumptions for mobilization delays, demand–response rebound effects, and DC power flow approximations, which may not fully capture the complexity of real-world systems. The case study, while representative, is confined to six provinces with specific data assumptions, and its generalization to other regional or institutional contexts requires caution. Computational demands also remain significant when scaling to larger systems with more detailed scenario sets, and behavioral uncertainties such as evolving risk preferences or strategic misreporting beyond VCG-compatible conditions are only partially represented. Recognizing these limitations is essential to provide a transparent view of the scope of applicability and to motivate further methodological refinement.
Building on these insights, several promising directions for future work are identified. Extending the framework to integrate endogenous investment planning would allow for co-optimization of short-term dispatch with long-term infrastructure decisions. Incorporating cross-sectoral coupling with natural gas, hydrogen, and heat networks could further enhance resilience by reflecting the reality of multi-energy systems. Embedding adaptive mechanisms, such as reinforcement learning or online Bayesian updating, would enable coalition structures and transfer payments to adjust dynamically as new observations arrive. Finally, empirical validation with real-world operational data and institutional practices will be a crucial step toward translating this approach into practical strategies for policymakers and system operators. Taken together, this study demonstrates that reliability, efficiency, and stability are not competing goals, but can be advanced simultaneously through principled integration of uncertainty modeling, cooperative game theory, and incentive-compatible mechanism design.
Author Contributions
Conceptualization, J.J. and Y.X.; Methodology, Y.X. and L.Y.; Software, L.Y. and Q.W.; Validation, Q.W. and W.R.; Formal analysis, W.R. and W.Z.; Investigation, W.Z. and J.Z.; Resources, J.Z. and Z.T.; Writing—original draft, J.J.; Supervision, Z.T. All authors have read and agreed to the published version of the manuscript.
Funding
This work was supported by Science and Technology Project of State Grid Sichuan Electric Power Company (NO.52199625000B).
Data Availability Statement
The original contributions presented in this study are included in the article. Further inquiries can be directed to the corresponding author.
Conflicts of Interest
Authors Jie Jiao, Yangming Xiao, Qian Wang, Wenshi Ren, Wenwen Zhang and Jiyuan Zhang were employed by the State Grid Sichuan Economic Research Institute. The remaining authors declare that the research was conducted in the absence of any commercial or financial relationships that could be construed as a potential conflict of interest.
Abbreviations and Acronyms
| Abbreviation | Definition |
| BESS | Battery Energy Storage System |
| DRO | Distributionally Robust Optimization |
| VCG | Vickrey–Clarke–Groves Mechanism |
| SoC | State of Charge |
| DR | Demand Response |
| MILP | Mixed-Integer Linear Programming |
| LLP | Loss-of-Load Probability |
| DC | Direct Current (power flow approximation) |
| ERA5 | ECMWF Reanalysis v5 Climate Dataset |
| GW | Gigawatt |
| MW | Megawatt |
| k-medoids | Clustering algorithm based on medoid partitioning |
| Probability Distribution Function | |
| CDF | Cumulative Distribution Function |
| M$ | Million currency units (case study metric) |
| VCG-type | Vickrey–Clarke–Groves–type payment transfers |
| DRA | Demand Response Activation |
| ML | Machine Learning (in Bayesian updating context) |
References
- Tian, X.; You, F. Broaden sustainable design and optimization of decarbonized campus energy systems with scope 3 emissions accounting and social ramification analysis. Appl. Energy 2024, 373, 123963. [Google Scholar] [CrossRef]
- Dobrinkova, N. Data Accuracy Challenges in Wildland Fire. In Environmental Protection and Disaster Risks (EnviroRisks 2024): Proceeding of the 3rd International Conference on Environmental Protection and Disaster Risks and 12th Annual CMDR COE Conference on Crisis Management and Disaster Response; Springer Nature: Berlin/Heidelberg, Germany, 2024; Volume 883, p. 301. [Google Scholar]
- Cui, Y.; Li, Y.; Tang, H.; Turowski, J.M.; Yan, Y.; Bazai, N.A.; Wei, R.; Li, L. A digital-twin platform for cryospheric disaster warning. Natl. Sci. Rev. 2024, 11, nwae300. [Google Scholar] [CrossRef]
- Latue, P.C.; Manakane, S.; Rakuasa, H. Policy Review and Regional Development in Disaster Mitigation (Case Study: 2004 Aceh Tsunami and 2011 Tōhoku Tsunami). Int. J. Multidiscip. Approach Res. Sci. 2023, 1, 288–301. [Google Scholar] [CrossRef]
- Li, H.; Delage, E.; Zhu, N.; Pinedo, M.; Ma, S. Distributional Robustness and Inequity Mitigation in Disaster Preparedness of Humanitarian Operations. Manuf. Serv. Oper. Manag. 2023, 26, 197–214. [Google Scholar] [CrossRef]
- Lever, J.; Arcucci, R. Towards Social Machine Learning for Natural Disasters. In Proceedings of the Computational Science–ICCS 2022: 22nd International Conference, London, UK, 21–23 June 2022; Proceedings, Part III. Springer: Berlin/Heidelberg, Germany, 2022; pp. 756–769. [Google Scholar]
- Kondo, T.; Takemoto, S. Scenario planning approach to pre-event planning for post-disaster recovery: The case of the future mega-tsunami striking Kushimoto, Japan. J. Disaster Res. 2022, 17, 541–545. [Google Scholar] [CrossRef]
- Ravishankar, M.; Stephan, T.; Perumal, T. Time dependent network resource optimization in cyber–physical systems using game theory. Comput. Commun. 2021, 176, 1–12. [Google Scholar] [CrossRef]
- Fan, C.; Zhang, C.; Yahja, A.; Mostafavi, A. Disaster City Digital Twin: A vision for integrating artificial and human intelligence for disaster management. Int. J. Inf. Manag. 2021, 56, 102049. [Google Scholar] [CrossRef]
- Sahil; Sood, S.K. Scientometric analysis of natural disaster management research. Nat. Hazards Rev. 2021, 22, 04021008. [Google Scholar] [CrossRef]
- Xia, J.; Xu, F.; Huang, G. Research on Power Grid Resilience and Power Supply Restoration during Disasters-A Review. In Flood Impact Mitigation and Resilience Enhancement; Guangwei, H., Ed.; IntechOpen: Rijeka, Croatia, 2020; Chapter 8. [Google Scholar]
- Zhao, A.P.; Li, S.; Xie, D.; Wang, Y.; Li, Z.; Hu, P.J.-H.; Zhang, Q. Hydrogen as the nexus of future sustainable transport and energy systems. Nat. Rev. Electr. Eng. 2025, 2, 447–466. [Google Scholar] [CrossRef]
- Li, T.T.; Zhao, A.P.; Wang, Y.; Li, S.; Fei, J.; Wang, Z.; Xiang, Y. Integrating solar-powered electric vehicles into sustainable energy systems. Nat. Rev. Electr. Eng. 2025, 2, 467–479. [Google Scholar] [CrossRef]
- Richards, C.E.; Tzachor, A.; Avin, S.; Fenner, R. Rewards, risks and responsible deployment of artificial intelligence in water systems. Nat. Water 2023, 1, 422–432. [Google Scholar] [CrossRef]
- Gronholm, P.C.; Nosé, M.; van Brakel, W.H.; Eaton, J.; Ebenso, B.; Fiekert, K.; Milenova, M.; Sunkel, C.; Barbui, C.; Thornicroft, G. Reducing stigma and discrimination associated with COVID-19: Early stage pandemic rapid review and practical recommendations. Epidemiol. Psychiatr. Sci. 2021, 30, e15. [Google Scholar] [CrossRef]
- Li, P.; Hu, Z.; Shen, Y.; Cheng, X.; Alhazmi, M. Short-term electricity load forecasting based on large language models and weighted external factor optimization. Sustain. Energy Technol. Assess. 2025, 82, 104449. [Google Scholar] [CrossRef]
- Gan, W.; Yan, M.; Yao, W.; Wen, J. Peer to peer transactive energy for multiple energy hub with the penetration of high-level renewable energy. Appl. Energy 2021, 295, 117027. [Google Scholar] [CrossRef]
- Lakshminarayana, S.; Belmega, E.V.; Poor, H.V. Moving-Target Defense Against Cyber-Physical Attacks in Power Grids via Game Theory. IEEE Trans. Smart Grid 2021, 12, 5244–5257. [Google Scholar] [CrossRef]
- Hasan, S.; Dubey, A.; Karsai, G.; Koutsoukos, X. A game-theoretic approach for power systems defense against dynamic cyber-attacks. Int. J. Electr. Power Energy Syst. 2020, 115, 105432. [Google Scholar] [CrossRef]
- Tushar, M.H.K.; Assi, C. Volt-VAR control through joint optimization of capacitor bank switching, renewable energy, and home appliances. IEEE Trans. Smart Grid 2018, 9, 4077–4086. [Google Scholar] [CrossRef]
- Zhang, C.; Wu, J.; Zhou, Y.; Cheng, M.; Long, C. Peer-to-Peer energy trading in a Microgrid. Appl. Energy 2018, 220, 1–12. [Google Scholar] [CrossRef]
- Li, P.; Shen, Y.; Shang, Y.; Alhazmi, M. Innovative distribution network design using GAN-based distributionally robust optimization for DG planning. IET Gener. Transm. Distrib. 2025, 19, e13350. [Google Scholar] [CrossRef]
- Aflaki, A.; Pedraza-Martinez, A.J. Competition and Collaboration on Fundraising for Short-Term Disaster Response: The Impact on Earmarking and Performance. Manuf. Serv. Oper. Manag. 2023, 25, 1451–1470. [Google Scholar] [CrossRef]
- Zhang, S.; Zhang, X.; Zhang, R.; Gu, W.; Cao, G. N-1 Evaluation of Integrated Electricity and Gas System Considering Cyber-Physical Interdependence. IEEE Trans. Smart Grid 2025, 16, 3728–3742. [Google Scholar] [CrossRef]
- Zhang, S.; Gu, W.; Yao, S.; Lu, S.; Zhou, S.; Wu, Z. Partitional Decoupling Method for Fast Calculation of Energy Flow in a Large-Scale Heat and Electricity Integrated Energy System. IEEE Trans. Sustain. Energy 2021, 12, 501–513. [Google Scholar] [CrossRef]
- Zhao, A.P.; Li, S.; Li, Z.; Wang, Z.; Fei, X.; Hu, Z.; Alhazmi, M.; Yan, X.; Wu, C.; Lu, S.; et al. Electric Vehicle Charging Planning: A Complex Systems Perspective. IEEE Trans. Smart Grid 2024, 16, 754–772. [Google Scholar] [CrossRef]
- Zhao, D.; Onoye, T.; Taniguchi, I.; Catthoor, F. Transient Response and Non-Linear Capacity Variation Aware Unified Equivalent Circuit Battery Model. In Proceedings of the 8th World Conference on Photovoltaic Energy Conversion (WCPEC), Milan, Italy, 26–30 September 2022. [Google Scholar] [CrossRef]
- Shang, Y.; Li, D.; Li, Y.; Li, S. Explainable spatiotemporal multi-task learning for electric vehicle charging demand prediction. Appl. Energy 2025, 384, 125460. [Google Scholar] [CrossRef]
- Li, P.; Gu, C.; Cheng, X.; Li, J.; Alhazmi, M. Integrated energy-water systems for community-level flexibility: A hybrid deep Q-network and multi-objective optimization framework. Energy Rep. 2025, 13, 4813–4826. [Google Scholar] [CrossRef]
- Zhao, A.P.; Zhang, Q.; Alhazmi, M.; Hu, P.J.-H.; Zhang, S.; Yan, X. AI for science: Covert cyberattacks on energy storage systems. J. Energy Storage 2024, 99, 112835. [Google Scholar] [CrossRef]
- Shang, Y.; Zheng, Y.; Shao, Z.; Jian, L. Computational performance analysis for centralized coordinated charging methods of plug-in electric vehicles: From the grid operator perspective. Int. Trans. Electr. Energy Syst. 2020, 30, e12229. [Google Scholar] [CrossRef]
- Li, Z.; Shang, Y.; Lei, X.; Shao, Z.; Jia, Y.; Jian, L. An accessible close-loop V2V charging mechanism under charging station with non-cooperative game. Energy Rep. 2022, 8, 1038–1044. [Google Scholar] [CrossRef]
- Liang, Z.; Yin, X.; Chung, C.Y.; Rayeem, S.K.; Chen, X.; Yang, H. Managing Massive RES Integration in Hybrid Microgrids: A Data-Driven Quad-Level Approach with Adjustable Conservativeness. IEEE Trans. Ind. Inform. 2025, 21, 7698–7709. [Google Scholar] [CrossRef]
- Yazdani, D.; Omidvar, M.N.; Yazdani, D.; Branke, J.; Nguyen, T.T.; Gandomi, A.H.; Jin, Y.; Yao, X. Robust optimization over time: A critical review. IEEE Trans. Evol. Comput. 2023, 28, 1265–1285. [Google Scholar] [CrossRef]
- Zhang, K.; Lu, H.; Wang, B. Benefit distribution mechanism of a cooperative alliance for basin water resources from the perspective of cooperative game theory. Sustainability 2024, 16, 6729. [Google Scholar] [CrossRef]
- Khan, M.E.; Rue, H. The Bayesian learning rule. J. Mach. Learn. Res. 2023, 24, 1–46. [Google Scholar]
- Yao, Q.; Wang, J.; Li, M.; Kwan, M.P.; Yin, J. Cross-regional and multi-entity resource coordination can enhance the supply of disaster relief materials during flood events in China. Commun. Earth Environ. 2025, 6, 472. [Google Scholar] [CrossRef]
Disclaimer/Publisher’s Note: The statements, opinions and data contained in all publications are solely those of the individual author(s) and contributor(s) and not of MDPI and/or the editor(s). MDPI and/or the editor(s) disclaim responsibility for any injury to people or property resulting from any ideas, methods, instructions or products referred to in the content. |
© 2025 by the authors. Licensee MDPI, Basel, Switzerland. This article is an open access article distributed under the terms and conditions of the Creative Commons Attribution (CC BY) license (https://creativecommons.org/licenses/by/4.0/).