Article

Using Statistical Methods to Identify the Impact of Solid Fuel Boilers on Seasonal Changes in Air Pollution

by
Ewa Bakinowska
1,
Alicja Dota
1,*,
Rafał Urbaniak
2,
Bartosz Ciupek
3,
Marcin Żurawski
2 and
Marek Dębczyński
2
1
Faculty of Control, Robotics and Electrical Engineering, Institute of Mathematics, Poznan University of Technology, 3a Piotrowo St., 61-138 Poznan, Poland
2
Faculty of Technology, University of Kalisz, 201-205 Poznańska St., 62-800 Kalisz, Poland
3
Faculty of Environmental Engineering and Energy, Institute of Thermal Energy, Poznan University of Technology, 3 Piotrowo St., 61-138 Poznan, Poland
*
Author to whom correspondence should be addressed.
Energies 2025, 18(20), 5428; https://doi.org/10.3390/en18205428
Submission received: 6 September 2025 / Revised: 2 October 2025 / Accepted: 10 October 2025 / Published: 15 October 2025
(This article belongs to the Special Issue Energy and Environmental Economics for a Sustainable Future)

Abstract

Air pollution with particulate matter (PM), recognized by the EU and WHO as a significant factor affecting human health, is subject to standards. Exceeding these standards on a daily or annual basis poses an increased health risk. This article presents an analysis of data from 2022 to 2024 from the administrative area of Pleszew (Poland), which, in 2023, ranked second in the country in terms of annual PM10 concentration [µg/m3]. The main cause of the poor air quality is identified as so-called “low emissions” resulting from residential heating using high-emission coal-fired boilers. The methods used in this analysis not only identified the main causes of pollutant emissions but also demonstrated the seasonal impact of these sources on air quality, both on an annual and daily basis. The analysis utilized statistical tools such as a mixed linear regression model and Tukey’s post hoc tests performed after analysis of variance (ANOVA). The obtained regression model of PM10 concentration on the outside air temperature (defining the intensity of operation of heating devices) clearly indicates the predicted air pollution. Dividing the day into three time intervals proved to be an effective analytical tool enabling the identification of periods with the highest risk of high PM10 concentrations. The highest average PM10 concentration values were recorded in the autumn and winter months between 3:00 PM and 9:00 PM. The developed methods can serve as fundamental tools for local government authorities, guiding further energy policy directions for the study area to improve the identified situation. At the same time, daily and hourly air pollution analysis clearly confirmed the characteristics of inefficient heat sources, which will allow residents to protect their health by avoiding spending time outdoors during peak particulate matter concentration hours. Until the energy situation in the region changes, this will continue.

1. Introduction

High concentrations of particulate matter in atmospheric air are among the main environmental factors negatively affecting human health. In particular, they contribute to the development of respiratory and cardiovascular diseases [1,2]. Therefore, the continuous monitoring of particulate matter concentrations and identifying the factors leading to their increase are crucial [3]. Primary sources include both anthropogenic emissions, such as those from transport, the energy sector, and heating (particularly those resulting from the use of hand-fired grate boilers), and atmospheric factors that influence heating intensity.
The World Health Organization (WHO) [4,5,6,7] and the European Union (EU) [8] have drawn attention to the problem of air pollution. EU policy emphasizes the need to phase out fossil fuels to improve the environment and protect public health. Despite the ongoing geopolitical crisis, the EU maintains a strategic direction in climate and environmental policy [9]. Research indicates that atmospheric pollutant emissions in member states vary spatially depending on the level of industrialization, urbanization, and economic development and the environmental condition [10]. The relationship between meteorological conditions and particulate matter (PM) concentrations is also attracting increasing international interest [11,12,13,14,15]. At the same time, the literature emphasizes the role of non-atmospheric factors, which, however, are rarely subjected to detailed analysis.
The WHO air quality guidelines (for PM10: annual recommended level 15 μg/m3, daily 45 μg/m3, with a maximum of three days per year exceeding this limit) are an important reference point for assessing population exposure and are widely analyzed in scientific studies [16,17]. However, scientists point out that the European regulations remain unadjusted to WHO recommendations and that public health institutions should participate more actively in the interpretation of environmental data. Additionally, attention is drawn to the need for research that takes into account the local context, as the WHO guidelines are based mainly on data from highly developed countries and focus on exposure to single pollutants [18].
The second decade of the 21st century has brought significant changes in energy policy and individual heating in Poland. Increased public awareness and stricter emission requirements for boilers, resulting from subsequent editions of the PN-EN 303-5 standard and the Ecodesign Directive (EU) 2015/1189, impose on manufacturers the obligation to reduce emissions and improve the energy efficiency of devices [19,20].
Despite these efforts, there are still regions in Poland where air quality improvement is slow. In a 2018 WHO report on the most polluted cities in Europe, Pleszew was ranked 14th [21]. These results prompted local authorities to take action, including inventorying heat sources and subsidizing their replacement [22]. However, due to changes in the law, municipalities have lost full control over the implementation of these goals.
Consequently, the study site was the urban–rural commune of Pleszew (Pleszew County, Greater Poland Voivodeship), with an area of 180.15 km2 and a population of approximately 30,000 inhabitants [23]. Air quality monitoring was conducted in 2022–2024 to identify the impact of heating boilers on local pollution. Statistical analysis of the measurement data allowed for the clear identification of emission sources. This study also provides a new perspective on the temporal distribution of particulate matter concentrations and demonstrates strong correlations between emission levels, the lifestyle of residents, and the combustion technology used in hand-fired grate boilers [24,25].
The aim of this study was to identify the main sources of particulate matter emissions in the Pleszew commune and to determine the relationship between air temperature and PM10 concentration, with particular emphasis on the role of hand-fired grate boilers. For this purpose, measurements were conducted using air quality sensors located throughout the commune between 2022 and 2024. Measurements were taken, among other things, of PM1.0, PM2.5, and PM10 concentrations; relative humidity; atmospheric pressure; and air temperature at 10 min intervals. Because the relationships for PM1.0 and PM2.5 were analogous to those observed for PM10, the detailed analysis focused on the latter parameter.
The study results demonstrated a significant relationship between temperature and particulate matter concentrations during the heating season. The temperature drop resulted in increased boiler operation, and the observed phenomena were additionally related to residents’ lifestyles. Detailed statistical analysis of the data from 2022 to 2024, including linear regression models and analysis of variance (ANOVA), confirmed the key role of hand-fired grate boilers in shaping pollution levels. The developed PM10–temperature regression model allowed for the prediction of local emission levels. Additionally, Tukey’s post hoc tests were used to analyze the differences between average concentrations in three daily intervals. Graphical visualization was achieved using violin plots with boxplots.

2. Materials and Method

The primary goal of this research was to utilize statistical methods to identify the impact of solid fuel boilers on environmental pollution. A detailed description of the statistical tools used is presented directly in the computational section, which utilizes actual measurement data archived between 2022 and 2024 from the Pleszew administrative area (Poland). Section 2.1 presents detailed information on the location, methodology, and accuracy of environmental parameter measurements.
Based on environmental research conducted in Pleszew and knowledge of solid fuel combustion processes, the authors of the article made controversial assumptions that should not have been made given the emission standards contained in PN-EN 303-5:2012, which have been in force since 2012. In accordance with the cited standards, grate-fired boilers using top-firing techniques, which were characterized by high-emission combustion throughout their entire operating cycle, were withdrawn from production [26,27]. Since then, automatic pellet boilers, classified as a renewable energy source, and heat pumps have been gaining popularity. Unfortunately, to this day, grate-fired boilers with top-firing combustion throughout the entire bed are in use, and their combustion quality varies throughout the process. After firing, these boilers enter the clean-burning phase, which, when high-quality wood fuel is used, guarantees correct emission parameters. These boilers are approved for operation and distribution as wood gasification boilers, provided that the installation requirements requiring the user to install a heating medium buffer are met. In real-world conditions, they are subject to improper operation because they burn carbon-based fuels: hard coal, lignite, and pulverized coal. Most installations also lack buffer installation. This is an illegal practice, implemented due to a lack of environmental awareness and the energy poverty of residents, as reflected in high environmental pollution rates [28,29]. A detailed description of the construction and operation of the indicated boiler designs is presented in Section 2.2.

2.1. Air Pollution Measurement Methodology

To reflect actual air quality conditions in a rural–urban area, the sensor was located in Pleszew in an area with a low concentration of residential development, devoid of tall buildings and industrial plants. The sensor’s location partially borders agricultural land, which allowed for air circulation and eliminated the impact of road transport on air pollution readings. Figure 1 shows a site plan of the measurement station location.
The measurements were conducted from January 2022 to December 2024, in 10 min intervals. The purpose of these frequent measurements was to determine dynamic changes in environmental conditions and assess the impact of heating devices on changes in air quality.
The measuring station recorded the following parameters:
  • Humidity measurement: Measurement accuracy ±3% (in the absolute humidity range from 20% to 80%).
  • Pressure measurement: Measurement accuracy ±0.12% (in the barometric pressure range from 700 kPa to 900 kPa).
  • Temperature measurement accuracy:
    ±0.5% (in the temperature range from 0 to 65 °C);
    ±1.25% (in the temperature range from −20 to 0 °C);
    ±1.5% (in the temperature range from −40 to −20 °C).
  • Measurement of particulate matter PM10, PM2.5, PM1.0: With an accuracy of 50% for 0.3 μm particles and 98% for ≥0.5 μm particles [30,31].
The PMS5003 sensor, a compact, inexpensive laser light scattering module, was used to measure particulate matter concentration. The particulate matter sensor is one of the measuring elements of an air quality analyzer named Air Sensor. It is a measuring device manufactured by the Polish company BRAGER from Pleszew, Poland. The PMS5003 uses a semiconductor laser diode and photodetector to estimate particle concentration through the phenomenon of light scattering, with particle size determined based on the intensity and angle of light scattering. The sensor can detect particles as small as 0.3 μm, with a 50% detection efficiency at this threshold. For particles 0.5 μm and larger, the detection efficiency exceeds 98%, which is sufficient for accurate estimation of the mass concentration of PM1.0, PM2.5, and PM10 in ambient conditions [30].
Due to the need to reflect the actual values of environmental conditions, the station was subject to periodic (every 3 months) technical inspections.

2.2. Characteristics of Low-Power Boilers with Manual Fuel Loading

Hand-fired grate boilers are characterized by a simple design. They usually have a combustion chamber connected to the hopper and one or more combustion passages. Their efficiency reaches up to 87%, and the combustion time of a single fuel charge is up to 24 h [19,20]. In chamber boilers with manual fuel loading, the fuel is burned in the upper part of the fuel chamber, which is supplied with air. Flue gases are discharged to the heat exchanger directly from the upper part of the fuel bed. A view of the boiler is shown in Figure 2.
The boilers of this type are often equipped with a forced-air fan that supplies air to the combustion chamber. The combustion process is regulated by a microprocessor system, which varies the fan speed depending on the set operating parameters. Thanks to these solutions, the concentrations of hydrocarbon compounds and carbon monoxide in the exhaust gases are many times lower than in bottom-fired boilers. Significantly higher combustion efficiency values are achieved, reaching up to 87%, and the boiler’s output can be quickly adjusted to the current heat demand of the heated premises. Boilers fueled with pulverized coal are particularly popular. Modern boilers of this type are economically comparable to boilers with automatic feeders.
The use of top-firing techniques combined with microprocessor control systems has significantly improved thermal efficiency compared to boilers. This technique is not without its drawbacks. A single fuel loading prevents smooth boiler power regulation over a wider range due to the large combustion surface. Additionally, there are a number of operational problems associated with the need for daily boiler cleaning, fuel loading, and firing [28,29,32]. Research on solid fuel combustion in small-scale thermal power engineering focuses on both improving process efficiency and reducing pollutant emissions [33,34,35,36,37]. The importance of fuel feeding is described in [38,39,40], and the problem of pollutant emissions during co-combustion of different fuel types is described in [41,42].
From the point of view of the discussed issues related to the periodic increase in air pollution, two key factors should be distinguished:
  • Periodic increases in thermal energy demand resulting from seasonal changes and seasonal drops in outdoor temperatures observed between October and April. This is a natural phenomenon occurring in the analyzed climate zone, requiring residents to utilize heating devices to ensure comfortable living conditions. During these periods, we recorded local increases in air pollution resulting from the operation of the heating devices presented.
  • Daily changes in air pollution indicators resulting from the operating characteristics of boilers with manual fuel loading. Technical data regarding the operation of these devices indicate that the boilers have a burn time of up to 24 h; unfortunately, in real conditions, the burn time is limited to a range of 6 to 12 h, depending on the outside temperature and the amount of fuel loaded [43,44].
These boilers require a complete combustion cycle each time, which is characterized by variable pollutant emissions depending on the phase of the process. During operation, five basic stages of the combustion process are completed:
  • Fuel loading. Due to the residents’ lifestyles, this phase typically begins in the afternoon after returning from work. It can be assumed that most residents work a single shift and return home between 3 and 5 PM. During this period, both the boiler and the heating system are completely cooled (the water temperature in the boiler is approximately 20 °C). The boiler should be cleaned of ash and any remaining burnt fuel. A new batch of fuel, ranging from a few to a dozen kilograms, is then loaded. In addition to the fuel, a “kindling” in the form of pieces of wood or other materials is also placed in the boiler to ensure a quick flame with a combustion temperature sufficient to ignite the primary fuel (coal, fine coal, wood).
  • Ignition phase. This is the combustion phase that produces the highest levels of pollutants. This phase lasts from one to several hours. During this phase, flammable materials ignite, with combustion temperatures sufficient to ignite the main fuel bed. The combustion process involves both the combustion of solid carbon and the combustion of volatile combustible components released from the fuel as a result of degassing, which is one of the combustion phases. During this phase, the combustion chamber is at a low temperature, preventing rapid degassing of combustible components. This combustion phase produces high emissions of carbon monoxide and soot, which are not combusted due to the low temperature of this process.
  • The boiler operating parameters stabilization phase. After the ignition period, the combustion process gradually stabilizes. This phase lasts approximately 1 h. During this time, the water in the boiler and heating system reaches a temperature of 50 to 70 °C, which guarantees an increase in the temperature in the combustion chamber. In this phase of the combustion process, pollutant emissions gradually decrease, but the observed level of emitted pollutants still exceeds the emission standards for class 3 and 4 boilers according to PN-EN 303-5:2012.
  • The stable combustion phase. This is the longest phase of the combustion process, lasting from 6 to 7 hours. During this period, the boiler operates stably. The building’s energy performance, in the form of poor thermal insulation, guarantees stable heat collection, enabling a uniform combustion process. Pollutant emissions are reduced.
  • The bed burnout phase. This is the final phase of the combustion process. The fuel is completely burned, and the boiler water temperature gradually drops. During this phase, we observe low pollutant emissions and high oxygen concentration in the exhaust gases resulting from the absence of combustible substances. This phase lasts approximately one hour.
Detailed knowledge of the energy processes characteristic of each of the mentioned phases and knowledge of the residents’ lifestyles and employment patterns allowed us to determine the suggested time intervals adopted in the further course of the research.

3. Results

The WHO-recommended PM10 concentration standards are quite restrictive and should be considered the globally accepted standard. However, due to Poland’s membership in the EU, all analyses in this chapter were conducted in relation to the less stringent EU standard.
This chapter is devoted to the analysis of PM10 particulate matter concentrations in the administrative area of Pleszew in the years 2022–2024.
Section 3.1 presents the monthly averages of PM10 values, along with graphs and a discussion on the observations. Particular attention is paid to the analysis of seasonality, in the autumn–winter months (heating season) and in the spring–summer months, to demonstrate the relationship between PM10 concentrations and the heating season.
In Section 3.2, a preliminary analysis of the detailed data, i.e., hourly PM10 values for the selected days during the heating period, is conducted. To facilitate interpretation, three day types are introduced:
  • Standard combustion process (SCP)—Weekdays, when most residents return home in the afternoon.
  • Weekend (WEEKEND)—Days off from work, characterized by a different lifestyle of the residents.
  • Constant heat reception (CHR)—Days with forced, continuous boiler operation cycle with manual fuel loading. The heating system does not cool down because the low outside temperature remains at a similar level throughout the day.
In order to examine the change in air pollution levels on a daily basis, the day was divided into three time intervals, which were used in further analysis:
  • Int0: Hours in the interval between [3.00 PM and 9.00 PM);
  • Int1: Hours in the interval between [9.00 PM and 9.00 AM);
  • Int2: Hours in the interval between [9.00 AM and 3.00 PM).
In Section 3.3, the correlation coefficients between PM10 values and temperature are determined separately for each month, and a mixed linear regression model is presented. An extension of this analysis, as well as a presentation of the simple regression models describing the PM10–temperature relationship for each month and each year separately, is included in Section 3.4. Furthermore, mixed linear regression models were estimated, which enabled the forecasting of monthly PM10 values in the future based on data from the years 2022–2024.
In Section 3.5, a detailed analysis of hourly PM10 measurements is performed for the selected days indicated earlier in Section 3.2. Appropriate statistical tests are applied based on which specific conclusions were drawn.

3.1. Air Pollution Recording Results for the Pleszew Administrative Area (Poland) over the Years 2022–2024

The World Health Organization (WHO) recommendations regarding permissible concentrations of PM10 particulate matter are more restrictive than the current EU standards. According to WHO, the recommended levels are as follows [4,5,6,7]:
  • Average annual limit: 15 µg/m3 (previously 20 µg/m3);
  • Daily limit: 45 µg/m3 (previously 50 µg/m3).
The EU regulations [8] recommend the following for PM10 (particulate matter with a diameter of up to 10 μm):
  • Annual limit: 40 µg/m3;
  • Daily limit: 50 µg/m3.
According to the EU regulations, the daily norm can be exceeded a maximum of 35 times a year.
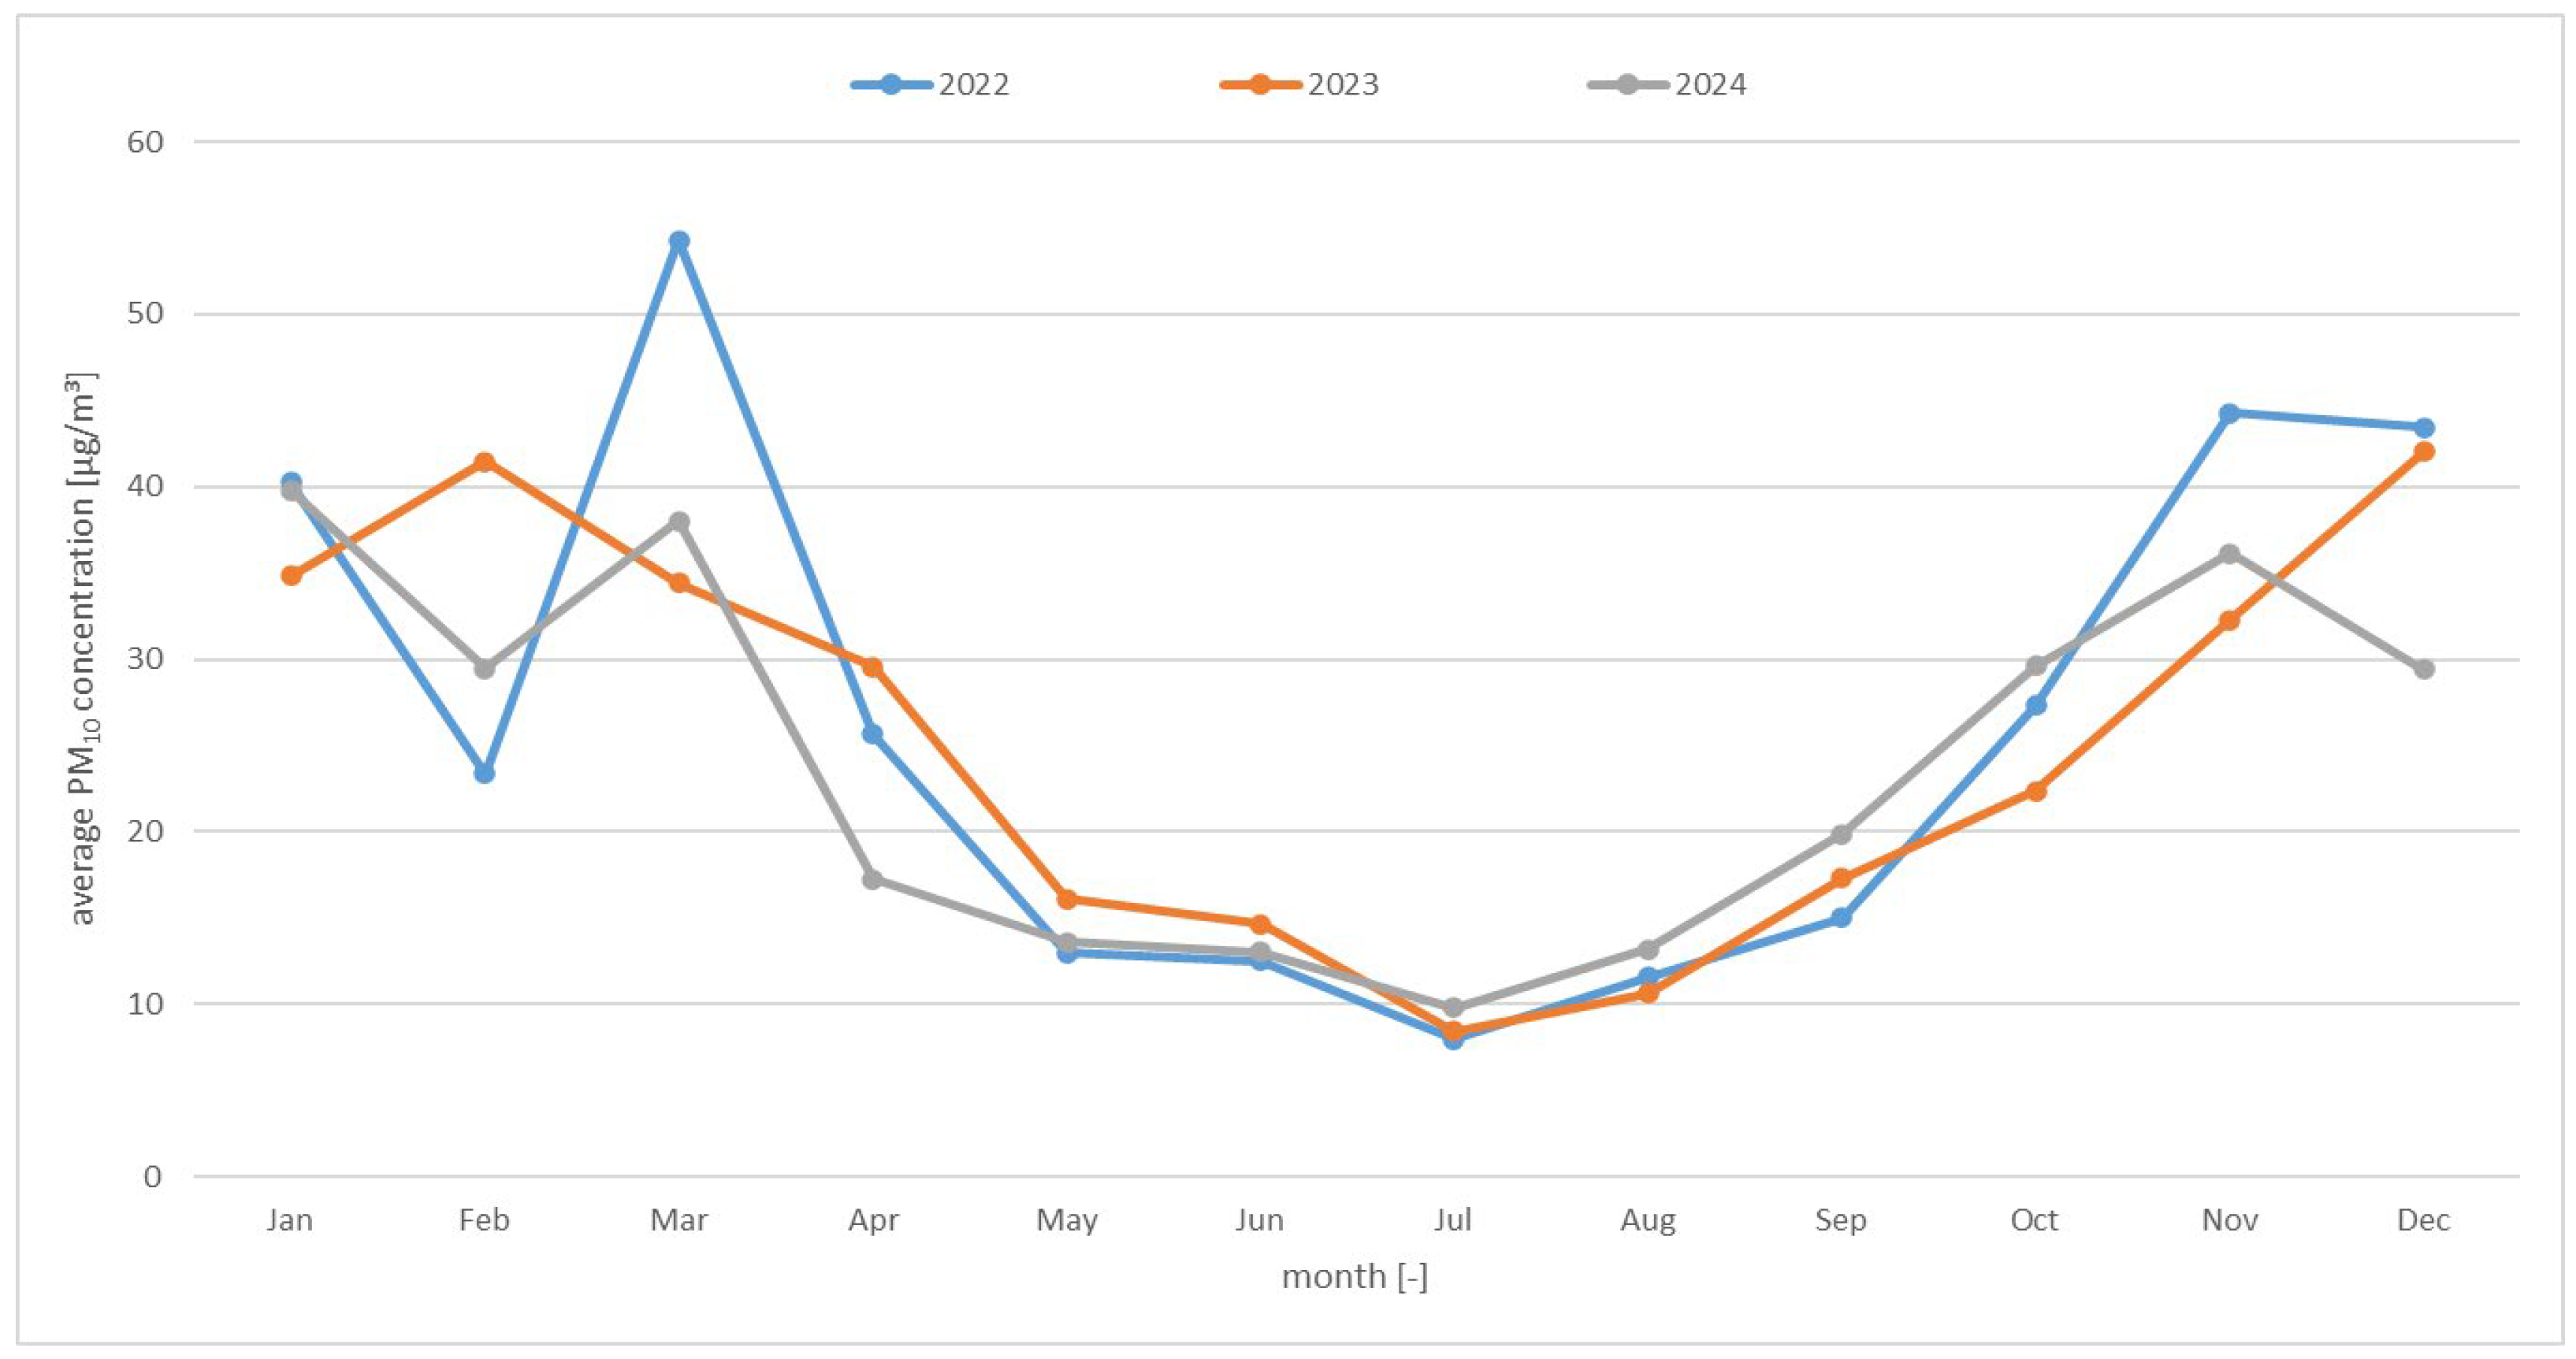
Air pollution in the Pleszew area was analyzed in relation to the EU standards. The average PM10 concentration levels for 2022–2024 in individual months are presented in Table 1 and Figure 3.
Both the tabular data and the corresponding graph allow for the determination of the typical concentration levels that can be expected in individual months. The analysis of the annual values indicates that, despite meeting the requirements of the very liberal EU standards, the average annual concentrations significantly exceed the World Health Organization’s (WHO) recommended limit value of 15 µg/m3. The data in Table 1 (Figure 3), while important, are general in nature and do not allow for a full understanding of air pollution dynamics. Therefore, a more detailed analysis of the daily particulate matter concentration values is necessary.
The annual PM10 concentration patterns in 2022–2024 show a similar pattern. Seasonality is clearly visible—the highest average values were recorded in the winter months, while the lowest were recorded in the summer. This relationship indicates a significant influence of atmospheric conditions, particularly air temperature. Low temperatures favor the more intensive use of individual heat sources, including boilers with manual fuel loading, which may be the main source of the increased particulate matter concentrations during the heating season. These assumptions are confirmed by the observed relationships between average monthly temperature and average monthly PM10 concentration presented in Figure 4, Figure 5 and Figure 6.
The graphs indicate that the lowest PM10 concentrations occur in months characterized by higher air temperatures, while the highest values are observed in months with lower temperatures. Detailed calculations regarding the correlation between these values are presented in Section 3.3.
The demand for thermal energy, particularly during the autumn and winter months, is driving the increased use of boilers. In turn, boiler operation intensity is closely related to the air temperature outside the heated building. Hence, the study of the influence of the intensity of use of hand-fired grate boilers on the level of particulate matter pollution comes down, with some simplification, to the study of the influence of temperature on the concentration of particulate matter in the air.
Based on the data obtained during the three-year research period, statistical analyses were carried out taking into account two main aspects:
  • The impact of air temperature outside heated buildings (relative to boiler use intensity) on PM10 levels. We answer the question of how PM10 values change depending on the temperature. Based on the years 2022–2024, we created a prediction model for each month that allowed us to predict the level of PM10 pollution in the future depending on the temperature.
  • For randomly selected days, we analyzed how PM10 concentrations changed over the course of a single 24 h period depending on the time of day. This is, of course, closely related to the stages of the combustion process, i.e., the operation of hand-fired grate boilers. This confirmed the thesis that hand-fired grate boilers are the main cause of increased air pollution on a daily and hourly basis.
First, however, similarly to this chapter, the graphs of the daily distribution of PM10 values for the selected days of the heating period are analyzed.

3.2. Daily Distribution of Air Pollution for the Administrative Area of Pleszew (Poland) over the Years 2022–2024

From the entire recorded time period, several characteristic days were selected, which are presented in the graphs below. The first four graphs illustrate the typical combustion process during spring and autumn, i.e., during periods of moderate temperatures.
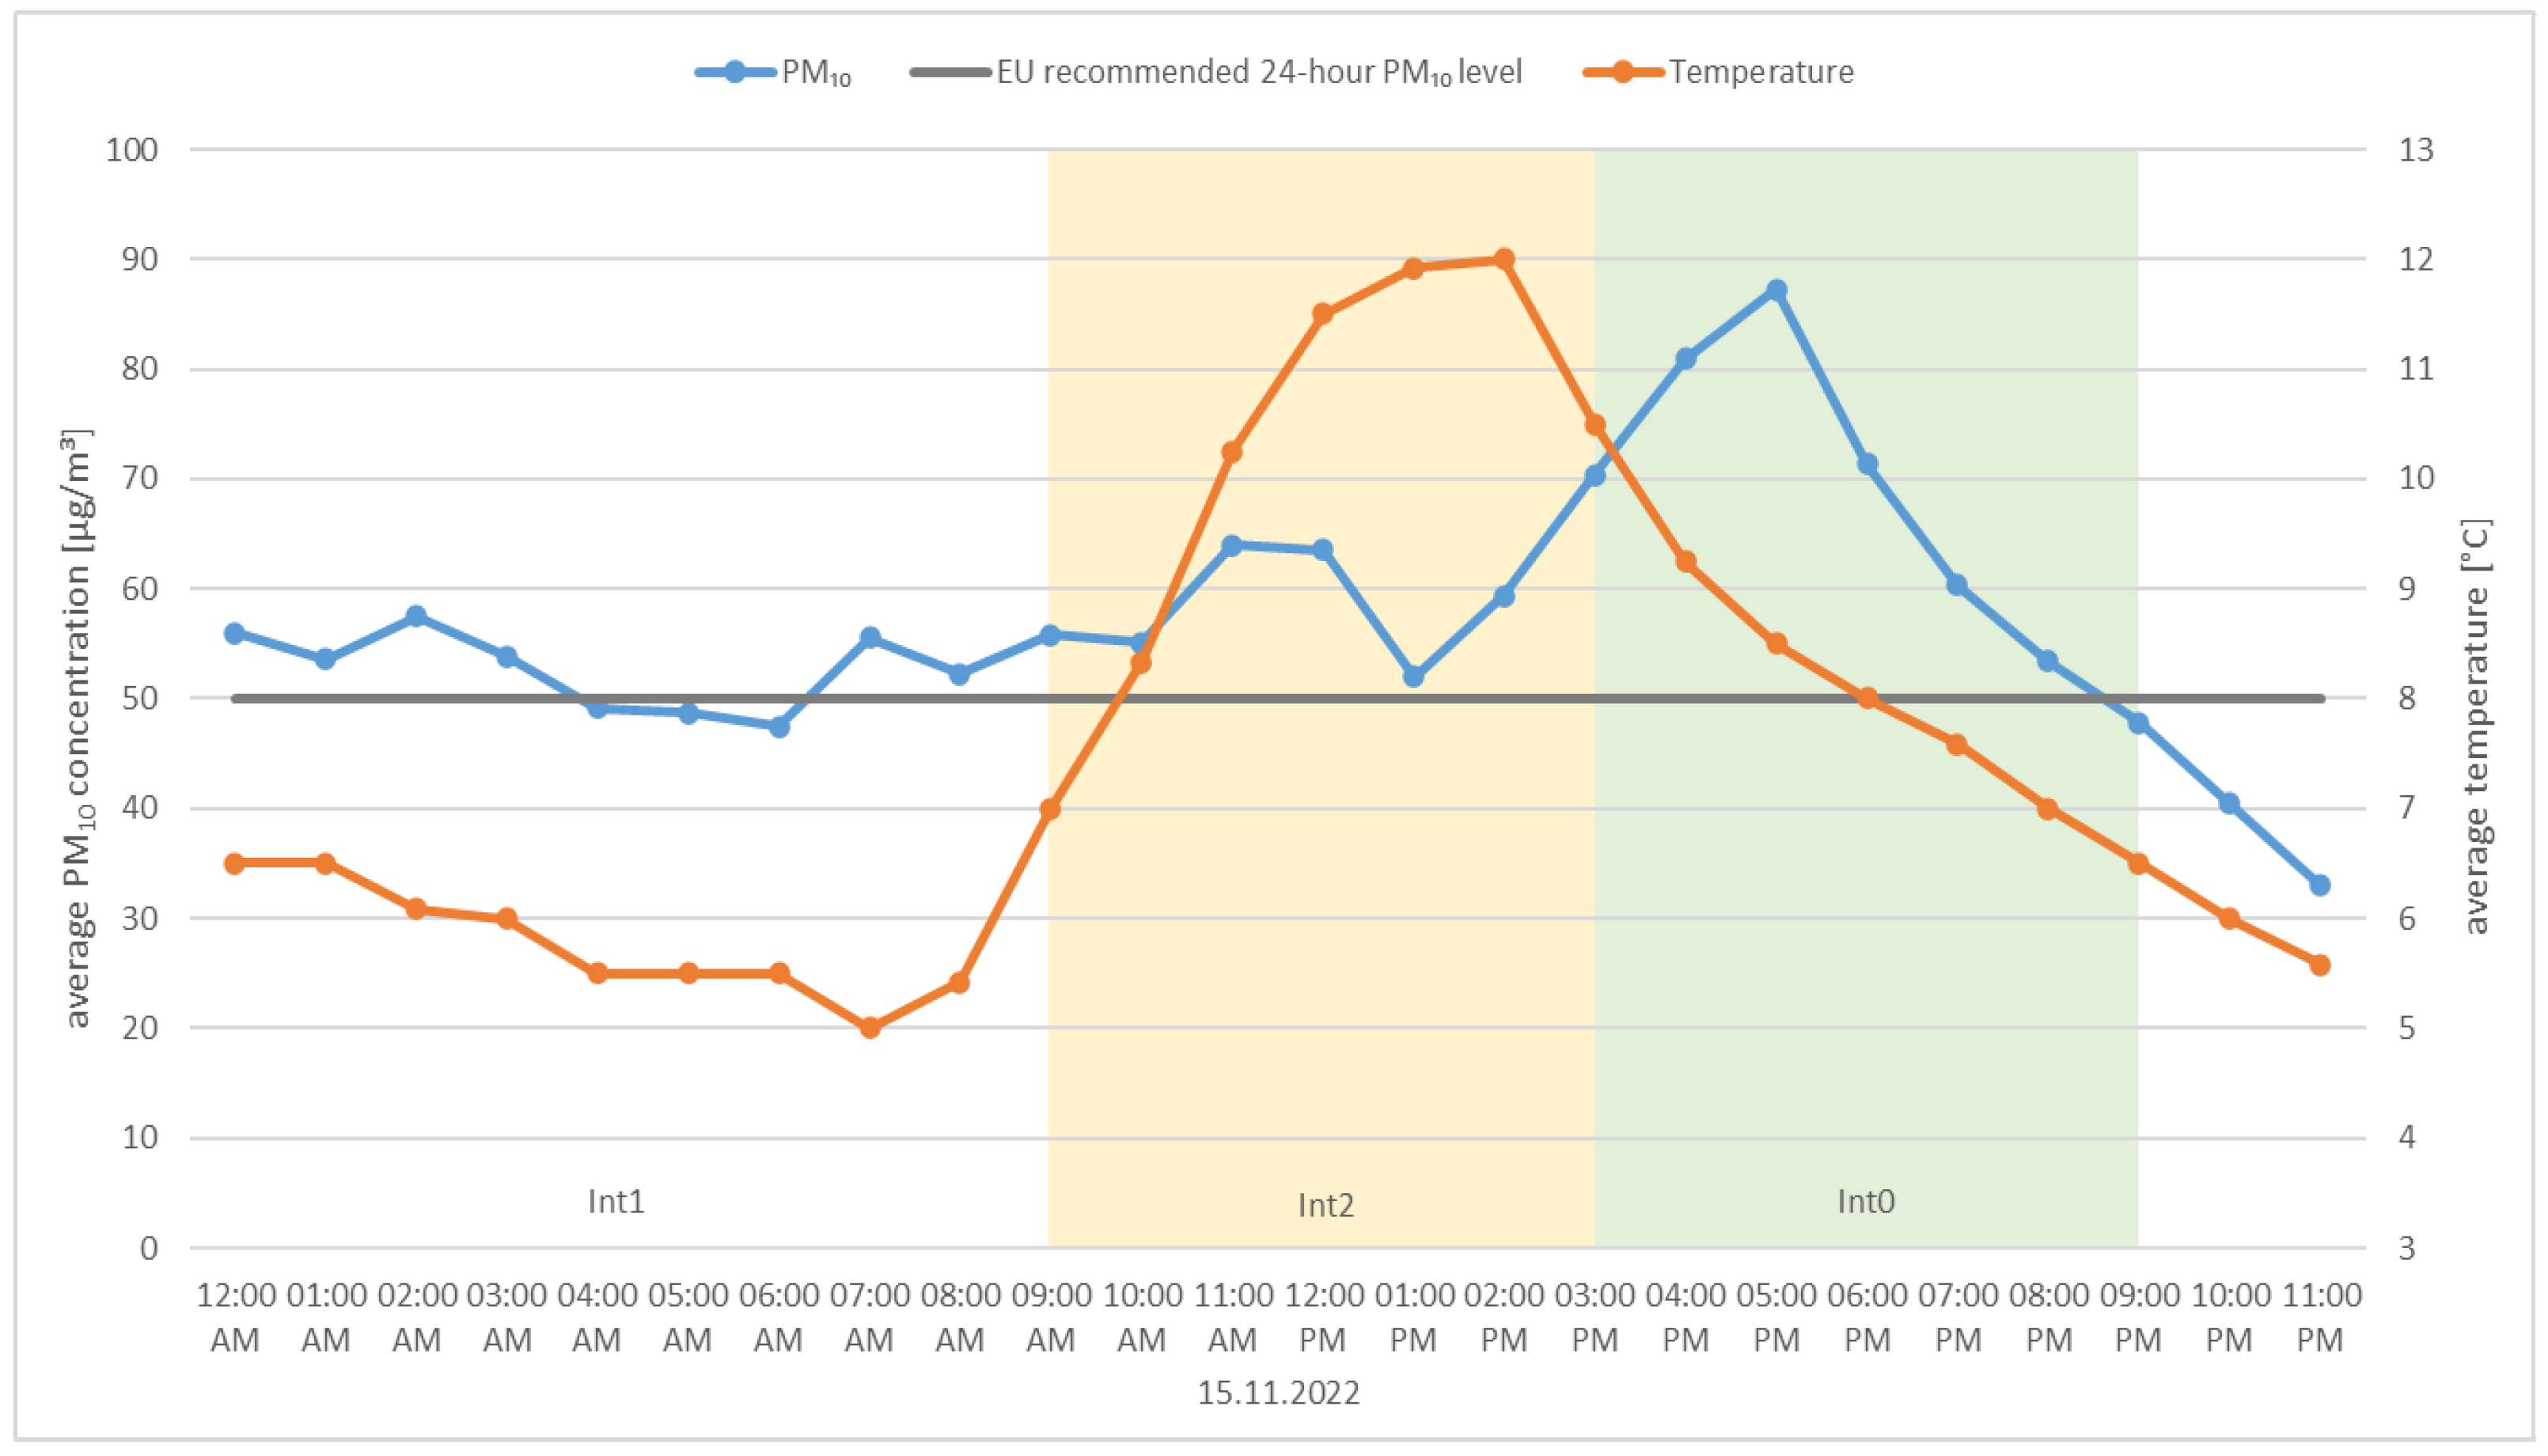
Figure 7 shows the hourly average temperatures and PM10 concentrations on 15 November 2022. This was a standard combustion process (SCP) day—Tuesday. The graph shows a significant increase in particulate matter concentration in the afternoon, approximately from 3:00 PM to 6:00 PM, which corresponds to Interval 0 (Int0). At 5:00 PM, the particulate matter concentrations reach their maximum value. The PM10 concentrations remain above the EU-recommended standard for almost the entire 24 h period.
Figure 8 shows the hourly average temperatures and PM10 concentrations on 15 March 2023. This was a standard combustion process (SCP) day—Wednesday. The graph again shows a significant increase in particulate matter concentration in the afternoon, this time from approximately 5:00 PM to 9:00 PM, which also corresponds to Interval 0 (Int0). Starting around 6:00 PM, the PM10 concentrations exceed the EU-recommended daily standard, and at 7:00 PM, the particulate matter concentrations reach their maximum value.
Figure 9 shows the hourly average temperatures and PM10 concentrations on 23 October 2023. This was a standard combustion process (SCP) day—Monday. The graph again shows a significant increase in particulate matter concentration in the afternoon, starting at approximately 5:00 PM, during Interval 0 (Int0). Particulate matter concentrations remain high in the evenings, reaching a local maximum at 6:00 PM, at which time they exceed the EU-recommended daily standard.
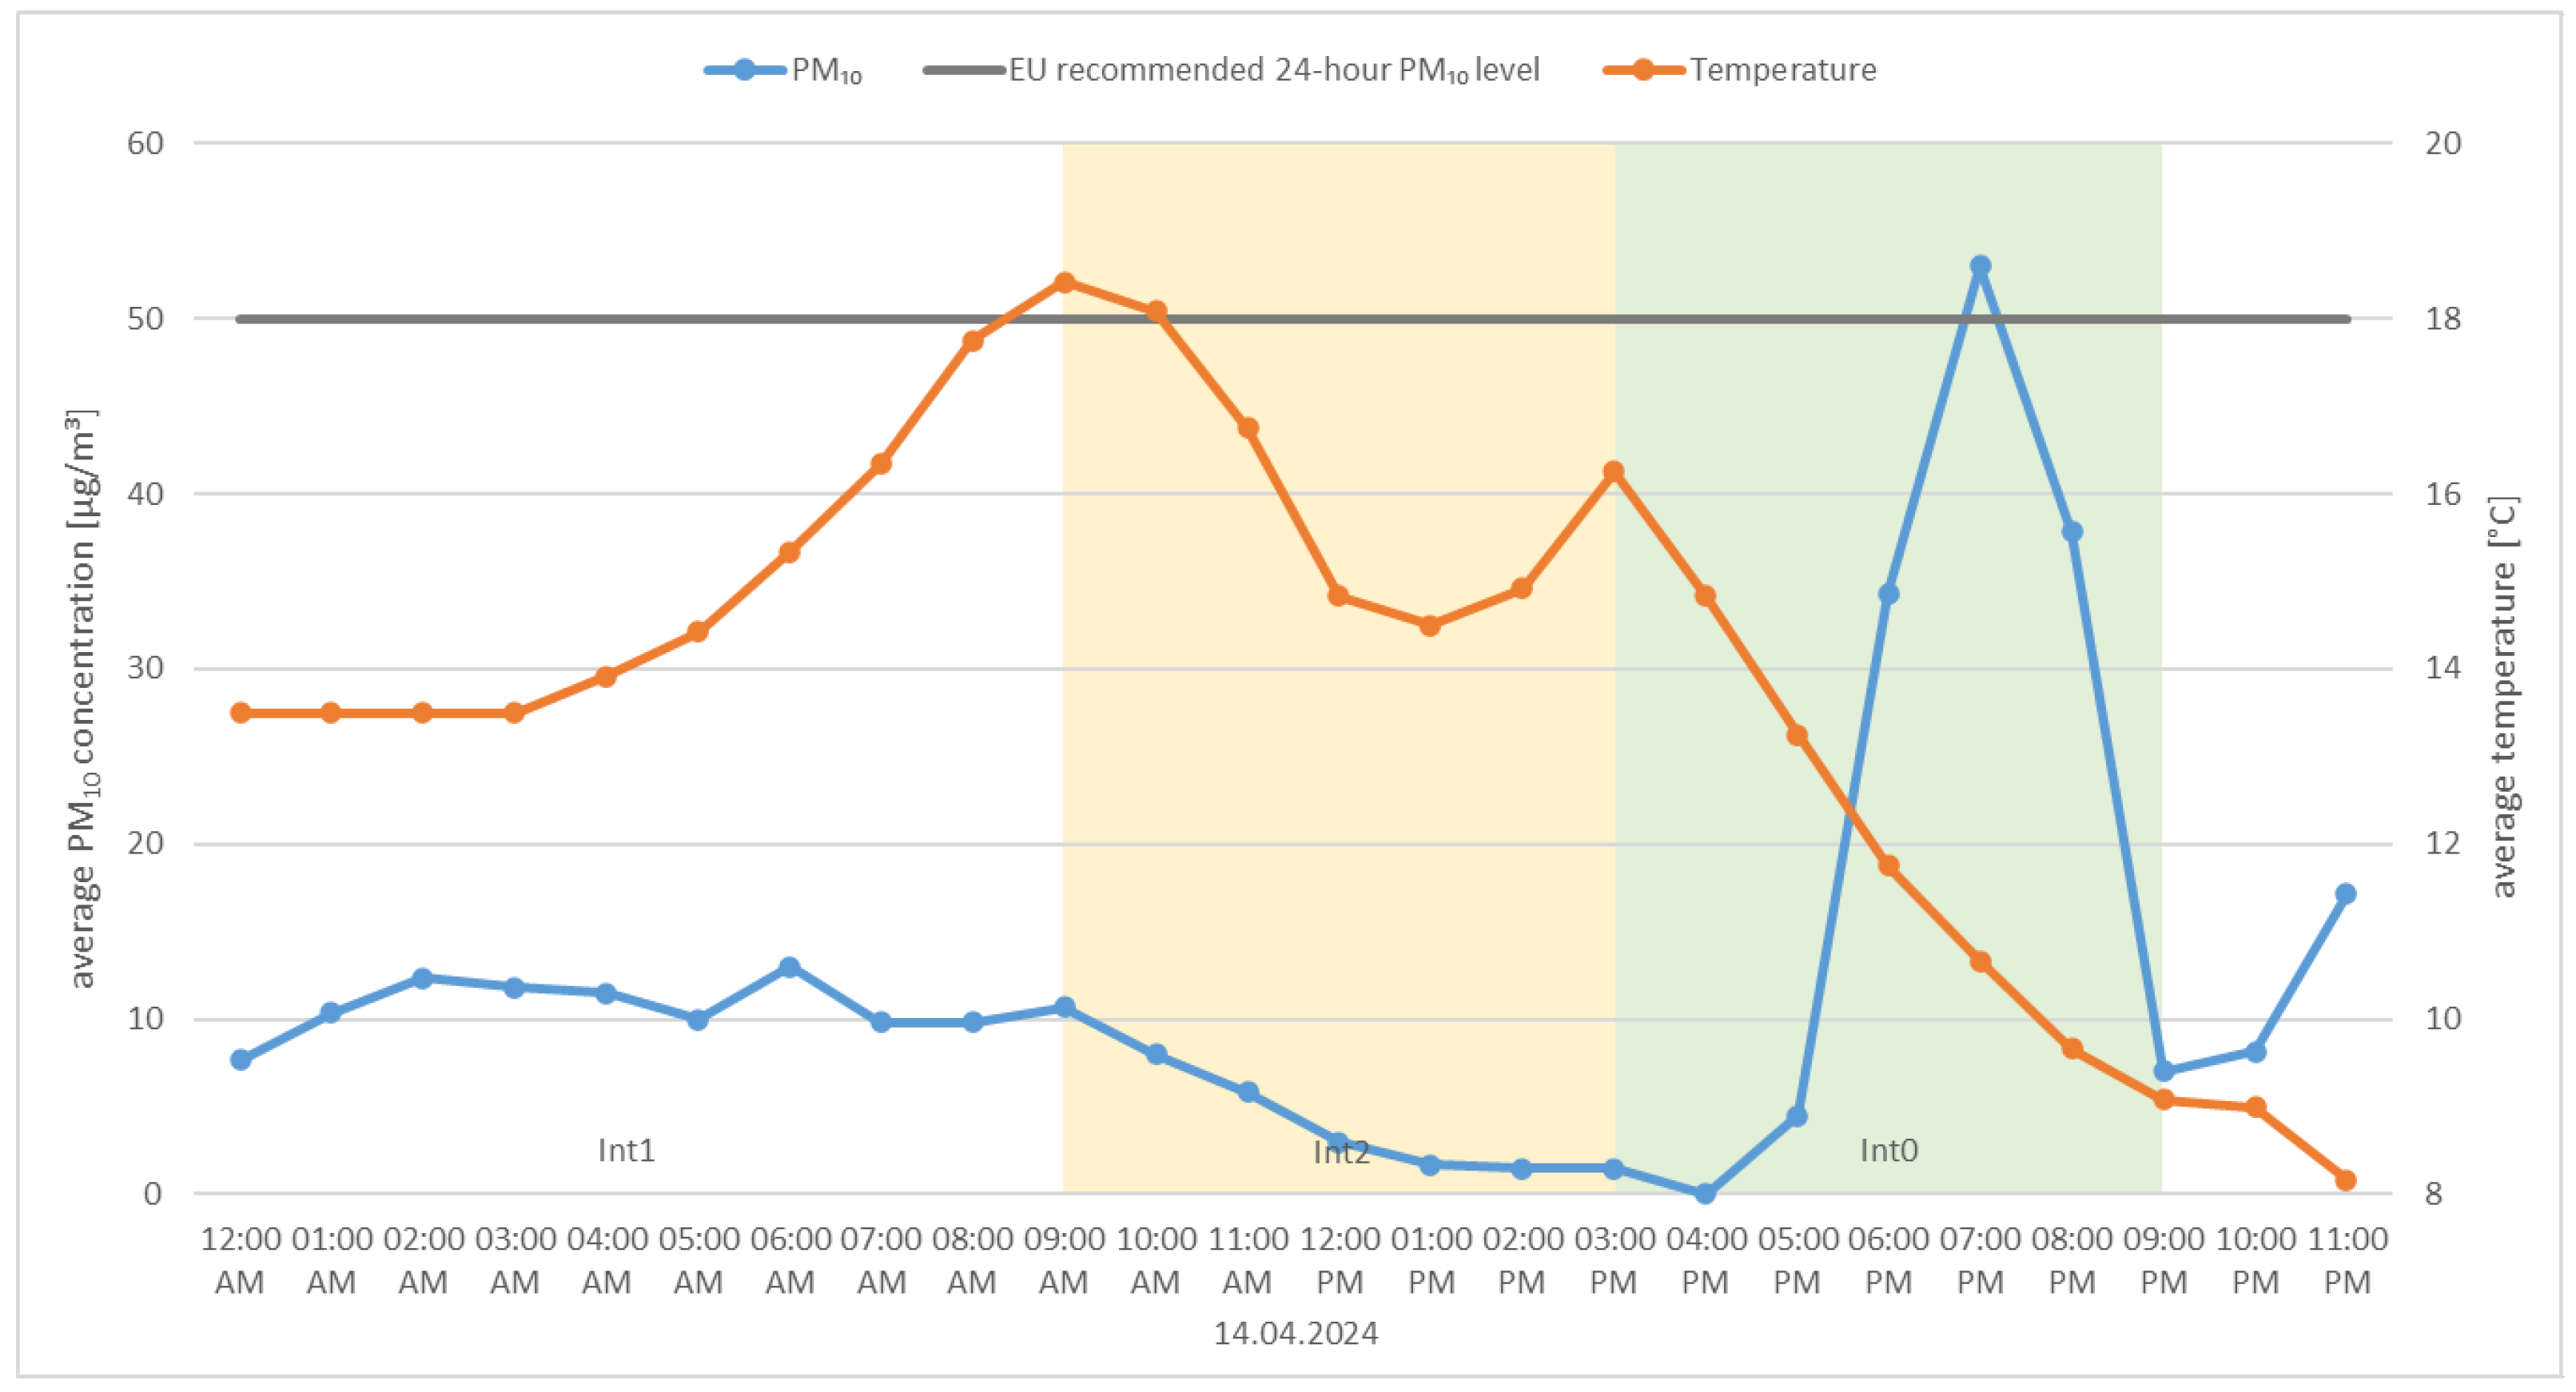
Figure 10 shows the hourly average temperatures and PM10 concentrations on 14 April 2024. This was a standard combustion process (SCP) day—Monday. The graph below shows an increase in particulate matter concentration, with a maximum at around 7:00 PM, also during Interval 0 (Int0). During this time interval, the PM10 concentrations temporarily exceeded the EU-recommended daily standard.
All four graphs above (Figure 7, Figure 8, Figure 9 and Figure 10) show a significant increase in PM10 concentration in the afternoon, starting around 5:00 PM. This is due to the fact that most residents finish work between 3:00 PM and 5:00 PM and, upon arriving at their homes, begin the process of firing the boiler. This process, performed on a cold heating system, is inefficient and generates a large amount of particulate matter. After the boiler is lit and the system is warmed up—usually after 7:00 PM—particulate matter emissions decrease significantly, even though the falling outside temperature increases the boiler’s thermal output.
The next two graphs show the relationship between temperature and particulate matter concentration for weekend days, i.e., days off from work.
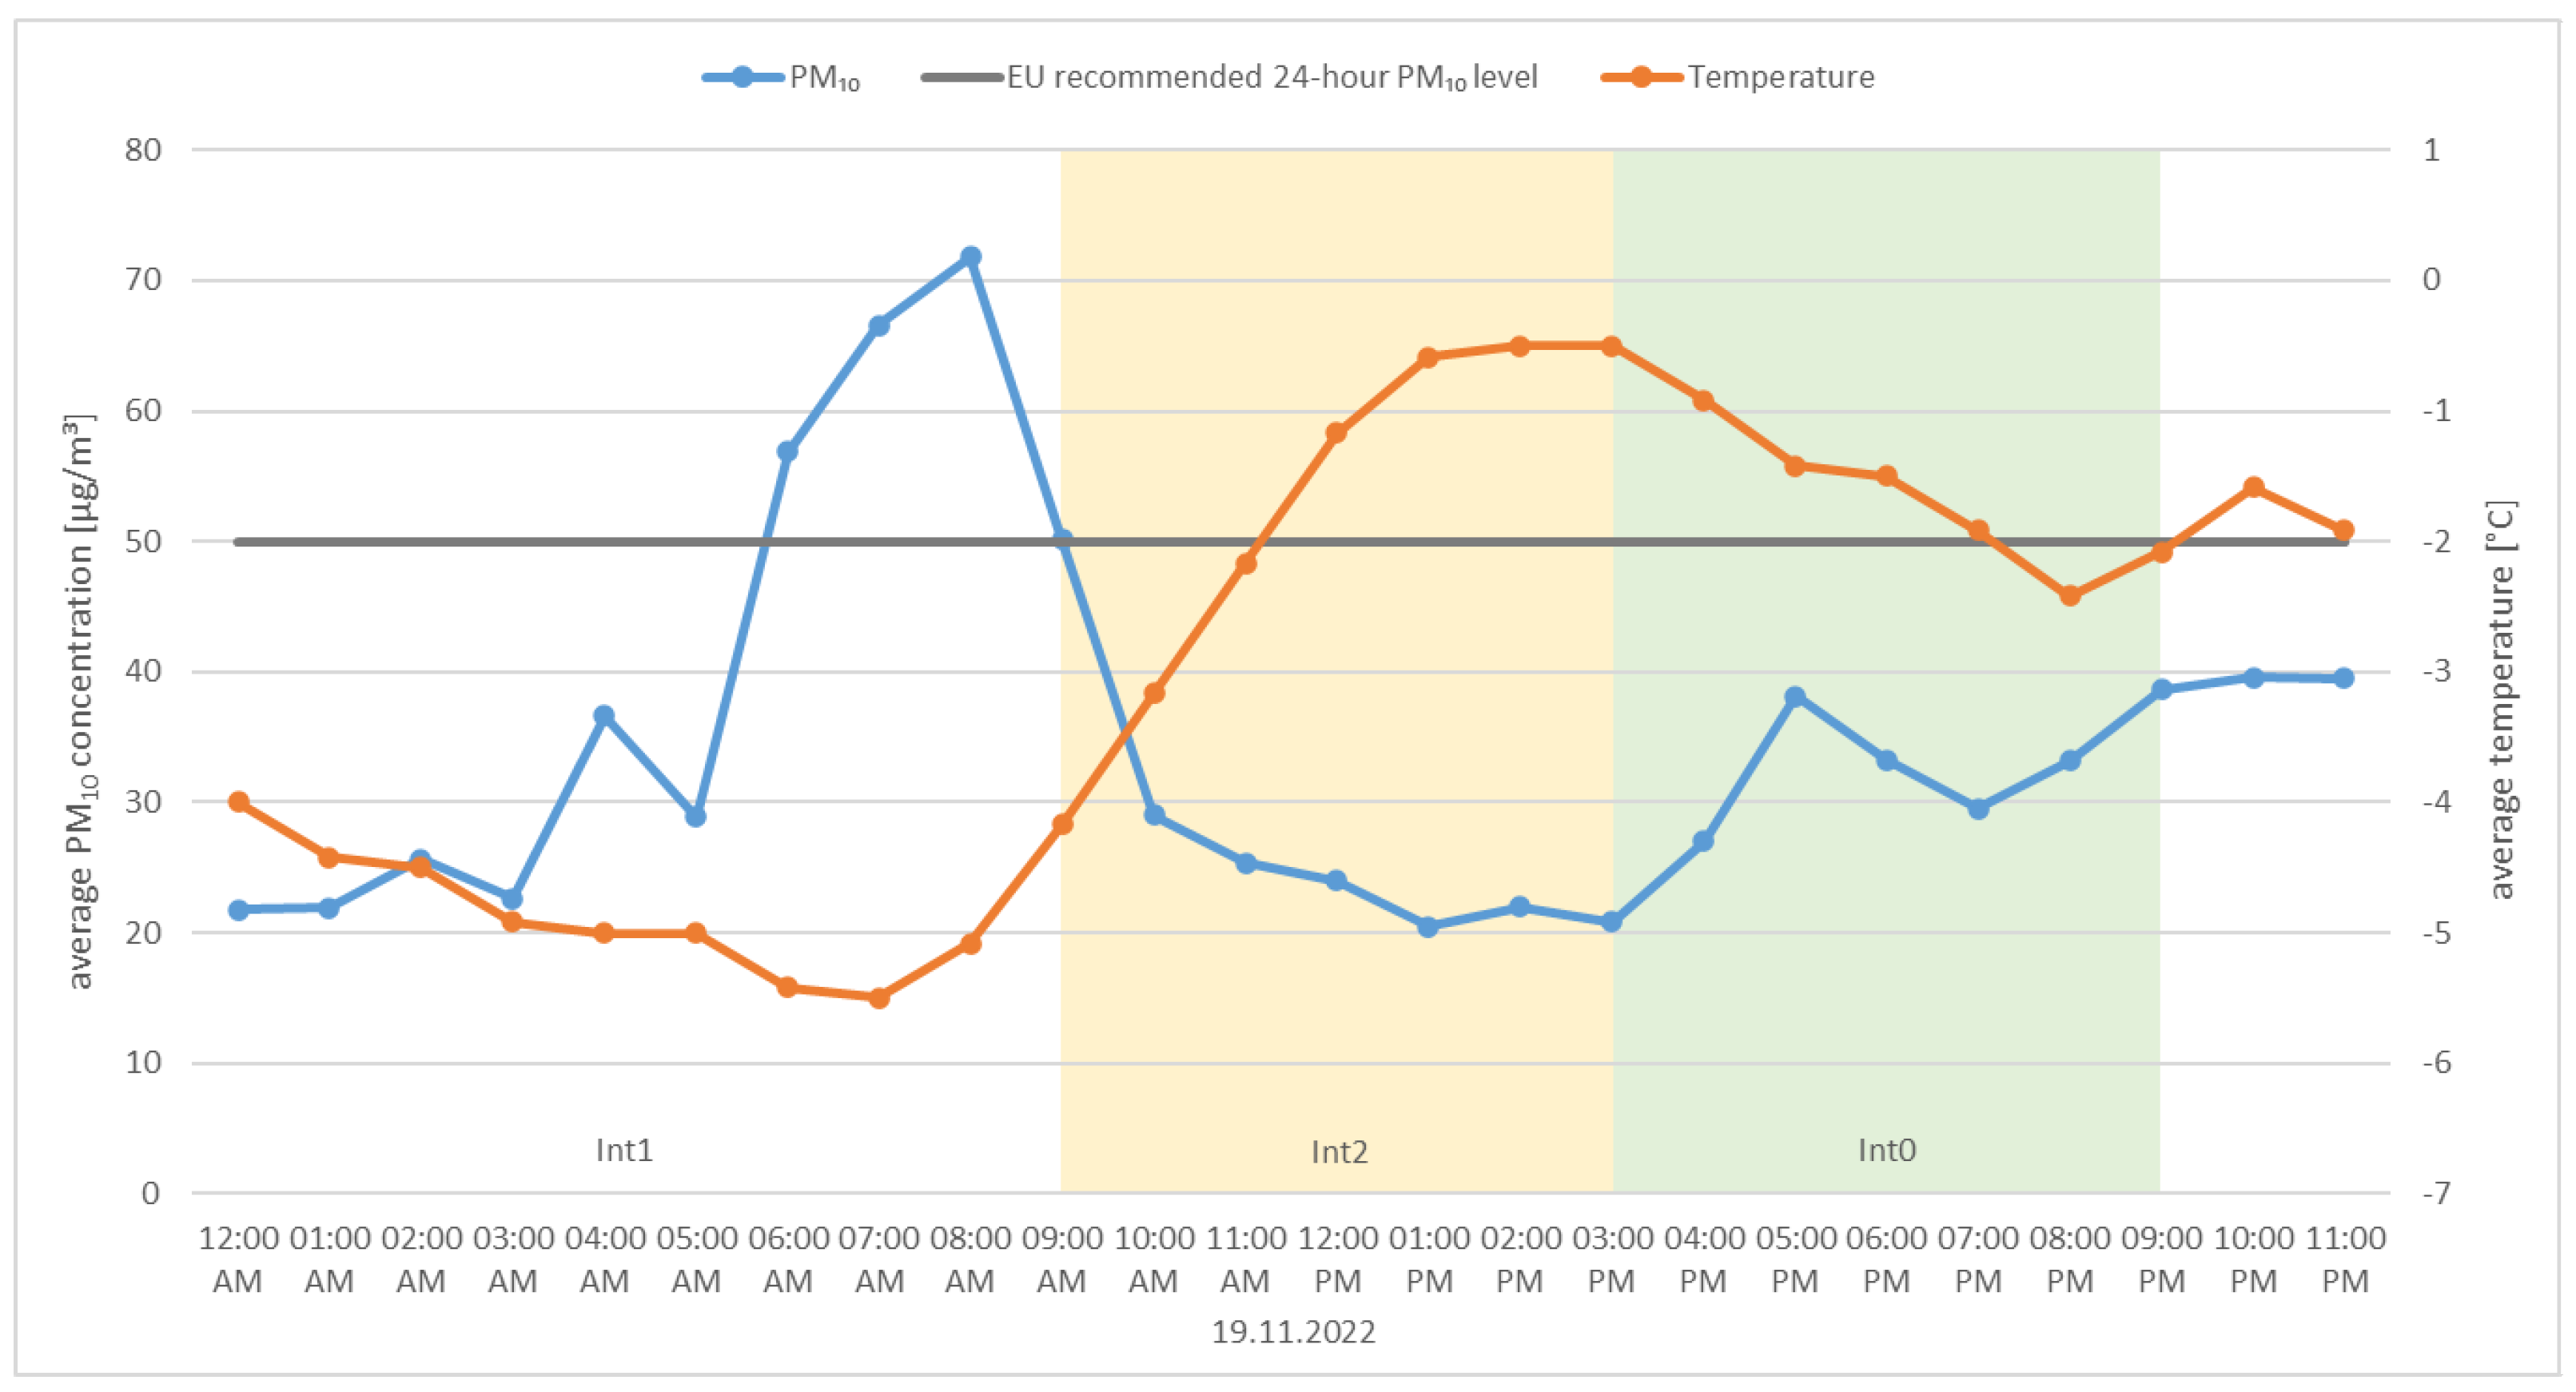
Figure 11 shows the hourly average temperatures and PM10 concentrations on 19 November 2022. This was a non-working day (WEEKEND)—Saturday. The graph below shows an increase in particulate matter concentration starting at approximately 6:00 AM, with a maximum around 8:00 AM, this time during Interval 1 (Int1), temporarily exceeding the EU-recommended limit value.
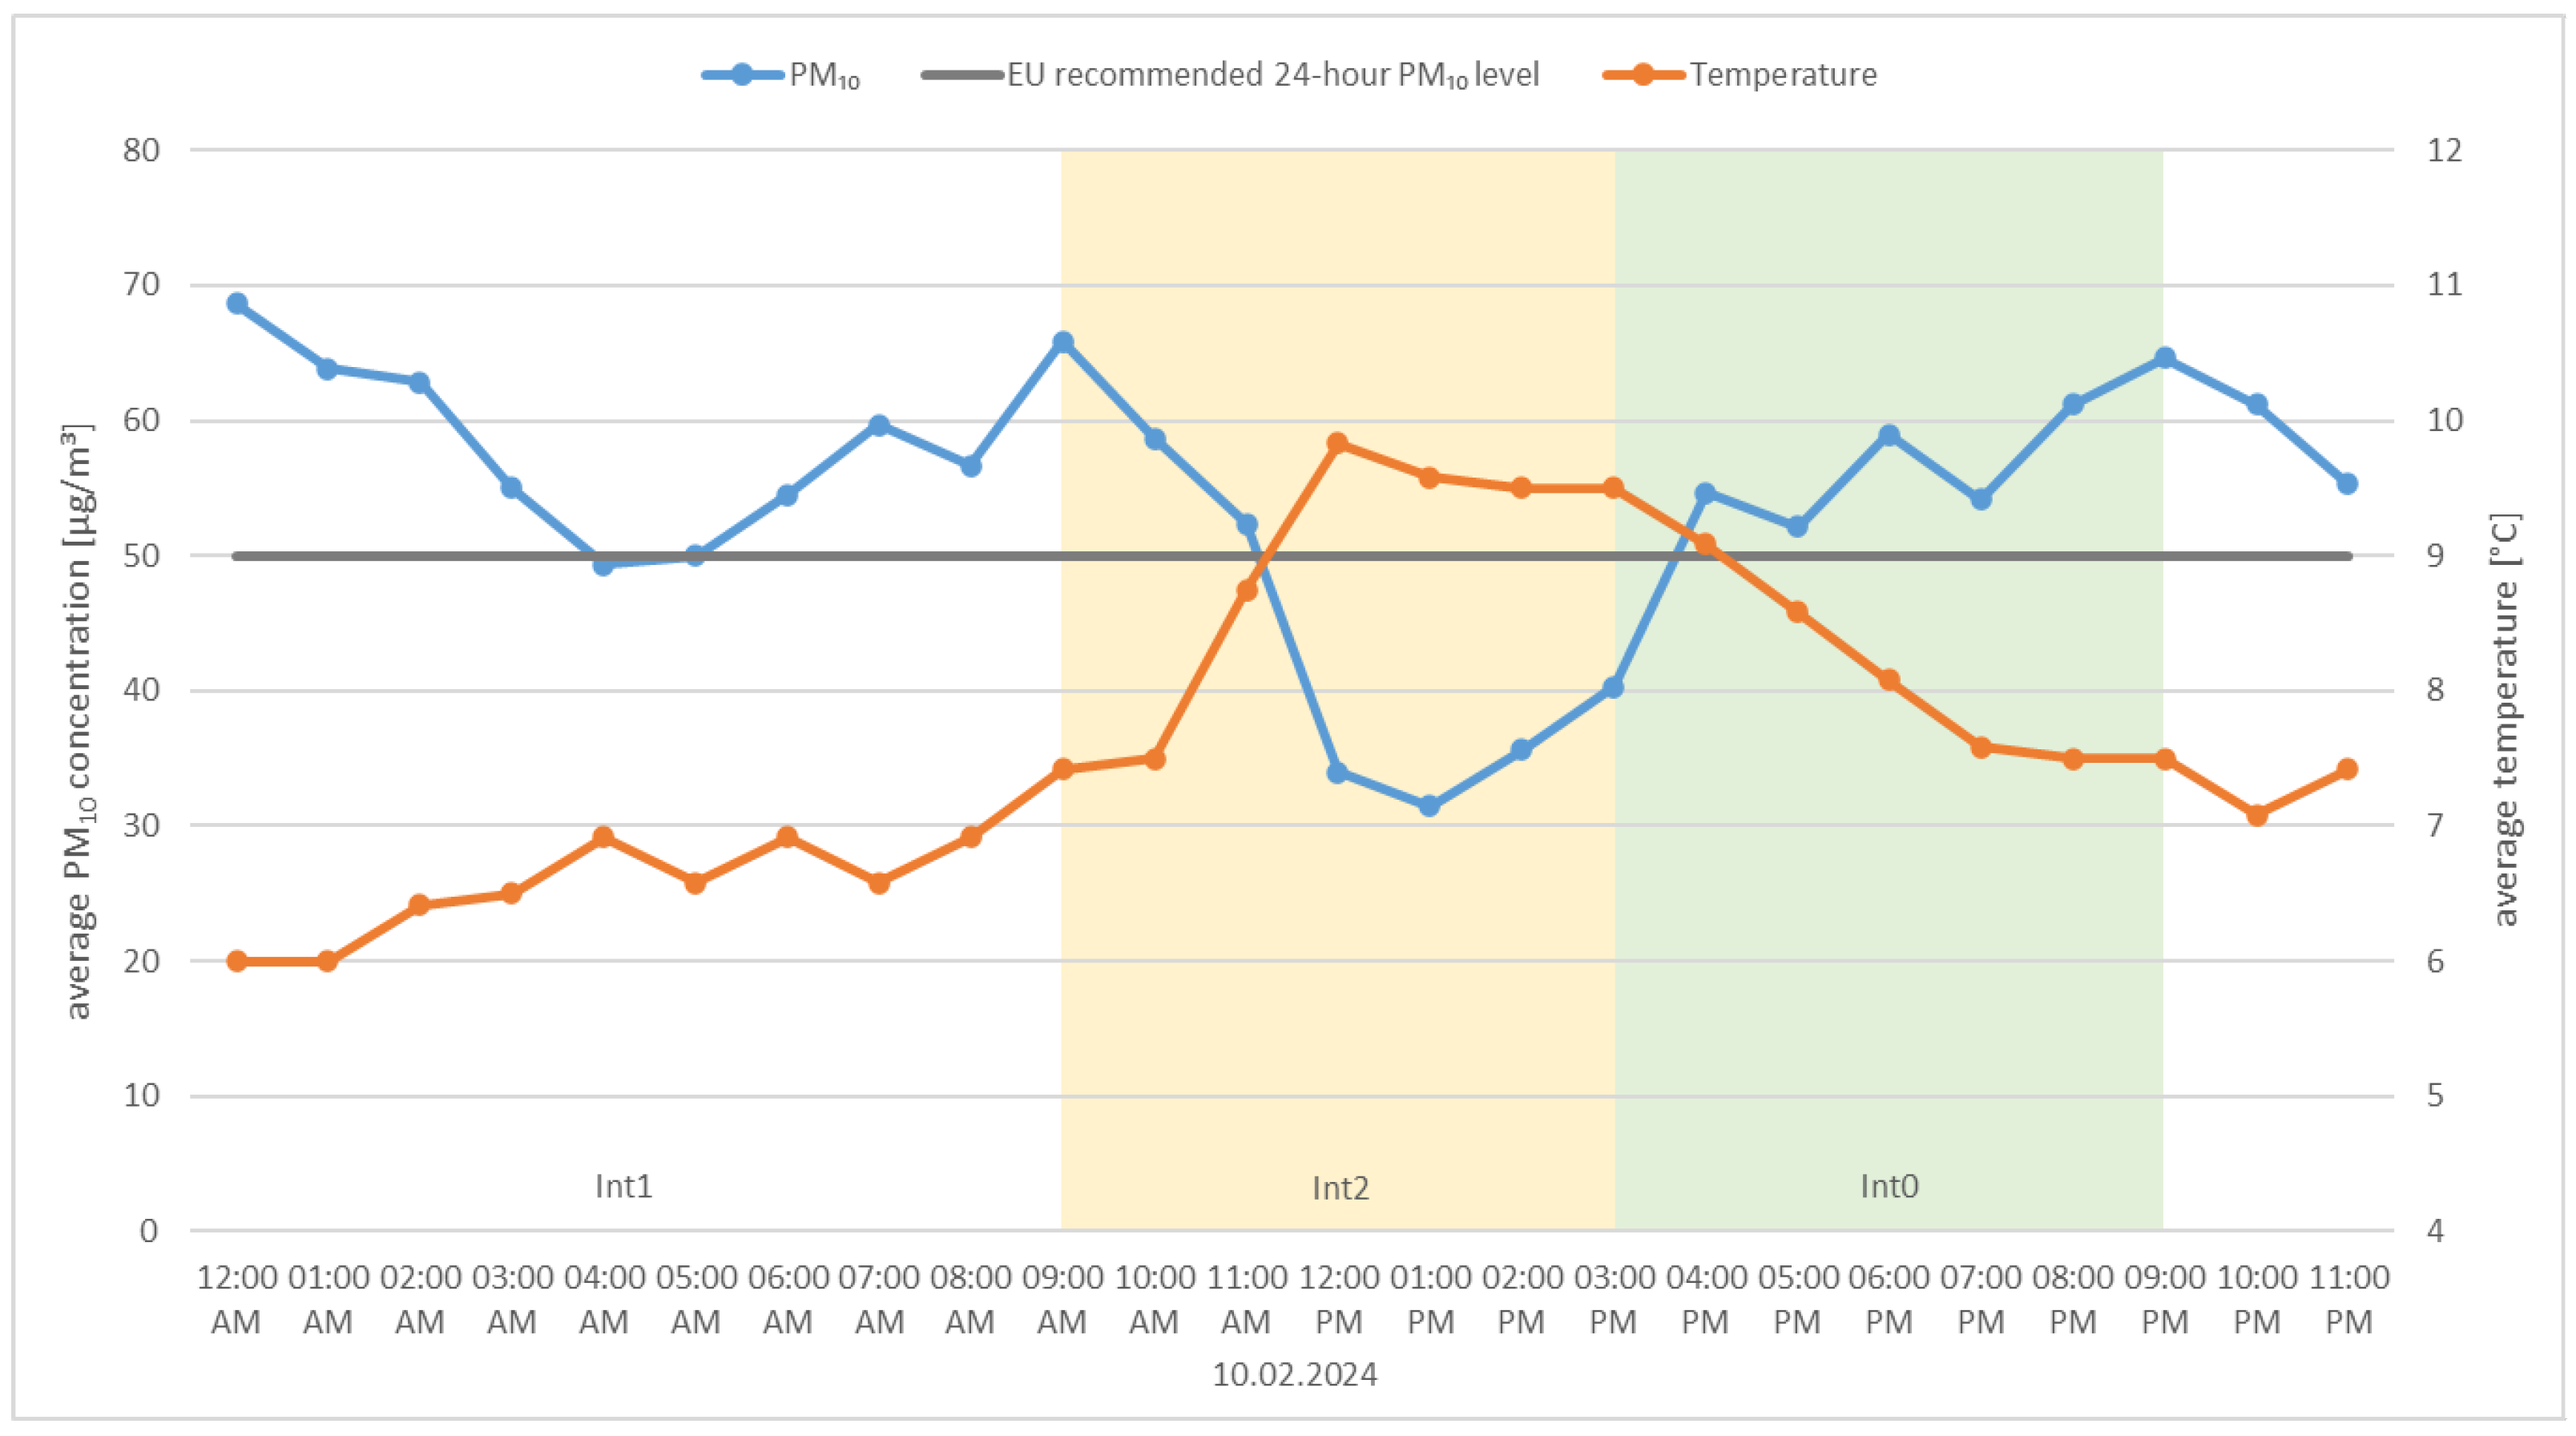
Figure 12 shows the hourly average temperatures and PM10 concentrations on 10 February 2024. This was a non-working day (WEEKEND)—Saturday. The graph below shows a morning increase in particulate matter concentration, with a local maximum at 9:00 AM, on the border of Interval 2 (Int2). For most of the day, pollution remains above the EU-recommended standard.
In the above two graphs (Figure 11 and Figure 12), the highest particulate matter emissions occur in the morning, in contrast to weekdays, where the highest emissions occur in the afternoon. This is most likely due to the fact that, on non-working days, residents begin firing up their boilers shortly after waking up.
The last graph shows the relationship between temperature and particulate matter concentration during a day with a low outside temperature that remained at a similar level throughout the day.
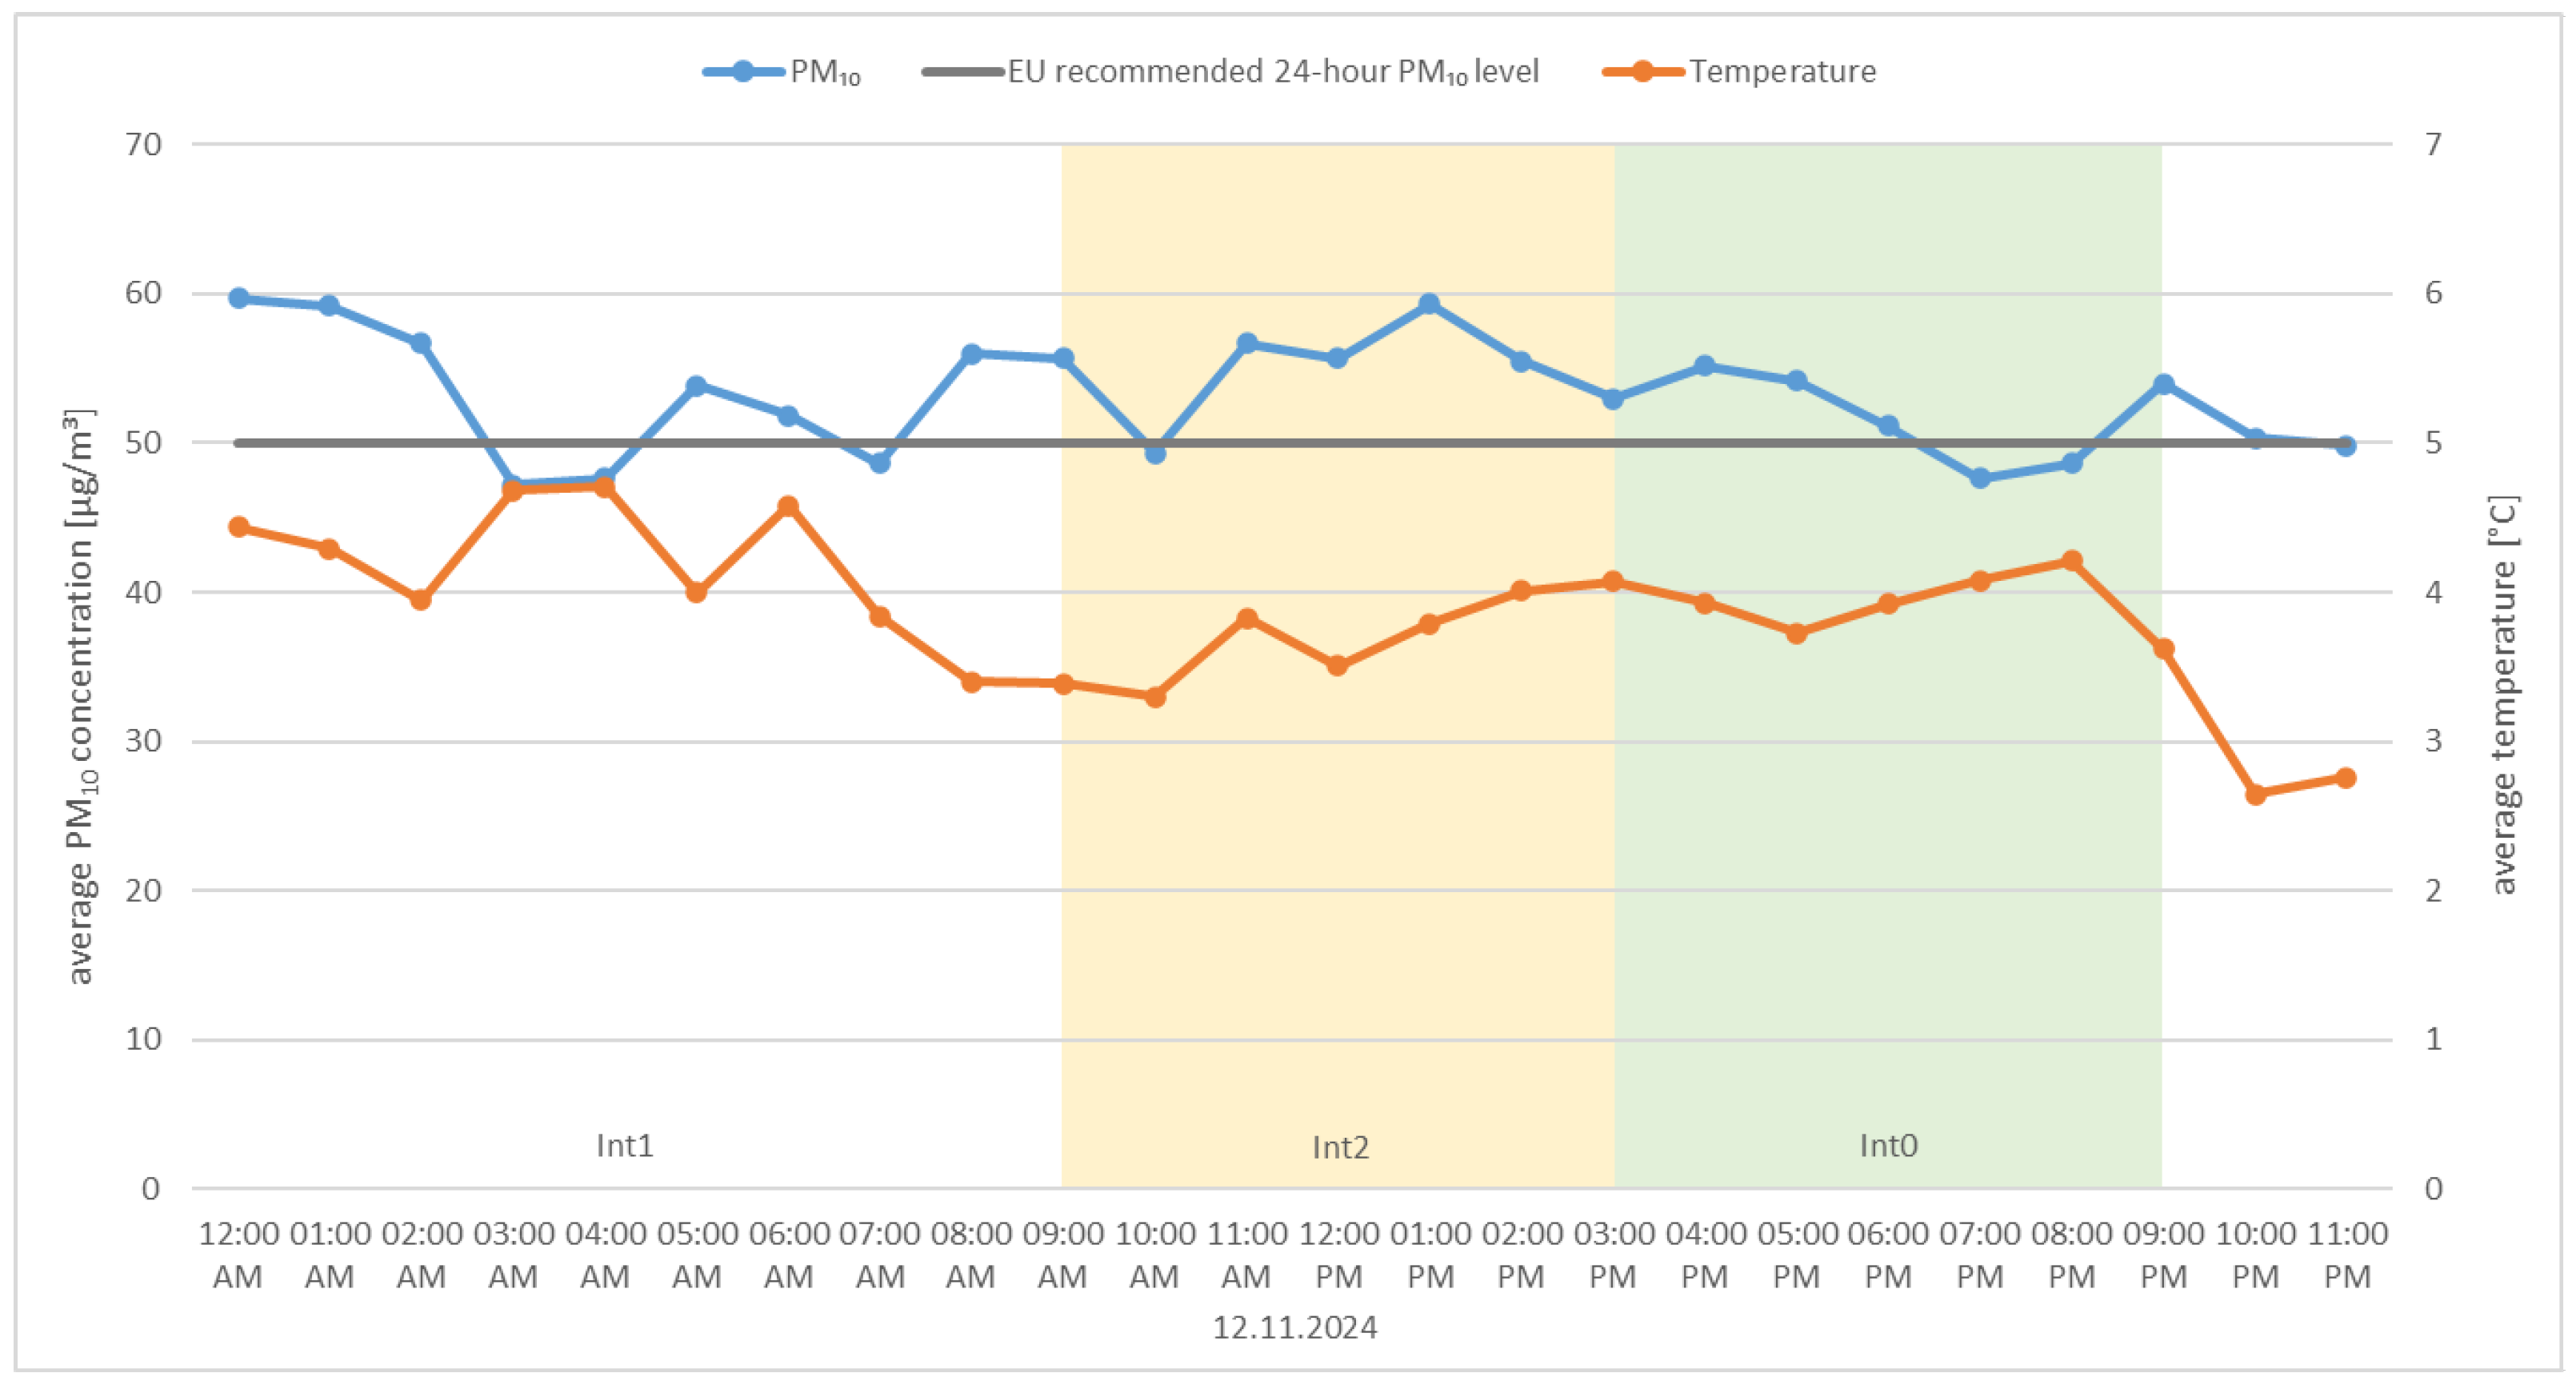
Figure 13 shows the hourly average temperatures and PM10 concentrations on 12 November 2024. This was a constant heat reception (CHR) day—Tuesday. In the graph below, the PM10 concentration levels remain similar throughout the day and are above the EU-recommended standard most of the time. Due to the relatively low and constant temperatures, in this case, heating systems operate around the clock, so there is no single common moment when boilers are fired up, as was the case on the days shown in Figure 7, Figure 8, Figure 9 and Figure 10 (even though it is also a weekday).

3.3. Linear Regression Model

One of the statistics of bivariate data is the Pearson linear correlation coefficient from the sample, which is denoted as r and defined by the following formula:
r = s x y s x s y
where
  • sxy is the sample covariance: s x y = 1 n 1 i = 1 n x i · y i n · x ¯ · y ¯ ;
  • s x is the sample standard deviation for the variable X, s x = 1 n 1 i = 1 n x i 2 n · x ¯ 2 ;
  • s y is the sample standard deviation for the variable Y, s y = 1 n 1 i = 1 n y i 2 n · y ¯ 2 .
The absolute value of the correlation coefficient informs about the strength of the linear relationship between the examined features X and Y:
  • 0—No linear relationship;
  • 0–0.2—Very weak linear relationship;
  • 0.2–0.4—Weak linear relationship;
  • 0.4–0.6—Moderate linear relationship;
  • 0.6–0.8—Strong linear relationship;
  • 0.8–1—Very strong linear relationship.
Based on the data from 2022–2024 regarding air pollution with PM10, the correlation coefficient (dependence) of PM10 concentration on air temperature and, consequently, on the intensity of boiler use was determined for each month.
Table 2 presents the values of the correlation coefficients from Sample (1) determined from three years of measurements in total.
Designation:
  • Jan—Data from January 2022, January 2023, and January 2024 taken together;
  • Feb—Data from February 2022, February 2023, and February 2024 taken together;
  • Dec—Data from December 2022, December 2023, and December 2024 taken together.
A moderate positive relationship between temperature and PM10 can be observed in July and a strong positive relationship in August. This means that as temperature increases, PM10 pollution increases moderately/strongly.
The opposite relationship can be observed for the autumn and winter months: November, December, and January. The negative relationship means that as temperatures decrease, PM10 pollution increases. This relationship is moderately negative for November and January and strongly negative for December.
Although the correlation coefficient allows for the description of the direction and strength of the relationship, it does not allow for the prediction of the value of the dependent variable Y for a given value of the independent variable X.
Such prediction is possible using, for example, a linear regression model, the advantage of which is a clear interpretation of parameters.
To include the random effect of year in the model, a regression model is used for statistical analysis, which, in scalar form, can be presented as follows [45,46]:
y i j = β 0 + β 1 x i j + γ j + ε i j
where
  • y i j is the observed individual i-th value in the j-th year (random variable, dependent);
  • β 0 is the intercept of the linear regression (fixed parameter);
  • β 1 is the linear regression coefficient (fixed parameter);
  • x i j is the i-th value of the independent variable (covariate) in the j-th year;
  • γ j is the random effect of the j-th year;
  • ε i j is the random error of the i-th observation in the j-th year.
It is assumed that the random variables from the model have the following parameters:
  • E ( y i j ) = β 0 + β 1 x i j , V a r ( y i j ) = σ 2 ;
  • E ( γ j ) = 0 , V a r ( γ j ) = σ j 2 ;
  • E ( ε i j ) = 0 , V a r ( ε i j ) = σ 2 .
Here, E(⋅) denotes the expected value of the random variable, and Var(⋅) denotes the variance of the random variable.

3.4. Regression Analysis of PM10 Concentration on Temperature

Knowledge about particulate matter air pollution allows us to take action to minimize the negative impact on health and the environment. It allows us to understand the causes and effects of pollution and take steps to improve air quality. Monitoring pollution throughout the year and at different times of the day allows us to make informed decisions, for example, regarding outdoor physical activity, especially during periods of increased particulate matter concentration.
Hence, detailed studies of the influence of the atmospheric environment, in particular air temperature (in relation to the operation of top-loaded boilers), on the level of particulate matter pollution in different months of the year seem justified.
Research conducted for the years 2022–2024 allowed us to determine a simple linear regression model for PM10 levels as a function of temperature. Such a model could be created for each month of a given year separately. The simple linear regression model would then have the following form [46]:
y i = β 0 + β 1 x i + ε i
where
  • y i is the observed individual i-th value (random, dependent variable);
  • β 0 is the intercept of linear regression (fixed parameter);
  • β 1 is the linear regression coefficient (fixed parameter);
  • x i is the i-th value of the independent variable (covariate);
  • ε i is the random error of the i-th observation.
It is assumed that the random variables from the model have the following parameters:
  • E ( y i ) = β 0 + β 1 x i , V a r ( y i ) = σ 2 ;
  • E ( ε i ) = 0 , V a r ( ε i ) = σ 2 .
Here, E(⋅), as before, denotes the expected value of the random variable, and Var(⋅) denotes the variance of the random variable. Model (3) is quite “poor” because it does not include the year effect.
Based on Model (3), the PM10 level, i.e., y, can be determined depending on temperature x. For example, for December in 2022, 2023, and 2024, the graphs of the simple regression lines (3) are presented in Figure 14.
According to Formula (3), regression lines were estimated for the three years under consideration. We can read the level of PM10 pollution; for example, in December 2022, at a temperature of 0 °C (red line), it was slightly higher at the same temperature in 2024 (green line) and the highest in 2023. Of course, we can see differences between the years, although the trend is maintained in all three years. Additionally, the daily standard of 50 µg/m3 permitted by the EU regulations is marked with a horizontal dashed line.
The graphs showing these relationships are interesting from a statistical perspective. It can be analyzed how PM10 levels have changed in previous years depending on outdoor air temperature and, consequently, boiler operation intensity.
However, a more meaningful approach than determining the relationship for a given month of a given year is to make predictions (forecasts) for the future based on previous years. Model (2), which takes into account the year effect, provides this capability.
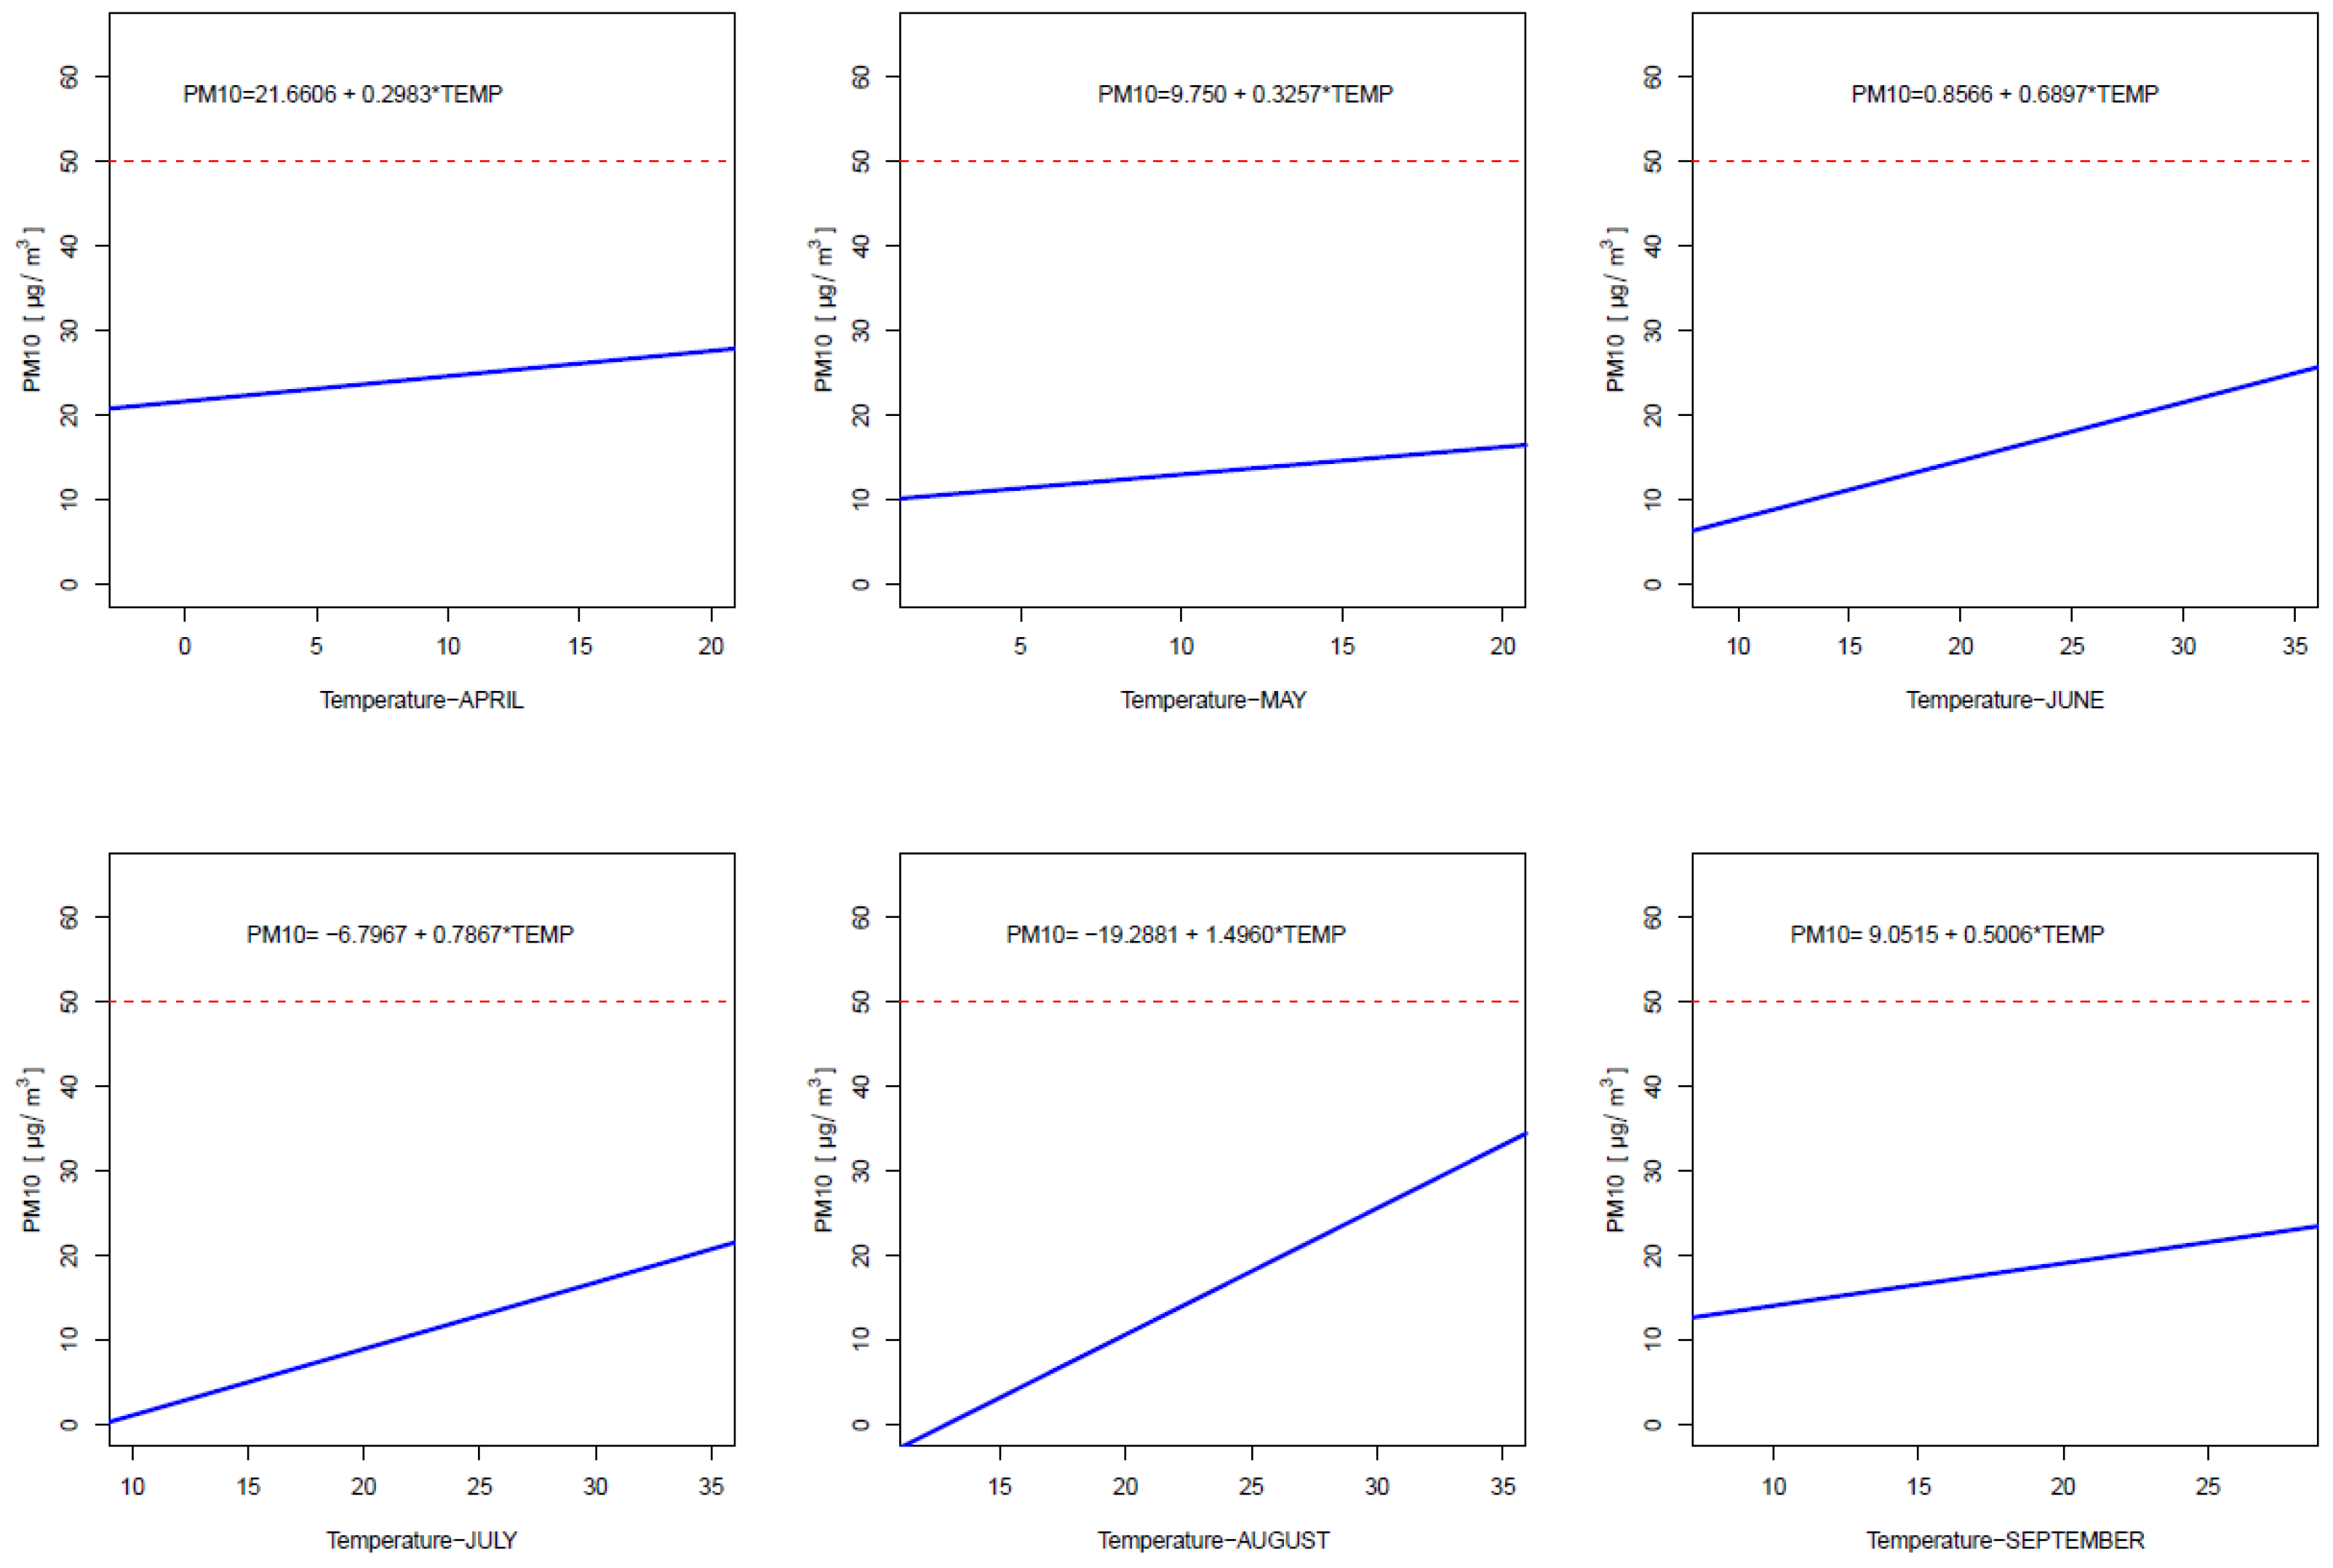
Based on the observed PM10 concentration values in the 2022–2024 study years, the regression models presented in Figure 15 and Figure 16 were estimated separately for each month according to Formula (2).
For example, the model for December (Figure 15) presents a linear regression (PM10 values as a function of temperature), which enables the prediction of future PM10 particulate matter pollution for a given temperature in December from the following equation:
PM 10 = 52.5953 4.4317 TEMP
An example forecast for five selected temperatures in December is presented in Table 3.
The above estimates were based on three years of research. Each graph also includes a horizontal dashed line (the daily limit of 50 µg/m3 permitted by EU regulations). Note that, in December, even at 0 °C, we can expect air pollution in Pleszew to exceed 50 µg/m3. The lower the temperature, the higher the pollution, according to Model (4).
The graphs in Figure 15 are consistent with the information in Table 2. The largest negative relationship between PM10 and temperature can be observed for November, December, and January. The straight lines (blue) are the most sloped, and in each of these three months, the relationship is statistically highly significant. Furthermore, for the negative temperatures typical of these three months, the predicted PM10 values exceed 50 µg/m3. In the remaining three months (Figure 15), although the relationship is also negative, slightly lower PM10 pollution can be expected.
Based on the models estimated for the months of April to September (Figure 16), we can expect a positive relationship between PM10 and temperature. This means that as the temperature increases, PM10 increases. Although the relationship is quite strong in July and August, we can expect PM10 concentrations to be significantly below the permissible limit of 50 µg/m3.

3.5. Daily and Hourly Air Pollution Analysis

To determine whether boilers with manual fuel loading are a major cause of increased air pollution on a daily and hourly basis, a detailed analysis of randomly selected days was conducted. To obtain reliable results, the analysis included days/24 h periods from different years and seasons, taking into account the varying heat consumption of Pleszew residents.
The analysis was carried out
(1)
on 15 November 2022 and two days preceding and two days following (five consecutive days randomly selected from the 2022 heating period);
(2)
on three randomly selected days from the 2023 heating period (a spring day, an autumn day, and a winter day);
(3)
on randomly selected days (from three years), taking into account the combustion process and heat reception.
It was analyzed how the concentrations of PM10 change during one day depending on the time of day, which is closely related to the stages of the combustion process, i.e., the operation of the hand-fired grate boilers.
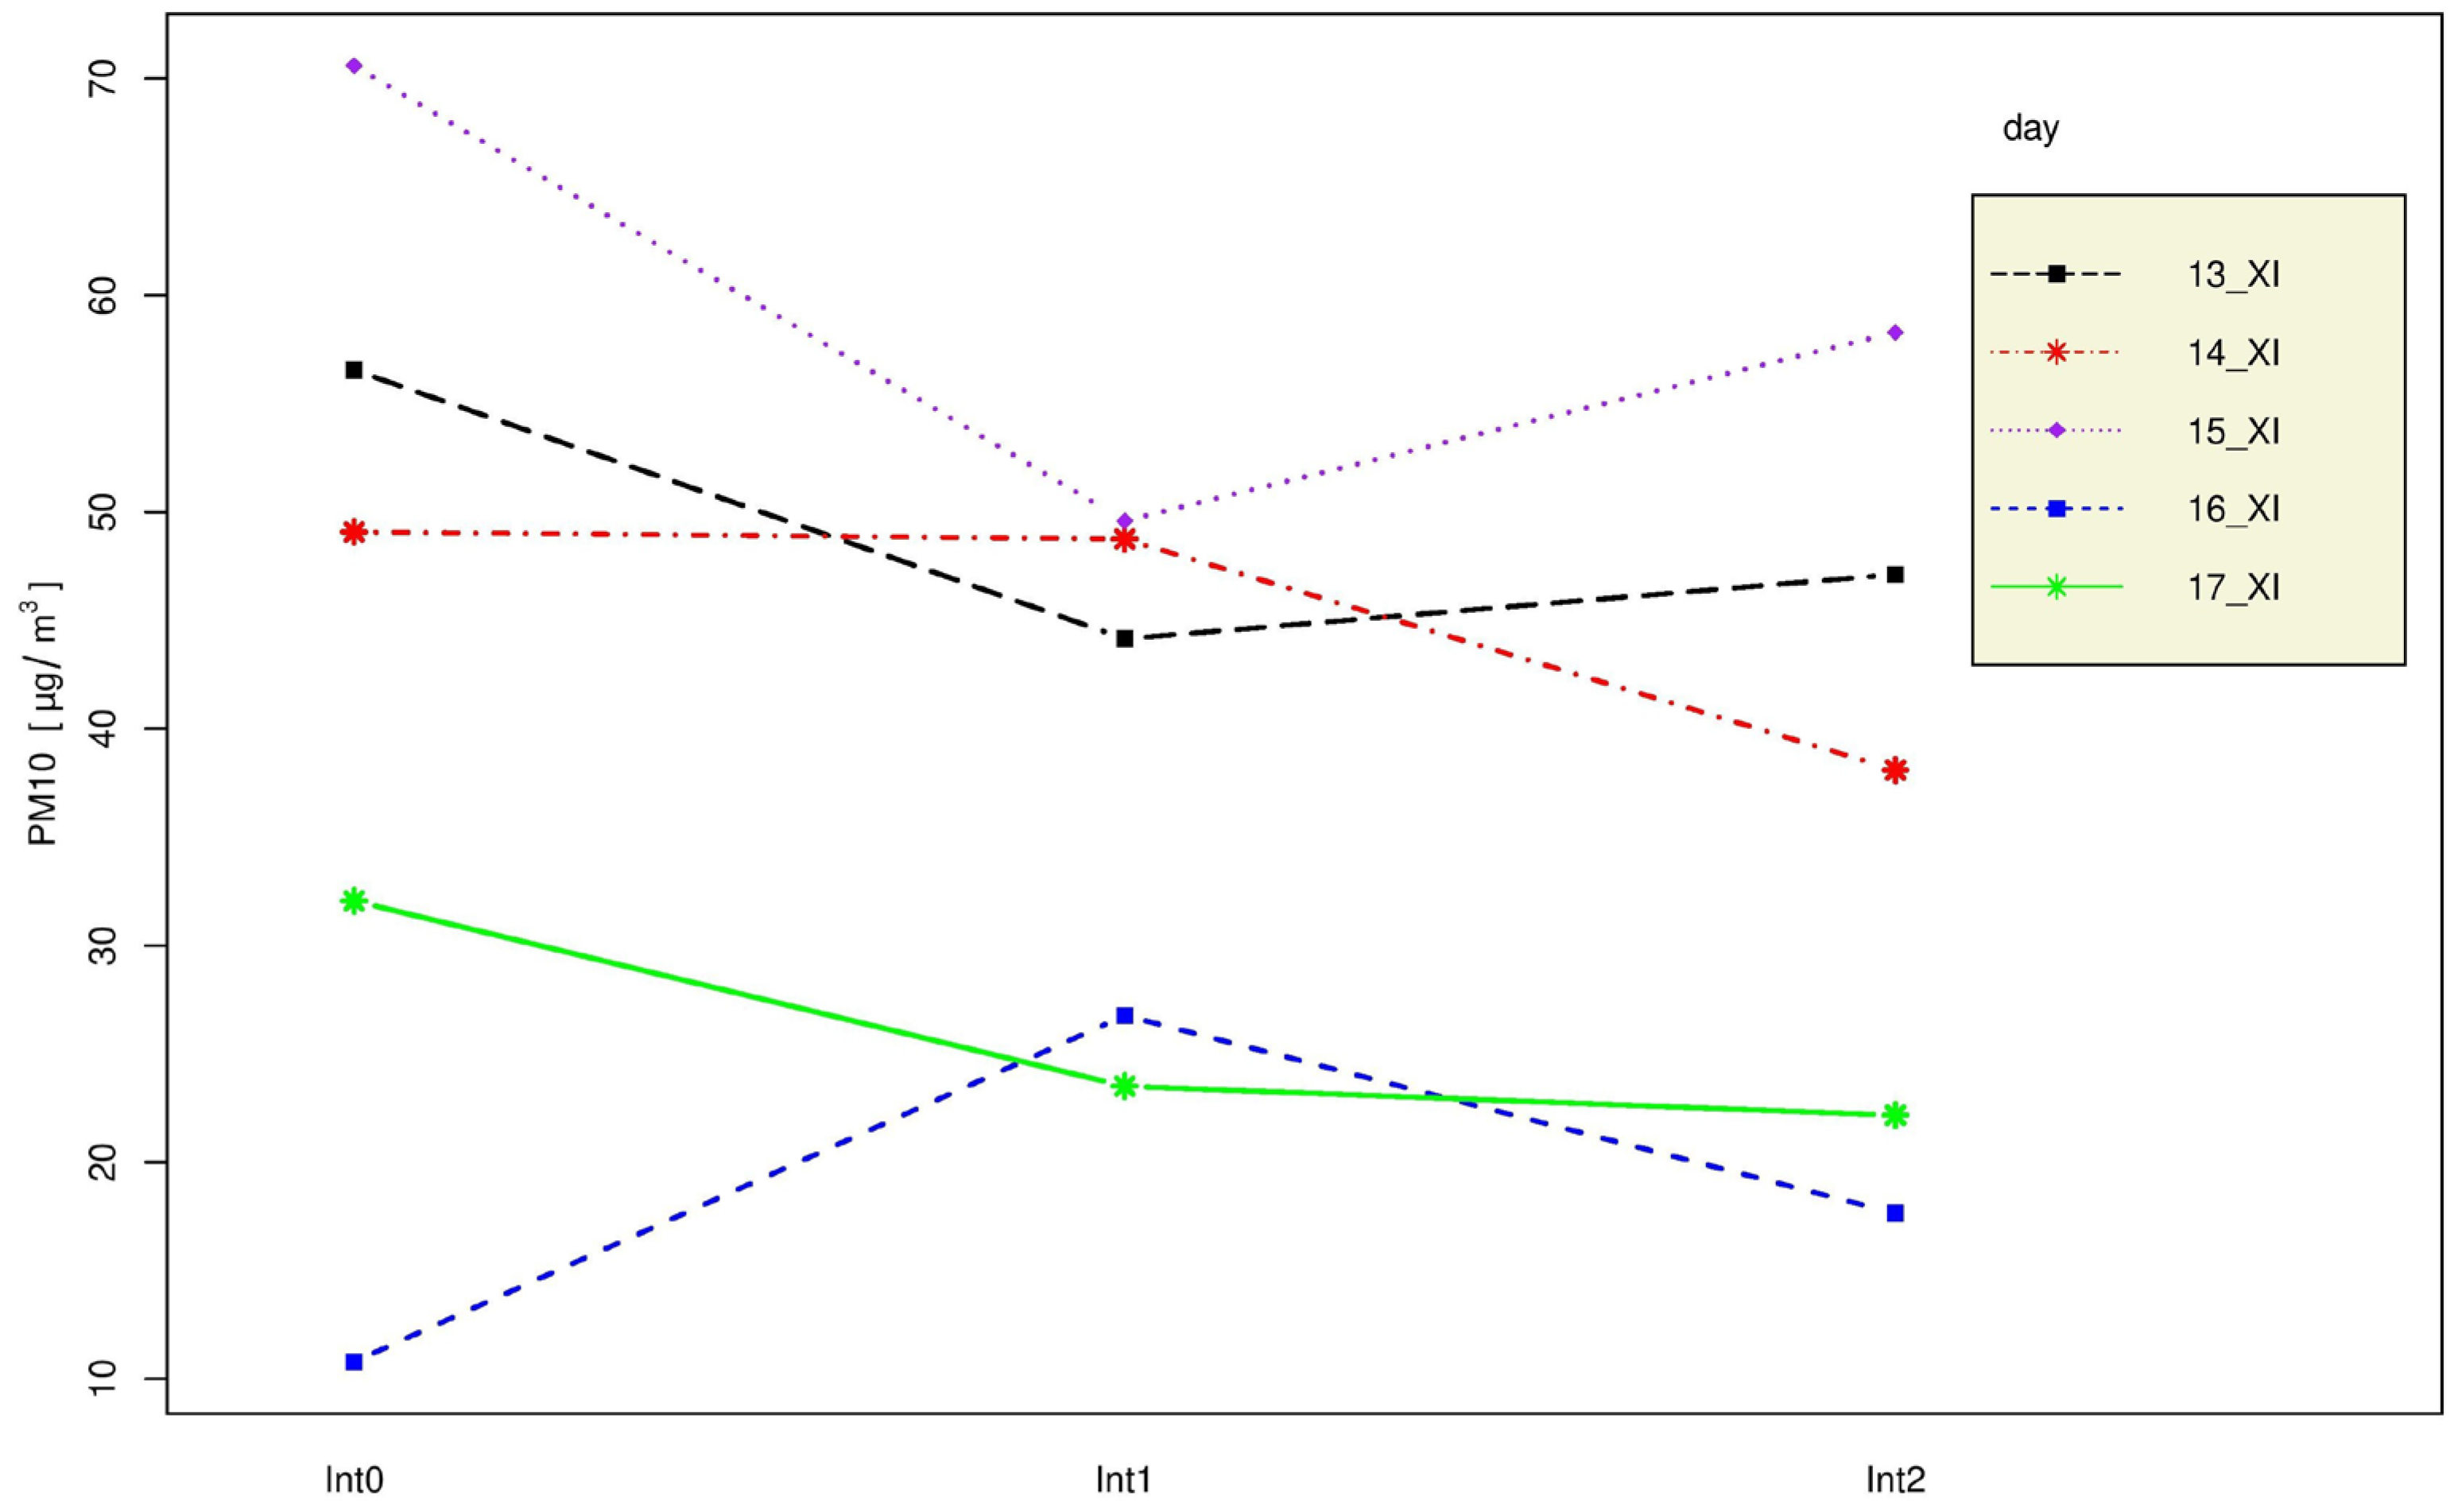
The first analysis was performed for the five consecutive days in November 2022: from 13 November to 17 November. Average PM10 value levels were plotted for individual days (adopted time intervals).
In the graph (Figure 17), it can be seen that for almost all days, the average PM10 values were the highest during Interval 0, i.e., between 3:00 PM and 9:00 PM. The exception was 16 November.
In the next steps, detailed research and statistical analyses were performed to answer the question of whether the differences between the PM10 values for the three considered intervals are statistically significant, i.e., whether the time intervals do not differ in terms of PM10 values.
We put forward the null hypothesis H 0 which states that the average PM10 values for all three intervals are the same (within one 24 h period):
H 0 : μ I n t 0 = μ I n t 1 = μ I n t 2
where
  • μ I n t 0 means the average concentration of PM10 during the time interval Int0, i.e., in the hourly interval from [3:00 PM to 9:00 PM);
  • μ I n t 1 means the average concentration of PM10 during the time interval Int1, i.e., in the hourly interval from [9:00 PM to 9:00 AM);
  • μ I n t 2 means the average concentration of PM10 during the time interval Int2, i.e., in the hourly interval from [9:00 AM to 3:00 PM).
We assume that we are testing at a significance level of α = 0.01 (with an error of 0.01). After conducting an analysis of variance (ANOVA) on the observed data, we obtain p values. If the p value < α, we reject H 0 . The ANOVA results for each of the five sample days are presented independently in Table 4.
Table 4 shows that (for each day independently) the null hypothesis H0 should be rejected; hence, we claim that (for a given day) the average PM10 values for all three intervals are not the same, and they differ statistically significantly.
Next, Tukey’s test for homogeneous groups was performed. The results are presented in Table 5.
Column 4 lists the average PM10 content for each hourly interval for a given day. The averages are arranged in descending order (within a day). The letters in the fourth column indicate Tukey’s homogeneous group. We can deduce which time intervals (within a single day) belong to the same group in terms of PM10 content.
And so, for example, for 13 November, the hourly intervals from [9:00 AM to 3:00 PM) and from [9:00 PM to 9:00 AM) belong to the same homogeneous group “b” (i.e., do not differ statistically significantly) in terms of the average PM10 value. Similarly, on 14 November, the hourly intervals from [3:00 PM to 9:00 PM) and from [9:00 PM to 9:00 AM) belong to the same homogeneous group “a” (i.e., do not differ statistically significantly) in terms of the average PM10 value. The remaining results should be interpreted analogously.
The results in Table 5 confirm what we observe in Figure 17, namely, that for almost all days, the average PM10 values were the highest during Interval 0, i.e., between 3:00 PM and 9:00 PM. Furthermore, on 15 November and 13 November, between 3:00 PM and 9:00 PM, the PM10 level significantly exceeded 50 µg/m3. This may confirm the assumption that, during these hours, the operation of boilers with manual fuel loading was very intense and caused high air pollution.
The exception was 16 November. On that day, PM10 levels were low during all time intervals. The air temperature, humidity, and atmospheric pressure on that day were similar to those on other days, so the low PM10 levels must be attributed to other factors, such as strong winds.
Table 6 presents the results of the Tukey’s test for the randomly selected days from the heating period in 2023.
The results in Table 6 confirm the thesis that PM10 pollution is the highest between 3:00 PM and 9:00 PM.
Additionally, the above analyses were performed for randomly selected days, taking into account the combustion process and heat reception:
Standard combustion process (SCP)—Working days:
  • 15 November 2022—Tuesday;
  • 15 March 2023—Wednesday;
  • 23 October 2023—Monday;
  • 14 April 2024—Monday.
Weekend (WEEKEND)—Days off from work, different lifestyle of residents:
  • 19 November 2022—Saturday;
  • 10 February 2024—Saturday.
Constant heat reception (CHR)—Due to the low outside air temperature, a continuous cycle of boiler operation is forced:
  • 12 November 2024—Tuesday—Temperature around 0 °C all day.
Based on the results in Table 7, it can be seen that, on SCP days, when residents return from work in the afternoon, air pollution with PM10 is at different levels, but on each of the four days analyzed, it was the highest during the time interval Int0, i.e., [3:00 PM–9:00 PM].
On WEEKEND days, air pollution with PM10 was the highest during the Int1 time interval, i.e., [9:00 PM—9:00 AM]. On these days, residents are often away from home during the day, and the boiler is loaded and fired up in the evening.
On the CHR day, where constant heat reception occurred, the PM10 air pollution was comparable among the three time intervals. This was a day when low temperatures persisted throughout the day. On this day, during each time interval, not only the daily standards recommended by the WHO (45 µg/m3) but also the EU standards (50 µg/m3) were exceeded.
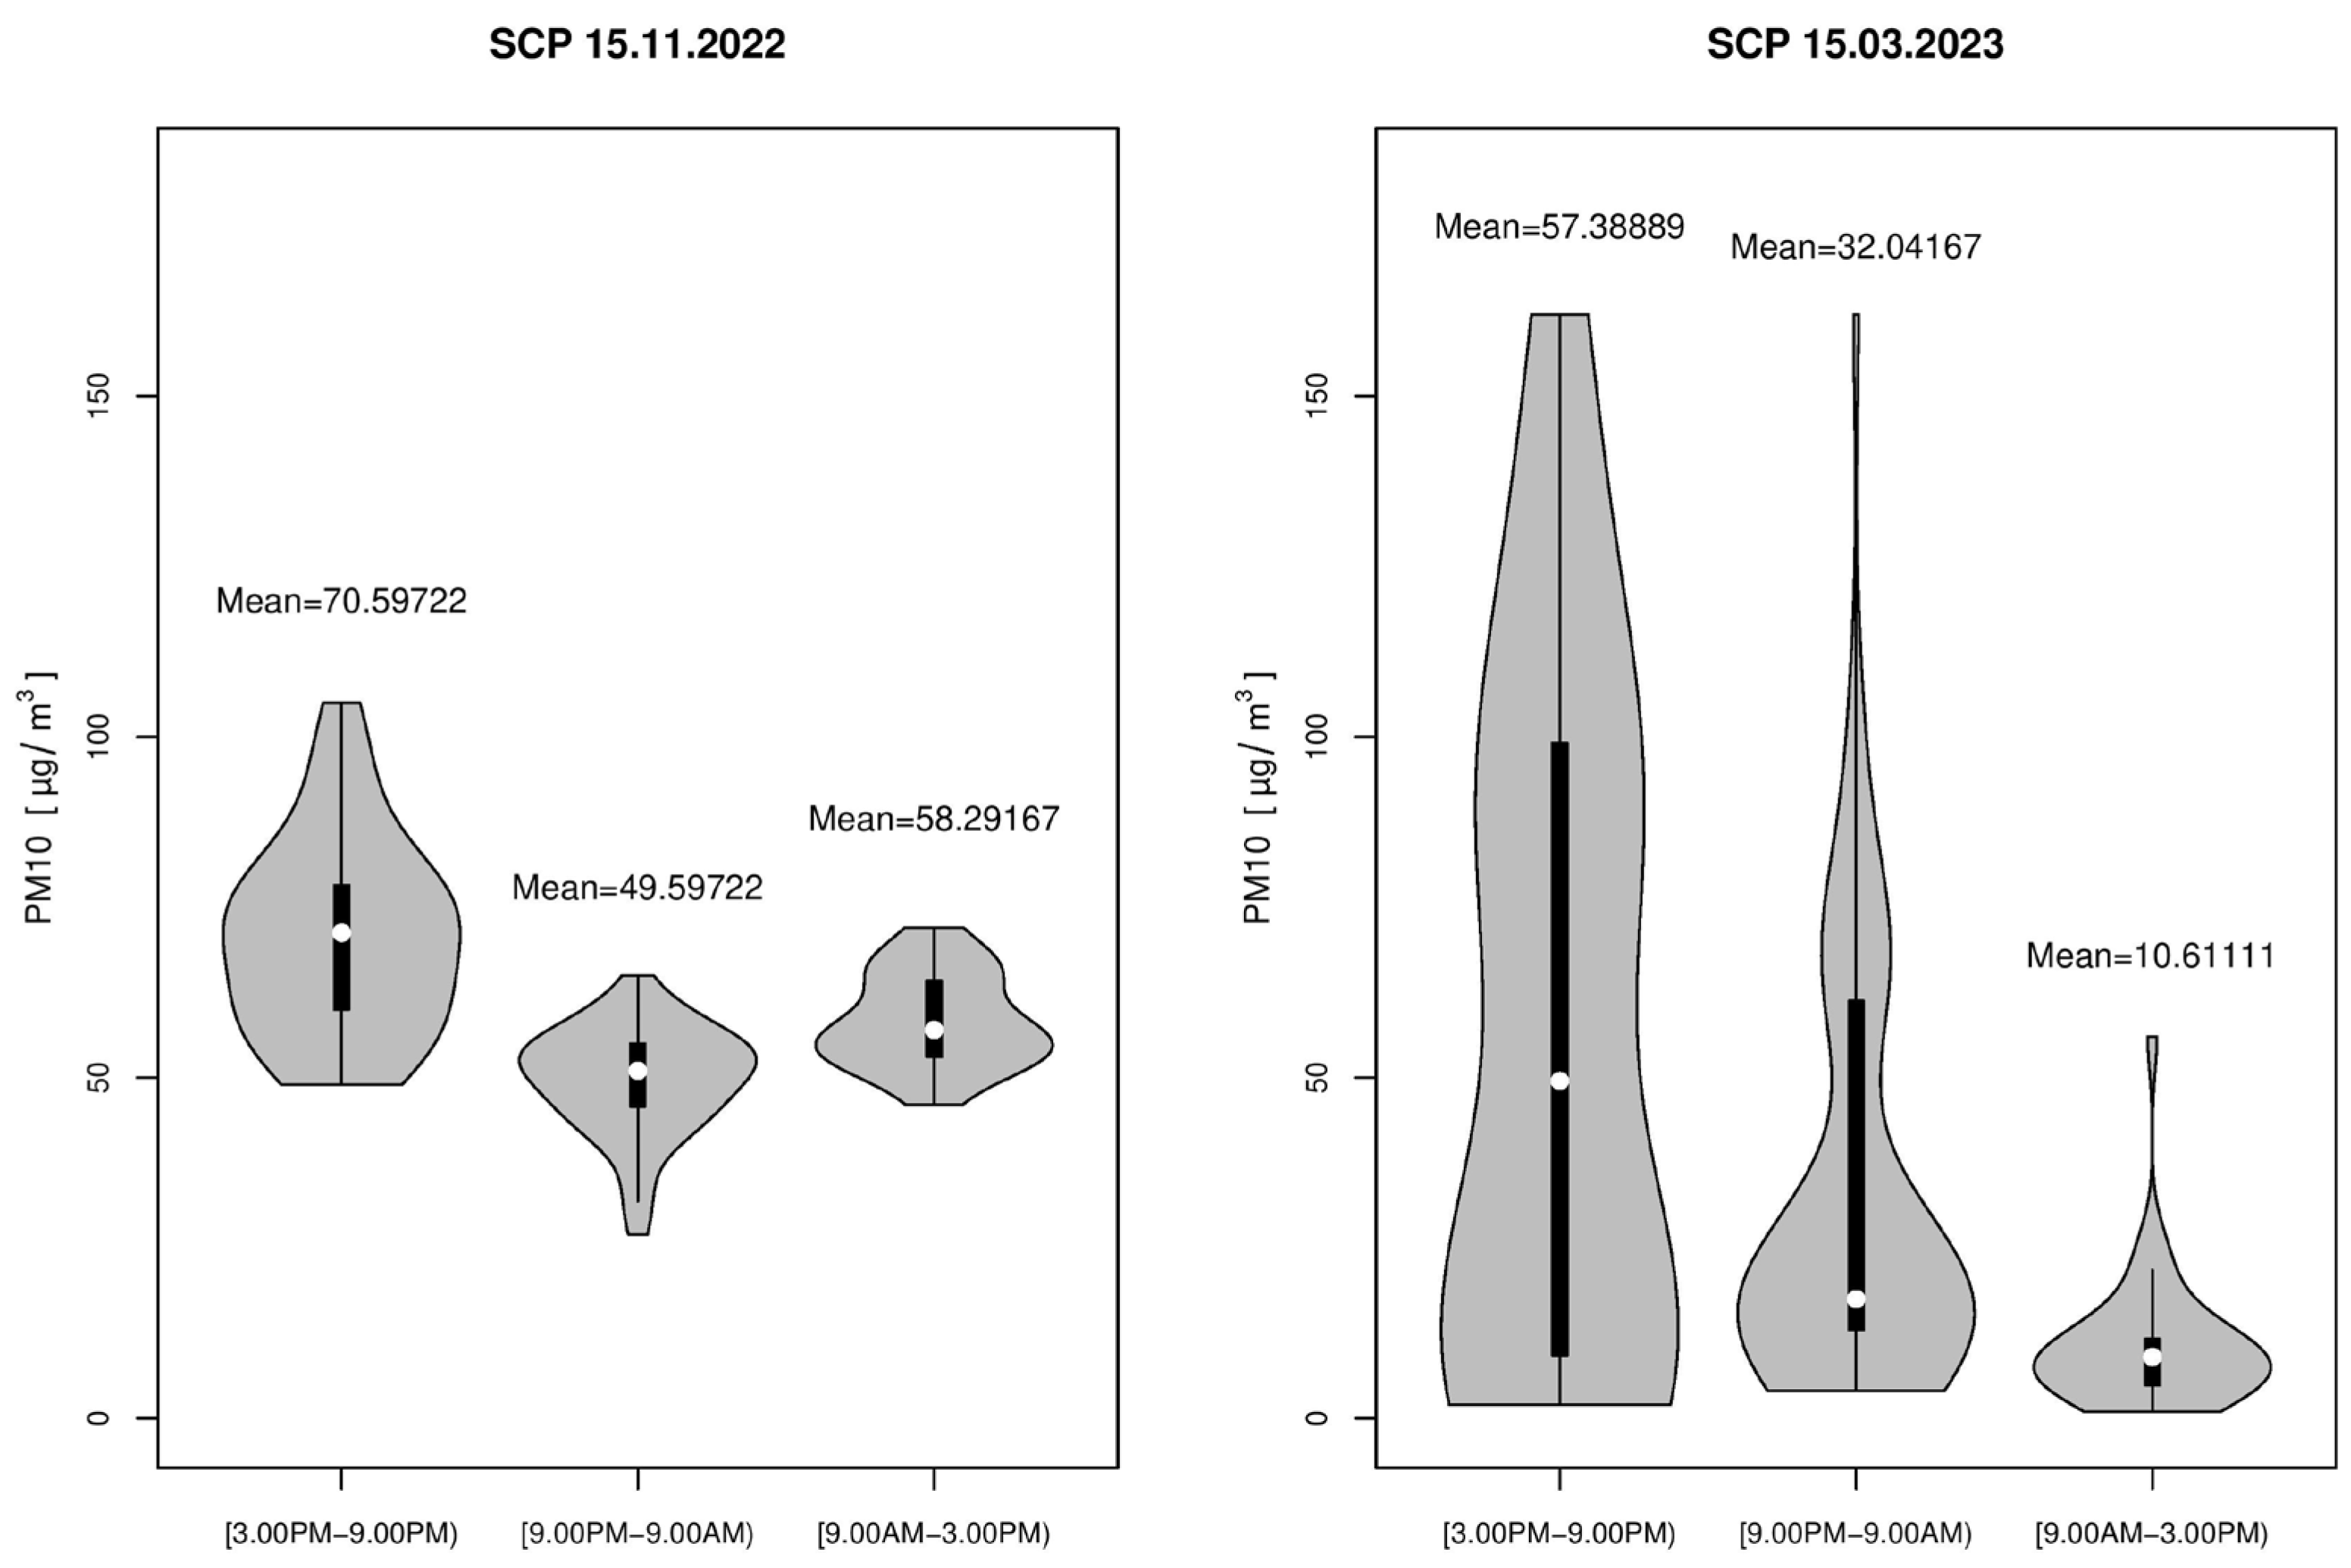
To better illustrate the observed PM10 concentrations, a graphical illustration of the data for four sample days was created (Figure 18 and Figure 19).
Figure 18 and Figure 19 present violin plots of the observed PM10 concentrations. The black rectangle is the boxplot, the bottom of the boxplot is the lower quartile, and the top is the upper quartile. The white circle in the center of the rectangle is the median. The width of the “violin” indicates the number of observed concentrations (the wider the violin, the more observations there were at a given level). The graphs show the mean concentration values in each time interval—Mean.
For example, for 19 November 2022—a WEEKEND day (Figure 19)—although the average value during the time interval [9:00 PM–9:00 AM) was Mean = 39.22222 µg/m3, we can notice that the concentration values ranged from approx. Min=16 µg/m3 to approx. Max = 82 µg/m3. The median was Me = 35.5 µg/m3 (white circle). The highest concentrations were observed at the level of 25–45 µg/m3 (the widest violin).
During the WEEKEND, most observations during all time intervals were below 50 µg/m3.
On 12 November 2024—the constant heat reception (CHR) day—the concentrations during all time intervals were at the same level (the widest violin at the level of approx. 50 µg/m3)
However, on the days when the standard combustion process (SCP, Figure 18) was in progress, the highest concentrations were observed during Interval 0, i.e., in the hours from [3:00 PM to 9:00 PM).
All statistical analyses were performed using the R (RStudio, R version 4.1.2) program [47].

4. Discussion and Conclusions

The ability to forecast air pollution levels for specific months of the year is an important tool supporting both individual and institutional decision-making processes. Knowledge of expected changes in air quality allows for informed physical activity and for planning time spent outdoors to minimize exposure to harmful substances. In situations requiring outdoor activities during times when elevated particulate matter concentrations are forecasted, protective measures such as filtering masks, limiting exposure time, or using air purifiers in enclosed spaces become possible.
Air quality forecasts are particularly important for high-risk groups, including children, the elderly, and patients with respiratory and circulatory system diseases. Early information about expected deteriorations in air quality allows these individuals to limit activities requiring intense physical exertion and take preventative measures that can reduce the risk of exacerbating disease symptoms.
Forecasting is becoming a crucial element of public health policy and adaptation strategies in the context of air pollution in urban agglomerations.
The obtained results clearly indicate that PM10 concentrations in the study area strongly depend on both the type of day and the time of day. The highest concentrations were observed in the autumn and winter periods, during the afternoon and evening hours (Int0 interval: 3:00 PM–9:00 PM).
On days with persistently low outdoor temperatures, PM10 concentrations remain high in each of the analyzed intervals. This indicates persistently unfavorable air quality conditions throughout the 24 h cycle, without natural improvement phases. This is crucial for public health protection and intervention planning.
The relationship demonstrated in this study between the use of hand-fired grate boilers and increased air pollutant concentrations indicates the direct impact of individual household decisions on environmental quality. Hand-fired grate boilers, due to their design and low energy efficiency, generate significantly higher emissions of particulate matter and other pollutants compared to modern heat sources. The empirical confirmation of this relationship should be a premise for decisions to gradually phase out the use of these devices in favor of ecological solutions such as gas boilers, heat pumps, or systems based on renewable energy sources.
From a social perspective, the obtained results also have educational significance and can contribute to increasing residents’ awareness of the consequences of their heating source choices for air quality and public health. Demonstrating a clear correlation between individual behavior and the state of the natural environment strengthens the argument for pro-ecological actions and investments in low-emission technologies.
More broadly, eliminating hand-fired boilers and replacing them with modern heating devices should be supported not only by individual decisions of residents but also through appropriate public policy instruments, including subsidy programs, tax relief, and legal regulations. This will enable sustainable emission reductions and improved air quality at the local and regional levels.
Summary:
  • The statistical analysis carried out in this study showed a significant relationship between the temperature drop and the increase in the concentration of suspended PM10 particulate matter in the heating season, which confirms the hypothesis about the dominant influence of atmospheric conditions (especially low temperature) on pollutant emissions.
  • The key role of manually hand-fired boilers in shaping the level of particulate matter emissions was pointed out, which suggests the need for further regulation and modernization of this type of combustion source.
  • The daily PM10 standard, i.e., 50 µg/m3 (according to EU regulations), was exceeded on days when constant heat removal occurred due to low outside temperatures.
  • Division of the day into three time intervals (Int0, Int1, Int2) proved to be an effective analytical tool enabling the identification of periods with the highest risk of high PM10 concentrations.
  • The highest concentrations were recorded in the autumn–winter season during the afternoon and evening hours (Int0) on weekdays, which is associated with the intensification of solid fuel combustion in households.
  • The results confirm that pollutant emissions are not solely a function of technical factors but are also significantly related to residents’ lifestyles, highlighting the importance of social aspects in air quality research.
  • The developed linear regression model enables effective forecasting of local PM10 concentrations depending on temperature, which is a useful tool in planning environmental policy and preventive measures.
  • The conducted analysis of variance (ANOVA) and Tukey’s post hoc tests revealed significant differences among the average particulate matter concentrations during the three daily intervals, indicating the complex nature of emission dynamics and the need to account for temporal variability in research and modeling.

Author Contributions

Conceptualization, E.B., A.D., R.U. and B.C.; methodology, E.B., A.D., R.U., B.C. and M.Ż.; software, M.Ż. and M.D.; validation, E.B., A.D., R.U. and B.C.; formal analysis, E.B., A.D. and R.U.; investigation, R.U. and B.C.; resources, R.U. and B.C.; data curation, E.B., A.D., R.U., B.C., M.Ż. and M.D.; writing—original draft preparation, E.B. and R.U.; writing—review and editing, E.B., A.D., R.U., B.C. and M.Ż.; visualization, E.B., R.U. and M.Ż.; supervision, R.U. and B.C.; project administration, E.B., A.D., R.U. and B.C.; funding acquisition, E.B., A.D., M.Ż. and M.D. All authors have read and agreed to the published version of the manuscript.

Funding

This project is co-financed by the University of Kalisz, the Polish state budget, and the Minister of Science under the “Doskonała nauka II” programme, contract number KONF/SP/0400/2024/02. This study was partly funded by the Institute of Mathematics, Poznan University of Technology, under grant no. 0213/SBAD/0122.

Data Availability Statement

The data supporting the findings of this study are available within the article. The full dataset is not publicly available due to restrictions.

Conflicts of Interest

The authors declare no conflicts of interest. The funders had no role in the design of the study; in the collection, analyses, or interpretation of data; in the writing of the manuscript; or in the decision to publish the results.

Abbreviations

The following abbreviations are used in this manuscript:
ANOVAAnalysis of Variance
CHRConstant Heat Reception
EUEuropean Union
PMParticulate Matter
SCPStandard Combustion Process
WHOWorld Health Organization

References

  1. Adamkiewicz, Ł.; Maciejewska, K.; Rabczenko, D.; Drzeniecka-Osiadacz, A. Ambient Particulate Air Pollution and Daily Hospital Admissions in 31 Cities in Poland. Atmosphere 2022, 13, 345. [Google Scholar] [CrossRef]
  2. Świeczkowski, M.; Kurasz, A.; Dąbrowski, E.J.; Bachorzewska-Gajewska, H.; Dobrzycki, S.; Kuzma, L. Analysis of Short- and Medium-Term Influence of Polish Smog on Atherothrombotic Cardiovascular Diseases in 709 Counties in Eastern Europe—Preliminary Results (EP-Particles Study). Eur. Heart J. 2023, 44 (Suppl. 2), ehad655.2572. [Google Scholar] [CrossRef]
  3. Adamkiewicz, Ł.; Maciejewska, K.; Skotak, K.; Krzyzanowski, M.; Badyda, A.; Juda-Rezler, K.; Dąbrowiecki, P. Health-Based Approach to Determine Alert and Information Thresholds for Particulate Matter Air Pollution. Sustainability 2021, 13, 1345. [Google Scholar] [CrossRef]
  4. WHO. Air Quality Guidelines—Global Update 2005: Particulate Matter, Ozone, Nitrogen Dioxide and Sulfur Dioxide; World Health Organization: Geneva, Switzerland, 2006; pp. 1–484. [Google Scholar]
  5. WHO. WHO Global Air Quality Guidelines: Particulate Matter (PM2.5 and PM10), Ozone, Nitrogen Dioxide, Sulfur Dioxide and Carbon Monoxide; World Health Organization: Geneva, Switzerland, 2021; pp. 1–218. [Google Scholar]
  6. WHO. Repository of Guidance Documents and Tools for Air Quality Management Systems; World Health Organization: Geneva, Switzerland, 2023; Available online: https://www.who.int/publications/m/item/repository-of-guidance-documents-and-tools-for-air-quality-management-systems (accessed on 6 August 2025).
  7. WHO. Epidemiological Repository on Particulate Matter and Mortality; World Health Organization: Geneva, Switzerland, 2022; Available online: https://www.who.int/tools/epidemiological-repository-on-particulate-matter-and-mortality (accessed on 6 August 2025).
  8. Directive 2008/50/EC of the European Parliament and of the Council of 21 May 2008 on Ambient Air Quality and Cleaner Air for Europe. Official Journal of the European Union. 2008. Available online: https://eur-lex.europa.eu/legal-content/EN/TXT/HTML/?uri=CELEX:32008L0050 (accessed on 8 August 2025).
  9. Tosun, J. The European Union’s Climate and Environmental Policy in Times of Geopolitical Crisis. J. Common Mark. Stud. 2023, 61, 147–156. [Google Scholar] [CrossRef]
  10. Bąk, I.; Barwińska-Małajowicz, A.; Wolska, G.; Walawender, P.; Hydzik, P. Is the European Union Making Progress on Energy Decarbonisation While Moving towards Sustainable Development? Energies 2021, 14, 3792. [Google Scholar] [CrossRef]
  11. Souza, A.d.; Oliveira-Júnior, J.F.d.; Cardoso, K.R.A.; Fernandes, W.A.; Pavao, H.G. The Impact of Meteorological Variables on Particulate Matter Concentrations. Atmosphere 2025, 16, 875. [Google Scholar] [CrossRef]
  12. Ziernicka-Wojtaszek, A.; Zuśka, Z.; Kopcińska, J. Assessment of the Effect of Meteorological Conditions on the Concentration of Suspended PM2.5 Particulate Matter in Central Europe. Sustainability 2024, 16, 4797. [Google Scholar] [CrossRef]
  13. Rincon, G.; Morantes, G.; Roa-López, H.; Castro, M.; Ochoa, A. Spatio-temporal statistical analysis of PM1 and PM2.5 concentrations and their key influencing factors at Guayaquil city, Ecuador. Stoch. Environ. Res. Risk Assess. 2023, 37, 1093–1117. [Google Scholar] [CrossRef]
  14. Tian, Y.; Zhang, L.; Wang, Y.; Song, J.; Sun, H. Temporal and Spatial Trends in Particulate Matter and the Responses to Meteorological Conditions and Environmental Management in Xi’an, China. Atmosphere 2021, 12, 1112. [Google Scholar] [CrossRef]
  15. Czernecki, B.; Półrolniczak, M.; Kolendowicz, L.; Marosz, M.; Kendzierski, S.; Pilguj, N. Influence of the atmospheric conditions on PM10 concentrations in Poznań, Poland. J. Atmos. Chem. 2017, 74, 115–139. [Google Scholar] [CrossRef]
  16. Beloconi, A.; Vounatsou, P. Substantial Reduction in Particulate Matter Air Pollution across Europe during 2006-2019: A Spatiotemporal Modeling Analysis. Environ. Sci. Technol. 2021, 55, 15505–15518. [Google Scholar] [CrossRef] [PubMed]
  17. Iriti, M.; Piscitelli, P.; Missoni, E.; Miani, A. Air Pollution and Health: The Need for a Medical Reading of Environmental Monitoring Data. Int. J. Environ. Res. Public Health 2020, 17, 2174. [Google Scholar] [CrossRef]
  18. Zhu, T.; Wan, W.; Liu, J.; Xue, T.; Gong, J.; Zhang, S. Insights into the New WHO Global Air Quality Guidelines. Kexue Tongbao 2022, 67, 697–706. [Google Scholar] [CrossRef]
  19. EN 303-5:2012; Heating Boilers—Part 5: Heating Boilers for Solid Fuels, Manually and Auto-Matically Stocked, Nominal Heat Output of up to 500 kW—Terminology, Requirements, Testing and Marking. Polish Committee for Standardization: Warsaw, Poland, 2012.
  20. Ecodesign Directive (EU) 2015/1189; Implementing Directive 2009/125/EC of the European Parliament and of the Council with Regard to Ecodesign Requirements for Solid Fuel Boilers. Commision Regulation (EU): Brussels, Belgium, 2015.
  21. Five Things We Learned from the World’s Biggest Air Pollution Database. Available online: https://unearthed.greenpeace.org/2018/05/02/air-pollution-cities-worst-global-data-world-health-organisation/ (accessed on 1 August 2025).
  22. Urząd Miasta i Gminy w Pleszewie. Ekspertyza—Źródła Ciepła na Terenie Miasta Pleszew. 2020. Available online: https://smart.pleszew.pl/wp-content/uploads/2023/01/Ekspertyza-inwentaryzacja-budynk%C3%B3w-i-lokali.pdf (accessed on 1 August 2025).
  23. Statistics Poland—Local Data Bank. Available online: https://bdl.stat.gov.pl (accessed on 6 August 2025).
  24. Ciupek, B. Laboratorium Spalania Paliw Kopalnych i Biomasy; Wyadawnictwo Politechniki Poznańskiej: Poznan, Poland, 2022; ISBN 978-83-7775-666-9. (In Polish) [Google Scholar]
  25. Ciupek, B. Kotły Grzewcze na Paliwa Stałe. Wybrane Aspekty Budowy i Eksploatacji; Wydawnictwo Politechniki Poznańskiej: Poznan, Poland, 2023; ISBN 978-83-7775-721-5. (In Polish) [Google Scholar]
  26. Ciupek, B.; Frąckowiak, A. Review of Thermal Calculation Methods for Boilers—Perspectives on Thermal Optimization for Improving Ecological Parameters. Energies 2024, 17, 6380. [Google Scholar] [CrossRef]
  27. Ciupek, B.; Urbaniak, R. Optimization of the Retort Burner Construction to Reduce Emission of Harmful Substances (Optymalizacja konstrukcji palnika retortowego w aspekcie obniżenia emisji substancji szkodliwych). Ciepłownictwo Ogrzew. Went. 2018, 49, 519–524. [Google Scholar] [CrossRef]
  28. Kubica, K. Uwarunkowania Czystego Spalania Paliw Stałych w Domowych Instalacjach Produkcji Energii Cieplnej; Instytut Techniki Cieplnej Politechniki Śląskiej: Gliwice, Poland, 2010. [Google Scholar]
  29. Hehlmann, J.; Kuberka, M. Biblioteka Dobrych Praktyk. konstrukcje Kotłów C.O. EiiP: Ostrów Wielkopolski, Poland, 2007. [Google Scholar]
  30. Plantower Sensor PMS7003. Available online: https://www.plantower.com/en/products_33/74.html (accessed on 23 June 2025).
  31. Bosch Sensortec. BME280 Combined Humidity and Pressure Sensor. Available online: https://www.bosch-sensortec.com/products/environmental-sensors/humidity-sensors-bme280/ (accessed on 23 June 2025).
  32. Zawistowski, J. Co to są Kotły Zasypowe? Available online: https://www.ogrzewnictwo.pl/artykuly/urzadzenia-grzewcze/kotly-c-o/kotly-na-paliwa-stale/co-to-sa-kotly-zasypowe-dr-inz-jacek-zawistowski (accessed on 23 June 2025).
  33. Persson, T.; Rönnbäck, M.; Mattsson, J.E.; Danielsson, B.-O.; Ryde, D. Chunkwood fuel feeding and combustion experiments in small-scale boilers to provide design suggestions for chunkwood friendly boiler construction. Sustain. Energy Technol. Assess. 2024, 71, 103986. [Google Scholar] [CrossRef]
  34. Adam, R.; Zeng, T.; Röver, L.; Schneider, P.; Werner, H.; Birnbaum, T.; Lenz, V. Long-term emission demonstration using pretreated urban non-woody biomass residues as fuel for small scale boilers. Renew. Energy 2024, 237, 121815. [Google Scholar] [CrossRef]
  35. Ciupek, B. Emission of nitrogen oxides (NOx) from a heating boiler fuelled by woody and non-woody biomass pellets supplied with an aqueous solution of urea. Biomass Bioenergy 2025, 202, 108202. [Google Scholar] [CrossRef]
  36. Sekyere, C.K.K.; Opoku, R.; Asaaga, B.; Baah, B.; Andoh, P.Y.; Obeng, G.Y.; Agbogla, J. Techno-environmental assessment of the fuel properties of a variety of briquettes for biomass boiler applications. Clean. Energy Syst. 2025, 10, 100185. [Google Scholar] [CrossRef]
  37. Szatyłowicz, E.; Walendziuk, W. Analysis of Polycyclic Aromatic Hydrocarbon Content in Ash from Solid Fuel Combustion in Low-Power Boilers. Energies 2021, 14, 6801. [Google Scholar] [CrossRef]
  38. Zając, G.; Gładysz, J.; Szyszlak-Bargłowicz, J. Effect of Changes in Mains Voltage on the Operation of the Low-Power Pellet Boiler. Energies 2025, 18, 498. [Google Scholar] [CrossRef]
  39. Dula, M.; Kraszkiewicz, A.; Parafiniuk, S. Combustion Efficiency of Various Forms of Solid Biofuels in Terms of Changes in the Method of Fuel Feeding into the Combustion Chamber. Energies 2024, 17, 2853. [Google Scholar] [CrossRef]
  40. Kurkus-Gruszecka, M.; Krawczyk, P.; Lewandowski, J. Numerical Analysis on the Flue Gas Temperature Maintenance System of a Solid Fuel-Fired Boiler Operating at Minimum Loads. Energies 2021, 14, 4420. [Google Scholar] [CrossRef]
  41. Abdillah, S.F.I.; Yang, T.-W.; You, S.-J.; Wang, Y.-F. Assessing trade-off between carbon and flue gas emissions in power plants: Influences of air pollution control devices, fuel types, and combustion reactors. J. Environ. Chem. Eng. 2025, 13, 115707. [Google Scholar] [CrossRef]
  42. Czaplicka, M.; Klyta, J.; Komosiński, B.; Konieczny, T.; Janoszka, K. Comparison of Carbonaceous Compounds Emission from the Co-Combustion of Coal and Waste in Boilers Used in Residential Heating in Poland, Central Europe. Energies 2021, 14, 5326. [Google Scholar] [CrossRef]
  43. Bartoszewicz, J.; Urbaniak, R. Analiza wpływu konfiguracji ustawień sterowania na pracę kotła małej mocy. Ciepłownictwo Ogrzew. Went. 2010, 7–8, 241–246. [Google Scholar]
  44. Gołoś, K.; Ciupek, B.; Judt, W.; Urbaniak, R. Impact of replacement of solid fuel heating boilers on air quality in Poland in 2000–2020. Przemysł Chem. 2021, 5, 486–489. [Google Scholar] [CrossRef]
  45. McCulloch, C.E.; Searle, S.R. Generalized, Linear, and Mixed Models; Wiley: New York, NY, USA, 2001; pp. 156–178. [Google Scholar]
  46. Rao, C.R.; Toutenburg, H. Linear Models, 2nd ed.; Springer: New York, NY, USA, 1999; pp. 23–121. [Google Scholar]
  47. R Core Team. R: A Language and Environment for Statistical Computing; R Foundation for Statistical Computing: Vienna, Austria, 2021; Available online: https://www.R-project.org/ (accessed on 1 November 2021).
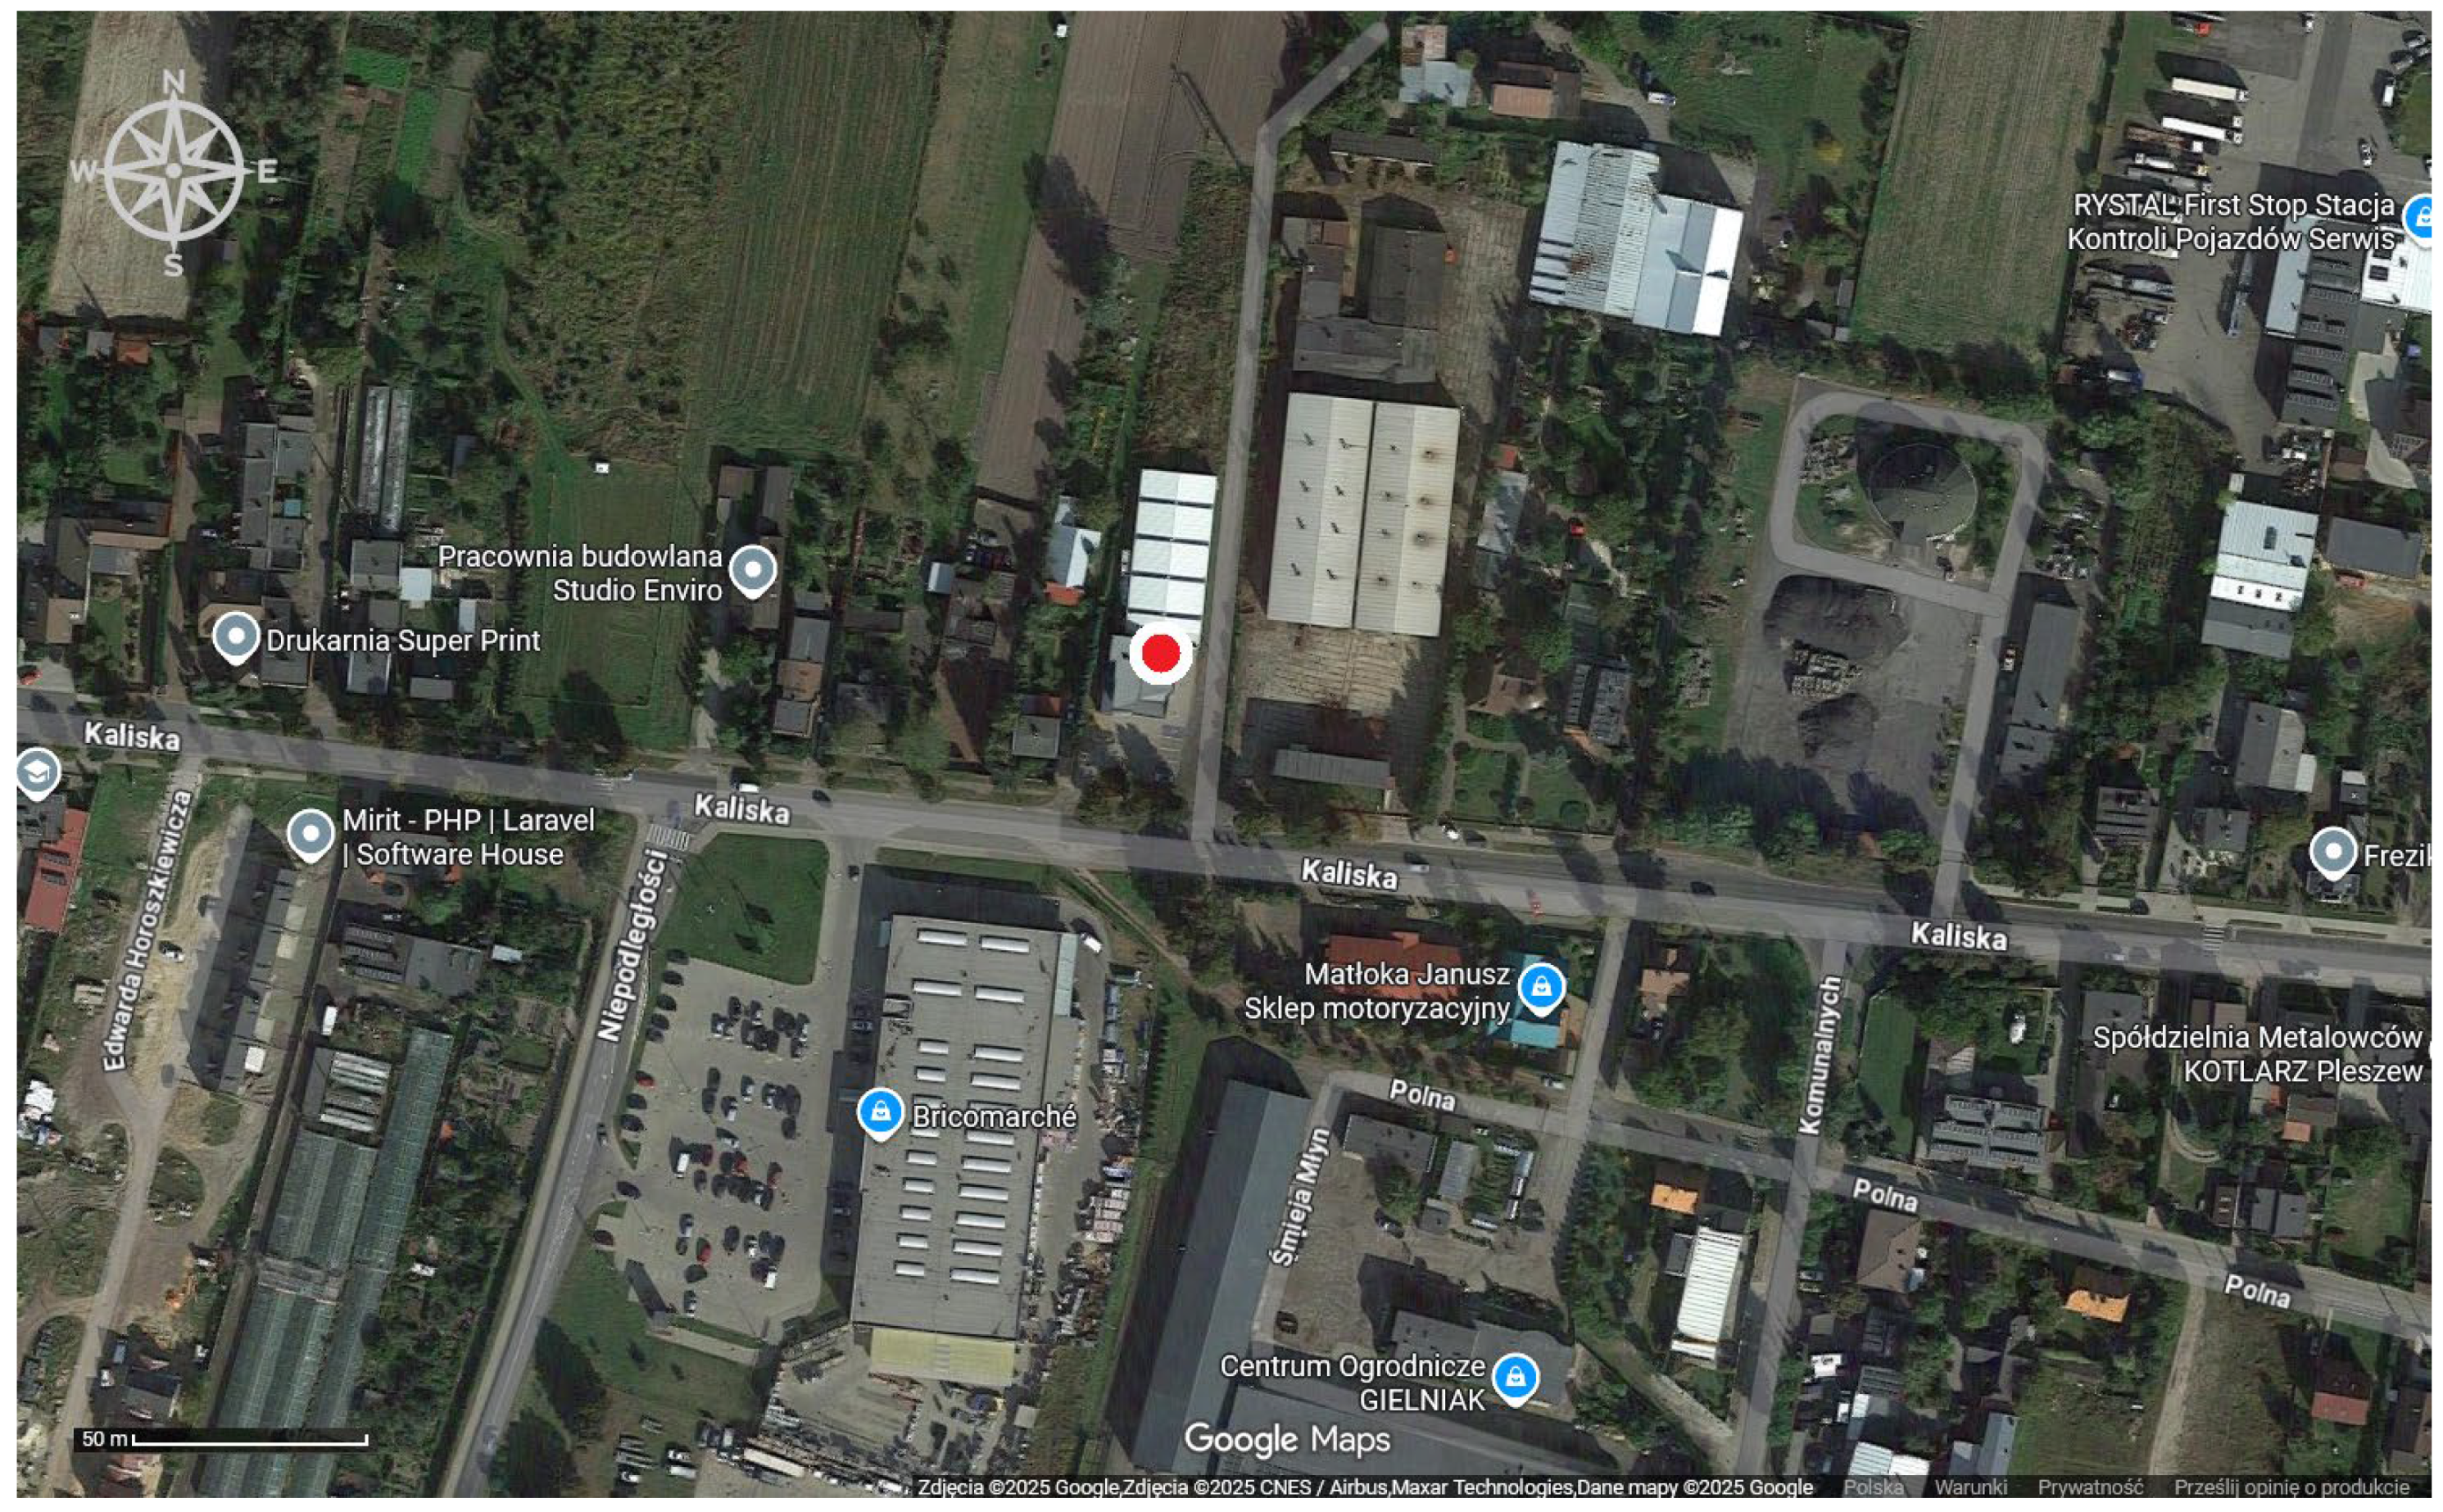
Figure 1. Location of the measuring station [source: Google Maps].
Energies 18 05428 g001
Figure 2. Hand-fired grate boiler [32].
Energies 18 05428 g002
Figure 3. Average monthly PM10 concentrations in 2022–2024.
Energies 18 05428 g003
Figure 4. Average monthly PM10 concentrations and temperatures in 2022.
Energies 18 05428 g004
Figure 5. Average monthly PM10 concentrations and temperatures in 2023.
Energies 18 05428 g005
Figure 6. Average monthly PM10 concentrations and temperatures in 2024.
Energies 18 05428 g006
Figure 7. Average hourly PM10 concentrations and temperatures on 15 November 2022.
Energies 18 05428 g007
Figure 8. Average hourly PM10 concentrations and temperatures on 15 March 2023.
Energies 18 05428 g008
Figure 9. Average hourly PM10 concentrations and temperatures on 23 October 2023.
Energies 18 05428 g009
Figure 10. Average hourly PM10 concentrations and temperatures on 14 April 2024.
Energies 18 05428 g010
Figure 11. Average hourly PM10 concentrations and temperatures on 19 November 2022.
Energies 18 05428 g011
Figure 12. Average hourly PM10 concentrations and temperatures on 10 February 2024.
Energies 18 05428 g012
Figure 13. Average hourly PM10 concentrations and temperatures on 12 November 2024.
Energies 18 05428 g013
Figure 14. Linear regression: Dependence of PM10 level on temperature in December in 2022–2024. The horizontal red dashed line marks the daily standard PM10 = 50 µg/m3 permitted by EU regulations.
Energies 18 05428 g014
Figure 15. Regression Models (2) of the PM10 level on temperature, estimated based on data from 2022–2024, taking into account the effect of year: October, November, December, January, February, and March. The horizontal red dashed line marks the daily standard PM10 = 50 µg/m3 permitted by EU regulations. The asterisk (*) represents the multiplication symbol.
Energies 18 05428 g015
Figure 16. Regression Models (3) of PM10 levels on temperature, estimated based on data from 2022–2024, taking into account the year effect. Months are April, May, June, July, August, and September. The horizontal red dashed line marks the daily standard PM10 = 50 µg/m3 permitted by EU regulations. The asterisk (*) represents the multiplication symbol.
Energies 18 05428 g016
Figure 17. Average PM10 values in intervals for selected days, 13–17 November 2022.
Energies 18 05428 g017
Figure 18. Violin plots of PM10 concentration during time intervals for two example SCP days.
Energies 18 05428 g018
Figure 19. Violin charts of PM10 concentration during time intervals for two example days: a WEEKEND day and a CHR day.
Energies 18 05428 g019
Table 1. Average monthly PM10 concentration levels in µg/m3 for the administrative area of Pleszew (Poland).
Month202220232024
January40.2434.8439.81
February23.3441.4829.46
March54.3034.4438.02
April25.6429.5817.23
May12.9816.1213.62
June12.5114.6513.05
July7.978.449.80
August11.5910.6113.21
September15.0117.3119.88
October27.3122.3929.61
November44.2932.2636.16
December43.4742.0229.41
Annual average: 26.6125.2324.09
Table 2. Correlation coefficients (effect of temperature on PM10). Data from 2022–2024.
Month:JanFebMarAprMayJunJulAugSepOctNovDec
r−0.54−0.34−0.210.010.070.370.580.720.17−0.05−0.45−0.62
Table 3. Predicted PM10 concentration values for five selected temperatures.
December
Temperature [°C]PM10 [µg/m3]
−1096.9123
−574.7538
052.5953
530.4368
108.2783
Table 4. p values for analysis of variance (comparisons of average PM10 contents) of three time intervals (ANOVA) for five sample days in November 2022.
Dayp Value of ANOVA
13 November 2022<0.001 ***
14 November 2022<0.001 ***
15 November 2022<0.001 ***
16 November 2022<0.001 ***
17 November 2022<0.001 ***
*** significance at the 0.001 level.
Table 5. Tukey’s test results for homogeneous groups for five sample days in November 2022. Mean value of PM10.
DayHourIntervalMean Value of PM10Tukey Group
13 November 2022[3:00 PM–9:00 PM)Int056.55556a
[9:00 AM–3:00 PM)Int247.12500b
[9:00 PM–9:00 AM)Int144.15278b
14 November 2022[3:00 PM–9:00 PM)Int049.08333a
[9:00 PM–9:00 AM)Int148.75694a
[9:00 AM–3:00 PM)Int238.09722b
15 November 2022[3:00 PM–9:00 PM)Int070.59722a
[9:00 AM–3:00 PM)Int258.29167b
[9:00 PM–9:00 AM)Int149.59722c
16 November 2022[9:00 PM–9:00 AM)Int126.77083a
[9:00 AM–3:00 PM)Int217.63889b
[3:00 PM–9:00 PM)Int010.79167c
17 November 2022[3:00 PM–9:00 PM)Int032.05556a
[9:00 PM–9:00 AM)Int123.50694b
[9:00 AM–3:00 PM)Int222.16667b
Groups marked with the same letters do not differ statistically significantly. Groups marked with different letters differ statistically significantly in terms of the average value of PM10. Groups a and b differ statistically significantly, groups b and c differ statistically significantly, groups a and c differ statistically significantly.
Table 6. Tukey’s test results for homogeneous groups for three sample days in 2023. Mean value of PM10.
DayHourIntervalMean Value of PM10Tukey Group
15 March 2023[3:00 PM–9:00 PM)Int057.38889a
[9:00 PM–9:00 AM)Int132.04167b
[9:00 AM–3:00 PM)Int210.61111c
23 October 2023[3:00 PM–9:00 PM)Int040.86111a
[9:00 PM–9:00 AM)Int127.13889b
[9:00 AM–3:00 PM)Int217.5000c
1 December 2023[3:00 PM–9:00 PM)Int0240.7222a
[9:00 PM–9:00 AM)Int2186.3611b
[9:00 AM–3:00 PM)Int1153.9028c
Groups marked with the same letters do not differ statistically significantly. Groups marked with different letters differ statistically significantly in terms of the average value of PM10. Groups a and b differ statistically significantly, groups b and c differ statistically significantly, groups a and c differ statistically significantly.
Table 7. Tukey’s test results for homogeneous groups for days with different heat reception (SCP, WEEKEND, CHR).
DayHourIntervalMean Value of PM10Tukey Group
SCP
(Tuesday)
15 November 2022[3:00 PM–9:00 PM)Int070.59722a
[9:00 AM–3:00 PM)Int258.29167b
[9:00 PM–9:00 AM)Int149.59722c
SCP
(Wednesday)
15 March 2023[3:00 PM–9:00 PM)Int057.38889a
[9:00 PM–9:00 AM)Int132.04167b
[9:00 AM–3:00 PM)Int210.61111c
SCP
(Monday)
23 October 2023[3:00 PM–9:00 PM)Int040.86111a
[9:00 PM–9:00 AM)Int127.13889b
[9:00 AM–3:00 PM)Int217.5000c
SCP
(Monday)
14 April 2024[3:00 PM–9:00 PM)Int021.861111a
[9:00 PM–9:00 AM)Int110.722222b
[9:00 AM–3:00 PM)Int25.111111b
WEEKEND
(Saturday)
19 November 2022[9:00 PM–9:00 AM)Int139.22222a
[3:00 PM–9:00 PM)Int030.31944b
[9:00 AM–3:00 PM)Int228.500b
WEEKEND
(Saturday)
10 February 2024[9:00 PM–9:00 AM)Int158.47222a
[3:00 PM–9:00 PM)Int053.58333b
[9:00 AM–3:00 PM)Int246.33333c
CHR
(Tuesday)
12 November 2024[9:00 AM–3:00 PM)Int255.36111a
[9:00 PM–9:00 AM)Int152.90278ab
[3:00 PM–9:00 PM)Int051.63889b
Groups marked with different letters differ statistically significantly in terms of the average value of PM10. Groups a and b differ statistically significantly, groups b and c differ statistically significantly, groups a and c differ statistically significantly. Groups marked with the same letters do not differ statistically significantly. Groups a and ab do not differ statistically significantly (these groups are homogeneous).
Disclaimer/Publisher’s Note: The statements, opinions and data contained in all publications are solely those of the individual author(s) and contributor(s) and not of MDPI and/or the editor(s). MDPI and/or the editor(s) disclaim responsibility for any injury to people or property resulting from any ideas, methods, instructions or products referred to in the content.