Article

Numerical Study of a Solar Dryer Prototype with Microencapsulated Phase Change Materials for Rice Drying †

1
Facultad de Ingeniería Mecánica, Universidad Tecnológica de Panamá, Panama City 0819-07289, Panama
2
Facultad de Ingeniería Eléctrica, Universidad Tecnológica de Panamá, Panama City 0819-07289, Panama
3
CEMCIT AIP, Ingeniería y Tecnología, Centro de Estudios Multidisciplinarios en Ciencias, Panama City 0819-07289, Panama
*
Authors to whom correspondence should be addressed.
This article was included at the Sixteenth International Conference on Thermal Engineering: Theory and Applications, Bucharest, Romania, 18–20 June 2025.
Energies 2025, 18(20), 5427; https://doi.org/10.3390/en18205427
Submission received: 15 September 2025 / Revised: 2 October 2025 / Accepted: 10 October 2025 / Published: 15 October 2025

Abstract

This study presents a numerical investigation of a solar dryer prototype integrated with microencapsulated phase change material (MPCM) for rice drying under tropical climatic conditions. The thermal and drying behavior of the system was evaluated under the following four configurations: a baseline solar dryer, a dryer with MPCM only, a dryer with an auxiliary heater, and a combined system using both MPCM and auxiliary heating. The prototype was also tested with rice layers of 25 mm and 45 mm to assess the influence of layer thickness on drying performance. The results showed that the use of MPCM reduced temperature fluctuations from about Δ T 70 °C in the baseline case to stabilized values near 33–34 °C (MPCM only) and 35–38 °C (MPCM + heater), contributing to a more stable thermal environment. In thinner layers (25 mm), MPCM helped prevent localized overheating, while in thicker layers (45 mm), it promoted more uniform moisture reduction. However, the overall improvement in drying performance was marginal, as efficiency remained strongly dependent on heater support. The study points out the need for improved integration of PCM within dryer design. Enhanced thermal contact and strategic preheating of MPCM could improve heat discharge during non-solar periods. Future work will focus on experimental validation, design optimization, and the development of preheating strategies to maximize the benefits of PCM-assisted solar drying systems.

1. Introduction

Solar dryers provide an energy-efficient approach to reducing moisture content in various products by utilizing solar energy. Nonetheless, the natural variability of solar radiation results in temperature instability and prolonged drying durations, particularly during periods of low irradiance [1,2]. To mitigate these challenges, phase change materials (PCMs) have been investigated for their capacity to store surplus thermal energy during peak solar input and discharge it when solar radiation declines [3,4]. PCMs absorb heat as they melt from solid to liquid at a specific temperature range. When ambient temperatures drop below this melting point, they release the stored energy and solidify. To mitigate techical drawbacks related to volume change and leakage associated with conventional PCMs, microencapsulation is used as a containment strategy [5,6].
Alternatively, hybrid systems combining PCMs with auxiliary heating sources or improved dryer geometries have demonstrated an improved performance in terms of temperature maintenance and drying uniformity [7,8]. For instance, El-Sebaii et al. showed that integrating paraffin wax as a PCM in an indirect solar dryer halved the drying time for cut Thymus leaves compared to a system without PCM, while also improving the thermal stability of the drying chamber [9]. Similarly, Kant et al. concluded that latent heat storage materials like PCMs can enhance the steady-state performance of dryers, particularly in the temperature range of 40–60 °C suitable for food and medicinal herbs [10]. To further improve drying performance and energy efficiency, ongoing research explores combinations of PCM with additional functional materials, such as silica (SiO2), and advanced modeling techniques including Computational Fluid Dynamics (CFD) to optimize dryer design and predict performance [11,12,13].
Grain drying is also one of the most energy-intensive post-harvest processes, consuming 10–15% of total energy in food industries [14]. For rice in particular, the challenge lies in balancing rapid moisture removal with the preservation of structural integrity and nutritional value. Rice drying is a critical post-harvest operation, as uncontrolled temperature and humidity can severely affect grain quality, leading to fissuring, reduced milling yield, and nutrient degradation. The thermophysical properties of rice, including its specific heat capacity and thermal conductivity, vary with moisture content and temperature, which makes precise thermal regulation indispensable during drying [15]. Other researchers have focused on optimizing drying parameters to preserve nutritional quality [16] or on modeling the complex heat and mass transfer during drying [17,18]. The layer thickness of the rice itself is a critical factor, with thinner layers promoting faster and more uniform drying [19]. Therefore, achieving a stable and uniform thermal environment is not merely an energy efficiency concern, but a fundamental requirement for preserving the economic value, nutritional content, and milling quality of rice.
Suitable drying conditions for rice have been explored extensively in experimental studies. Li et al. [16] demonstrated that a hot-air temperature of approximately 49 °C, relative humidity of 30 % , and a tempering ratio near three (3) achieved efficient drying while preserving key nutritional components such as protein, amylose, and amylopectin. Similarly, Müller et al. [20] reported that careful control of drying-air temperature within 40–60 °C improves milling yield and minimizes fissuring across rice varieties. At higher temperatures, rapid drying accelerates starch crystallinity loss, protein denaturation, and uneven moisture migration, demonstrating the importance of thermal stability during drying [16,20]. To support the design of energy-efficient and quality-preserving dryers, numerical simulations have been increasingly applied to rice drying processes. Thin-layer drying models and non-equilibrium deep-bed approaches have been used to describe coupled heat and mass transfer phenomena during drying [14,18]. Naghavi et al. [18] showed that non-equilibrium models could accurately predict air and grain temperatures, intergranular humidity, and moisture distribution in rough rice beds, offering valuable insights for dryer optimization. Such modeling tools not only reduce the need for extensive experimental trials, but also provide a framework to evaluate innovative designs, including PCM-assisted dryers. By simulating PCM integration into rice drying systems, researchers can identify appropiate PCM melting ranges, placements, and capacities that maximize thermal stability while minimizing energy use.
This work evaluates the thermal behavior of a preliminary small-scale prototype of a solar dryer operating under the following four distinct configurations: without MPCM and without a heater, without MPCM but with a heater, with MPCM and a heater, and with MPCM but without a heater, thorugh numerical simulations. The analysis denotes the impact of incorporating PCMs and/or an auxiliary heating source in enhancing thermal stability within the solar drying system. Then, a layer of rice is incorporated in the model to explore the performance of the dryer prototype with MPCM in its drying process considering the following two different layer thicknesses: 25 mm and 45 mm.

2. Materials and Methods

This study investigates the thermal and drying performance of a solar dryer enhanced with microencapsulated phase change material (MPCM). Numerical simulations were employed to evaluate the thermal behavior of the dryer under different configurations, as well as the influence of the MPCM on the drying of a rice layer. The first part of the investigation focused on the thermal performance of the solar dryer. The following two design variations were evaluated: (i) a reference case without MPCM integration and (ii) an enhanced system incorporating MPCM. In addition, the influence of an auxiliary electrical heater was considered as a third operating scenario. These configurations were simulated to quantify their effects on the internal air temperature and thermal stability within the drying chamber. The MPCM used in the study was Thermoball 35 from Insilico® (Ansan, Gyeonggi-do, South Korea), characterized by a melting temperature close to 35 °C and a latent heat of fusion of approximately 186.12 kJ/kg according to the manufacturer. Its role was to store excess thermal energy during the day and release it during low-radiation periods, thereby improving temperature regulation within the dryer. The auxiliary heater was considered as a control mechanism for ensuring the minimum drying temperature when solar radiation alone was insufficient.
After identifying the best-performing thermal configuration from the first part of the study, simulations were extended to investigate the drying performance of rice under varying product loading conditions. The rice was modeled as a porous moist layer, and the following two layer thicknesses were considered: 25 mm and 45 mm. These values represent practical ranges for thin-layer drying in small-scale applications. Numerical simulations were performed to estimate temperature and moisture distribution within the rice layer over time. The objective was to understand how layer thickness influences heat and mass transfer, and consequently, drying efficiency when using an MPCM. All simulations used the same boundary conditions derived from the best thermal case, allowing for a consistent comparison of the effects of rice layer thickness.

2.1. Mathematical Model

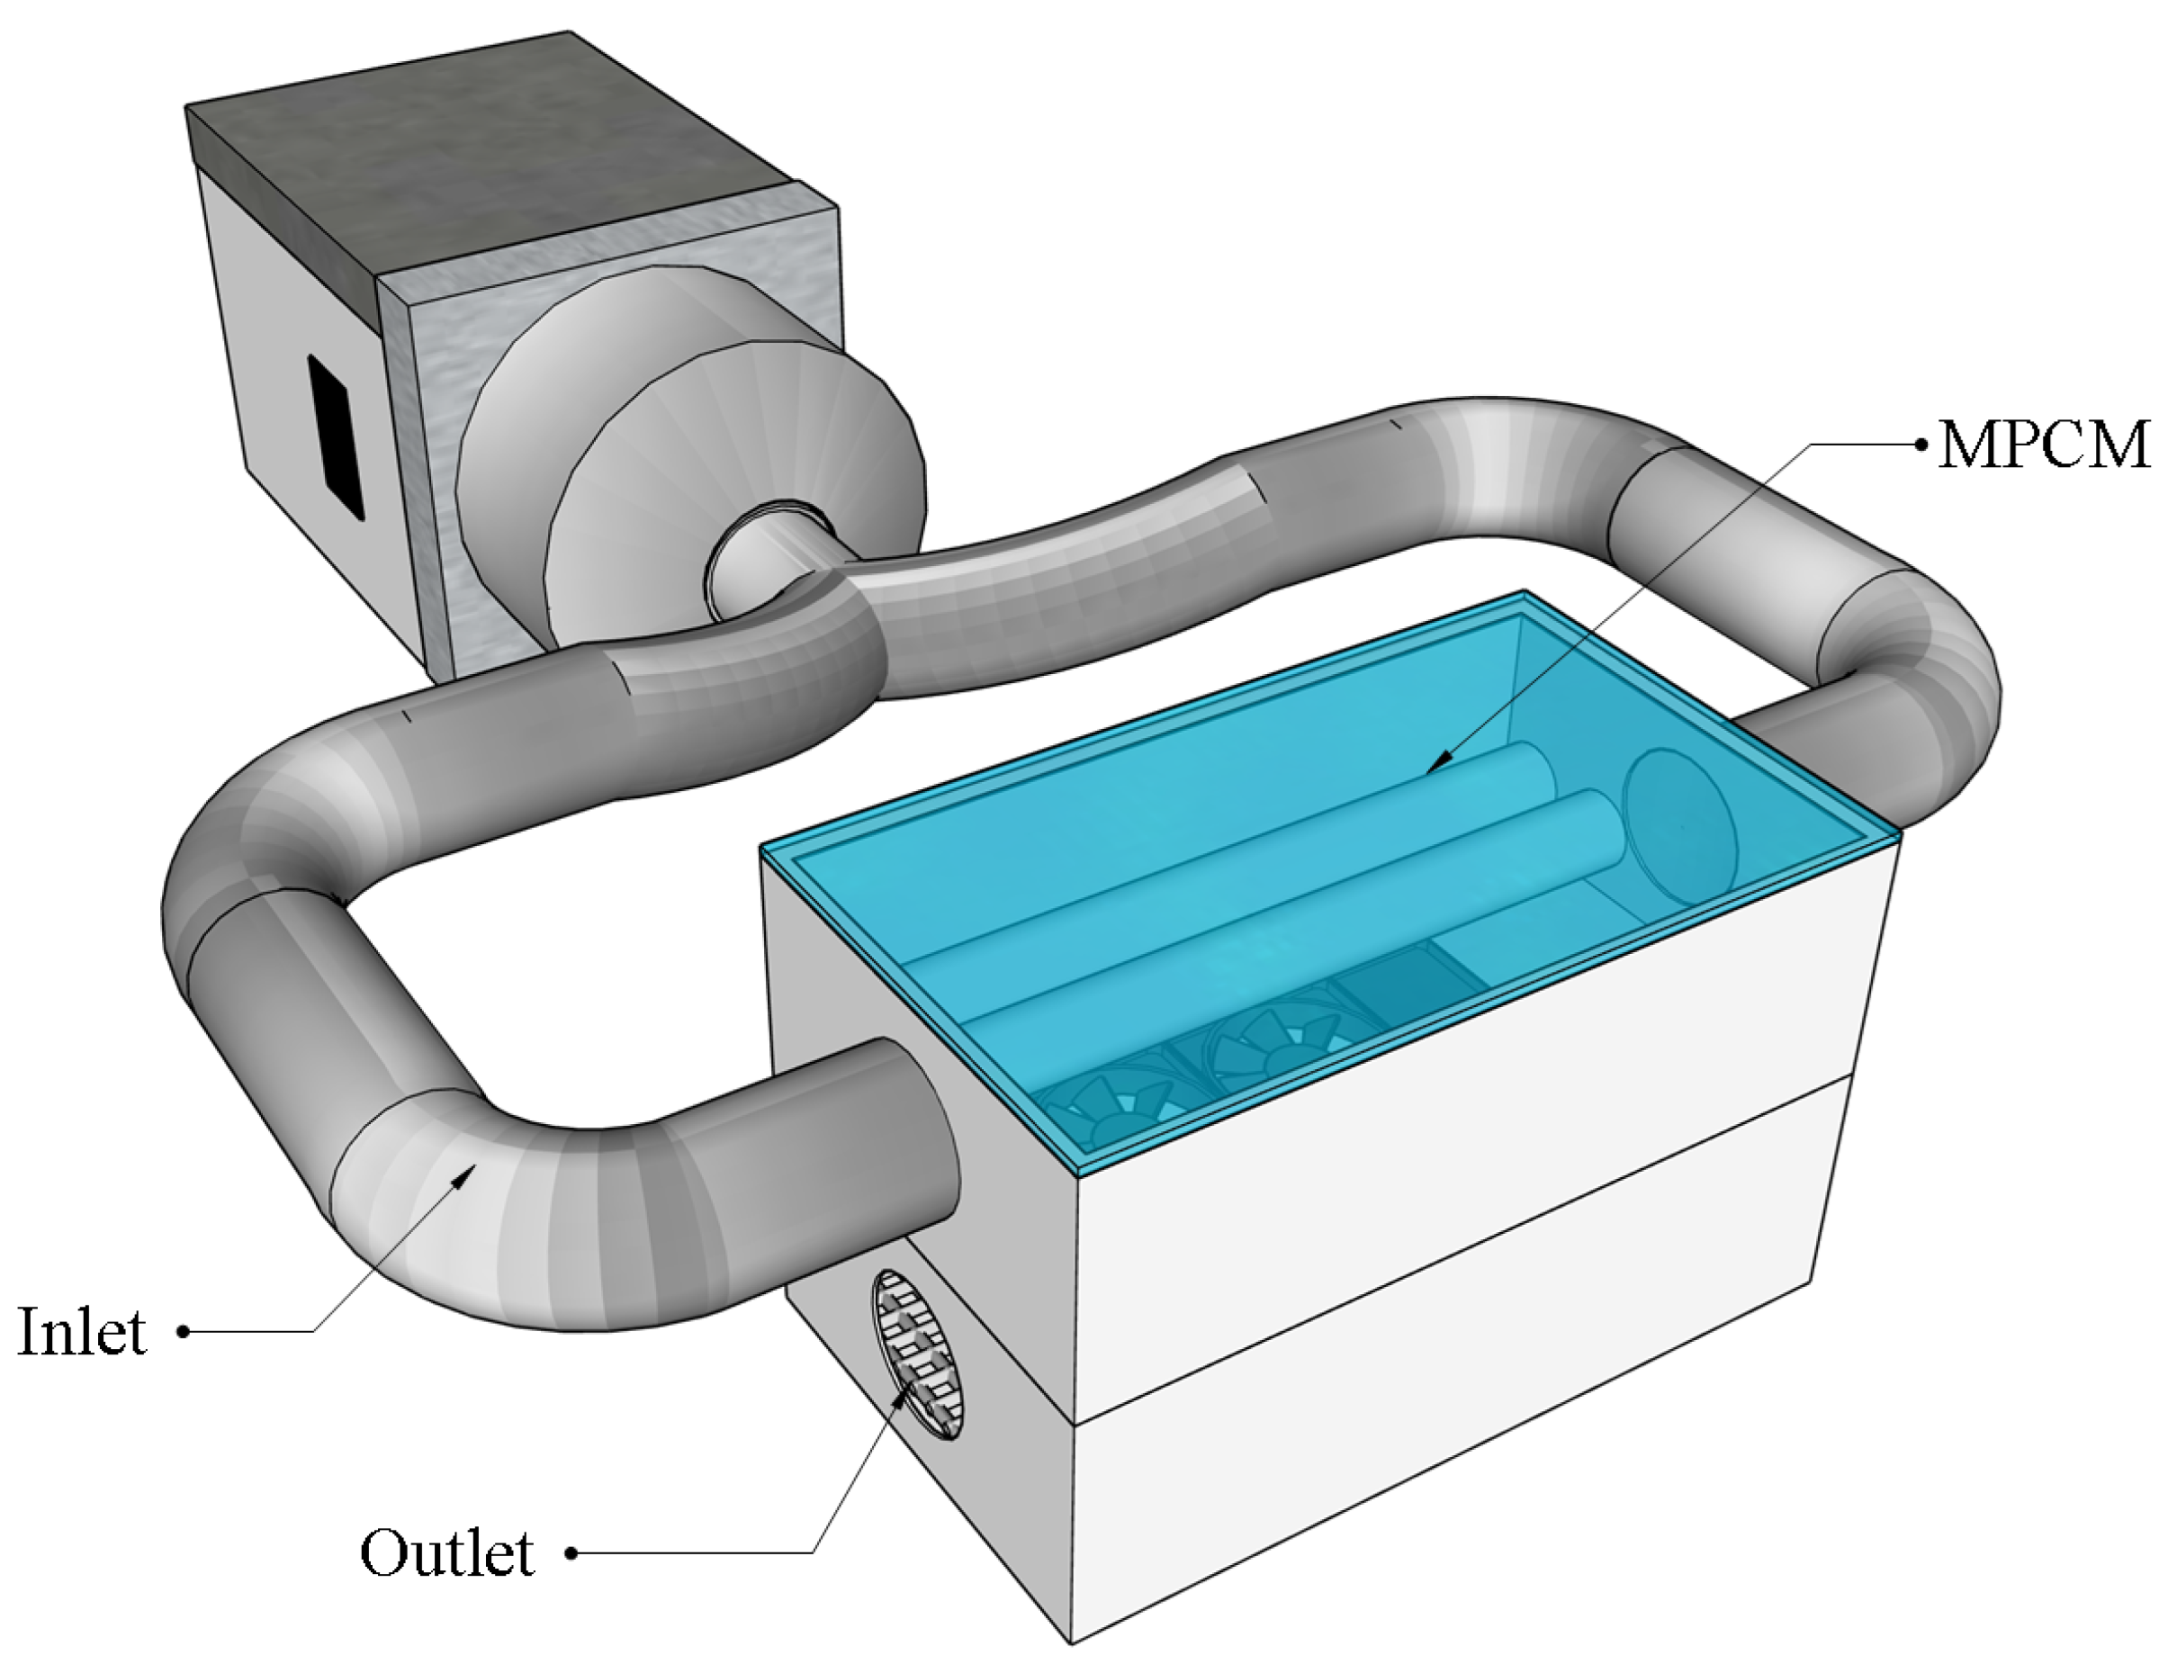
COMSOL Multiphysics (version 6.2) was employed in this study to simulate the thermal and fluid flow behavior within a solar dryer, which may include an MPCM and an auxiliary heater. In its first section, the investigation considered the following four main configurations: the solar dryer without MPCM, the solar dryer with an auxiliary heater, the solar dryer incorporating MPCM, and the solar dryer equipped with both MPCM and a heater. Figure 1 presents a schematic of the system, illustrating the dimensions of the small-scale solar dryer prototype, the placement of the MPCM tube, and the overall airflow pattern. The simulated dryer had dimensions of 0.43   m in length, 0.26   m in height, and 0.25   m in width. This schematic was based on the actual prototype shown in Figure 2, which is intended for use in future experimental validation.
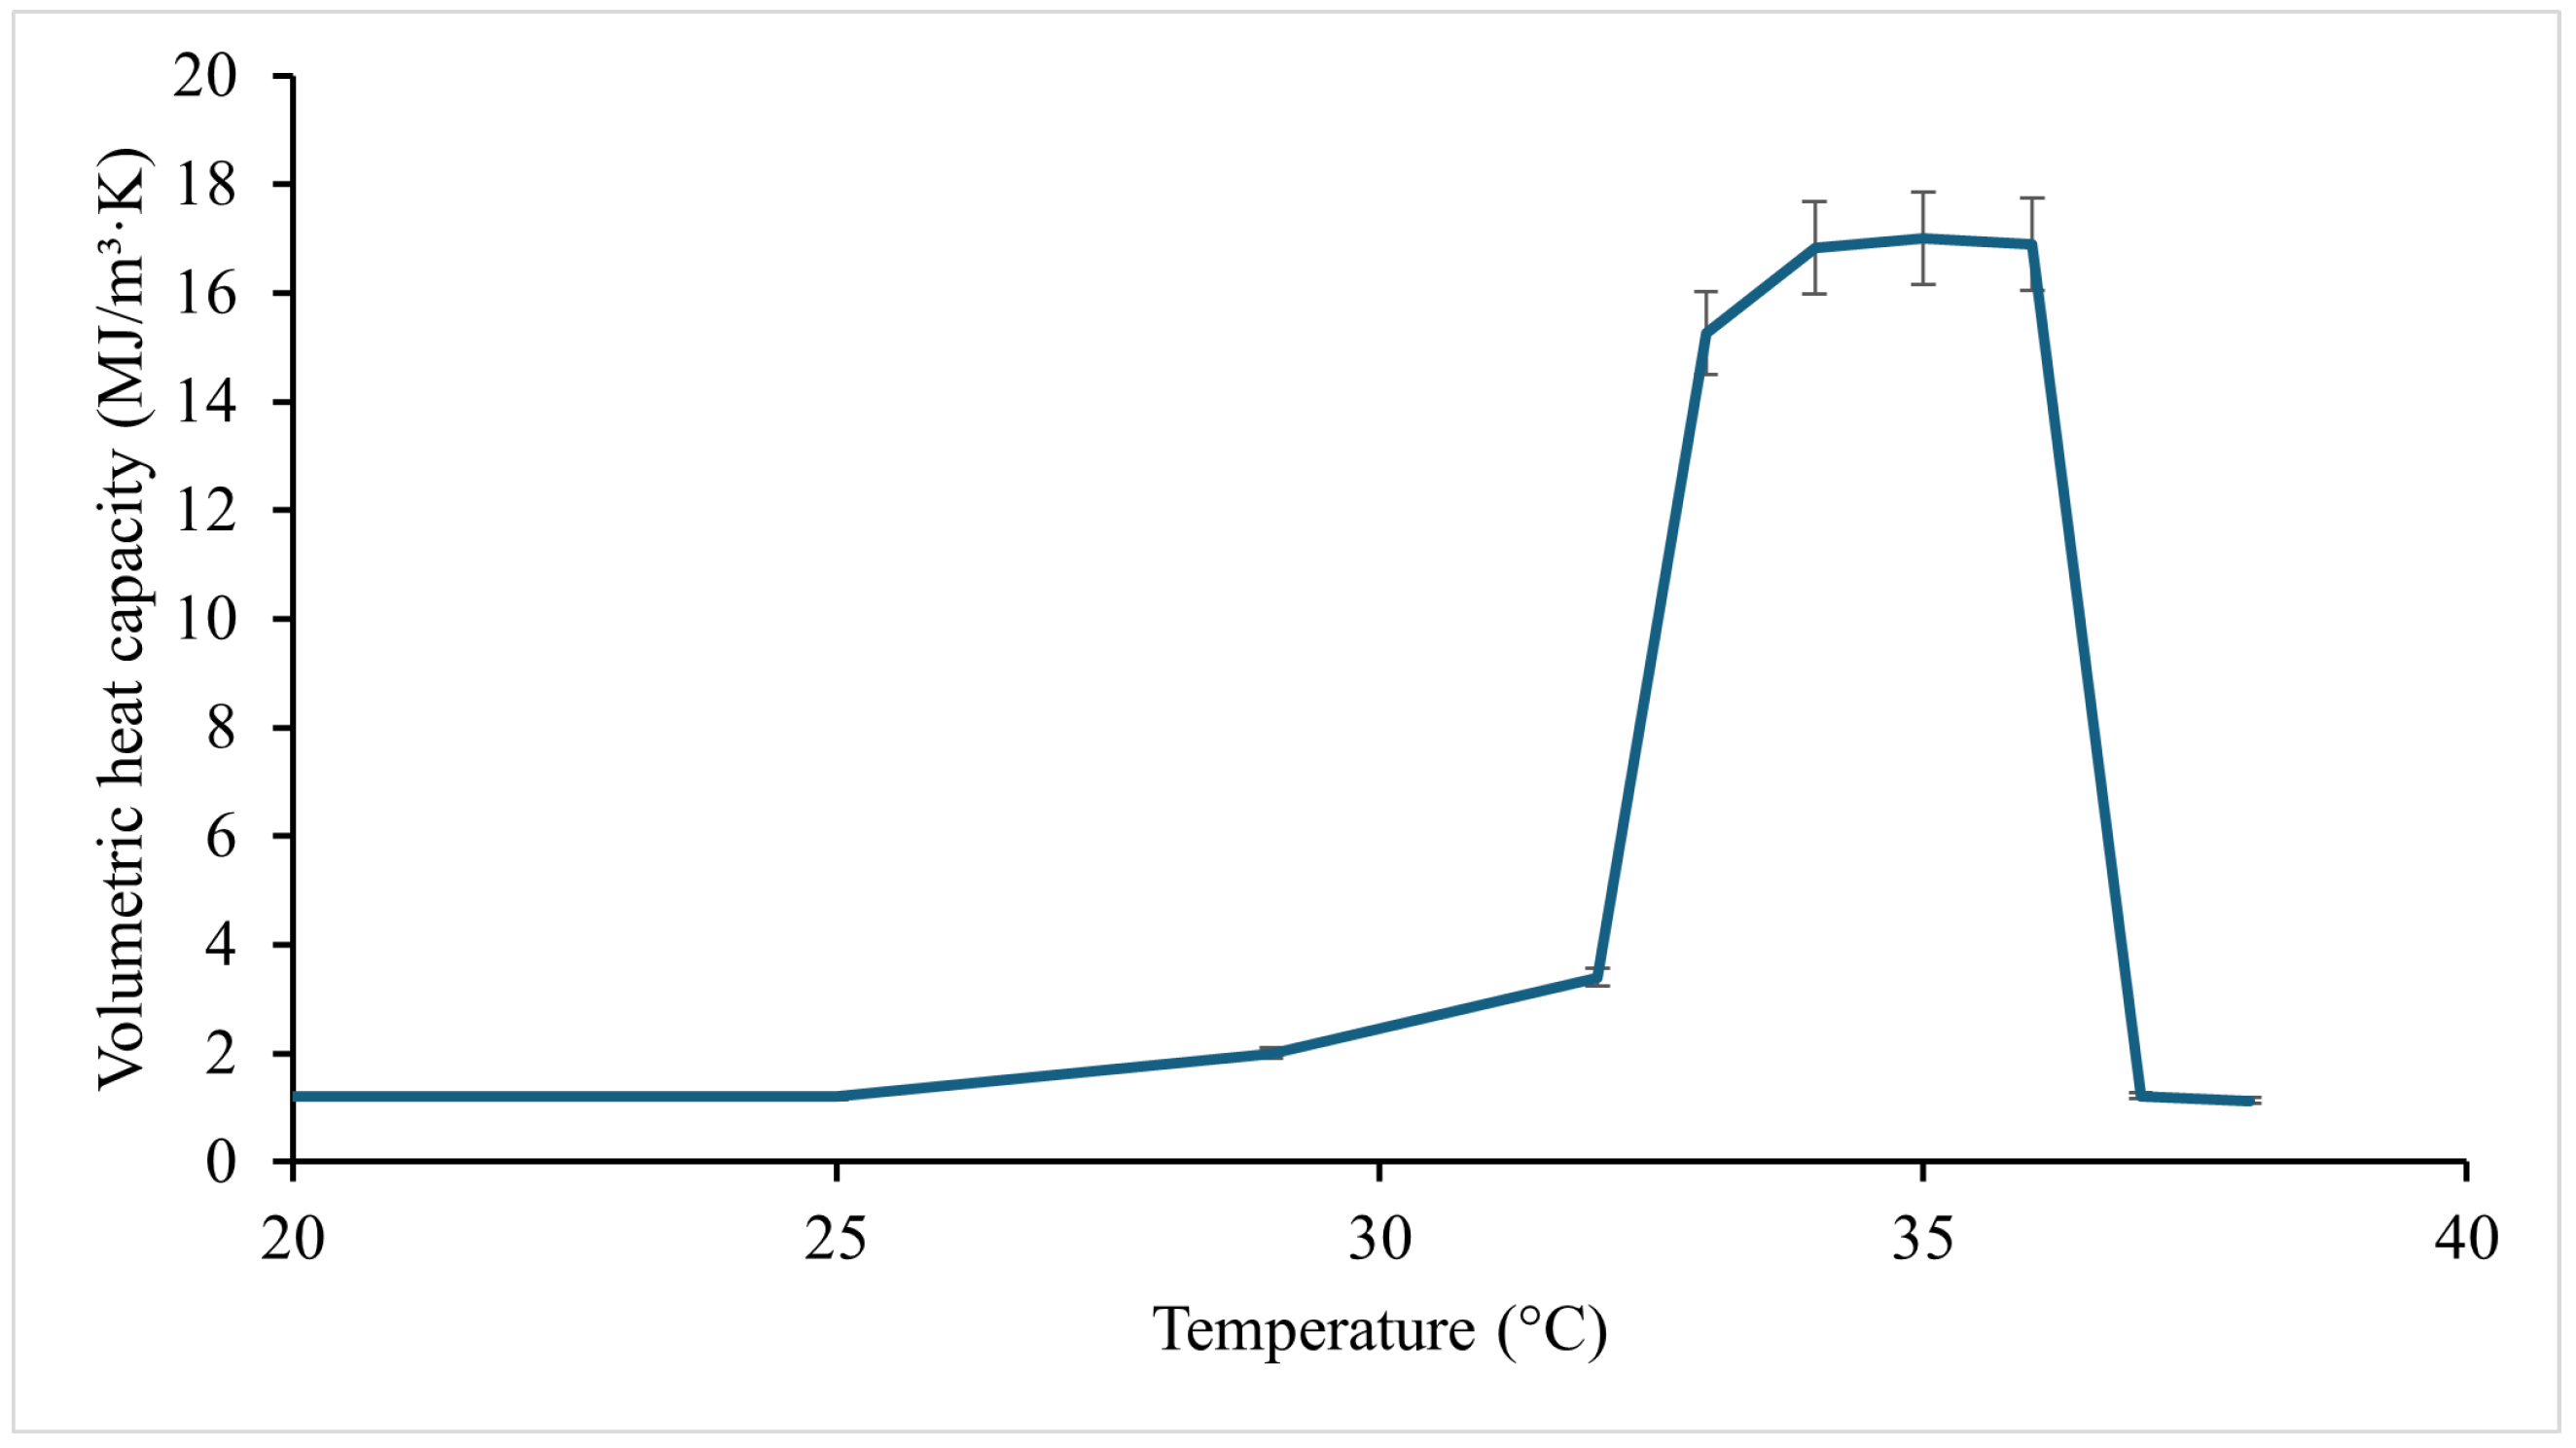
Table 1 presents the input parameters employed in the simulation. The selected MPCM was in powdered form with an average particle diameter of 15.30   μ m . Thermal characterization was conducted under controlled laboratory conditions using the Transient Plane Source (TPS) technique [21], allowing for the determination of the volumetric heat capacity of the MPCM as a function of temperature, as illustrated in Figure 3. Bulk (apparent) density measurements were repeated ten times according to the ASTM B527 standard [22,23], giving an average density of 487   ±   8.53   kg   m 3 . Given a melting point near 35 °C, density evaluations were carried out slightly below and above this temperature threshold (within a Δ T = 5   K range) to observe potential phase change effects. The results indicated minimal changes in bulk density between solid and liquid states. Specific heat capacity was then obtained by dividing the measured volumetric heat capacity by the corresponding density. Figure 3 shows the volumetric heat capacity of MPCM35 as a function of temperature obtained with the TPS method, showing an error of ± 5 % .

2.1.1. Air Flow Inside the Dryer

In the air domain, the compressible laminar flow of an ideal gas is assumed. The thermal and fluid dynamics are governed by the Navier–Stokes equations, the energy equation, and the continuity equation. Viscous dissipation and radiative heat losses are neglected, and thermal properties are considered a function of temperature. The energy equation for the air domain, incorporating pressure work, is given by the following:
ρ   c p , a T t + u i T x i = p u i x i + k 2 T x i x i + Q h ,
where ρ is the air density, c p , a is the specific heat of air, u i is the velocity component in the i-direction, p is pressure, T is temperature, k is thermal conductivity, and Q h is the internal heat source term representing the heater.
To model the momentum conservation in the air domain for compressible flow, the Navier–Stokes equations in conservative form are used, as follows:
( ρ u i ) t + ( ρ u i u j ) x j = P x i + x j μ u i x j + u j x i 2 3 μ   δ i j u k x k ,
where P is pressure, μ is dynamic viscosity, and δ i j is the Kronecker delta.
The continuity equation for compressible flow, which accounts for spatial and temporal variations in density, is defined as follows:
ρ t + ( ρ u i ) x i = 0 , i = 1 , 2
expressing the conservation of mass within the system.

2.1.2. Microencapsulated Phase Change Material

When analyzing an MPCM, the energy equation is adapted to incorporate the effects of latent heat during the melting process. For the MPCM region, the energy conservation equation becomes:
t ρ M P C M ( T ) H M P C M ( T ) = · k M P C M ( T ) T
The MPCM enthalpy can be directly computed as follows:
H M P C M ( T ) = T 0 T c p , M P C M ( T )   d T
To estimate the effective density of the MPCM, a phase-fraction weighted average is used, as follows:
ρ M P C M ( T ) = γ ( T ) ρ s + β ( T ) ρ l
Likewise, the thermal conductivity during the phase change is approximated by the following:
k M P C M ( T ) = γ ( T ) k s + β ( T ) k l
where β ( T ) and γ ( T ) are the liquid and solid fractions in the MPCM, respectively.

2.1.3. Rice Layer

The drying of the rice layer is modeled as a coupled heat and mass transfer process within a porous medium, accounting for the presence and interactions of both gas and liquid phases. The energy balance in the porous rice bed includes contributions from the air (gas phase), liquid water, and the solid matrix (rice). The equation governing temperature T is given by the following:
ρ eff c p , eff T t + ρ g c p , g u g · T + ρ l c p , l u l · T = · ( k eff T ) + Q evap ,
with effective thermal properties defined as follows:
ρ eff = ( 1 ε ) ρ s + ε ( S l ρ l + S g ρ g )
c p , eff = ( 1 ε ) c p , s + ε ( S l c p , l + S g c p , g )
k eff = ( 1 ε ) k s + ε S l w l k l + S g w g k g
where ε is the porosity of the rice bed; S l and S g are the saturations of the liquid and gas phases, respectively; ρ s , ρ l , and ρ g are the densities of the solid, liquid, and gas phases, respectively; c p , s , c p , l , and c p , g are the specific heat capacities of the solid, liquid, and gas phases, respectively; w l and w g are the mass fractions of the liquid and gas species; and k s , k l , and k g are the thermal conductivities of the solid, liquid, and gas phases, respectively.
The latent heat source term is defined as follows:
Q evap = L v G evap ,
where L v is the latent heat of vaporization and G evap is the evaporation rate.
The moisture transport is modeled using a combined convection–diffusion formulation, with distinct treatment for the gas-filled pore region and liquid transport through the solid matrix.
( ε g ρ g w v ) t + · ( ρ g u g w v ) = · ( ρ g D eff w v ) + I ˙ ,
( ε l ρ l θ l ) t + · ( ρ l u l θ l ) = I ˙ ,
where w v is the water vapor mass fraction, θ l is the volumetric liquid water content, and I ˙ is the rate of evaporation.
The effective vapor diffusivity D eff is given by an empirical function of temperature, as follows:
D eff = D 0 exp E a R T ,
where D 0 is the pre-exponential factor, E a is the activation energy for diffusion, and R is the universal gas constant.
The velocity of the liquid phase through the porous medium is modeled via Darcy’s law, as follows:
u l = κ l , eff μ l P l ,
where κ l , eff is the effective permeability, μ l is the liquid viscosity, and P l is the pressure in the liquid phase.
The equilibrium moisture content X eq of rice is a function of temperature T and relative humidity R H , fitted using a modified Chung–Pfost equation, as follows:
X eq = C 1 C 3 ln ( T + C 2 ) ln ( R H ) ,
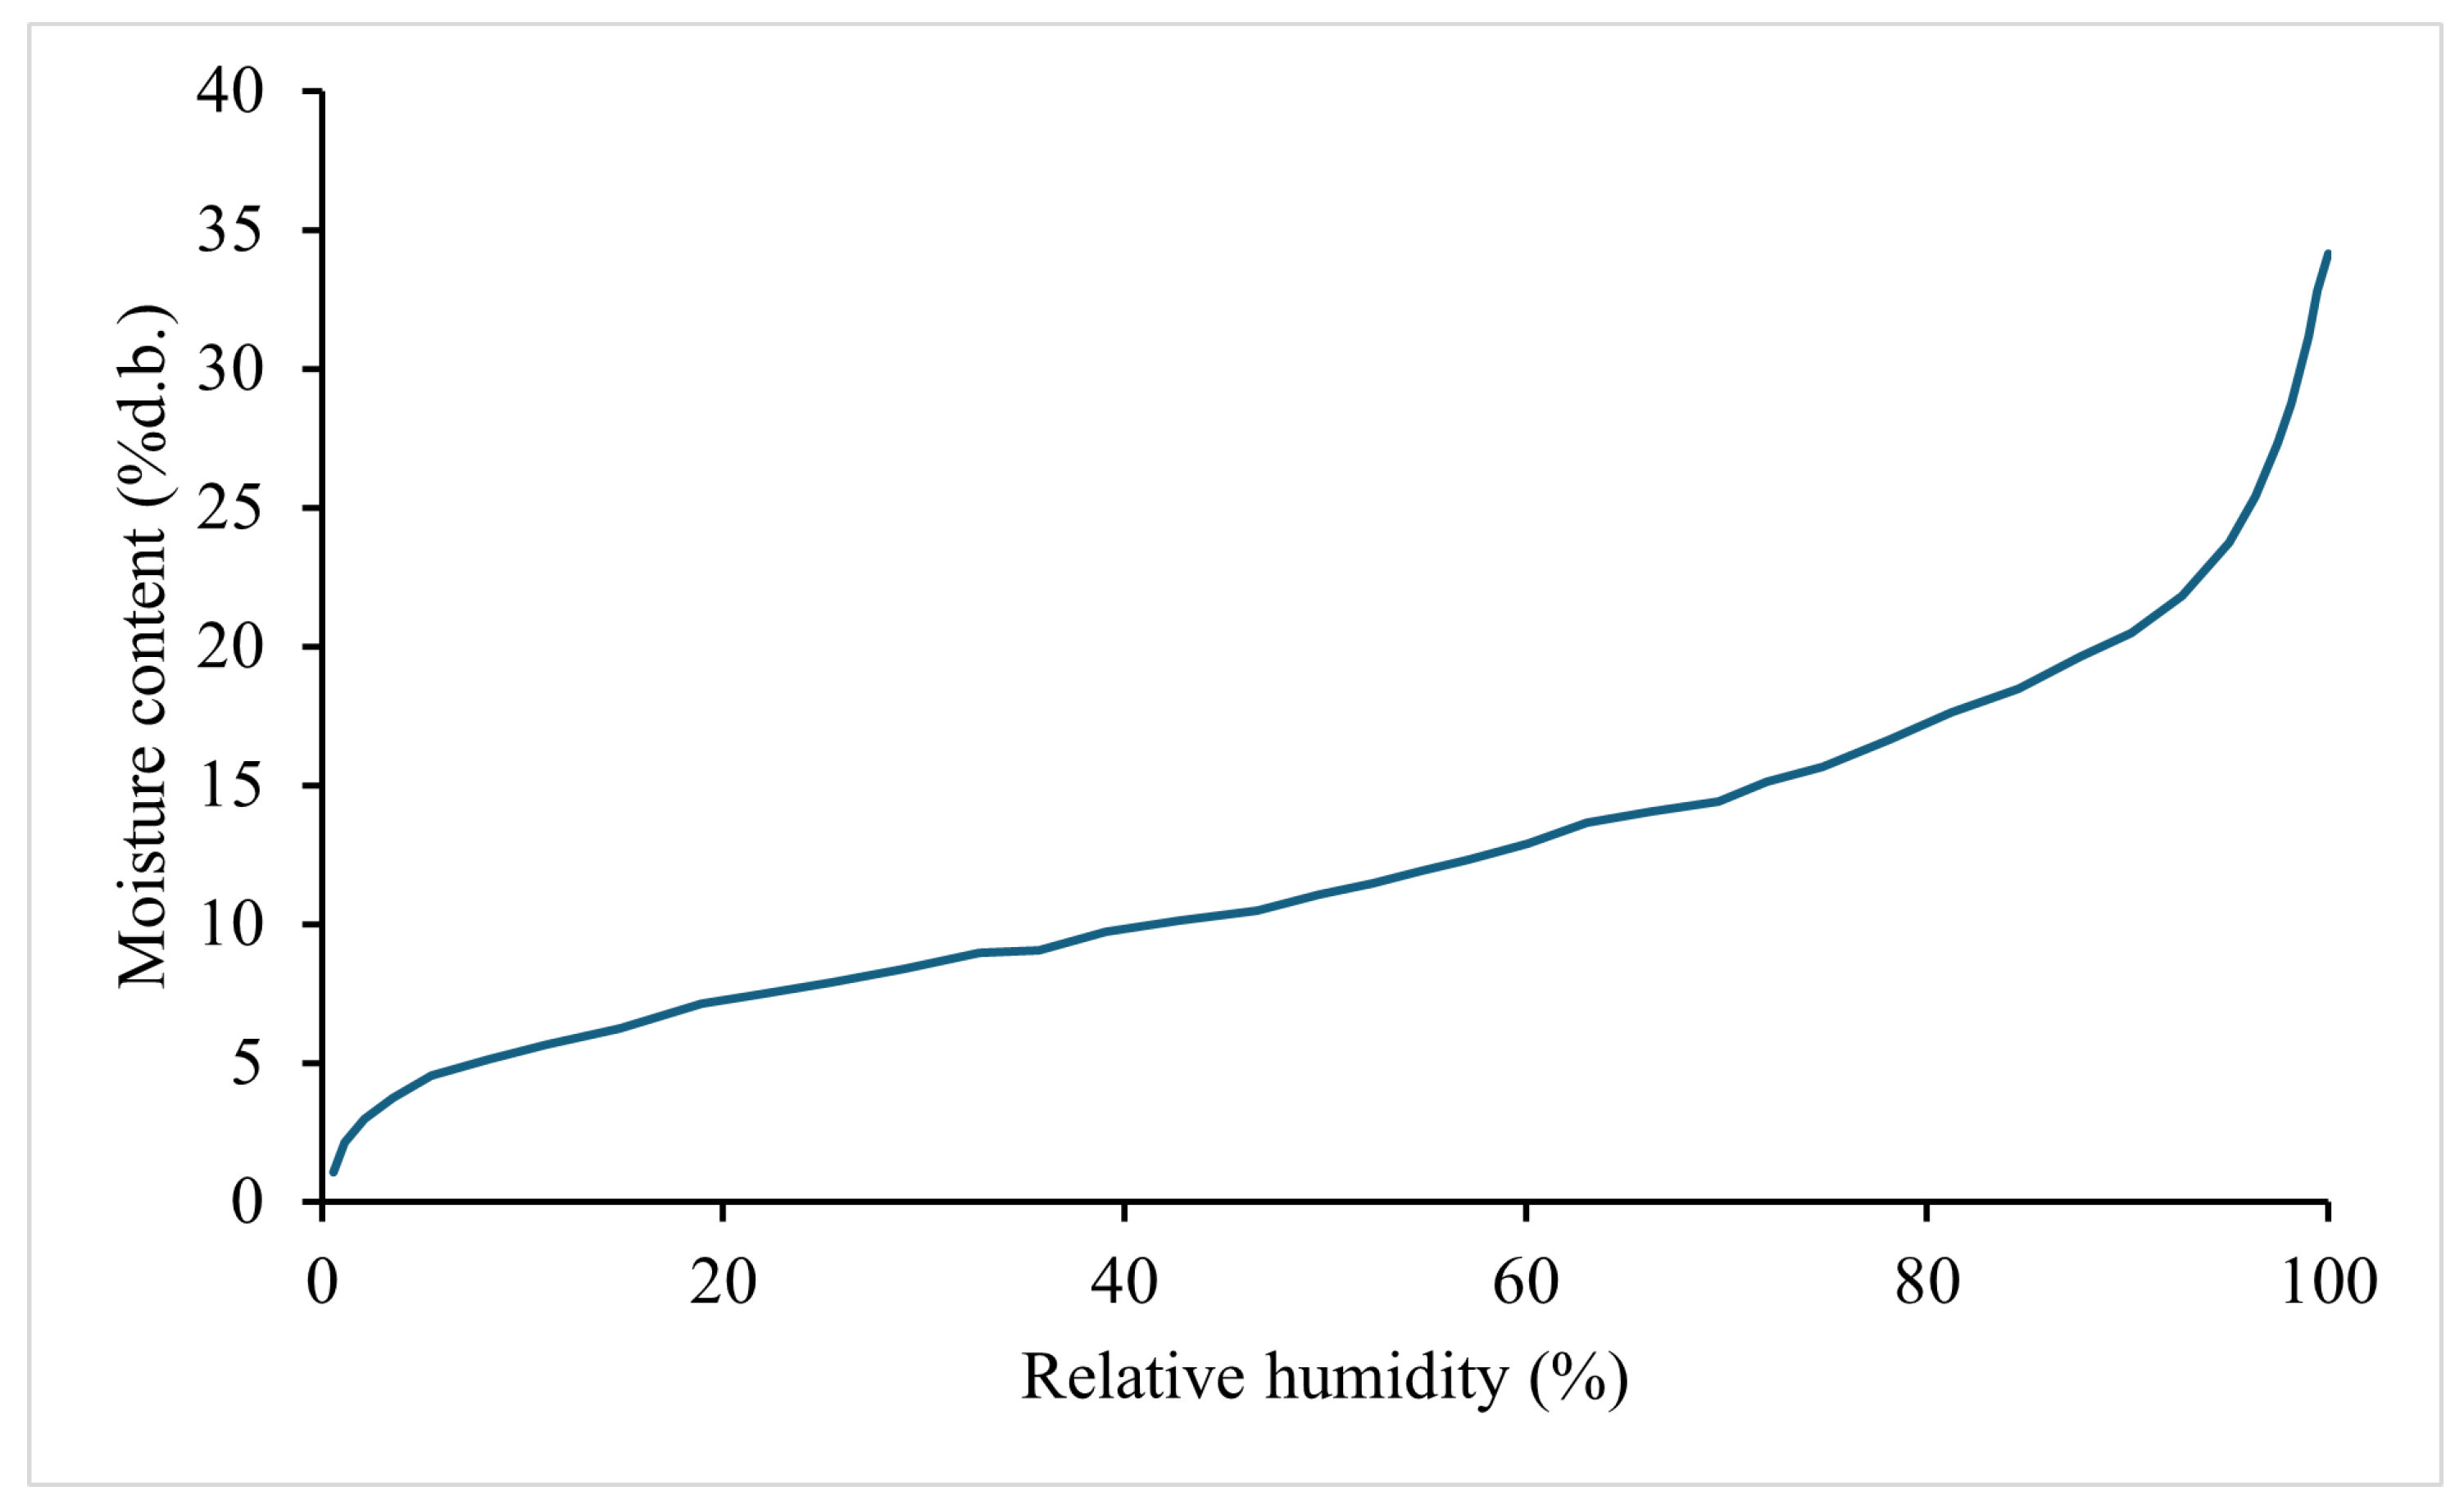
where C 1 , C 2 , and C 3 are empirical coefficients determined empirically for rough rice. Basunia et al. [24] determined the resultant sorption isotherm for rough rice, as shown in Figure 4.
The volumetric shrinkage of rice kernels during drying has been reported to be about 10–13% [25]. Prakash and Pan [26] demonstrated that the impact of shrinkage of rice drying in modeling is negligible (less than 5%). Therefore, in this study, the shrinkage effect was neglected for simplicity.

2.1.4. Boundary and Initial Conditions

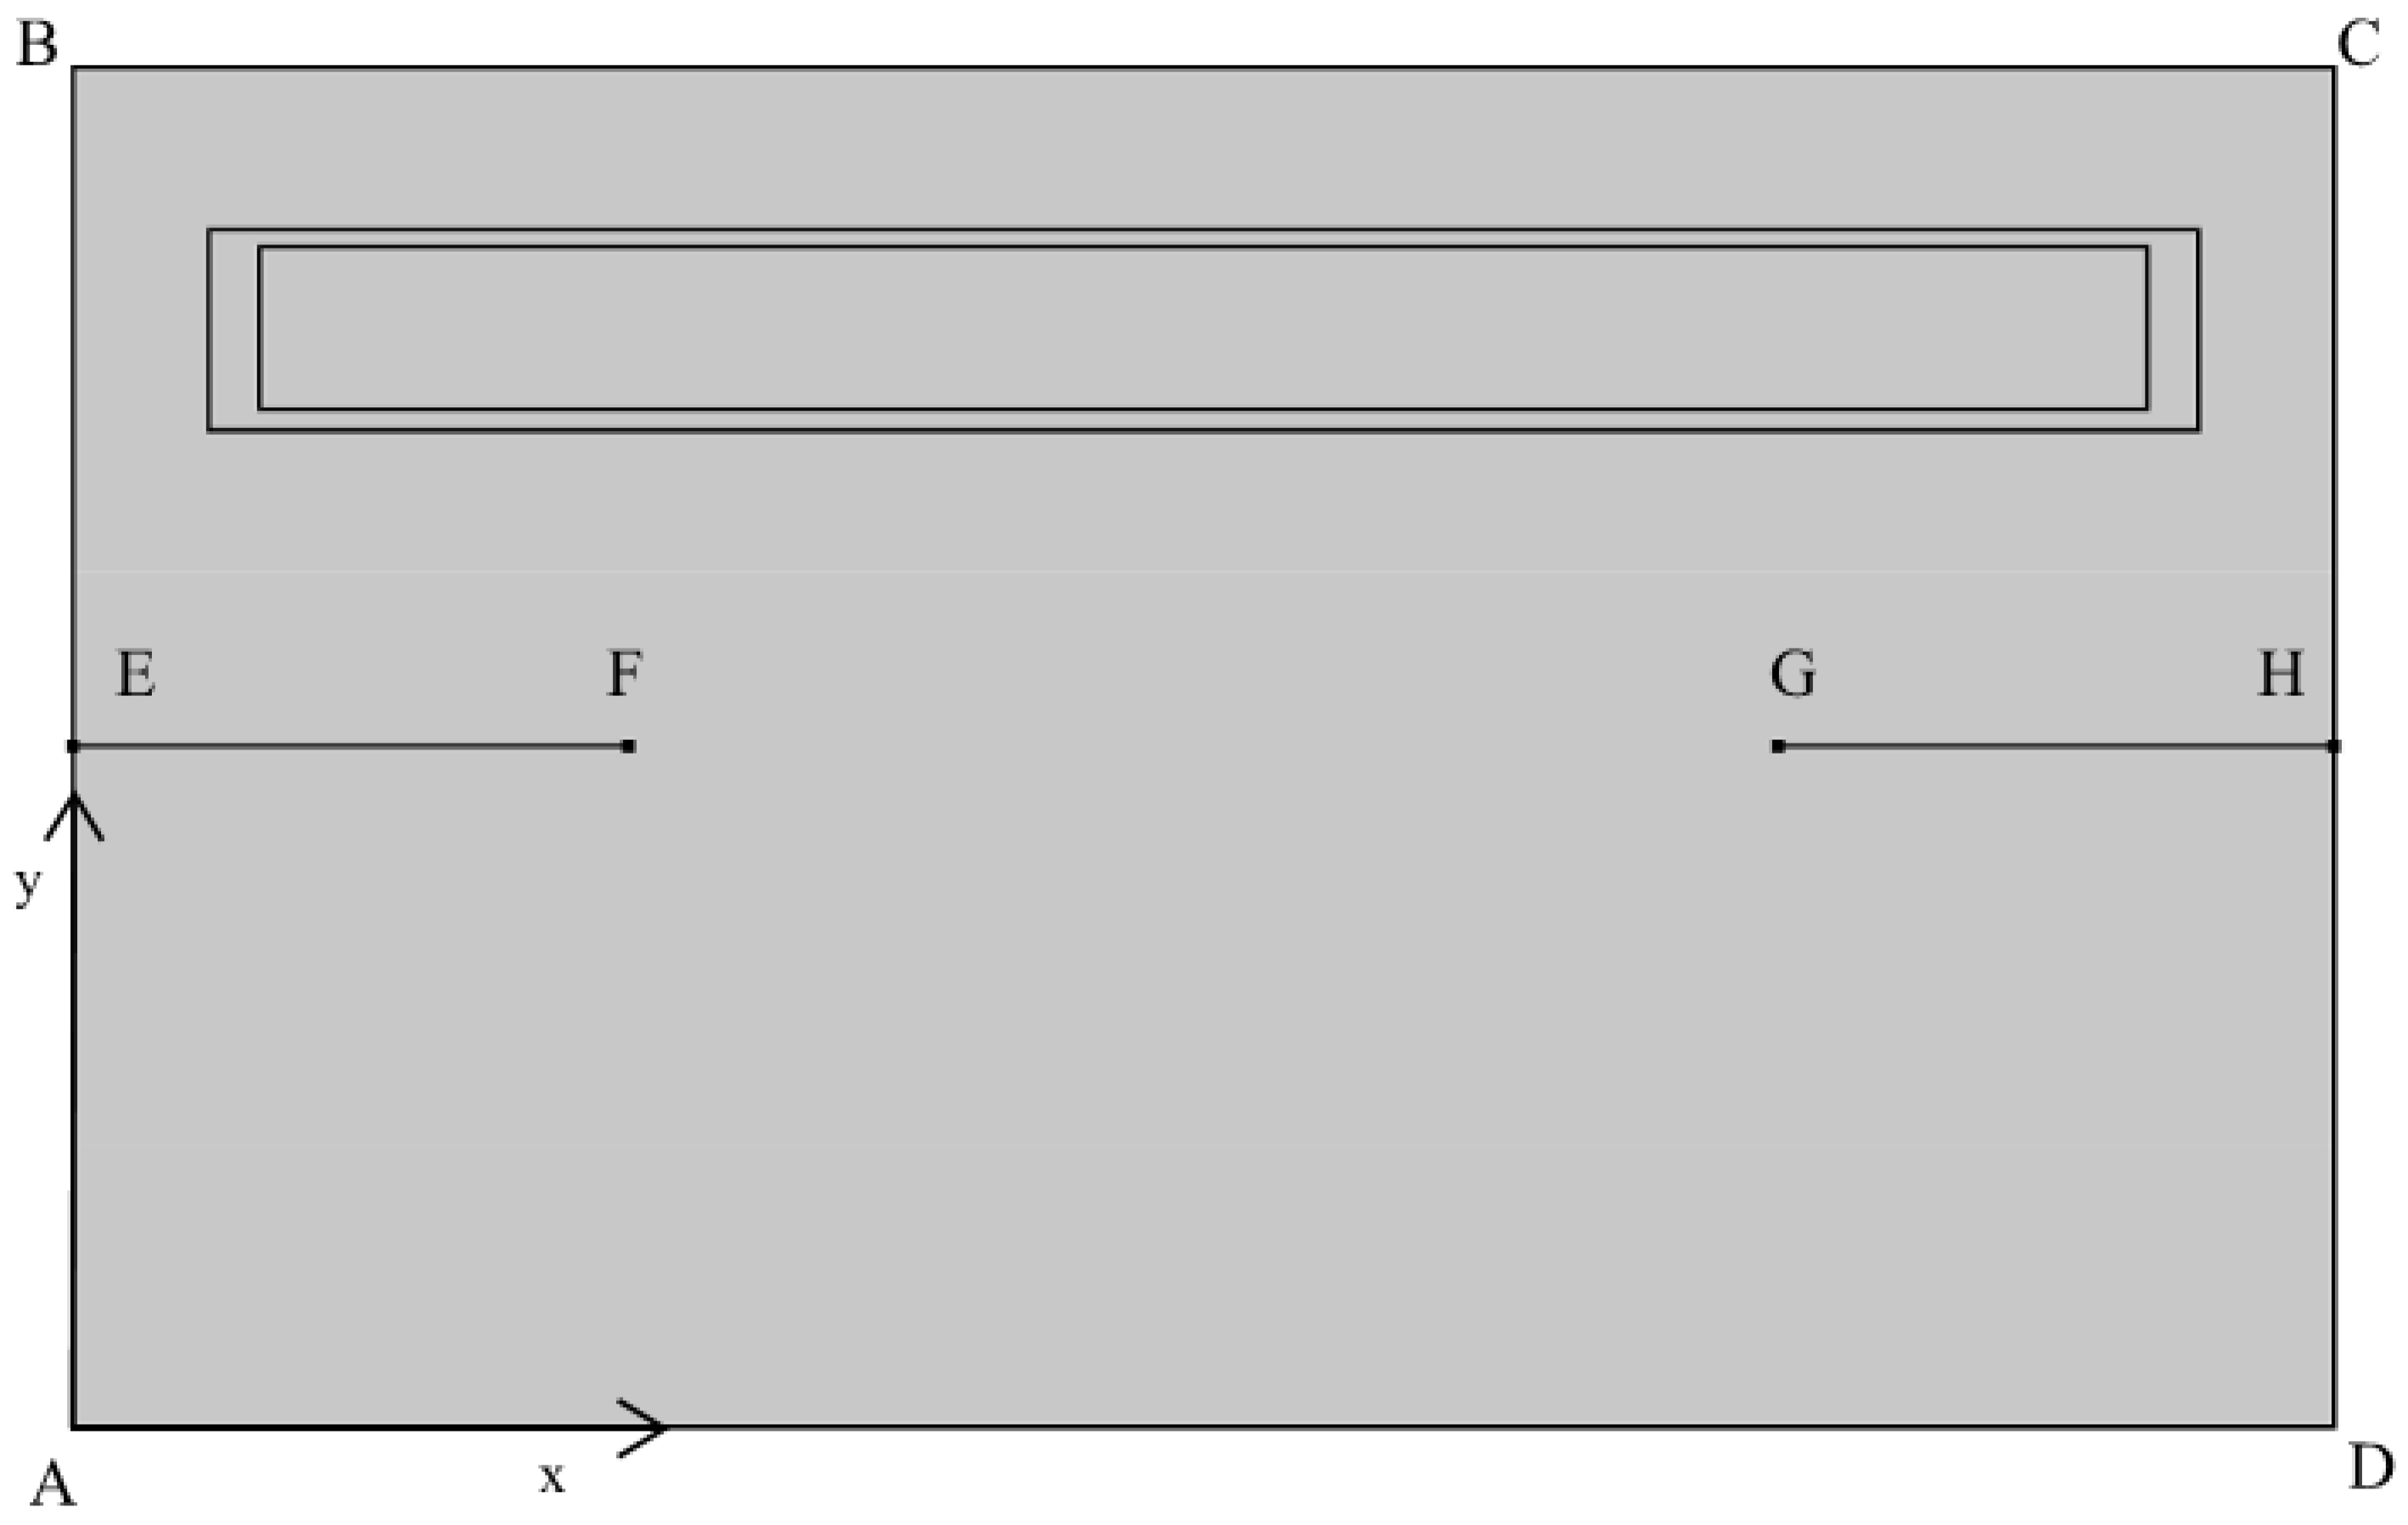
Figure 5 shows the boundary surfaces considered in this study. The initial and boundary conditions of the dryer setup are outlined in Table 2. These conditions define thermal and flow constraints at key surfaces, as well as initial system states. Even though the initial inlet air velocity is assumed to be 0 m / s , it is assumed that the air velocity increases linearly to 0.008 m / s over 30 minutes and then remains constant.
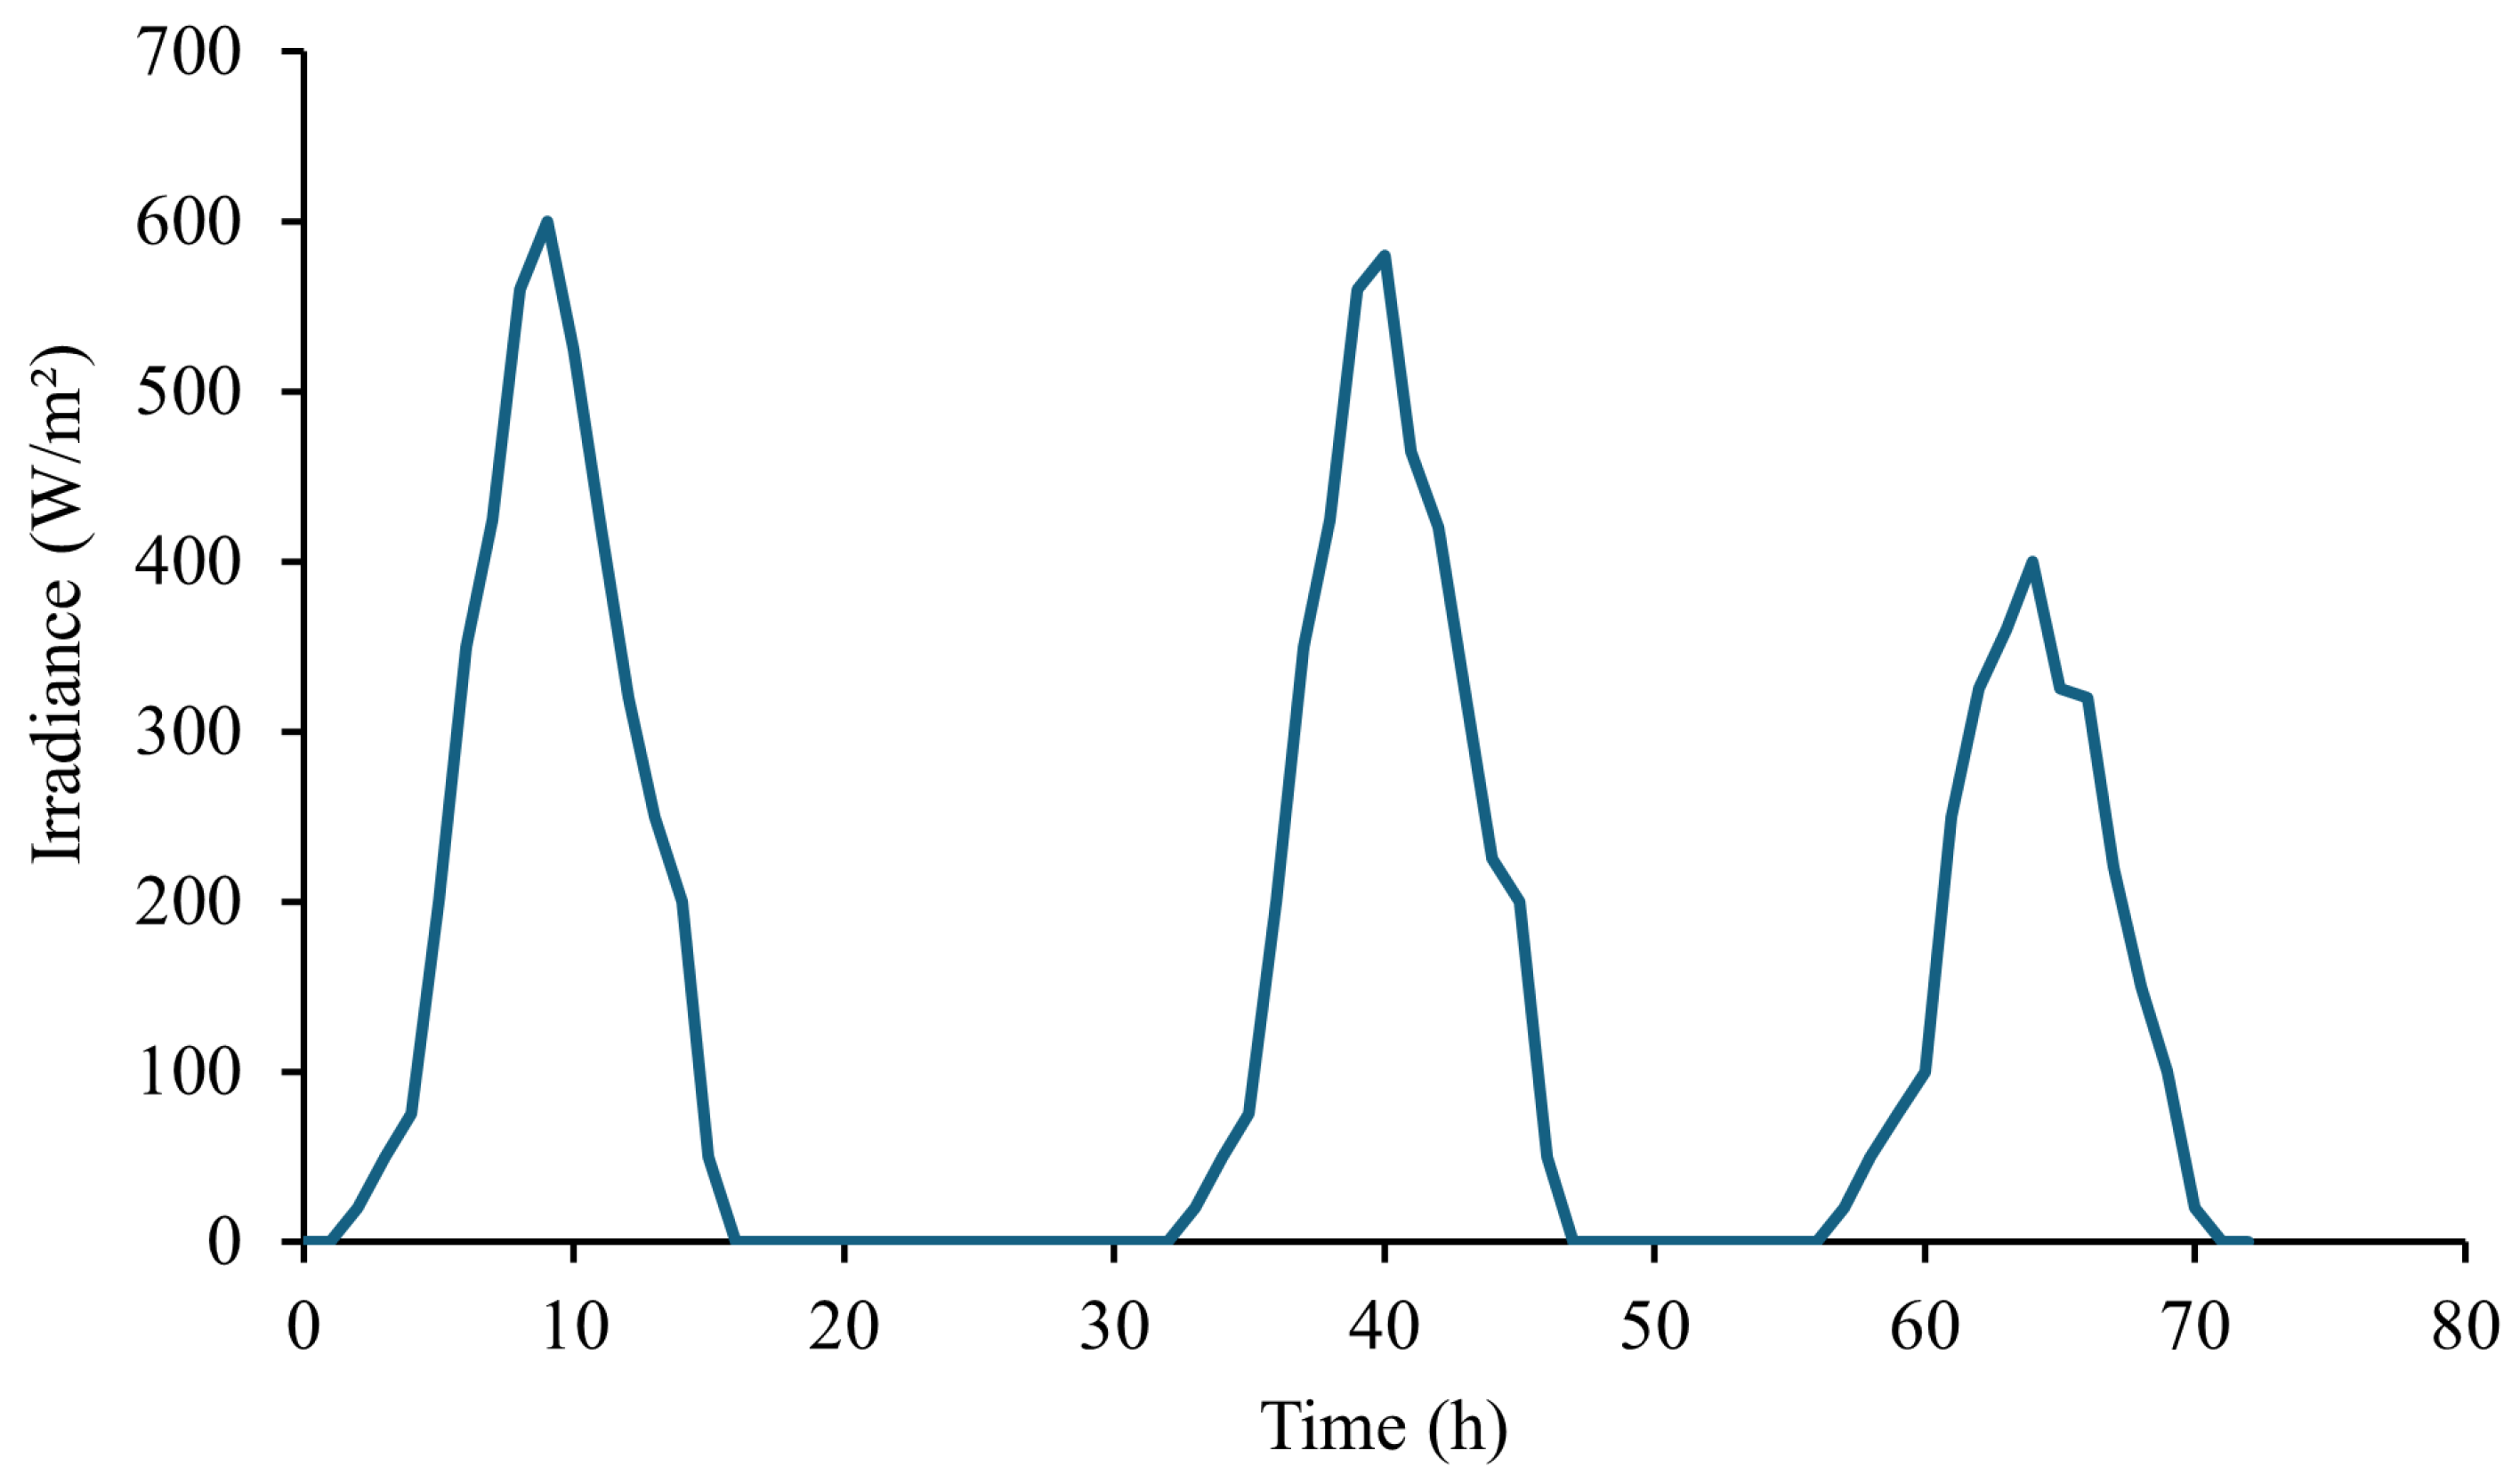
Note that q solar in Table 2 accounts for the external solar radiation, implemented in COMSOL as a time-dependent flux using measured irradiance data from Las Tablas, Los Santos (Figure 6).
q solar = τ · I ( t )
where τ is the transmittance of the glass cover and I ( t ) is the time-dependent solar irradiance. The transparent cover was modeled with a solar transmittance of 88   % , representative of standard clear plastic or glass materials [27]. Due to the naturally driven airflow, boundary conditions were applied to simulate passive convection and solar heat input. These were based on climatic data from Las Tablas, Los Santos, Panama, during the dry season using a weather station. Observations over a three-day monitoring period recorded a maximum solar irradiance of approximately 600   W / m 2 on the first day, as shown in Figure 6.
Internal surface-to-surface radiation was neglected, as conduction through the cover and convection inside the chamber dominate heat transfer in this small-scale prototype. Air inlet velocity was set within a low range, representative of natural convection, as no mechanical ventilation was considered. Although external airflow may be influenced by ambient wind, internal circulation is limited by the enclosure’s geometry and flow resistance. Consequently, the flow regime remains within the laminar domain, justifying the use of a laminar model for both thermal and fluid flow simulations.
The inlet air temperature was modeled using a cosine-based daily function [28], where T mean = 27 °C, as follows:
T inlet ( t ) = T mean + Δ T cos 2 π ( t 14 ) 24
Here, T mean denotes the daily mean ambient air temperature and Δ T represents the daily temperature amplitude, defined as half of the difference between the maximum and minimum ambient air temperatures, i.e., Δ T = ( T max T min ) / 2 . On the other hand, at time t = 0 and initial temperature T 0 , the rice layer is assumed to be at uniform temperature and moisture content, as follows:
T ( r , 0 ) = T 0 , X ( r , 0 ) = X 0 .
The boundary condition at the top surface of the rice layer accounts for both convective heat and mass exchange between the air and the product, expressed as follows:
k eff T · n = h T ( T T ) ,
D eff X · n = h m ( X eq X ) ,
where h T and h m are the convective heat and mass transfer coefficients, T is the dryer’s air temperature, and X eq is the equilibrium moisture content corresponding to the local air conditions. To model the moisture equilibrium at the air–grain interface, the empirical sorption isotherm for rough rice proposed by Basunia and Abe [24] was employed.

2.1.5. Numerical Methodology and Error Analysis

Numerical simulations were carried out using COMSOL Multiphysics® 6.2. An implicit direct solver was employed with the backward differentiation formula (BDF) to ensure stability in transient problems. A verification study was conducted to evaluate the influence of mesh refinement and time step size on the accuracy of the solutions. The convergence criterion was defined as a reduction in the residuals of the energy equation below 10 6 at each time step, and an adaptive time-stepping scheme with a relative tolerance of 0.01 was employed.
The relative error ϵ was used to quantify deviations from the most refined simulation, defined as follows:
ϵ = 1 m i = 1 m | ϕ i ϕ ^ i | ϕ ^ i ,
where ϕ i and ϕ ^ i are the computed value at the i-th time step for a given case and the corresponding reference value from the finest mesh or smallest time step, respectively. The error was evaluated in terms of the maximum relative deviation of the temperature at the center of the rice bed.
For the grid verification, four refinement levels were tested for each rice thickness. In the case of a 45 mm layer, the number of mesh elements was 8696, 8718, 8790, and 15,075 for normal, fine, very fine, and extra fine meshes, respectively. For the 25 mm layer, the corresponding values were 8860, 8872, 8966, and 15,303. As shown in Figure 7a, the maximum relative error decreased monotonically with refinement, reaching values below 0.01 % for the extra fine mesh in both thicknesses, which confirmed grid independence.
For the time step verification, the case of a 45 mm layer with a fine mesh was analyzed using fixed time steps of 1, 5, and 10 s. Figure 7b shows that the maximum relative error remained below 0.0002 % , confirming the independence of the solution with respect to time discretization.
Based on these results, the fine mesh (around 8700–8900 elements depending on layer thickness) and a time step of 1 s were selected for all simulations, ensuring a balance between accuracy and computational cost.

3. Results and Discussion

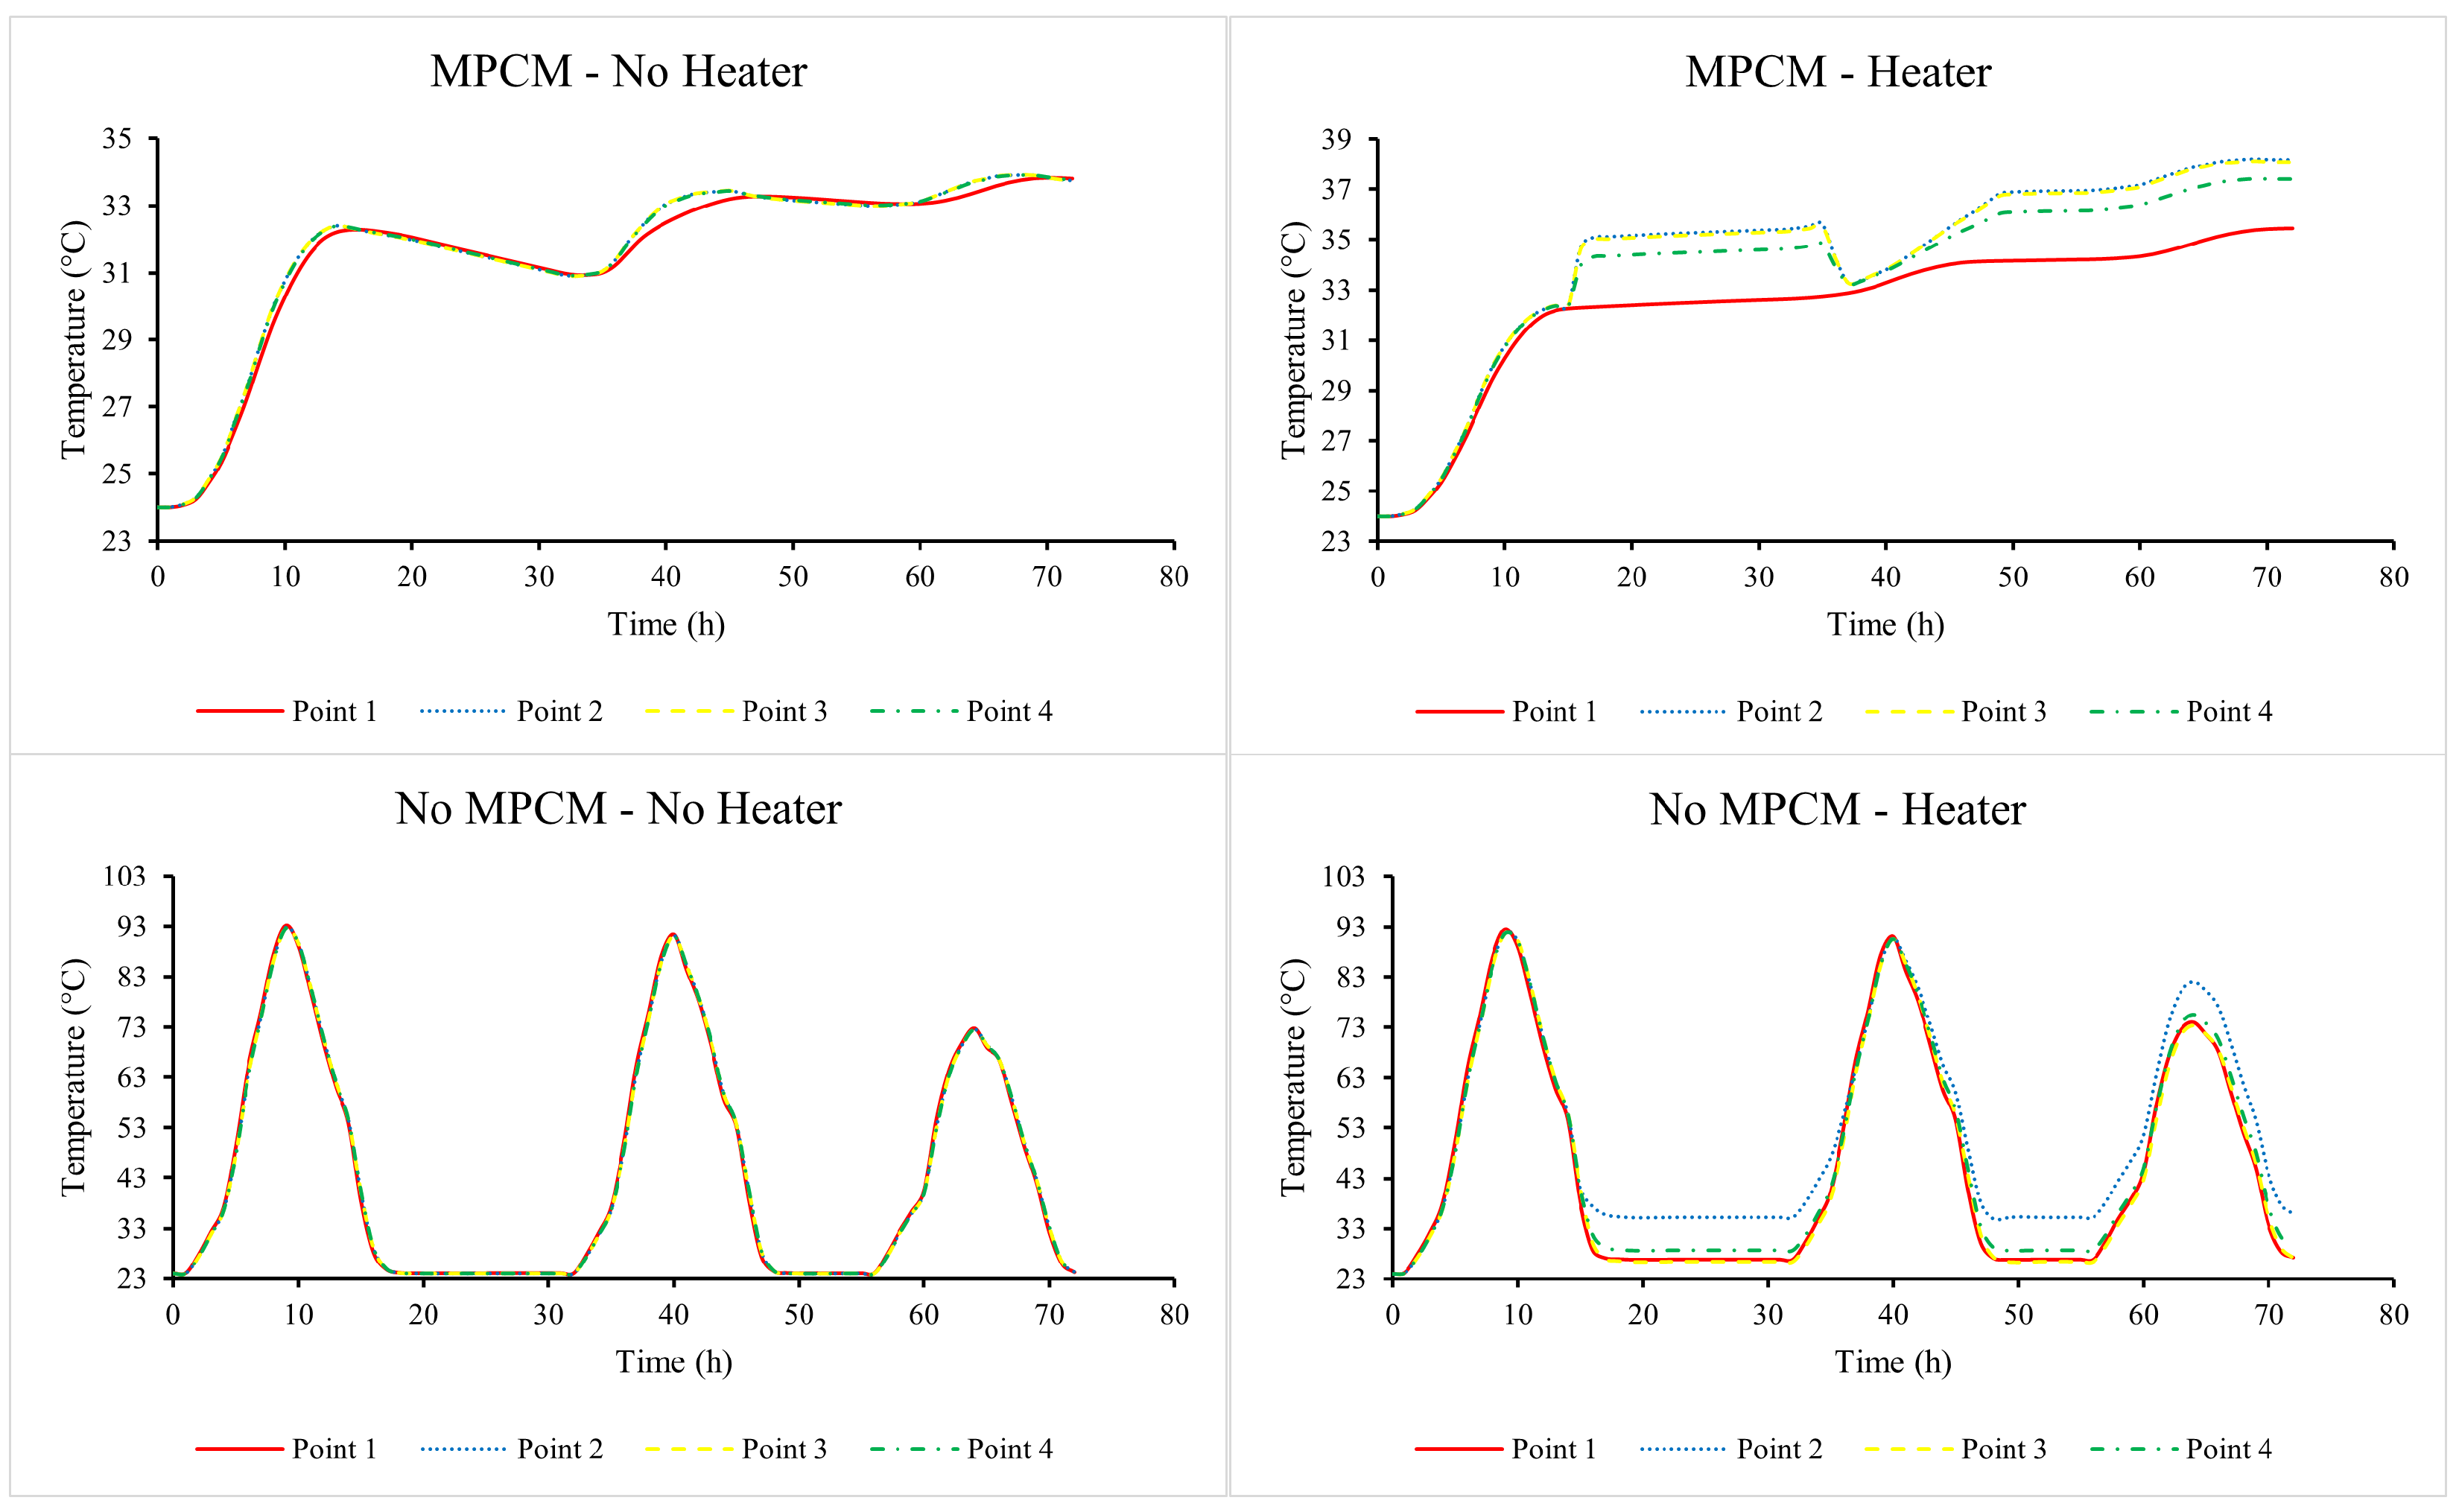
This section presents the experimental and numerical findings obtained from the solar dryer integrated with and without MPCM and with and without an auxiliary heater. The analysis focuses on the thermal performance of the system, showing the influence of the MPCM on moderating temperature fluctuations and enhancing heat distribution within the drying chamber. Figure 8 illustrates the experimental configuration, showing the heater arrangement, the MPCM compartment, and the monitoring points used to evaluate temperature evolution. The discussion begins by addressing the thermal response of the dryer in the absence of product, providing insight into the role of MPCM in stabilizing chamber conditions before moving to product-based drying performance. The four measurement points indicated in Figure 8 were selected to capture the spatial variation in temperature inside the solar dryer. Point 1, located within the MPCM compartment, monitors the influence of the phase change material on local thermal buffering and storage. Points 2, 3, and 4 are positioned at different locations in the drying chamber near the moist rice, allowing for evaluation of the temperature distribution experienced by the product. In particular, Point 2 represents the central zone above the rice bed, while Points 3 and 4 capture conditions closer to the heaters at the lateral edges. When moist rice is introduced into the chamber, however, the analysis shifts from local point measurements to the average thermophysical properties of the product. In this case, the rice bed acts as a distributed medium, and its bulk temperature and moisture evolution are used to evaluate dryer performance and drying kinetics, rather than relying solely on the discrete point measurements.

3.1. Thermal Performance of the Solar Dryer with Microencapsulated Phase Change Material Without Product

Figure 9 illustrates the temporal temperature evolution for four different operational configurations of the solar dryer. In the configuration without MPCM and without auxiliary heating (bottom-left), heat transfer is solely governed by solar irradiance, leading to sharp temperature oscillations. The maximum and minimum recorded values are T max 93 °C and T min 23 °C, resulting in a total fluctuation of Δ T 70 °C. The four monitored points follow nearly identical trends, confirming that temperature distribution inside the chamber is spatially uniform. With the addition of the auxiliary heater but without MPCM (bottom-right), the system maintains elevated temperatures during non-solar hours, with a particular increase in the temperature in point 2. Although this configuration enhances drying potential by reducing downtime, it also increases energy demand.
For the configuration with MPCM only (top-left), the phase change material effectively buffers temperature fluctuations, limiting the maximum temperature to around 33–34 °C. The PCM absorbs excess heat during the day and releases it during non-solar hours, thereby maintaining temperatures near its melting point. The four points show negligible differences, confirming homogeneous conditions within the drying chamber. Finally, in the hybrid configuration combining MPCM and auxiliary heating (top-right), the system provides the most stable thermal environment. Temperatures are sustained between approximately 35 and 38 °C, ensuring better conditions for drying while preventing extreme peaks. Here, the auxiliary heater compensates for thermal losses, while the MPCM reduces oscillations by storing and releasing latent heat. Overall, the results show that while MPCM alone is effective in dampening oscillations, the heater plays an important role in maintaining sufficiently high temperatures during non-solar periods.

3.2. Drying of Rice with the Prototype of a Solar Dryer with MPCM

A series of numerical simulations were conducted to evaluate the impact of the microencapsulated phase change material (MPCM) and rice layer thickness on the thermal and drying performance of the solar dryer. The study considered configurations with and without MPCM, using rice layers of 25 mm and 45 mm. Due to the increased thermal load introduced by the presence of the rice product, the electric heater was activated in all cases with product loading.
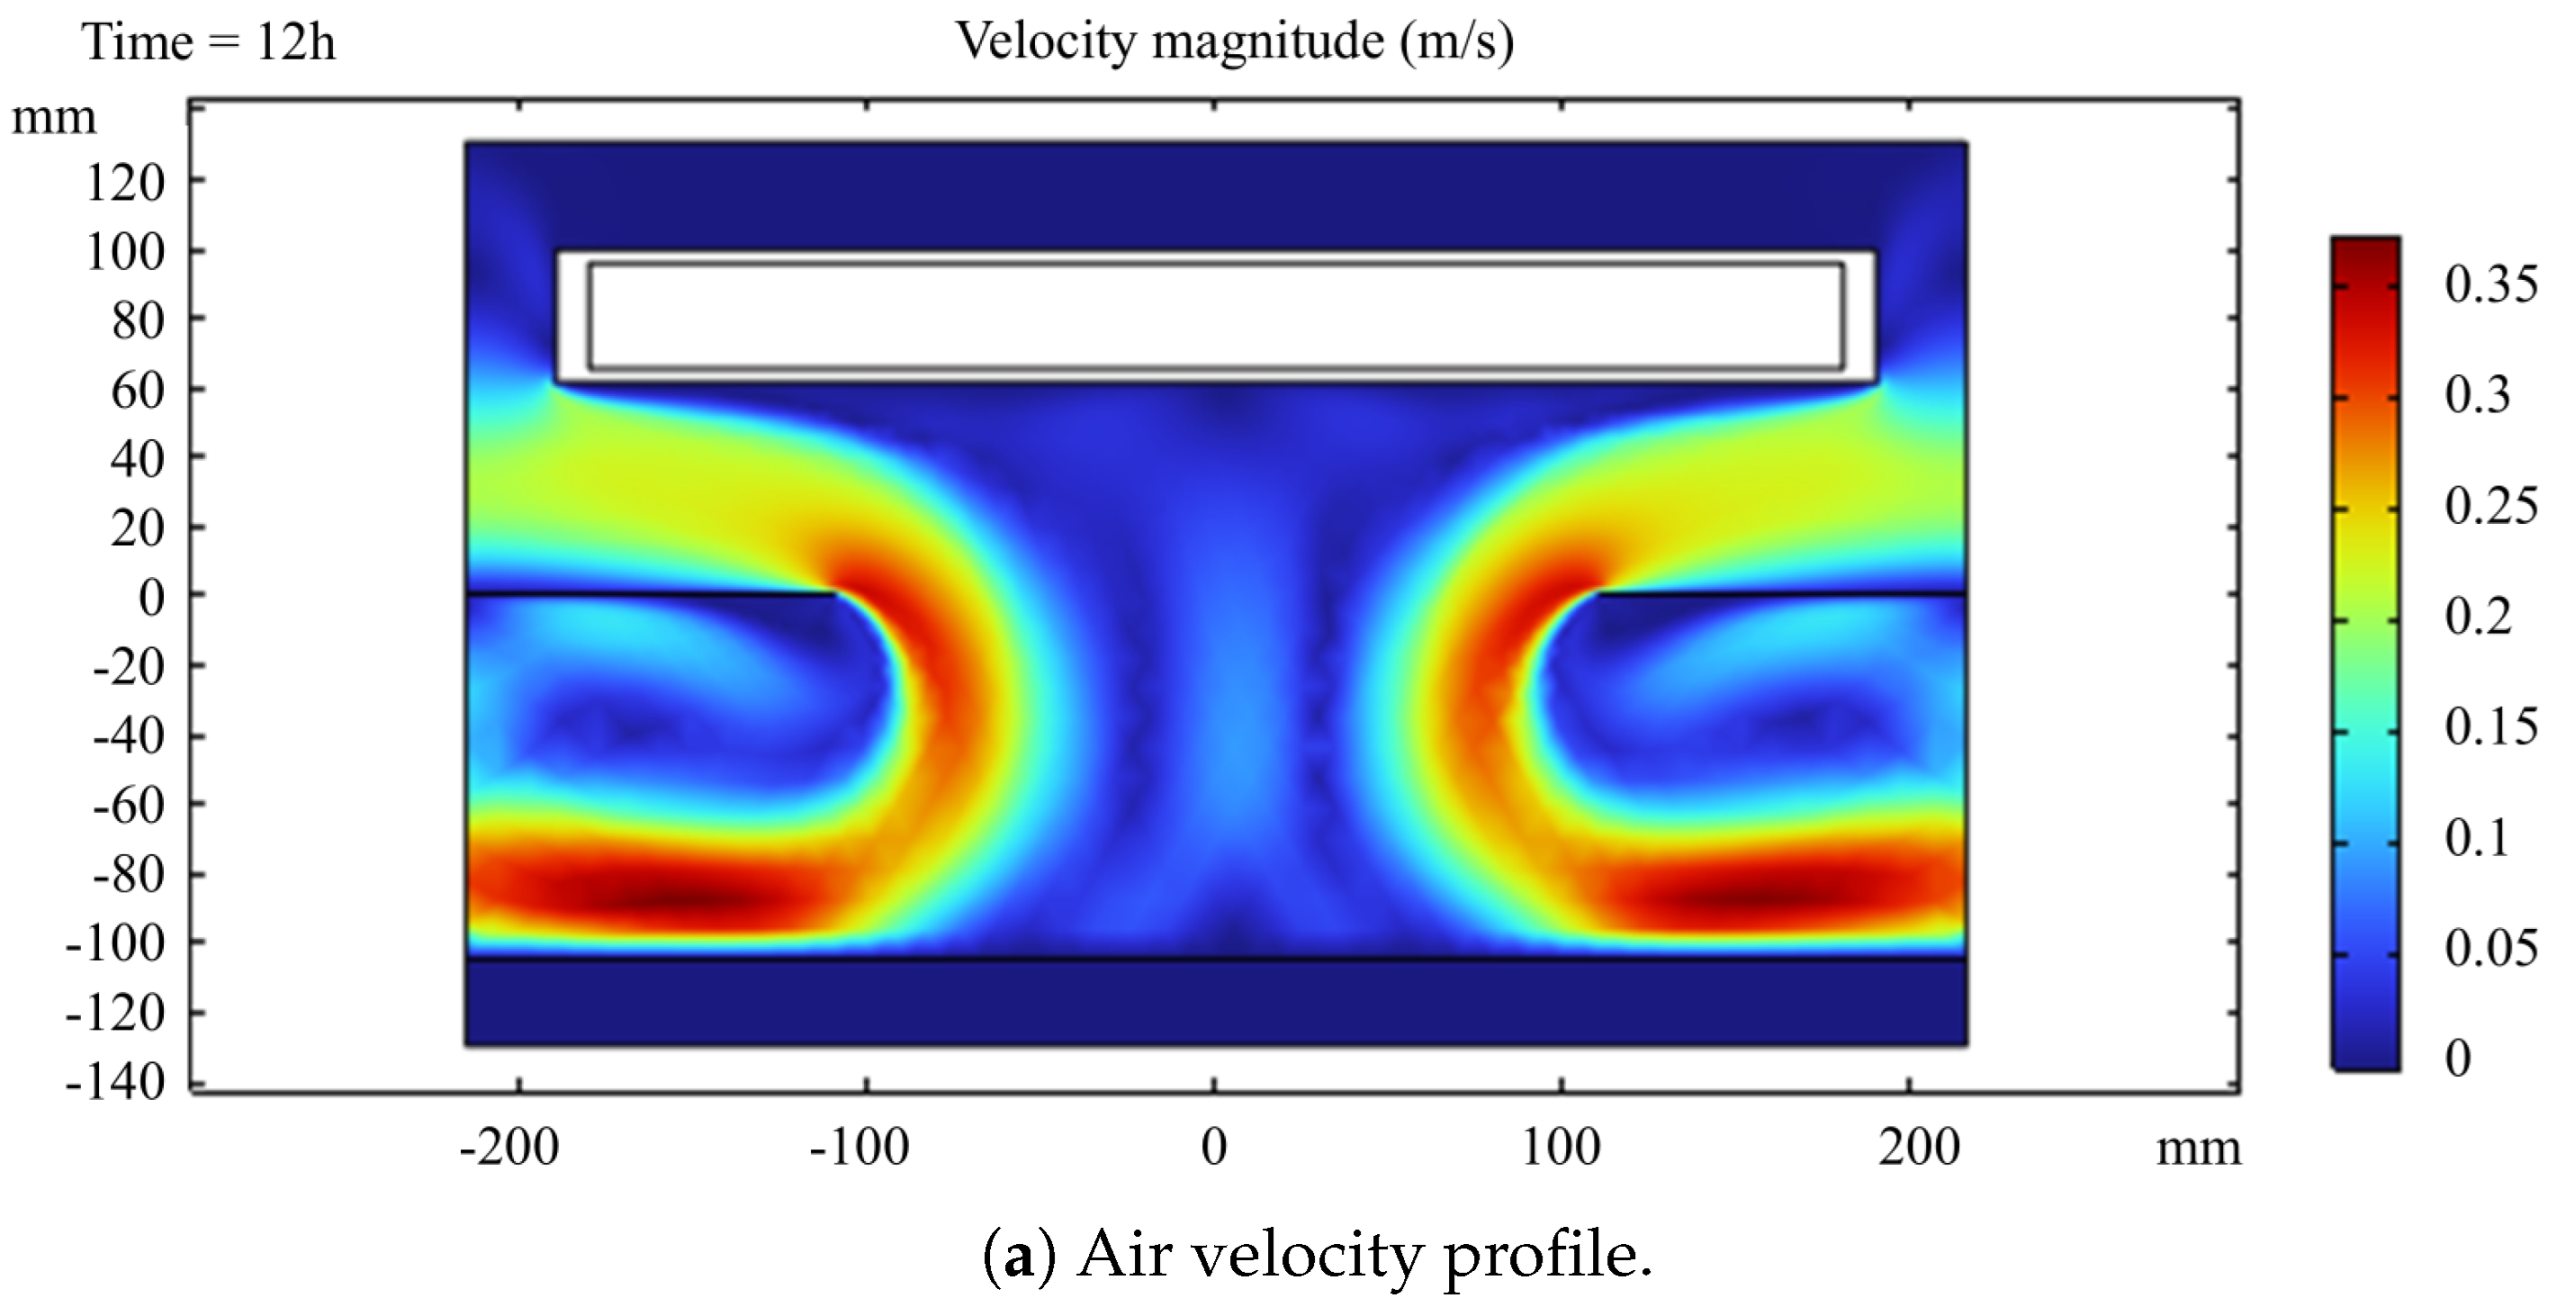
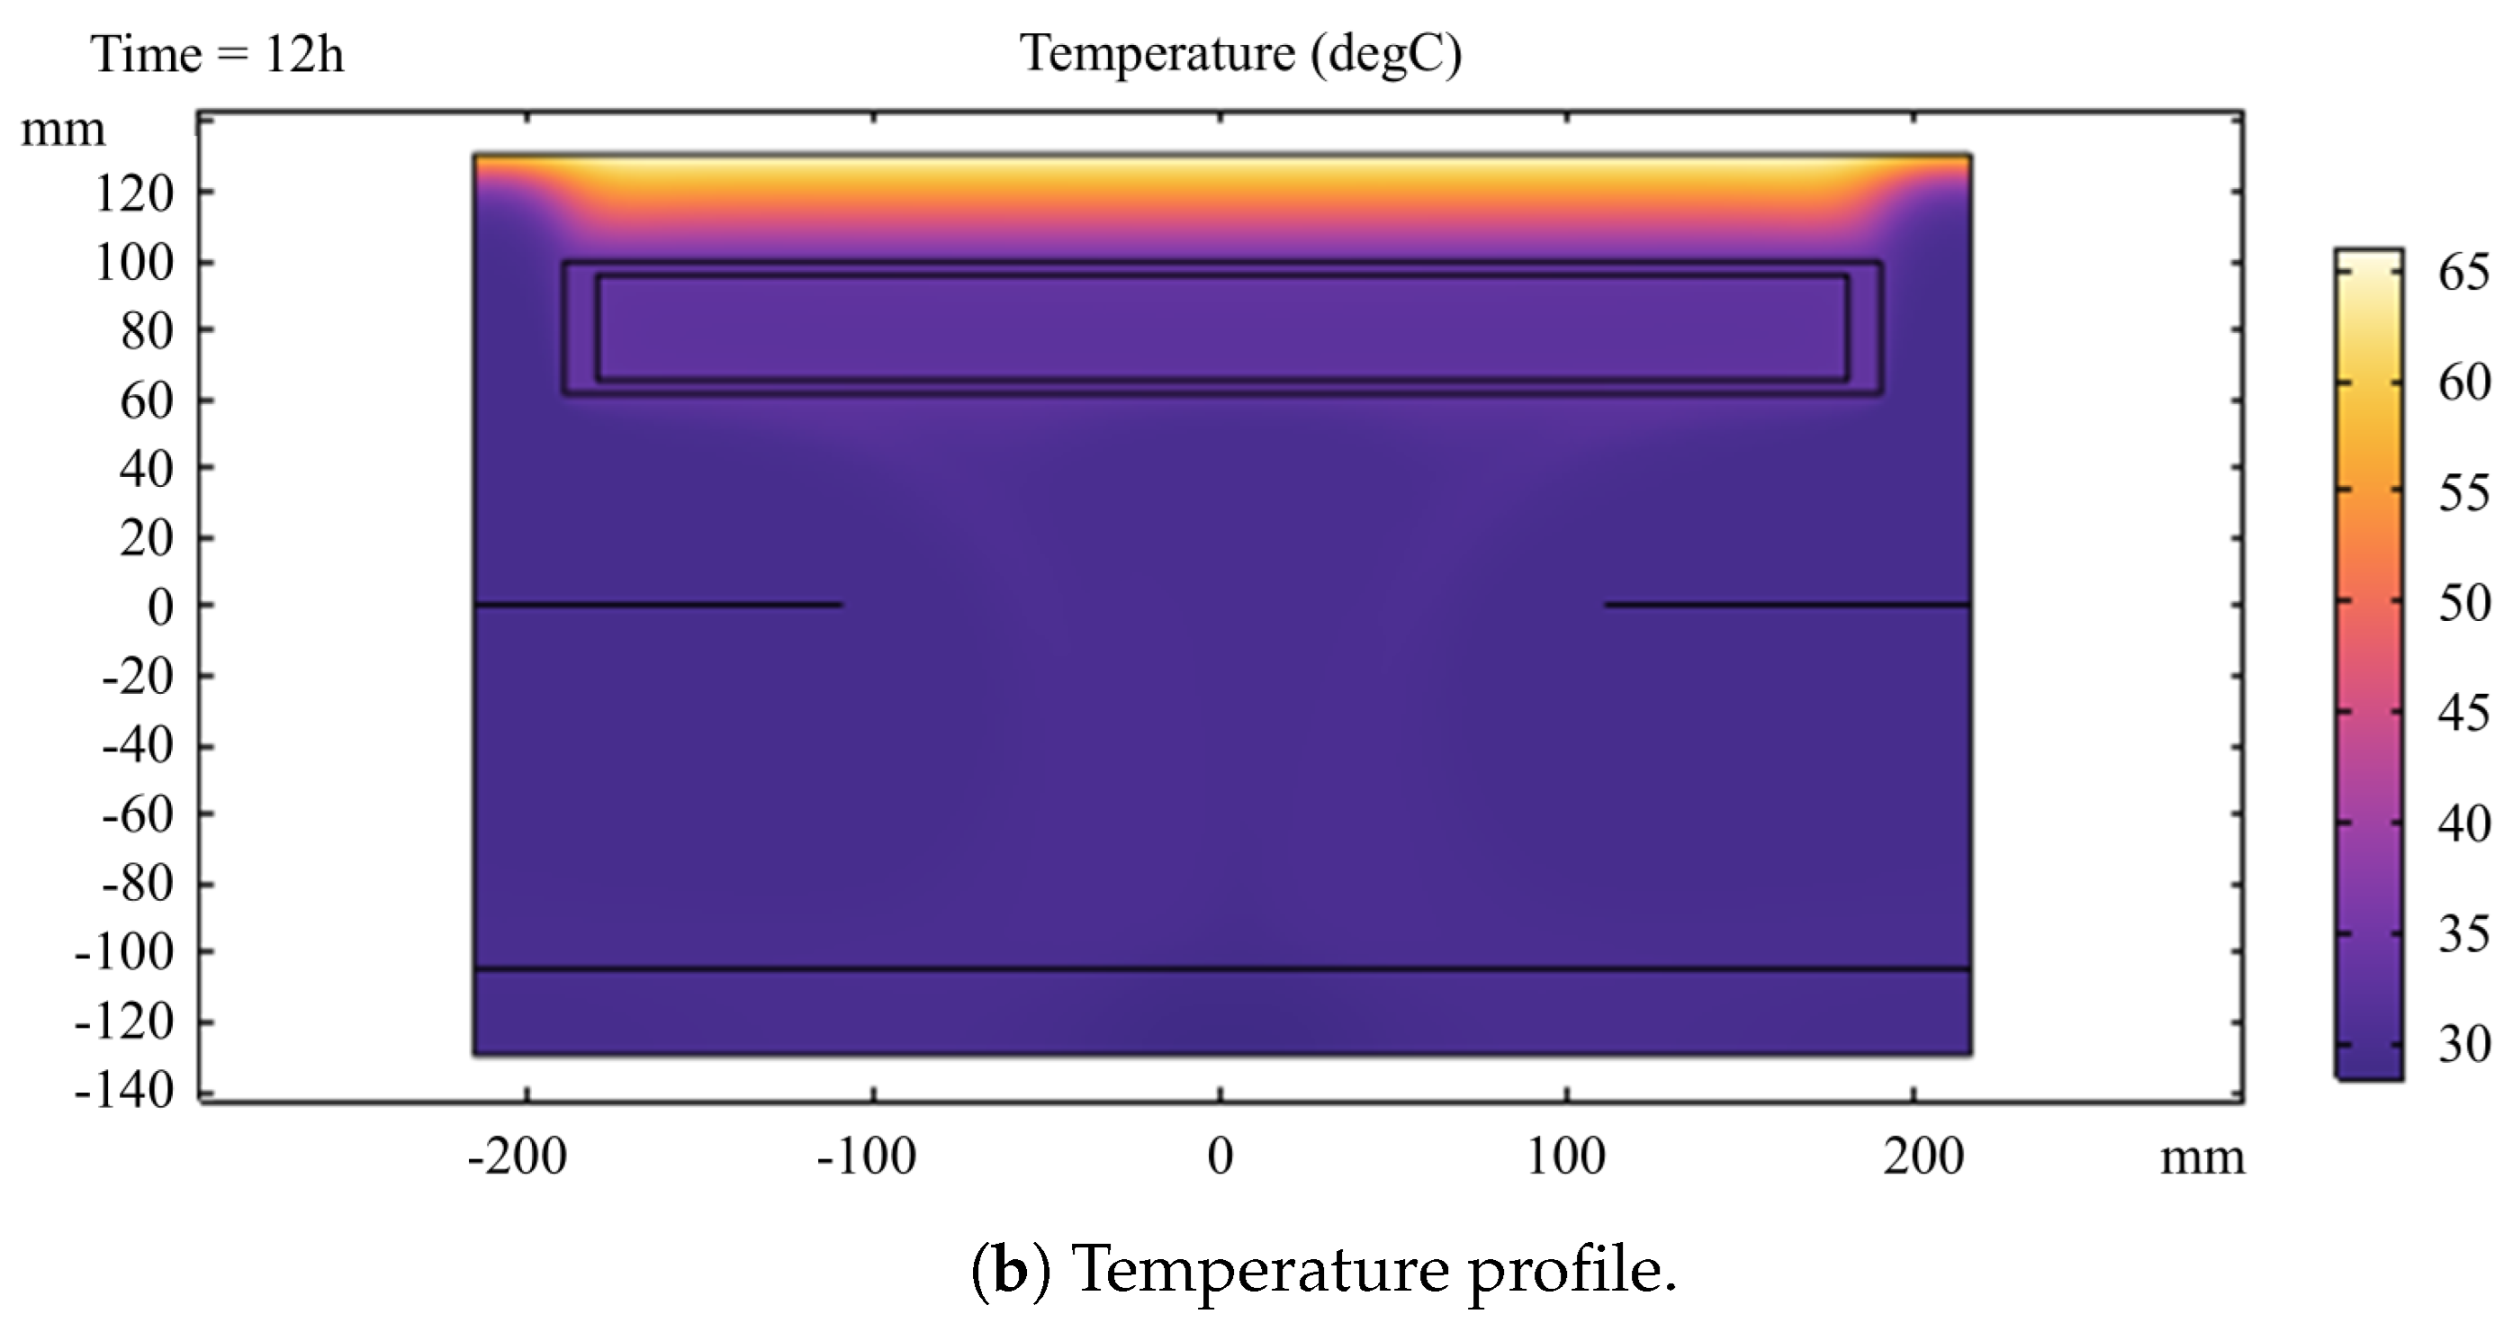
Figure 10 presents the air velocity and temperature distribution within the drying chamber at 12 h for the configuration with MPCM and a 25 mm rice layer. The airflow field shows relatively uniform velocities with localized recirculation zones that enhance convective heat transfer near the product surface. The corresponding temperature distribution reveals stratification, with higher temperatures near the upper zones and moderated gradients in the product region, indicating that the MPCM contributes to stabilizing the chamber air temperature through latent heat exchange.
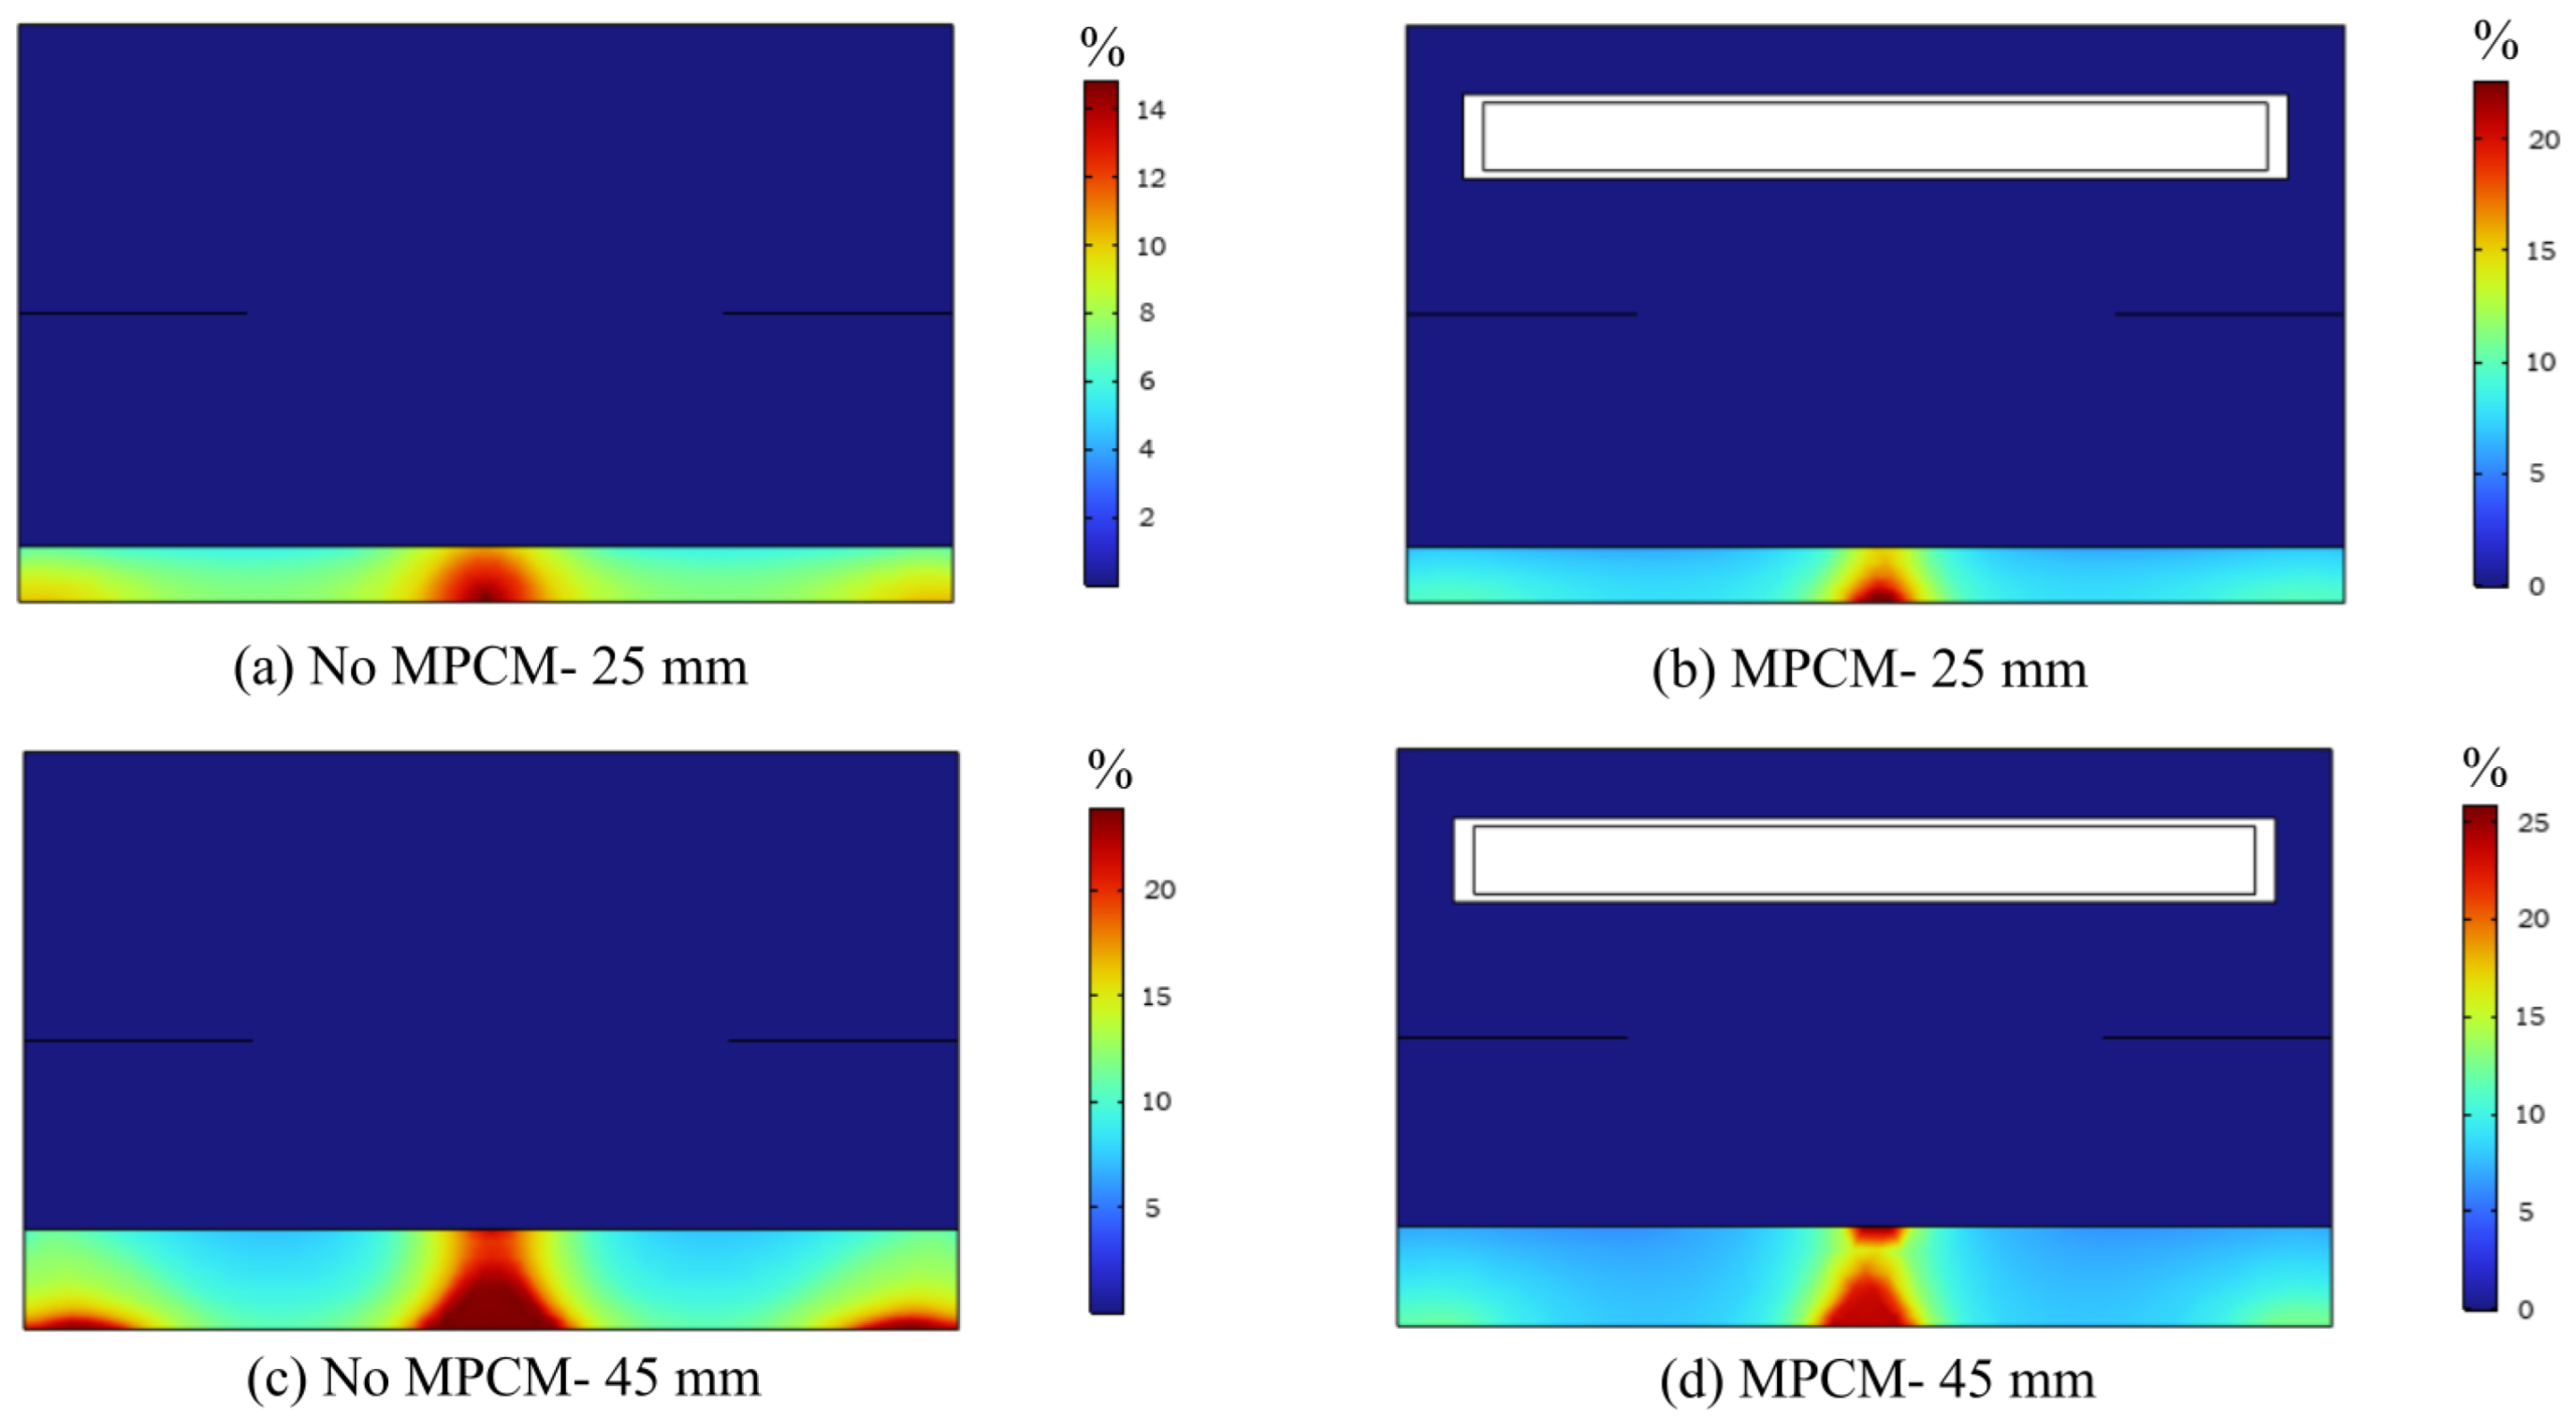
The moisture distribution at 12 h is shown in Figure 11. The cases with MPCM (Figure 11b,d) display notably more uniform wet-basis moisture content (WBMC) compared to cases without MPCM (Figure 11a,c). WBMC is defined as the ratio of the mass of water to the total mass of the wet material. A more uniform drying is particularly evident in the 45 mm rice layer, where the moisture gradients are more pronounced in the absence of MPCM. In addition, the WBMC is higher in the center portion of the rice layer in all cases, which is attributed to the limited convective airflow reaching this zone. This effect is more pronounced in the thicker layer (45 mm), where the drying front progresses more slowly due to the greater thermal mass and reduced heat penetration depth. Results show the need for enhanced airflow strategies to improve drying uniformity, especially in thicker product loads.
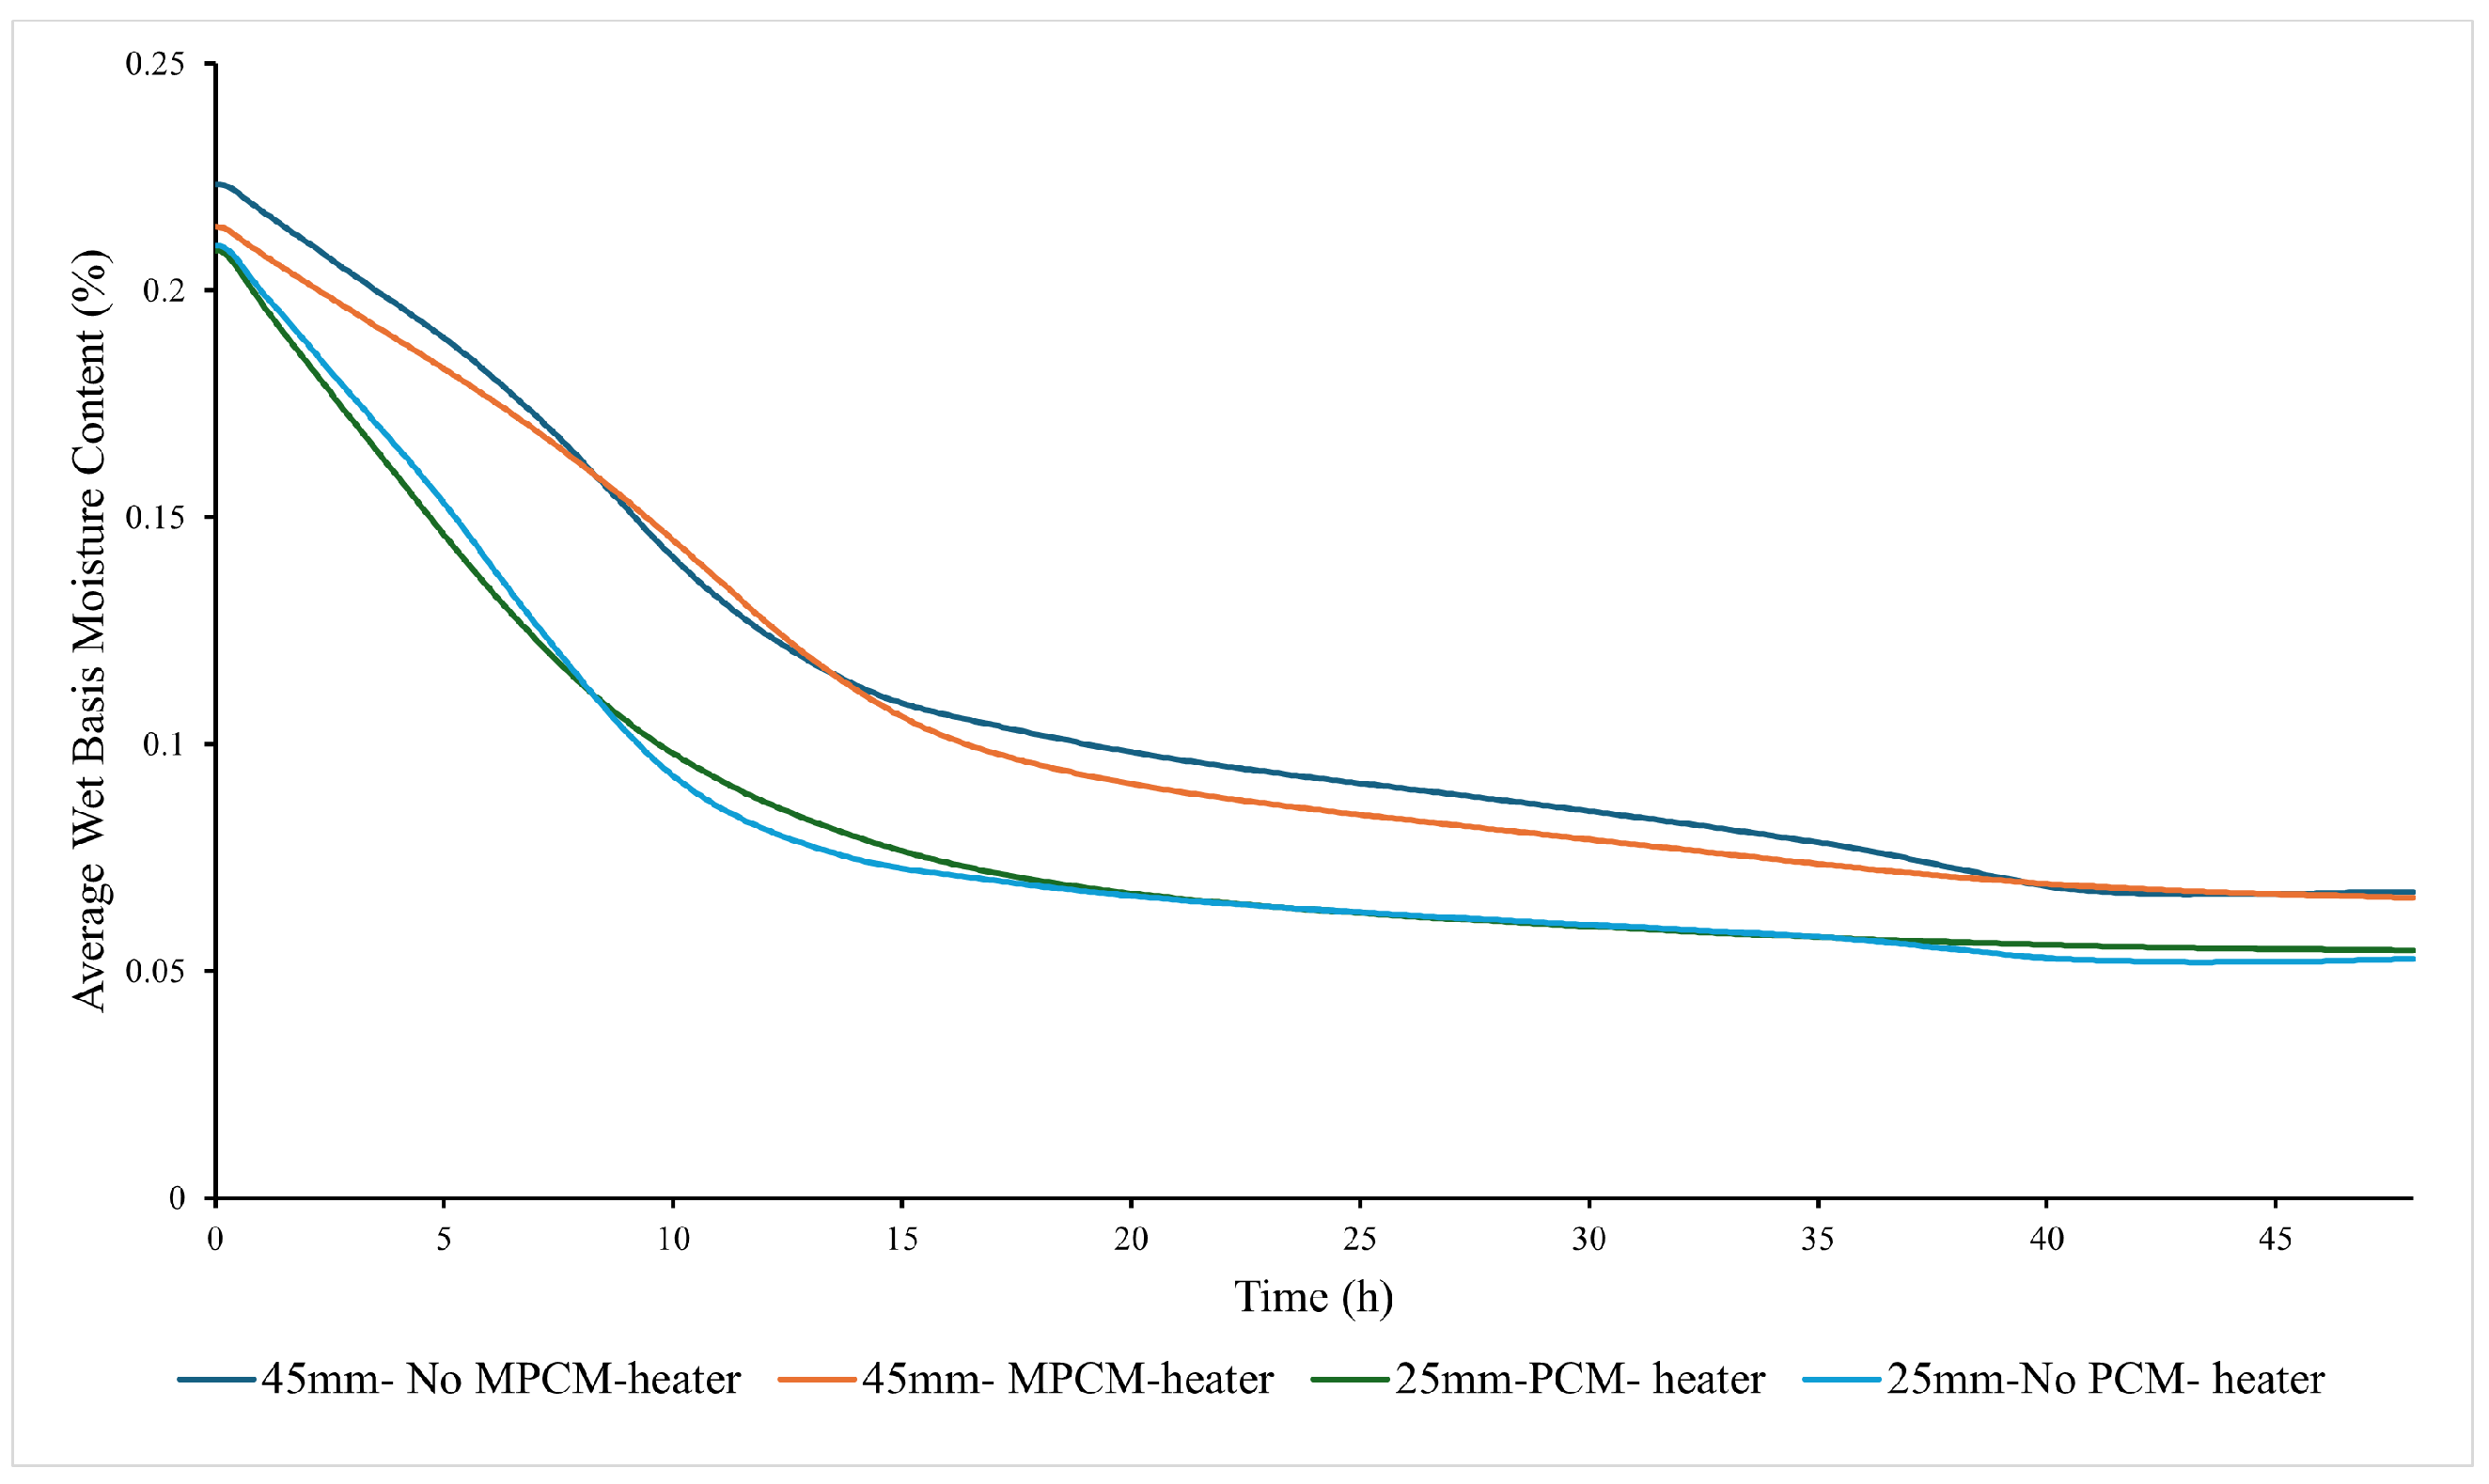
Figure 12 presents the time evolution of the average WBMC for the various cases. The use of MPCM consistently resulted in slightly faster moisture reduction, particularly in the 45 mm layer. The cases without MPCM exhibited a slower drying rate, especially for the thicker layer, likely due to insufficient thermal energy reaching the lower sections.
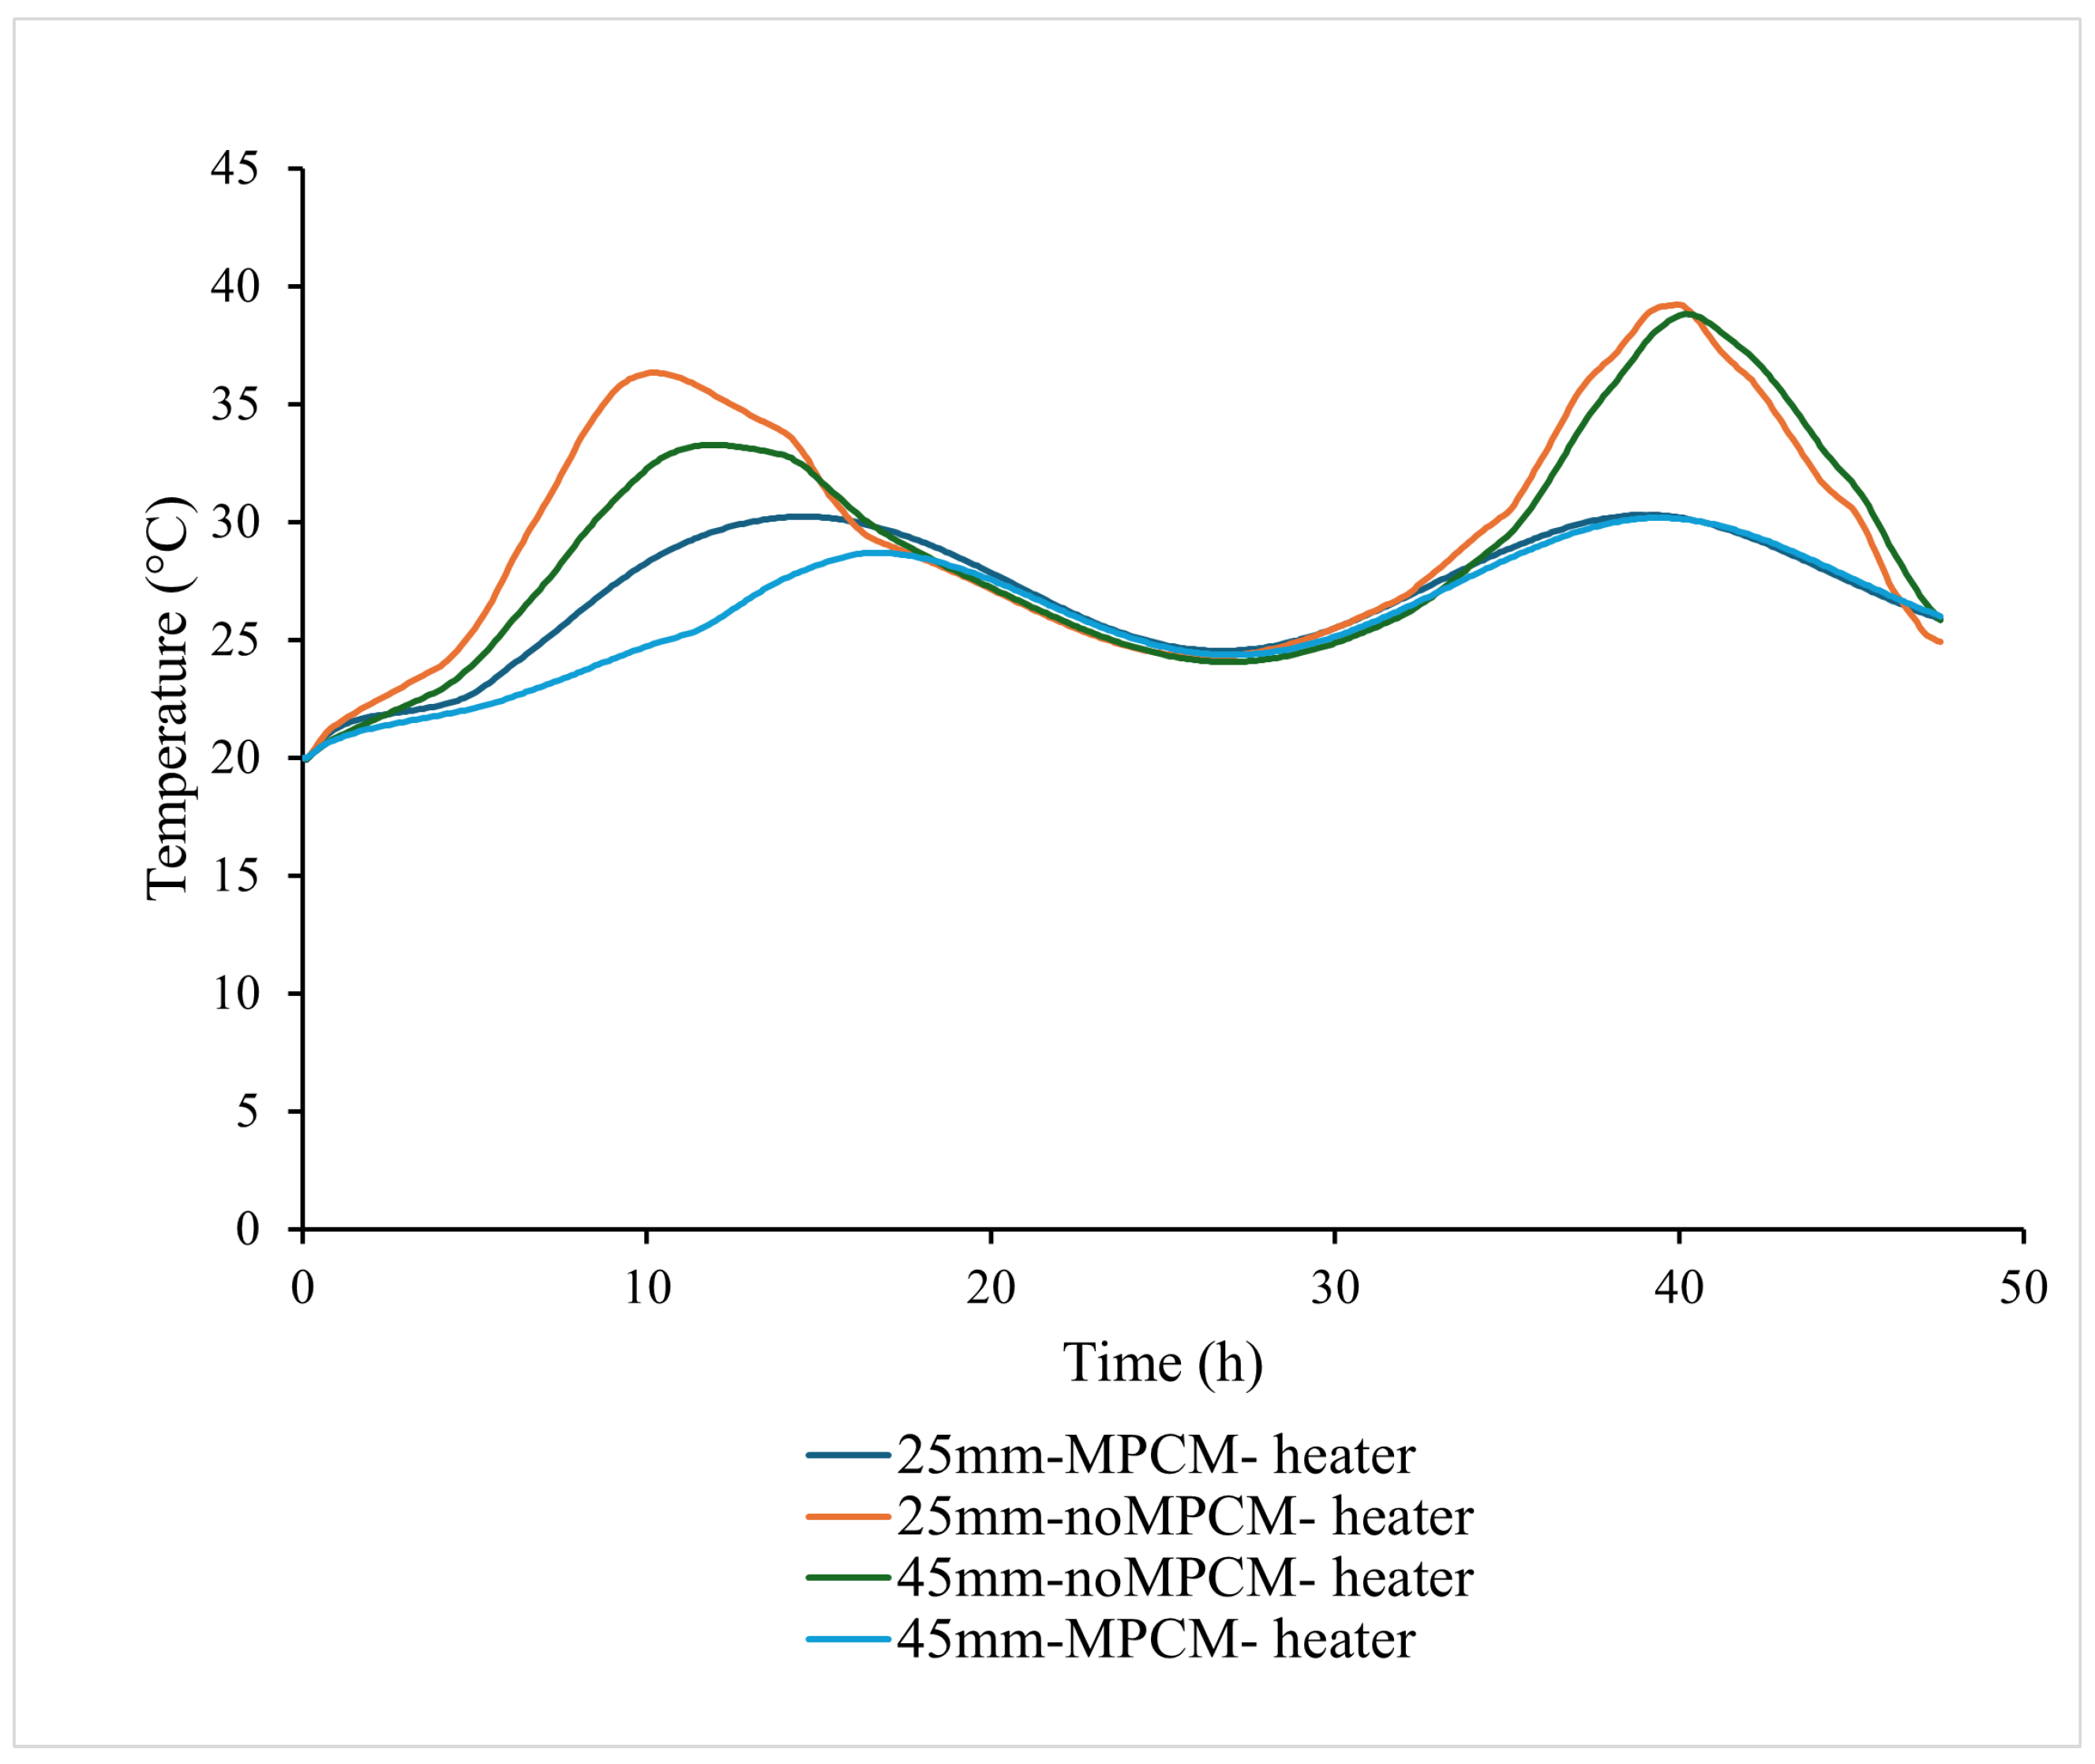
The average rice temperature profiles (Figure 13) show the influence of MPCM in reducing temperature fluctuations. This reduction in thermal oscillations is beneficial for preserving grain quality, as it helps prevent localized overheating of the surface. In all cases, the average temperature remained below 40 °C, which is favorable for minimizing quality degradation like stress cracking. However, such low temperatures may limit drying speed and could increase the risk of mold or spoilage if airflow is inadequate [29]. The results suggest that while MPCM enhances thermal stability, optimizing drying rates may require balancing the amount and distribution of MPCM with proper airflow management to ensure sufficient heat transfer to the product.
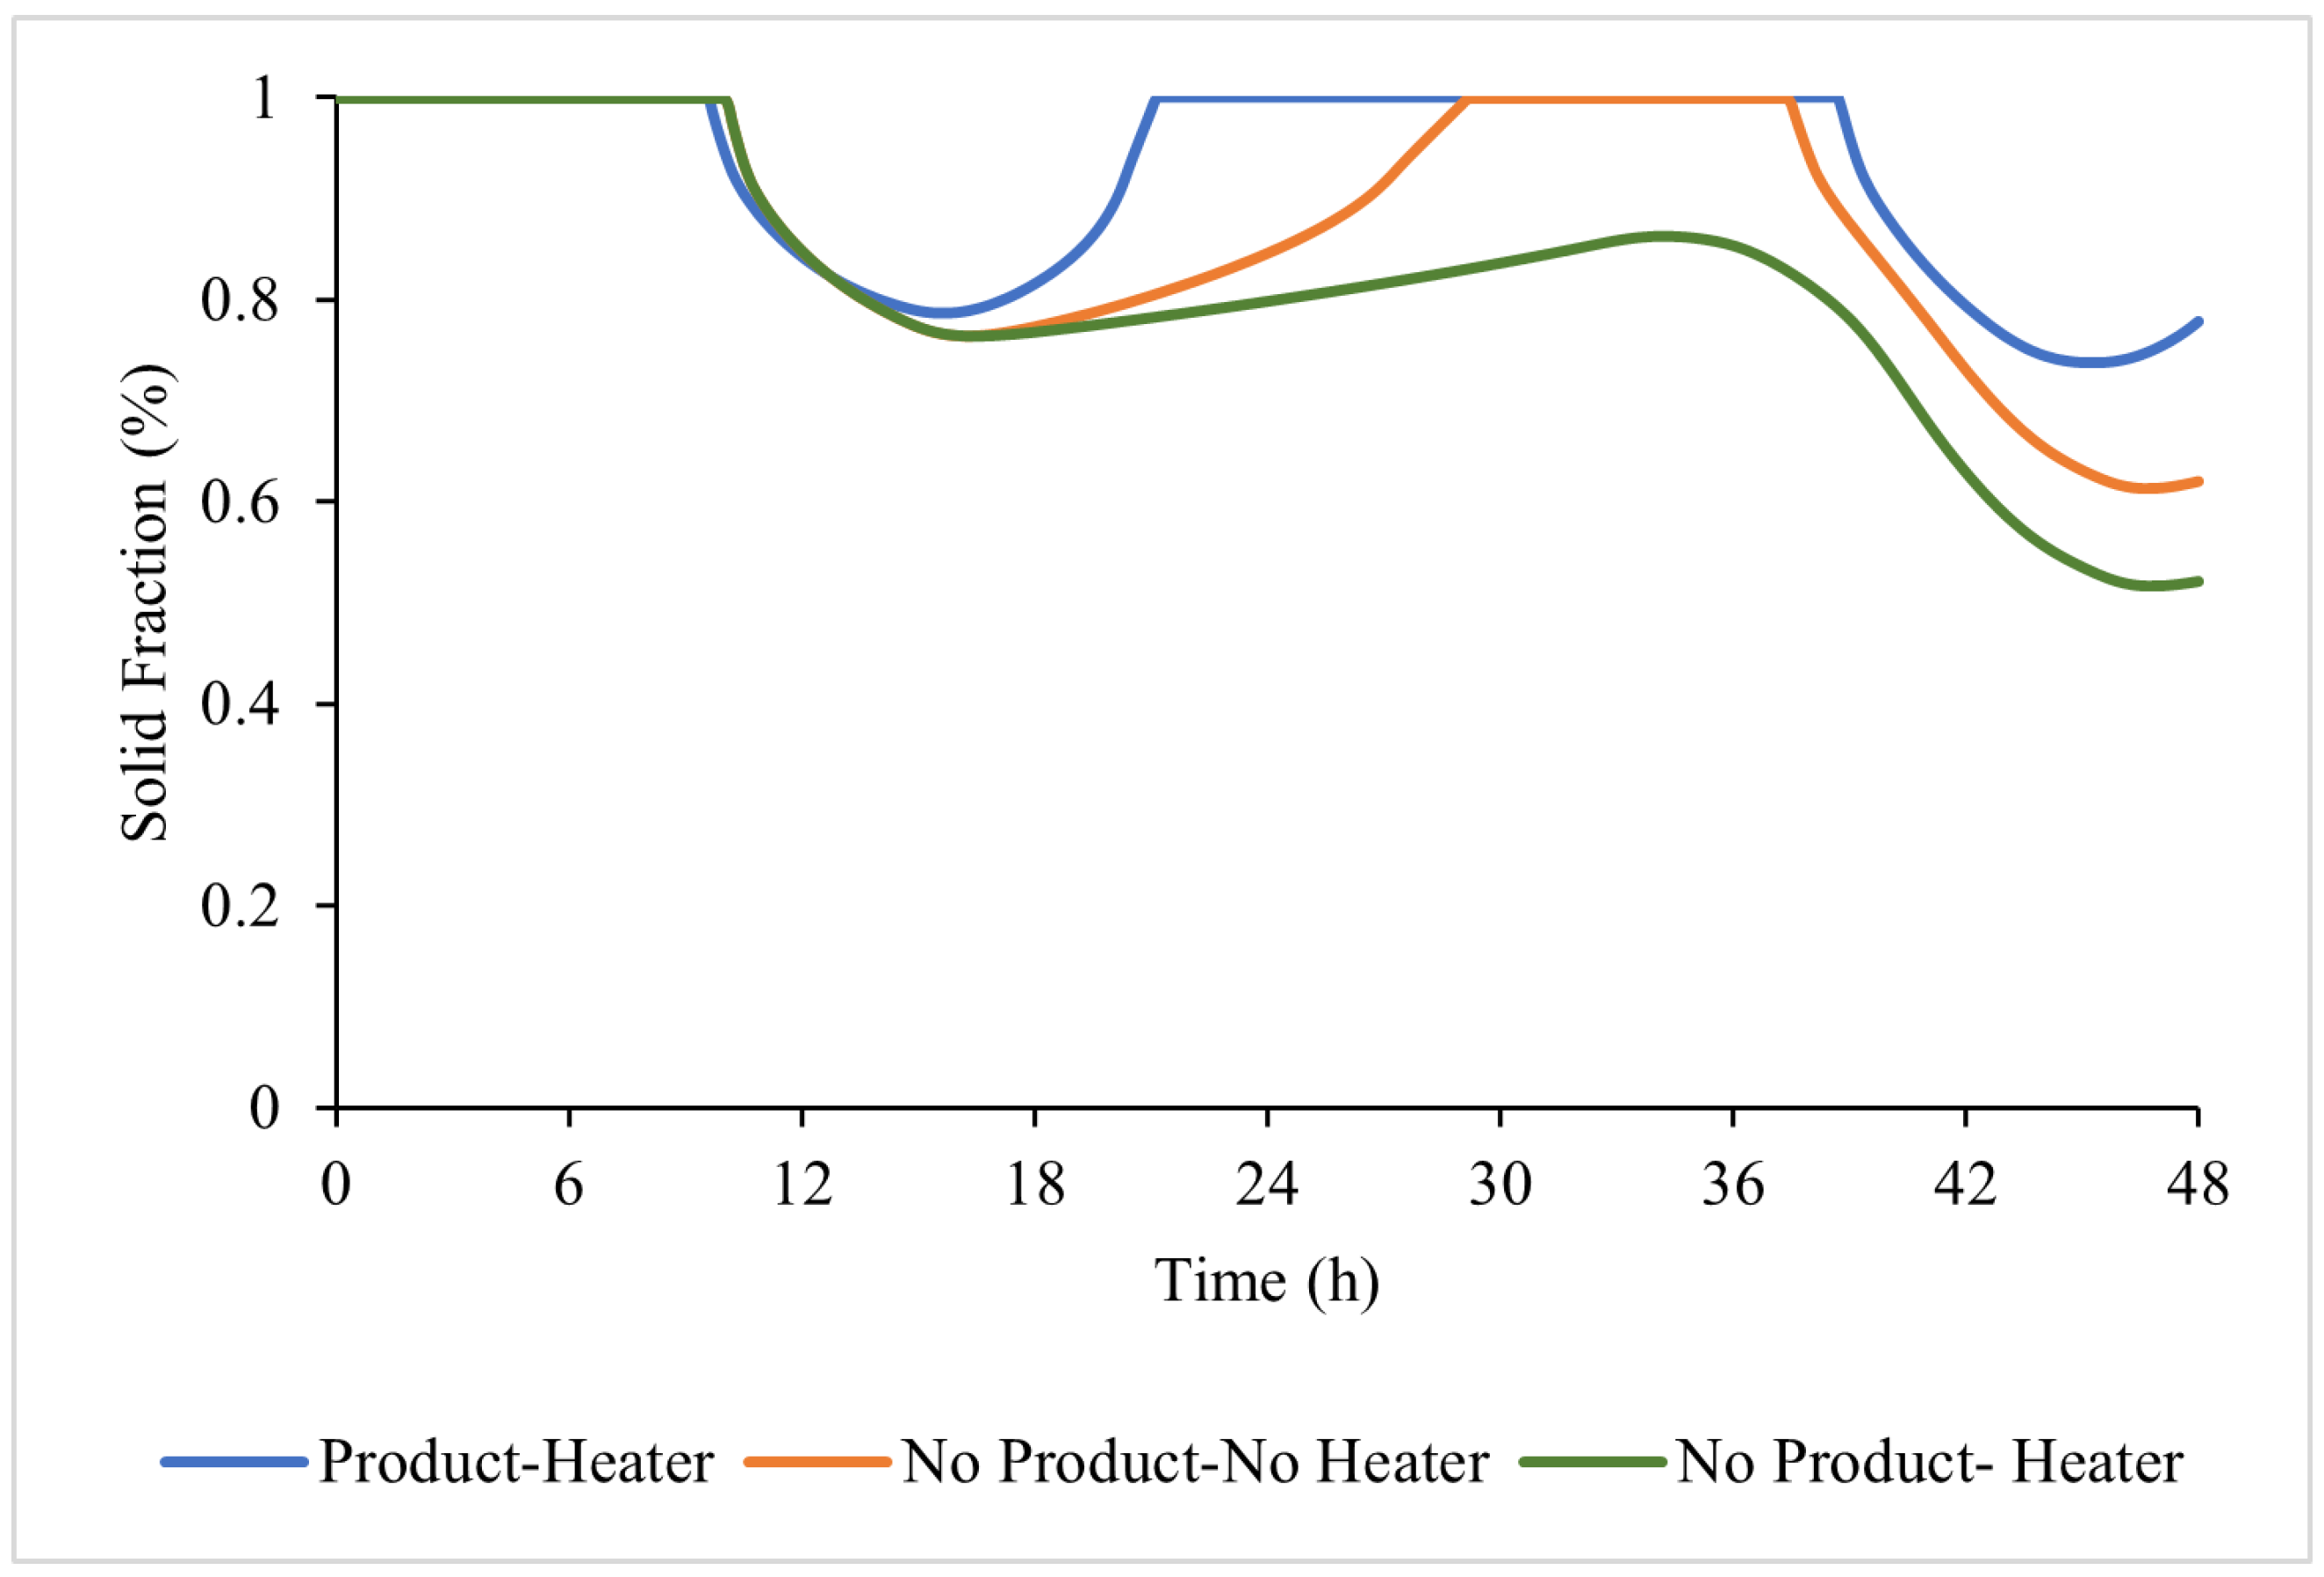
Figure 14 illustrates the average solid phase fraction of the MPCM for different operating conditions with product (rice) in a 25 mm layer. In the case with product and heater, the MPCM remains mostly in a solid phase, reaching only partial melting. As a result, the latent storage capacity of the MPCM is underutilized when product is present.
In contrast, the configuration without product but with the heater shows the highest solid fractions, with the MPCM undergoing extensive melting and re-solidification cycles. This reflects greater charging of the storage medium, since the absence of thermal demand from the rice allows more energy to be directed toward the MPCM. The case without product and without heater exhibits intermediate behavior: the MPCM follows the solar radiation cycle, melting during peak irradiance hours and partially solidifying during low-radiance periods. However, the overall utilization of latent heat remains limited due to the absence of auxiliary energy input. These results show that MPCM performance is highly sensitive to the presence of product load. When rice is present, the MPCM contributes less to thermal buffering because more of the available heat is used for moisture evaporation. In contrast, heater-assisted cases without product allow for greater MPCM charging, but this condition does not reflect real drying scenarios. Thus, optimizing MPCM effectiveness requires balancing product thermal demand with sufficient energy input to achieve meaningful melting and storage.
After examining the solid fraction evolution of the MPCM under different operating conditions, it is also relevant to highlight the critical thermal and drying parameters of the rice layer. Table 3 summarizes the minimum and maximum temperatures, the corresponding thermal amplitudes, and the overall WBMC reduction after 48 h. This comparative view allows for identifying the stabilizing role of the MPCM, which significantly reduces thermal oscillations while maintaining a comparable level of moisture removal, particularly in the thicker layer (45 mm).
Several previous studies have numerically simulated rice drying to analyze heat and mass transfer and optimize dryer design. For example, Naghavi et al. [18] developed a non-equilibrium deep-bed model for rough rice, accurately predicting temperature and moisture profiles during drying. Iranmanesh et al. [11] used CFD to investigate the effects of PCM integration on air temperature uniformity and drying kinetics in solar dryers. Li et al. [17] applied a coupled heat and mass transfer model to simulate thin-layer rice drying, validating their results with experimental data. These works provide a benchmark for evaluating the present study’s approach and results. Compared to these studies, the present work has extended the modeling framework by incorporating MPCM and analyzing its impact on both thermal stability and drying uniformity in a small-scale solar dryer. While Naghavi et al. and Li et al. focused on predicting temperature and moisture evolution in rice beds without thermal storage, our results demonstrate that MPCM integration effectively reduces temperature fluctuations and promotes more uniform drying, especially in thicker layers. For instance, when comparing with the inflatable solar dryer (ISD) validated by Salvatierra-Rojas et al. [30], it can be noted that the ISD, operating with forced convection and without PCM, reached peak temperatures close to 64 °C and achieved shorter drying times. In contrast, the MPCM-assisted cabinet dryer of the present study maintained a lower but more stable temperature range (33–38 °C), which favored greater uniformity in thicker rice layers.
While the present results indicate the stabilizing effect of MPCM on chamber temperature, they also reveal important limitations that explain its reduced effectiveness during low-irradiance periods. The limited thermal contribution of the MPCM during such periods can be attributed to several design and material constraints. First, the relatively small MPCM amount in the prototype restricted the total latent heat that could be stored and subsequently discharged when solar input declined. In addition, the melting temperature of the selected MPCM (approximately 35 °C) may not have provided a sufficiently high driving potential to sustain heat release once chamber air temperatures approached equilibrium with the ambient, leading to incomplete utilization of the latent storage capacity in the presence of product. The numerical results also suggested that most of the absorbed solar energy was directly consumed by moisture evaporation in the rice layer, leaving little surplus to fully charge the MPCM. Moreover, the placement of the MPCM tubes limited their direct thermal contact with the airflow, further reducing the rate of heat exchange during discharge. A sensitivity analysis varying PCM volume, positioning, and melting point would, therefore, be valuable to quantify these effects and identify conditions under which the MPCM could deliver a more significant contribution to drying performance, particularly in thicker product layers where uniform heat penetration is more critical. Addressing these factors through systematic sensitivity analyses will guide future design optimization and integration strategies, including enhanced MPCM preheating and container placement, to maximize thermal storage benefits in practical drying applications.

4. Conclusions and Future Work

This study presented a numerical investigation of a solar dryer prototype enhanced with microencapsulated phase change material (MPCM), assessing its thermal behavior and drying performance for rice under tropical climatic conditions. The simulations included the following four configurations: a baseline dryer, a dryer with MPCM only, one with an auxiliary heater, and a hybrid system combining MPCM and auxiliary heating. While the inclusion of MPCM helped reduce temperature fluctuations and contributed to thermal buffering, its overall effect on drying performance was found to be marginal in the current dryer design.
The results indicated that although MPCM contributed to smoother temperature profiles and slightly improved moisture uniformity, particularly in thicker rice layers, its impact was not substantial enough to accelerate the drying process. One key limitation observed was that during nighttime or low-irradiance periods, the MPCM did not release sufficient stored thermal energy to maintain proper drying temperatures. This suggests that most of the solar energy available during the day was used to charge the MPCM, with limited thermal discharge occurring when it was most needed.
To address these limitations, improvements in the design and integration of the MPCM system are necessary. Enhancing thermal contact between the MPCM and the drying chamber air or product layer, optimizing the placement of MPCM containers, and increasing the overall MPCM volume could improve energy transfer efficiency. In addition, preheating the MPCM (either using the auxiliary heater or a separate thermal charging method) before the drying cycle starts may increase its effectiveness during periods without solar input.
Future work will include experimental validation of the numerical results and exploration of alternative MPCM configurations and charging strategies. A detailed sensitivity analysis is also needed to quantify the effects of MPCM volume, placement, and melting temperature on system performance, as well as to optimize the integration of MPCM with the dryer and product load. Further studies should evaluate the economic feasibility of such systems, investigate the performance across different crop types, and assess long-term reliability and scalability for rural or off-grid applications. These efforts aim to develop a more effective and energy-resilient solar drying system using thermal energy storage, while also expanding comparative analyses with validated solar dryer technologies to further support the numerical predictions.

Author Contributions

Conceptualization, I.H. and Y.S.; methodology, I.H.; software, I.H. and H.R.; formal analysis, I.H.; writing—original draft preparation, I.H.; writing—review and editing, Y.S., A.G. and E.C.; visualization, A.G.; supervision, Y.S.; project administration, Y.S.; funding acquisition, I.H. and Y.S. All authors have read and agreed to the published version of the manuscript.

Funding

This research was funded by Secretaria Nacional de Energia (SENACYT) from Panama, grant number APY-NI-2023A-39.

Institutional Review Board Statement

Not applicable.

Informed Consent Statement

Not applicable.

Data Availability Statement

The original contributions presented in this study are included in the article. Further inquiries can be directed to the corresponding authors.

Acknowledgments

Y.S. and E.C. acknowledge the support of Panama’s National Research System (SNI). H.R. acknowledges the support of Panama’s National Secretariat of Science, Technology, and Research (SENACYT) through its IFARHU- SENACYT Scholarship Program, Professional Excellence Scholarship subprogram. I.H. and Y.S. acknowledge the full financial support of SENACYT, grant number APY-NI-2023A-39. The authors also thank the Universidad Tecnológica de Panamá and the Centro de Estudios Multidisciplinarios en Ciencias, Ingeniería y Tecnología-AIP (CEMCIT-AIP) for their support. Finally, the authors thank Worcester Polytechnic Institute (WPI) and the Center for Advance Research in Drying (CARD) for their academic contribution and for facilitating knowledge exchange.

Conflicts of Interest

The authors declare no conflicts of interest.

Abbreviations

The following abbreviations are used in this manuscript:
MPCM             Microencapsulated Phase Change Material
PCMPhase Change Material
WBMCWet-Basis Moisture Content
CFDComputational Fluid Dynamics
RHRelative Humidity
PDEPartial Differential Equation
TPSTransient Plane Source
COMSOLCOMSOL Multiphysics (Simulation Software)
Nomenclature
Main Symbols
c p Specific heat capacity (J/kg·K)
CConstant
DDiffusivity (m2/s)
E a Activation energy for diffusion (J/mol)
FBody force (N)
G evap Evaporation rate ( kg/m 3 · s)
HEnthalpy (J/kg)
h m Convective mass transfer coefficient (m/s)
h T Convective heat transfer coefficient ( W/m 2 · K)
ISolar irradiance (W/m2)
I ˙ Rate of evaporation ( kg/m 3 · s)
kThermal conductivity (W/m·K)
L v Latent heat of vaporization (J/kg)
PPressure (Pa)
qHeat flux (W/m2)
Q evap Volumetric heat source term (W/m3)
Q h Internal heat source term (W/m3)
RUniversal gas constant (J/mol·K)
R H Relative humidity (%)
SSaturation
tTime (s)
TTemperature (K or °C)
θ Volumetric liquid water content
uAir velocity (m/s)
wMass fraction
XMoisture content (kg/kg dry basis)
Subscripts
0Initial condition
e f f Effective
e q Equilibrium condition
gGas phase
h e a t e r Heater
i n l e t Inlet condition
lLiquid phase
M P C M Microencapsulated phase change material
m a x Maximum value
m e a n Mean condition
m i n Minimum value
o u t l e t Outlet condition
sSolid phase
s o l a r Solar
vVapor phase
Ambient condition
Greek Letters  
γ Solid-phase fraction of the MPCM
β Liquid-phase fraction of the MPCM
κ Permeability (m2)
ρ Density (kg/m3)
τ Transmittance
θ Volumetric liquid water content
ε Porosity
μ Dynamic viscosity

References

  1. Asnaz, M.S.K.; Dolcek, A.O. Comparative performance study of different types of solar dryers towards sustainable agriculture. Energy Rep. 2021, 7, 6107–6118. [Google Scholar] [CrossRef]
  2. Venkatesh, R.; Sharma, P.; Subbarao, C.C.; Mohanavel, V.; Veerababu, K.; Jadhav, A.; Ravichandran, M.; Soudagar, M.E.M.; Alotaibi, M.A.; Sivanraju, R. Enhancement solar dryer performance and collector efficiency of paraffin PCM/copper fin featured solar dryer. Sci. Rep. 2025, 15, 31746. [Google Scholar] [CrossRef]
  3. Jain, A.; Kumar, A.; Shukla, A.; Sharma, A. Development of Phase Change Materials (PCMs) for Solar Drying Systems. In Solar Drying Technology; Springer: Berlin/Heidelberg, Germany, 2017. [Google Scholar] [CrossRef]
  4. Kumar, K.S.; Vasanthi, R.; Jaafar, M.S.; Munimathan, A.; Shanmugam, M.K.; Alwetaishi, M.; Afzal, A.; Rajendran, P.; Lee, I.E. Experimental and exergy evaluation of a PCM integrated active indirect solar dryer for Turkey berries with economic and environmental assessment. Sci. Rep. 2025, 15, 21661. [Google Scholar] [CrossRef] [PubMed]
  5. Drissi, S.; Ling, T.C.; Mo, K.H.; Eddhahak, A. A review of microencapsulated and composite phase change materials: Alteration of strength and thermal properties of cement-based materials. Renew. Sustain. Energy Rev. 2019, 110, 467–484. [Google Scholar] [CrossRef]
  6. Harris, I.; James Rivas, A.; Ortega Del Rosario, M.D.L.A.; Saghir, M.Z. Recent developments in phase change material-based solar water heating systems: Insights on research trends and opportunities. Int. J. Thermofluids 2023, 20, 100359. [Google Scholar] [CrossRef]
  7. Gupta, A.; Shukla, S.; Srivastava, A. Analysis of solar drying unit with phase change material storage systems. Int. J. Agil. Syst. Manag. 2013, 6, 164. [Google Scholar] [CrossRef]
  8. Thanompongchart, P.; Pintana, P.; Tippayawong, N. Improving solar dryer performance with automatic control of auxiliary heated air. Energy Rep. 2023, 9, 109–113. [Google Scholar] [CrossRef]
  9. El-Sebaii, A.A.; Shalaby, S.M. Experimental Investigation of Drying Thymus Cut Leaves in Indirect Solar Dryer With Phase Change Material. J. Sol. Energy Eng. 2017, 139, 061011. [Google Scholar] [CrossRef]
  10. Kant, K.; Shukla, A.; Sharma, A.; Kumar, A.; Jain, A. Thermal energy storage based solar drying systems: A review. Innov. Food Sci. Emerg. Technol. 2016, 34, 86–99. [Google Scholar] [CrossRef]
  11. Iranmanesh, M.; Samimi Akhijahani, H.; Barghi Jahromi, M.S. CFD modeling and evaluation the performance of a solar cabinet dryer equipped with evacuated tube solar collector and thermal storage system. Renew. Energy 2020, 145, 1192–1213. [Google Scholar] [CrossRef]
  12. Aumporn, O.; Zeghmati, B.; Chesneau, X.; Janjai, S. Numerical study of a solar greenhouse dryer with a phase-change material as an energy storage medium. Heat Transf. Res. 2018, 49, 509–528. [Google Scholar] [CrossRef]
  13. Venkateswarlu, K.; Reddy, S.V.K. Recent trends on energy-efficient solar dryers for food and agricultural products drying: A review. Waste Dispos. Sustain. Energy 2024, 6, 335–353. [Google Scholar] [CrossRef]
  14. Sadaka, S. Determination of short-grain rough rice drying kinetics under isothermal conditions using an integrated model. BioResources 2022, 17, 4001–4017. [Google Scholar] [CrossRef]
  15. Iguaz, A.; San Martin, M.B.; Arroqui, C.; Fernandez, T.; Mate, J.I.; Virseda, P. Thermophysical properties of medium grain rough rice (LIDO cultivar) at medium and low temperatures. Eur. Food Res. Technol. 2003, 217, 224–229. [Google Scholar] [CrossRef]
  16. Li, J.; Chang, K.; Yin, J.; Jin, Y.; Yi, X.; Zhang, Z.; He, Y.; Yang, Q.; Tang, Z.; Liu, X.; et al. Study on Optimization of Rice-Drying Process Parameters and Directional Regulation of Nutrient Quality. Appl. Sci. 2024, 14, 10825. [Google Scholar] [CrossRef]
  17. Li, B.; Feng, S.; He, Q.; Zhu, Y.; Hu, Z.; Jiang, Y.; Su, L. Numerical simulation of rice drying process in a deep bed under an angular air duct. J. Food Process. Eng. 2023, 46, e14438. [Google Scholar] [CrossRef]
  18. Naghavi, Z.; Moheb, A.; Ziaei-rad, S. Numerical simulation of rough rice drying in a deep-bed dryer using non-equilibrium model. Energy Convers. Manag. 2010, 51, 258–264. [Google Scholar] [CrossRef]
  19. Sadaka, S. Impact of grain layer thickness on rough rice drying kinetics parameters. Case Stud. Therm. Eng. 2022, 35, 102026. [Google Scholar] [CrossRef]
  20. Müller, A.; Nunes, M.T.; Maldaner, V.; Coradi, P.C.; Moraes, R.S.D.; Martens, S.; Leal, A.F.; Pereira, V.F.; Marin, C.K. Rice Drying, Storage and Processing: Effects of Post-Harvest Operations on Grain Quality. Rice Sci. 2022, 29, 16–30. [Google Scholar] [CrossRef]
  21. Zhang, N.; Yin, S.Y.; Yang, H.H. Transient performance of coupled heat and mass transfer in cross-flow hollow fiber membrane module for air dehumidification. Int. J. Refrig. 2019, 108, 190–199. [Google Scholar] [CrossRef]
  22. Nguyen, Q.B.; Nai, M.L.S.; Zhu, Z.; Sun, C.N.; Wei, J.; Zhou, W. Characteristics of Inconel Powders for Powder-Bed Additive Manufacturing. Engineering 2017, 3, 695–700. [Google Scholar] [CrossRef]
  23. ASTM B527-24; Test Method for Tap Density of Metal Powders and Compounds. ASTM International: Conshohocken, PA, USA, 2023. Available online: http://www.astm.org/cgi-bin/resolver.cgi?B527-24 (accessed on 10 October 2025). [CrossRef]
  24. Basunia, M.; Abe, T. Moisture adsorption isotherms of rough rice. J. Food Eng. 1999, 42, 235–242. [Google Scholar] [CrossRef]
  25. Steffe, J.F.; Singh, R.P. Note on Volumetric Reduction of Short Grain Rice During Drying. Cereal Chem. 1979, 2, 148–150. [Google Scholar]
  26. Prakash, B.; Pan, Z. Effect of Geometry of Rice Kernels on Drying Modeling Results. Dry. Technol. 2012, 30, 801–807. [Google Scholar] [CrossRef]
  27. Lakhdar, B.; Salaheddine, A.; Brahim, M.; Mohamed, D. Exergetic analysis and optimization of a flat plate solar collector. J. Biodivers. Environ. Sci. 2019, 14, 1–12. [Google Scholar]
  28. Nierode, D.E. The Cyclical Sine Model Explanation for Climate Change. Int. J. Plant Anim. Environ. Sci. 2022, 12, 175–191. [Google Scholar] [CrossRef]
  29. Du, J.; Lin, Y.; Gao, Y.; Tian, Y.; Zhang, J.; Fang, G. Nutritional changes and early warning of moldy rice under different relative humidity and storage temperature. Foods 2022, 11, 185. [Google Scholar] [CrossRef] [PubMed]
  30. Salvatierra-Rojas, A.; Ramaj, I.; Romuli, S.; Müller, J. CFD-Simulink Modeling of the Inflatable Solar Dryer for Drying Paddy Rice. Appl. Sci. 2021, 11, 3118. [Google Scholar] [CrossRef]
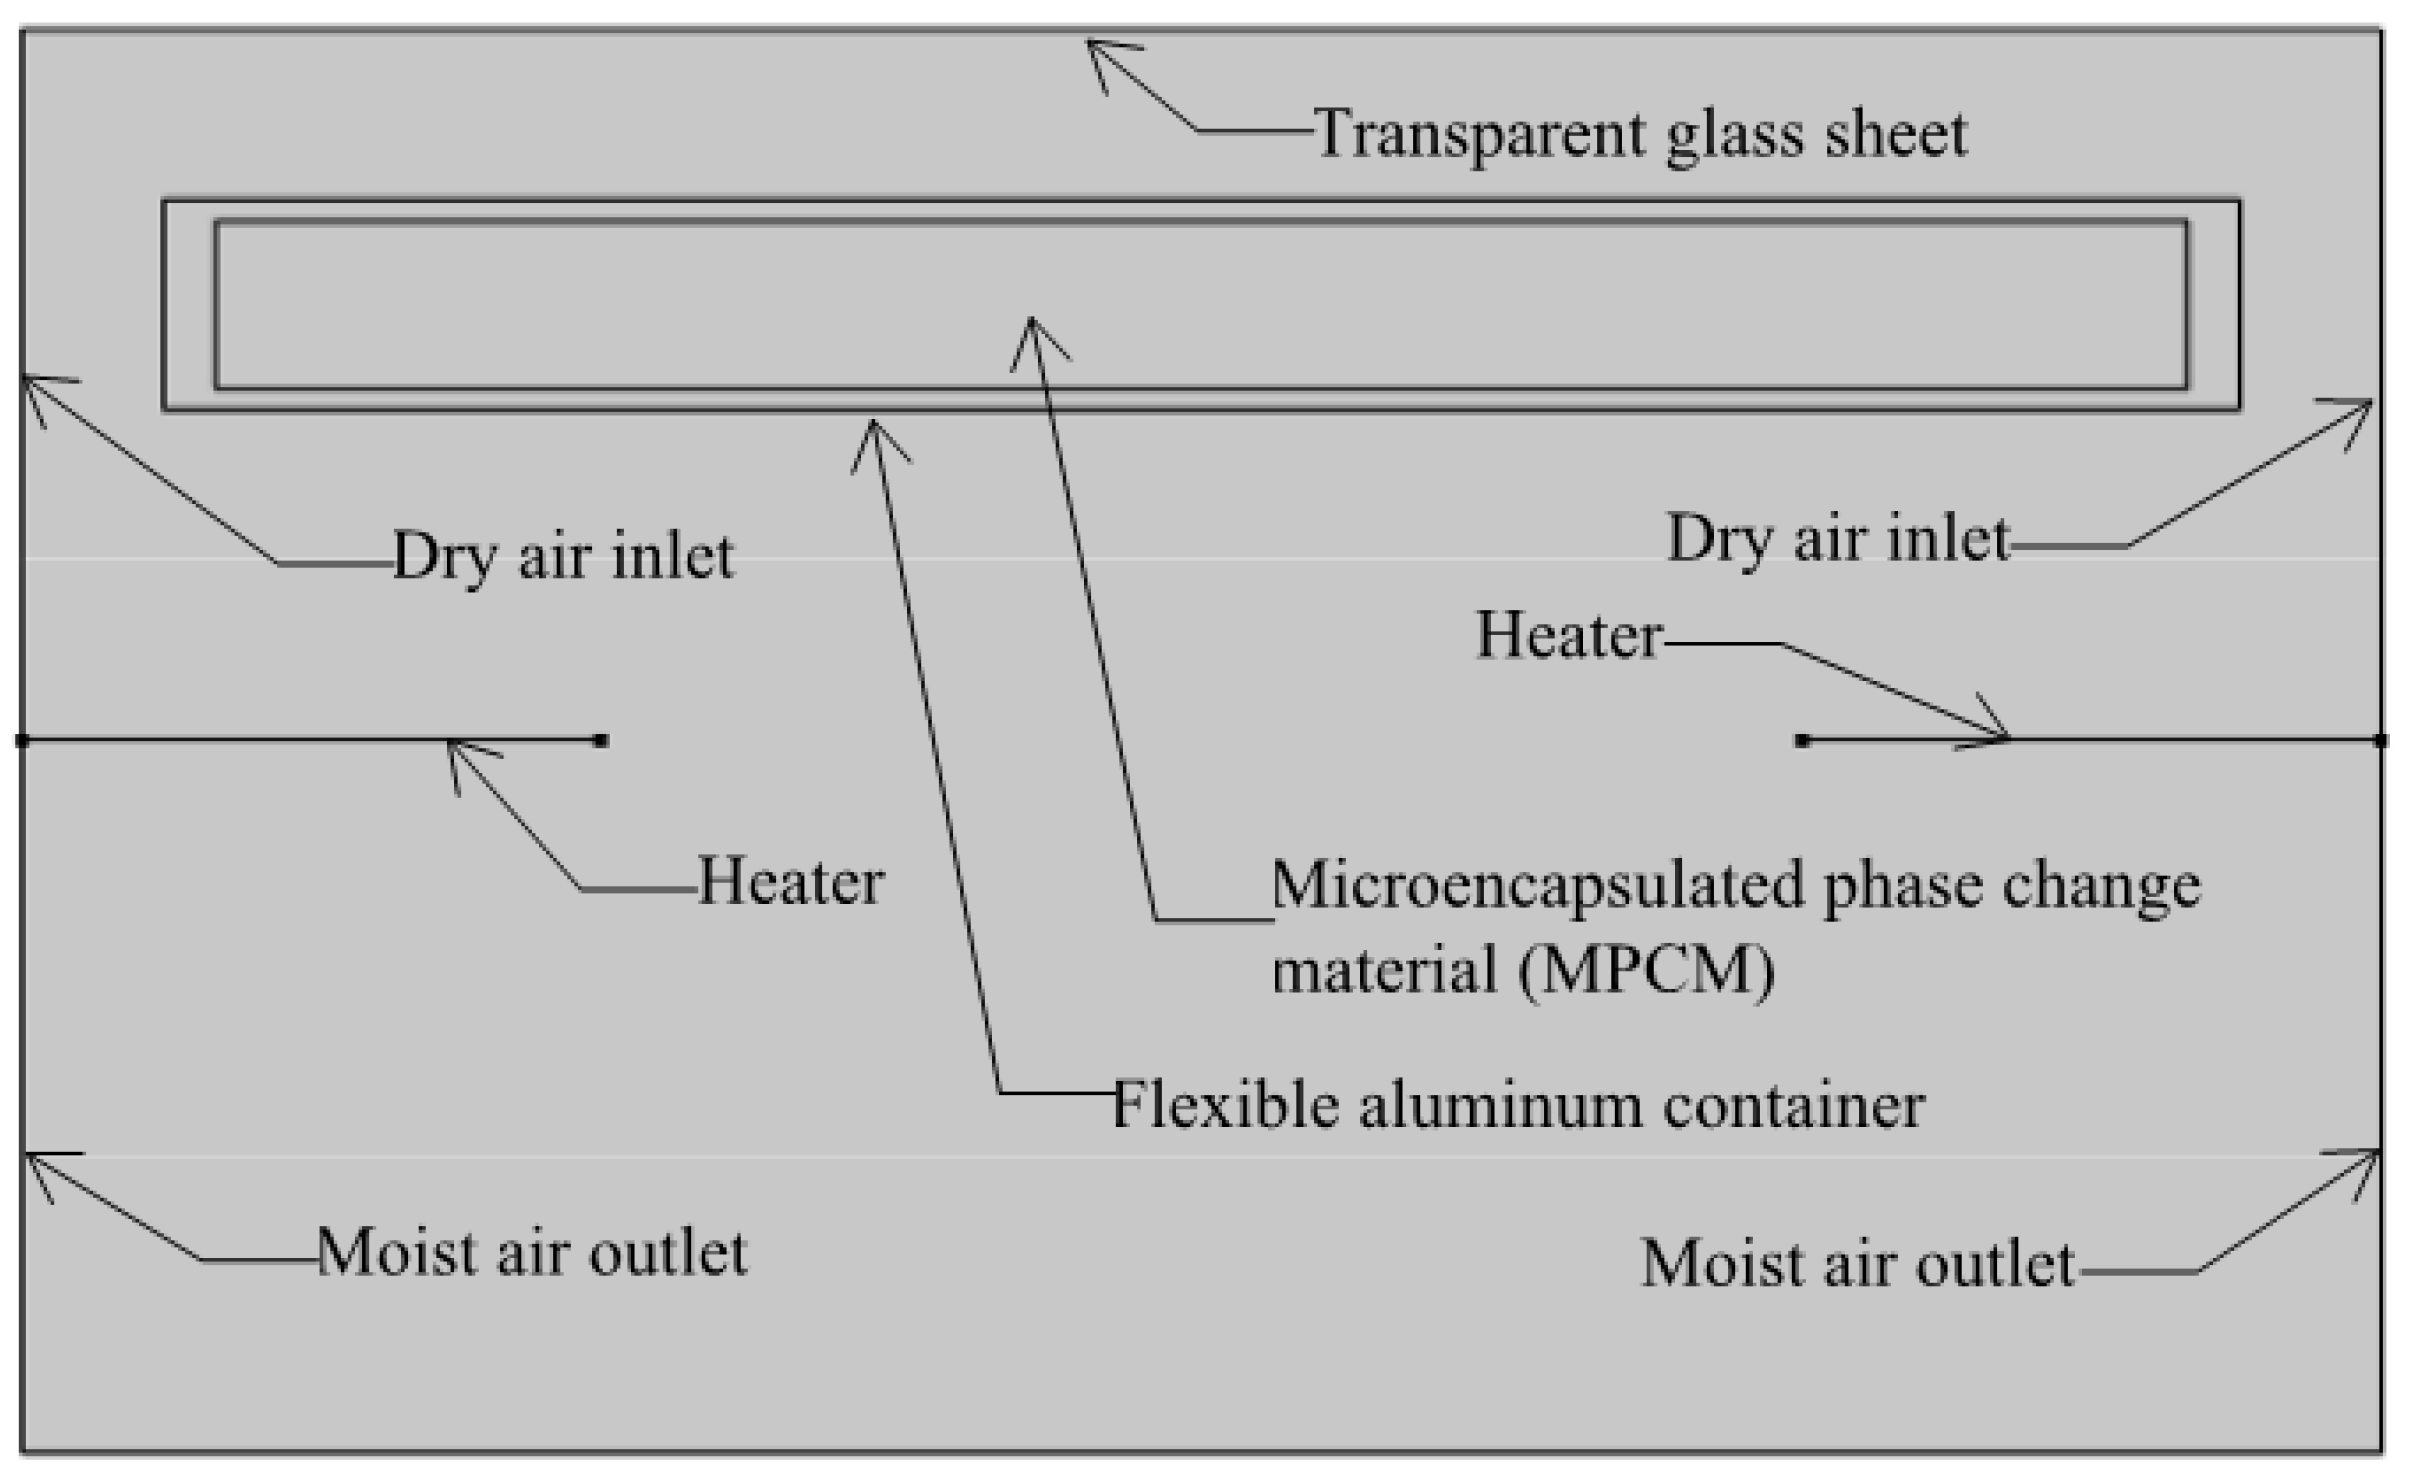
Figure 1. Schematic of the solar dryer with MPCM and auxiliary heater.
Energies 18 05427 g001
Figure 2. Three-dimensional model of the solar dryer prototype.
Energies 18 05427 g002
Figure 3. Volumetric heat capacity of the MPCM, Thermoball 35 from Insilico®.
Energies 18 05427 g003
Figure 4. Sorption isotherm at 40 °C from the modified Chung–Pfost equation [24].
Energies 18 05427 g004
Figure 5. Schematic representation of boundary surfaces.
Energies 18 05427 g005
Figure 6. Solar irradiance measured for three days in Las Tablas, Los Santos, Panama (March, 2021).
Energies 18 05427 g006
Figure 7. Mesh and time step independency analysis based on maximum relative error based on temperature at the center of the rice bed.
Energies 18 05427 g007
Figure 8. Schematic of the solar dryer with MPCM and auxiliary heater and the location of points of interest in this study.
Energies 18 05427 g008
Figure 9. Temperature profile over time in points of interest for the four cases considered in this study.
Energies 18 05427 g009
Figure 10. Air velocity and temperature profiles at 12 h in the solar dryer with MPCM and a rice layer thickness of 25 mm.
Energies 18 05427 g010aEnergies 18 05427 g010b
Figure 11. WBMC distribution in the rice layer with the 25 and 45 mm at 12 h in the solar dryer with and without MPCM and the heater.
Energies 18 05427 g011
Figure 12. Average wet-basis moisture content vs. time of the rice layers in the dryer with and without MPCM, considering 25 mm and 45 mm layer thicknesses.
Energies 18 05427 g012
Figure 13. Average temperature vs. time for the different cases considered in this study.
Energies 18 05427 g013
Figure 14. Average solid phase fraction of the MPCM vs. time for the cases with and without product and heater.
Energies 18 05427 g014
Table 1. Dimensions of the solar dryer prototype.
NameValueDescription
L e (m) 0.43 Dryer length
H e (m) 0.26 Dryer height
d tube (m) 0.0381 Diameter of MPCM tube
a n (m) 0.25 Dryer width
Table 2. Boundary and initial conditions.
SurfaceDescriptionThermal B.C.
(BC)Glass cover k   T n = q solar + h T   ( T ext T )
(AD)Insulated base k   T n = 0
(BE, CH)Inlets T inlet ( t )
(AE, DH)Outlets T outlet ( t ) = T ( t )
Initial dryer temperature T = 293.15   K ; 20 °C
Initial air velocity u i ( 0 ) = 0   m / s
Table 3. Critical points by configuration: extreme temperatures, thermal amplitude (heater ON), and moisture reduction 0–48 h.
Case T min (°C) T max (°C) Δ T (°C) WBMC reduction , 0 48 h (%)
25 mm—Heater only20.0039.2119.2175.0
25 mm—Heater + MPCM20.0030.3010.3173.9
45 mm—Heater only20.0038.8218.8269.8
45 mm—Heater + MPCM20.0030.1810.1869.1
Disclaimer/Publisher’s Note: The statements, opinions and data contained in all publications are solely those of the individual author(s) and contributor(s) and not of MDPI and/or the editor(s). MDPI and/or the editor(s) disclaim responsibility for any injury to people or property resulting from any ideas, methods, instructions or products referred to in the content.