Article

Improved Polar Lights Optimizer Based Optimal Power Flow for ADNs with Renewable Energy and EVs

1
Yunnan Power Grid Co., Ltd., Kunming Power Supply Bureau, Kunming 650000, China
2
Yunnan Power Dispatching and Control Center, Kunming 650000, China
3
Faculty of Electric Power Engineering, Kunming University of Science and Technology, Kunming 650500, China
*
Author to whom correspondence should be addressed.
Energies 2025, 18(20), 5403; https://doi.org/10.3390/en18205403
Submission received: 15 September 2025 / Revised: 5 October 2025 / Accepted: 11 October 2025 / Published: 14 October 2025
(This article belongs to the Special Issue Energy, Electrical and Power Engineering: 5th Edition)

Abstract

With the large-scale integration of renewable energy sources such as wind and photovoltaic (PV) power, along with the increasing use of electric vehicle (EV), the operation of active distribution network (ADN) faces challenges, including bidirectional power flows, voltage fluctuations, and increased network losses. To address these issues, this study develops a multi-objective optimal power flow (MOOPF) model that simultaneously considers wind and PV generation, battery energy storage systems (BESSs), and EV charging loads. The proposed model aims to simultaneously optimize operating cost, node voltage deviation, and network losses, while ensuring voltage quality and system reliability. An improved polar lights optimizer (IPLO) is introduced to solve the MOOPF problem, enhancing global search capability and convergence efficiency without increasing computational complexity. Simulation results on the improved IEEE-33 bus test system show that compared with conventional algorithms such as GA, ABC, PSO and WOA, the IPLO optimizer achieves superior performance. Specifically, IPLO significantly reduces voltage deviation and network losses, while maintaining an average voltage level close to unity, thereby improving both voltage quality and energy efficiency. Furthermore, when compared with the original PLO, IPLO also demonstrates a reduction in operating cost. These results validate the effectiveness and applicability of the proposed IPLO-based MOOPF framework in ADNs with high use of renewable energy and EVs.

1. Introduction

In recent years, with the accelerating global energy transition, the integration of renewable energy sources, such as wind and photovoltaic (PV) power, in active distribution network (ADN) has increased [1,2,3]. In certain regions, the installed capacity of distributed PV and wind turbine (WT) already accounts for more than 30% of the total installed capacity of the ADN, and this proportion is expected to further increase in the future [4,5]. Meanwhile, the rapid growth in the number of electric vehicles (EVs) has significantly altered the load characteristics of ADN [6]. On one hand, the intermittency and variability of renewable energy introduce new challenges to power flow distribution, voltage stability, and operational scheduling in ADN [7]. On the other hand, large-scale concentrated or randomly distributed EV charging loads can lead to increased peak demand at local nodes, higher network losses, and voltage violation issues [8]. Moreover, the peak output of renewable energy generation often does not coincide with the peak charging demand of EVs, making supply–demand coordination more challenging. These factors render traditional ADN scheduling strategies insufficient to simultaneously ensure security, economic efficiency, and operational performance under the deep integration of high-penetration renewable energy and electric transportation [9,10,11,12].
Optimal power flow (OPF) is an optimization approach that, under the constraints of system operation, adjusts controllable variables to achieve a single objective such as improving economic efficiency, reducing network losses, or enhancing system security [13]. However, with the large-scale integration of distributed energy resources, energy storage systems, and EVs, the operational objectives of ADN have become increasingly diversified, and a single-objective OPF is no longer sufficient to comprehensively capture the requirements of operational optimization [14]. To address this issue, researchers have proposed multi-objective optimal power flow (MOOPF), which extends the conventional OPF by incorporating multiple optimization objectives and solving for the Pareto-optimal solution set, using multi-objective optimization algorithms. This approach provides decision makers with scheduling strategies that balance trade-offs among different objectives [15,16].
In the context of ADN operational optimization, MOOPF can simultaneously account for economic efficiency, reliability, and power quality while satisfying constraints on power flows, voltages, and branch capacities. In existing studies, for instance Reference [17] points out that the traditional OPF problems are often focused on thermal generators, with other distributed energy sources and emerging load factors frequently overlooked. It further proposes a memory-guided Jaya algorithm for solving MOOPF; however, this approach does not incorporate energy storage systems or EV loads. Reference [18] employs an improved multi-objective hummingbird algorithm to solve the OPF problem of power systems, integrating renewable energy and plug-in hybrid EVs. However, it does not conduct an in-depth modeling of the charging load characteristics of pure EVs. Moreover, most existing studies still exhibit limitations in modeling the temporal characteristics of loads and renewable energy, and their cost models often lack a systematic consideration of energy storage degradation and operation and maintenance costs.
To address the above issues, this study proposes a dynamic optimization framework for ADNs based on the improved polar lights optimizer (IPLO) algorithm [19]. This work focuses on enhancing the original PLO by introducing barycenter-guided search and dynamically adaptive damping factors, thereby improving its convergence stability and solution diversity from a methodological perspective. On this basis, the proposed IPLO is applied to a MOOPF model of distribution networks, which comprehensively considers the stochastic outputs of wind and PV generation, seasonal charging patterns of EVs, battery energy storage systems (BESS), and demand response mechanisms [20,21,22]. The optimization objectives in this study are strictly limited to node voltage deviations and system operating costs. Other indicators are reported as auxiliary comparison results to provide a more comprehensive evaluation of the optimization performance. This design demonstrates both the methodological advancements of the IPLO and its practical effectiveness in ensuring economic efficiency and operational security of ADNs under multi-scenario conditions.
In terms of load modeling, to more realistically capture the temporal characteristics and seasonal variations of EV charging demand, in this study, we used one year of measured charging load data from a site located in a core city in southern China [23]. The K-shape clustering algorithm was applied to identify representative load patterns, classifying them into four typical daily charging load curves corresponding to spring, summer, autumn, and winter [24]. These clustered load profiles were subsequently treated as fixed inputs to the MOOPF model. This method not only preserves the representative fluctuation characteristics of charging demand across different seasons but also reduces the computational complexity of multi-period optimization, thereby improving computational efficiency without sacrificing accuracy. The resulting typical daily curves were directly used as EV load inputs in the MOOPF model, providing more practical and representative load data support for multi-objective optimization.
The remainder of this paper is organized as follows: Section 2 presents the modeling of the ADN and the formulation of the MOOPF model. Section 3 describes the IPLO algorithm and solution approach. Section 4 provides case studies and result analysis. Section 5 summarizes the whole paper and proposes future research directions.

2. Methodology

2.1. K-Shape Clustering

K-shape is an unsupervised clustering algorithm specifically designed for time series, derived from K-means but enhanced to preserve shape similarity [25,26]. Its core lies in two improvements: translation-invariant distance measurement and optimized centroid update. Compared with methods such as DTW-k-Means and elastic k-Means, K-shape provides a better balance between computational efficiency and clustering accuracy. It maintains relatively low computational cost and produces stable centroids even under phase-shifted load patterns, making it particularly suitable for extracting representative seasonal EV charging demand profiles. The K-shape algorithm consists of the following two key components:
(1) Shape-based distance (SBD) calculation: The similarity between two time series x and y is measured using the SBD, which is derived from the normalized cross-correlation (NCC) and ensures translation invariance. The SBD is defined as the following [27]:
S B D x , y = 1 max s N C C w x , y N C C w x , y = C C w x , y V 0 ( x , x ) × V 0 ( y , y )
where S B D [ 0 ,   2 ] , and a smaller value indicates a higher degree of shape similarity between the two sequences, and C C w x , y is a method for measuring the correlation between two time series. The sequence alignment process in SBD is depicted in Figure 1.
(2) Centroid update based on similarity optimization: Unlike K-means which computes the centroid as a pointwise average, K-shape formulates centroid computation as an optimization problem to maximize shape similarity [28]:
μ k * = a r g max μ k x D k max s N C C w x , y 2
where D k denotes the sample set of the k -th cluster and μ k represents the optimal centroid. The centroid obtained through this method maximizes the shape similarity with all sequences within the cluster.

2.2. Demand Response Modeling

When the output of distributed wind and PV generation does not match real-time load demand, the system must rely on the main grid to supplement the required power, which may lead to increased operating costs and higher peak loads. For ADN with significant penetration of distributed resources, the demand response uses price signals to steer user consumption behavior, thereby mitigating the impact of renewable energy fluctuations on the system and enhancing operational flexibility. To this end, a time-of-use pricing strategy was introduced, dividing a day into peak, flat, and off-peak periods. Based on the baseline electricity price, differentiated price coefficients were applied to encourage load shifting to off-peak periods, thereby reducing the peak-to-valley load difference [29]. In this study, a three-period time-of-use (TOU) pricing scheme was adopted as a simplified yet widely applied demand response approach. This choice represents a trade-off between model accuracy and computational complexity, while aligning with the study’s objective of guiding BESS charging and discharging behavior, as shown below:
λ p ( t ) = λ 0 ( 1 + α 1 ) , t T p λ f ( t ) = λ 0 ( 1 + α 2 ) , t T f λ v ( t ) = λ 0 ( 1 + α 3 ) , t T v
where λ p ( t ) , λ f ( t )   λ v ( t ) denote the electricity prices corresponding to the peak, flat, and off-peak periods. λ 0 is the baseline electricity price, α 1 , α 2 and α 3 are the price adjustment coefficients for each period, and T p , T f and T v represent the peak, flat, and off-peak time periods, respectively.
TOU was adopted in this study for two main reasons: (1) it is a mature and widely implemented DR mechanism in real-world power systems, ensuring practical feasibility and representativeness; and (2) its straightforward structure, relying on clearly defined time intervals and price levels, simplifies the modeling process while retaining interpretability, thus making it suitable for integration with the proposed optimization framework.
To characterize the dynamic impact of price signals on user loads, this study introduced an electricity–price coupling elasticity matrix model to describe the price response characteristics of multi-period loads. This model can simultaneously capture the influence of price fluctuations in the current period on immediate electricity consumption behavior, as well as account for inter-period price linkage effects, thereby forming a multidimensional coupled load response mechanism [30]. The variation in user electricity consumption can be expressed as a function of the price changes in both the current and related periods, as follows:
P j = P 0 , j · z { p , f , v } k z z · λ z λ 0
where P z and P 0 , j and P j denote the baseline electricity consumption and its variation for period j { p , f , v } , λ 0 and λ z represent the baseline electricity price and its variation for period z { p , f , v } , and k j z is the element of the demand price elasticity coefficient matrix K . The demand price elasticity coefficient matrix K is given as follows [31]:
K = k p p k p f k p v k f p k f f k f v k v p k v f k v v
where the diagonal element k z z represents the self-elasticity coefficient for period z , reflecting the sensitivity of the load in that period to changes in its own electricity price. The matrix is derived from representative studies that are widely adopted in demand response research. These coefficients reflect the average elasticity levels observed under practical operating conditions.

2.3. The BESS Modeling

Within the dynamic optimization framework of the ADN, the BESS is primarily employed to mitigate the output fluctuations of renewable energy sources and to reduce the peak-to-valley load difference, thereby lowering system operating costs and enhancing operational security margins [32,33]. Given that the EV charging loads in this study were fixed through clustering, the scheduling of the BESS mainly focused on regulating the power balance between renewable energy output and the baseline load. The charging and discharging process of the BESS can be expressed as the following [34]:
E B E S S t = E B E S S t 1 + P c h , B E S S t Δ t η c h ,       charing E B E S S t = E B E S S t 1 + P d i s , B E S S ( t ) Δ t η d i s ,       discharing
where E B E S S t denote the stored energy at time t , P c h , B E S S ( t ) and P d i s , B E S S ( t ) represent the charging and discharging power, η c h and η d i s are the charging and discharging efficiencies, and Δ t is the dispatch interval.
To facilitate scheduling optimization, the state of charge (SOC) of the BESS is introduced to characterize its capacity utilization. The dynamic variation of SOC can be modeled as:
S O C B E S S t = S O C B E S S t 1 + P c h , B E S S t Δ t η c h E B E S S , r a t e ,       charing S O C B E S S t = S O C B E S S t 1 P d i s , B E S S ( t ) Δ t E B E S S , r a t e η d i s ,       discharing
where, S O C B E S S t is defined as the ratio of the stored energy to the rated capacity at time t , E B E S S , r a t e denote the rated capacity of BESS.

2.4. Optimazation Model

The optimization model developed in this study is built upon the MOOPF framework and jointly optimizes the siting, capacity allocation, and operational strategies of multiple distributed BESSs, considering the output of distributed renewable energy sources and the charging loads of EVs.
The first optimization objective is to minimize the life cycle cost (LCC) of the BESS, with its annualized expression given by:
m i n F 1 = C I , B E S S + C M , B E S S + C O , B E S S + C R , B E S S T L
C I , B E S S = μ C R F , B E S S i = 1 N B E S S ( c b a E B E S S , i + c i n P B E S S , i ) C M , B E S S = μ C R F , B E S S ( ϵ M , b a c b a E B E S S , i + ϵ M , i n c i n P B E S S , i ) C O , B E S S = n t = 1 T a [ λ s e l l P c h , B E S S t λ p u r ( t ) P d i , B E S S t ] C R , B E S S = μ C R F , B E S S r = 1 R b a ( 1 δ B E S S ) t b a r ( 1 + d ) t b a r
μ C R F , B E S S = d ( 1 + d ) l B E S S 1 + d
where C I , B E S S is the initial investment cost of the BESS, C M , B E S S is the maintenance cost of the BESS, C O , B E S S is the operating cost of the BESS, and C R , B E S S is the replacement cost of the BESS. T L is the depreciation period, which was set to 15 years in this study. c b a and c i n represent the unit cost of the battery and the cost of the converter, respectively. E B E S S , i and P B E S S , i denote the rated capacity and the rated charging and discharging power of the i -th BESS, respectively. N B E S S represents the total number of installed BESS units, ϵ M , b a and ϵ M , i n are the proportions of maintenance costs for the battery and the converter relative to their initial investment, λ s e l l and λ p u r are the electricity selling price to the grid and the purchasing price from the grid. R b a is the number of battery replacements, t b a is the time for a single battery replacement, and δ B E S S represents the battery cost reduction rate. d is the discount rate, l B E S S is the designed service life of the BESS. The second optimization objective is to minimize the root mean square of voltage deviations at system nodes, thereby ensuring that the power quality of the ADN complies with operational standards:
m i n F 2 = 1 N n T d n = 1 N n t = 1 T d ( U n t U ¯ n )
where N n denotes the number of nodes in the ADN, T d represents the time periods of a typical day, which is set to 24 h in this model, U n t denotes the actual voltage at node n at time t , and U ¯ n represents the nominal voltage at node n .
The constructed MOOPF model for the ADN must satisfy the following constraints to ensure solution feasibility and operational security. The system power balance constraint is expressed as follows:
P l o a d t = P g r i d t + P B E S S t + P P V t + P W T t P l o a d t = P b a s e t + P E V t
where P l o a d denotes the total load power of the ADN, P b a s e t is the baseline load power of the ADN, P E V t is the charging load power of EVs, P g r i d t is the power imported from the external grid, P B E S S t represent the power output or input of BESS, and P P V t and P W T t represent the output power of PV and WT, respectively.
The BESS must satisfy the following operational constraints:
0 P c h , B E S S t P c h , B E S S m a x 0 P d i s , B E S S t P d i s , B E S S m a x P c h , B E S S t · P d i s , B E S S t = 0
where, P c h , B E S S m a x and P d i s , B E S S m a x represent the upper bounds of charging and discharging power, respectively.
The SOC constraint is expressed as follows:
S O C B E S S m i n S O C B E S S t S O C B E S S m a x
where S O C B E S S m i n and S O C B E S S m a x are the lower and upper bounds of SOC values.
The node voltage constraint is expressed as follows:
U m i n U n ( t ) U m a x
where U m i n and U m a x denote the lower and upper limits of the nominal voltage, respectively.

3. Model Solution Based on Polar Lights Optimizer

3.1. Polar Lights Optimizer

The PLO algorithm is a novel meta-heuristic optimization method proposed in 2024, inspired by the natural phenomenon of aurora or polar lights [35]. Polar lights are formed when particles from the solar wind, guided by the Earth’s magnetic field, collide with gas molecules in the atmosphere. It abstracts three physical processes of particles—gyration, oval walk, and chaotic collision—to balance global exploration and local exploitation in the search domain. Gyration distributes solutions uniformly and avoids premature convergence. Oval walk enhances neighborhood search through irregular perturbations. Chaotic collision increases population diversity and prevents local stagnation.

3.1.1. Gyration Motion

The Sun emits streams of high-energy particles that, under Lorentz forces, revolve along magnetic field lines and form helical trajectories. This gyration ensures a uniform spread of solutions but is subject to energy dissipation due to atmospheric damping. To capture this effect, a damping factor was introduced into the motion equation, reflecting the gradual velocity decay over time. The velocity variation under geomagnetic and damping effects can be expressed as follows:
v t = C e q B α m t
where v denotes the velocity component generated during the gyration of a particle, C is the integration constant, C = 1 , B represents the intensity of the Earth’s magnetic field, B = 1 , q and m denote the electric charge and the mass of the charged particle, q = 1 , m = 100 , t denotes the number of iterations, and α is the damping factor, α ϵ [ 1 , 1.5 ] .

3.1.2. Aurora Oval Walk

Geomagnetic activity and atmospheric effects cause the auroral oval boundary to contract toward the poles and expand toward the equator, driving particles to migrate between regions and producing spatial displacements. This continuous variation induces cross-regional motions with strong randomness and chaotic characteristics, providing a natural basis for simulating global search. In the algorithm, this mechanism introduces unpredictable perturbations that allow candidate solutions to escape local optima and enhance global exploration. The auroral oval walk is modeled through Lévy flights, which reproduce the irregular disturbances caused by boundary contraction at the poles and expansion at the equator. The process can be expressed as [36]:
A o = L e v y d × X a v g j X i , j + L B + r 1 × U B L B 2 X a v g = 1 N × i = 1 N X i L e v y d d 1 β ,       0 < β 2
where L e v y d denotes a random number following the Lévy distribution, X a v g is the centroid position of the high-energy particle swarm, X i , j is the current position of the high-energy particle, and X a v g j X i , j represents the movement tendency of the particle, r 1 is a random number uniformly distributed in the interval [ 0 ,   1 ] , β is a key Lévy flight index that adjusts stability, d denotes the step size, and U B and L B denote the upper and lower bounds of the solution space, respectively.
Based on the gyration motion of particles and the auroral elliptical wandering, the updated position of each particle can be expressed as:
X n e w i , j = X i , j + r 2 × ( W 1 × v t + W 2 × A o )
where r 2 is a random number uniformly, r 2 [ 0 , 1 ] , W 1 and W 2 are the weighting coefficients corresponding to the gyration motion and auroral elliptical wandering of the particles, respectively. Their calculation is given as follows:
W 1 = 2 1 + e 2 ( t / t m a x ) 4 1 W 2 = e ( 2 t / t m a x ) 3
where t m a x denotes the maximum number of iterations of the algorithm.

3.1.3. Particle Collision

High-energy particles guided by the solar wind often collide along magnetic field lines, altering their motion and enhancing auroral complexity. Inspired by this, PLO employs a chaotic collision mechanism in which particles may randomly deviate and collide at uncertain angles, generating new solutions. This increases diversity and prevents premature convergence. The formulation is given as follows [37]:
X n e w i , j = X i , j + sin r 3 × π × X i , j X a , j ,       r 4 < K   a n d   r 5 < 0.05
K = ( t / t m a x )
where X a , j represents any particle in the swarm. K denotes the collision probability, which increases progressively as the algorithm iterations proceed, reflecting the growing frequency of particle collisions. r 3 , r 4 and r 5 are independent random variables distributed in the interval [0, 1].

3.2. Improved Polar Lights Optimizer

3.2.1. Barycenter-Guided Oval Walk

The original PLO algorithm exhibits certain limitations in its oval walk strategy. Specifically, the original formulation employs the population arithmetic mean X a v g as the global guiding point. This approach neglects the quality differences among individuals, as the search direction is solely determined by the arithmetic average of all solutions. Consequently, inferior individuals may interfere with the guidance process, leading to reduced convergence speed and compromised optimization accuracy.
To address this drawback, this study is the first to propose the concept of a barycenter-guided oval walk in the context of PLO optimization. This approach introduces the concept of a barycenter, in which the nondominated rank and crowding distance are incorporated as weighting factors to comprehensively characterize both the quality and distribution of individuals. Compared with the traditional centroid, the barycenter not only reflects the dominant role of high-quality solutions within the population but also preserves solution diversity, thereby facilitating the guidance of the population toward promising regions of the search space. The improved aurora-inspired oval walk formula can be expressed as the following:
A o = L e v y d × X b a r y j X i , j + L B + r 1 × U B L B 2
where X b a r y denotes the barycenter position, calculated by the following weighted formulation:
X b a r y = i = 1 N ω i X i ω i = η · 1 1 + r a n k i + ( 1 η ) · c d i m a x ( c d )
where r a n k i represents the nondominated rank of the i -th individual, c d i is the crowding distance, and η is balance parameter.
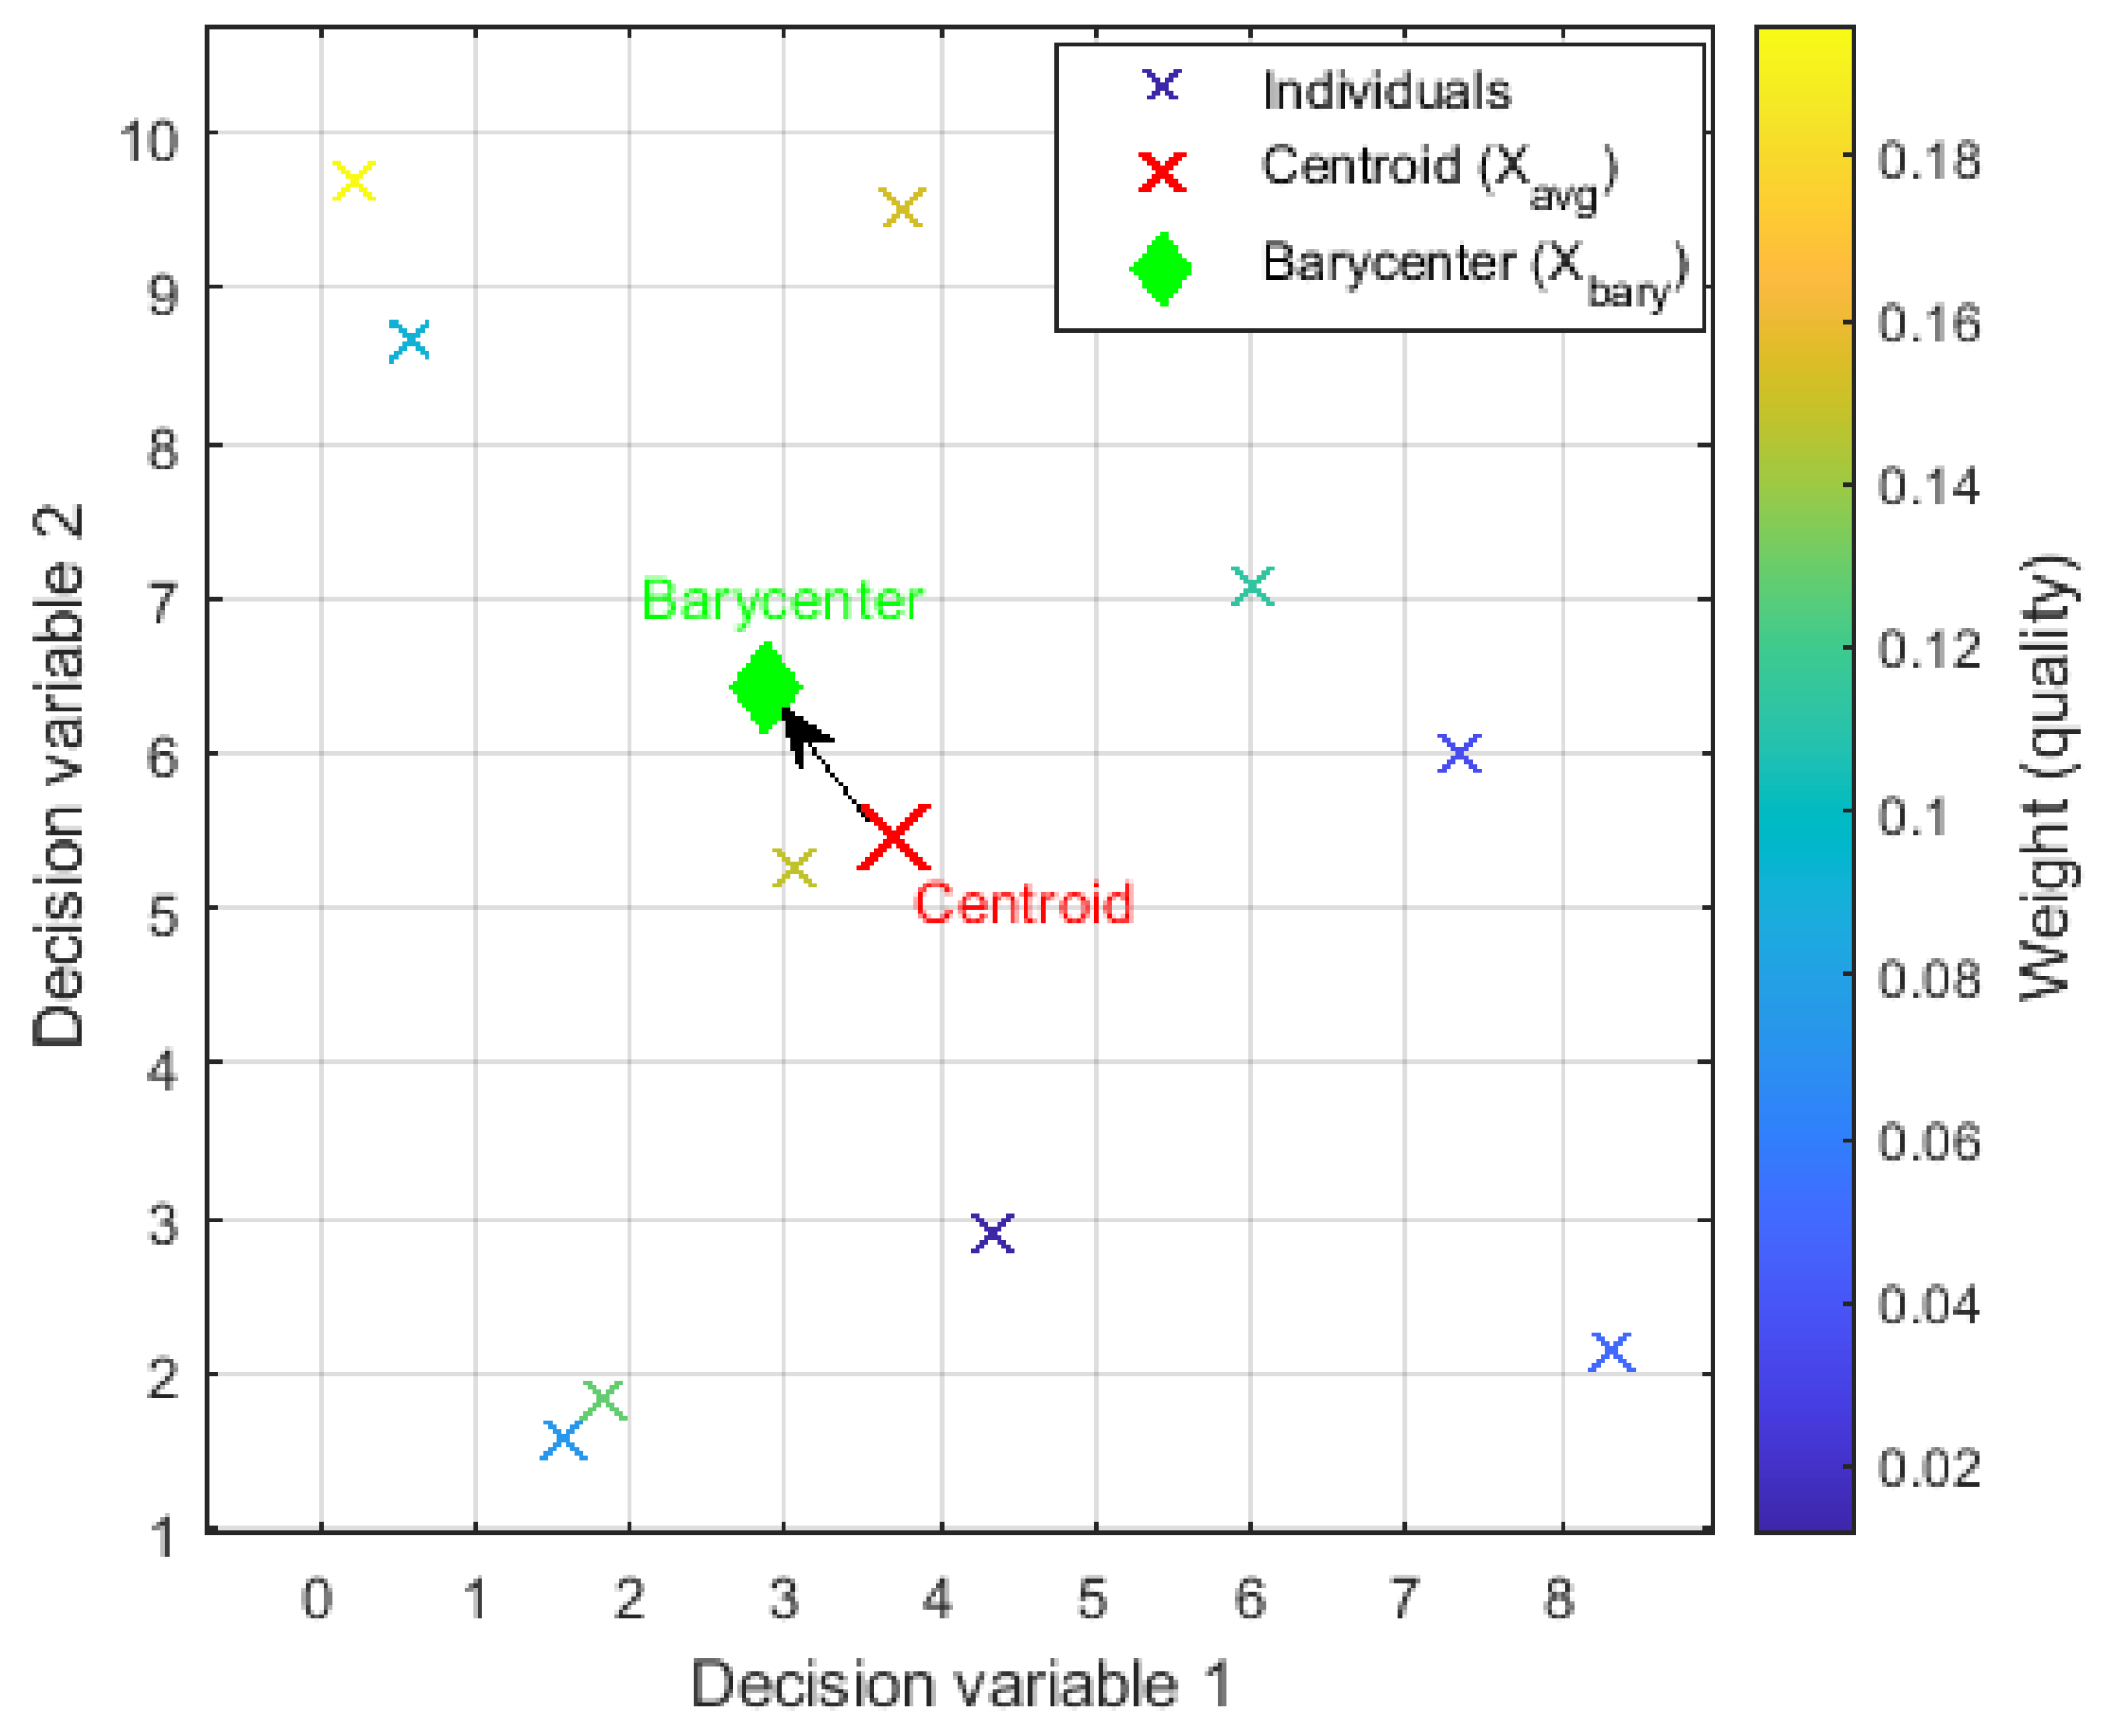
Figure 2 illustrates the difference between the population centroid X a v g and the population barycenter X b a r y . The red cross denotes the centroid, i.e., the arithmetic mean of all individuals’ positions, whereas the green diamond indicates the barycenter, i.e., the weighted average position incorporating individual weights. The arrow denotes the shift from the pre-optimization centroid X a v g to the post-optimization barycenter X b a r y . Other crosses represent population individuals, where the color depth corresponds to the quality weight of each individual. It can be clearly observed that the centroid merely reflects the overall average distribution of the population without accounting for quality differences among individuals. In contrast, the barycenter is located closer to regions where high-weight individuals are concentrated, thereby highlighting the guiding role of superior individuals in directing the evolutionary trajectory of the population. This improvement strengthens the algorithm’s convergence efficiency and exploitation capability while preserving population diversity.

3.2.2. Dynamically Adaptive Damping Factor

In Equation (18), the damping factor α was set as a fixed value, which prevents it from adapting to the iterative process. Such a static design has inherent limitations, including the following: when α is too small, particle velocities become excessively large, causing oscillations and a tendency to get trapped in local optima; conversely, when α is too large, velocity decays too quickly, leading to a premature loss of exploration capability and insufficient population diversity.
To address this issue, this study is the first to introduce a nonlinear dynamic decay mechanism into the PLO framework, allowing the damping factor α to gradually decrease with the number of iterations as follows:
α t = 1 ( 10 7 0.9 ) 1 t α t = α t 1 · α t
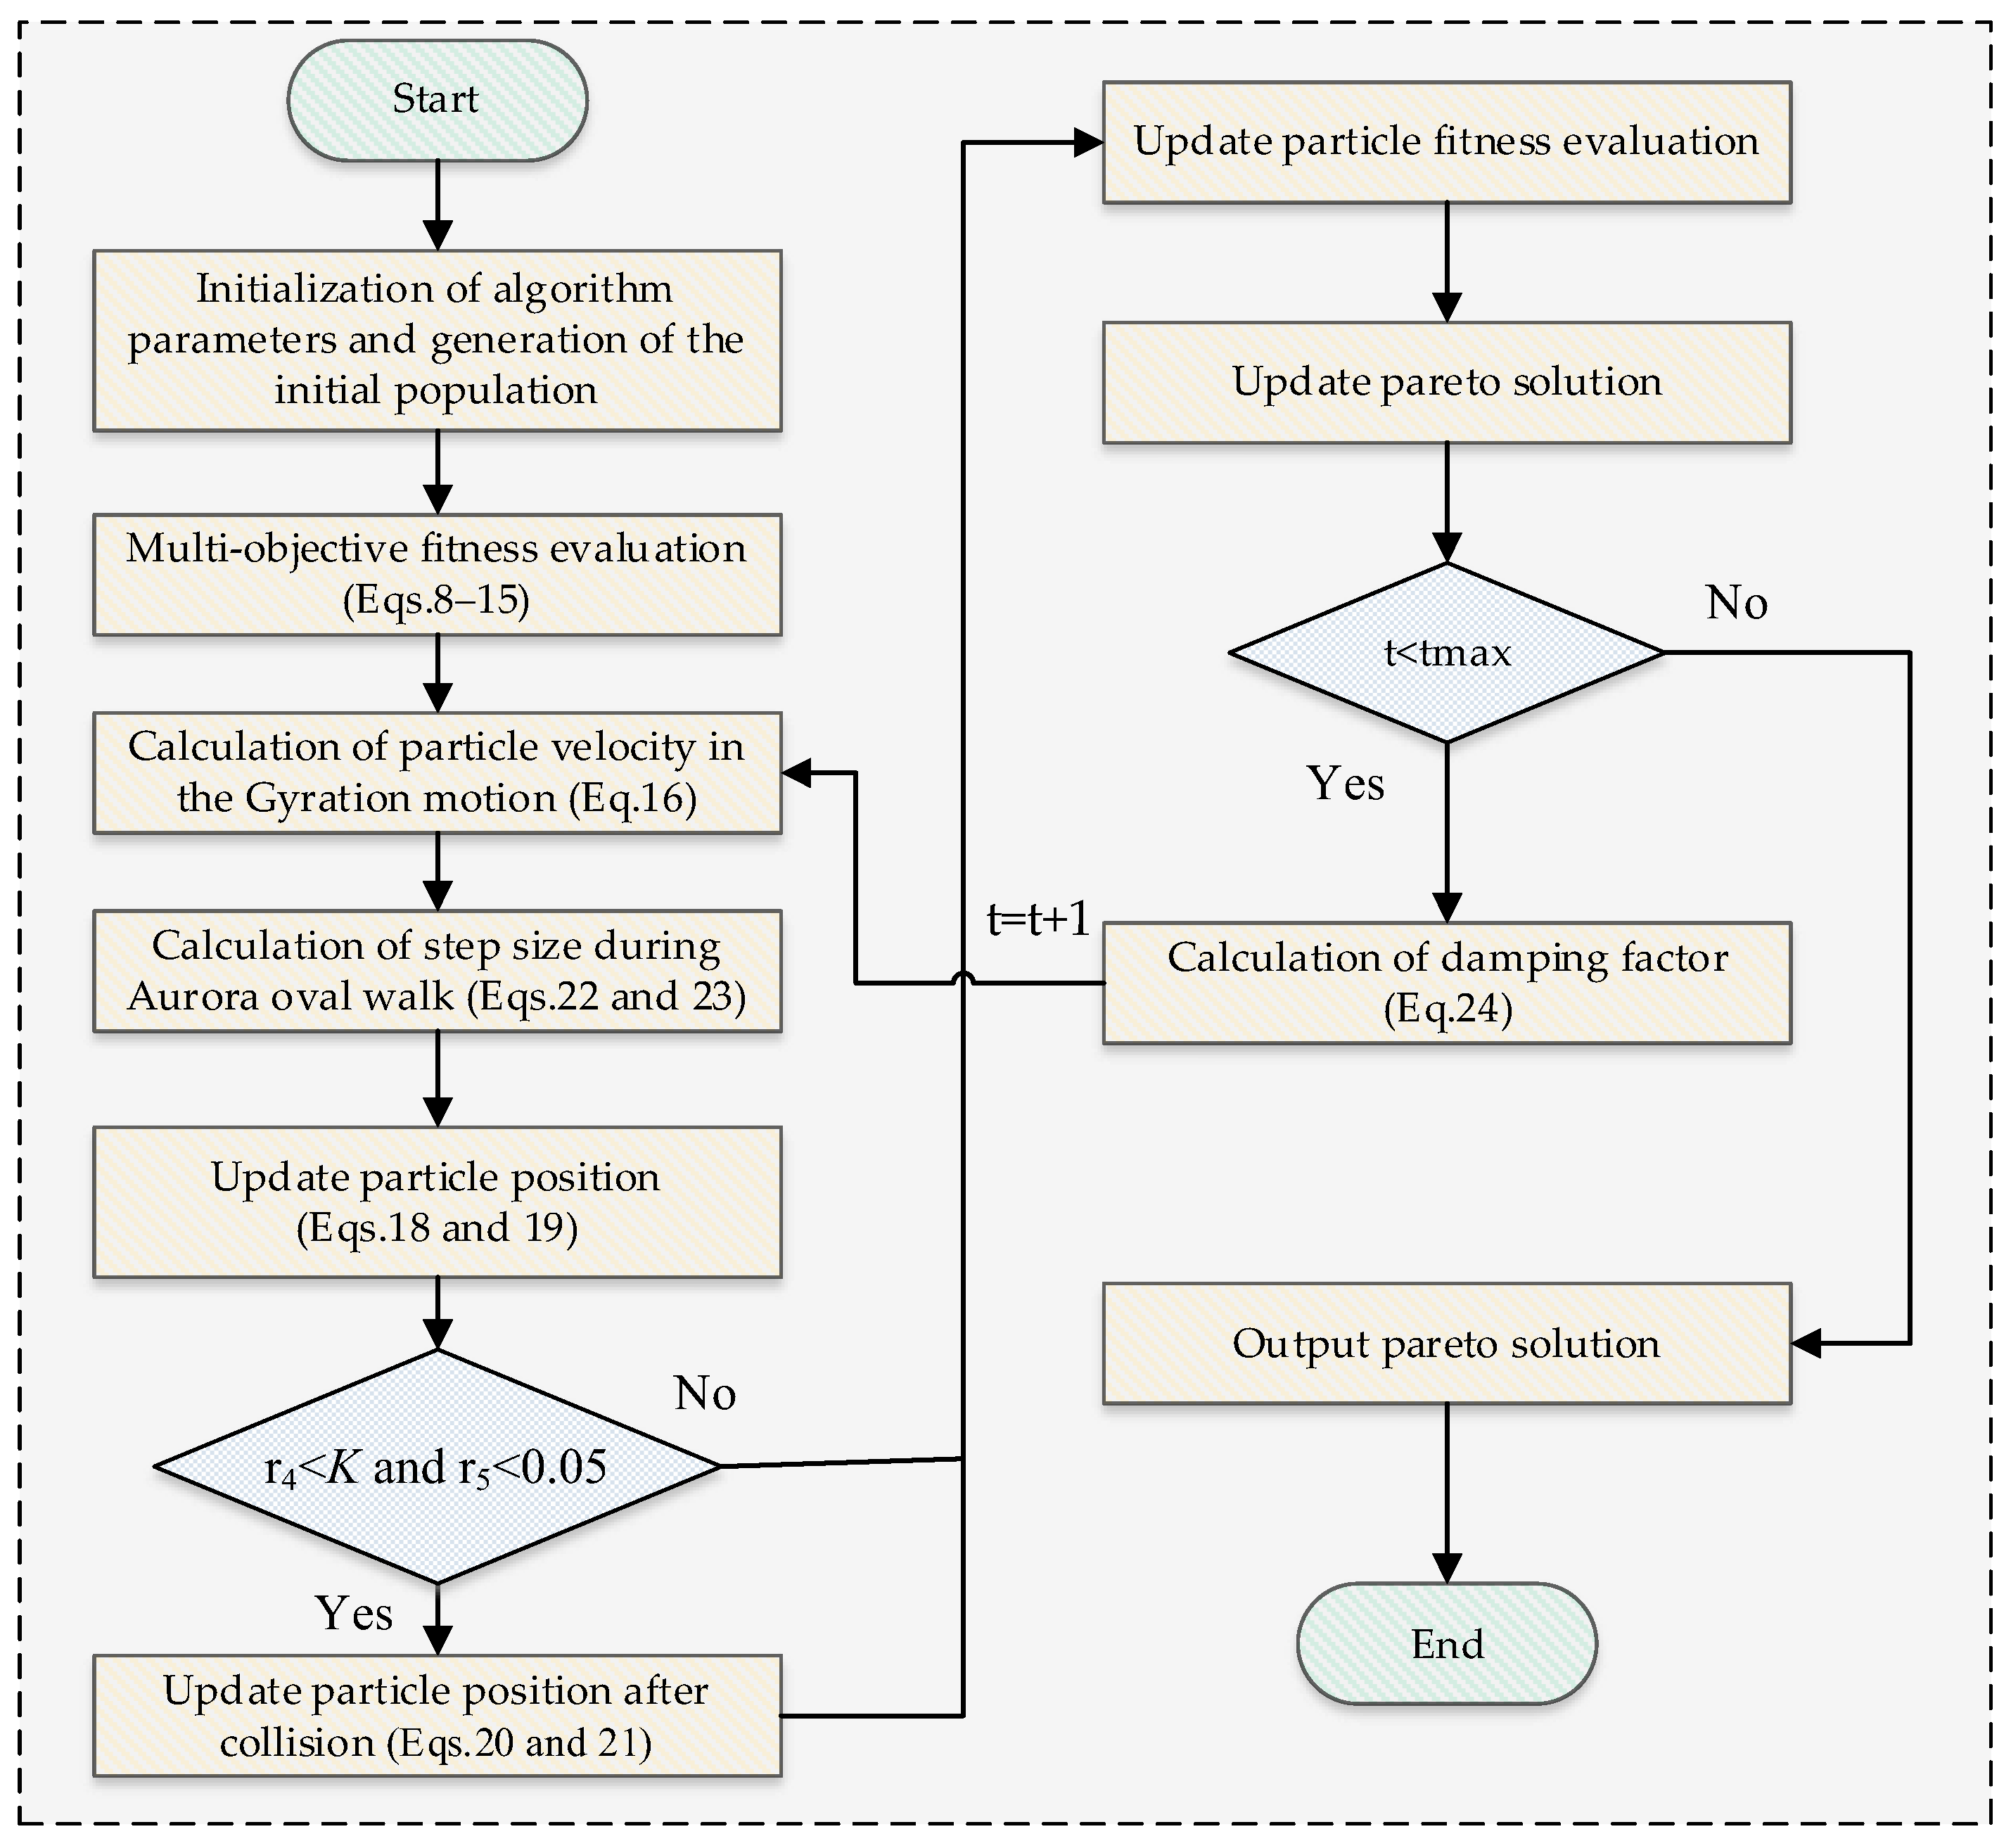
where α t represents the decay coefficient at t -th iteration. With increasing iterations, α progressively decreases. By combining this mechanism with Equation (18), particle velocity v ( t ) remains relatively large during the early stages, ensuring strong global search ability, while gradually decaying in later stages to enhance local exploitation accuracy. The flowchart of MOOPF based on the IPOL algorithm is shown in Figure 3.
Notably, the proposed two improvements are generic rather than domain-specific, while their efficacy is demonstrated here for distribution-network multi-objective optimal power flow, the underlying mechanism readily transfers to a wide range of optimization problems.

4. Case Study

In this study, the IEEE 33-bus distribution test feeder was employed as the simulation platform for evaluating the proposed MOOPF model. The system topology is shown in Figure 4, where two wind turbine generators rated at 0.5 MW were integrated at nodes 14 and 21, and two photovoltaic units rated at 1.6 MW were connected at nodes 17 and 31. An EV charging station was modeled at node 26. The generation profiles of wind and photovoltaic units were generated as standard test curves within the IEEE 33-bus framework. The EV load, PV and WT output were from real-world data collected from a core city in southern China were adopted. These records were processed using the K-shape clustering algorithm to extract four representative seasonal charging profiles, which were then mapped onto the EV station in the test system to capture seasonal variations and daily charging patterns. The modeling and simulation experiments in this study were conducted in MATLAB R2023A on a computer equipped with an AMD Ryzen 7 5700G processor (3.80 GHz, with Radeon Graphics) and 64.0 GB of RAM. The proposed model explicitly accounts for network power flow balance, nodal voltage constraints, and other operational limits, with the aim of minimizing both operating costs and voltage deviations.
For optimization, the PLO was adopted as the primary algorithm. To comprehensively evaluate its effectiveness, several widely used metaheuristic methods were employed for comparison, including genetic algorithm (GA) [38], whale optimization algorithm (WOA) [39], particle swarm optimization (PSO) [40], and artificial bee colony (ABC) algorithm [41]. In addition, we also compared against a pre-optimization-base scenario in which the ADN operates under identical renewable generation and EV load conditions, with no BESS installed. The comparative experiments were designed to assess the performance of IPLO in solving the MOOPF problem, particularly with respect to nodal voltage deviation and annual operating cost. Detailed system parameters and algorithm settings are provided in Table 1 and Table 2.

4.1. K-Shape Clustering Result

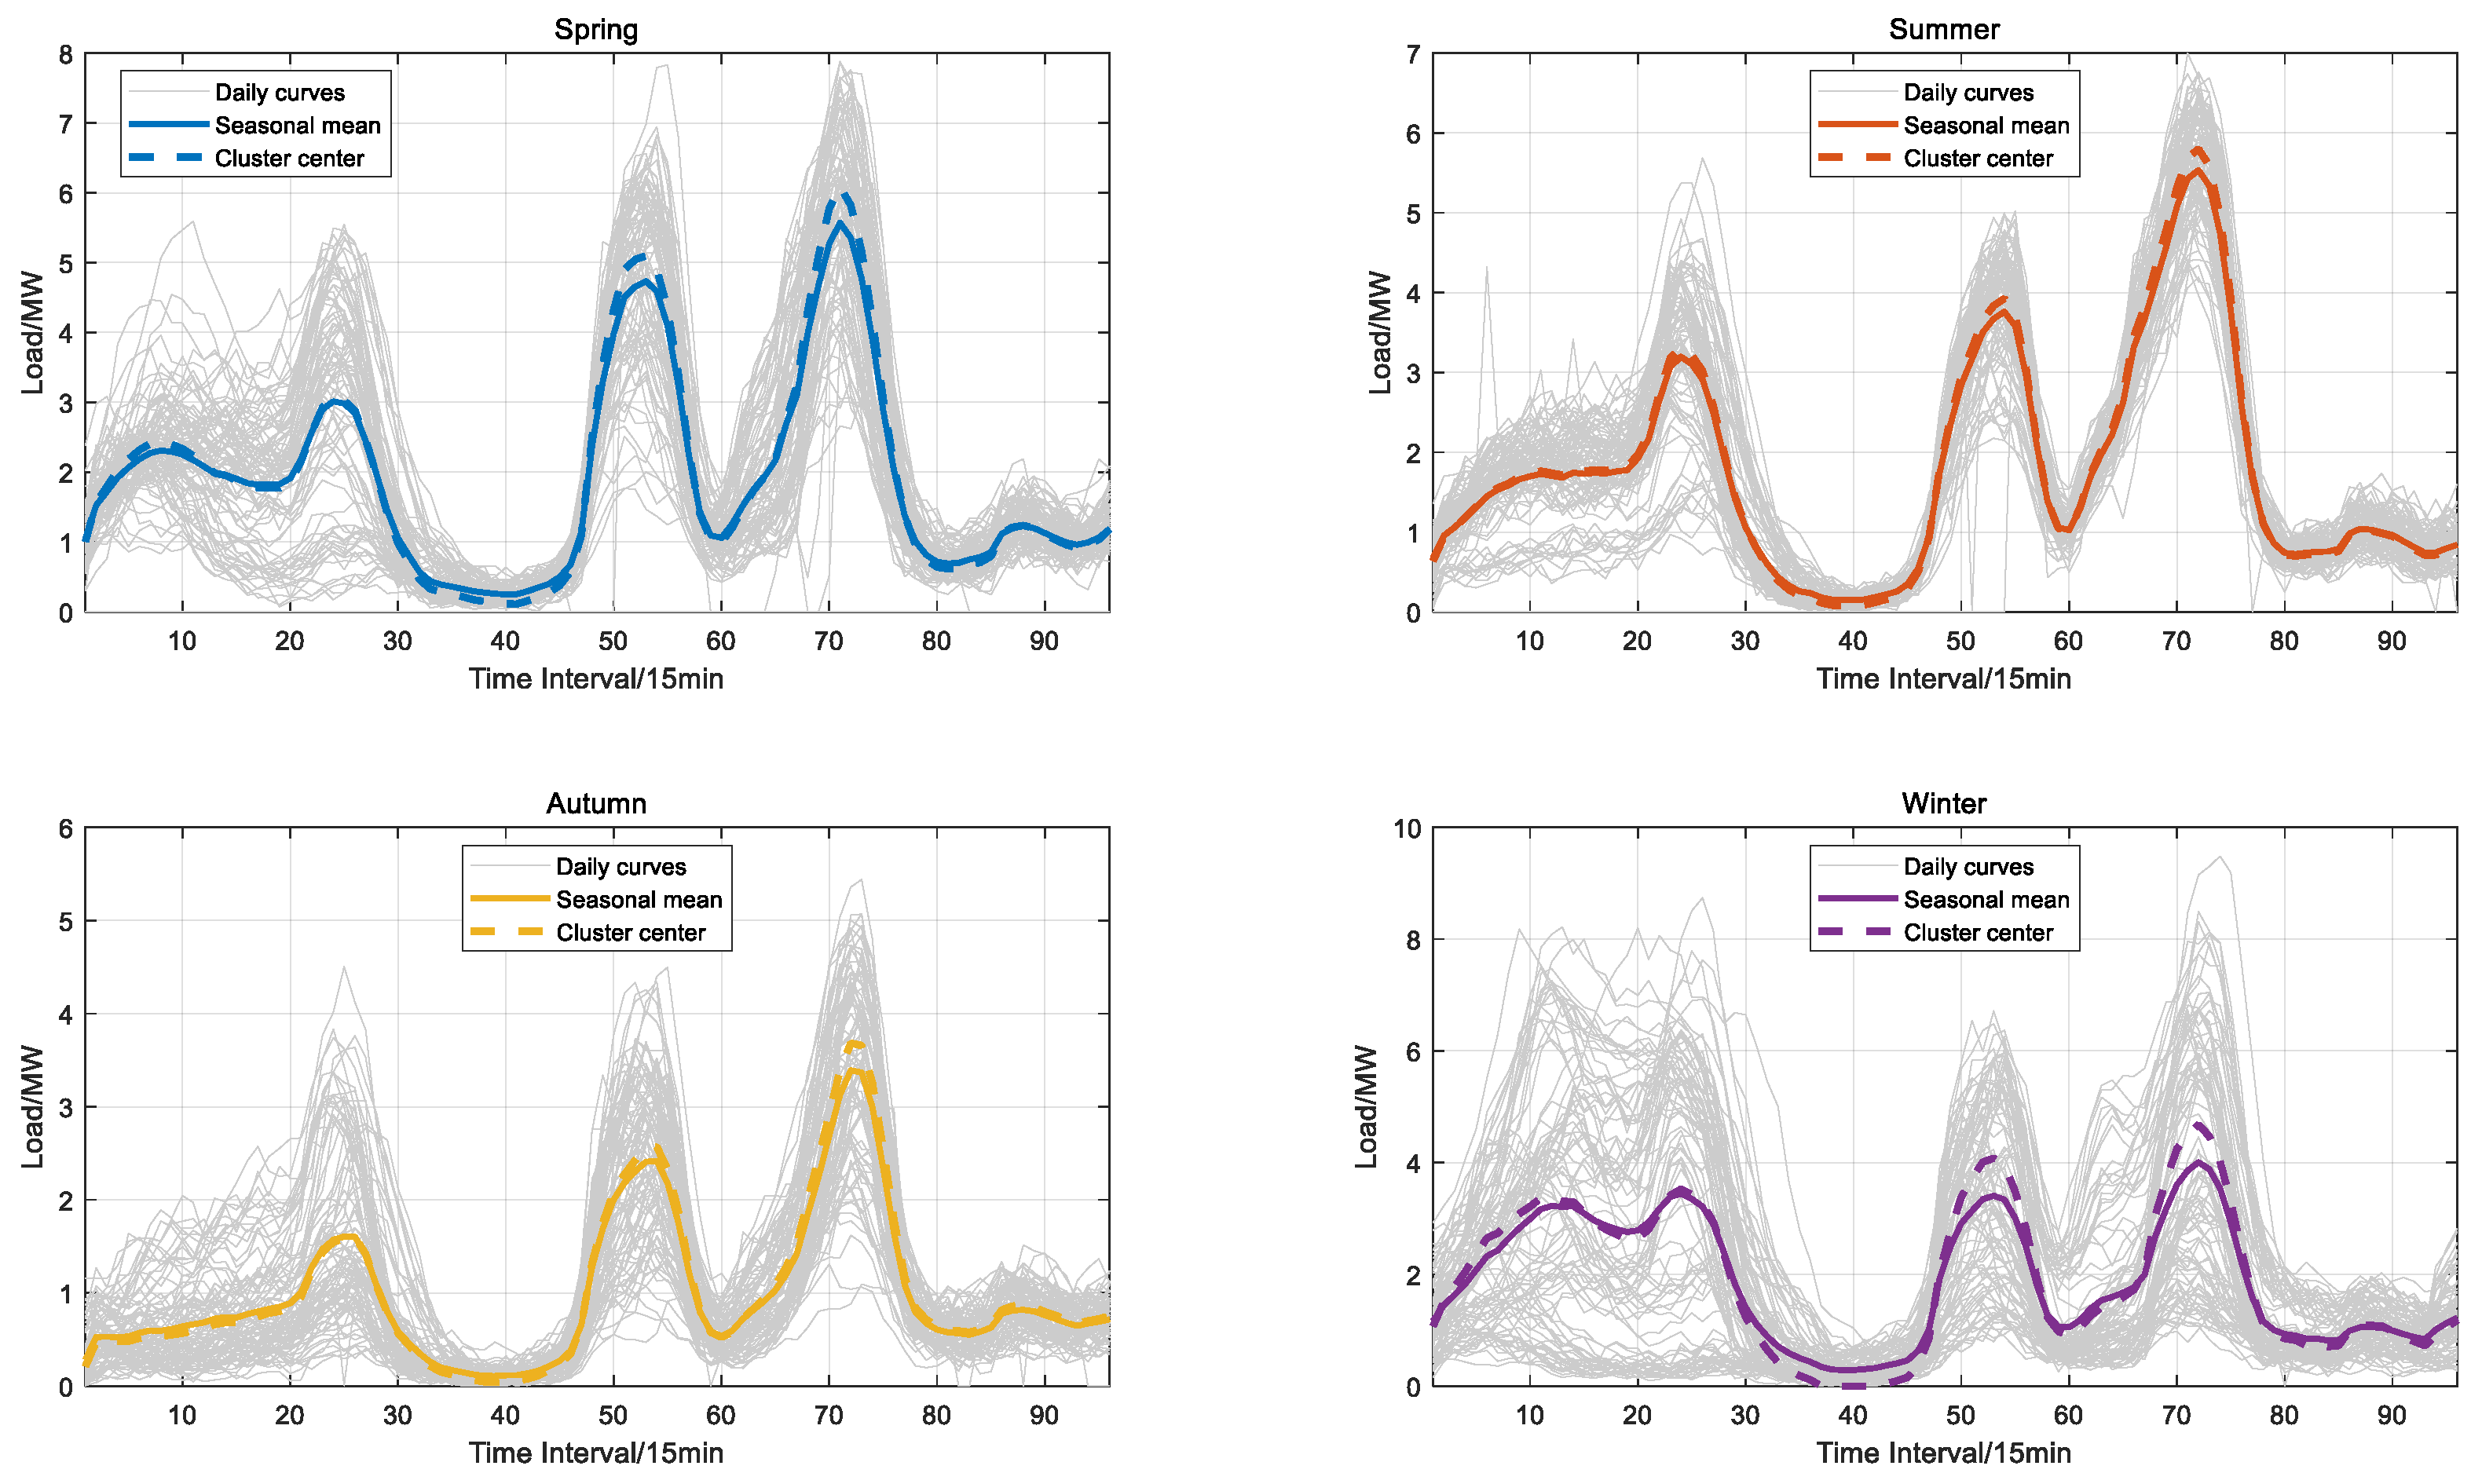
Figure 5 illustrates the daily electric vehicle charging load curves across the four seasons, together with the seasonal mean curves and the K-shape clustering centers. As shown, the typical daily loads vary markedly by season: autumn exhibits the lowest overall load level with relatively stable profiles; summer is characterized by the most concentrated evening peak, imposing significant stress on the grid; and spring and winter, by contrast, display stronger fluctuations with more heterogeneous charging behaviors. In spring, summer, and autumn, the charging load curve clearly exhibits three distinct peaks occurring at approximately 06:00, 14:00, and 18:00, with the highest peak observed around 18:00. In contrast, the winter profile presents four peaks at around 03:00, 06:00, 14:00, and 18:00, with the maximum load likewise appearing near 18:00. The gray curves represent the intra-seasonal variability of daily loads, directly reflecting the dispersion of charging behaviors. The colored solid lines depict the seasonal mean curves, capturing the general trend, while the dashed lines corresponding to the K-shape cluster centers more closely resemble the actual peak–valley structure and better preserve the characteristic load profiles. Compared with the mean curves, the K-shape clustering approach provides a more faithful representation of typical daily load patterns, offering stronger representativeness and applicability. Therefore, K-shape clustering can effectively extract seasonal typical load curves, supplying a reliable basis for subsequent optimal power flow modeling.

4.2. Analysis of MOOPF Results

Table 3 presents the operating results of the base scenario and different optimization algorithms (the results of each algorithm representing the average values obtained from five independent runs), including annual operating cost, average voltage level, voltage deviation, network losses, and operating time. Compared with the base scenario, all optimization algorithms improve voltage quality and network loss to varying degrees. Among them, IPLO, as an improved algorithm of PLO, shows the most outstanding performance in multi-objective optimization. In the base scenario, the voltage deviation reaches as high as 0.03491 p.u., and the network loss is 1119.63 MWh/year. After optimization with IPLO, the voltage deviation is significantly reduced to 0.02107 p.u., representing a decrease of about 39.64%; the network loss is reduced to 730.49 MWh/year, a reduction of approximately 34.76%. Meanwhile, the average voltage level remains close to 1.0 p.u., ensuring compliance with the voltage quality constraints. Compared with the original PLO algorithm, the operating cost of IPLO decreases from 2.4236 CNY million/year to 2.3614 CNY million/year, a reduction of about 2.56%. The voltage deviation is reduced from 0.02137 p.u. to 0.02107 p.u., while the operating time remains almost the same (13,143 s vs. 13,216 s). This result indicates that IPLO achieves dual improvements over PLO without increasing computational complexity. GA and ABC show greater advantages in terms of cost; however, their voltage deviations are inferior to that of IPLO, with GA exhibiting more than an 5.05% gap in voltage quality compared to IPLO. The cost of WOA is 211.0730 CNY million/year, lower than that of IPLO, but its voltage deviation is 3.26% higher and its network losses increase by 2.90%. In addition, although ABC achieves lower costs, its operating time reaches 29,144 s, nearly 2.2 times that of IPLO, indicating higher algorithmic complexity that is unfavorable for meeting real-time requirements in engineering applications. Although both operating cost and voltage deviation are considered as optimization objectives, the framework in this study places slightly greater emphasis on improving voltage quality, as it is critical for secure distribution network operation. Overall, IPLO demonstrates the best performance in terms of voltage deviation and network losses. Compared with the base scenario, IPLO achieves a substantial improvement in voltage quality and a significant reduction in system energy consumption, verifying its effectiveness and engineering applicability in multi-objective optimization scheduling of ADNs.
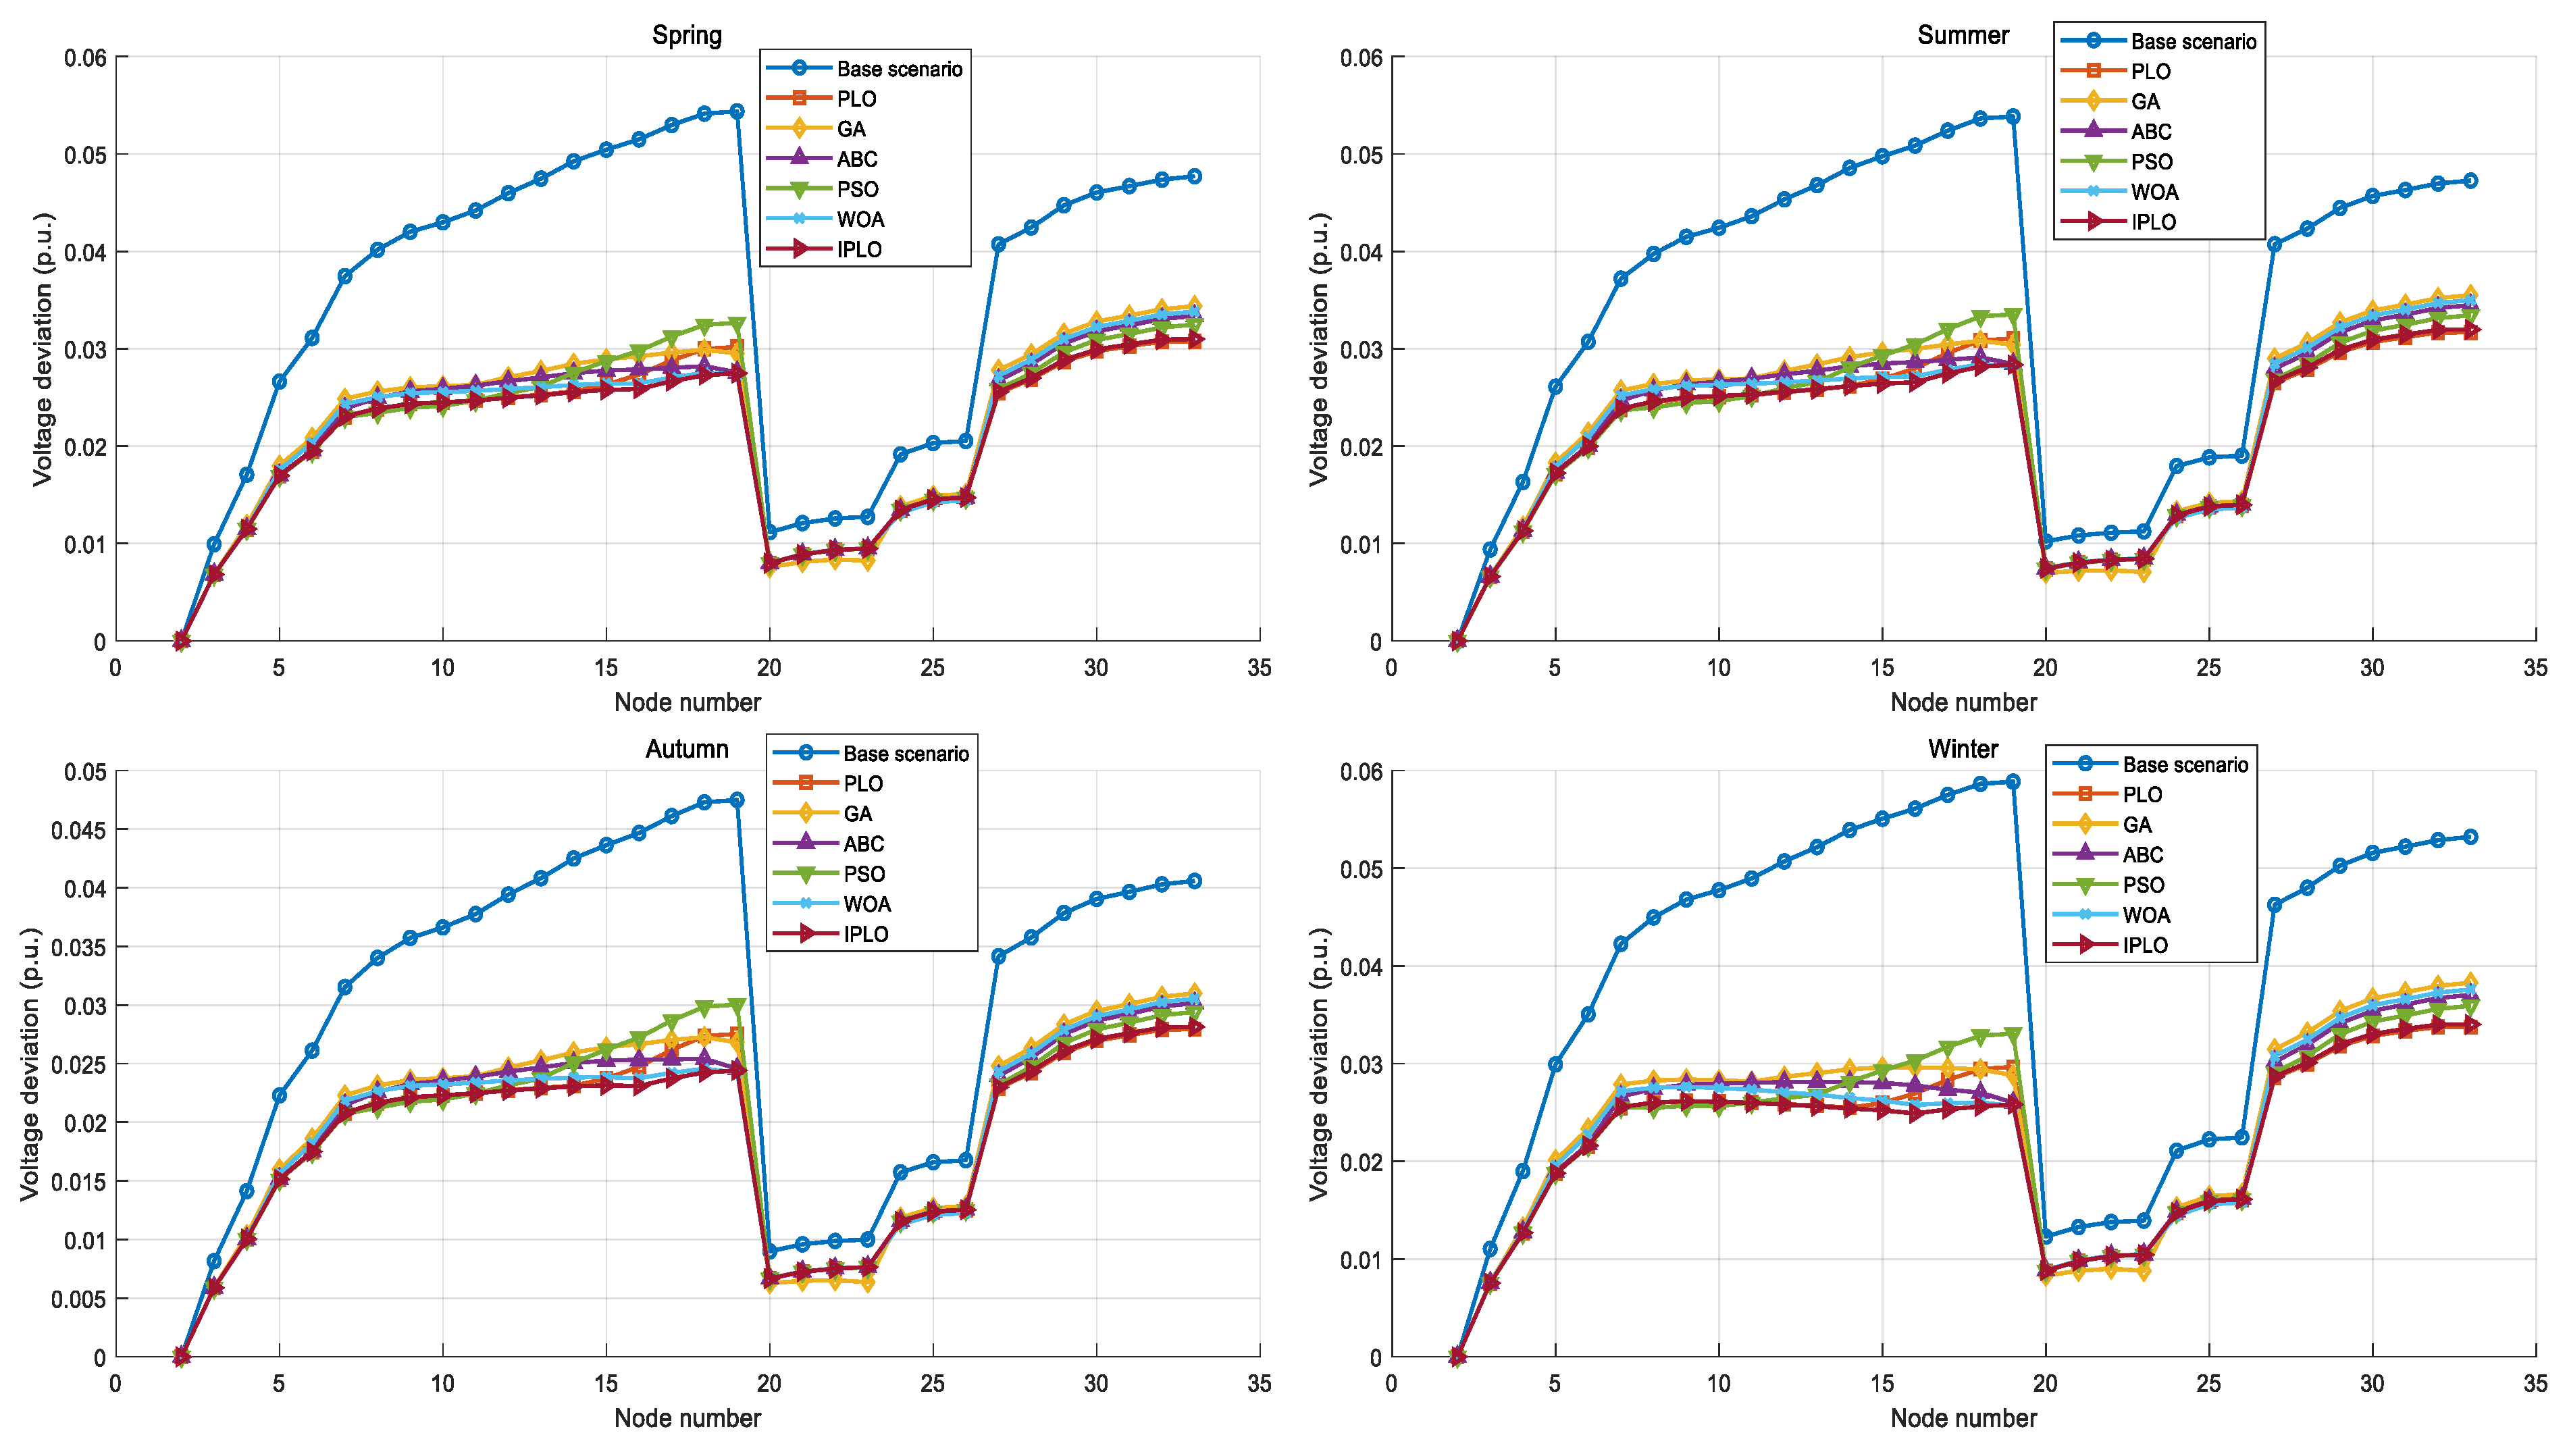
In Figure 6, the results of node voltage deviations before and after optimization with different algorithms are presented. It can be observed that, prior to the MOOPF implementation, the node voltage deviations in the ADN fluctuate significantly across seasons, with nodes 19 and 33 exhibiting particularly large deviations. After MOOPF optimization, the voltage deviations of the nodes are effectively suppressed, the overall level is significantly reduced, and the differences among nodes are also noticeably diminished. Further comparison reveals that the IPLO algorithm achieves the smallest voltage deviation at most nodes, with only nodes 20–24 being slightly higher than those of the GA algorithm. Overall, it demonstrates superior optimization performance compared to other methods. Furthermore, it can be observed from Figure 7 that the performance of different algorithms in terms of voltage deviation exhibits distinct differences, each algorithm is independently executed five times. The IPLO algorithm achieves the lowest median and the most concentrated distribution, indicating superior accuracy and stability compared with the other methods. PLO and WOA rank next, with the former yielding lower deviations and the latter demonstrating better stability. The ABC algorithm shows moderate performance, whereas GA and PSO exhibit larger voltage deviations with higher fluctuations, reflecting relatively poor overall performance.
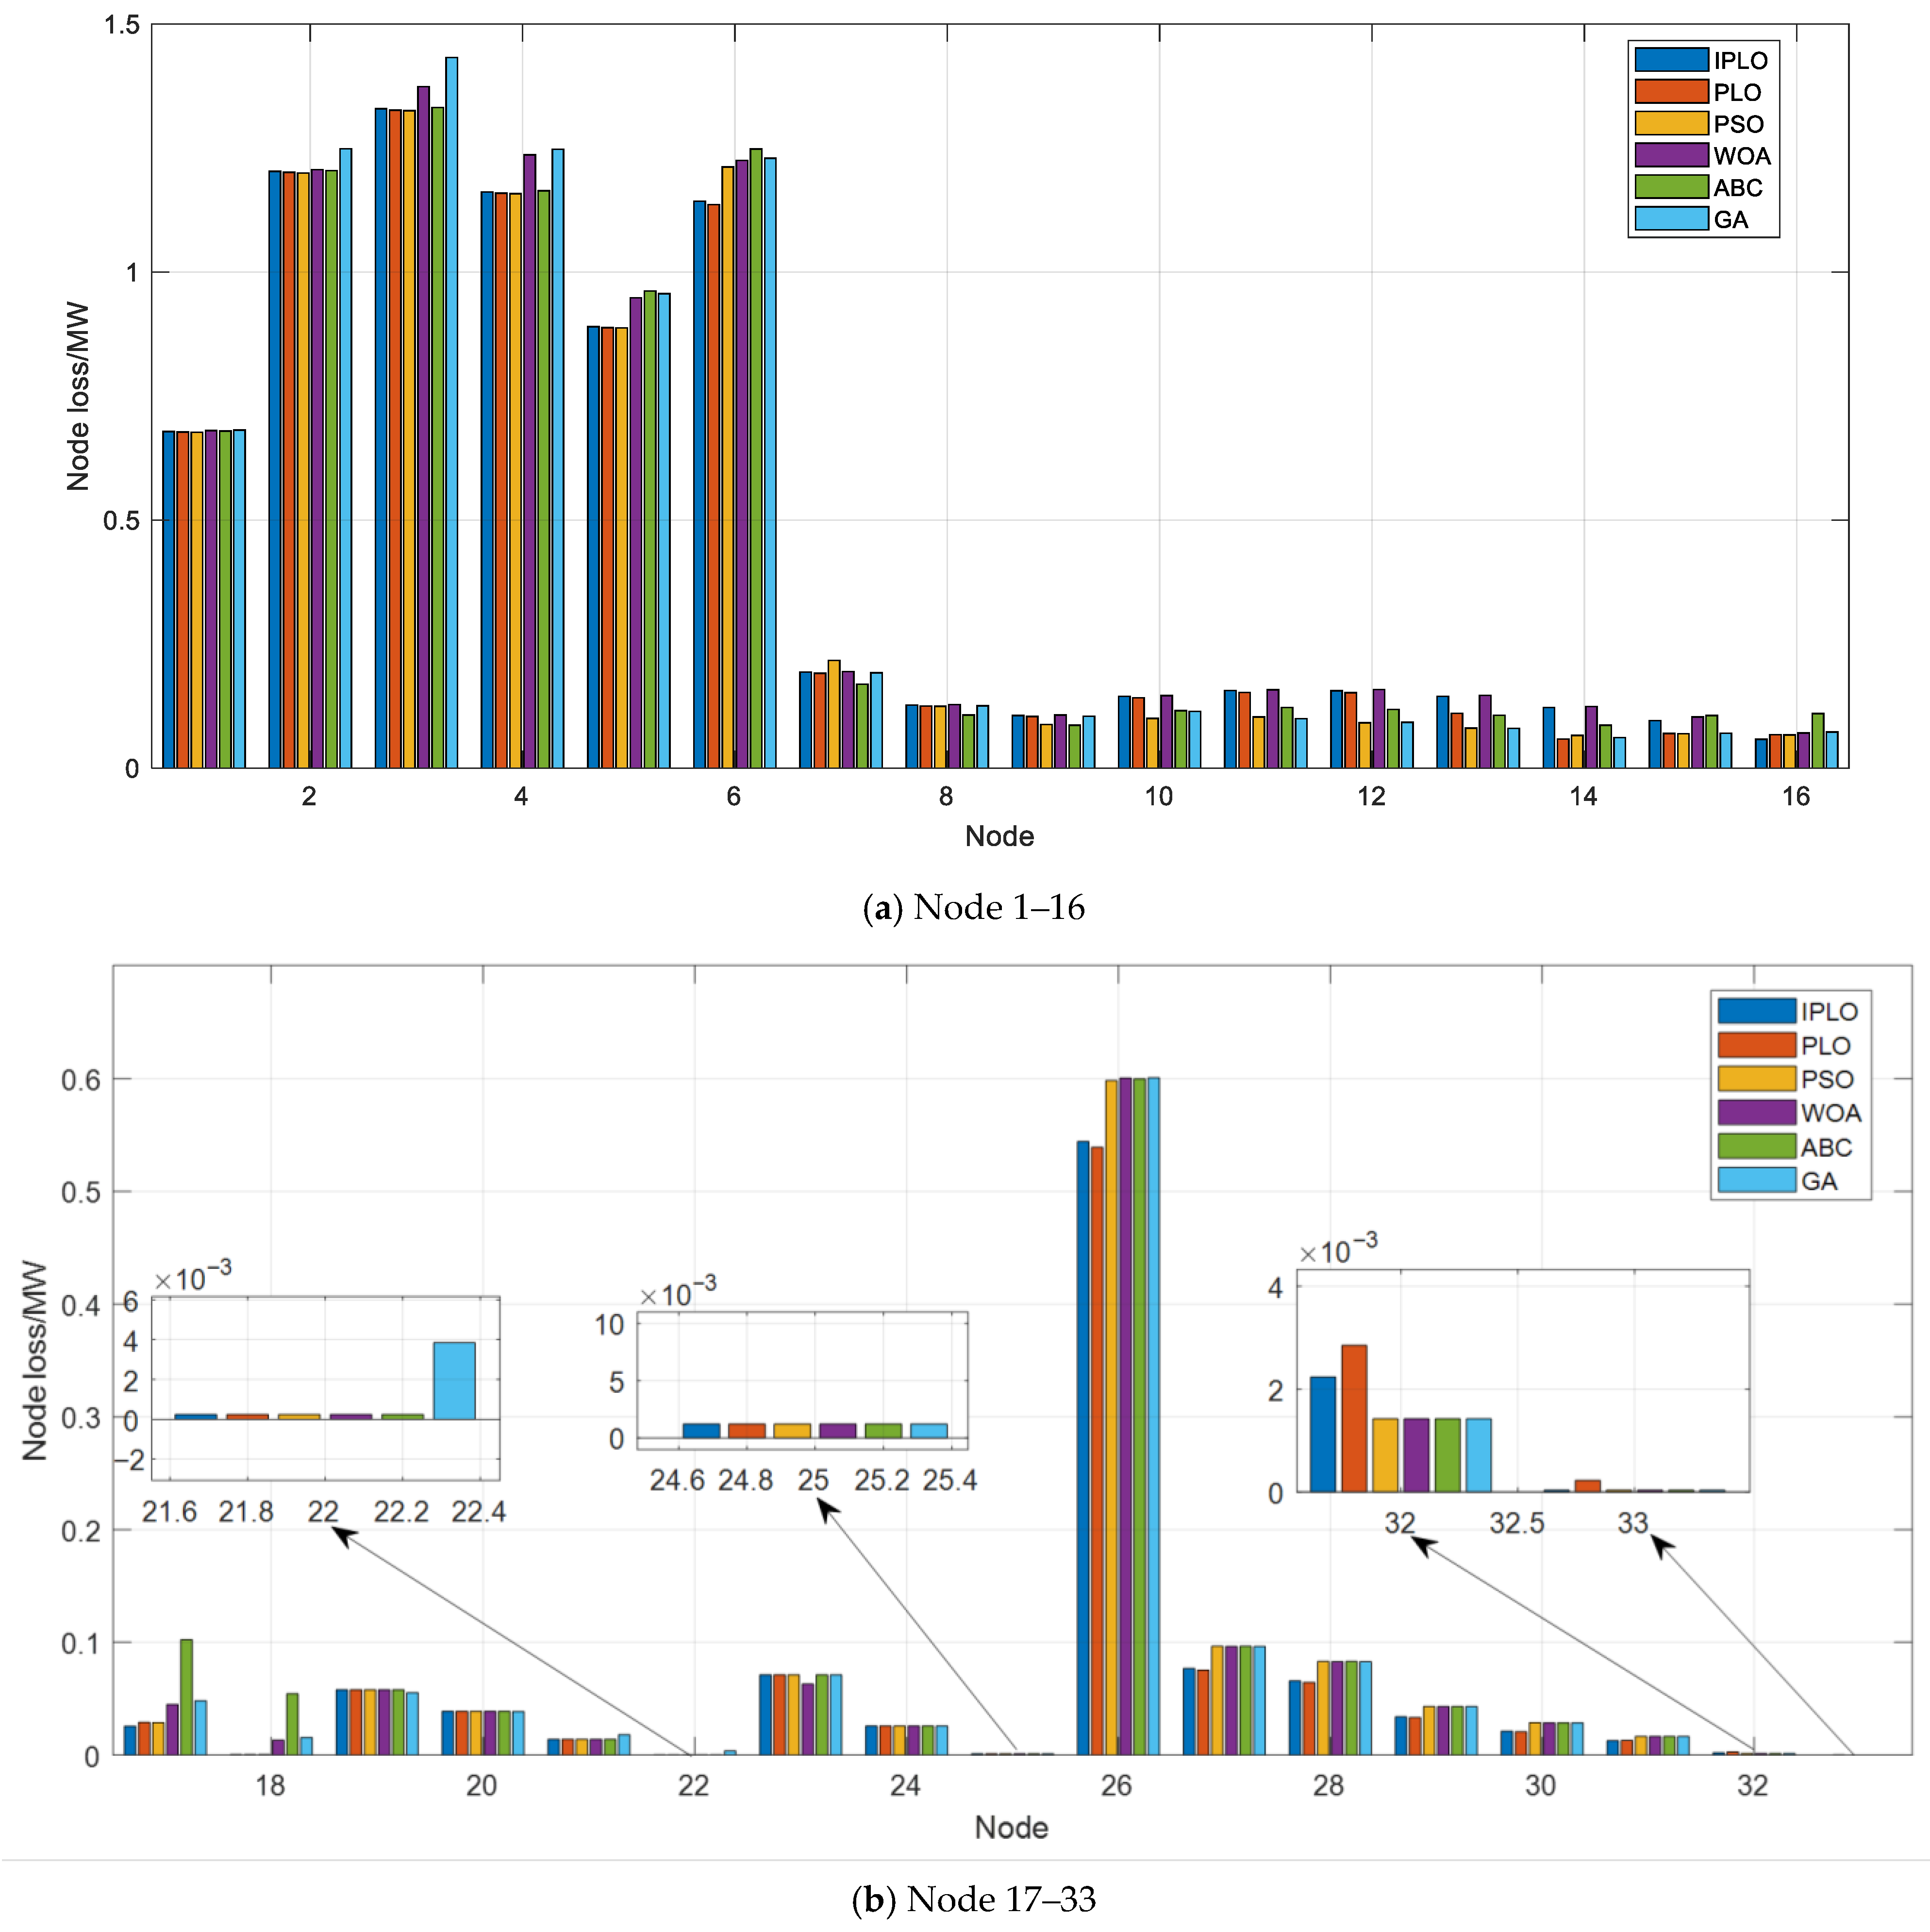
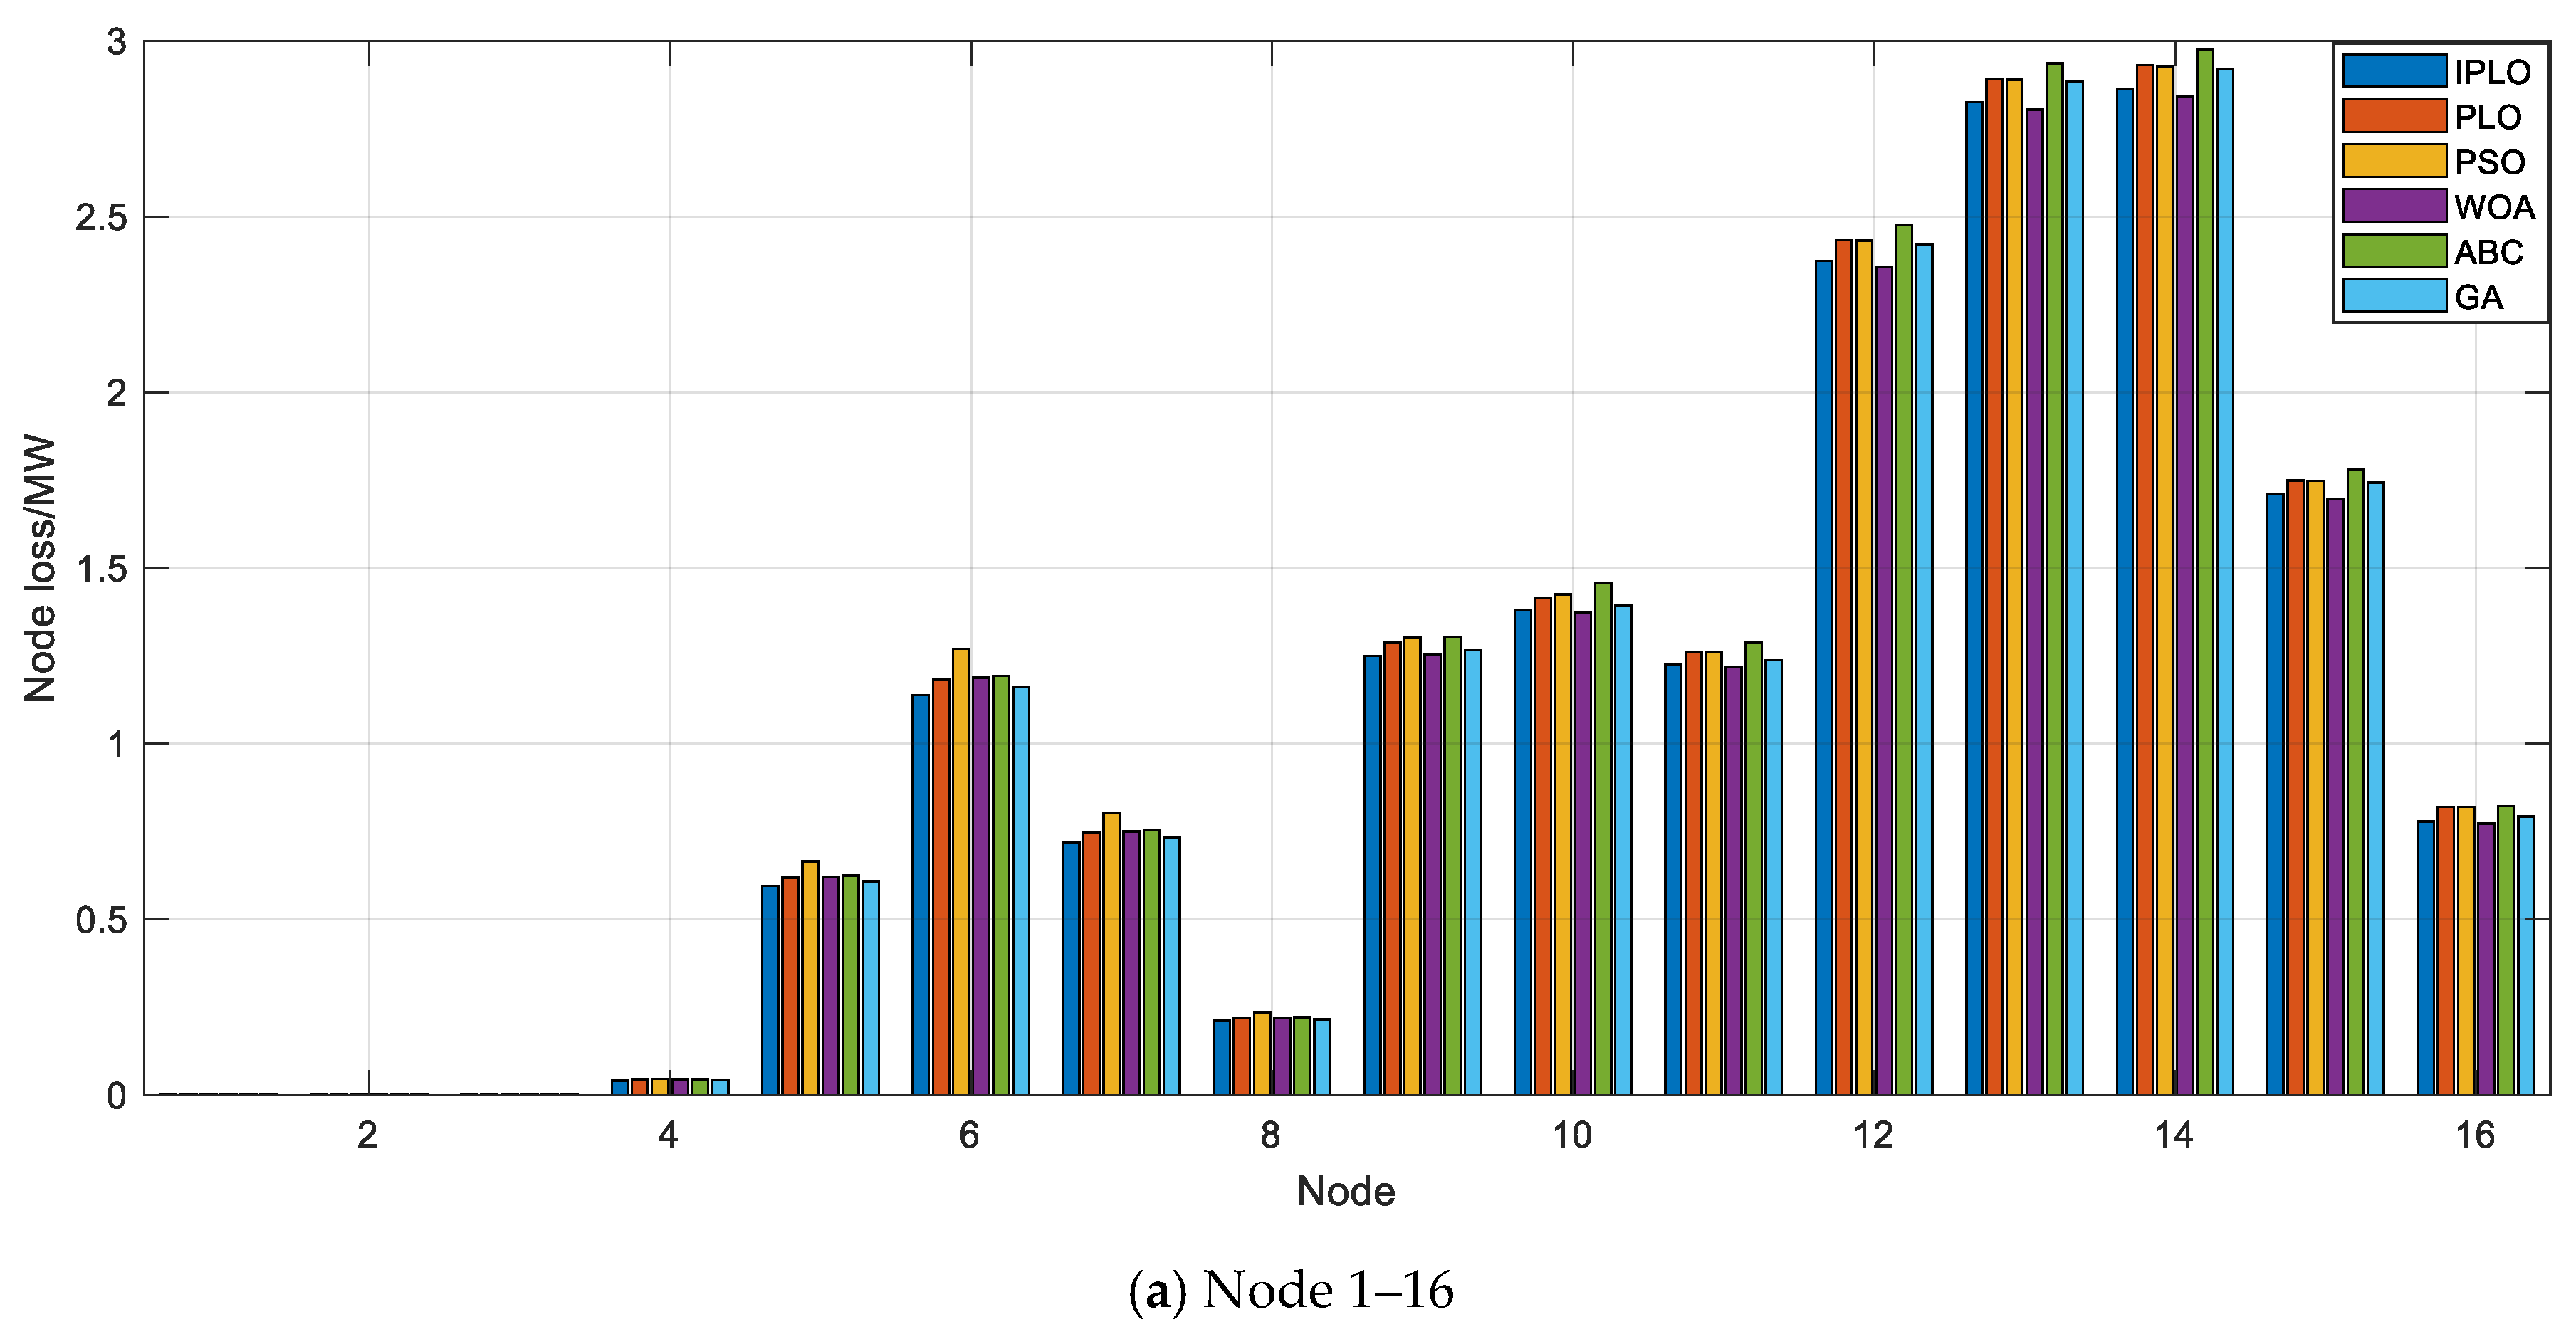
Figure 8 shows the network losses at each node of the distribution system after MOOPF optimization using different algorithms. As can be observed, nodes 1–6 and node 26 exhibit relatively higher losses. Overall, IPLO, PLO, and PSO achieve more significant loss reduction across most nodes, with overall performance superior to that of WOA, ABC, and GA. In particular, PSO demonstrates the most prominent effect in reducing losses at nodes 9–15, while beyond node 16, IPLO and PLO outperform the other algorithms.
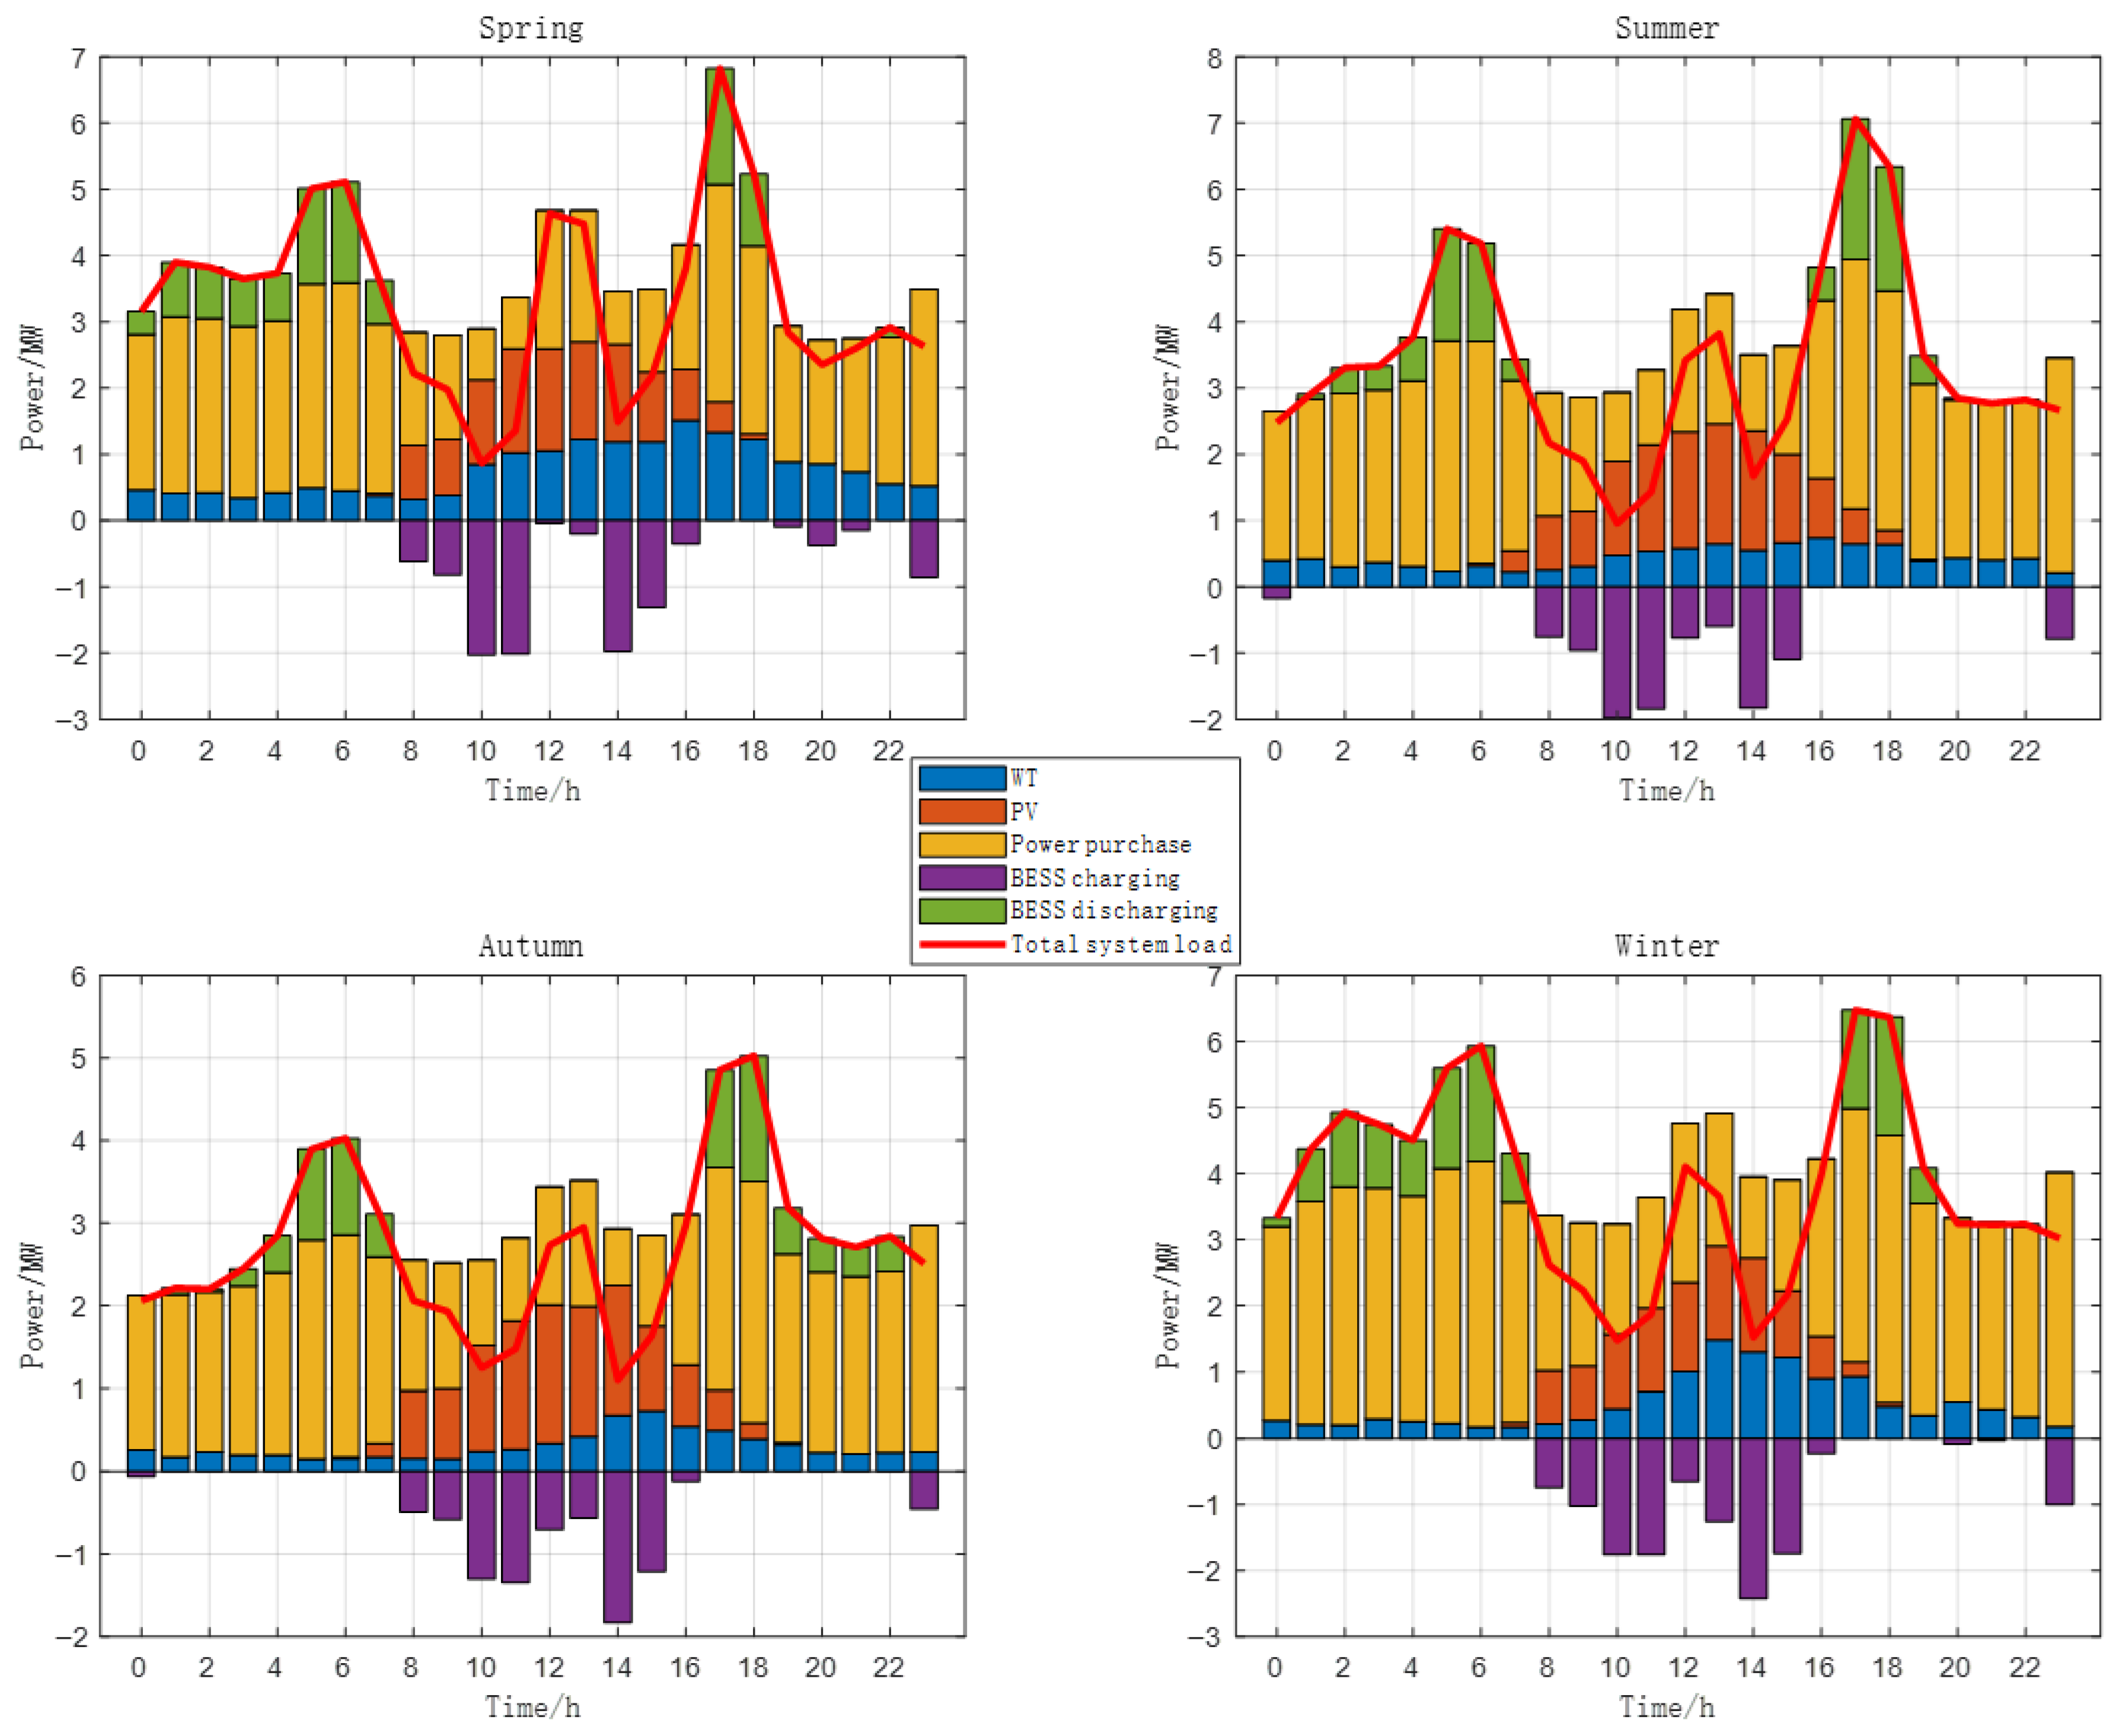
Figure 9 illustrates the coordinated operation of WT, PV, purchased electricity, and BESS across representative days in four seasons. It can be observed that, under the optimal power flow framework, the BESS discharges during peak load periods and actively charges during off-peak hours, thereby achieving a typical peak-shaving and valley-filling effect. This operation smooths the purchased power profile and reduces the system’s instantaneous dependence on the external grid. Due to the influence of EV charging demand, the total system load also exhibits a three-peak pattern; consequently, when a minor peak occurs around 12:00–13:00, the BESS charging power declines. Seasonal variations in renewable generation and load characteristics further affect the regulation capability of the BESS. Within the optimal power flow framework, the BESS operation not only satisfies voltage and power flow constraints but also enhances system stability and reduces operating costs, while simultaneously increasing the renewable energy utilization rate, thereby demonstrating significant value under high renewable penetration scenarios.
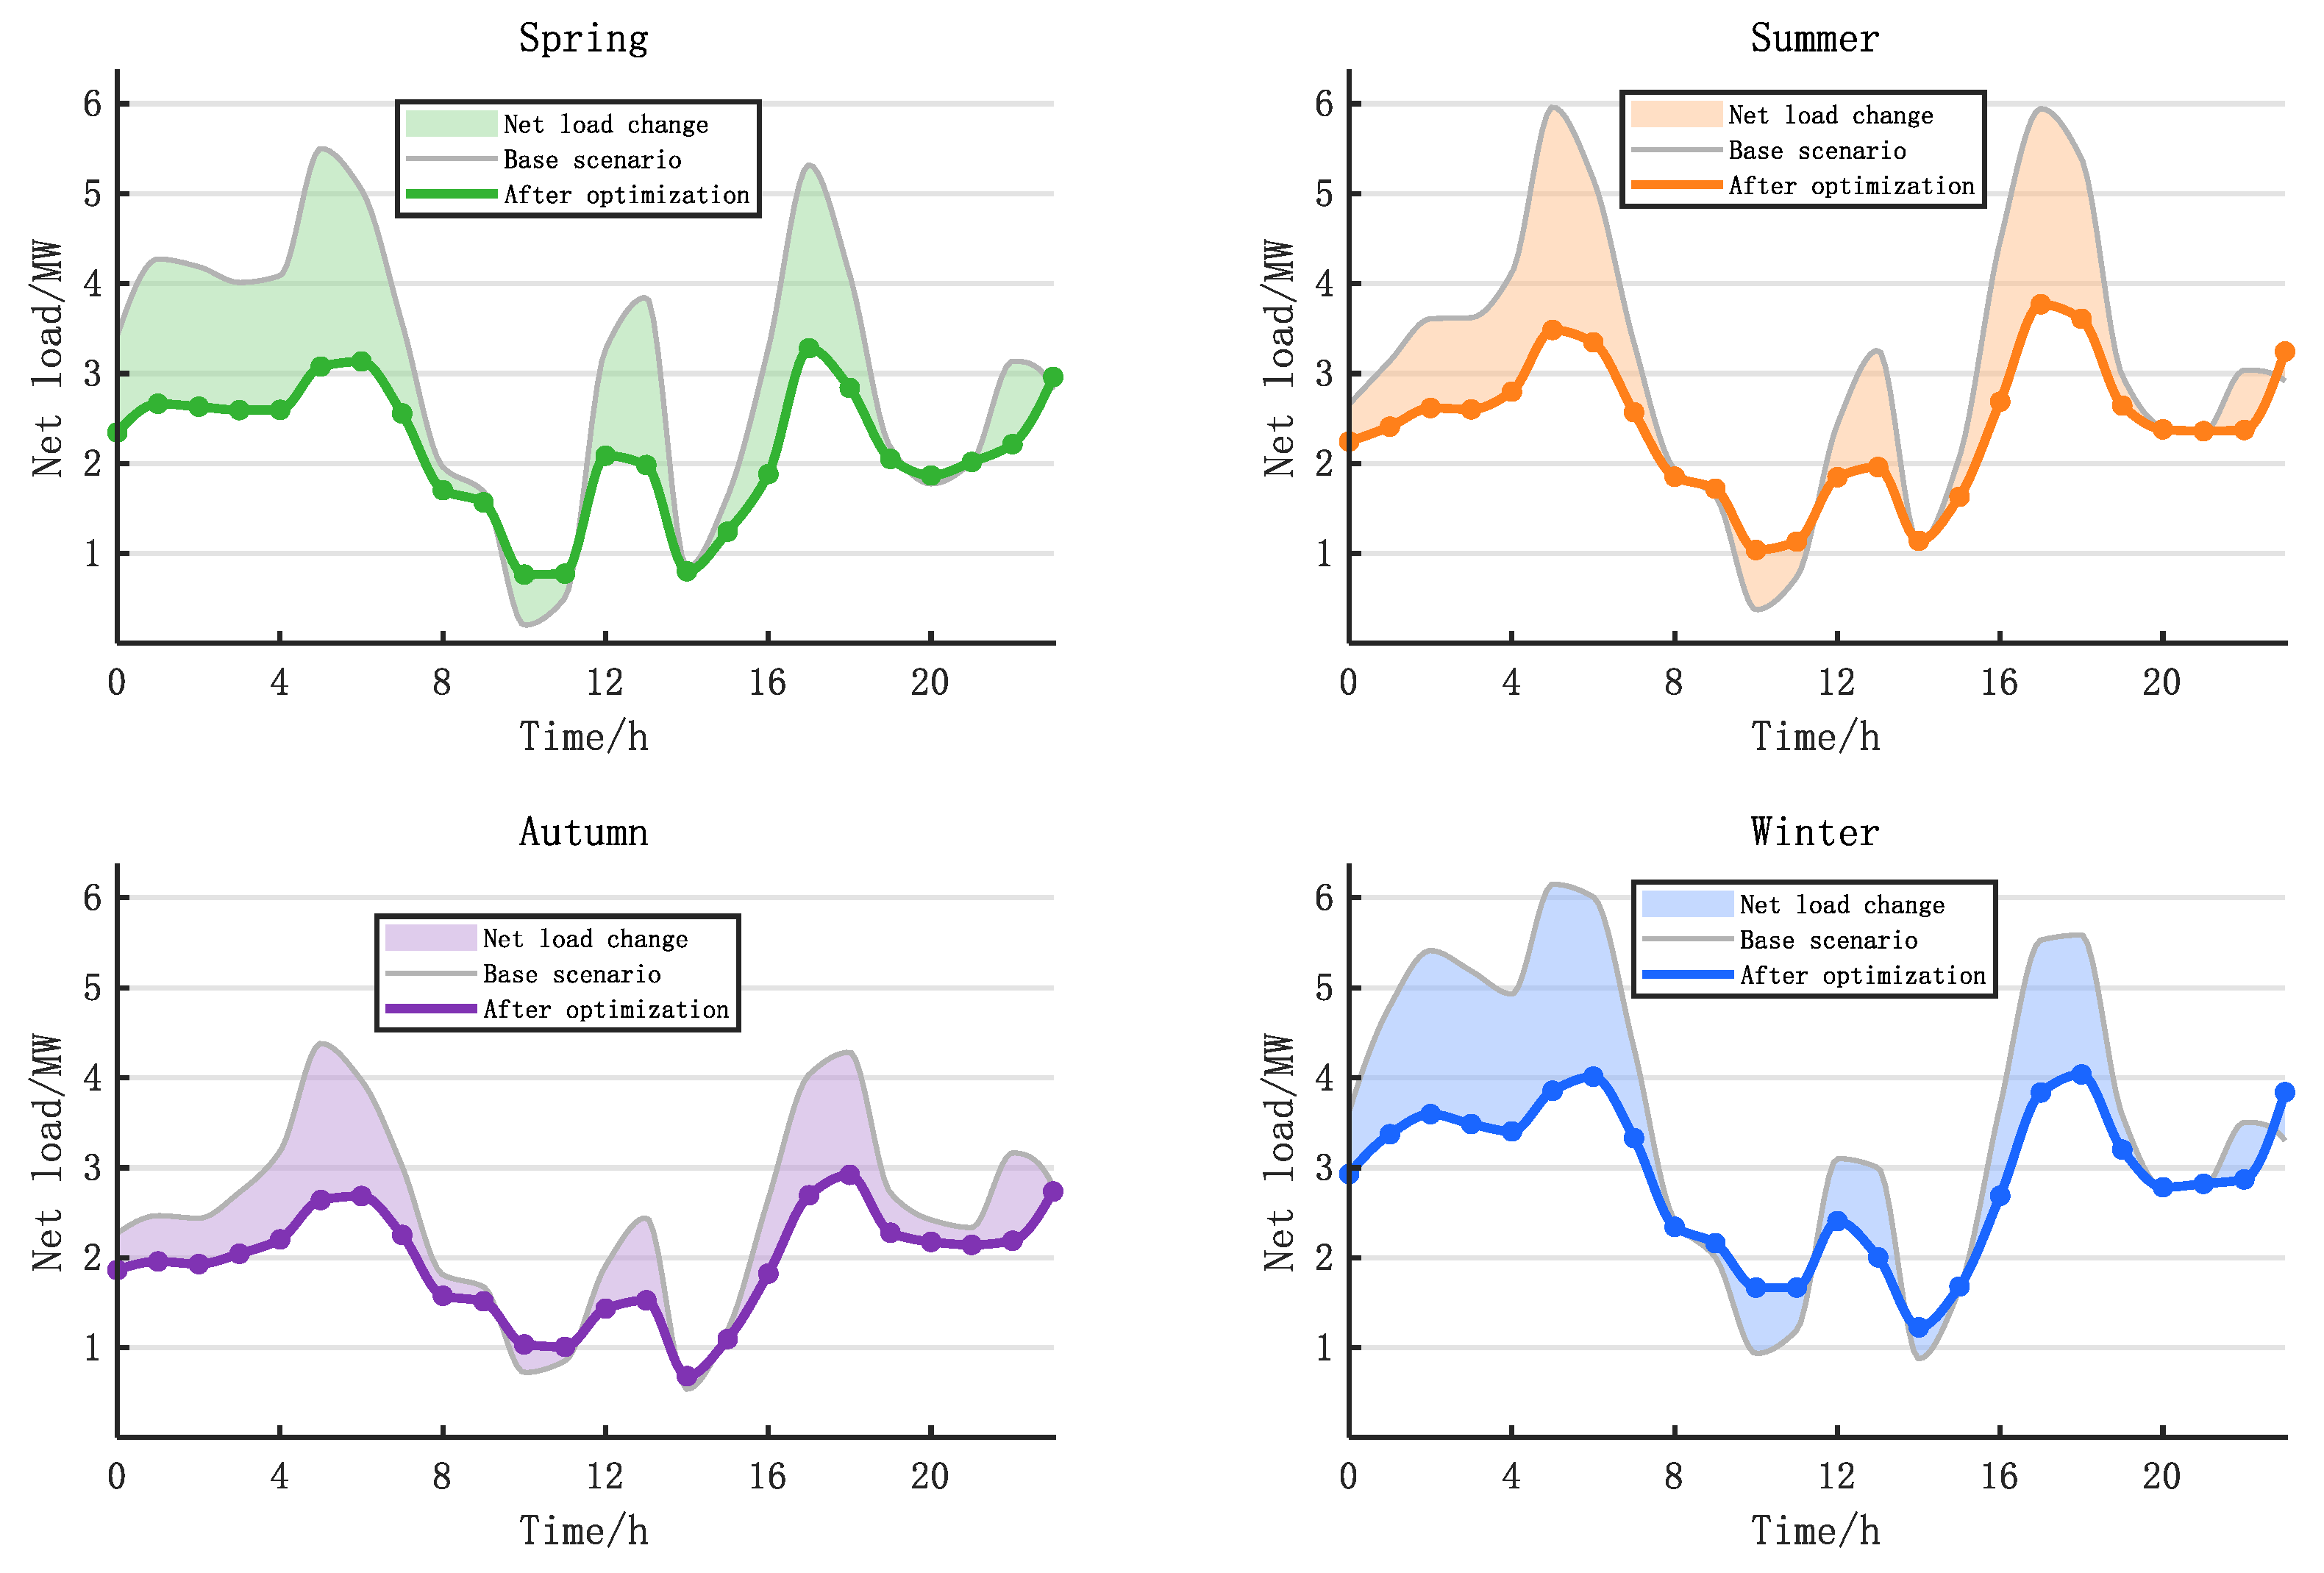
Figure 10 compares the system net load before and after optimization. After optimization, the average net load profiles across all seasons exhibit substantial improvements, with significantly reduced fluctuations and a markedly narrowed peak-to-valley gap. The BESS stores energy during off-peak periods and discharges during peak hours, effectively achieving peak shaving and valley filling. In particular, the pronounced load peaks around 06:00 and 18:00 are effectively mitigated. During nighttime, the net load is mainly stabilized through the combined contribution of WT generation and BESS discharge.
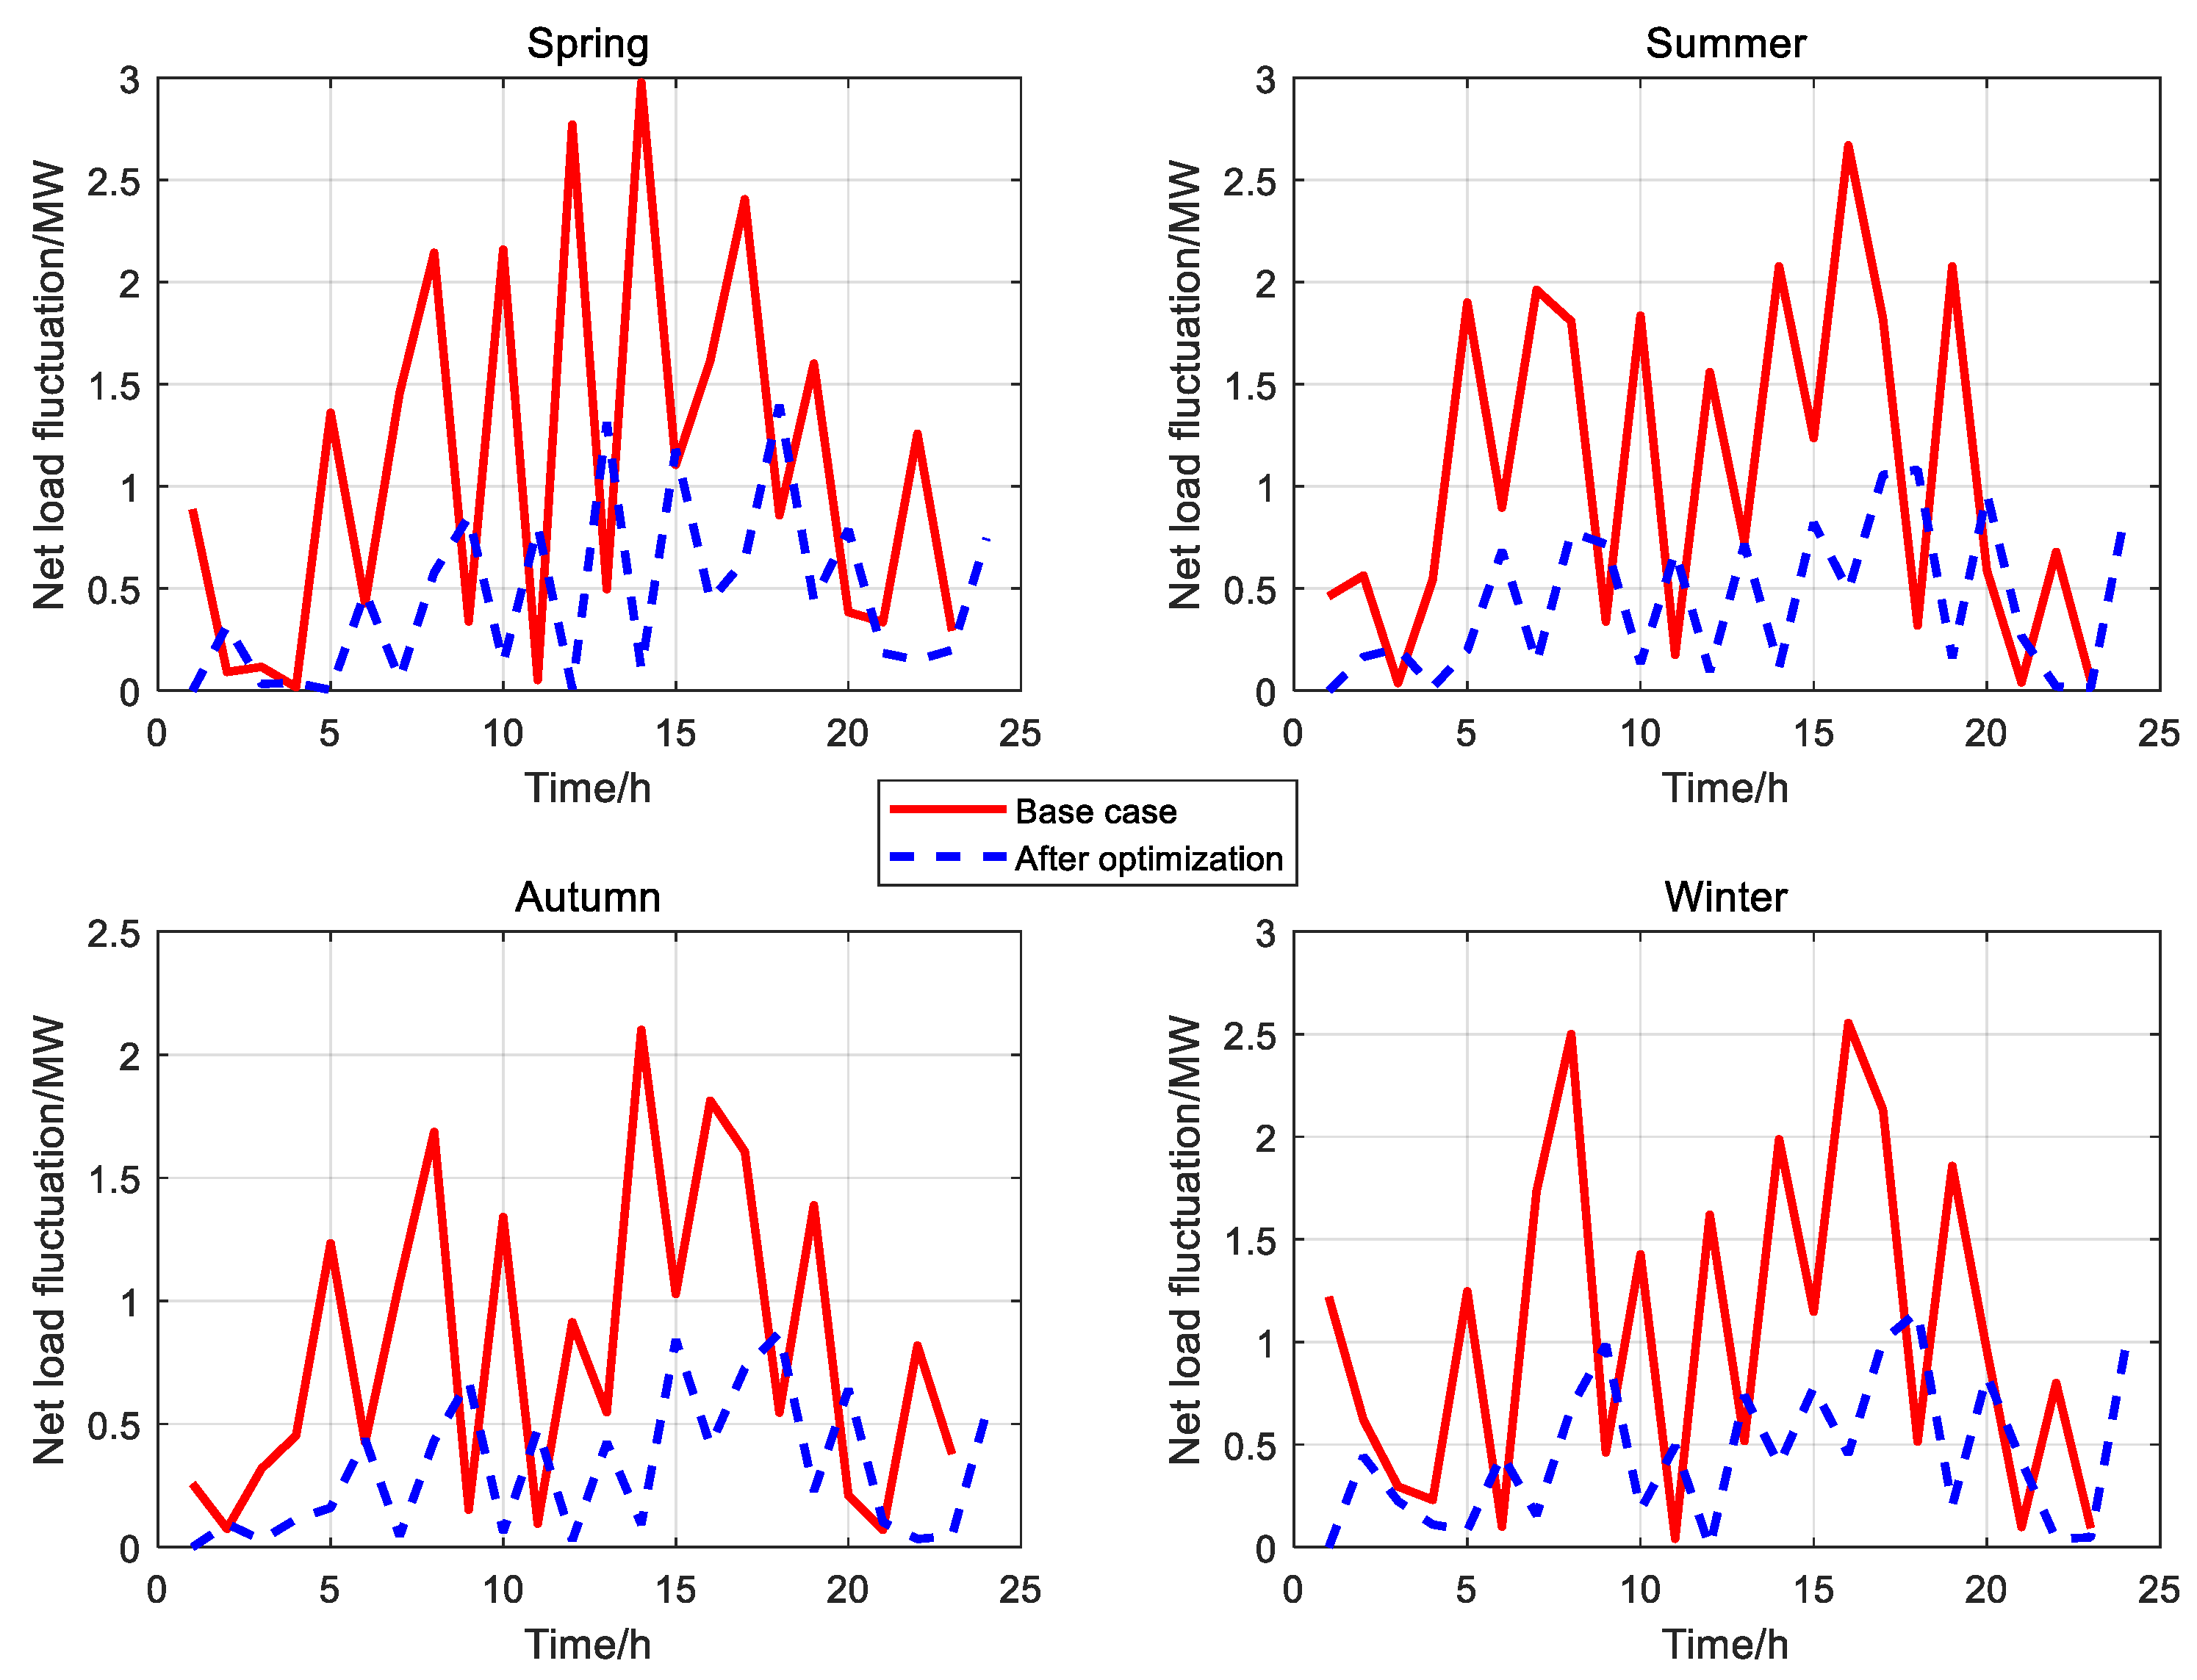
Figure 11 illustrates the load fluctuation characteristics of four seasons. On representative days in spring, summer, autumn, and winter, the base scenario curves exhibit pronounced fluctuations, particularly during peak and valley periods. After optimization, these fluctuations are significantly suppressed, and the overall profiles become smoother. This demonstrates that the proposed model can effectively mitigate load volatility, reduce the impact of sudden changes on the grid, and enhance system operational stability. By charging during off-peak hours and discharging during peak hours, the BESS alleviates sharp peaks and deep valleys, leading to a more balanced load distribution, improved dispatch optimization, reduced frequency regulation pressure, and higher overall operational efficiency.
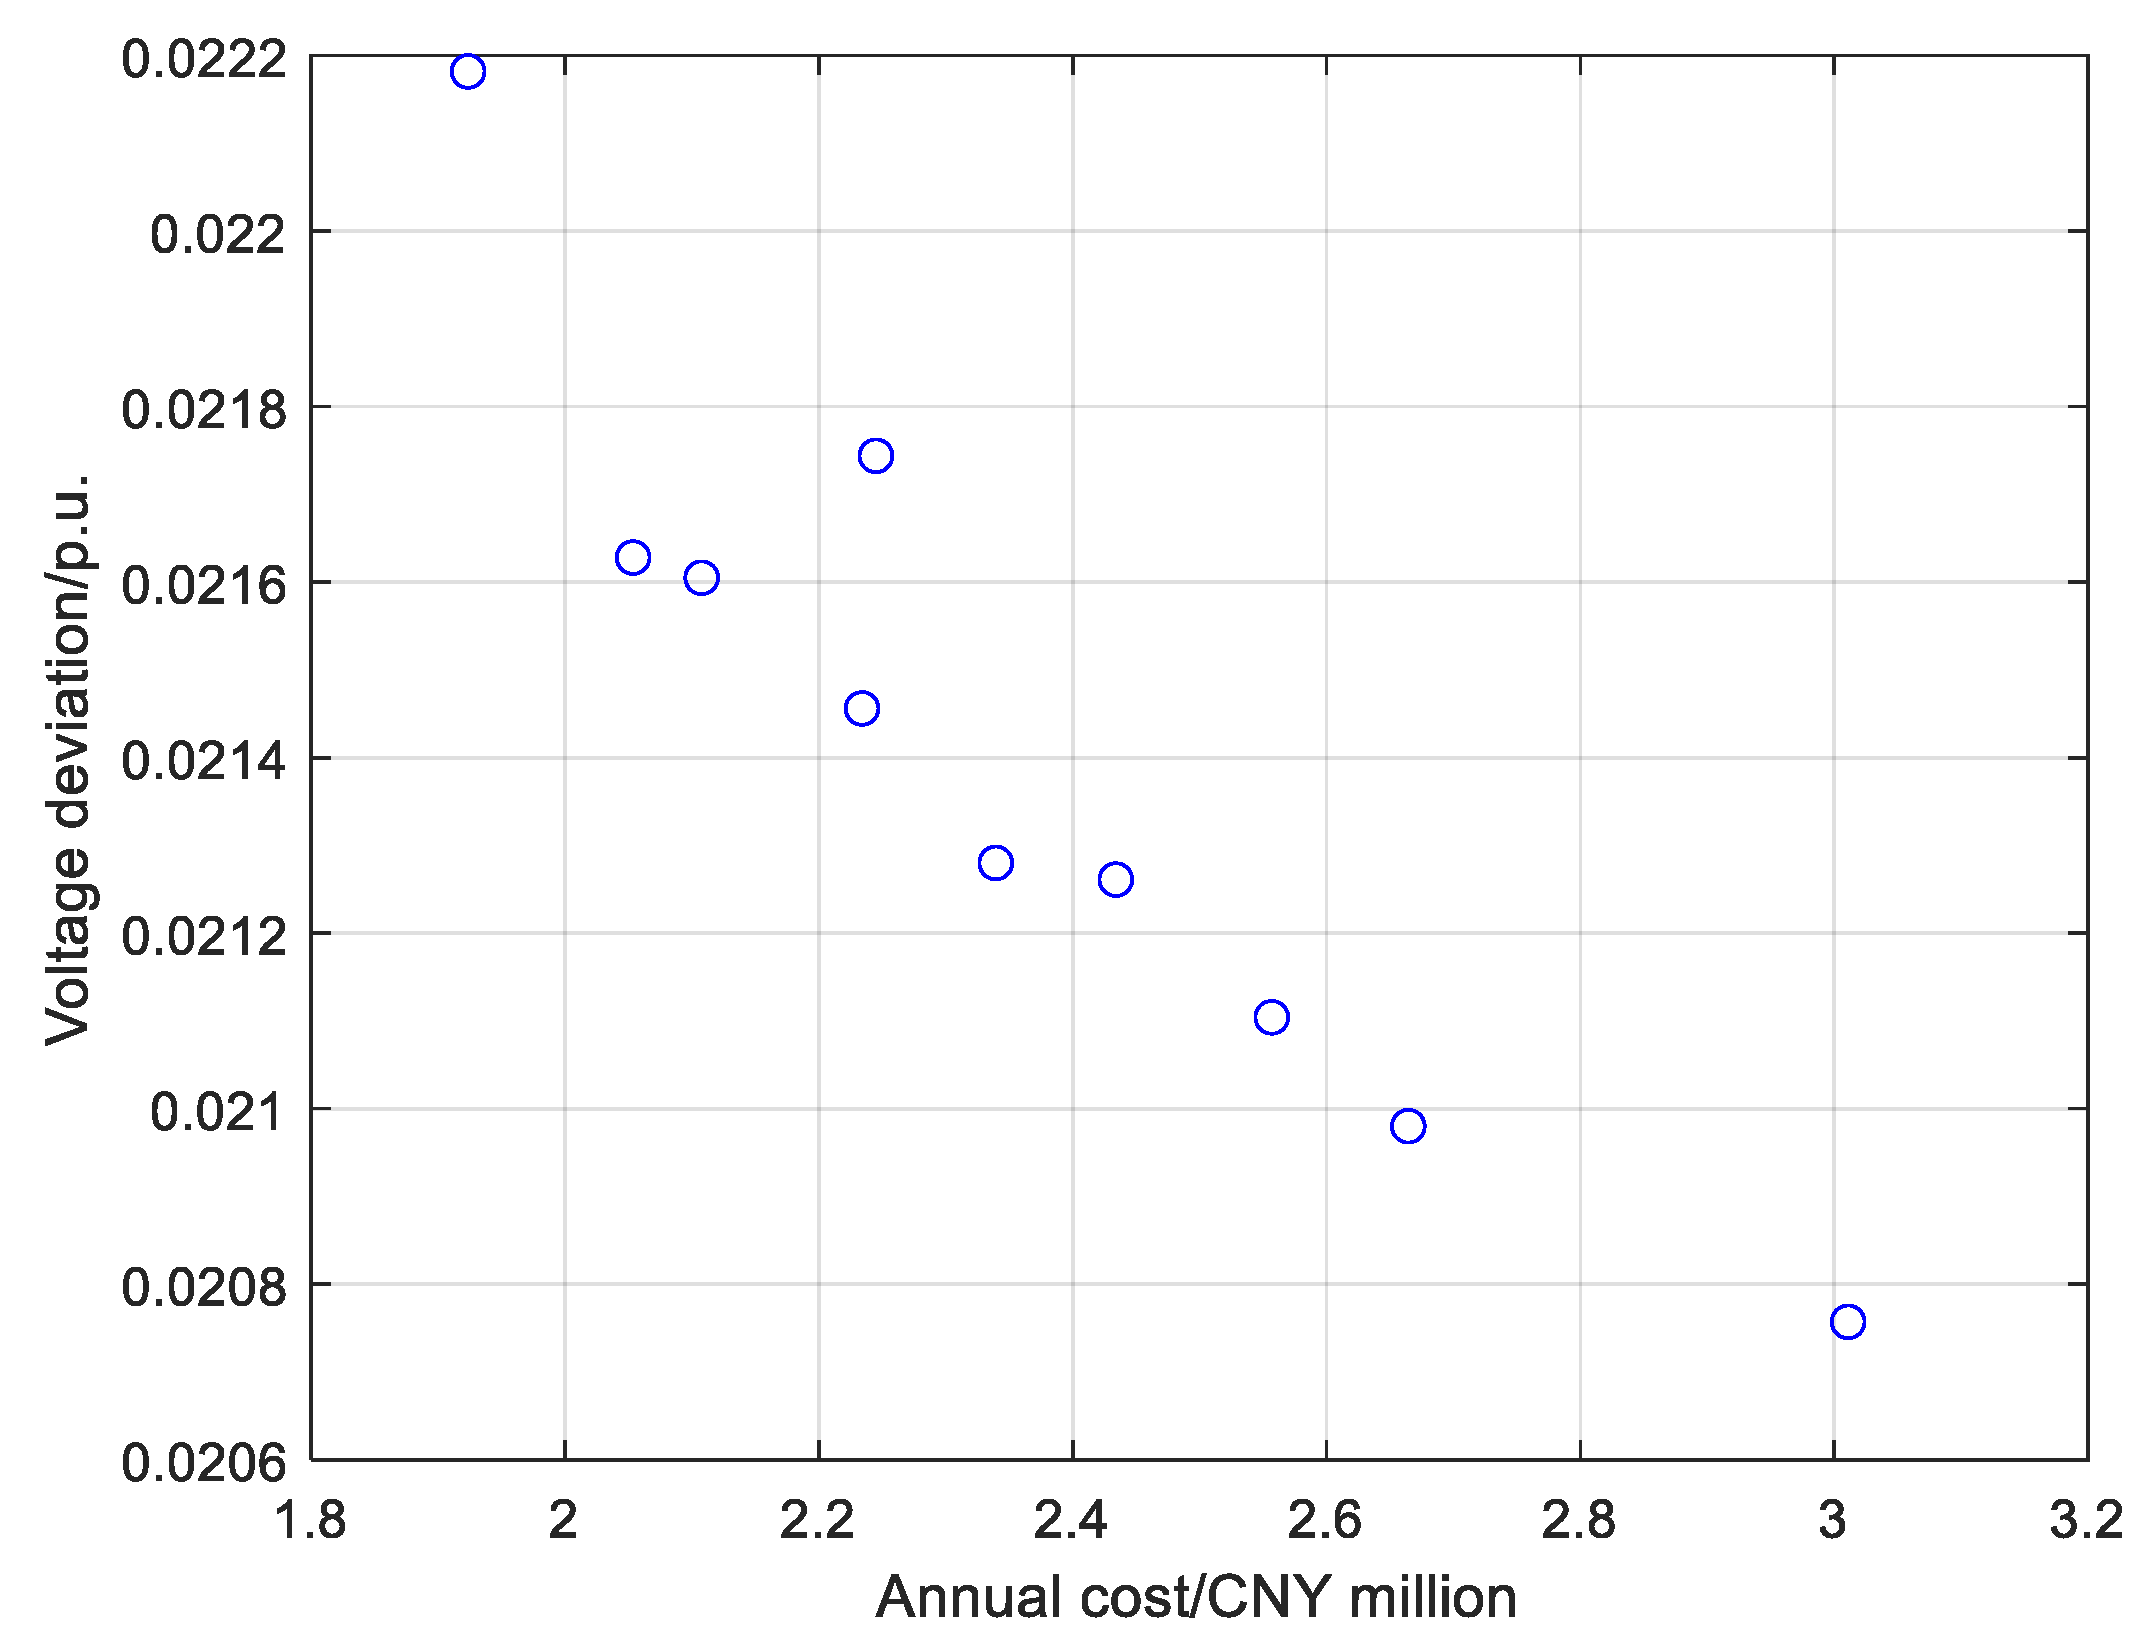
As shown in Figure 12, the Pareto front obtained by the IPLO algorithm clearly reflects the trade-off between annual cost and voltage deviation. The overall distribution presents a descending trend from the upper left to the lower right, illustrating the typical trade-off between reducing voltage deviation and increasing operating costs, a result consistent with conventional findings in power system optimization. Overall, the Pareto set is evenly distributed with complete boundary solutions and without obvious aggregation phenomena. This demonstrates the proposed algorithm’s good convergence and distribution performance, as well as the adaptability of IPLO to complex constraints, thereby providing strong support for the coordinated optimization of economic efficiency and voltage quality in ADNs. Moreover, it can be observed that the Pareto solutions are relatively sparse in the low-cost region. This is primarily because the system in this region relies heavily on renewable generation, while the EV charging load is modeled as an inflexible demand, and the operational boundaries of energy storage further constrain system flexibility. These factors compress the feasible solution space, resulting in a sparse Pareto front. In contrast, the higher-cost region allows more flexible operation of energy storage, leading to a smoother and more desirable Pareto front.
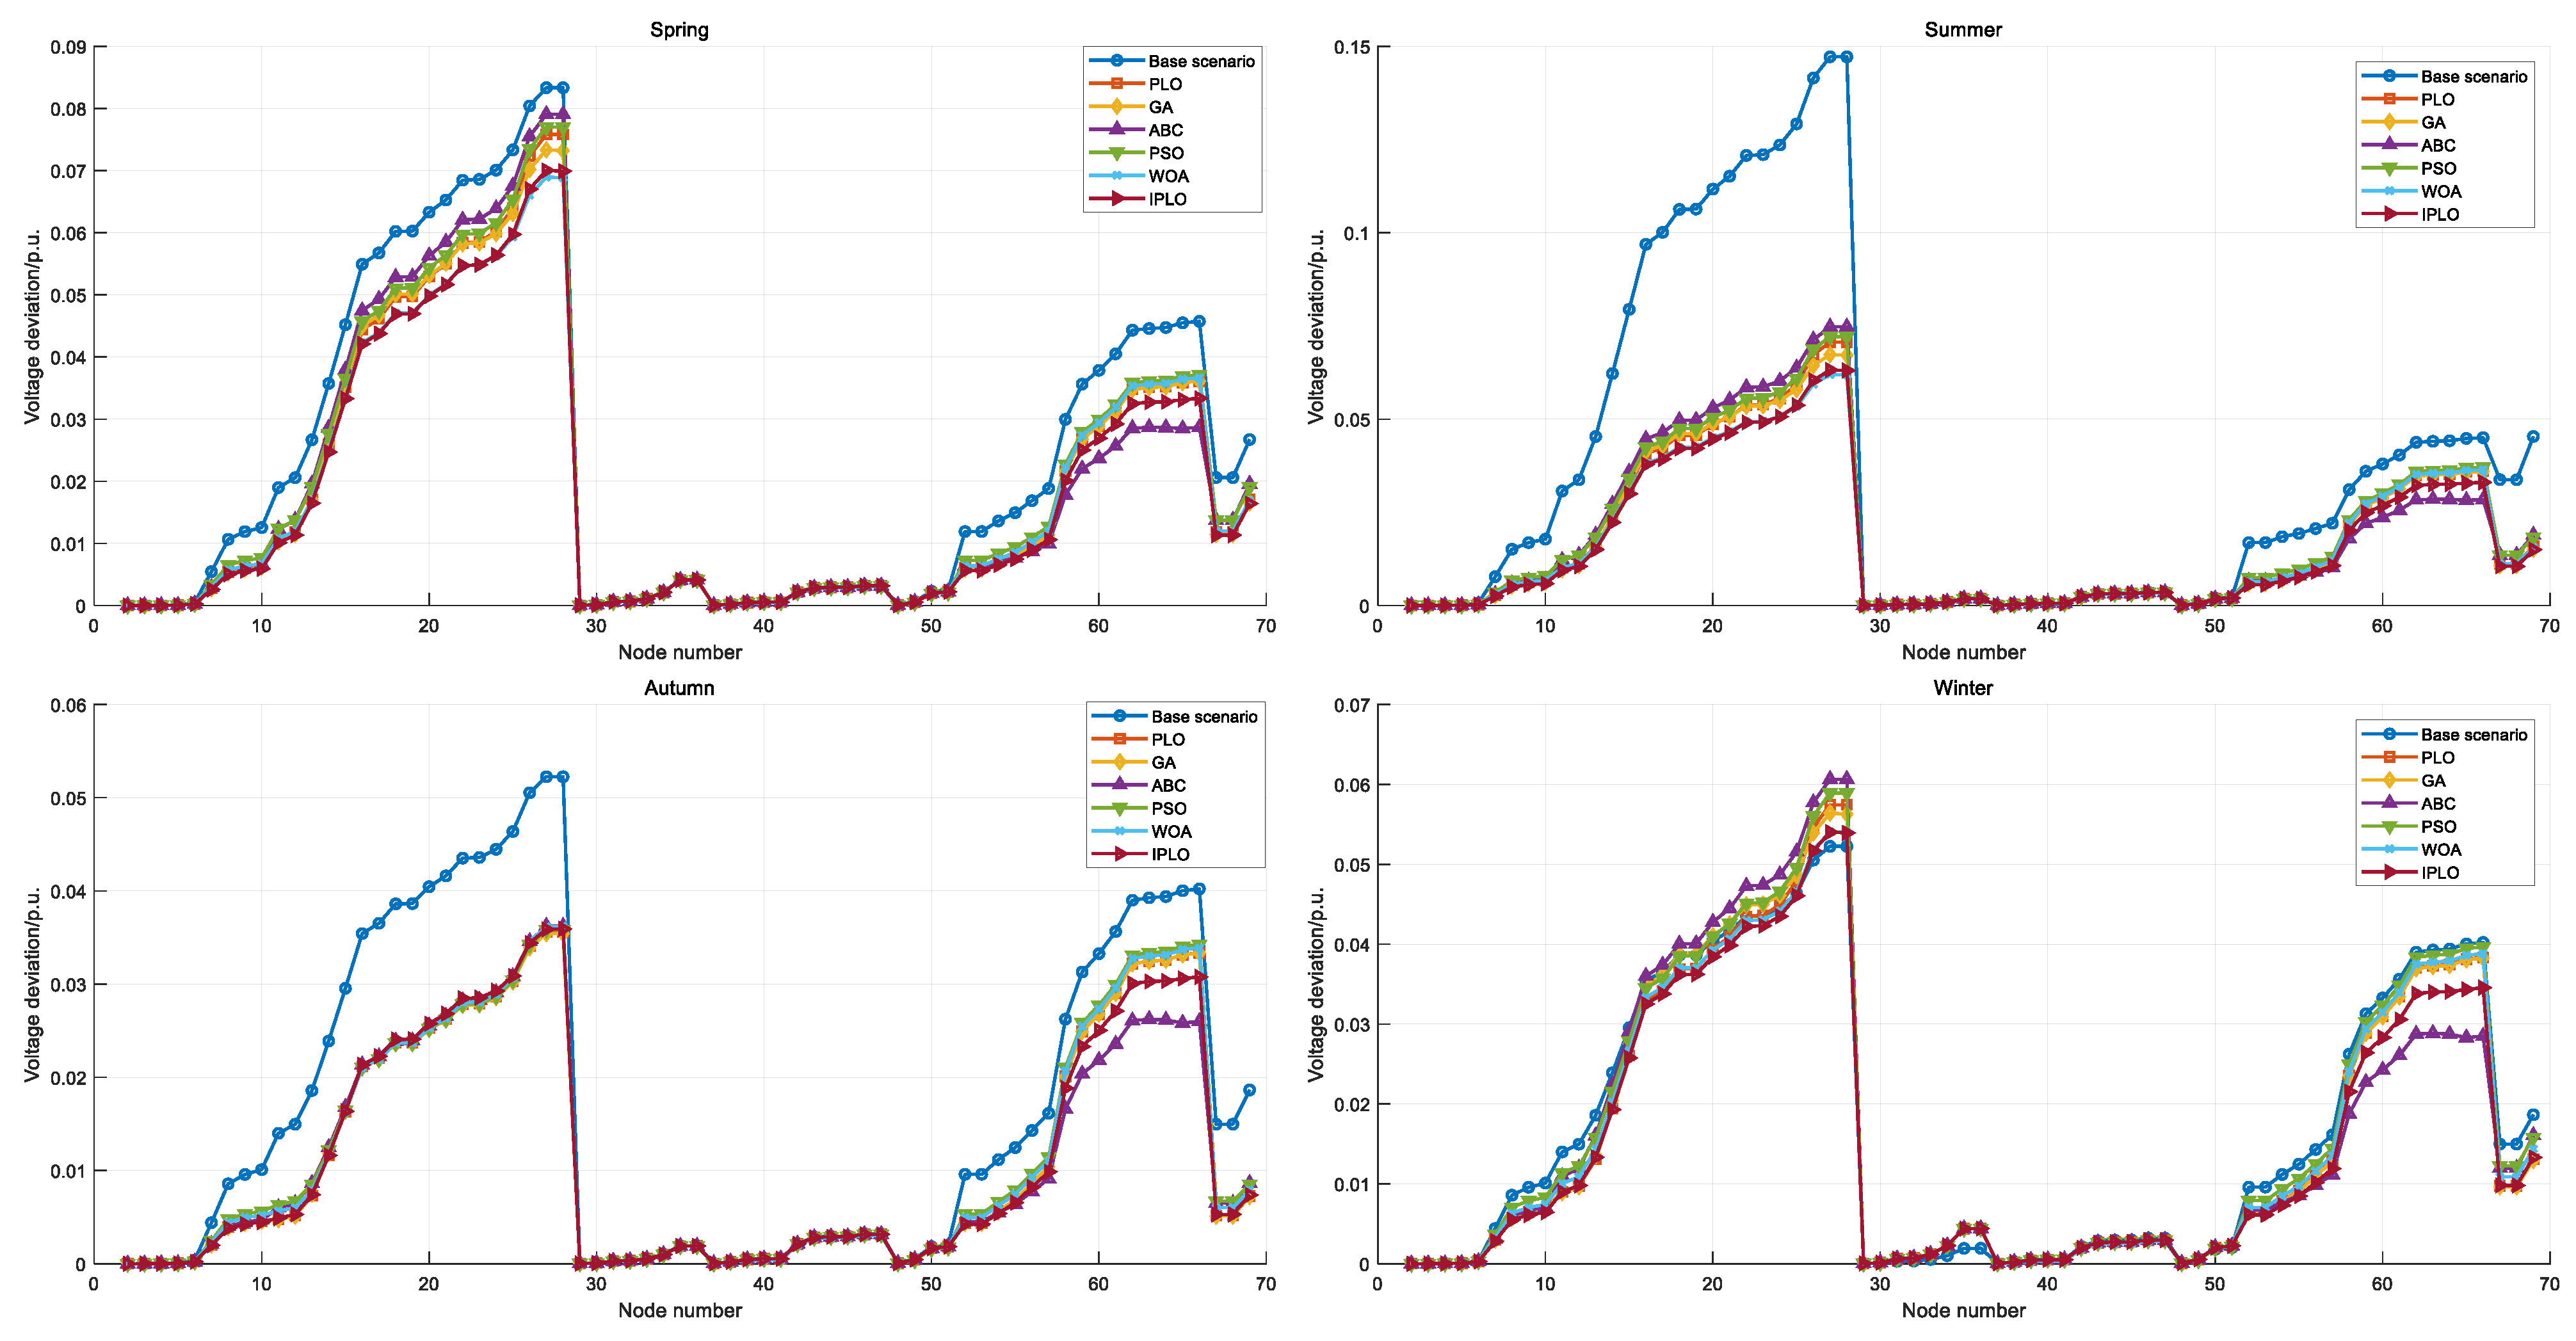
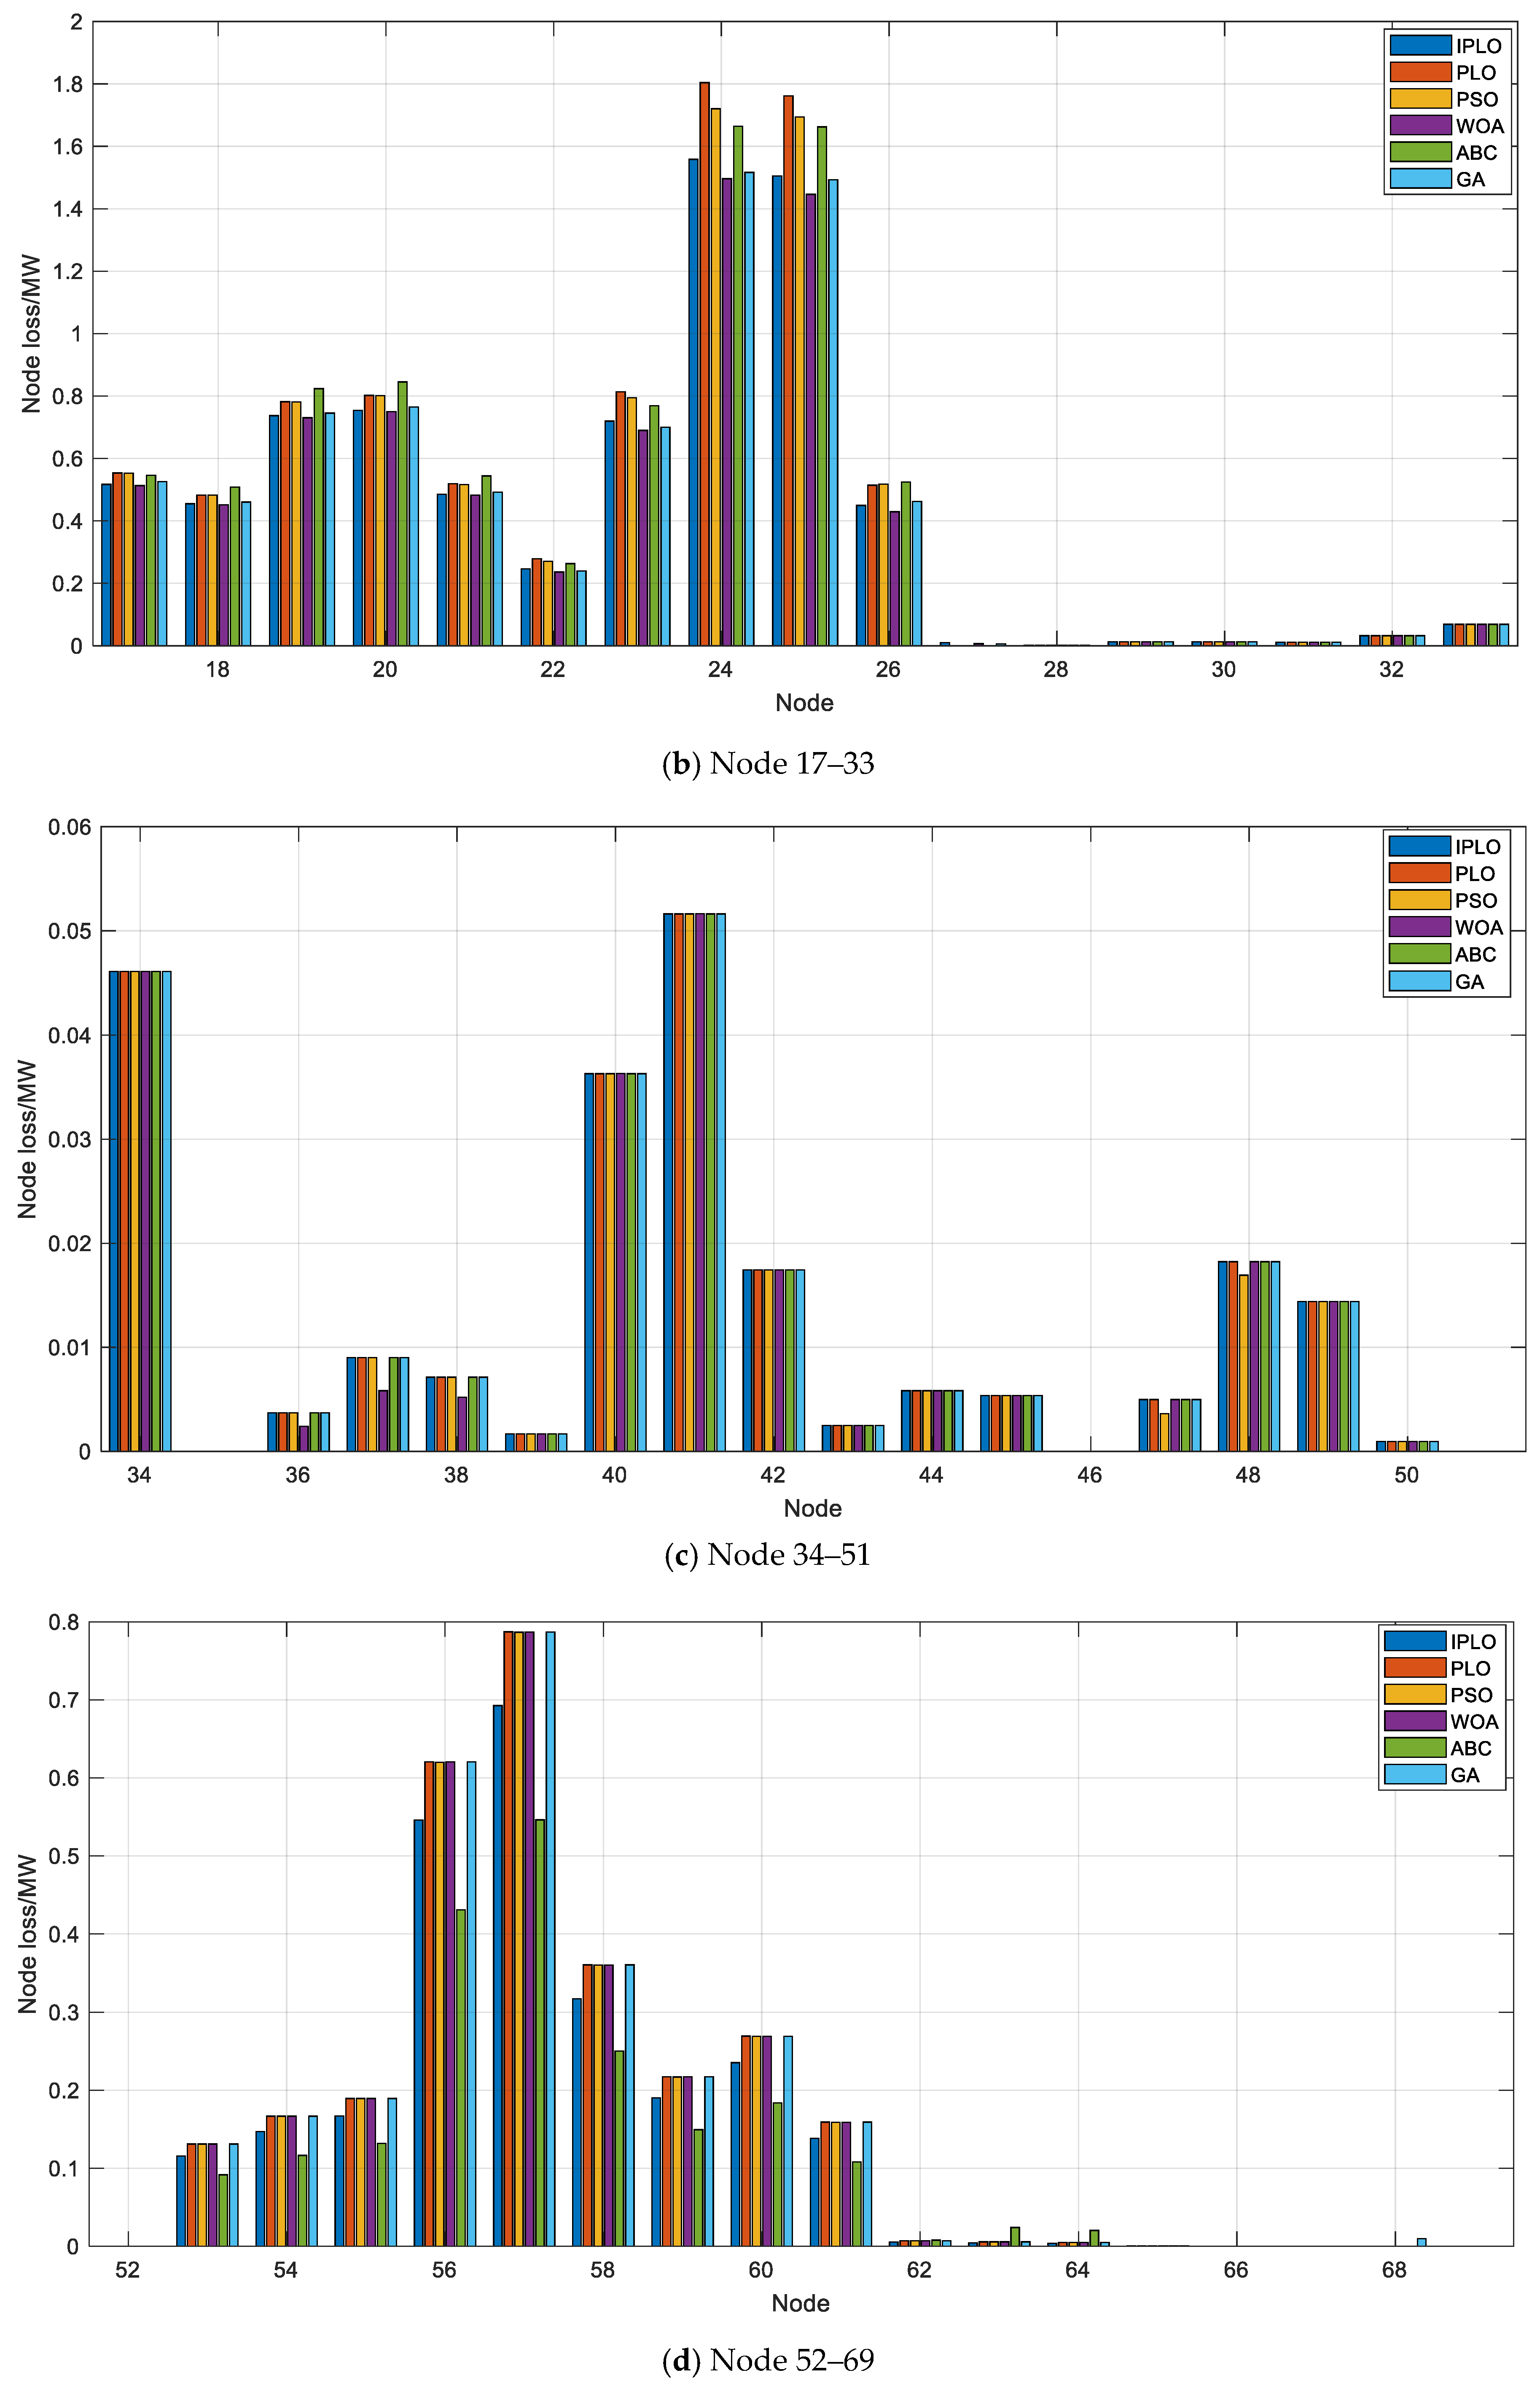
Additionally, the simulation results on the IEEE 69 system further confirm the applicability and effectiveness of the proposed IPLO algorithm in large-scale distribution networks. As shown in Table 4, IPLO achieves significantly lower voltage deviations compared to PLO, PSO, and GA, while maintaining higher average voltage levels and reduced network losses, demonstrating stable overall performance. Although its operating cost is slightly higher than that of some algorithms, IPLO provides a superior trade-off between voltage quality and economic efficiency, with robust convergence in larger systems. Figure 13 and Figure 14 illustrate the voltage deviation improvements and node loss distribution before and after optimization, further highlighting the robustness and scalability of IPLO. These findings indicate that the proposed method is not only effective for small- and medium-scale systems but also exhibits strong potential for application in larger and more complex distribution networks.

4.3. Discussion

The simulation results in Section 4.1 and Section 4.2 show that the proposed IPLO algorithm exhibits pronounced advantages in voltage–deviation control and result stability. Moreover, it maintains solution diversity and robustness across multiple scenarios and constraints, demonstrating its practical value and scalability for multi-objective optimization in distribution networks.
Beyond the presented case, IPLO also has broader applicability in electrical engineering. Owing to its balanced global exploration and local exploitation, it is well suited to complex optimization tasks, such as distribution network reconfiguration, siting and sizing of distributed energy resources, and scheduling of renewables and demand response under uncertainty. These problems are typically high-dimensional and non-convex, where traditional methods often struggle to deliver stable, high-quality solutions.
Regarding load modeling, the EV charging load used in this study is a fixed input obtained by clustering one year of measured data. Looking ahead, incorporating vehicle-to-grid (V2G) interaction offers promising opportunities but also introduces challenges, including the high randomness of charging or discharging behavior, the increased complexity of power-flow calculations due to bidirectional flows, and the trade-off between battery aging costs and operating benefits. Potential remedies include probabilistic or data-driven scenario generation for V2G, explicitly embedding battery lifetime constraints in the optimization framework, and designing distributed or hierarchical control strategies to coordinate large-scale V2G participation. These enhancements would further extend the applicability of the proposed approach in emerging smart-grid scenarios.
Additionally, the BESS is primarily regarded as an active power regulation unit in this study, achieving peak shaving and operating cost reduction through charge–discharge operations. However, in practical applications, BESS can also provide reactive power support, which plays a critical role in voltage stability. Incorporating this functionality into the model could be achieved by introducing P–Q coupling constraints and inverter-based Q–V control strategies, allowing BESS to supply reactive power without exceeding its rated apparent power. This would further enhance the applicability of the model for voltage regulation and power quality improvement, representing a promising direction for future research. Furthermore, the present study only considers the life-cycle cost of BESS without explicitly addressing degradation mechanisms or lifetime extension strategies. In reality, the battery lifetime is strongly influenced by factors such as depth of discharge, charge or discharge rate, and cycle counts. Future work could integrate degradation cost functions or equivalent cycle lifetime models into the existing optimization framework, explicitly embedding battery aging into the objectives and constraints. Such integration would not only ensure economic efficiency and voltage security but also mitigate adverse impacts on battery lifetime caused by excessive cycling.

5. Conclusions

This paper addresses the MOOPF problem of ADNs coupled with PV, WT, EV charging loads, and BESSs, developing a dynamic optimization framework based on the IPLO to optimize four seasonal scenarios. The main conclusions are as follows:
(1) The MOOPF model for ADN proposed in this study fully accounts for the output characteristics of renewable energy, the charging load of EVs, and the integrated role of BESS, thereby providing an accurate representation of the operational characteristics under high renewable energy penetration.
(2) By incorporating population barycenter guidance and dynamic parameter adjustment mechanisms, IPLO enhances both convergence efficiency and solution quality during the search process without increasing computational complexity.
(3) Compared with the IEEE39 base scenario (defined as before optimization, the ADN operating under the same renewable generation and EV load conditions without BESS configuration), the IPLO-based MOOPF significantly reduces voltage deviation by 39.64% and effectively decreases network losses by approximately 34.76%, while maintaining the average voltage level at 0.9997 p.u. This ensures compliance with voltage quality constraints, improving voltage stability and operational economy, and strengthening the capability of the ADN to withstand renewable energy fluctuations.
Overall, the IPLO algorithm demonstrates an improved balance between economic efficiency and voltage quality compared with the base scenario and other algorithms (PSO, GA, WOA, FA, and SA). Specifically, it achieves substantially lower voltage deviations while maintaining operating costs within an acceptable range, thereby reflecting a more favorable trade-off between these two conflicting objectives, offers a practical technical pathway for multi-objective optimization scheduling of ADNs. Future research will focus on the following aspects:
(1) Incorporating the vehicle-to-grid paradigm of EVs to investigate the impact of coordinated charging and discharging optimization on system stability and economic performance.
(2) Extending the model from a single power system to an integrated energy system, in which the coupling of electricity, heating, and cooling is considered to achieve cross-energy coordination, thereby enhancing overall energy efficiency and carbon reduction capability.
(3) Enhancing the modeling of BESS by incorporating both its reactive power support capability and degradation mechanisms, so that joint active–reactive dispatch and lifetime-aware operation can be achieved, thereby improving voltage regulation, economic performance, and long-term sustainability.

Author Contributions

Writing—original draft, P.Z.; writing—review and editing, Y.Z., F.Z., X.R., F.Z., Y.H. and B.Y.; methodology, Y.Z. and F.Z.; software, X.R. and W.H.; formal analysis, W.H.; resources, W.H. and Y.H.; visualization, B.Y. and P.Z.; All authors have read and agreed to the published version of the manuscript.

Funding

This work was supported by Yunnan Power Grid Co., Ltd. Science and Technology Project: Research and application of key technologies for graphical-based power grid accident reconstruction and simulation. (YNKJXM20240333).

Data Availability Statement

Data is only available upon request due to restrictions (privacy).

Conflicts of Interest

Peng Zhang, Fuyou Zhao, Xuan Ruan, Wei Huang and Yang He were employed by Yunnan Power Grid Co., Ltd. The authors declare that they have no known competing financial interests or personal relationships that could have appeared to influence the work reported in this paper.

Nomenclature

Abbreviations
ABCartificial bee colony
BESSbattery energy storage system
ADNactive distribution network
EVelectric vehicle
LCClife cycle cost
GAgenetic algorithm
IPLOimproved polar light optimizer
MOOPFmulti-objective optimal power flow
SBDshape-based distance
SOCstate of charge
OPFoptimal power flow
PLOpolar light optimizer
PSOparticle swarm optimization
PVphotovoltaic
WTwind turbine
WOAwhale optimization algorithm
Parameters
C C w correlation between two time series
λ electricity prices
T p , T f , T v peak, flat, and valley time periods
E B E S S t energy stored in the BESS
P c h , B E S S , P d i s , B E S S charging and discharging power of BESS
η c h , η d i s charging and discharging efficiencies of BESS
T L depreciation period
S O C B E S S state of charge of BESS
E B E S S , r a t e rated capacity of BESS
P l o a d total load power of the ADN
P P V , P W T PV and wind power generation
N n the number of nodes in the ADN
P B E S S power output or input of BESS
P b a s e baseline load power of the ADN
P E V charging load power of EV
U node voltage
c b a , c i n unit cost of the battery and converter
L e v y d random number of Lévy distribution
U B , L B upper and lower bounds
v particle speed
W weighting coefficient
r random number

References

  1. Li, H.; Yu, H.Y.; Liu, Z.J.; Wu, X.; Cao, B.R.; Zhang, C.; Liu, D. Long-term scenario generation of renewable energy generation using attention-based conditional generative adversarial networks. Energy Convers. Econ. 2024, 5, 15–27. [Google Scholar] [CrossRef]
  2. Hou, H.; Wang, Z.; Zhao, B.; Zhang, L.Q.; Shi, Y.; Xie, C.J.; Dong, Z.Y.; Yu, K.R. Distributed optimization for joint peer-to-peer electricity and carbon trading among multi-energy microgrids considering renewable generation uncertainty. Energy Convers. Econ. 2024, 5, 116–131. [Google Scholar] [CrossRef]
  3. Wang, J.B.; Wen, J.F.; Wang, J.R.; Yang, B.; Lin, J. Water electrolyzer operation scheduling for green hydrogen production: A review. Renew. Sustain. Energy Rev. 2024, 203, 114779. [Google Scholar] [CrossRef]
  4. Yang, Z.; Wang, H.Y.; Liao, W.L.; Bak, C.L.; Chen, Z. Protection challenges and solutions for AC systems with renewable energy sources: A review. Prot. Control. Mod. Power Syst. 2025, 10, 18–39. [Google Scholar] [CrossRef]
  5. Jiang, C.X.; Lin, Z.; Liu, C.X.; Chen, F.X.; Shao, Z.G. MADDPG-Based active distribution network dynamic reconfiguration with renewable energy. Prot. Control. Mod. Power Syst. 2024, 9, 143–155. [Google Scholar] [CrossRef]
  6. Yang, B.; Li, J.L.; Shu, H.C.; Cai, Z.L.; Tang, B.; Huang, X.Y.; Zhu, M.M. Recent advances of optimal sizing and location of charging stations: A critical overview. Int. J. Energy Res. 2022, 46, 17899–17925. [Google Scholar] [CrossRef]
  7. Yang, B.; Yu, L.; Chen, Y.X.; Ye, H.Y.; Shao, R.N.; Shu, H.C.; Yu, T.; Zhang, X.S.; Sun, L.M. Modelling, applications, and evaluations of optimal sizing and placement of distributed generations: A critical state-of-the-art survey. Int. J. Energy Res. 2020, 45, 3615–3642. [Google Scholar] [CrossRef]
  8. Jisoo, K.; Jean, M. Development of coordinated control method based on Graph search method between EV and DG for voltage regulation. Int. J. Electr. Power Energy Syst. 2024, 162, 110295. [Google Scholar] [CrossRef]
  9. Nibeditha, N.; Rajan Singaravel, M.M. Optimal sizing of PV–Wind generators with a smart EV charging framework to build grid friendly Net Zero Energy Campus. Sustain. Cities Soc. 2024, 111, 105575. [Google Scholar] [CrossRef]
  10. Tayenne, D.D.L.; Luis, G.G.; João, S.; Franco, J.F. Optimal probabilistic framework for grid cost operation considering voltage probability constraints and high penetration of EVs, wind and PV generation. J. Clean. Prod. 2025, 521, 146241. [Google Scholar] [CrossRef]
  11. Yuan, W.Q.; Li, Y.L.; Chen, X.L.; Zhang, S.F.; Wan, J.; Tian, H.L. Research on distance protection scheme for single-phase to ground faults in active distribution networks with gap-grounded transformers. Prot. Control. Mod. Power Syst. 2025, 10, 123–141. [Google Scholar] [CrossRef]
  12. Gao, H.J.; Wang, R.J.; He, S.J.; Wang, Z.Q.; Liu, J.Y. Bi-level stackelberg game-based distribution system expansion planning model considering long-term renewable energy contracts. Prot. Control. Mod. Power Syst. 2023, 8, 1031–1045. [Google Scholar] [CrossRef]
  13. Vaishya, S.R. An AC optimal power flow framework for active–reactive power scheduling considering generator capability curve. Energy Convers. Econ. 2023, 4, 425–438. [Google Scholar] [CrossRef]
  14. Ahmed, B.; Sulaiman, S.A.; Ijaz, A.; Khalid, M.; Abido, M.A.; AI-Ismail, F.S. Optimal power flow: A review of state-of-the-art techniques and future perspectives. IEEE Access 2025, 13, 60012–60039. [Google Scholar]
  15. Subhrajyoti, S.; Ajit, K.B.; Abhishek, K. Multi-objective optimal power flow with DG placement using TLBO and MIPSO: A comparative study. Energy Procedia 2017, 117, 236–243. [Google Scholar] [CrossRef]
  16. Zhu, J.H.; Yu, X.B.; Wang, F.; Mao, Y.Q. Multi-objective optimal power flow problem using constrained dynamic multitasking multi-objective optimization algorithm. Swarm Evol. Comput. 2025, 93, 101850. [Google Scholar] [CrossRef]
  17. Masoud, A.; Zaipatimah, A.; Vigna, K.R.; Ridha, H.M. A memory-guided Jaya algorithm to solve multi-objective optimal power flow integrating renewable energy sources. Appl. Soft Comput. 2024, 164, 11924. [Google Scholar]
  18. Ravi, K.A.; Vinod, K.D.M.; Anil, K.A.; Reddy, N.N. A TOPSIS based multi-objective optimal power flow approach using the artificial hummingbird algorithm for renewable energy and PEV integrated system. Measurement 2025, 256, 118337. [Google Scholar] [CrossRef]
  19. Aljaidi, M.; Jangir, P.; Arpita; Agrawal, S.P.; Pandya, S.B.; Parmar, A.; Gulothungan, G.; Alkoradees, A.F.; Khishe, M.; Jangid, R. Polar lights optimizer: A novel algorithm for accurate parameter estimation in proton exchange membrane fuel cells. Results Eng. 2025, 27, 106571. [Google Scholar] [CrossRef]
  20. Sikder, N.; Das, D. Optimal planning of microgrid with integrated QV bus and energy storage system considering uncertainties in load, renewable power generation, failure rates, and repair times of branches. J. Energy Storage 2025, 127, 116915. [Google Scholar] [CrossRef]
  21. Datta, U.; Kalam, A.; Shi, J. Smart control of BESS in PV integrated EV charging station for reducing transformer overloading and providing battery-to-grid service. J. Energy Storage 2020, 28, 101224. [Google Scholar] [CrossRef]
  22. Bhatia, A.A.; Das, D. Demand response strategy for microgrid energy management integrating electric vehicles, battery energy storage system, and distributed generators considering uncertainties. Sustain. Energy Grids Netw. 2025, 41, 101594. [Google Scholar] [CrossRef]
  23. Cao, T.W.; Xu, Y.L.; Liu, G.W.; Tao, S.Y.; Tang, W.J.; Sun, H.B. Feature-enhanced deep learning method for electric vehicle charging demand probabilistic forecasting of charging station. Appl. Energy 2024, 371, 123751. [Google Scholar] [CrossRef]
  24. Chen, S.J.; Wang, P.; Lü, J.H. k-Shape clustering enhances group lasso for gene selection and sample classification. IEEE Trans. Comput. Biol. Bioinform. 2025, 22, 1176–1188. [Google Scholar]
  25. Zhu, J.; Miao, Y.; Dong, H.; Li, S.L.; Chen, Z.Y.; Zhang, D. Short-term residential load forecasting based on K-shape clustering and domain adversarial transfer network. J. Mod. Power Syst. Clean Energy 2024, 12, 1239–1249. [Google Scholar]
  26. Zhang, W.; Cheng, M.; Xiang, Q.; Li, Q.M. Enhancing short-term load forecasting through K-Shape clustering and deep learning integration. IEEE Access 2025, 13, 30817–30832. [Google Scholar] [CrossRef]
  27. Yang, H.; Yan, C.; Chen, Z.; Wang, P. A K-shape clustering based transformer-decoder model for predicting multi-step potentials of urban mobility field. IEEE Trans. Intell. Transp. Syst. 2024, 25, 10298–10312. [Google Scholar]
  28. Yang, L.; Zhang, Z. A deep attention convolutional recurrent network assisted by K-shape clustering and enhanced memory for short term wind speed predictions. IEEE Trans. Sustain. Energy 2022, 13, 856–867. [Google Scholar] [CrossRef]
  29. Song, Y.Q.; Shangguan, L.Z.; Li, G.J. Simulation analysis of flexible concession period contracts in electric vehicle charging infrastructure public-private-partnership (EVCI-PPP) projects based on time-of-use (TOU) charging price strategy. Energy 2021, 228, 120328. [Google Scholar] [CrossRef]
  30. He, B.; Yang, B.; Han, Y.M.; Zhou, Y.M.; Hu, Y.W.J.; Shu, H.C.; Su, S.; Yang, J.; Huang, Y.P.; Li, J.L.; et al. Optimal EVCS planning via spatial-temporal distribution of charging demand forecasting and traffic-grid coupling. Energy 2024, 313, 133885. [Google Scholar] [CrossRef]
  31. Chen, C.Y.; Hu, B.; Xie, K.G.; Xiang, B. A peak-valley TOU price model considering power system reliability and power purchase risk. Power Syst. Technol. 2014, 38, 2141–2148. [Google Scholar]
  32. Zhang, W.Z.; Xu, C.B. Capacity configuration optimization of photovoltaic-battery-electrolysis hybrid system for hydrogen generation considering dynamic efficiency and cost learning. Energy Convers. Econ. 2024, 5, 78–92. [Google Scholar] [CrossRef]
  33. Yang, B.; Wang, J.T.; Chen, Y.X.; Li, D.Y.; Zeng, C.Y.; Chen, Y.J.; Guo, Z.X.; Shu, H.C.; Zhang, X.S.; Yu, T.; et al. Optimal sizing and placement of Energy storage system in power grids: A state-of-the-art one-stop handbook. J. Energy Storage 2020, 32, 101814. [Google Scholar] [CrossRef]
  34. Sharma, J.; Sundarabalan, C.K.; Balasundar, C. Advanced energy management strategy for enhancing battery lifespan in solar PV-powered EV charging stations with hybrid energy storage systems. Renew. Energy 2025, 251, 123443. [Google Scholar] [CrossRef]
  35. Yuan, C.; Zhao, D.; Heidari, A.A.; Liu, L.; Chen, Y.; Chen, H.L. Polar lights optimizer: Algorithm and applications in image segmentation and feature selection. Neurocomputing 2024, 607, 128427. [Google Scholar] [CrossRef]
  36. Li, S.B.; Guo, L.; Zhu, J.Z.; Liu, M.L.; Chen, J.X.; Meng, Z.H. Short-term multi-step wind speed forecasting with multi-feature inputs using variational mode decomposition, a novel artificial intelligence network, and the polar lights optimizer. Renew. Energy 2026, 256, 123965. [Google Scholar] [CrossRef]
  37. Shao, J.C.; Zhou, X.N.; Shao, Q.K.; Chen, H.L.; Pan, B.J. A novel lymph node metastasis prediction method for gastric cancer: Enhanced support vector machine with polar lights optimization. Biomed. Signal Process. Control. 2026, 111, 108349. [Google Scholar] [CrossRef]
  38. Ekariansyah, A.S.; Muwonge, M.; Saefuttamam, M.R.; Dikaimana, Y.; Nasruddin. Energy, exergy, and exergy-economic optimization of a multigeneration system driven by geothermal primary heat source using multi-objective genetic algorithm (MOGA). Energy 2025, 330, 136653. [Google Scholar] [CrossRef]
  39. Du, P.; Ye, Y.X.; Wu, H.; Wang, J.Z. Study on deterministic and interval forecasting of electricity load based on multi-objective whale optimization algorithm and transformer model. Expert Syst. Appl. 2025, 268, 126361. [Google Scholar] [CrossRef]
  40. Nkalo, U.K.; Inya, O.O.; Ifeanyi, O.P.; Ifeanyi, P.; Bola, A.U.; Ewean, D.I. A modified multi-objective particle swarm optimization (M-MOPSO) for optimal sizing of a solar–wind–battery hybrid renewable energy system. Sol. Compass 2024, 12, 100082. [Google Scholar] [CrossRef]
  41. Cao, Q.F.; Wang, H.L.; Hui, Z.J.; Chen, L.Y. Optimal location and sizing of multi-resource distributed generator based on multi-objective artificial bee colony algorithm. Energy Eng. 2024, 121, 499–521. [Google Scholar] [CrossRef]
  42. Zhu, X.H.; Hu, X.; Shi, N.; Zhang, Y.; Zhong, J.W. Multi-layer embedded optimization of micro-grid capacity considering price and incentive/compensation coupling mechanisms. Electr. Power 2023, 56, 173–186. [Google Scholar]
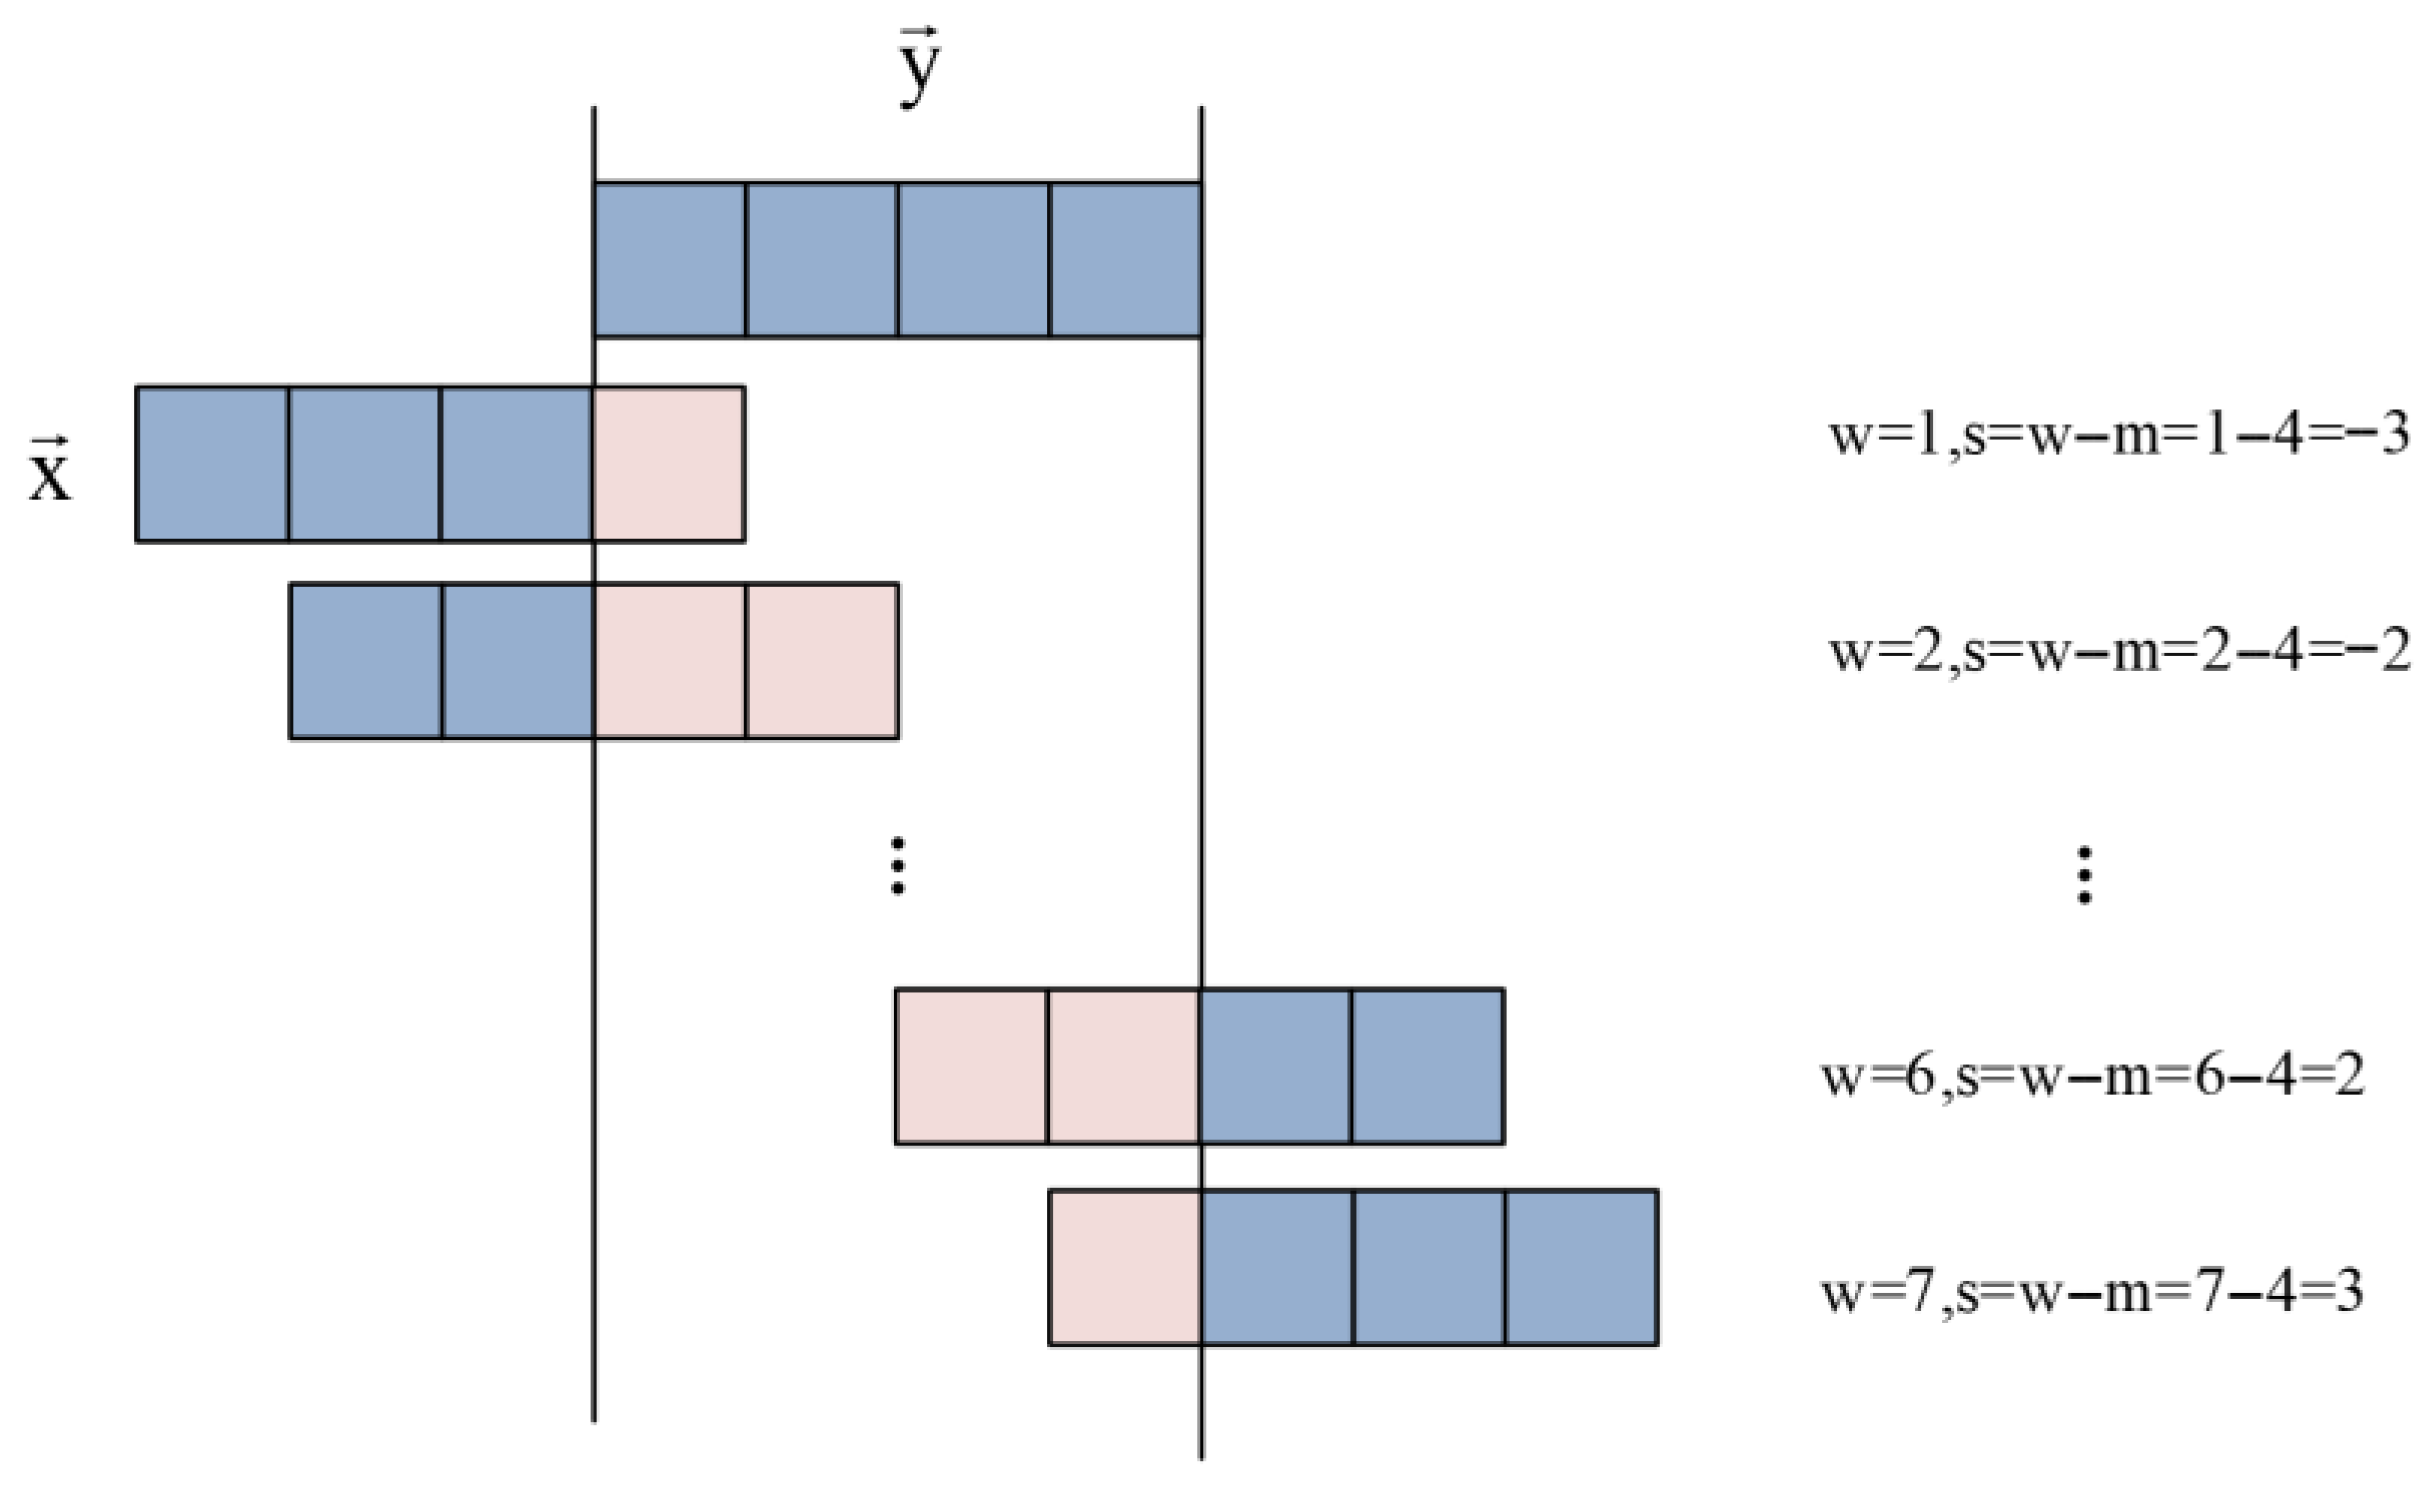
Figure 1. Illustration of sequence alignment process in shape-based distance computation.
Energies 18 05403 g001
Figure 2. Comparison between centroid and barycenter of the population.
Energies 18 05403 g002
Figure 3. Flowchart for MOOPF based on IPLO.
Energies 18 05403 g003
Figure 4. IEEE 33 bus topology diagram.
Energies 18 05403 g004
Figure 5. K-shape-based clustering results of seasonal EV charging loads.
Energies 18 05403 g005
Figure 6. IEEE 39 system voltage deviation before and after optimization.
Energies 18 05403 g006
Figure 7. Voltage deviation boxplot of each algorithm.
Energies 18 05403 g007
Figure 8. Node loss after optimization of each algorithm.
Energies 18 05403 g008
Figure 9. Power balance of typical days in four seasons.
Energies 18 05403 g009
Figure 10. Comparison of net loads in four seasons before and after the IPLO optimization.
Energies 18 05403 g010
Figure 11. Load fluctuations in the four seasons before and after the IPLO optimization.
Energies 18 05403 g011
Figure 12. Pareto solution set of IPLO.
Energies 18 05403 g012
Figure 13. IEEE 69 system voltage deviation before and after optimization.
Energies 18 05403 g013
Figure 14. IEEE 69 system node loss after optimization of each algorithm.
Energies 18 05403 g014aEnergies 18 05403 g014b
Table 1. System parameters.
ParameterValueParameterValue
WT capacity0.5 MW/unitSOC range0.1–0.9
PV capacity1.6 MW/unitCharge/discharge efficiency0.96, 1/0.96
Monte Carlo simulation runs100BESS power range−4~4 MW
Valley electricity price [42](1:00–6:00, 23:00–24:00): 290.5 CNY/MWhBESS capacity range0–4 MWh
Peak electricity price [42](11:00–13:00, 18:00–22:00): 1443.5 CNY/MWhSingle line failure probability0.01
Flat electricity price [42](7:00–10:00, 14:00–17:00): 1023.0 CNY/MWh
Table 2. Algorithms settings.
AlgorithmParameterValue
Global parametersMax iterations200
Population size10
Pareto solution size10
IPLO and PLOInitial damping factor1.25
Levy exponent1.50
Balance parameter0.50
GACrossover probability0.7
Mutation probability0.01
PSOInertia weight0.80
Individual learning factor1.00
Popular learning factor1.00
ABCScout limit10
Noise perturbation0.01
WOAInitial convergence factor1.00
Spiral coefficient0.10
Convergence factor0.10
Random acceptance rate0.05
Table 3. Comparison of the MOOPF results for different algorithms (IEEE 39).
AlgorithmAnnual Costs (CNY Million/Year)Voltage Deviation (p.u.)Average Voltage Level (p.u.)Network Losses (MWh/Year)Run Time (s)
Base scenario-0.034910.99891119.63-
IPLO2.36140.021070.9997737.8913,216
PLO2.42360.021370.9997742.1513,143
PSO1.98790.021850.9996770.7712,803
WOA2.11070.021780.9996752.3612,100
ABC1.92510.022140.9996787.5729,144
GA1.84150.022190.9995767.8111,627
Table 4. Comparison of the MOOPF results for different algorithms (IEEE 69).
AlgorithmAnnual Costs (CNY Million/Year)Voltage Deviation (p.u.)Average Voltage Level (p.u.)Network Losses (MWh/Year)Run Time (s)
Base scenario-0.026860.97573809.98-
IPLO3.06500.015210.97692504.5923,789
PLO3.00990.016110.97672660.4522,817
PSO3.02370.016890.97672664.0223,250
WOA2.95930.015790.97692520.5823,931
ABC2.80950.016080.97672592.5738,141
GA3.42370.016060.97682562.8523,983
Disclaimer/Publisher’s Note: The statements, opinions and data contained in all publications are solely those of the individual author(s) and contributor(s) and not of MDPI and/or the editor(s). MDPI and/or the editor(s) disclaim responsibility for any injury to people or property resulting from any ideas, methods, instructions or products referred to in the content.