Article

Enhanced-Dueling Deep Q-Network for Trustworthy Physical Security of Electric Power Substations

by
Nawaraj Kumar Mahato
1,
Junfeng Yang
1,2,
Jiaxuan Yang
1,
Gangjun Gong
1,*,
Jianhong Hao
3,
Jing Sun
4 and
Jinlu Liu
4
1
Beijing Engineering Research Center of Energy Electric Power Information Security, North China Electric Power University, Beijing 102206, China
2
School of Computer, Heze University, Heze 274015, China
3
School of Electrical and Electronics Engineering, North China Electric Power University, Beijing 102206, China
4
Power China Northwest Engineering Corporation Limited, Xian 710065, China
*
Author to whom correspondence should be addressed.
Energies 2025, 18(12), 3194; https://doi.org/10.3390/en18123194
Submission received: 17 April 2025 / Revised: 6 June 2025 / Accepted: 10 June 2025 / Published: 18 June 2025
(This article belongs to the Special Issue Energy, Electrical and Power Engineering: 3rd Edition)

Abstract

:
This paper introduces an Enhanced-Dueling Deep Q-Network (EDDQN) specifically designed to bolster the physical security of electric power substations. We model the intricate substation security challenge as a Markov Decision Process (MDP), segmenting the facility into three zones, each with potential normal, suspicious, or attacked states. The EDDQN agent learns to strategically select security actions, aiming for optimal threat prevention while minimizing disruptive errors and false alarms. This methodology integrates Double DQN for stable learning, Prioritized Experience Replay (PER) to accelerate the learning process, and a sophisticated neural network architecture tailored to the complexities of multi-zone substation environments. Empirical evaluation using synthetic data derived from historical incident patterns demonstrates the significant advantages of EDDQN over other standard DQN variations, yielding an average reward of 7.5, a threat prevention success rate of 91.1%, and a notably low false alarm rate of 0.5%. The learned action policy exhibits a proactive security posture, establishing EDDQN as a promising and reliable intelligent solution for enhancing the physical resilience of power substations against evolving threats. This research directly addresses the critical need for adaptable and intelligent security mechanisms within the electric power infrastructure.

Graphical Abstract

1. Introduction

With the increasing vulnerability of physical security threats to electric power, substations urge the requirement for the urgent need for robust security measures [1,2,3]. The traditional security measures and approaches, such as manual monitoring and static defence systems such as static surveillance systems, security guards, and fixed access controls, often fall short in addressing the dynamic and unpredictable nature of evolving threats, such as ballistic attacks, human intrusions, or equipment sabotage, which can lead to significant outages and economic losses [4,5]. These systems also suffer from other limitations, such as delayed threat detection and inefficient response mechanisms. This necessitates the development of adaptive and smart systems which may be capable of real-time threat detection and making appropriate response decisions.
Currently, reinforcement learning (RL) has emerged as a promising framework for addressing such challenges. The RL achieves this by enabling agents to learn the optimal policies through interaction with their environment [6,7,8]. In RL, an agent learns to make decisions by maximizing a cumulative reward signal and adapting its behavior based on trial-and-error experiences [6,8]. Further, Deep Q-Networks (DQN) is a class of RL networks which combines a deep neural network with Q-learning [6,8]. This algorithm has shown remarkable success in complex decision-making tasks such as Atari games [9] and controlling robotic systems [10]. However, the standard DQNs have some limitations in environments with large state and action spaces. It often suffers from overestimation bias and inefficient learning [11]. In order to overcome these problems, many other advanced variants of reinforced learning have been proposed, such as Dueling DQN [12,13,14] and Double DQN [15,16,17]. The Dueling DQN separates the Q-value estimation into state value and action advantage components, which improves its learning efficiency [14]. The Double DQN mitigates the overestimation bias by decoupling the action selection and evaluation [18]. Also, article [19] proposes a multi-agent DQN framework for enhancing dynamic network slicing beyond 5G networks by overcoming the overestimation bias of Vanilla DQN through action space reduction and efficient experience replay mechanisms, integrating Double DQN to improve learning stability. Regardless of these advancements, applying RL to the physical security of substations requires further enhancement to enhance the trustworthiness—defined as a high threat prevention rate, low false alarm rate and robust performance under varying conditions.
This research tackles the physical security challenges in electric power substations, where traditional static systems like manual monitoring often fail due to delayed threat detection and inefficient resource allocation, by proposing the Enhanced-Dueling Deep Q-Network (EDDQN), an advanced reinforcement learning framework designed to enhance security through real-time threat detection and response optimization. The substation security problem is mathematically formulated as a Markov Decision Process (MDP), which captures the complex and dynamic interactions across multiple zones, enabling the development of policies that maximize cumulative rewards while minimizing threats, vulnerabilities, and false alarms [20,21,22]. The EDDQN, an evolution of Dueling DQN, integrates Double DQN in order to mitigate overestimation bias, Prioritized Experience Replay (PER) to enhance sample efficiency by prioritizing significant experiences, and a dueling architecture to separate state-value and advantage streams for improved decision-making in large state spaces. The model aims to leverage real-time data from sources such as CCTV feeds, intrusion sensors, and environmental monitors to monitor zones, detect potential threats, and initiate adaptive responses, such as activating alarms, securing access points, or alerting security personnel. Due to the unavailability of real-time data, a synthetic dataset is generated to simulate these scenarios, facilitating controlled training of the EDDQN agent through interaction with the environment to learn optimal decision-making strategies. Further, a reward function is used to incentivize successful threat prevention, penalize failures and false alarms, and ensure a balanced policy that prioritizes security without excessive false positives, thus enhancing operational efficiency. By preventing attacks, minimizing unnecessary interventions, reducing outages, and bolstering the substation’s integrity, EDDQN strengthens resilience against evolving threats.
The rest of this paper is structured as follows: Section 2 presents the problem formulation and modeling, Section 3 presents the case study and simulation, and, finally, Section 4 concludes the paper.

2. Problem Formulation and Modeling

The number of physical security incidents (such as theft, vandalism, sabotage, suspicious activities, etc.) in electrical facilities, including substations, has increased [3,23,24]. Conventional security measures, such as rule-based systems or manual monitoring, often struggle to adapt to the dynamic and stochastic nature of these threats. This conventional method leads to delayed responses, and there are also excessive false alarms. Reinforcement learning (RL), particularly Deep Q-Networks (DQNs), offers a promising approach by enabling an agent to learn the optimal policies through interaction with the environment. This balances threat prevention and operational efficiency. This research models the substation physical security problem as a Markov Decision Process (MDP) to formalize the decision-making framework. It also employs EDDQN in order to develop trustworthy policies that address multiple objectives, including maximizing threat prevention while minimizing false alarms. The following subsections discuss the application and formulation of MDP and EDDQN in depth for the physical security of substations.

2.1. Markov Decision Process (MDP)

In order to address the challenges of physical security in electric power substations, this research formulates the problem as an MDP. This mathematical model provides a robust framework for decision-making in stochastic environments. Now, let us define an MDP by a tuple S , A , P , R , γ , where S is the state space, A is the action space, P is the state transition probabilities, R is the reward function, and γ 0 , 1 is the discount factor [20]. Here, the security system acts as an agent that observes the state of the substations. Then, we take appropriate actions in order to mitigate the threats. Subsequently, the reward is awarded based on its performance. The main objective is to harden the security policies. This is achieved by learning optimal actions that enhance threat prevention while maintaining reliability. This is the process of policy hardening. This formulation allows the agent to adapt to the dynamic nature of physical threats such as theft, vandalism, suspicious activities, insider threats, etc. This ensures both proactive and reactive responses.
Let us assume that the state space S = 0 , 1 , 2 n captures the security status of n zones within the substation, where each zone i has a state s i 0 , 1 , 2 . Here, s i = 0 indicates a normal state with no detected activity, s i = 1 indicates a suspicious state where potential threat indicators (suspicious activity) are observed (such as motion detection, unauthorized access attempts, etc.), and s i = 2 denotes a confirmation of threats (such as vandalism, theft or sabotage, etc.).
In this study, we set n = 3 , which means that the substations are divided into three security zones. This can be represented as s = 1 , 0 , 2 , which denotes that zone 1 is suspicious, zone 2 is normal, and zone 3 has a confirmed threat detected. Further, the action space A = 0 , 1 , 2 , , n allows the agent to either do nothing a = 0 or require focused security resources on a specific zone a 1 , , n . This focusing on the zone involves actions such as activating alarms, increasing surveillance, deploying personnel or police, etc. This enhances the probability of threat prevention in that particular zone. This discrete action space aligns with the requirement of reinforcement learning. This enables the agent to make focused decisions in a multi-zone environment.
The transition dynamics of the MDP can be defined by probabilities that control how each zone’s state evolves based on the current state and the action of the agent. This ensures that the model effectively captures the stochastic nature of the physical threat. These transitions remain independent across zones and are conditioned on the action a ι and formalized as follows. If a zone is in state s i = 2 (threat detected), it resets to s i = 0 (normal state) in the next time step, reflecting automatic mitigation procedures. For a zone in state s i = 0 (normal state), the probability of transitioning to s i = 1 (suspicious) is expressed as in Equation (1), and it remains in a normal state with the probability as expressed in Equation (2).
P s i = 1 | s i = 0 = p 0 1
P s i = 0 | s i = 0 = 1 p 0 1
Again, when a zone is in state s i = 1 (suspicious), two scenarios are possible. Now, with probability 1 p t h r e a t , any threats do not occur, and the zone either returns to normal state P s i = 0 | s i = 1 = p 1 0 or still stays suspicious P s i = 1 | s i = 1 = 1 p 1 0 . Then, with the probability p t h r e a t , a threat occurs, and the outcome depends on the action taken. If the agent focuses on the zone a = i , the threat is prevented with the probability as expressed in Equation (3), returning the zones to normal or failing with the probability as expressed in Equation (4), which results in a detected threat.
P s i = 0 | s i = 1 , a = i = p h i g h
P s i = 2 | s i = 1 , a = i = 1 p h i g h
P s i = 0 | s i = 1 , a i = p l o w
Moreover, if the agent does not focus on the zone a i , the prevention probability drops as expressed in Equation (5), with a higher chance of failure P s i = 2 | s i = 1 , a i = 1 p l o w . The overall transition probability for the state vector can be expressed as the product across zones, as expressed in Equation (6).
P s s , a = i = 1 n P s i | s i , a
Now, in this study, we used p 0 1 = 0.1 , p t h r e a t = 0.5 , p h i g h = 0.9 , p l o w = 0.3 and p 1 0 = 0.2 , reflecting the realistic dynamics based on incident data. Figure 1 demonstrates the state transition for a single zone. This shows the possible transition and their associated probabilities. Also, the visual dynamics of MDP are clearly shown in Figure 1.
Thereafter, the reward function needs to be designed to harden the policies. This policy hardening is performed by incentivizing threat prevention while penalizing undetected threats and false alarms. Now, for each zone i, the reward component r i can be computed as discussed as follows. If s i = 1 and a threat occurs (with the probability p t h r e a t ), the agent receives r i = + r p r e v e n t = + 1 if the threat is prevented (resulting in s i = 0 ), or r i = c t h r e a t = 10 ( c t h r e a t is the constant penalty value) if the threat is not prevented (resulting in s i = 2 ). If no threat occurs or the zone is not in a suspicious state, r i = 0 . Additionally, a false alarm penalty can be applied: if the agent focuses on a zone a > 0 and no threat occurs in that zone, a penalty r f a l s e = c f a l s e = 0.1 ( c f a l s e is the constant penalty value) is incurred; otherwise, r f a l s e = 0 . The total reward can be expressed as the sum across all the zones and the false alarm penalty, as in Equation (7).
r = i n r i + r f a l s e
This reward structure encourages the agent to focus on zones with genuine threats while avoiding unnecessary actions. This is the key aspect of policy hardening. Figure 2 demonstrates the reward computation process as a flowchart. It also highlights the conditions for positive rewards, penalties and false alarms. This ensures that the agent learns to balance security effectiveness with operational costs.

2.2. Modeling of Reinforced Learning Algorithm

This section details all the components used for modeling the Enhanced-Dueling DQN (EDDQN) in order to ensure a trustworthy policy for enhancing the physical security of electric power substations.

2.2.1. Deep Q-Networks (DQNs)

The Deep Q-Network (DQN) is a reinforcement learning algorithm that approximates the optimal action-value function Q * s , a , which denotes the expected cumulative reward for taking action a in state s and following the optimal policy thereafter [12,25,26]. Further, the Q-function is learned using a neural network that is parameterized by θ , where θ denotes the weights and biases of the network, updated during the training to minimize the loss function. This maps the states to Q-values for each possible action, as expressed in (8).
Q s , a ; θ Q × s , a
The network is trained by minimizing the differences between the predicted Q-value and the target value derived from the Bellman Equation (9) [27,28].
y = r + γ max a Q s , a ; θ
where r is the immediate reward received after taking action a in state s, γ is the discount factor (between 0 and 1), which balances the immediate and future rewards, s is the next state after taking action a , and θ is the parameters of a target network (which is a periodically updated copy of the main network in order to stabilize training).
The loss function for the training is the mean square error as expressed in Equation (10) [25].
L θ = Ε y Q s , a ; θ 2

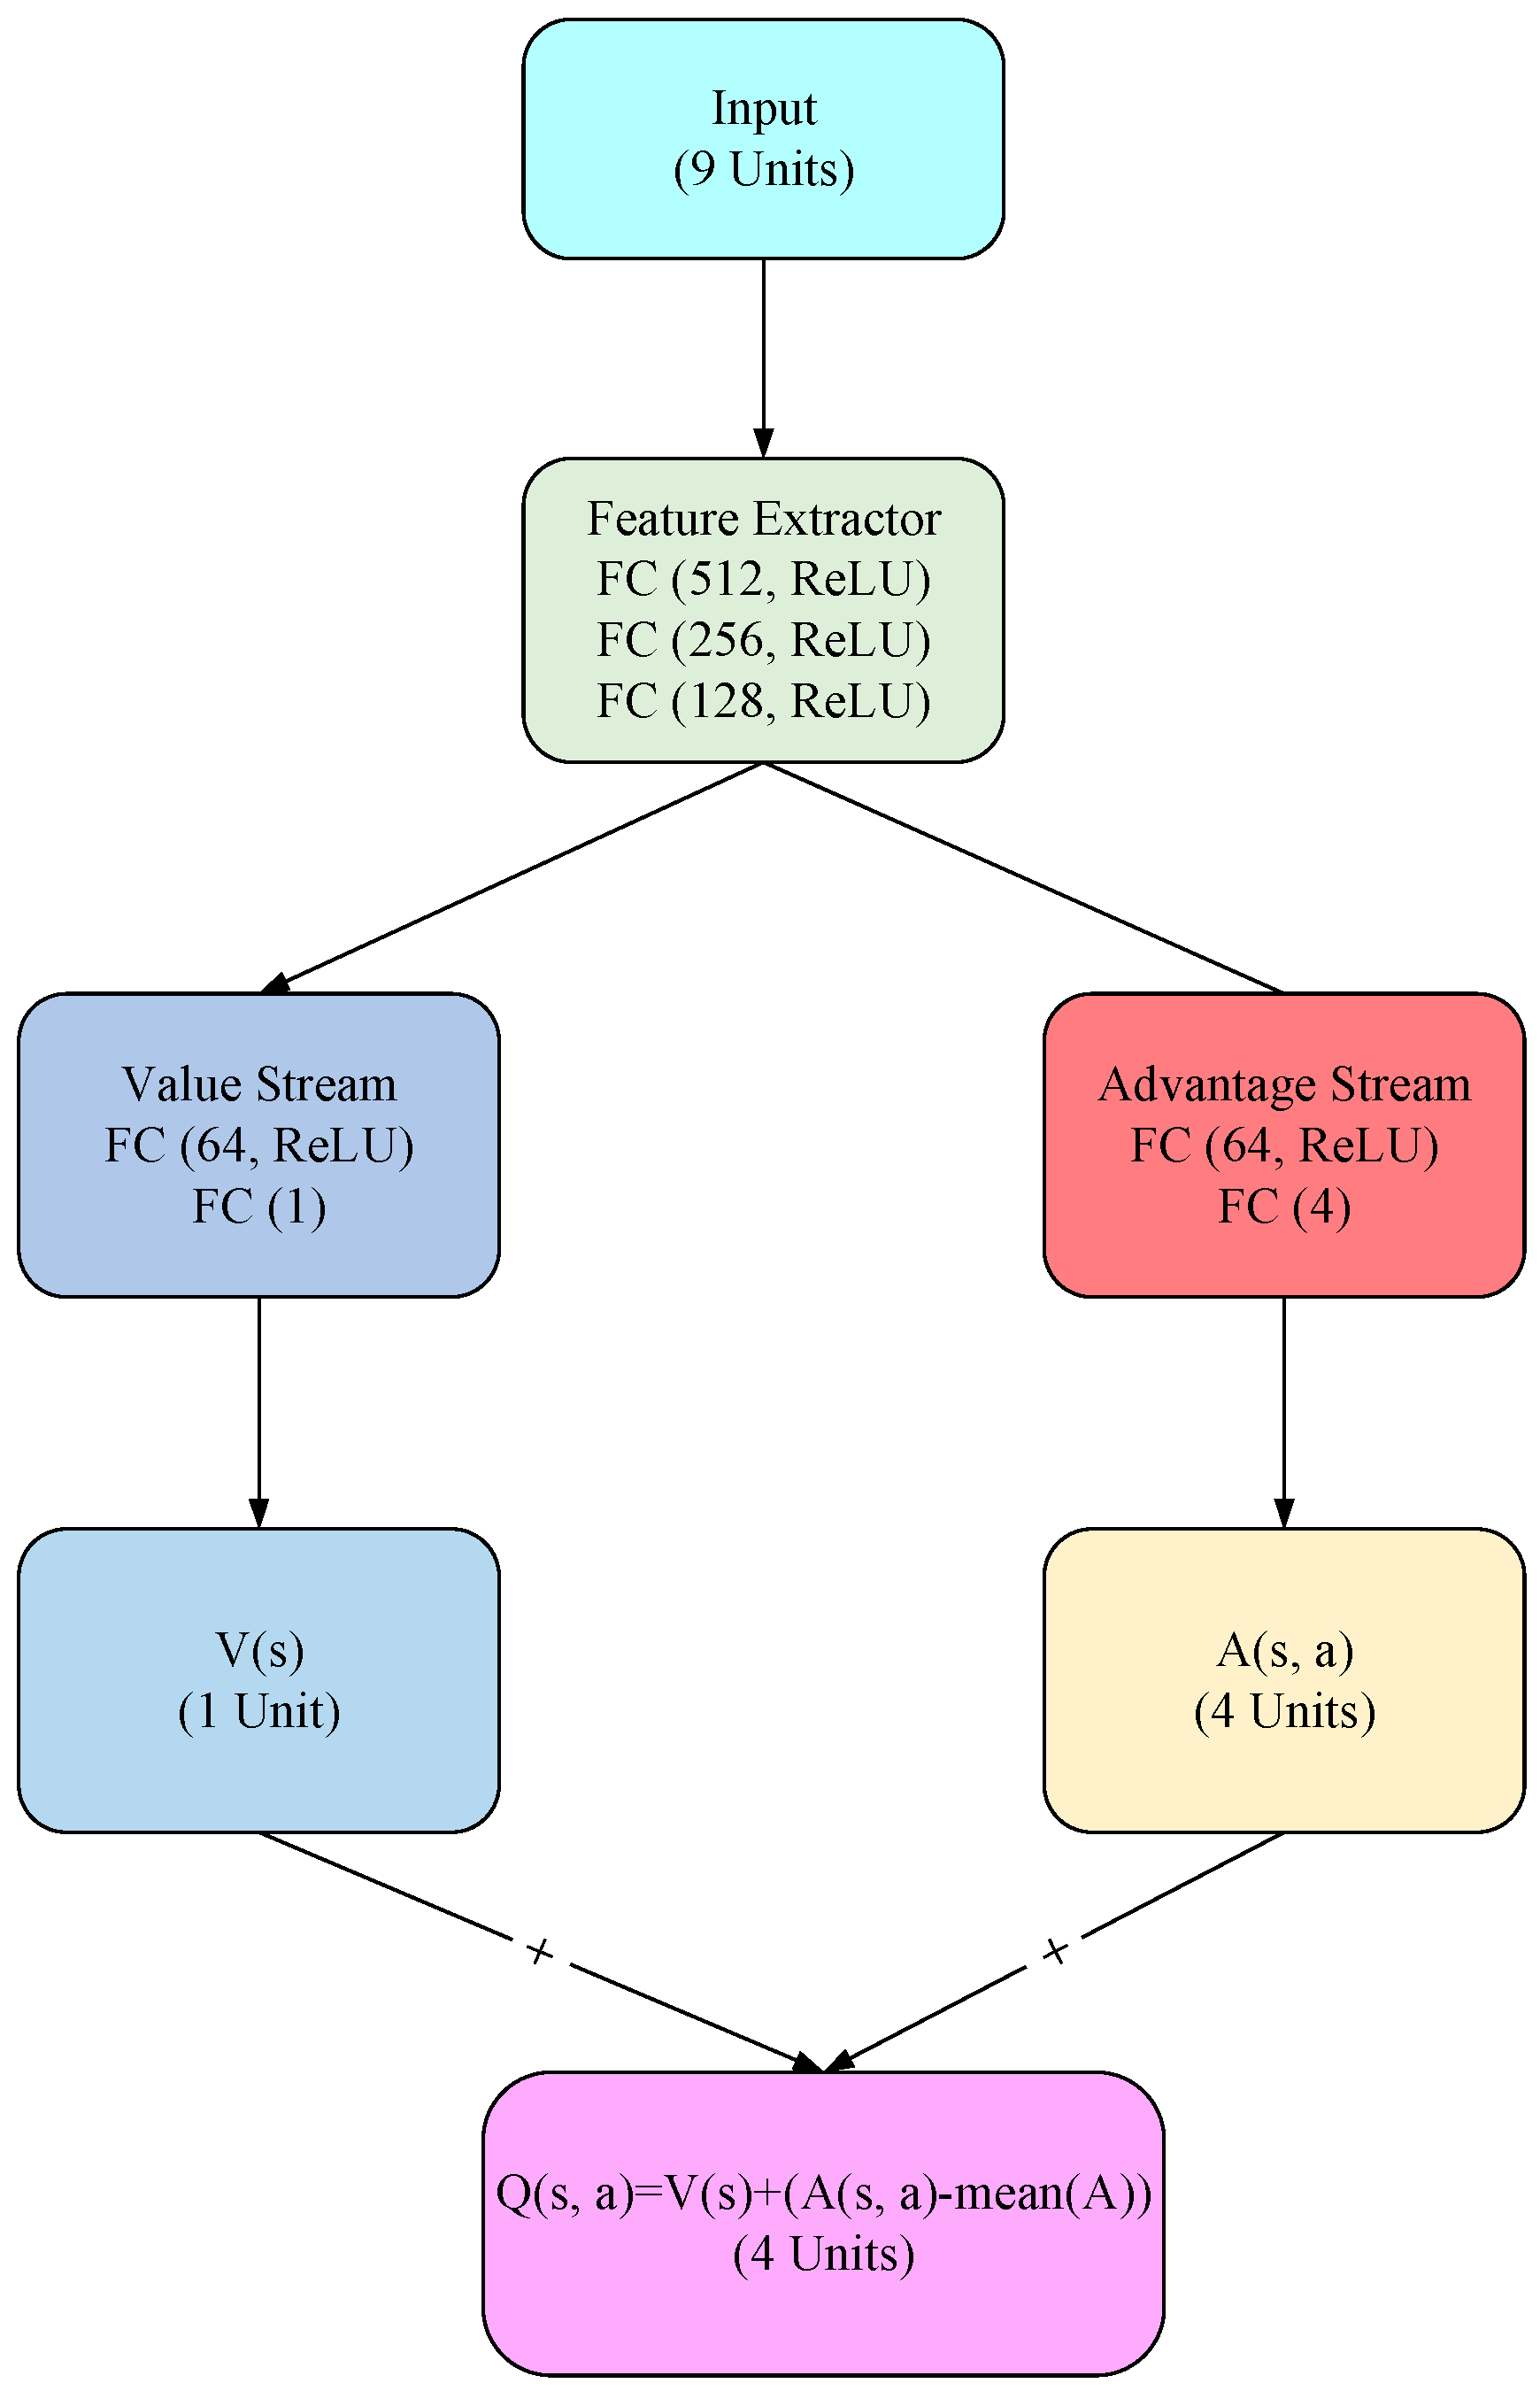
2.2.2. Dueling Deep Q-Networks (Dueling DQNs)

The Dueling DQN is applied to enhance the standard DQN by splitting the Q-function into two components: the state value function V s and the advantage function A s , a [15]. The V s is the value of being in state s, which is independent of the action taken. Furthermore, A s , a is the additional benefit of taking actions a in the state s in comparison to the average action. These two streams are featured by the neural network architecture, where one stream outputs V s ; θ , which is the state value and the other outputs A s , a ; θ , which is the advantage of each action. The Q-value can be computed as in Equation (11).
Q s , a ; θ = V ( s ; θ ) + A s , a ; θ 1 A a A s , a ; θ
where A is the number of possible actions, and the mean advantage 1 A a A s , a ; θ is subtracted in order to zero-center the advantages. This ensures that A s , a represents the relative benefit of each action. This separation permits the network to learn state values more efficiently, which is especially useful when the value of being in a state is more significant than the specific action taken.

2.2.3. Enhanced-Dueling Deep Q-Network (EDDQN) for Trustworthy Security Policies

This research work proposes an Enhanced-Dueling Double Deep Q-Network (EDDQN), which is an advanced reinforcement learning architecture designed to combine the strengths of dueling networks and double Q-learning. This helps in addressing the value overestimation and improves state-action value estimation. The core of this architecture decouples the Q-value estimation into two distinct streams. These two distinct streams are a state value stream and an action advantage steam, while integrating double Q-learning for stable target value computation.
This method builds upon the Dueling DQN architecture by incorporating the Double DQN for stable Q-value estimation (reduces overestimation bias in Q-value updates) and Prioritized Experience Replay (PER) for efficient learning (this improves learning efficiency by focusing on significant experiences) while employing the advanced network design (deep neural network with deeper or wider architecture) in order to capture the complex dynamics of multi-zone substation environments. This EDDQN framework incorporates additional enhancements and improvements in order to ensure better performance and trustworthiness, which is critical for security substations. This proposed EDDQN is designed to monitor multiple zones within a substation, detect potential threats, and allocate resources (e.g., focusing attention on a specific zone) to prevent attacks while minimizing unnecessary interventions. Further, this research models the substation as a multi-zone environment where each zone can transition between normal, threatened, and attacked states, with the agent’s actions influencing the likelihood of preventing threats, as discussed in Section 2.1. The reward structure incentivizes successful threat prevention while penalizing failures and false alarms, ensuring a balanced policy that prioritizes both security and operational efficiency.
As we know, the target Q-values use the maximum Q-value from the target network in standard DQN as expressed in Equation (9), which overestimates the Q-values due to the max operator selecting noisy or inflated estimates. Now, the Double DQN addresses this issue by decoupling action selection and evaluation, as expressed in Equation (12) [16].
y = r + γ Q s , arg max a Q s , a ; θ ; θ
In this, the main network (parameters θ) selects the best action, while the target network (parameters θ ) evaluates its Q-value, leading to more accurate and stable updates.
Then, the PER further enhances learning by prioritizing the transitions in the replay buffer based on their importance, typically measured by the temporal difference (TD) error as expressed in Equation (13) [29].
δ i = y i Q s i , a i ; θ
And, the priority p i of transition i can be expressed as in (14)
p i = δ i + ϵ
where ϵ is the small constant, which ensures all transitions have a non-zero sampling probability. The probability of sampling transition i from the replay buffer can be expressed as in Equation (15).
P i = p i α k p k α
where α controls the level of prioritization (if α = 0 , it is uniform sampling) and k p k α is the sum of the priorities raised to the power α over all transitions k in the replay buffer.
Moreover, in order to correct for bias from non-uniform sampling, importance-sampling weights need to be applied as expressed in (16).
w i = 1 N 1 P i β
where N is the buffer size, and β anneals from a small value to 1 during training. Then, the loss function becomes as expressed in Equation (17).
L θ = Ε w i y i Q s i , a i ; θ 2
Additionally, the policy π s is introduced, which defines how the EDDQN selects actions during any exploitation. The equation for policy can be expressed as in Equation (18).
π s = arg max a Q s , a ; θ
The policy further drives the agent’s decision-making ability, which is refined through training in order to prioritize actions that minimize threats and errors.
Accordingly, the EDDQN employs an advanced network design in order to handle complex state spaces. The neural network architecture of EDDQN is illustrated in Figure 3. This network initializes with an input layer of nine units, which represents the one-hot encoded state of a three-zone substation, where each zone can be in one of three states (normal, suspicious and attacked), resulting in a 3 × 3 = 9 -dimensional vector. This input is fed into a feature extractor, which comprises three fully connected (FC) layers (first with 512 units, second with 256 units and the third with 128 units), all employing the ReLU activation function in order to introduce the non-linearity and capture complex patterns in state space. These layers serve as a shared backbone, which transforms the raw state into a high-level feature representation. This encapsulates the essential dynamics of the substation environment. Then, the architecture moves towards the dueling design of two parallel streams: the value stream and the advantage stream. The value stream is assigned to estimate the state value V s , which consists of the FC layer with 64 units (ReLU activation) and is followed by a final layer with 1 unit (linear activation). This outputs a scalar value representing the expected cumulative reward of the current state, independent of the action taken. Concurrently, the advantage stream, which is responsible for computing the advantage A s , a of each action, and reflects the value stream’s layer with 64 units (ReLU activation), but this concludes with a layer of four units (linear activation). These four units correspond to the four possible actions in the environment (do nothing, focus on Zone 1, Zone 2, or Zone 3). This produces a vector of advantages for each action.
Finally, the output of those two streams is combined using dueling DQN equation Q s , a = V s + A s , a m e a n A , where the mean advantage is subtracted to zero-center the advantages. This ensures the identifiability between the value and advantage components. This combination gives the final output of 4 units, representing the Q-values for each action, which the agent uses to select the optimal action.
The EDDQN architecture influences the dueling structure to separately learn state values and action advantages, which enhances the learning efficiency in environments where the state quality often dominates the action-specific benefits. The deeper feature extraction layers ensure the robust modeling of the complex multi-zone substation security by developing a trustworthy security policy.

3. Case Study and Simulation

This section details the experimentation, results, and analysis of the proposed method for enhancing the physical security of the substation.

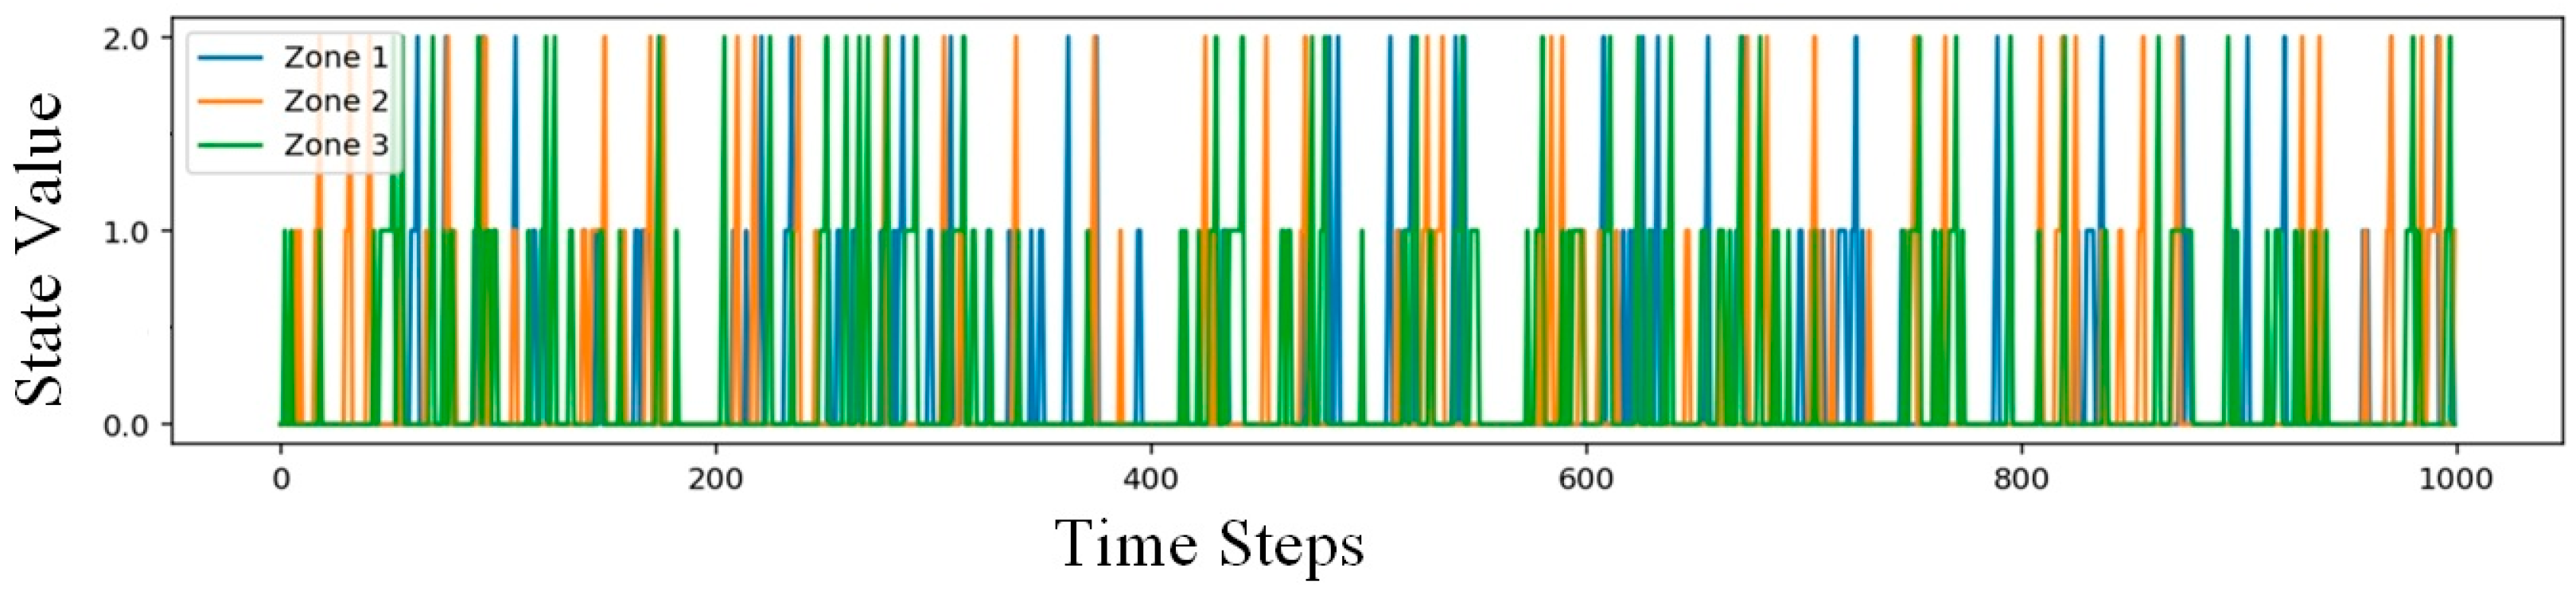
3.1. Synthetic Dataset Generation

The real-world data from the utilities is required to implement the above-proposed model. As the real-world utility data is sensitive and its associations with privacy restrictions, this research aims to generate sensitive data based on the approximation and weightage of past incidents of physical intrusion in 2023 in NERC, illustrated in Electric Emergency and Disturbance (OE-417) Events, 2023 [30]. This data generation process uses historical incident statistics from the above-mentioned incidents, where, in 2023, a total of 350 disturbances occurred, of which 103 were classified as vandalism, physical attacks or theft, 74 were classified as suspicious activities, and many more categories. This data is used to estimate the key probabilities in order to drive the synthetic data generation process. These statistics may provide a realistic scenario and ensure that the generated synthetic data may approximately mirror the threat dynamics and frequencies aligning with the observed real-world trends.
This synthetic data generation is structured on an MDP framework, as explained in Section 2.1. This process for data generation is implemented in Python 3.11. Synthetic data is vital to generate in order to simulate the dynamics of various physical threats. The synthetic dataset illustrates the evolution of security states across multiple zones in substations over time. Here, this research considers a substation with three zones, each of which can exist in one of the three states (normal (0), suspicious (1), and attacked). At each time step, the following are involved.
(a)
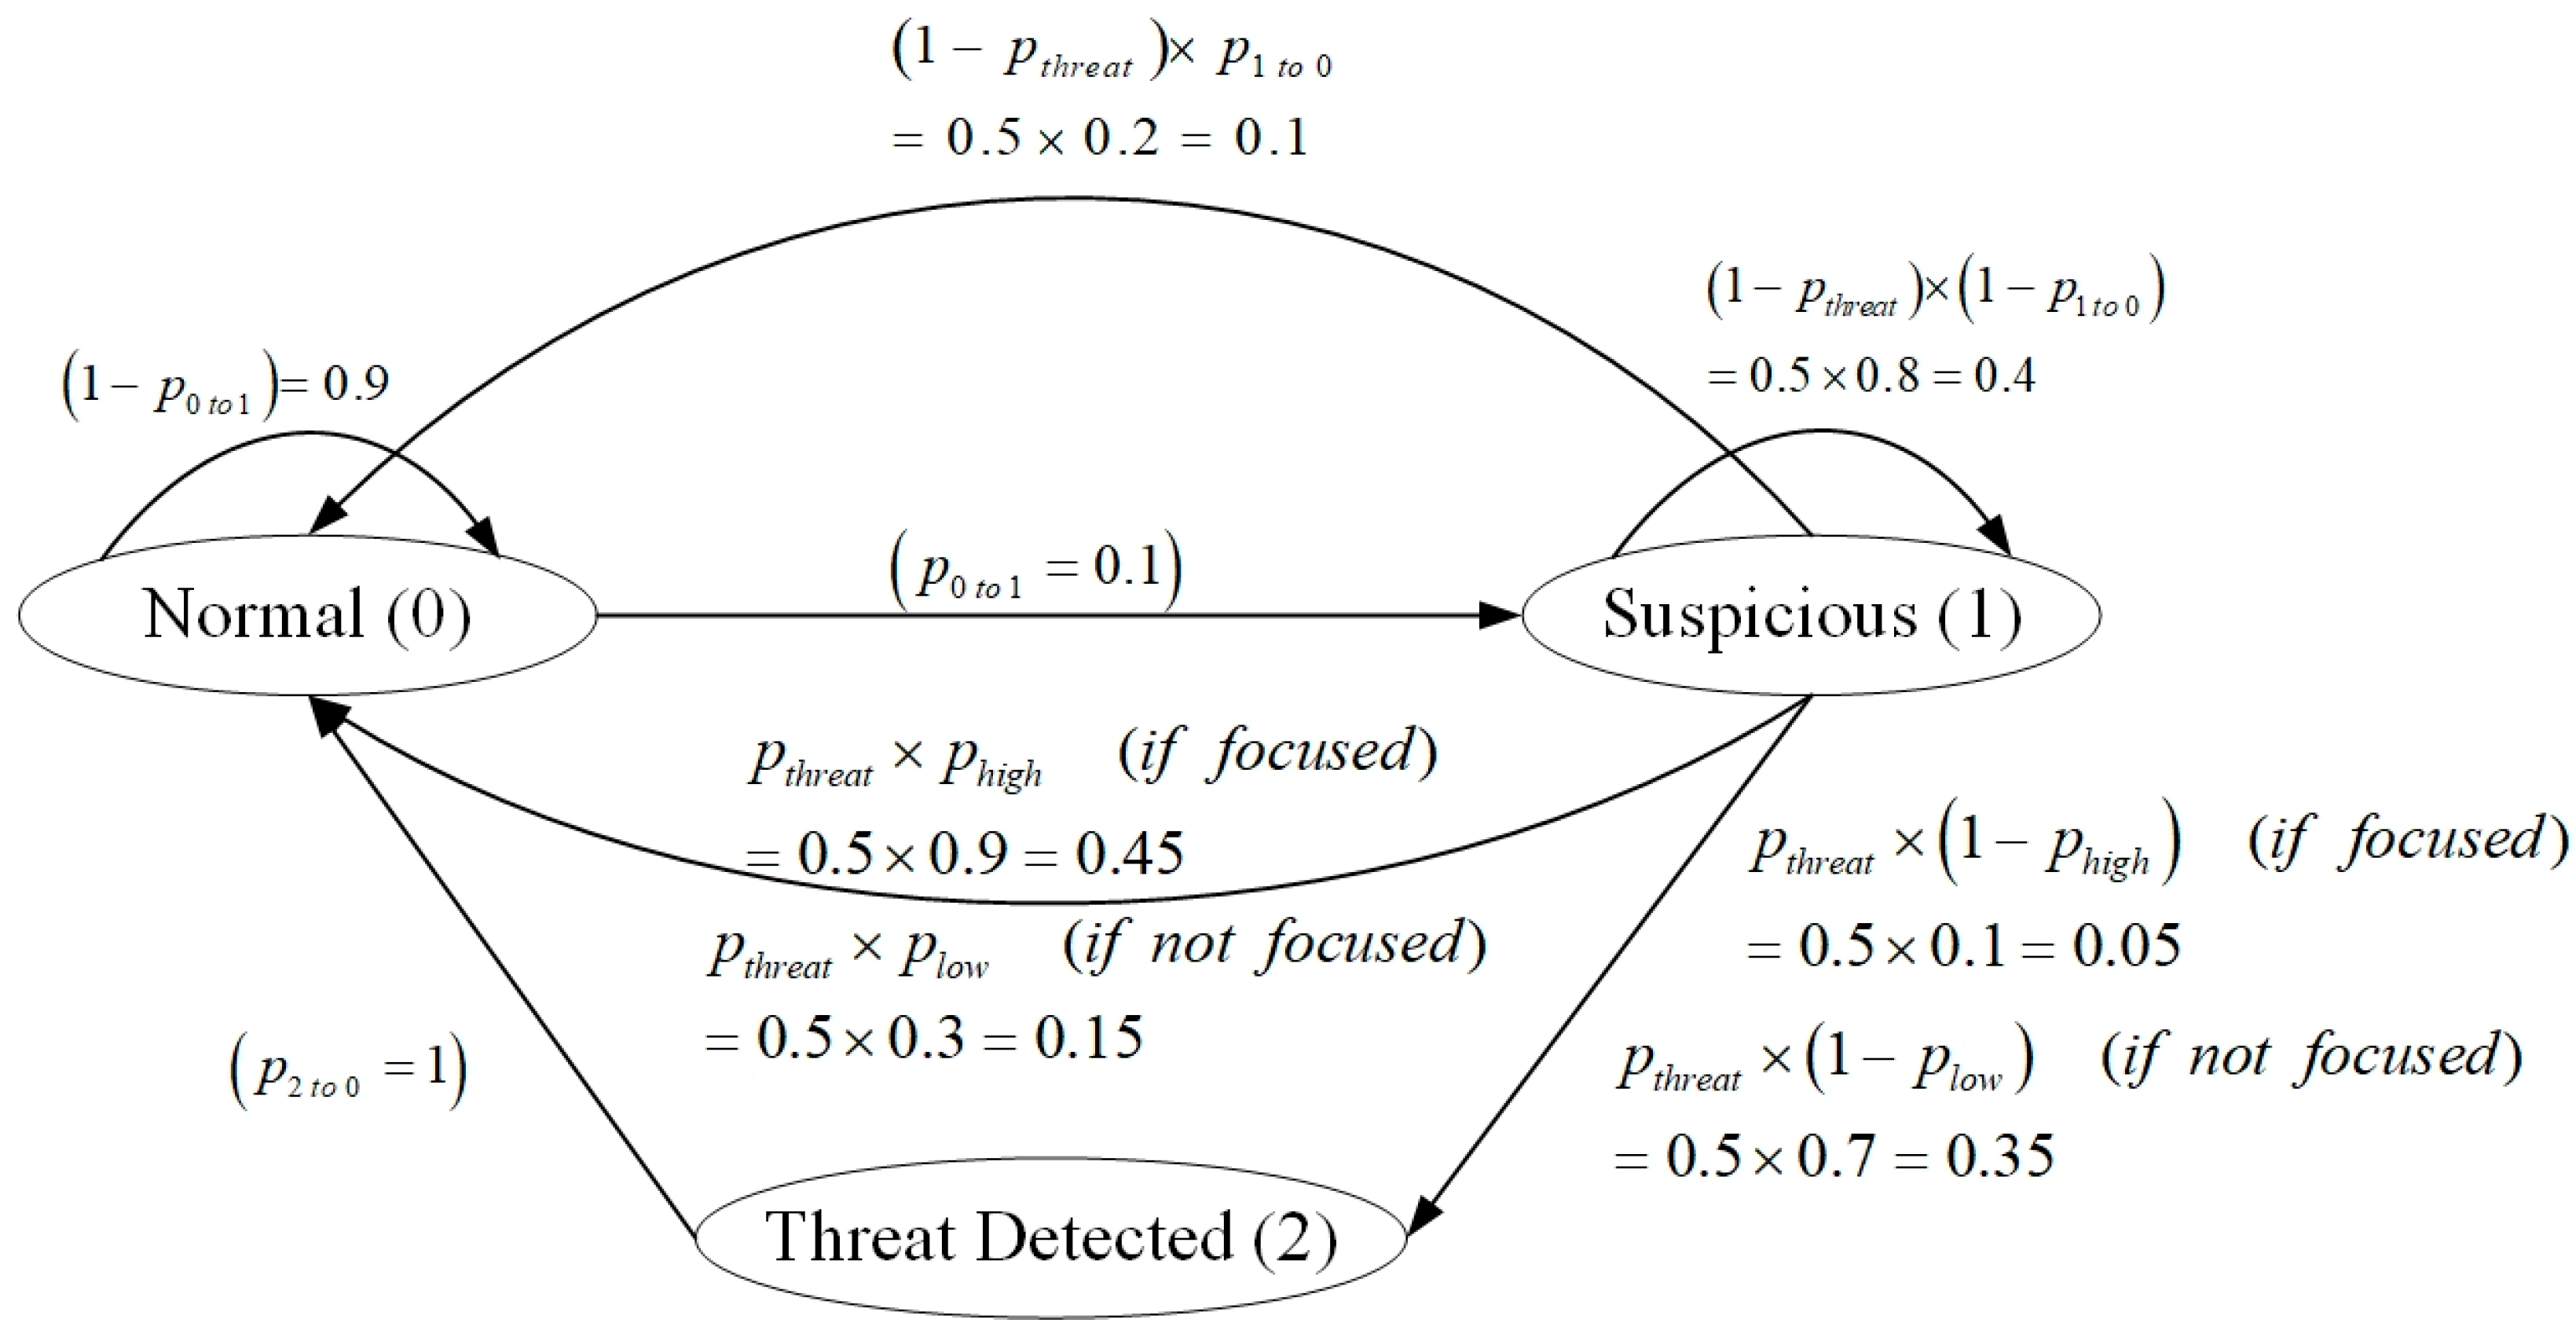
Firstly, each zone’s state evolves based on predefined transition probabilities derived from the OE-417 statistics and adjusted to reflect plausible threat dynamics, which are as follows:
  • p 0 1 = 0.1 : the probability of transitioning from normal to suspicious.
  • p t h r e a t = 0.5 : the probability of a threat occurring when a zone is suspicious.
  • p 1 0 = 0.2 : the probability of a suspicious zone returning to normal if no threat occurs.
  • p h i g h = 0.9 : the probability of preventing a threat when focusing on the correct zone.
  • p l o w = 0.3 : the probability of preventing a threat when not focusing on the zone.
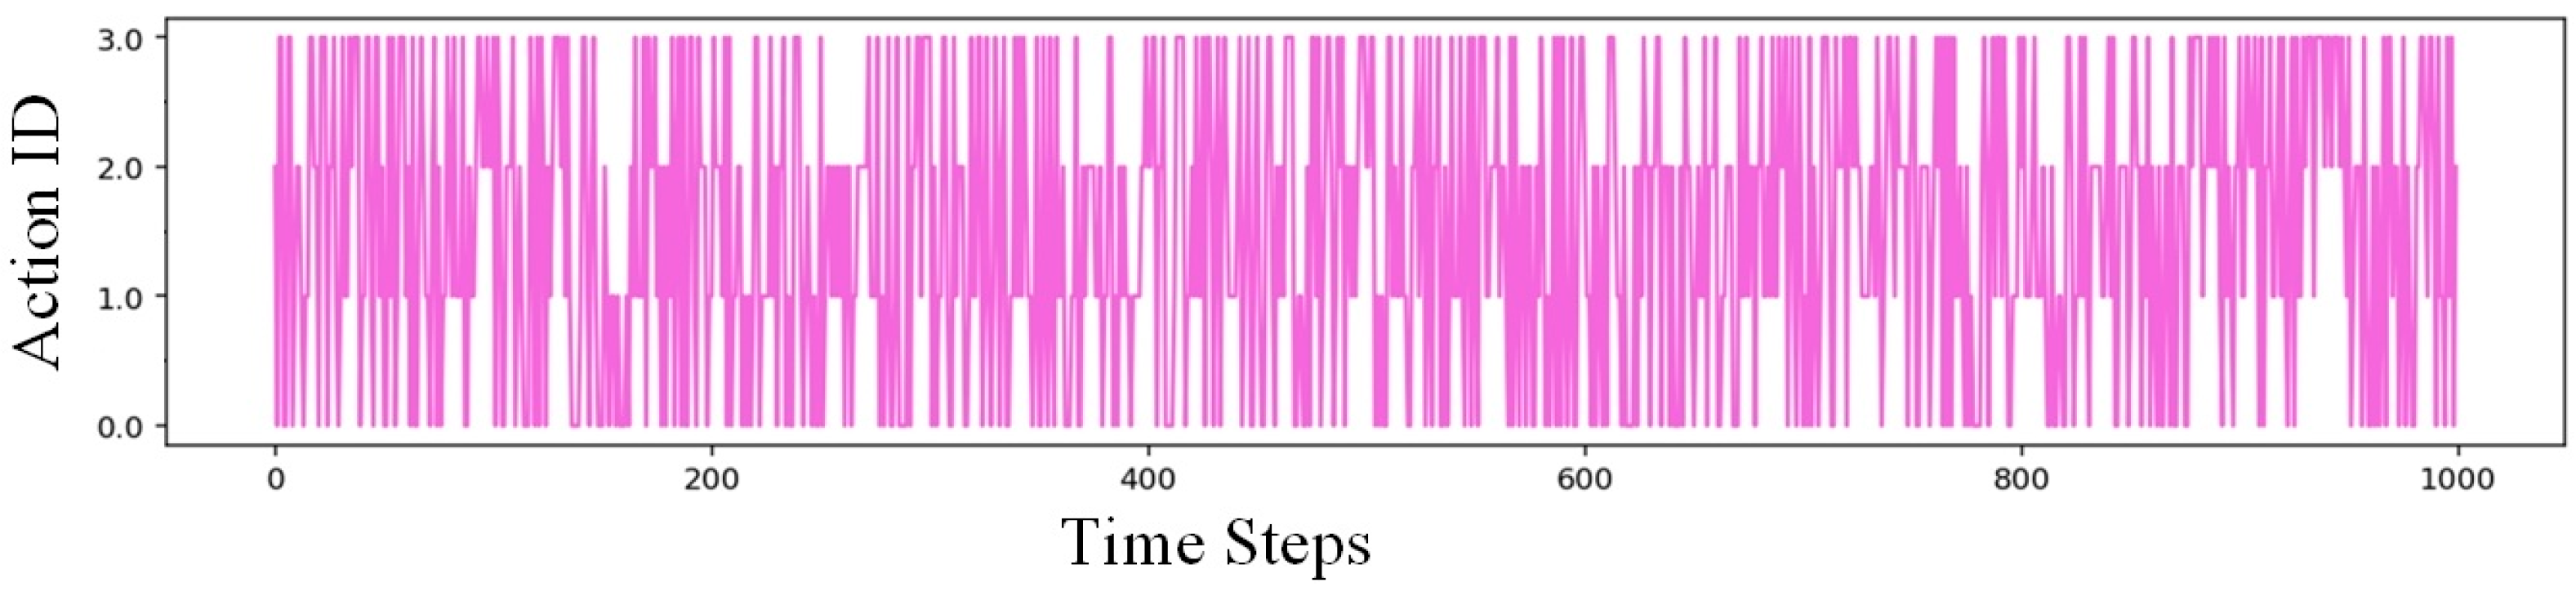
(b)
Then, an action is chosen randomly from the action space: either do nothing (0) or focus on a specific zone (1 to 3).
(c)
Then after, rewards are assigned based on outcomes:
  • r p r e v e n t = 1 : the reward for preventing a threat.
  • c t h r e a t = 10 : the cost of failing to prevent a threat.
  • r p r e v e n t = 0.1 
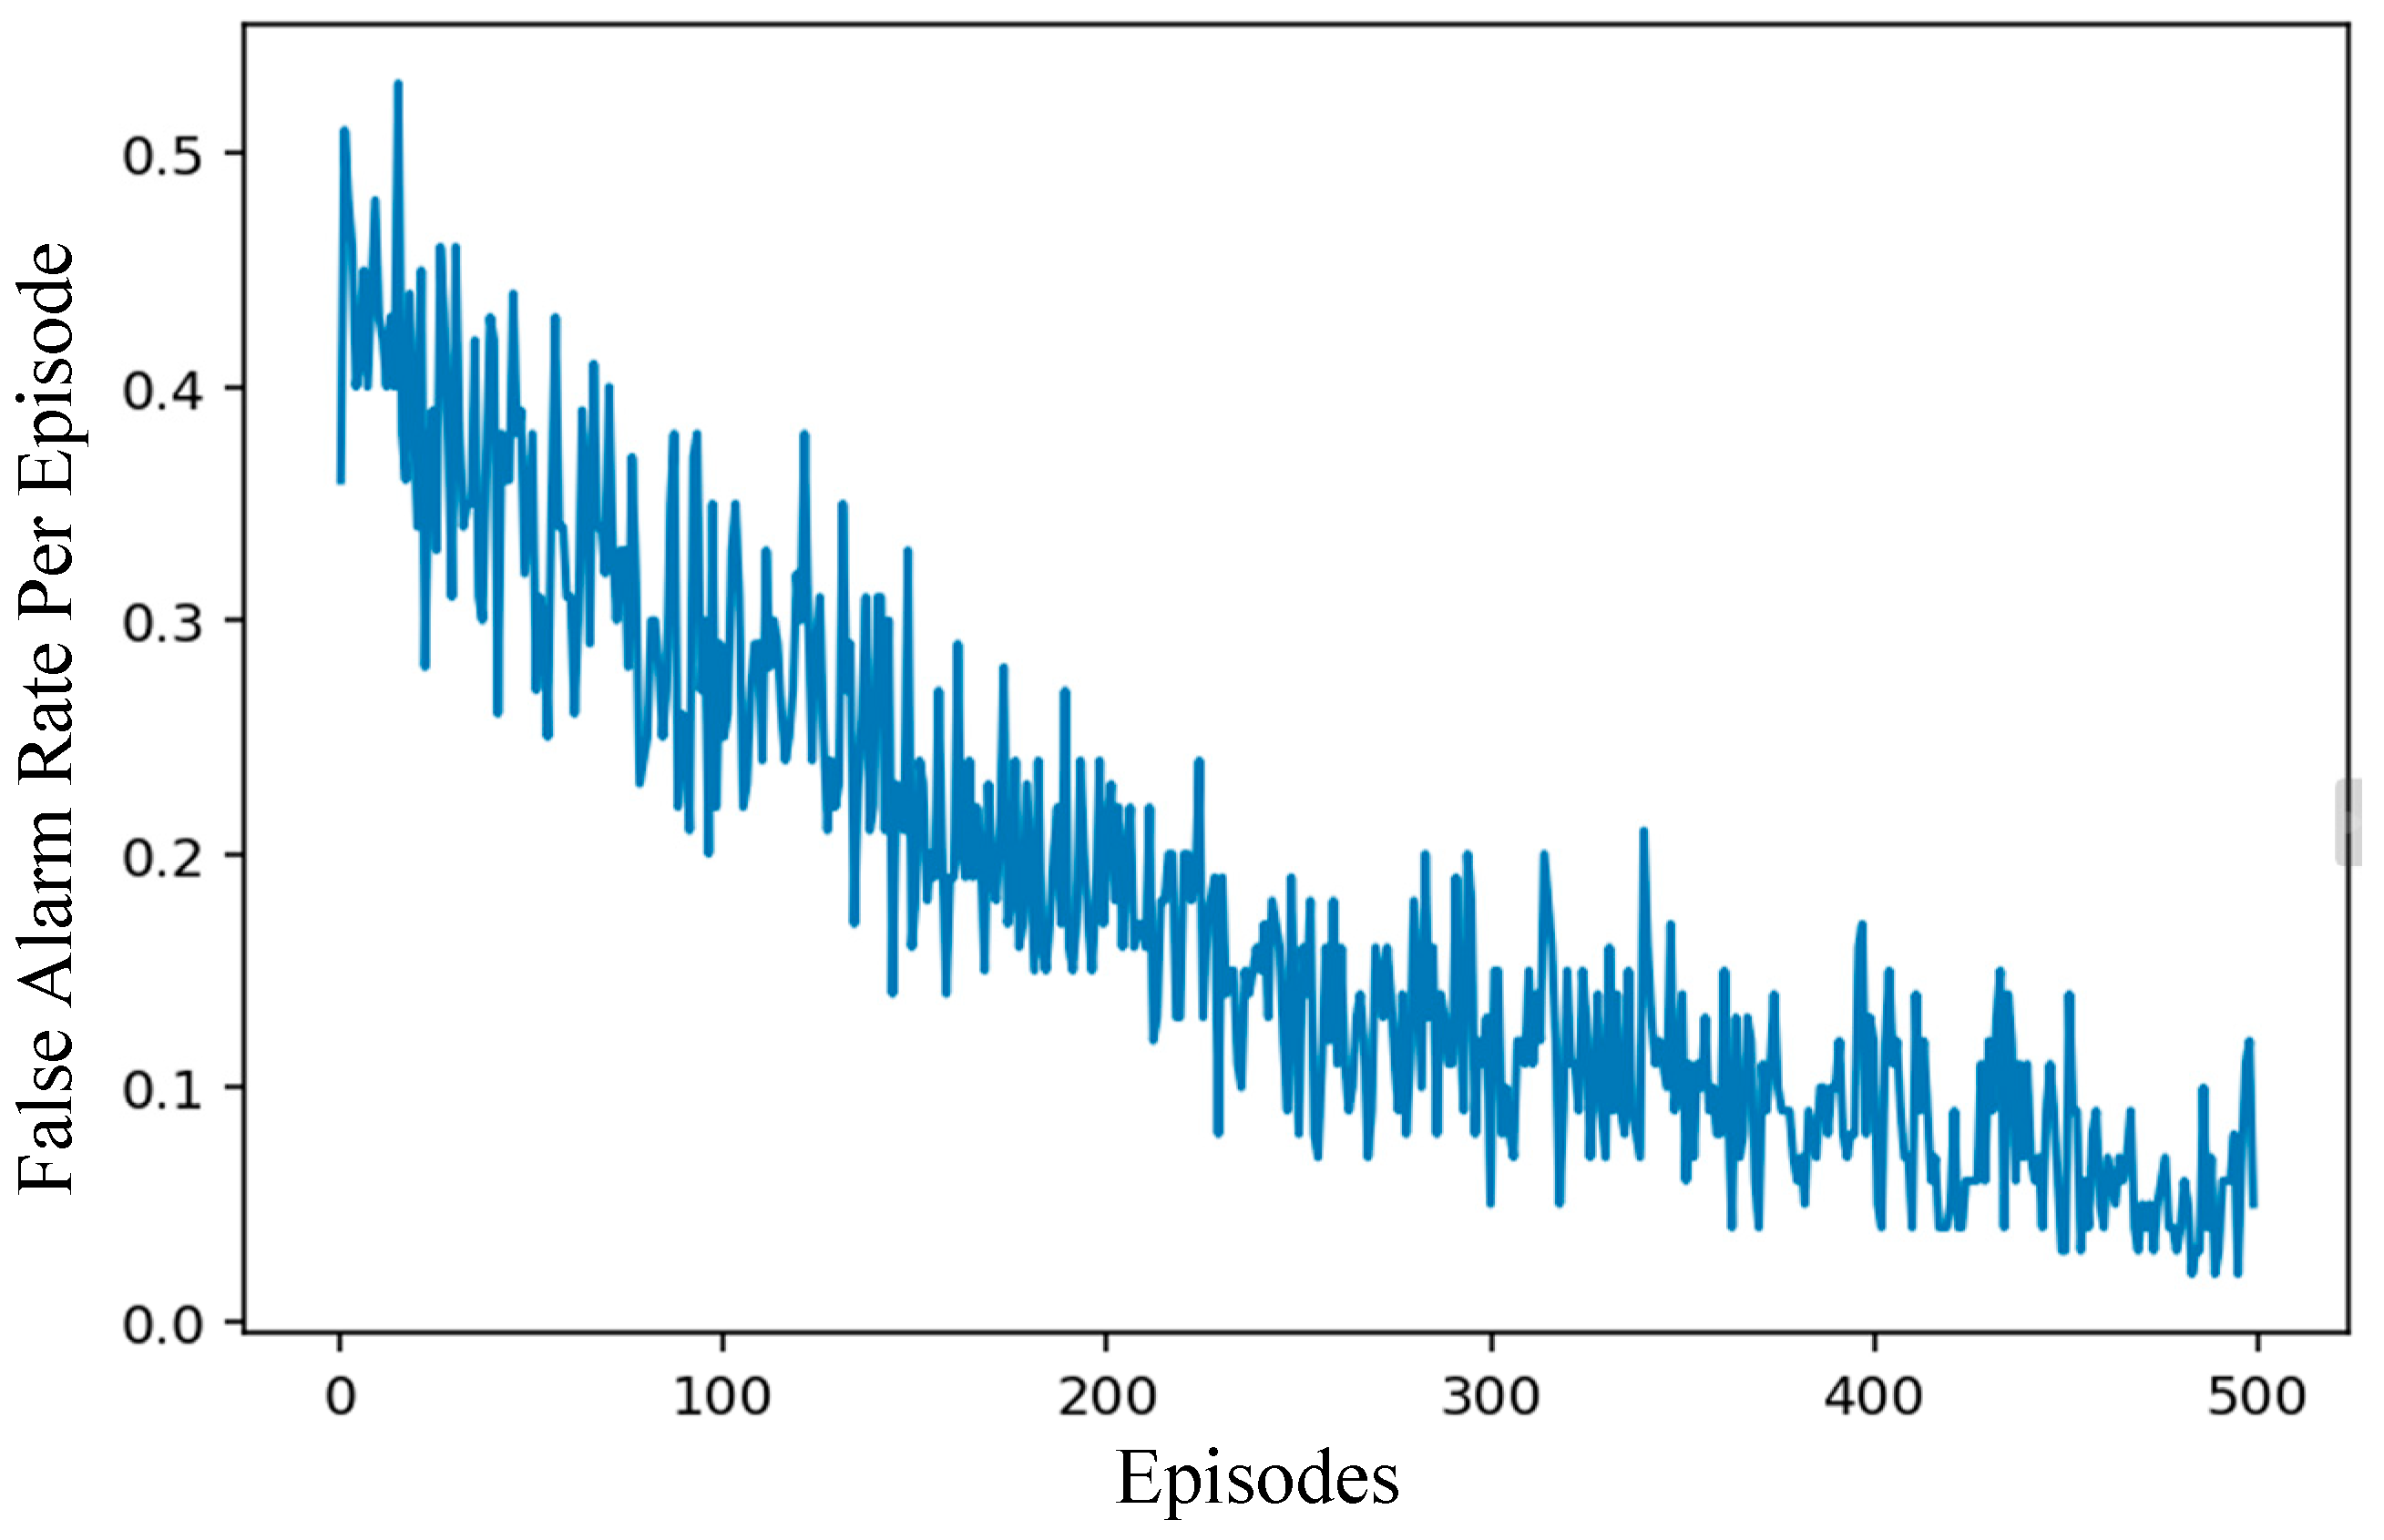
: the penalty for the false alarm when focusing on a suspicious zone that does not escalate.
The simulation spans 1000 time steps, producing a dataset that records the state of each zone, the action taken, and the resulting reward at every step. This process generates a rich sequence of scenarios capturing threat escalation, mitigation efforts, and operational trade-offs. In order to illustrate the properties of the dataset, Figure 4 depicts the state distribution across the three zones over time, revealing clusters of suspicious and attack stages. This shows the temporal dynamics of security states across the substation, showing the period of increased threat activity.
Figure 5 illustrates the frequency of each action (do nothing or focus on a specific zone) over timesteps. The actions are selected randomly to form a rough uniform distribution across the four possible actions (0 to 3). This reflects the simulation of an unbiased action policy.
Figure 6 illustrates the distribution of rewards. This captures the balance between positive rewards (threat prevention), significant penalties (unprevented threats) and minor penalties (false alarms).
While this synthetic dataset does not incorporate the full complexity of real-world substations—such as inter-zone dependencies or external factors like weather or human behavior—it provides a controlled and realistic environment for training and evaluating the EDDQN model. By leveraging incident-based probabilities, the dataset ensures that the agent learns policies relevant to substation security while circumventing the challenges of limited access to actual utility data.

3.2. Experimental Settings for Simulation of EDDQN

The experiment of this research is performed on a personal computer with a Windows environment. Table 1 details the experimental configuration of the software and hardware environment.
In order to optimize the performance of the proposed EDDQN reinforcement learning agents implemented in this paper for an optimized substation environment, the sensitivity analysis was conducted by systematically varying the two key hyperparameters such as learning rate and batch size, while keeping the other parameters fixed at their best-known values to assess their impacts on the agent’s performance. The learning rate is tested across values of 0.00001, 0.00002, and 0.00005 that control the step size of gradient descent during training, influencing the speed and stability of the convergence. The batch size was evaluated at 32, 64, and 128, which determines the number of experiences sampled from the replay buffer for each training update, affecting the quality of gradient estimates and training efficiency. For each combination, the agent was trained across 500 episodes, and the performance metrics were computed as illustrated in Table 2.
The analysis of the sensitivity results, as presented in Table 2, reveals that a learning rate of 0.00002 and a batch size of 64 yield the optimal performance for the EDDQN. This configuration achieves the best Average Reward alongside a higher Prevention Rate, a lower False Alarm Rate, and a reduced Training Loss compared to other tested hyperparameter combinations, justifying its selection for the final model.
Table 3 outlines the hyperparameter settings employed for the EDDQN in the simulation designed to enhance the physical security of a substation. These hyperparameters govern critical aspects of the training process, including the learning dynamics, exploration strategy, and network optimization, ensuring that the model develops an effective and reliable policy for threat mitigation.
The EDDQN simulation is carried out over 500 episodes to model the three zones of the substation environment, with each episode comprising 100 steps. This setup ensures that the agent encounters a sufficient number of threat scenarios to learn robust policies while maintaining manageable computational demands. At the beginning of each episode, the environment is reset to an initial state where all zones are in a normal condition (state 0). Over the course of the 100 steps, the agent interacts with the environment by taking actions, observing state transitions, and receiving rewards, thereby refining its decision-making strategy for effective substation security management.

3.3. Computational Efficiency Analysis

Table 1 illustrates the hardware used for computation. A single training run for the optimal hyperparameter configurations, as detailed in Table 3, required approximately 3 h and 30 min, utilizing 16 GB of RAM and achieving a GPU utilization of around 70%. The preliminary analysis indicates that the model is computationally viable on mid-range hardware, though efficiency could vary with larger state spaces or additional zones. A comprehensive optimization study, including comparisons with other DQN variants, is deferred to future work due to the current focus on performance evaluation rather than computational tuning.

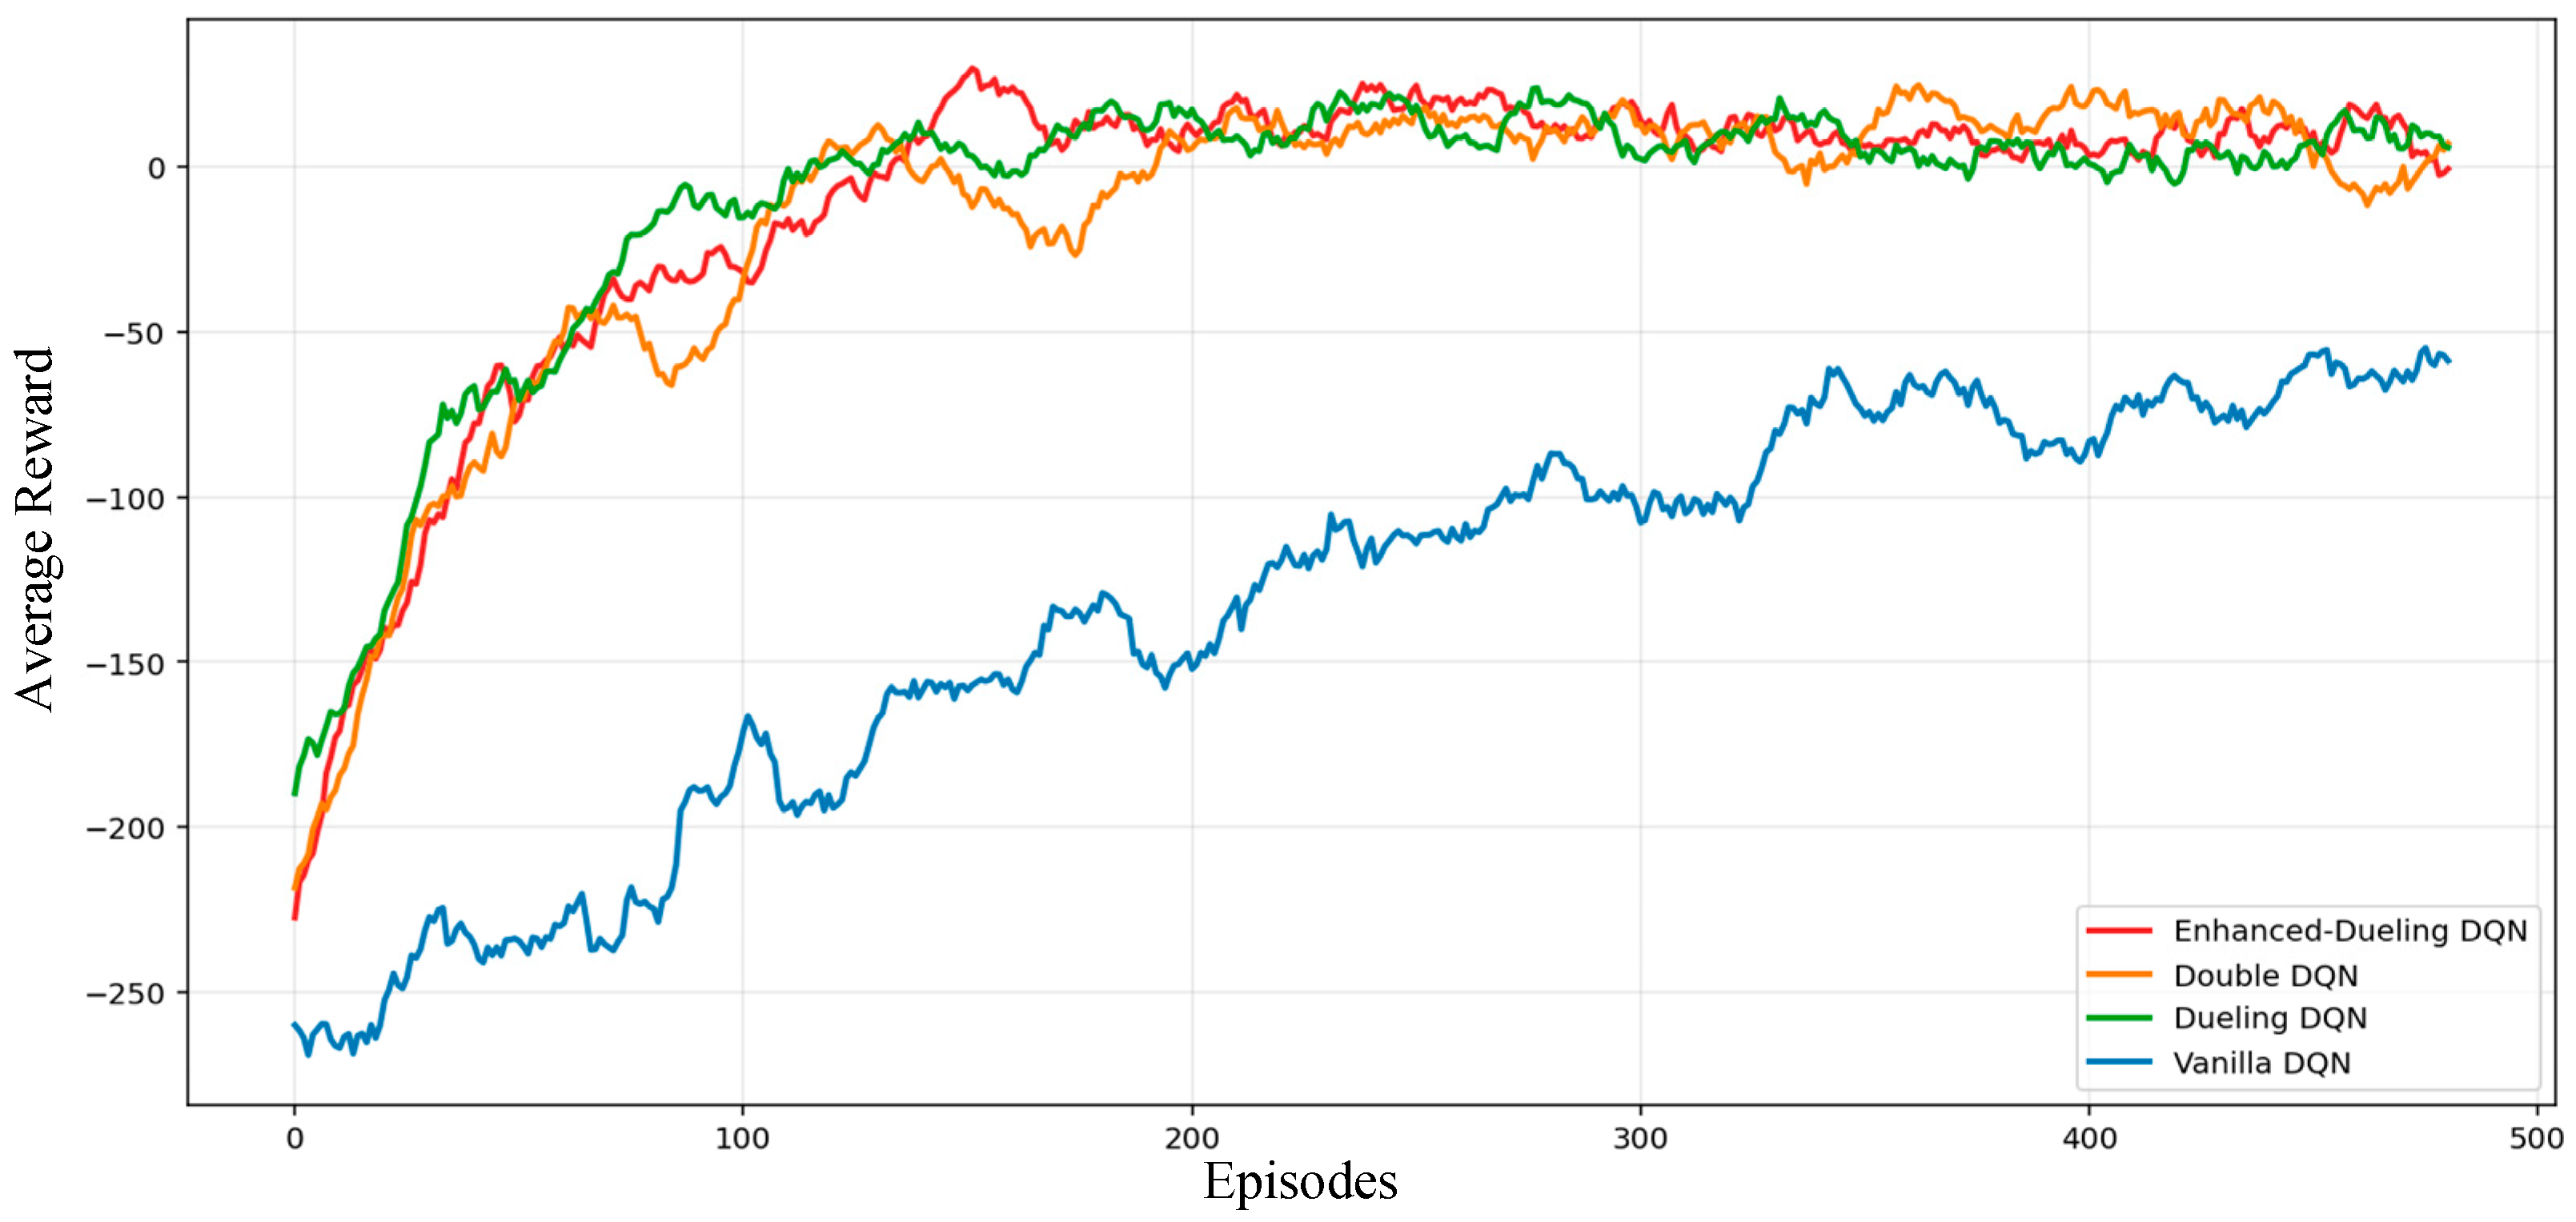
3.4. Results and Analysis

This research uses various metrics to evaluate the trustworthiness and effectiveness of the EDDQN model, comparing it with other similar DQN variants, such as vanilla DQN, Dueling DQN, and Double DQN, in the context of physical security of substations. These metrics include training loss per episode, action distribution over time, threat prevention rate and comparison of average reward. These metrics are computed and described below, along with illustrations.
Figure 7 illustrates the training loss per episode over 500 episodes for the EDDQN model. This initially begins at 3.0, but within 50 episodes, it drops sharply to around 1.75, which reflects its rapid learning capability. Afterwards, the loss stabilized and fluctuated between 1.25 and 1.75, with an average of 1.59. This low and consistent loss reflects the model’s consistency and ability to effectively approximate the Q-values.
Figure 8 illustrates the epsilon decay per episode over 500 episodes. The epsilon decay controls the exploration and exploitation balance during training. The EDDQN proposed in this research uses a slow decay rate of 0.995 per episode, which allows extended exploration before transitioning to exploitation.
Figure 9 depicts the action distribution across all episodes for the EDDQN, shifting to the learned policy. This shows that the agent predominantly selects proactive actions, as shown in the figure. This shows that the focus is on high-risk zones, eliminating the false alarm rates and minimizing unnecessary actions.
Figure 10 provides insights into the state distribution across episodes, illustrating how often the zones are in normal, suspicious, and threat-detected states. This figure shows that the EDDQN has increased the prevention rates significantly, keeping all the zones safer, which is the direct outcome of its effective policy.
Figure 11 demonstrates the practical effectiveness of the policy, which tracks the threat prevention rate over 500 episodes. The threat prevention rate of EDDQN starts around 60% and climbs steadily to 91.1% over the last 20 episodes, and also touches 100% in between. This demonstrates the consistent improvement in the model’s capacity to learn and sustain high-threat detection and mitigation.
Figure 12 illustrates the false alarm rate over 500 episodes. The EDDQN begins with a high rate of false alarms (59%) and gradually decreases to 0.5% over the last 20 episodes. This demonstrates the agent’s precision in avoiding unnecessary disruptions (which is a vital consideration in substation operation).
Figure 13 illustrates the 20-episode average reward over 500 episodes of different DQNs. This compares the performance of different DQN agents, showing that the model with a higher average reward performs much faster. The EDDQN starts with a low reward, but it quickly stabilizes around 0, averaging 7.5 over the last 20 episodes. Following EDDQN, Dueling DQN and Double DQN also achieve slightly lower averages (6.6 and 6.1, respectively). The EDDQN converges faster with higher rewards, reflecting its superiority in learning efficiency and policy quality.
The comparison of performance across agents of different DQN methods is illustrated in Table 4, including Enhanced-Dueling DQN, Dueling DQN, Double DQN, and Vanilla DQN.
The results in the table show that the EDDQN outperforms in all aspects (average reward, prevention rate, false alarm rate and training loss). This shows its ability to balance threat prevention with minimal errors and significantly reduce false alarm rates. This makes the model trustworthy and robust, making it suitable for practical security applications.

4. Conclusions

In conclusion, this research successfully presented and validated an Enhanced-Dueling Deep Q-Network (EDDQN) framework as a significant advancement in proactively safeguarding electric power substations against physical security threats. By formulating the substation environment as a multi-zone Markov Decision Process (MDP), EDDQN effectively learns to select mitigation actions that balance high threat prevention (91.1%) with a remarkably low incidence of false alarms (0.5%), achieving an average reward of 7.5. The integration of Double DQN and Prioritized Experience Replay proved crucial for stable and efficient learning within our advanced network architecture, enabling the agent to capture the nuanced dynamics of the substation. The observed proactive action policy underscores EDDQN’s potential as a trustworthy and intelligent security solution.
Despite these achievements, the study faces several limitations that warrant careful consideration. For the real-world application, the model must be reliant on real-world scenario datasets to match our required output. The computational intensity of EDDQN also poses a challenge, as training the model requires significant resources (e.g., 3.5 h per run on an NVIDIA RTX4060 GPU, as noted in Section 3.3), potentially limiting scalability for larger or more complex systems. While the threat prevention rate is 91.1% and the false alarm rate is low at 0.5%, the model may still miss critical threats in rare scenarios, leading to false negatives that could have severe consequences in a substation context. Finally, the implementation complexity of integrating EDDQN into existing substation systems demands advanced infrastructure, such as real-time data pipelines and specialized expertise, which may hinder practical deployment in resource-constrained environments.
In future work, several promising avenues for research and development emerge. These include exploring the integration of EDDQN with real-time sensor data and video analytics for enhanced situational awareness, investigating the transferability of the learned policies to different substation layouts and threat scenarios, and extending the framework to incorporate multi-agent coordination for collaborative security responses. Furthermore, analyzing the robustness of EDDQN against adversarial attacks and exploring methods for explainable AI to provide security personnel with insights into the agent’s decision-making process represent important next steps. Ultimately, this work lays a strong foundation for the development of truly adaptive and intelligent physical security systems for critical infrastructure.

Author Contributions

N.K.M.: Writing—original draft, conceptualization, methodology, software and visualization; J.Y. (Junfeng Yang): Writing—review and editing, methodology and resources; J.Y. (Jiaxuan Yang): Validation, writing—review and editing; G.G.: Funding acquisition, Supervision, formal analysis, and validation; J.H.: Supervision, investigation, and resources; J.S.: Resources and validation; J.L.: Resources and validation. All authors have read and agreed to the published version of the manuscript.

Funding

This research received no external funding.

Data Availability Statement

All the data are contained within the article.

Conflicts of Interest

Authors Jing Sun and Jinlu Liu were employed by the company Power China Northwest Engineering Corporation Limited. The remaining authors declare that the research was conducted in the absence of any commercial or financial relationships that could be construed as a potential conflict of interest.

References

  1. Chen, M.; Li, F.; Pang, Y.; Zhang, W.; Chen, Z. Research on the Electronic Replacement of Substation Physical Security Measures. Shandong Electr. Power 2020, 47, 59–62. [Google Scholar]
  2. Kelley, B.P. Perimeter Substation Physical Security Design Options for Compliance with NERC CIP 014-1. In Proceedings of the 2016 IEEE/PES Transmission and Distribution Conference and Exposition (T&D), Dallas, TX, USA, 3–5 May 2016; pp. 1–4. [Google Scholar]
  3. Mahato, N.K.; Yang, J.; Sun, Y.; Yang, D.; Zhang, Y.; Gong, G.; Hao, J. Physical Security of Electric Power Substations: Threats and Mitigation Measures. In Proceedings of the 2023 3rd International Conference on Electrical Engineering and Mechatronics Technology (ICEEMT), Nanjing, China, 21 July 2023; pp. 434–438. [Google Scholar]
  4. Xu, P.; Tian, W. Design and realization of digital video surveillance system for power substation. Electr. Power Autom. Equip. 2005, 25, 66. [Google Scholar]
  5. Jiangtao, H. Discussion on The Construction of Substation Security Video Surveillance System. IOP Conf. Ser. Mater. Sci. Eng. 2019, 563, 032004. [Google Scholar] [CrossRef]
  6. Nguyen, T.T.; Reddi, V.J. Deep Reinforcement Learning for Cyber Security. IEEE Trans. Neural Netw. Learn. Syst. 2023, 34, 3779–3795. [Google Scholar] [CrossRef] [PubMed]
  7. Tiong, T.; Saad, I.; Teo, K.T.K.; bin Lago, H. Deep Reinforcement Learning with Robust Deep Deterministic Policy Gradient. In Proceedings of the 2020 2nd International Conference on Electrical, Control and Instrumentation Engineering (ICECIE), Kuala Lumpur, Malaysia, 28 November 2020; pp. 1–5. [Google Scholar]
  8. Sutton, R.S.; Barto, A.G. Reinforcement Learning: An Introduction. IEEE Trans. Neural Netw. 1998, 9, 1054. [Google Scholar] [CrossRef]
  9. Mnih, V.; Kavukcuoglu, K.; Silver, D.; Graves, A.; Antonoglou, I.; Wierstra, D.; Riedmiller, M. Playing Atari with Deep Reinforcement Learning. arXiv 2013, arXiv:1312.5602. [Google Scholar]
  10. Lan, J.; Dong, X. Improved Q-Learning-Based Motion Control for Basketball Intelligent Robots Under Multi-Sensor Data Fusion. IEEE Access 2024, 12, 57059–57070. [Google Scholar] [CrossRef]
  11. Jäger, J.; Helfenstein, F.; Scharf, F. Bring Color to Deep Q-Networks: Limitations and Improvements of DQN Leading to Rainbow DQN. In Reinforcement Learning Algorithms: Analysis and Applications; Belousov, B., Abdulsamad, H., Klink, P., Parisi, S., Peters, J., Eds.; Studies in Computational Intelligence; Springer International Publishing: Cham, Switzerland, 2021; Volume 883, pp. 135–149. ISBN 978-3-030-41187-9. [Google Scholar]
  12. Sharma, A.; Pantola, D.; Kumar Gupta, S.; Kumari, D. Performance Evaluation of DQN, DDQN and Dueling DQN in Heart Disease Prediction. In Proceedings of the 2023 Second International Conference On Smart Technologies For Smart Nation (SmartTechCon), Singapore, 18 August 2023; pp. 5–11. [Google Scholar]
  13. Feng, L.-W.; Liu, S.-T.; Xu, H.-Z. Multifunctional Radar Cognitive Jamming Decision Based on Dueling Double Deep Q-Network. IEEE Access 2022, 10, 112150–112157. [Google Scholar] [CrossRef]
  14. Ban, T.-W. An Autonomous Transmission Scheme Using Dueling DQN for D2D Communication Networks. IEEE Trans. Veh. Technol. 2020, 69, 16348–16352. [Google Scholar] [CrossRef]
  15. Han, B.-A.; Yang, J.-J. Research on Adaptive Job Shop Scheduling Problems Based on Dueling Double DQN. IEEE Access 2020, 8, 186474–186495. [Google Scholar] [CrossRef]
  16. Lv, P.; Wang, X.; Cheng, Y.; Duan, Z. Stochastic Double Deep Q-Network. IEEE Access 2019, 7, 79446–79454. [Google Scholar] [CrossRef]
  17. Chen, X.; Hu, R.; Luo, K.; Wu, H.; Biancardo, S.A.; Zheng, Y.; Xian, J. Intelligent Ship Route Planning via an A∗ Search Model Enhanced Double-Deep Q-Network. Ocean Eng. 2025, 327, 120956. [Google Scholar] [CrossRef]
  18. Zeng, L.; Liu, Q.; Shen, S.; Liu, X. Improved Double Deep Q Network-Based Task Scheduling Algorithm in Edge Computing for Makespan Optimization. Tsinghua Sci. Technol. 2024, 29, 806–817. [Google Scholar] [CrossRef]
  19. Doanis, P.; Spyropoulos, T. Sample-Efficient Multi-Agent DQNs for Scalable Multi-Domain 5G+ Inter-Slice Orchestration. IEEE Trans. Mach. Learn. Commun. Netw. 2024, 2, 956–977. [Google Scholar] [CrossRef]
  20. Ouchani, S. A Security Policy Hardening Framework for Socio-Cyber-Physical Systems. J. Syst. Archit. 2021, 119, 102259. [Google Scholar] [CrossRef]
  21. Lang, Q.; Zhu, L.B.D.; Ren, M.M.C.; Zhang, R.; Wu, Y.; He, W.; Li, M. Deep Reinforcement Learning-Based Smart Grid Resource Allocation System. In Proceedings of the 2023 IEEE International Conferences on Internet of Things (iThings) and IEEE Green Computing & Communications (GreenCom) and IEEE Cyber, Physical & Social Computing (CPSCom) and IEEE Smart Data (SmartData) and IEEE Congress on Cybermatics (Cybermatics), Danzhou, China, 17 December 2023; pp. 703–707. [Google Scholar]
  22. Hao, Y.; Wang, M.; Chow, J.H. Likelihood Analysis of Cyber Data Attacks to Power Systems with Markov Decision Processes. IEEE Trans. Smart Grid 2018, 9, 3191–3202. [Google Scholar] [CrossRef]
  23. Herrmann, B.; Li, C.C.; Somboonyanon, P. The Development of New IEEE Guidance for Electrical Substation Physical Resilience. In Proceedings of the 2024 IEEE Power & Energy Society General Meeting (PESGM), Seattle, WA, USA, 21–25 July 2024; pp. 1–5. [Google Scholar]
  24. Sganga, N. Physical Attacks on Power Grid Rose by 71% Last Year, Compared to 2021. CBS News, 22 February 2023. [Google Scholar]
  25. Mnih, V.; Kavukcuoglu, K.; Silver, D.; Rusu, A.A.; Veness, J.; Bellemare, M.G.; Graves, A.; Riedmiller, M.; Fidjeland, A.K.; Ostrovski, G.; et al. Human-Level Control through Deep Reinforcement Learning. Nature 2015, 518, 529–533. [Google Scholar] [CrossRef]
  26. Qayoom, A.; Khuhro, M.A.; Kumar, K.; Waqas, M.; Saeed, U.; Ur Rehman, S.; Wu, Y.; Wang, S. A Novel Approach for Credit Card Fraud Transaction Detection Using Deep Reinforcement Learning Scheme. PeerJ Comput. Sci. 2024, 10, e1998. [Google Scholar] [CrossRef]
  27. Watkins, C.J.C.H.; Dayan, P. Q-Learning. Mach. Learn. 1992, 8, 279–292. [Google Scholar] [CrossRef]
  28. Zhang, S.; Wu, Y.; Ogai, H.; Inujima, H.; Tateno, S. Tactical Decision-Making for Autonomous Driving Using Dueling Double Deep Q Network with Double Attention. IEEE Access 2021, 9, 151983–151992. [Google Scholar] [CrossRef]
  29. Sovrano, F.; Raymond, A.; Prorok, A. Explanation-Aware Experience Replay in Rule-Dense Environments. IEEE Robot. Autom. Lett. 2022, 7, 898–905. [Google Scholar] [CrossRef]
  30. Electric Disturbance Events (OE-417) Annual Summaries. Available online: https://openenergyhub.ornl.gov/explore/dataset/oe-417-annual-summaries/information/ (accessed on 5 September 2024).
Figure 1. State transition diagram for a single zone.
Energies 18 03194 g001
Figure 2. Flowchart of reward computation process.
Energies 18 03194 g002
Figure 3. Neural network architecture for EDDQN.
Energies 18 03194 g003
Figure 4. State distributions across zones over time step.
Energies 18 03194 g004
Figure 5. Action frequency over time step.
Energies 18 03194 g005
Figure 6. Instantaneous reward distribution.
Energies 18 03194 g006
Figure 7. Training loss per episode.
Energies 18 03194 g007
Figure 8. Epsilon decay per episode.
Energies 18 03194 g008
Figure 9. Action distribution over time steps (50,000 steps).
Energies 18 03194 g009
Figure 10. State distribution over time (50,000 steps).
Energies 18 03194 g010
Figure 11. Threat prevention rate.
Energies 18 03194 g011
Figure 12. False alarm rate per episode.
Energies 18 03194 g012
Figure 13. Performance of DQN agents (comparison of average reward over 20-episode moving average).
Energies 18 03194 g013
Table 1. Software and hardware configuration.
ProjectEnvironment
SystemWindows 11 Pro N for Workstations
Memory (RAM)16 GB + 16 GB (DDR5-5600)
CPU13th Gen Intel(R) Core(TM) i7-13700H 2.40 GHz
Programming environmentSpyder 6.0.1
GPUNVIDIA RTX4060
PythonPython 3.11
PyTorch2.3.1 + cu118
Table 2. Sensitivity analysis of EDDQN hyperparameters.
Learning RateBatch SizeAverage RewardPrevention RateFalse Alarm RateTraining Loss
0.0000132−103.584.9035.2515.48
64−68.0081.8529.3013.12
128−239.5.0060.4956.1018.96
0.0000232−75.6585.285.203.51
647.5091.110.501.59
128−50.2586.604.605.53
0.0000532−96.7086.107.6010.30
6413.3.0086.500.612.51
128−87.7088.0010.116.35
Table 3. Model training hyperparameters.
ParametersValueDescription
Learning rate0.00002Step size for updating the neural network weights.
Batch size64No. of transactions sampled from replay buffer training step.
Discount factor0.99This balances the immediate and future rewards.
Epsilon start value1.0Initial value of epsilon for the epsilon-greedy exploration strategy.
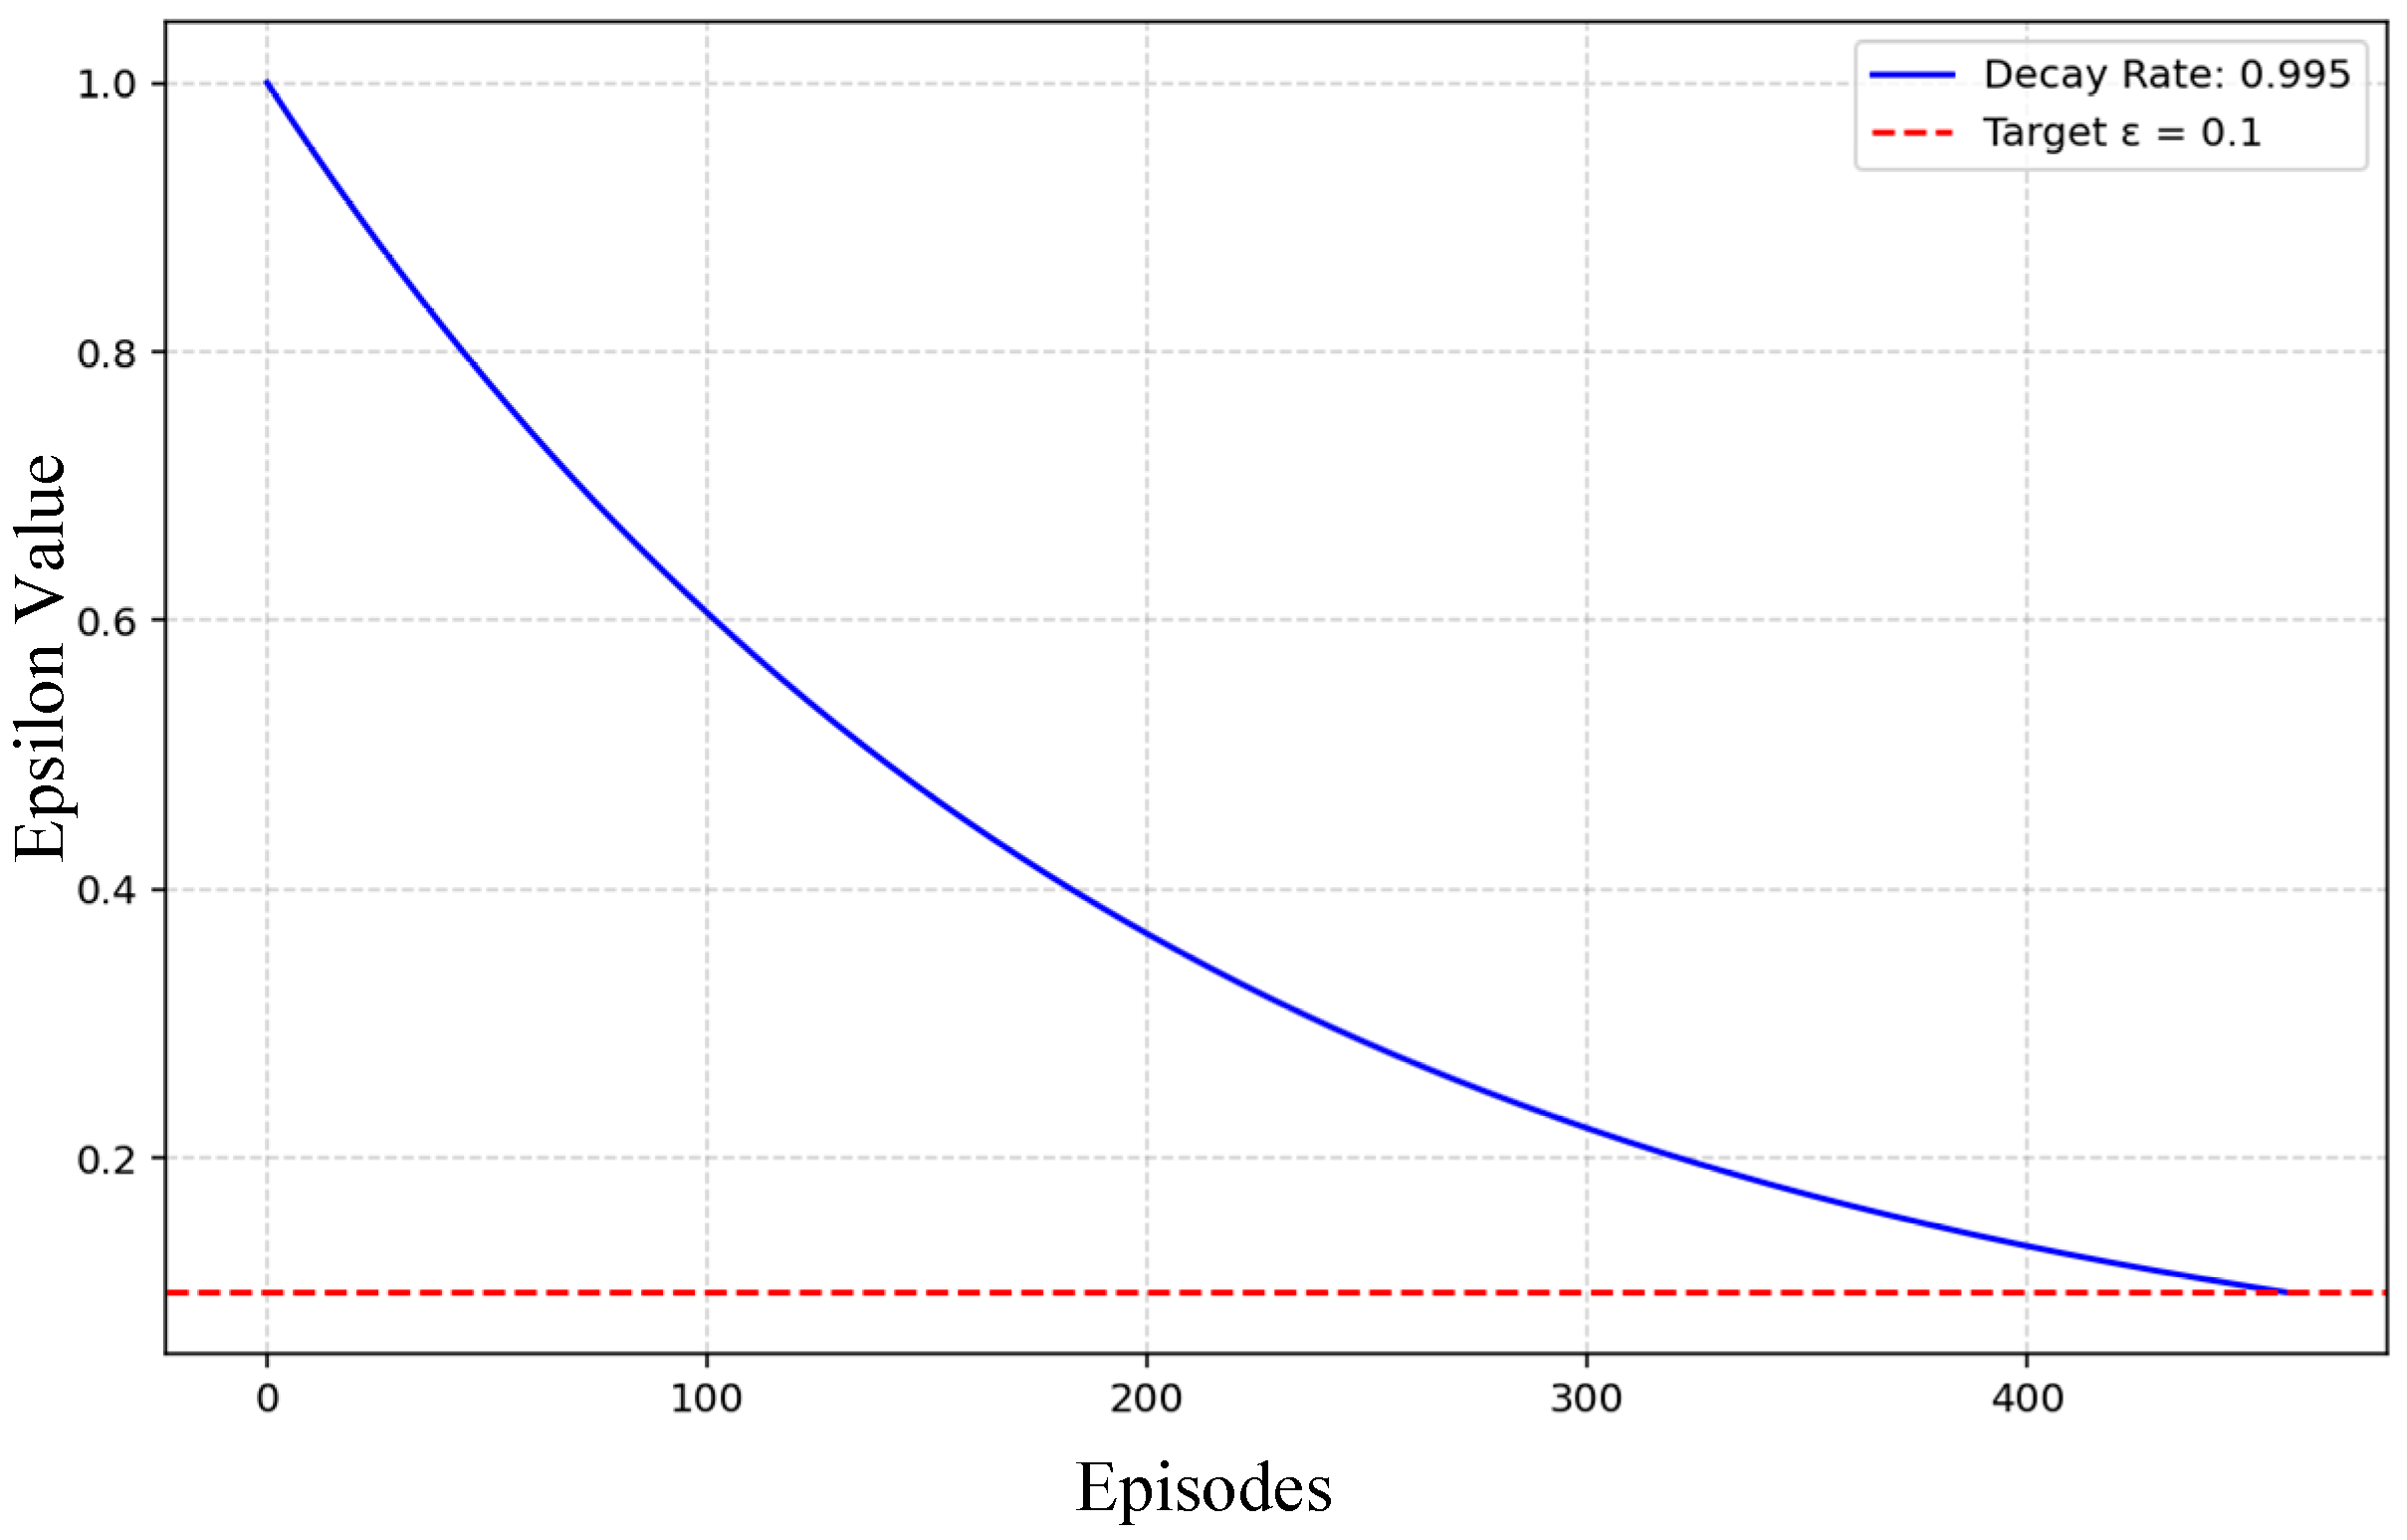
Epsilon decay0.995This is the rate at which epsilon decays per episode, which controls the exploration duration.
Epsilon minimum0.01This is minimum value of epsilon, which ensures some exploration throughout the training.
Target network updateEvery 50 stepsThis is the frequency of updating the target network in order to stabilize the Q-value estimation.
PER alpha0.7Prioritization exponent for sampling transitions in Prioritized Experience Replay.
PER beta0.5This is importance-sampling correction factor in Prioritized Experience Replay.
OptimizerAdamOptimization algorithm used for training the neural network.
Episodes500Total number of training episodes to learn the policy.
States per episode100Maximum number of steps per episode in the simulation environment.
Table 4. Comparison of performance metrics across agents of different DQNs.
Performance MetricsEnhanced-Dueling DQNDueling DQNDouble DQNVanilla DQN
Average Reward7.56.66.1−47.7
Prevention Rate91.1%89.1%88.3%81.6%
False Alarm Rate0.5%0.8%0.7%15.0%
Training Loss (20-Episode Moving Average)1.5912.9412.9820.57
Disclaimer/Publisher’s Note: The statements, opinions and data contained in all publications are solely those of the individual author(s) and contributor(s) and not of MDPI and/or the editor(s). MDPI and/or the editor(s) disclaim responsibility for any injury to people or property resulting from any ideas, methods, instructions or products referred to in the content.

