Article

Polarity-Dependent DC Dielectric Behavior of Virgin XLPO, XLPE, and PVC Cable Insulations

by
Khomsan Ruangwong
1,*,
Norasage Pattanadech
1,* and
Pittaya Pannil
2
1
Electrical Engineering Department, School of Engineering, King Mongkut’s Institute of Technology, Ladkrabang, Bangkok 10520, Thailand
2
Instrumentation and Control Engineering Department, School of Engineering, King Mongkut’s Institute of Technology, Ladkrabang, Bangkok 10520, Thailand
*
Authors to whom correspondence should be addressed.
Energies 2025, 18(20), 5404; https://doi.org/10.3390/en18205404 (registering DOI)
Submission received: 18 August 2025 / Revised: 25 September 2025 / Accepted: 11 October 2025 / Published: 14 October 2025

Abstract

Reliable DC cable insulation is crucial for photovoltaic (PV) systems and high-voltage DC (HVDC) networks. However, conventional materials such as cross-linked polyethylene (XLPE) and polyvinyl chloride (PVC) face challenges under prolonged DC stress—notably space charge buildup, dielectric losses, and thermal aging. Cross-linked polyolefin (XLPO) has emerged as a halogen-free, thermally stable alternative, but its comparative DC performance remains underreported. Methods: We evaluated the insulations of virgin XLPO, XLPE, and PVC PV cables under ±1 kV DC using time-domain indices (IR, DAR, PI, Loss Index), supported by MATLAB and FTIR. Multi-layer cable geometries were modeled in MATLAB to simulate radial electric field distribution, and Fourier-transform infrared (FTIR) spectroscopy was employed to reveal polymer chemistry and functional groups. Results: XLPO exhibited an IR on the order of 108–109 Ω, and XLPE (IR ~ 108 Ω) and PVC (IR ~ 107 Ω, LI ≥ 1) at 60 s, with favorable polarization indices under both polarities. Notably, they showed high insulation resistance and low-to-moderate loss indices (≈1.3–1.5) under both polarities, indicating controlled relaxation with limited conduction contribution. XLPE showed good initial insulation resistance but revealed polarity-dependent relaxation and higher loss (especially under positive bias) due to trap-forming cross-linking byproducts. PVC had the lowest resistance (GΩ-range) and near-unit DAR/PI, dominated by leakage conduction and dielectric losses. Simulations confirmed a uniform electric field in XLPO insulation with no polarity asymmetry, while FTIR spectra linked XLPO’s low polarity and PVC’s chlorine content to their electrical behavior. Conclusions: XLPO outperforms XLPE and PVC in resisting DC leakage, charge trapping, and thermal stress, underscoring its suitability for long-term PV and HVDC applications. This study provides a comprehensive structure–property understanding to guide the selection of advanced, polarity-resilient cable insulation materials.

1. Introduction

The rapid expansion of renewable energy systems, particularly in the realm of photovoltaic (PV) installations, marks a pivotal shift in power generation and distribution methodologies. The decentralization of solar energy is becoming increasingly prominent, especially in regions characterized by abundant sunlight and favorable regulatory frameworks. As this trend evolves, the demand for reliable, high-quality components rises correspondingly. Among these components, the direct current (DC) power cable is crucial, as it is engineered to withstand a variety of long-term electrical, thermal, and environmental stresses while providing a safe and durable connection. In PV cable design, the insulation system is of paramount importance. It must exhibit resistance to high DC voltage, ultraviolet (UV) radiation, extreme temperatures, humidity variations, and fluctuations in electric fields. The prevalent insulation materials utilized in low-voltage power cables include cross-linked polyethylene (XLPE), polyvinyl chloride (PVC), and cross-linked polyolefin (XLPO). XLPE is distinguished by its high insulation resistance, attributable to its semi-crystalline molecular structure; however, its peroxide cross-linking process can yield polar byproducts that may result in charge accumulation under sustained DC stress. Conversely, while PVC offers affordability and flexibility, its polar molecular components can lead to issues such as dielectric relaxation and charge trapping. On a more positive note, XLPO is increasingly recognized for its advantages as a halogen-free, thermally stable insulation material tailored for PV applications. Certified cable types like H1Z2Z2-K adhere to EN 50618 and IEC 62930 standards, leveraging XLPO’s low dielectric constant, minimal dipolar polarization, and exceptional resistance to heat-induced degradation. Notably, there is a scarcity of literature addressing the dielectric performance of XLPO in comparison to XLPE and PVC under conditions of reversing high-voltage DC stress—an oversight this study seeks to rectify. This research intends to investigate and compare the dielectric characteristics of cables insulated with XLPO, XLPE, and PVC. Key electrical parameters to be assessed include insulation resistance (IR), dielectric absorption ratio (DAR), and polarization index (PI), utilizing advanced measurement methodologies. Environmental variables such as temperature and humidity will be rigorously controlled to yield material-specific insights. Additionally, Fourier-transform infrared (FTIR) spectroscopy will be employed to analyze the molecular structures and evaluate their longevity. The findings from this study represent a significant advancement in comprehending the polarity-dependent dielectric responses in polymeric cable insulation, which is vital for selecting optimal materials and establishing standards within renewable energy systems. By highlighting the distinctive properties of XLPO, XLPE, and PVC, this research advocates for the strategic adoption of XLPO as a superior insulation option for sustainable long-term performance in clean energy infrastructures. Collectively, this research examines future directions for a promising future in renewable energy development [1,2].

2. Materials and Methods

2.1. Preparation of Cables

For this investigation, three types of virgin low-voltage power cables with different insulation materials—cross-linked polyolefin (XLPO), cross-linked polyethylene (XLPE), and polyvinyl chloride (PVC)—were selected to study their polarity-dependent dielectric behavior under high-voltage direct current (DC) stress. All samples were unused (factory-fresh) and had not undergone any prior electrical or mechanical stress, ensuring that the observed responses accurately reflect the intrinsic insulation characteristics, as shown in Figure 1.
Virgin XLPE CV 0.6/1 kV and XLPO-insulated PV cable H1Z2Z2-K pellets were sourced from BCC—Bangkok Cable Co., Ltd. (Samut Prakan and Chachoengsao, Thailand). The cables featured PVC insulation and a TPE outer sheath (BI-FLEX; rated 0.6/1 kV). The XLPO and XLPE cables were single-core types with a nominal conductor cross-section of 1 × 4 mm2, while the PVC cable had a larger conductor cross-section of 1 × 10 mm2. Each sample was cut to a uniform length of 40 cm to maintain consistent electrode geometry across all specimens. The general structure of these cables consists of a stranded copper conductor, an inner insulation layer, and an outer thermoplastic sheath, as illustrated in Figure 1a. To prepare the samples for dielectric testing, a 3 cm section of the outer sheath was removed. The exposed insulation surface was then wrapped circumferentially with aluminum tape to form a uniform and low-resistance outer electrode. This configuration minimizes electric field distortion and surface corona, ensuring the repeatability of test conditions. Conductive carbon paste was applied between the aluminum tape and the insulation surface to enhance electrical contact and reduce interface impedance. Each cable end was sealed with a silicone rubber insulation compound to prevent surface discharge, edge effects, or moisture ingress that could interfere with measurement stability. The final prepared specimens of XLPO, XLPE, and PVC cables are shown in Figure 1b–d, respectively.

2.2. Insulation Resistance Measurement Setup

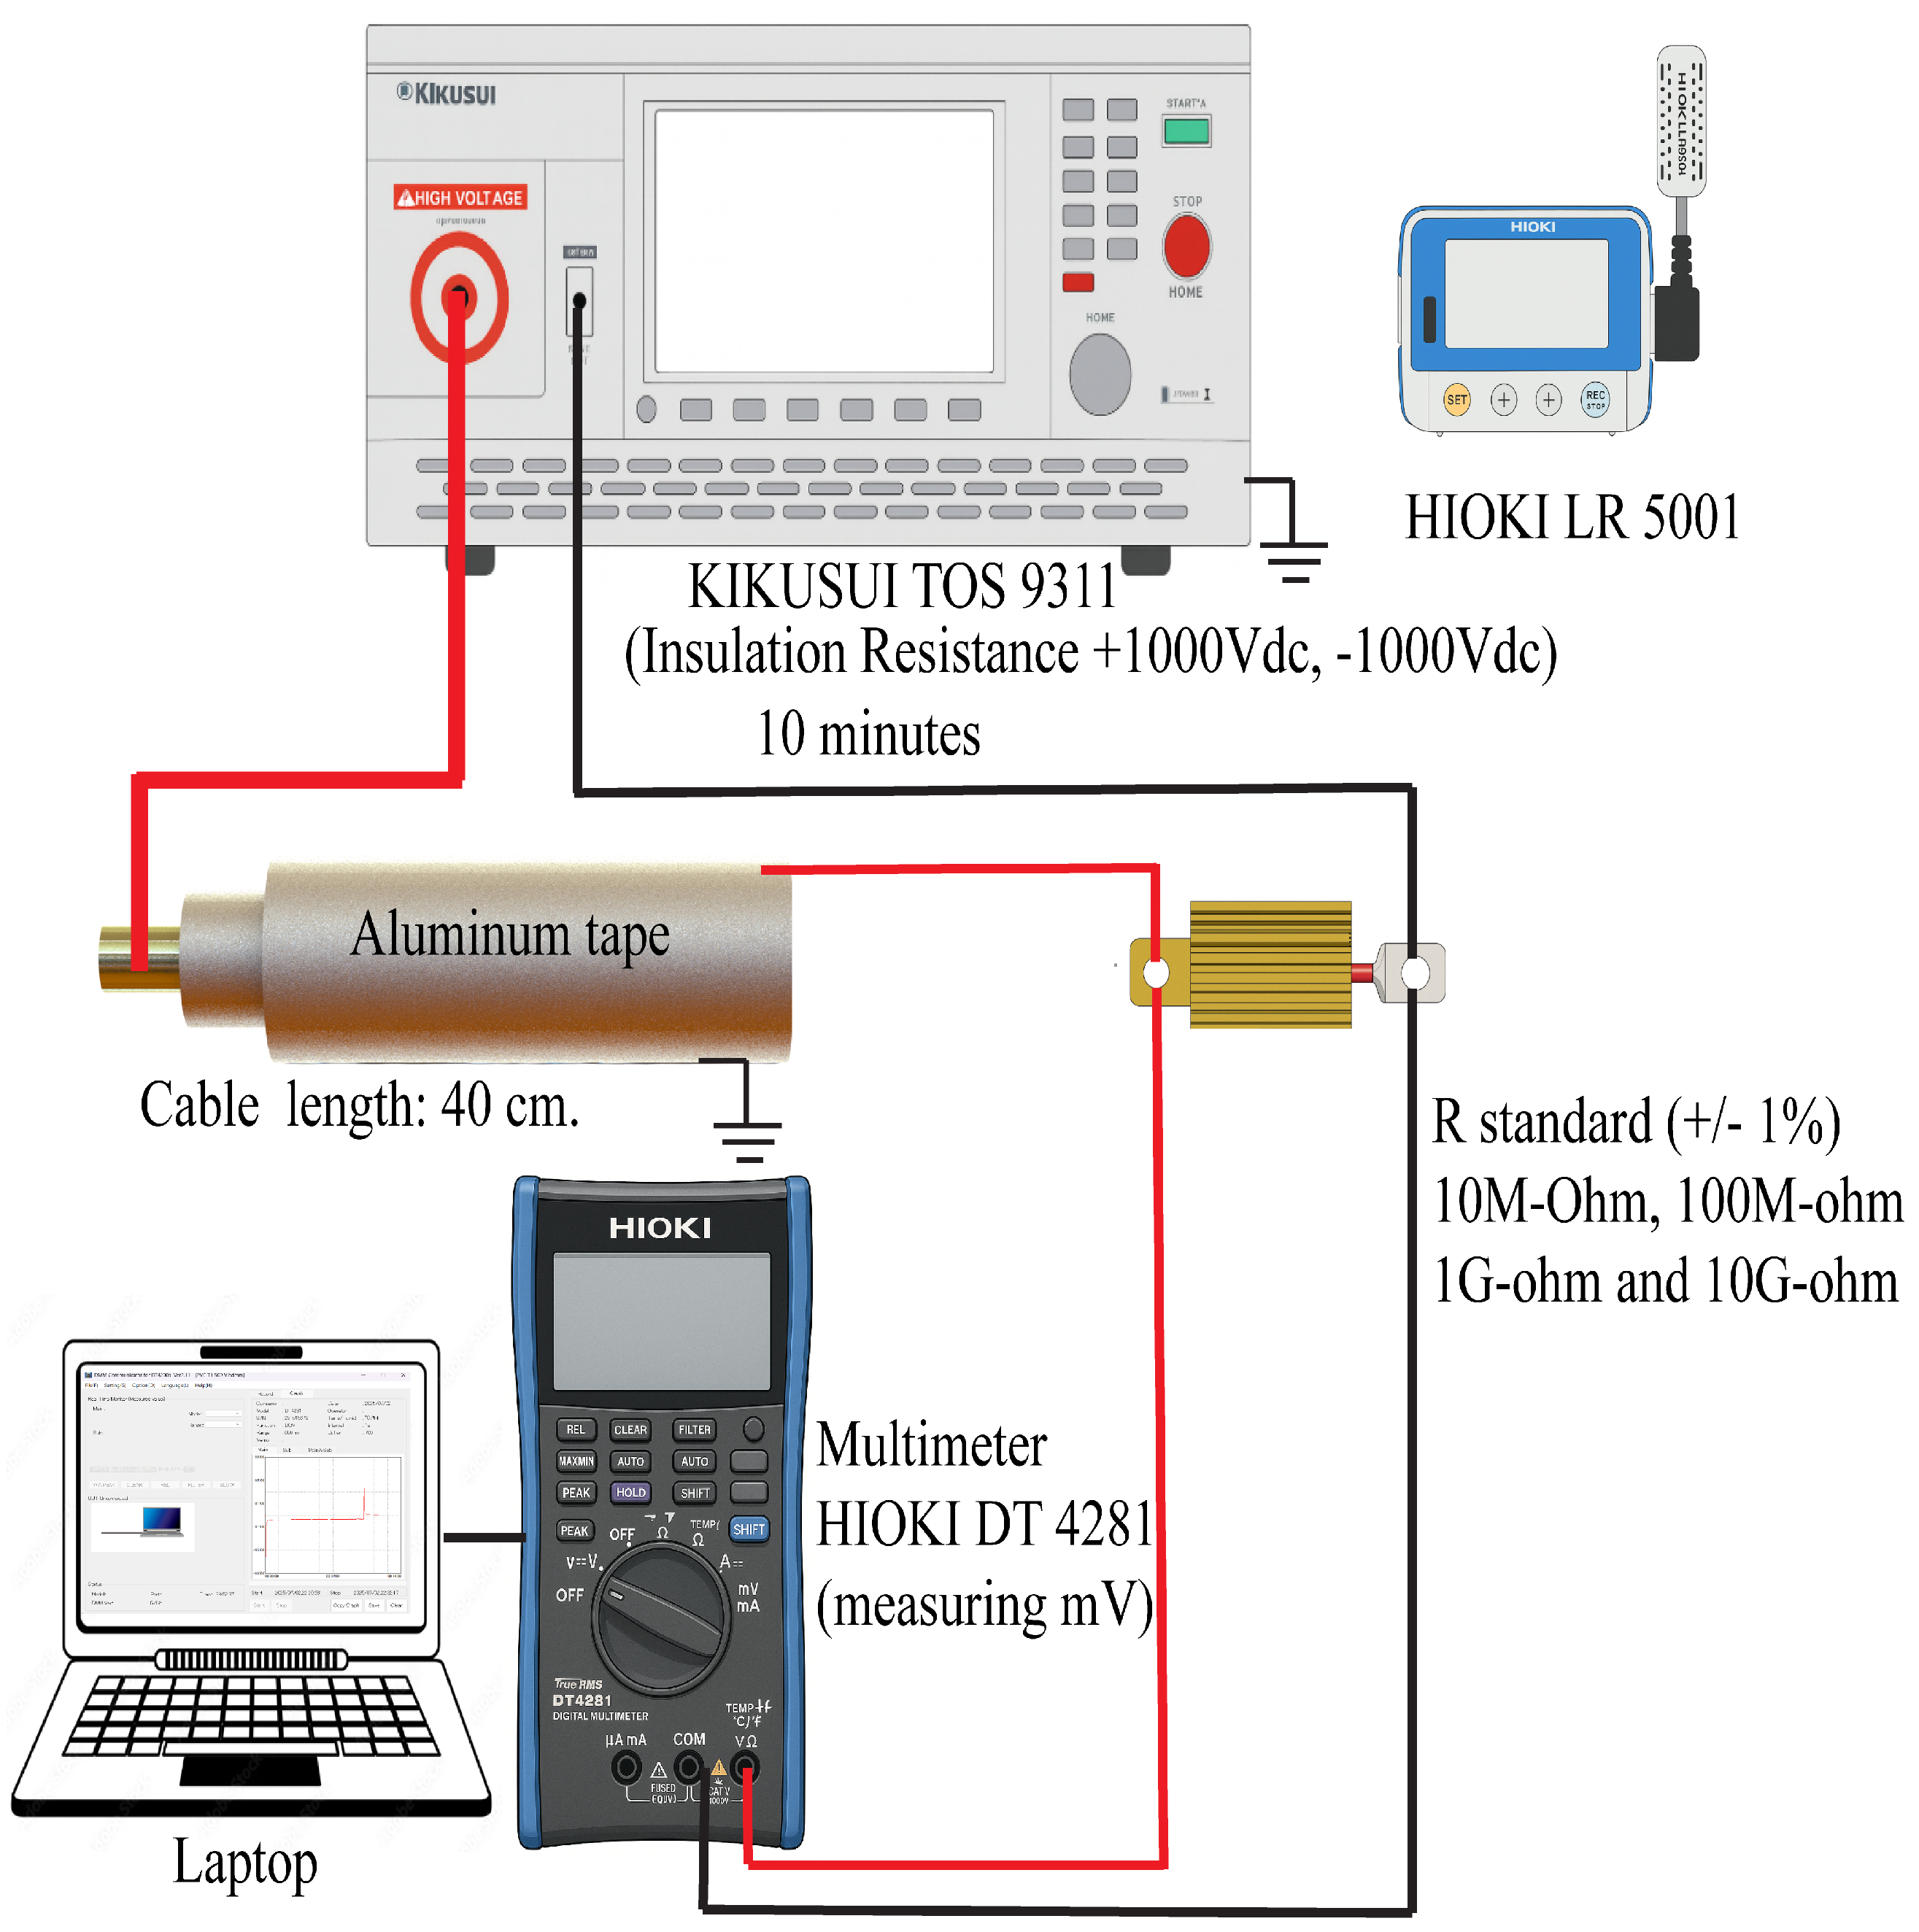
To evaluate the polarity-dependent dielectric characteristics of XLPO-, XLPE-, and PVC-insulated cables, insulation resistance (IR) tests were conducted using a high-impedance voltage-to-current conversion circuit under high-voltage DC excitation. The IR test setup is illustrated schematically in Figure 2.
XLPO-, XLPE-, and PVC-insulated cables underwent insulation resistance (IR) tests using a high-impedance current-to-voltage (shunt) measurement under high-voltage DC excitation. The IR test setup is illustrated schematically in Figure 2. A test voltage of ±1 kV DC was applied using a Kikusui TOS 9311 insulation tester. The leakage current was measured indirectly by recording the voltage drop across a precision standard resistor (Sonel CS-1), which was selected based on the insulation type to optimize signal resolution in the millivolt range. The resistance values chosen were as follows: 10 MΩ for PVC and 100 MΩ for XLPE and XLPO. This series resistor configuration enabled the conversion of sub-nanoampere leakage currents into readable millivolt signals, which were measured using a high-resolution digital multimeter (Hioki DT4281). All measurements were performed in triplicate (n = 3) for each material and polarity to assess repeatability; unless otherwise noted, results are reported as mean ± SD. All resistors used in this study had a tolerance of ±1%. The multimeter was connected to a computer for real-time voltage logging and time-resolved data acquisition.
Ramp durations were set to ≥10τ to suppress RC bias in Ceff estimation, where τ = Rseries Ccable; plateau averaging was used to estimate the conductance G. Temperature and relative humidity were maintained at 25 °C and 55% RH and logged (LR 5001) using a calibrated T/RH sensor. All tests were conducted in a controlled environment maintained at 25 °C and 55% relative humidity to minimize external influences on dielectric response. The applied voltage waveform included a rise time of 5 s, a steady-state test time of 600 s, and a fall time of 5 s, followed by a depolarization current (PDC) measurement phase lasting from 601 to 1000 s. This protocol enabled the accurate characterization of the charging and relaxation behaviors of the insulation materials under both positive and negative DC bias. The use of high-value resistors for low-current metrology is well established; for example, ref. [3] demonstrated attoampere measurements with a 185 GΩ feedback ammeter, and [4] described femtoampere electrometer calibration using 100 GΩ–1 TΩ standards on low-leakage PTFE fixtures to minimize parasitic paths.

2.3. Sample Preparation for FTIR Analysis

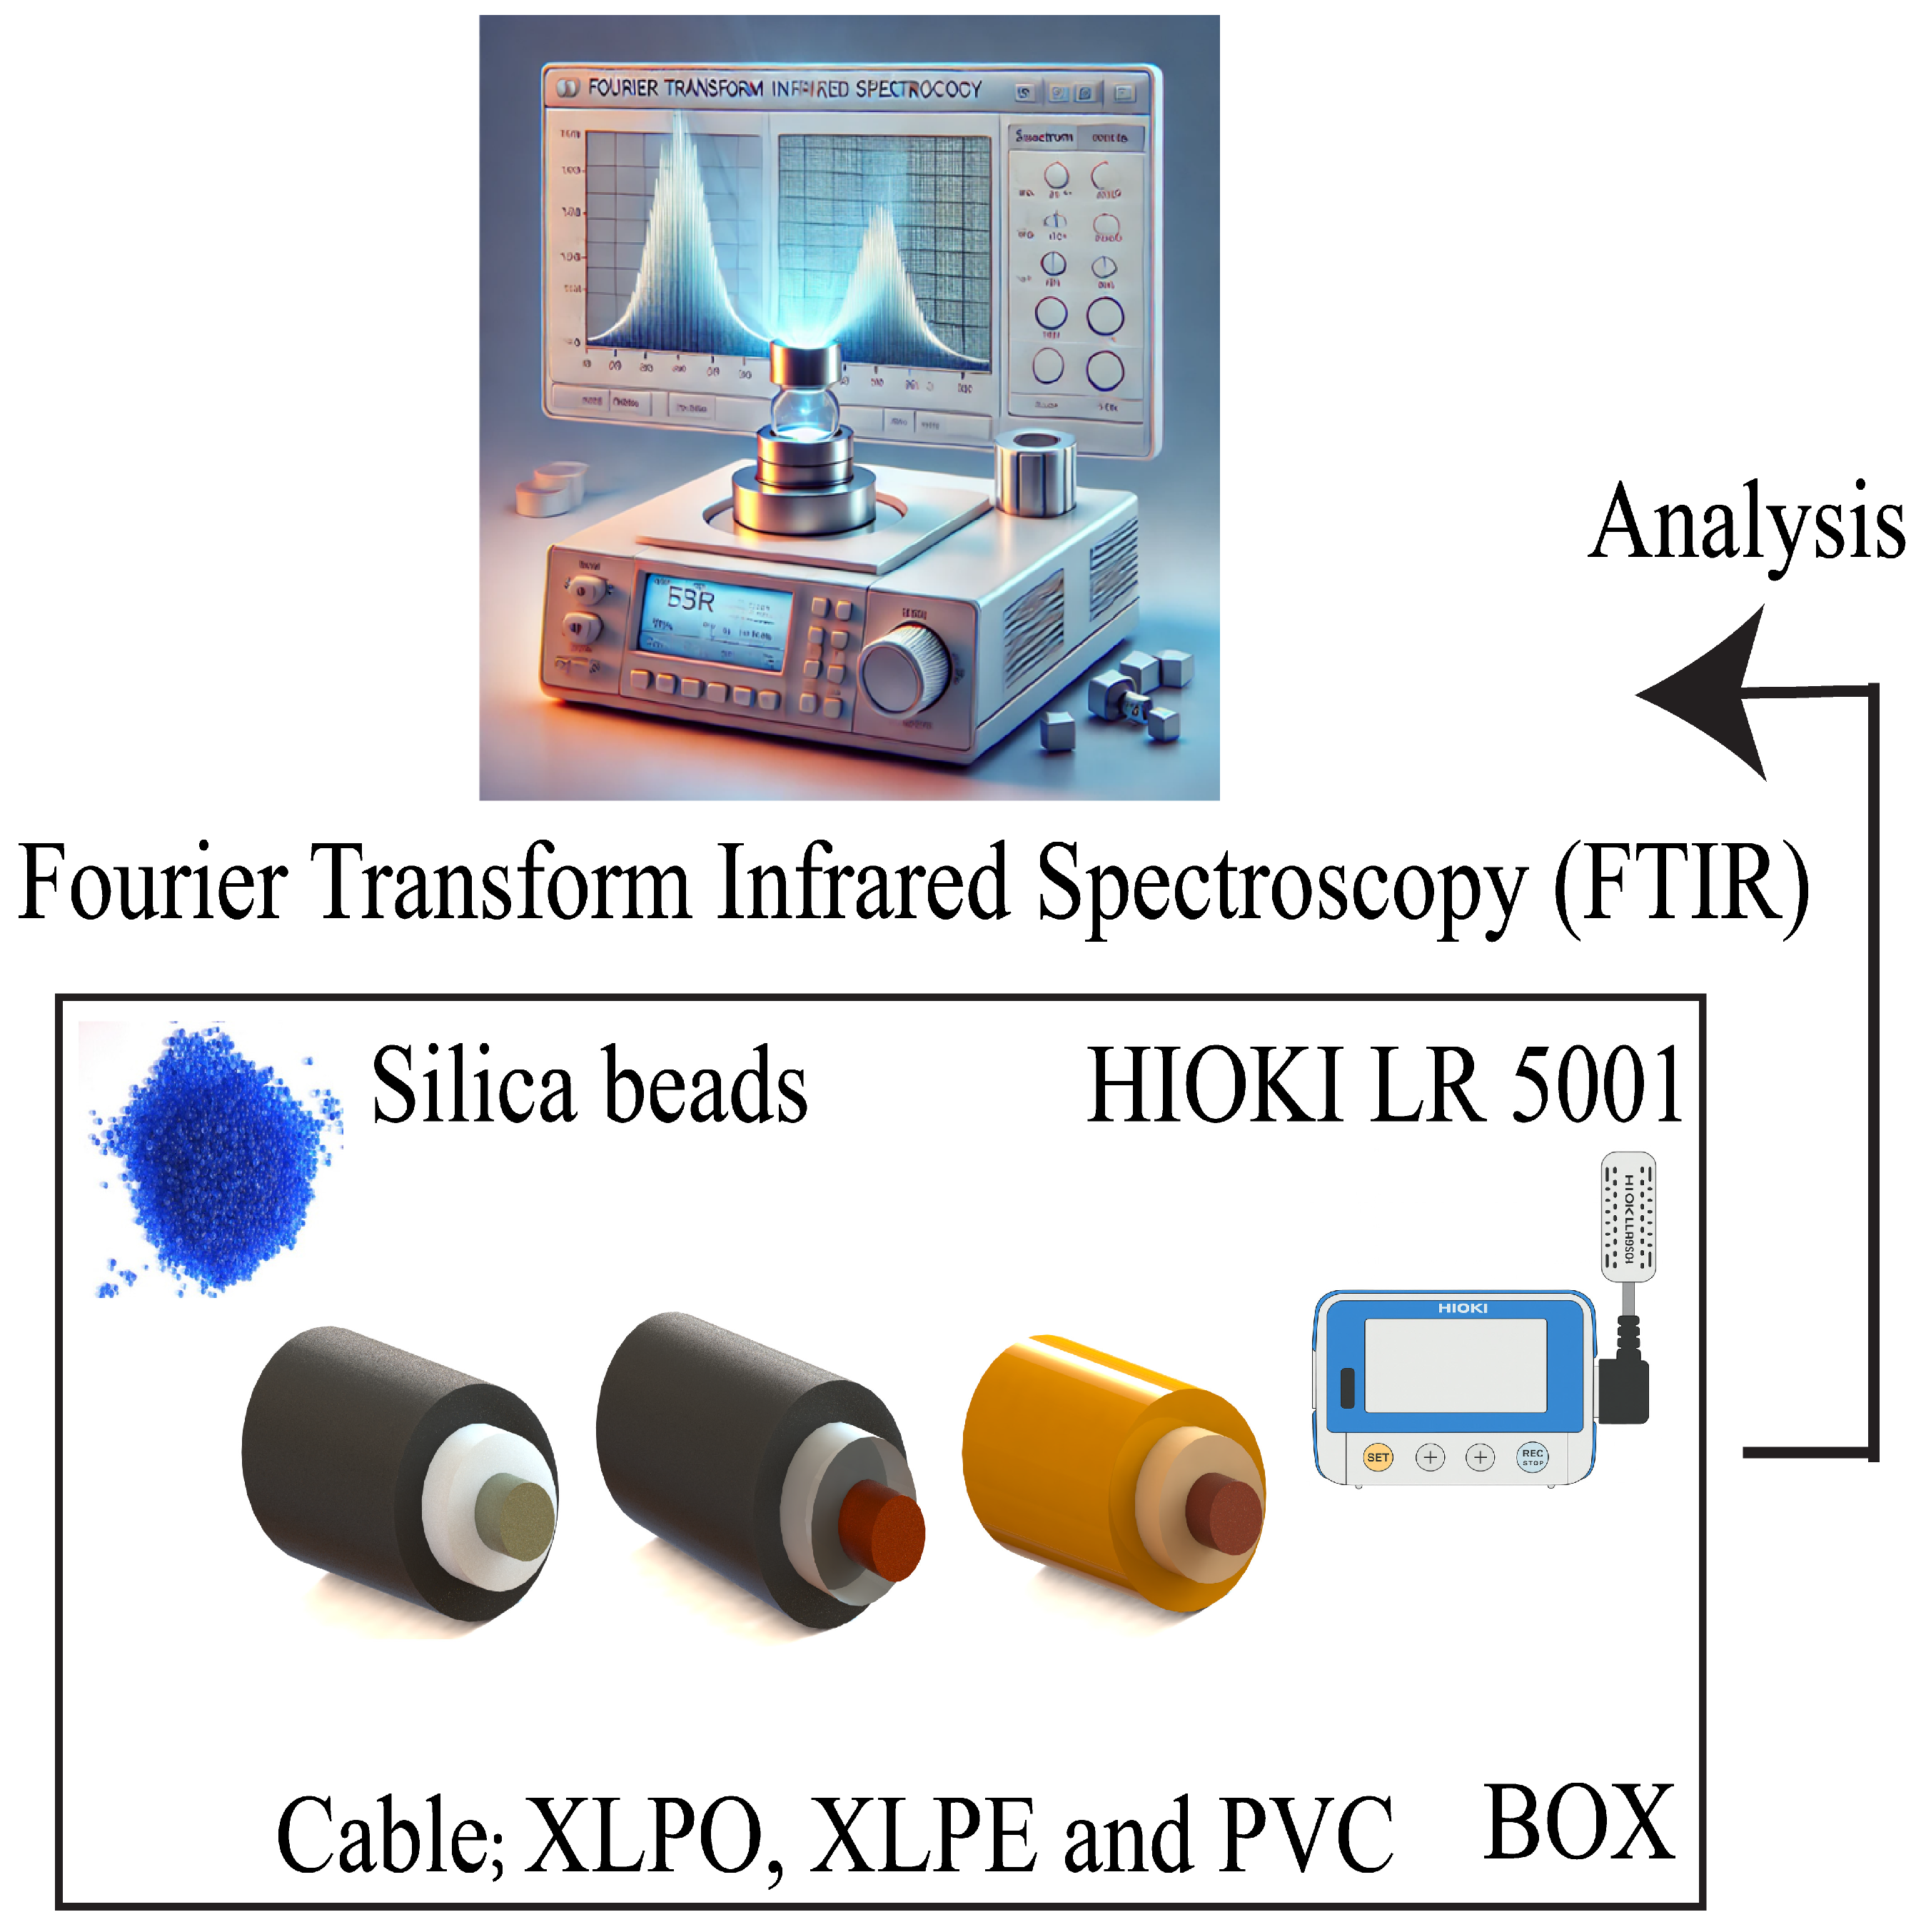
To characterize the chemical structure of the cable insulation materials, samples of cross-linked polyolefin (XLPO), cross-linked polyethylene (XLPE), and polyvinyl chloride (PVC) were prepared for Fourier Transform Infrared Spectroscopy (FTIR) analysis, as shown in Figure 3 [2,5,6,7].
The insulation layers were manually separated from the conductor using a precision polymer cutter to preserve geometry and surface integrity. For FTIR analysis, each material was shaped into cylindrical segments approximately 2 mm in length, with dimensions representative of the actual insulation thicknesses: XLPO: outer diameter of 3.2 mm, insulation thickness of 0.7 mm; XLPE: outer diameter of 3.88 mm, insulation thickness of 0.7 mm; and PVC: outer diameter of 9.5 mm, insulation thickness of 3.0 mm. Following the cutting process, all samples were cleaned using a 70:30 mixture of deionized (DI) water and isopropyl alcohol (IPA) to remove surface contaminants such as oils, grease, and dust that could interfere with spectral readings. The cleaning was performed using lint-free laboratory tissues (Kimwipes) under protocols established in prior studies [8,9]. Samples were allowed to air-dry at room temperature to avoid heat-induced chemical alterations. To prevent moisture uptake before FTIR measurements, the prepared samples were stored in a sealed dry box containing silica beads as a desiccant. Environmental stability within the box was monitored using a temperature and humidity data logger (HIOKI LR5001), which maintained conditions at 25 ± 0.5 °C and 55 ± 2% RH during storage. FTIR analysis was performed using attenuated total reflectance (ATR) mode on a benchtop spectrometer with a resolution of 4 cm−1, scanning across the range of 4000–500 cm−1 [6].

3. Results

3.1. Leakage Current and Insulation Resistance Characteristics of Virgin Insulation Materials

The experimental results regarding insulation resistance and leakage current behavior over a 600-s duration of direct current (DC) stress, followed by depolarization, for three types of virgin cables—XLPO, XLPE, and PVC—under both positive and negative polarities under ±1 kV DC stress. The data were obtained through precise current measurements using standard resistors and multimeter logging, converting the voltage drop into picoampere-level currents. This process facilitated the calculation of critical dielectric health indicators: the Dielectric Absorption Ratio (DAR), Polarization Index (PI), and Loss Index (LI). All tests were conducted under stable environmental conditions (25 °C, 55% relative humidity), effectively eliminating variances due to thermal noise or moisture.
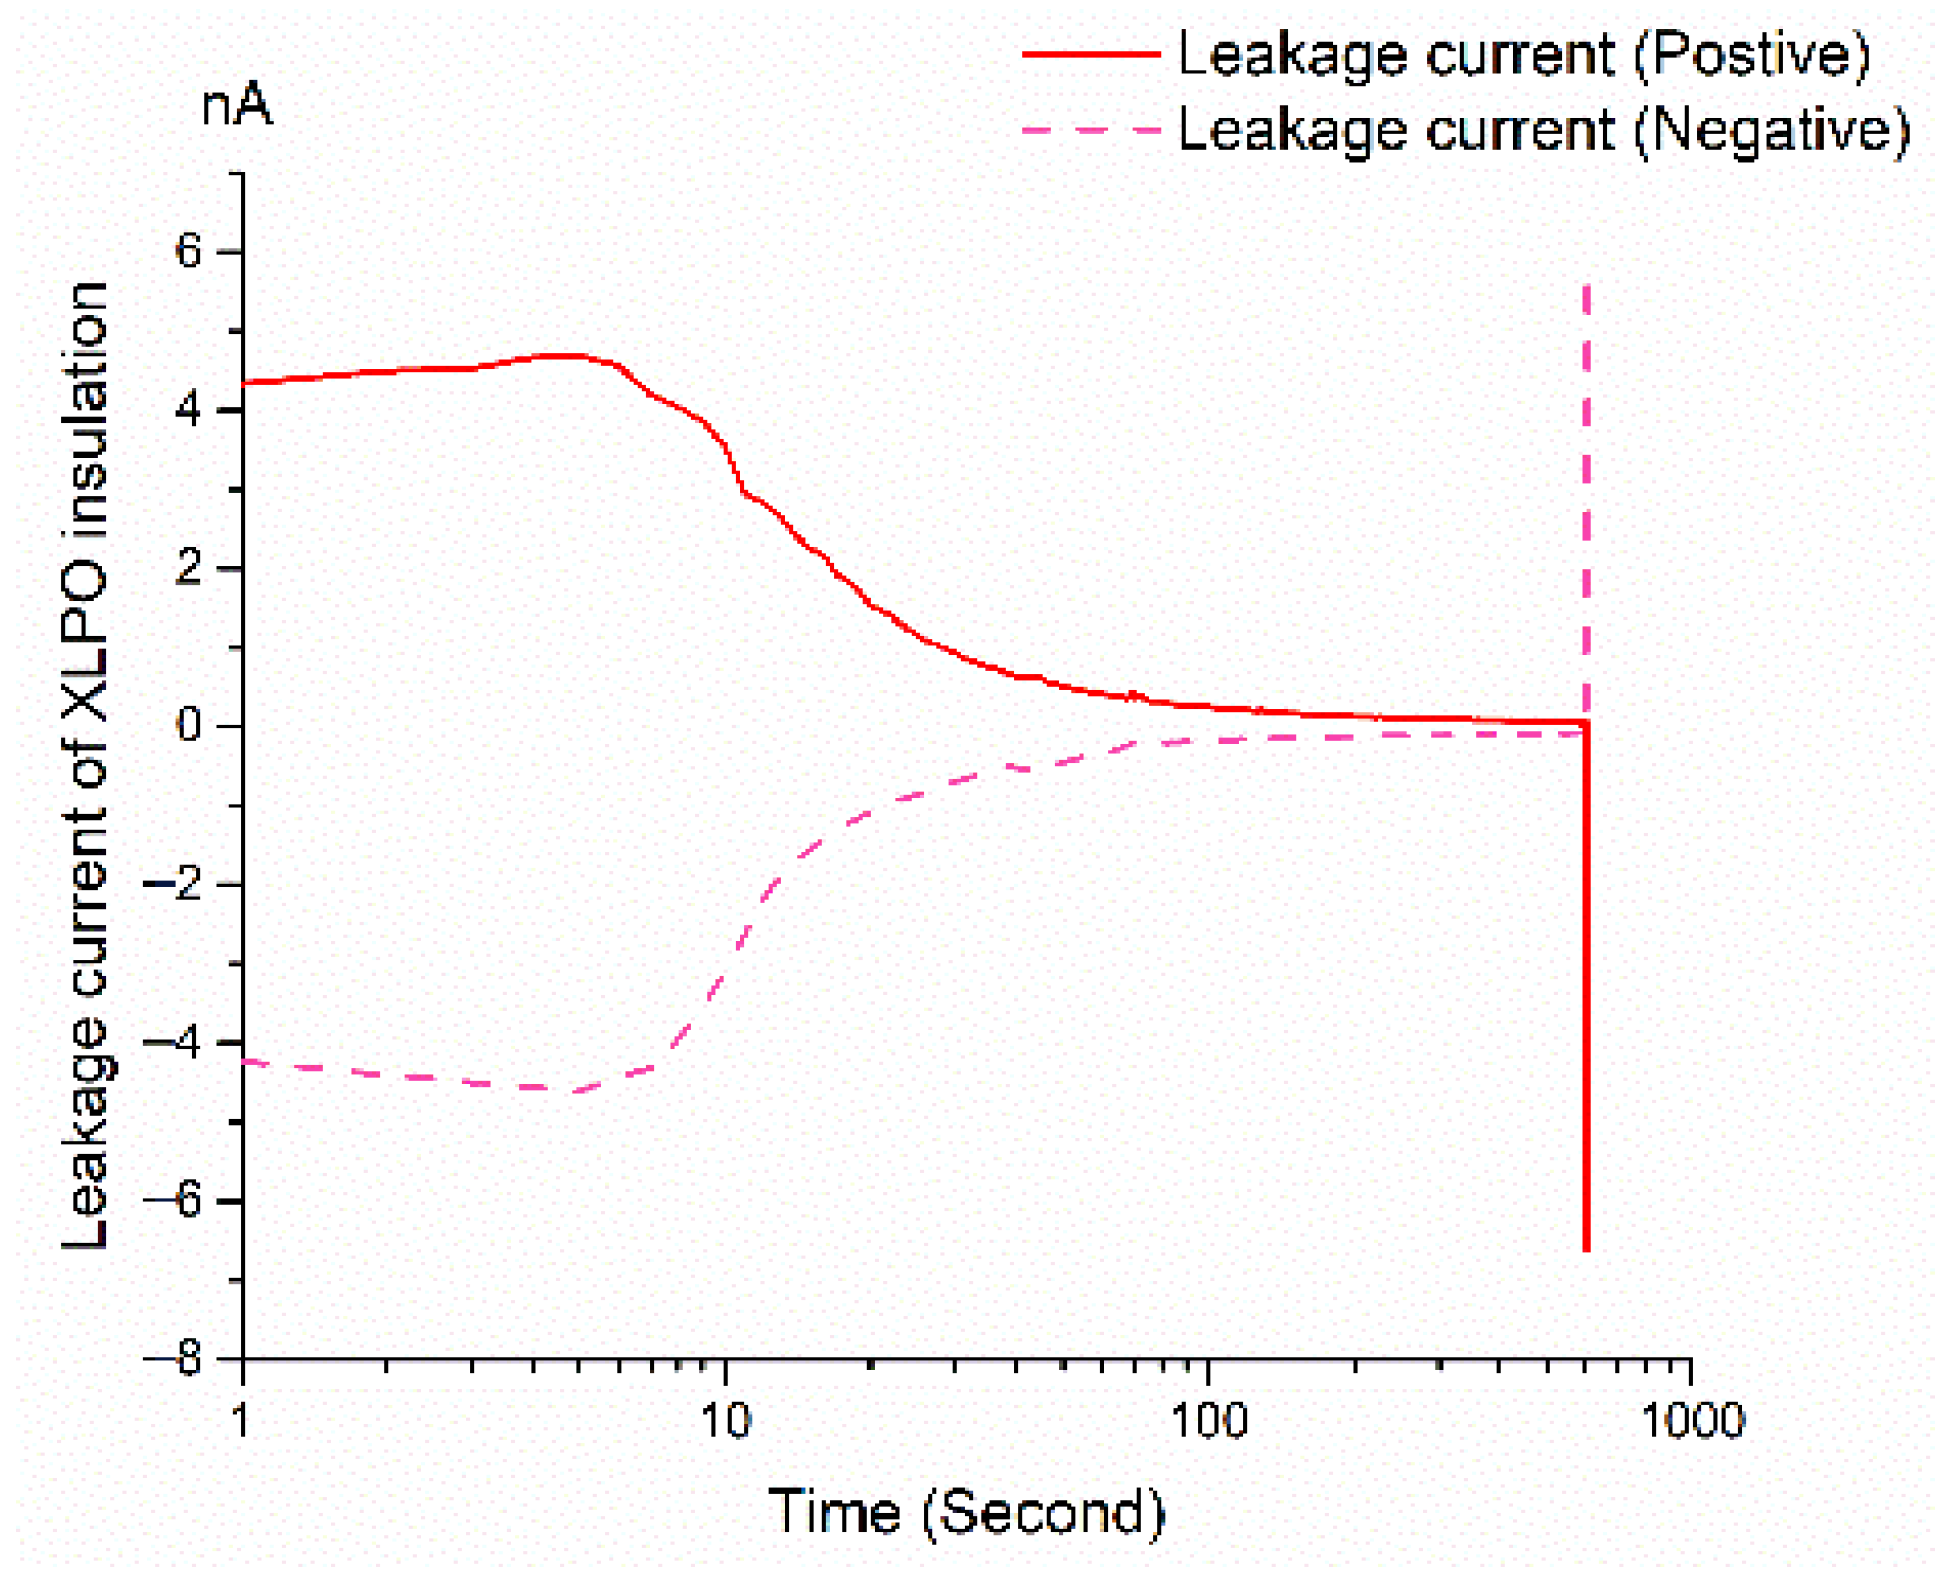
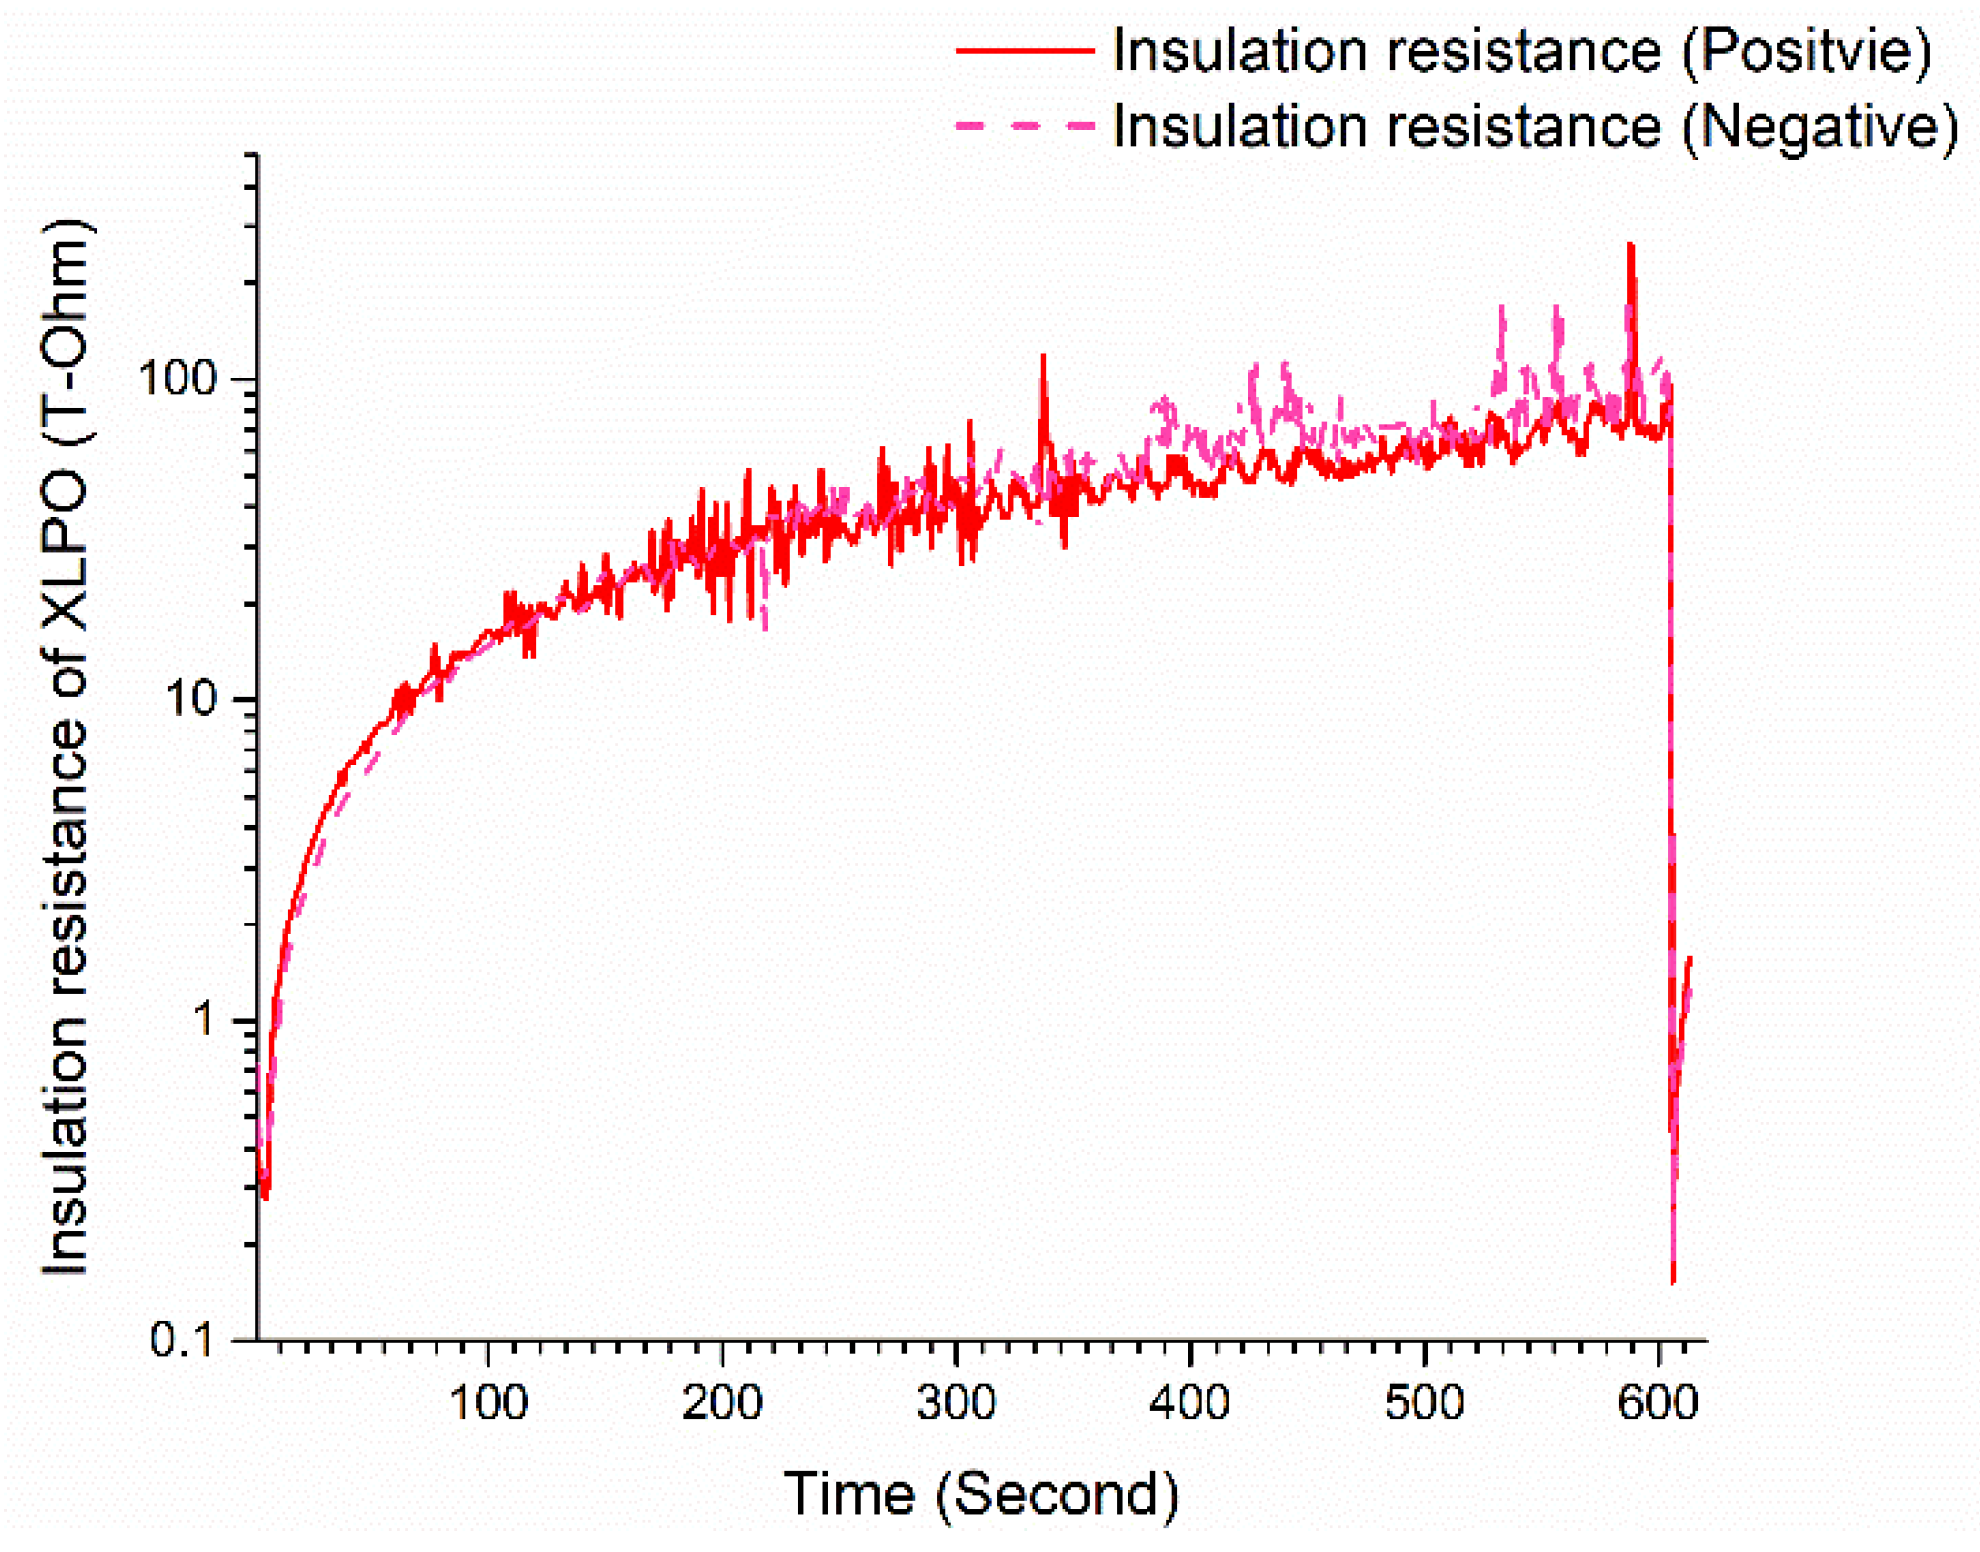
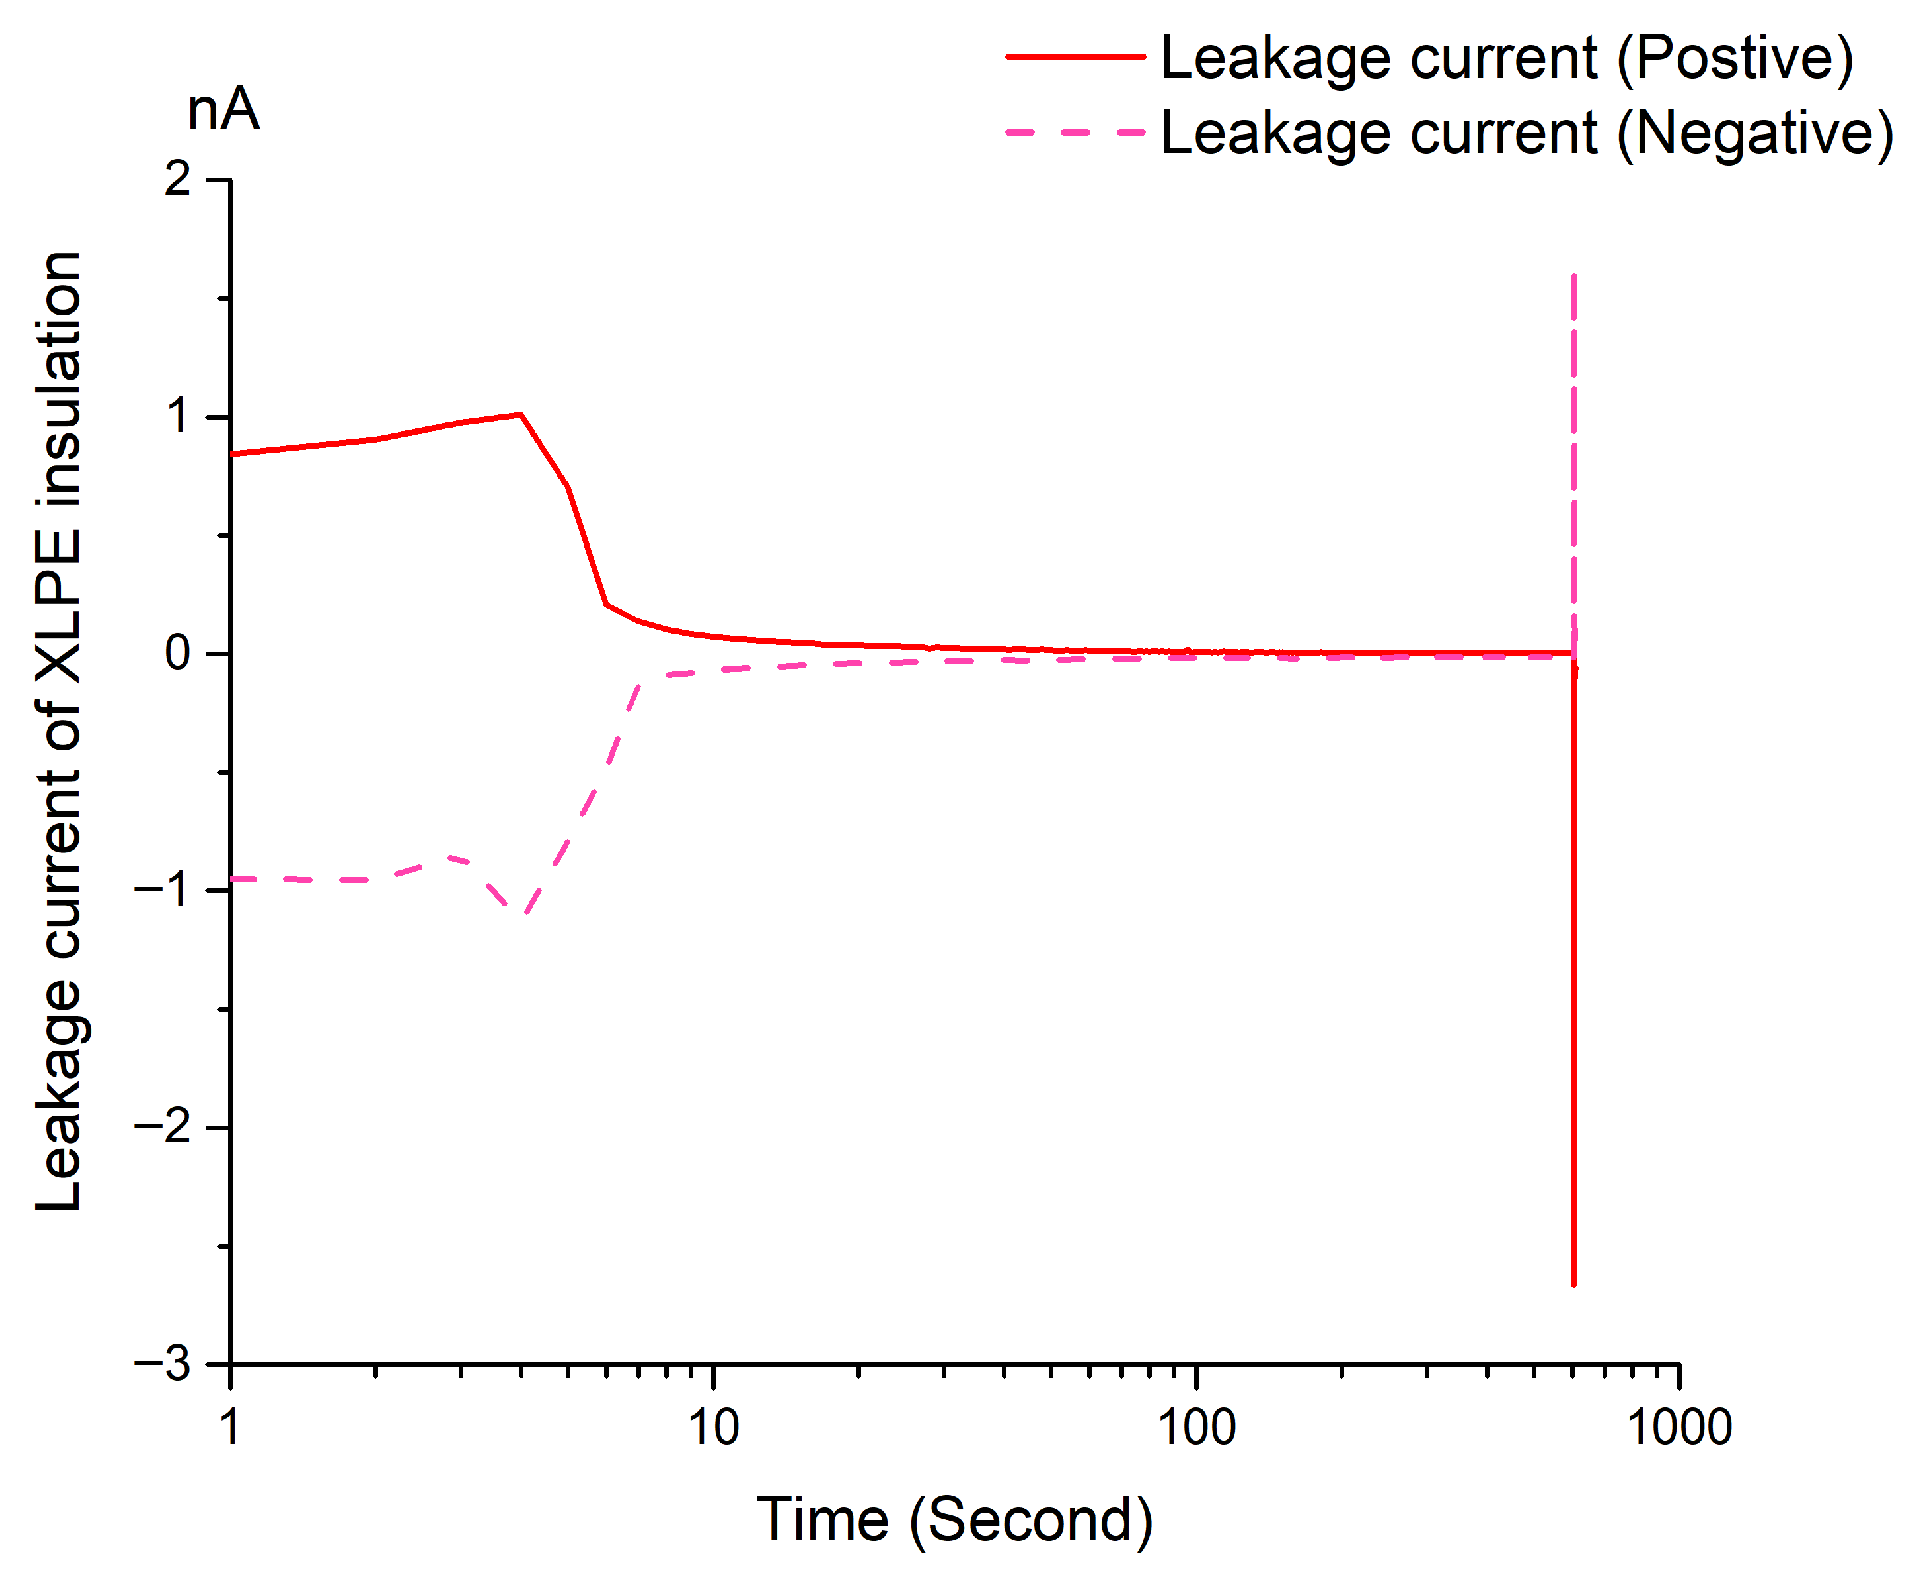
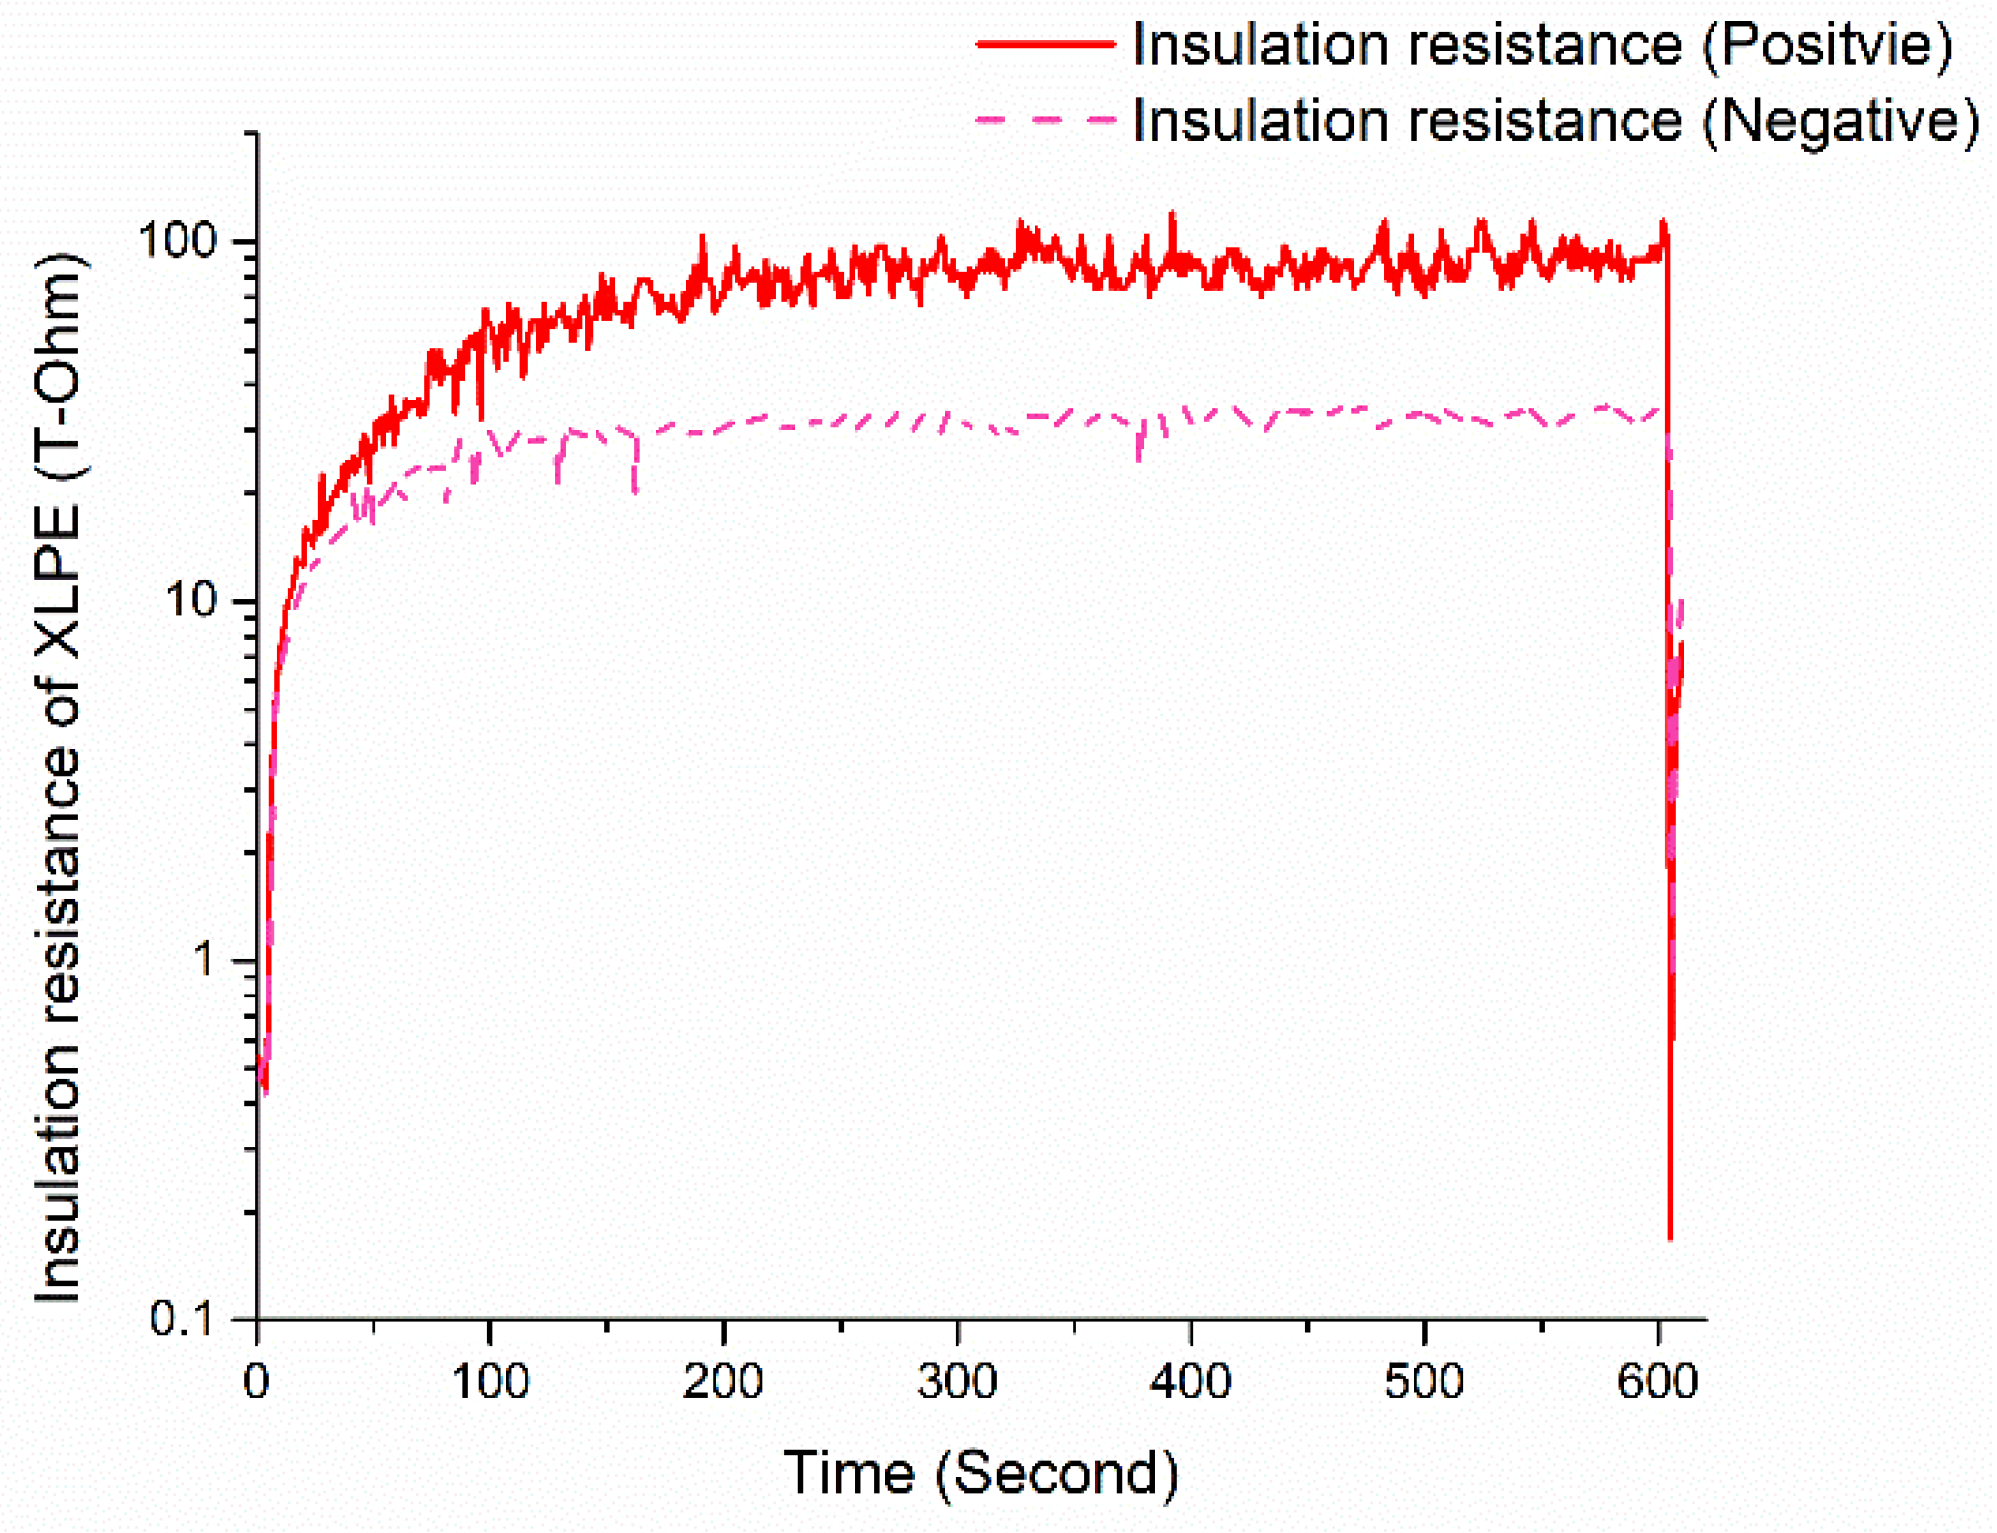
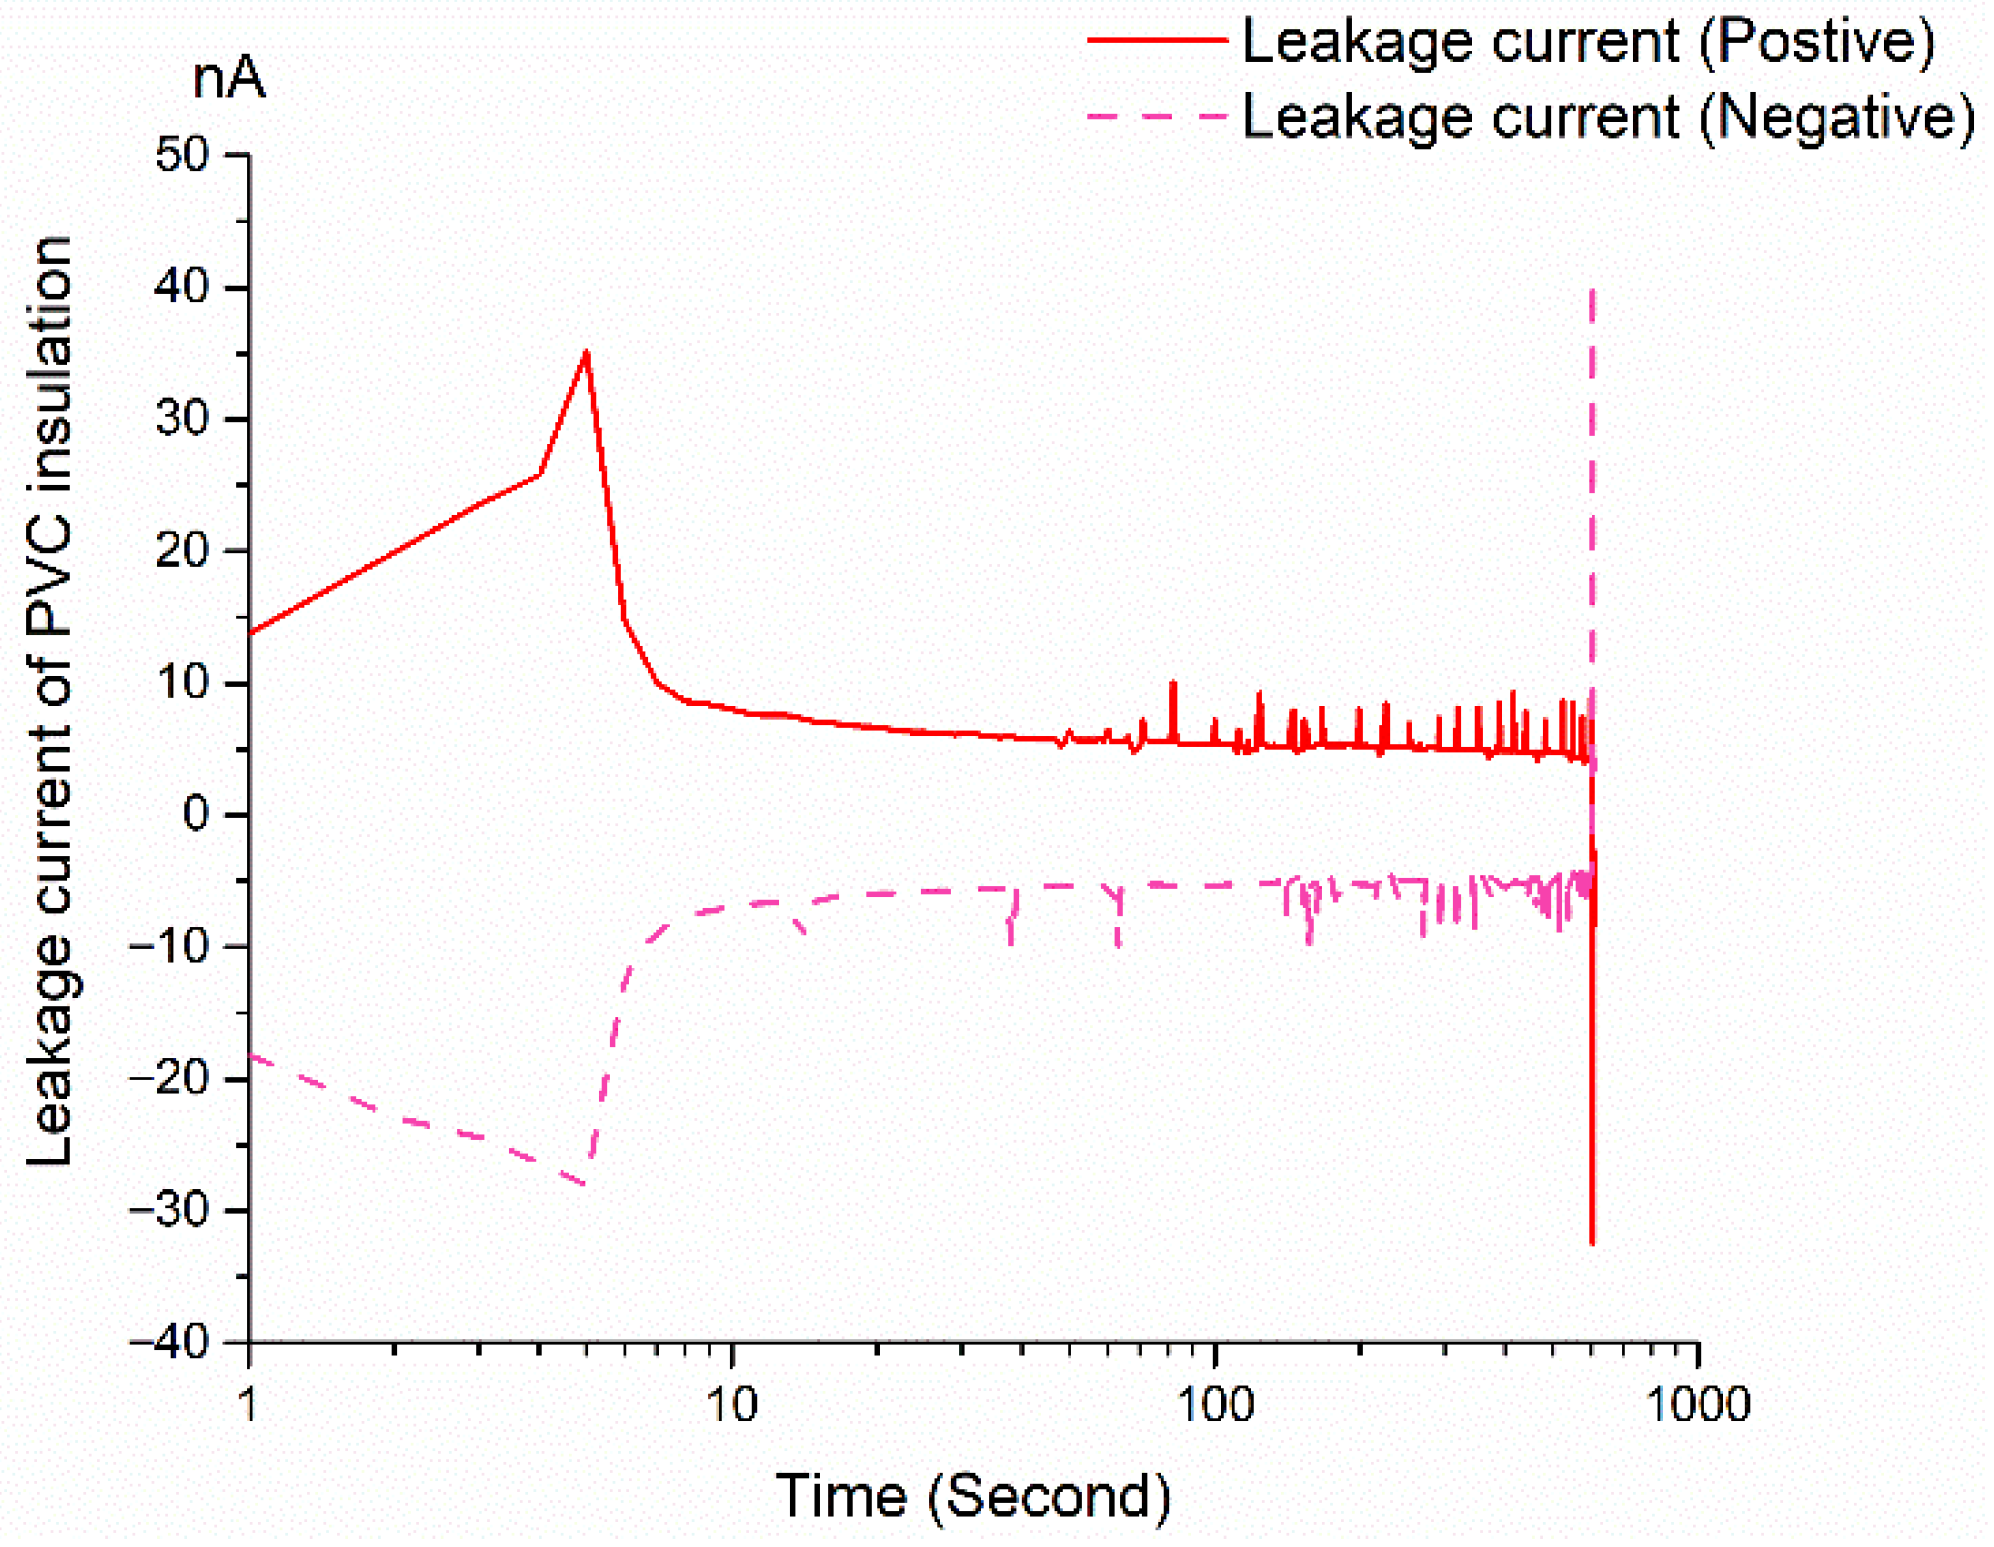
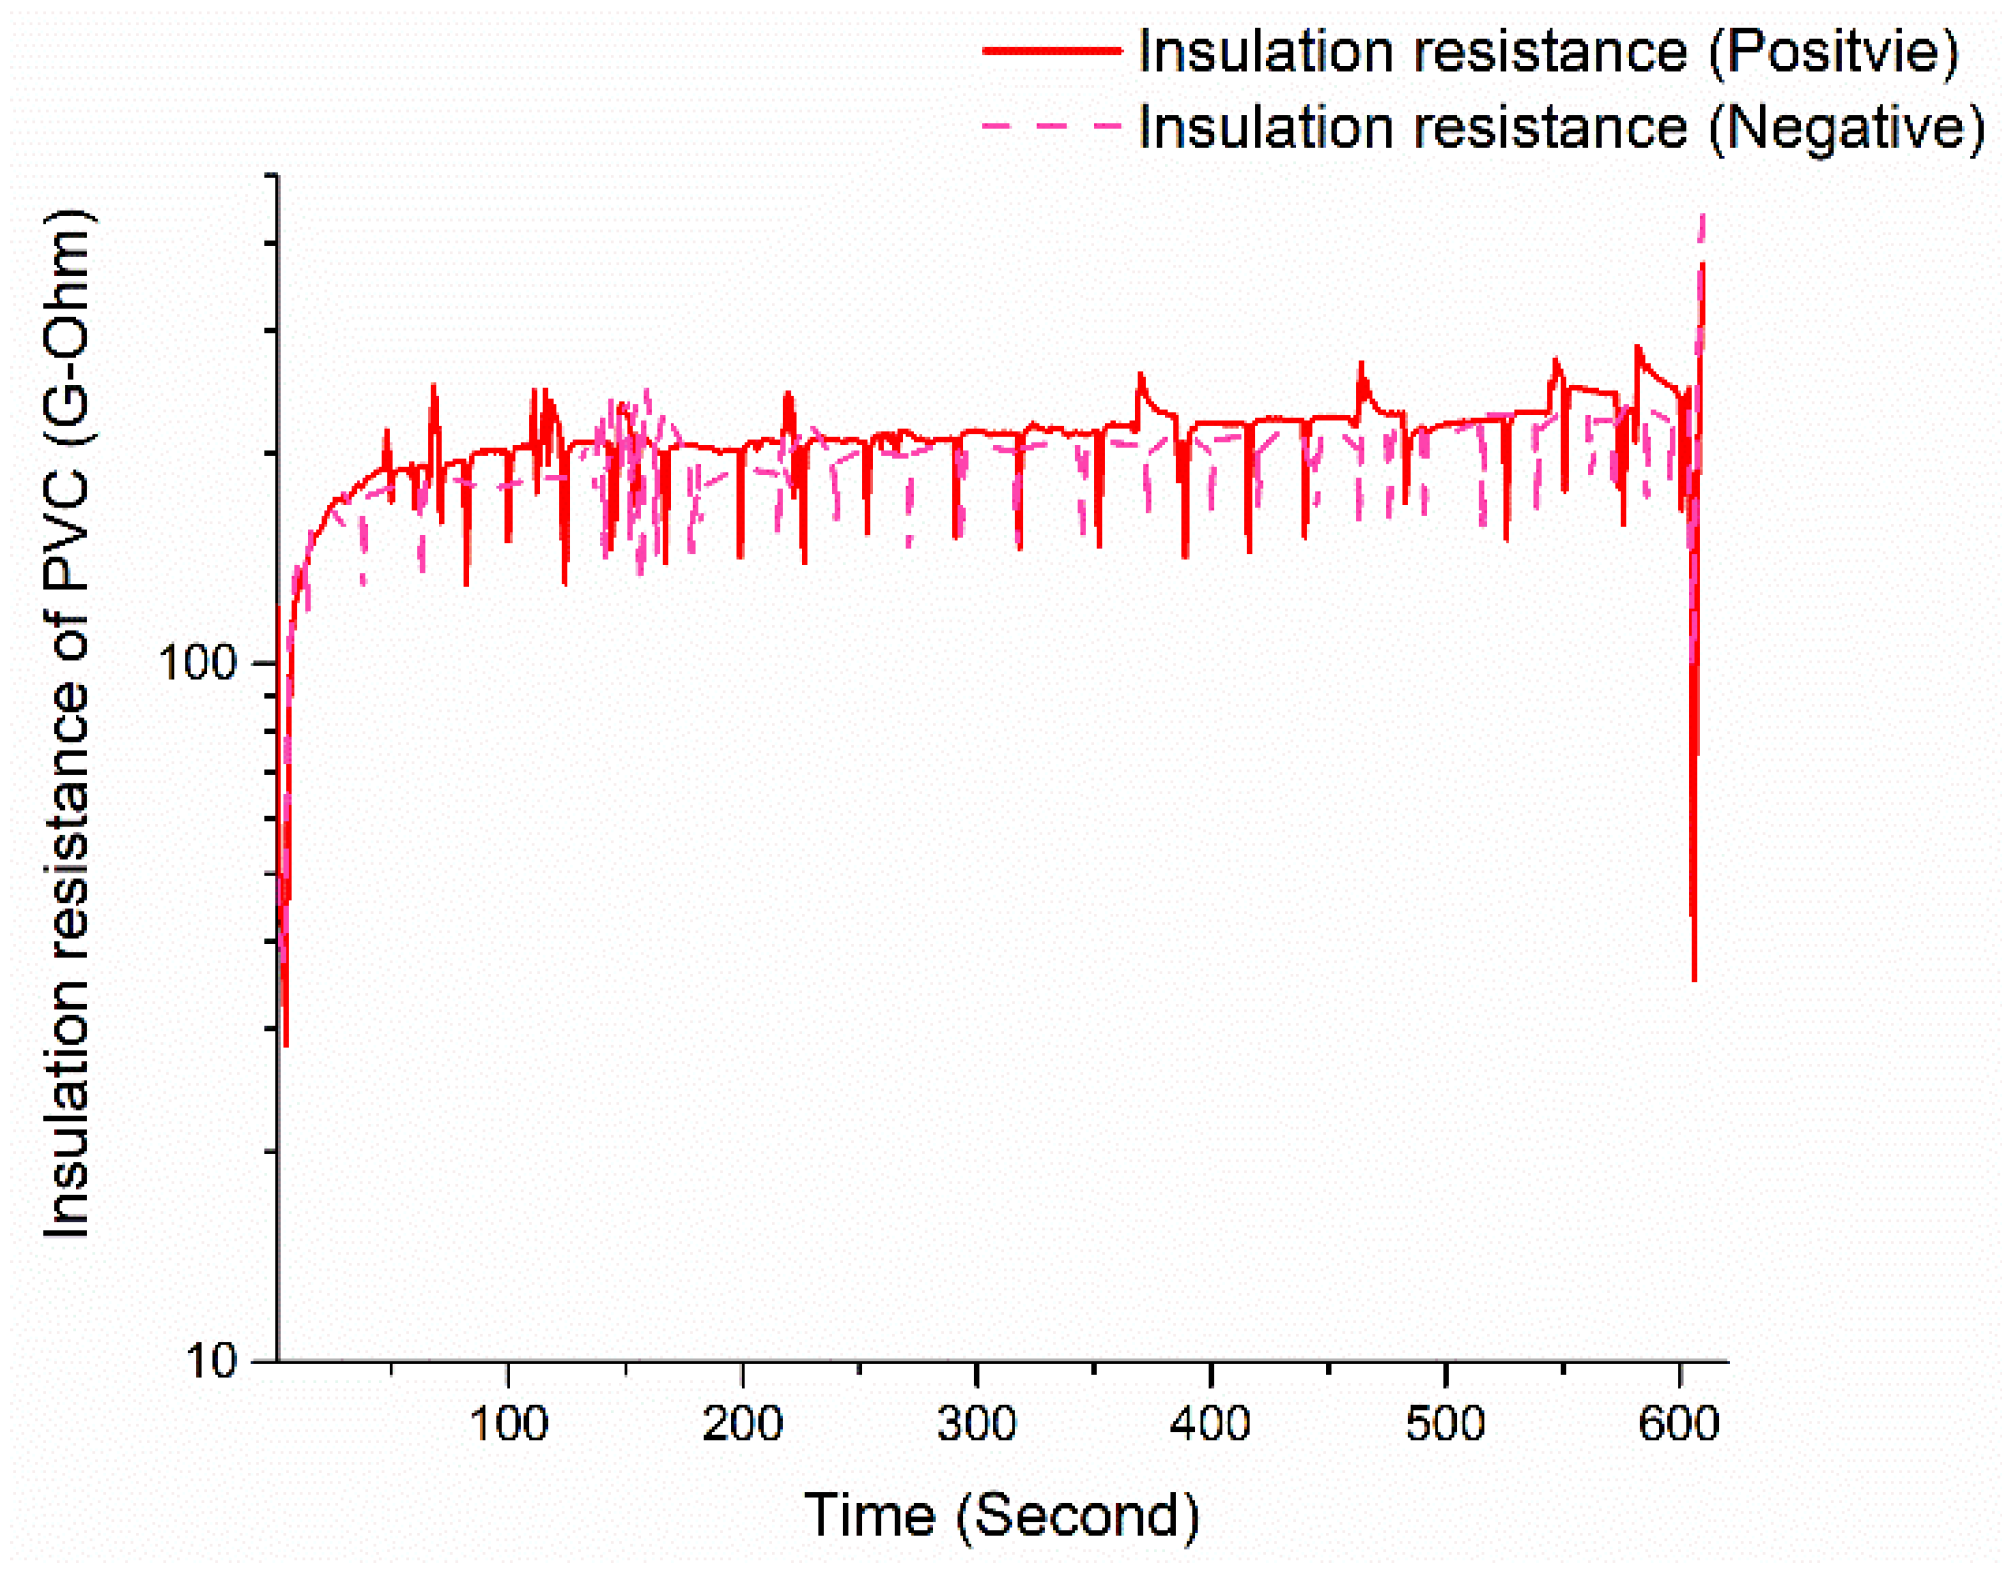
XLPO Insulation (Figure 4 and Figure 5): Under positive polarity, XLPO exhibited a marked increase in insulation resistance, rising from 4.44 TΩ at 30 s to 65.37 TΩ at 600 s. This observation indicates a time-dependent alignment of molecular dipoles and deep trapping sites [10,11]. The calculated DAR (2.22) and PI (6.62) suggest a strong capacity for dielectric relaxation and low ionic mobility. Additionally, the loss index of 1.53 (Idischarge = 6.61 nA; Icharge = 4.34 nA) reflects a predominance of capacitive energy storage with controlled relaxation, likely assisted by XLPO’s low-polarity structure and limited space-charge mobility. In the context of negative polarity, the initial resistance of XLPO was recorded at 3.67 TΩ at 30 s, reaching 116.92 TΩ at 600 s, with a higher PI of 14.72 and a similar DAR of 2.17. This suggests that alignment of deep traps may be induced by field asymmetry. The increase in insulation resistance under negative bias may be attributed to charge blocking at the electrode-polymer interface, as described in the literature [12] on DC space charge. The observed loss index of 1.36 (>1) indicates low-to-moderate discharge–charge asymmetry with a measurable conduction/trap-release contribution, reinforcing XLPO’s robust dielectric profile under varying polarities. XLPO Insulation XLPE Insulation (Figure 6 and Figure 7): The leakage current for XLPE was significantly lower compared to XLPO, with Icharge measured at 1.01 nA and Idischarge at 2.66 nA under positive polarity. The insulation resistance improved from 17.49 TΩ to 89.19 TΩ, yielding DAR of 1.85 and PI of 2.75, indicative of moderate polarization consistent with restrictions associated with the crystalline phase. However, LI reached 2.63 (>1), indicating strong discharge–charge asymmetry and a dominant conduction/trap-release contribution within the selected window, during depolarization. This behavior is consistent with previous findings on XLPE, wherein peroxide cross-linking produces polar byproducts (e.g., acetophenone) that facilitate space-charge accumulation and delayed relaxation processes [13,14]. Under negative polarity, XLPE exhibited lower PI (1.47) and DAR (1.56), along with a loss index of 1.46. These results confirm polarity-dependent dielectric behavior, indicating that trap-assisted conduction mechanisms vary according to the field direction due to the asymmetric molecular structure or interfacial charge effects [15,16]. PVC Insulation (Figure 8 and Figure 9): PVC displayed the highest initial leakage current, with Icharge at 35.16 nA under positive polarity, and the lowest overall insulation resistance, ranging from 170.9 GΩ to 241.6 GΩ. The poor DAR (0.98) and PI (1.45) indicate that predominant conduction mechanisms overshadow dipolar relaxation effects. LI = 0.92 (<1) confirms an unbalanced relaxation process, likely attributed to ionic transport and the low activation energy necessary for polarization reversal. For the negative polarity condition, Icharge was 28.03 nA and Idischarge reached 40.76 nA, resulting in a LI of 1.45. Despite marginal improvements in DAR and PI values (1.00 and 1.28, respectively), the findings support the notion that PVC is susceptible to polarity-dependent conduction and exhibits unstable dielectric performance. These results align with the highly polar backbone of PVC and its tendency toward interfacial charge accumulation and shifts in conductivity under reverse fields [17]. Comparative Implications: The superior dielectric characteristics of XLPO are evidenced by consistently high insulation resistance, favorable PI and DAR metrics, and a low LI across both polarities, underscoring its suitability for long-term DC field applications, such as photovoltaic cables. In contrast, the polarity sensitivity and energy loss profile of PVC render it less suitable for DC stress environments. While XLPE demonstrates commendable initial resistance, it poses challenges related to asymmetric relaxation and energy loss. These trends corroborate previous research on charge mobility, trap dynamics, and relaxation times in polymeric dielectrics subjected to high-field stress [10,16,18].
Electrical insulation systems exhibit complex dielectric behavior under DC voltage stress due to the combined effects of conduction, polarization, and relaxation phenomena. To evaluate the health, stability, and energy dissipation characteristics of polymeric insulation materials such as XLPO, XLPE, and PVC, a set of time-domain diagnostic parameters is employed. These include Insulation Resistance (IR), Dielectric Absorption Ratio (DAR), Polarization Index (PI), Polarization and Depolarization Current (PDC) analysis, and the Loss Index. Insulation Resistance (IR) is a fundamental parameter that represents the opposition of a dielectric material to leakage current when a direct current (DC) voltage is applied. High IR values indicate good dielectric quality, low moisture content, and minimal conductive paths within the material. It serves as a baseline for evaluating insulation integrity and aging conditions [19]. The Dielectric Absorption Ratio (DAR) provides insight into the dielectric’s absorption behavior over short durations. It is calculated as the ratio of insulation resistance measured at 60 s to that at 30 s, as shown in Equation (1):
DAR = R(60 s)/R(30 s)
This metric reflects the dielectric’s ability to polarize internally. A higher DAR suggests enhanced slow polarization mechanisms and low surface conduction, indicating better insulation quality [19].
The Polarization Index (PI) is a time-based diagnostic ratio that measures insulation behavior over an extended period, typically 10 min. It is defined by the ratio of resistance at 600 s to that at 60 s, as presented in Equation (2):
PI = R(600 s)/R(60 s)
PI values greater than 2.0 are generally associated with healthy insulation, while values below 1.0 may indicate moisture ingress, thermal degradation, or contamination [19].
PDC analysis evaluates the dielectric relaxation processes under a step DC voltage. Upon application of voltage, the polarization current decays, and after removal, the depolarization current exhibits a reverse transient. These behaviors can be modeled using a power-law function, as shown in Equation (3):
IPDC(t) = kt−n
where IPDC(t) is the time-dependent current (A), k is a constant related to material and voltage, t is time (s), and n is the decay exponent (typically between 0.5 and 2.0 for polymeric insulation materials) [7,16].
The Loss Index (LI) quantifies the symmetry between charging and discharging behavior. It is expressed as the ratio of peak depolarization current to peak polarization current, as illustrated in Equation (4):
Loss index = Idischarge/Icharge
By definition, LI ≈ 1 denotes symmetric charge–discharge; LI < 1 indicates dissipative/irreversible processes; LI > 1 signals asymmetric behavior with conduction/trap-release contributions in Table 1 [7,16].

3.2. Electric Field Distribution

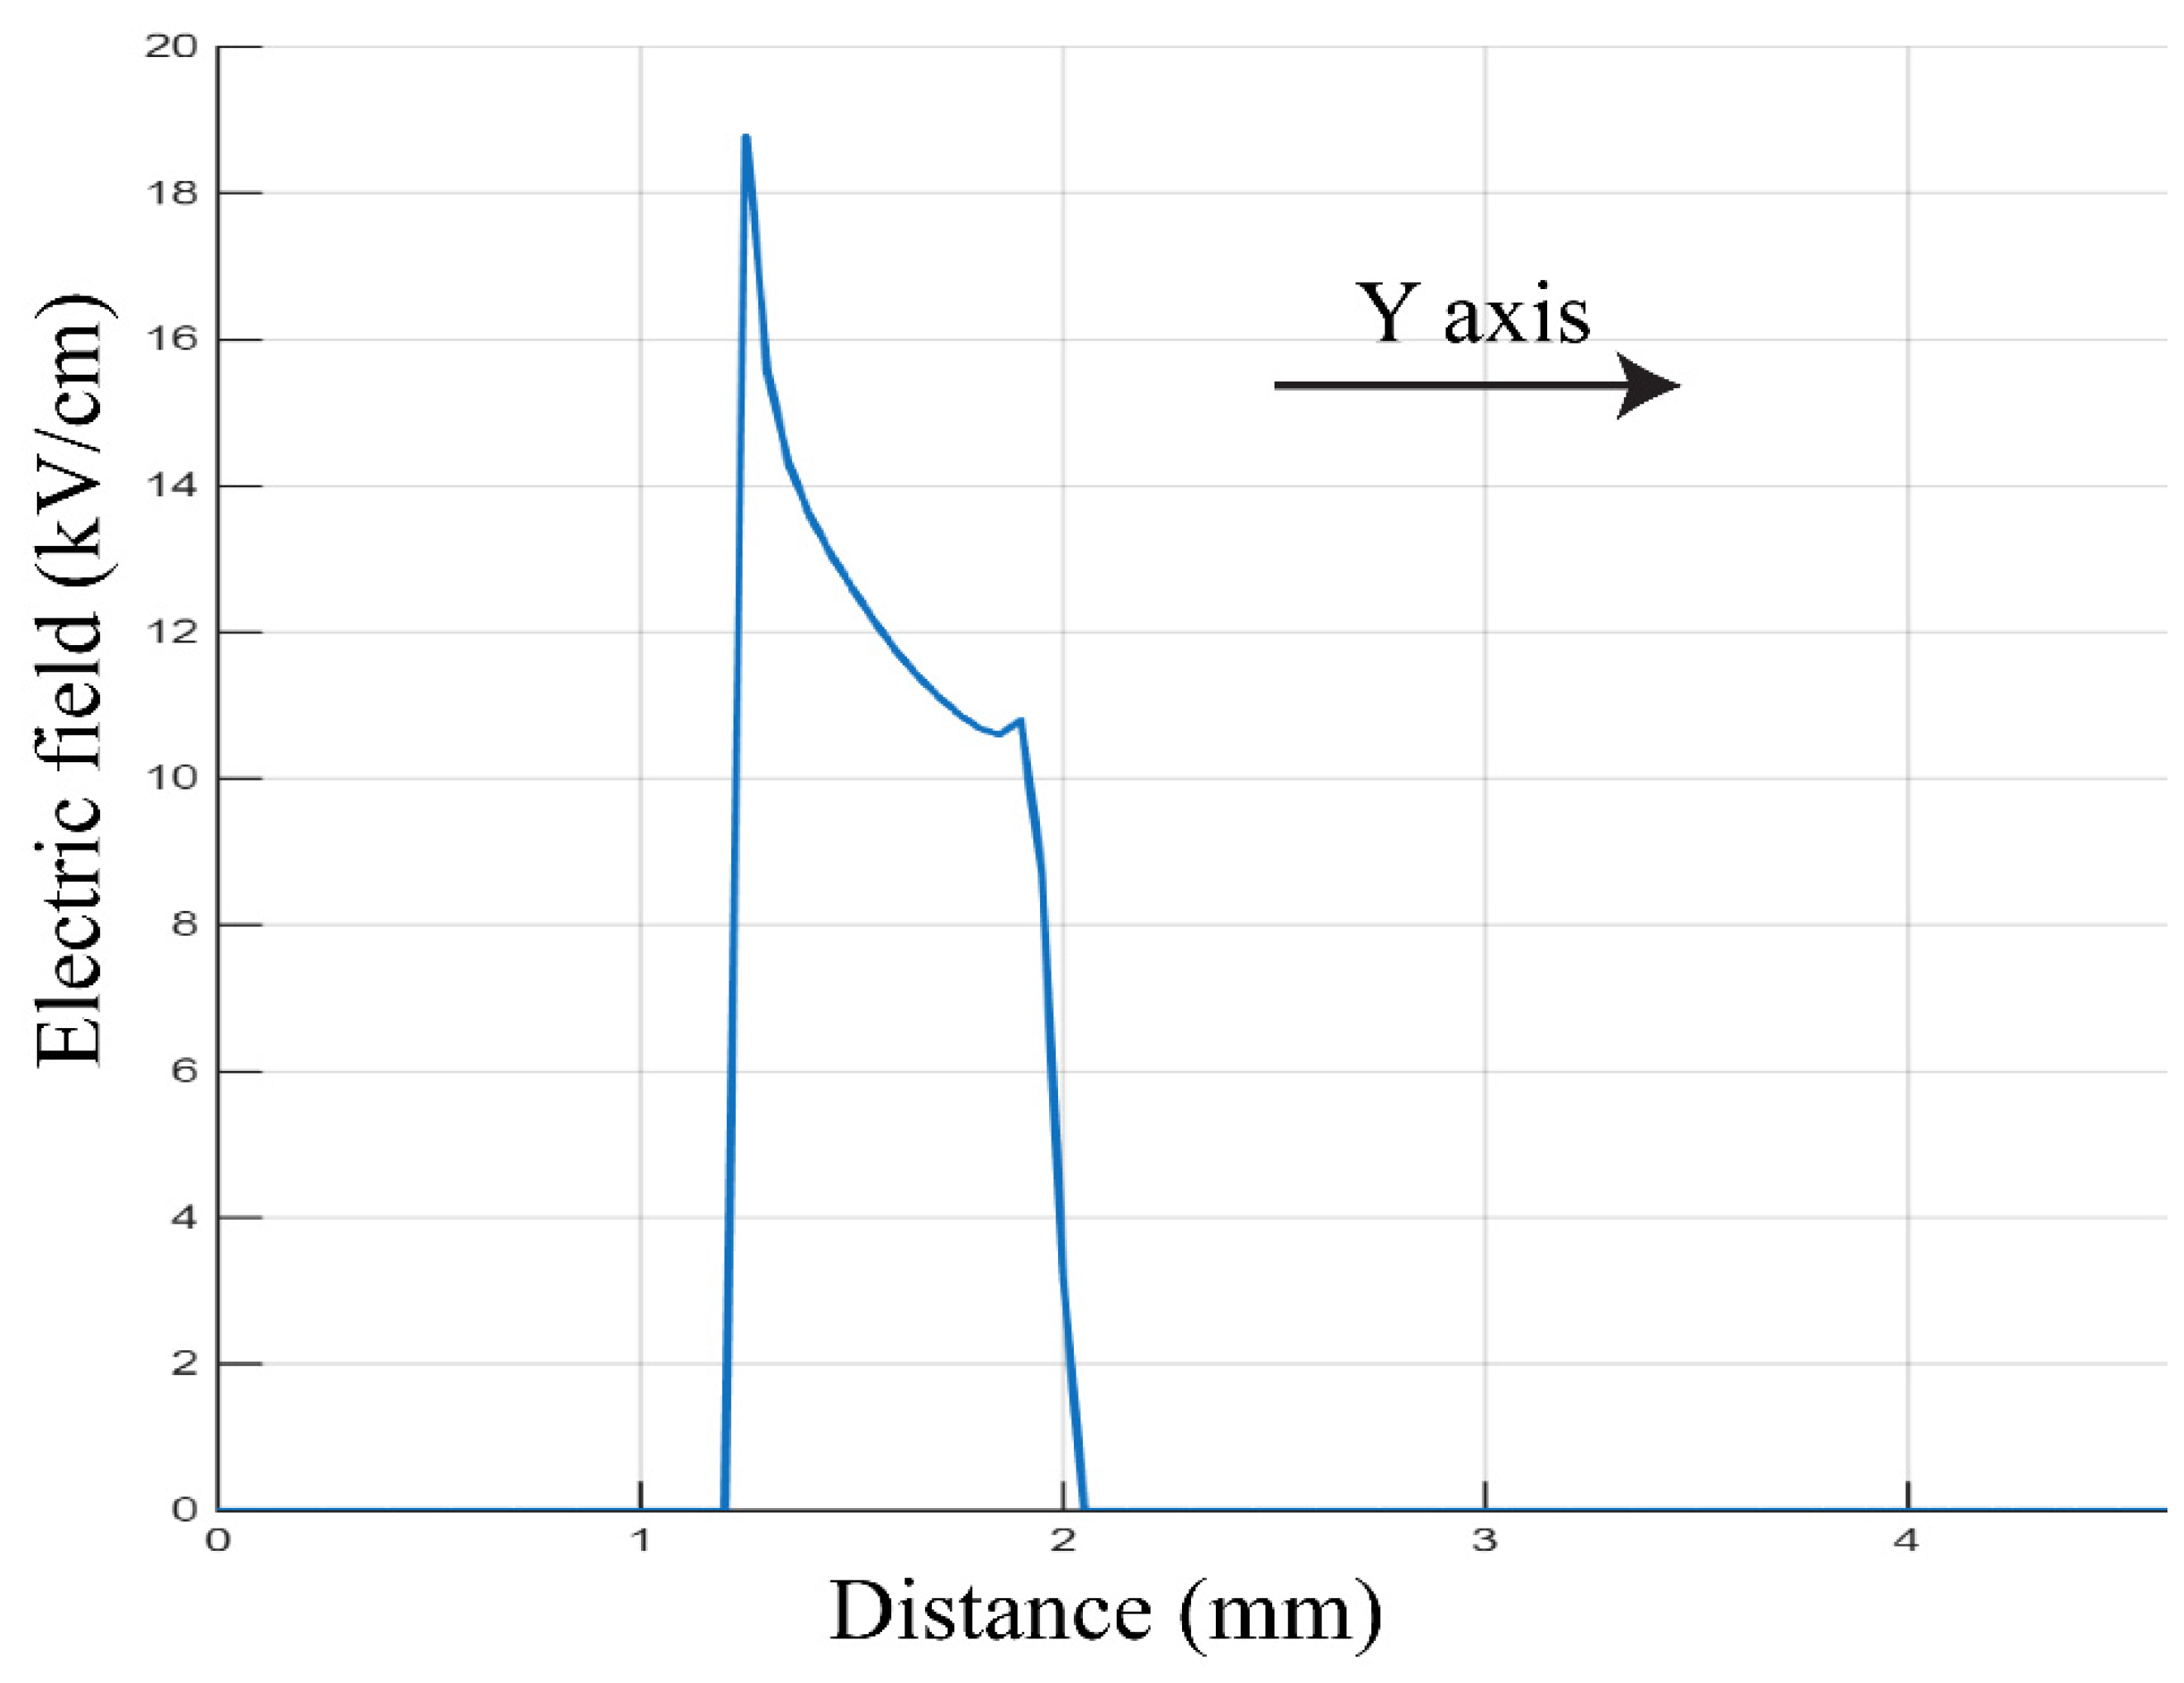
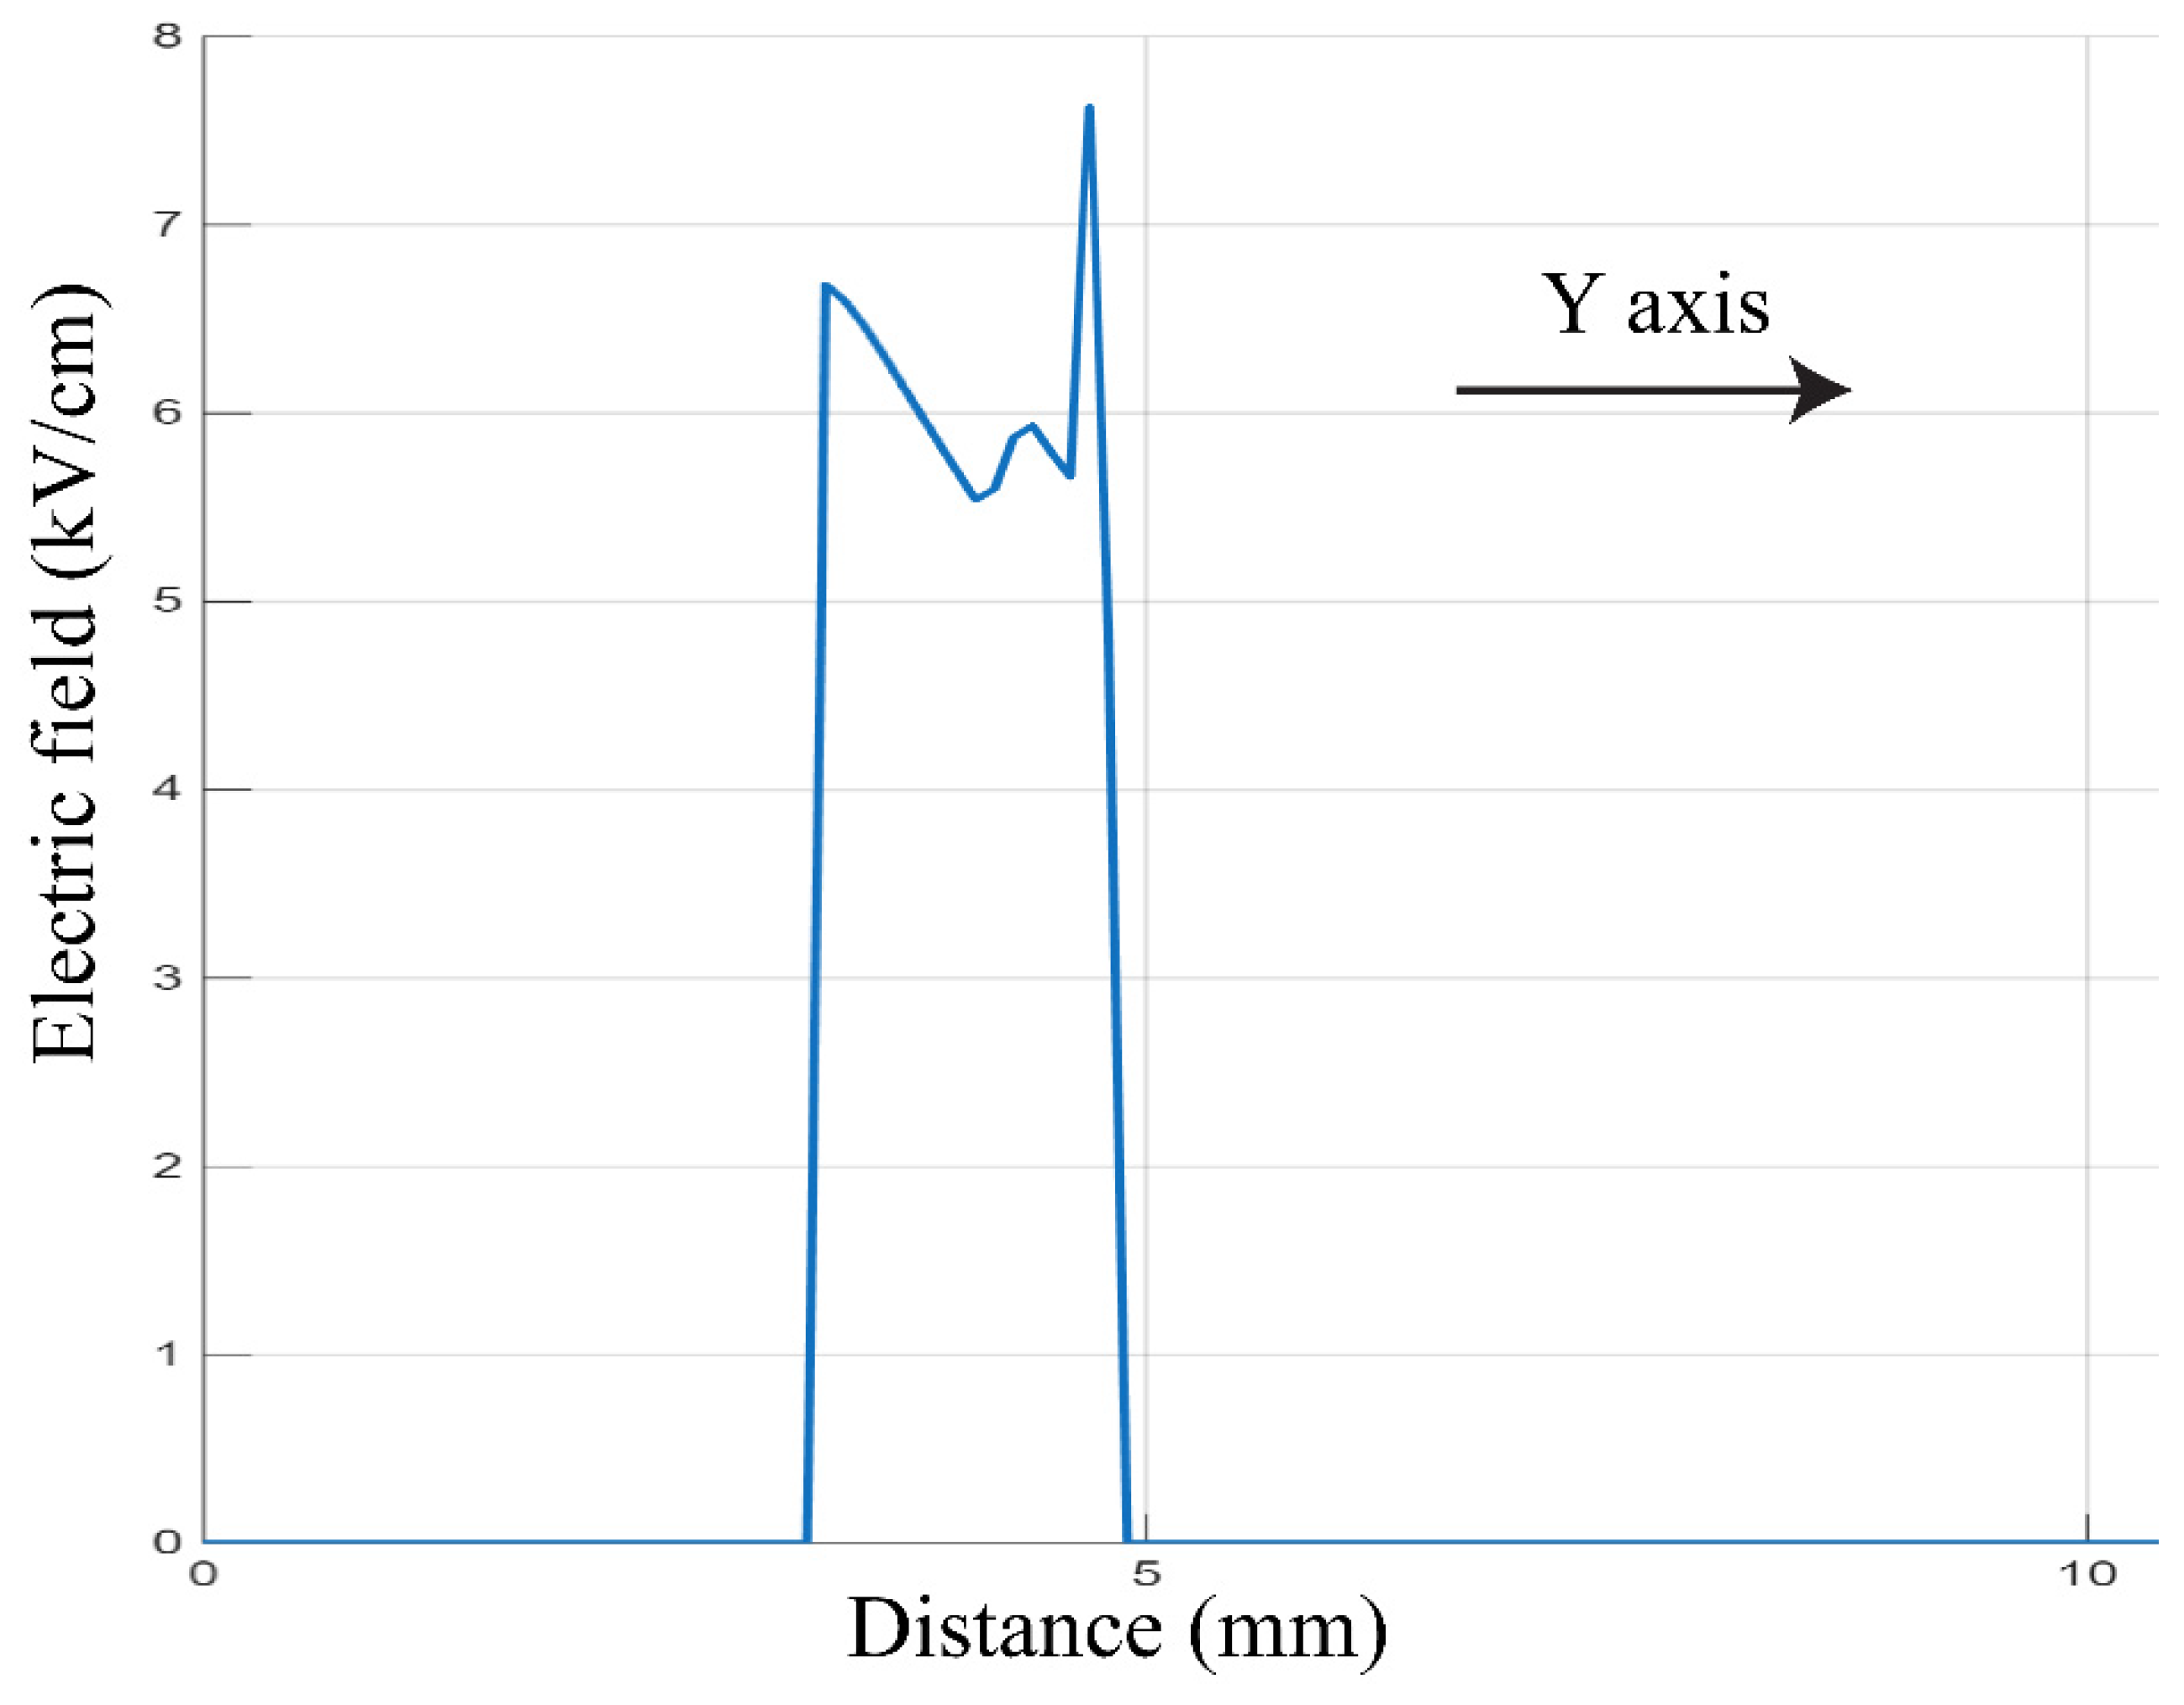
The simulated electric field distribution in a cross-linked polyolefin (XLPO)-insulated high-voltage direct current (HVDC) cable was analyzed using a 2D axisymmetric MATLAB (R2021b) model. The cable consists of a central tinned, annealed copper conductor energized at ± 1 kV DC, surrounded by XLPO insulation (with a relative permittivity, εr, of 2.48) having a diameter of 3.1 mm. This is followed by an XLPO-copolymer sheath (with εr of 2.45) that has a diameter of 3.9 mm, and finally, a 0.5 mm thick aluminum tape that serves as a grounded return electrode, as illustrated in Figure 10 [1,20]. The electric field distribution is radially symmetric and decays logarithmically from the conductor interface toward the grounded sheath, which is expected due to the cylindrical geometry of the cable. The peak electric field strength occurs at the surface of the conductor, reaching approximately 1.2 kV/mm. Notably, no asymmetry is observed between the positive and negative DC polarities, indicating a polarity-independent electric field distribution under steady-state conditions. The observed polarity dependence in IR/DAR/PI/LI arises from injection barriers and trap-controlled conduction. The slight difference in relative permittivity between the XLPO insulation and the XLPO-copolymer sheath results in a nearly continuous electric field gradient across their interface, effectively preventing concentrations of local electric stress. This uniform distribution confirms the dielectric stability of XLPO under high-voltage DC stress, making it a reliable candidate for long-term HVDC applications, as shown in Figure 11.
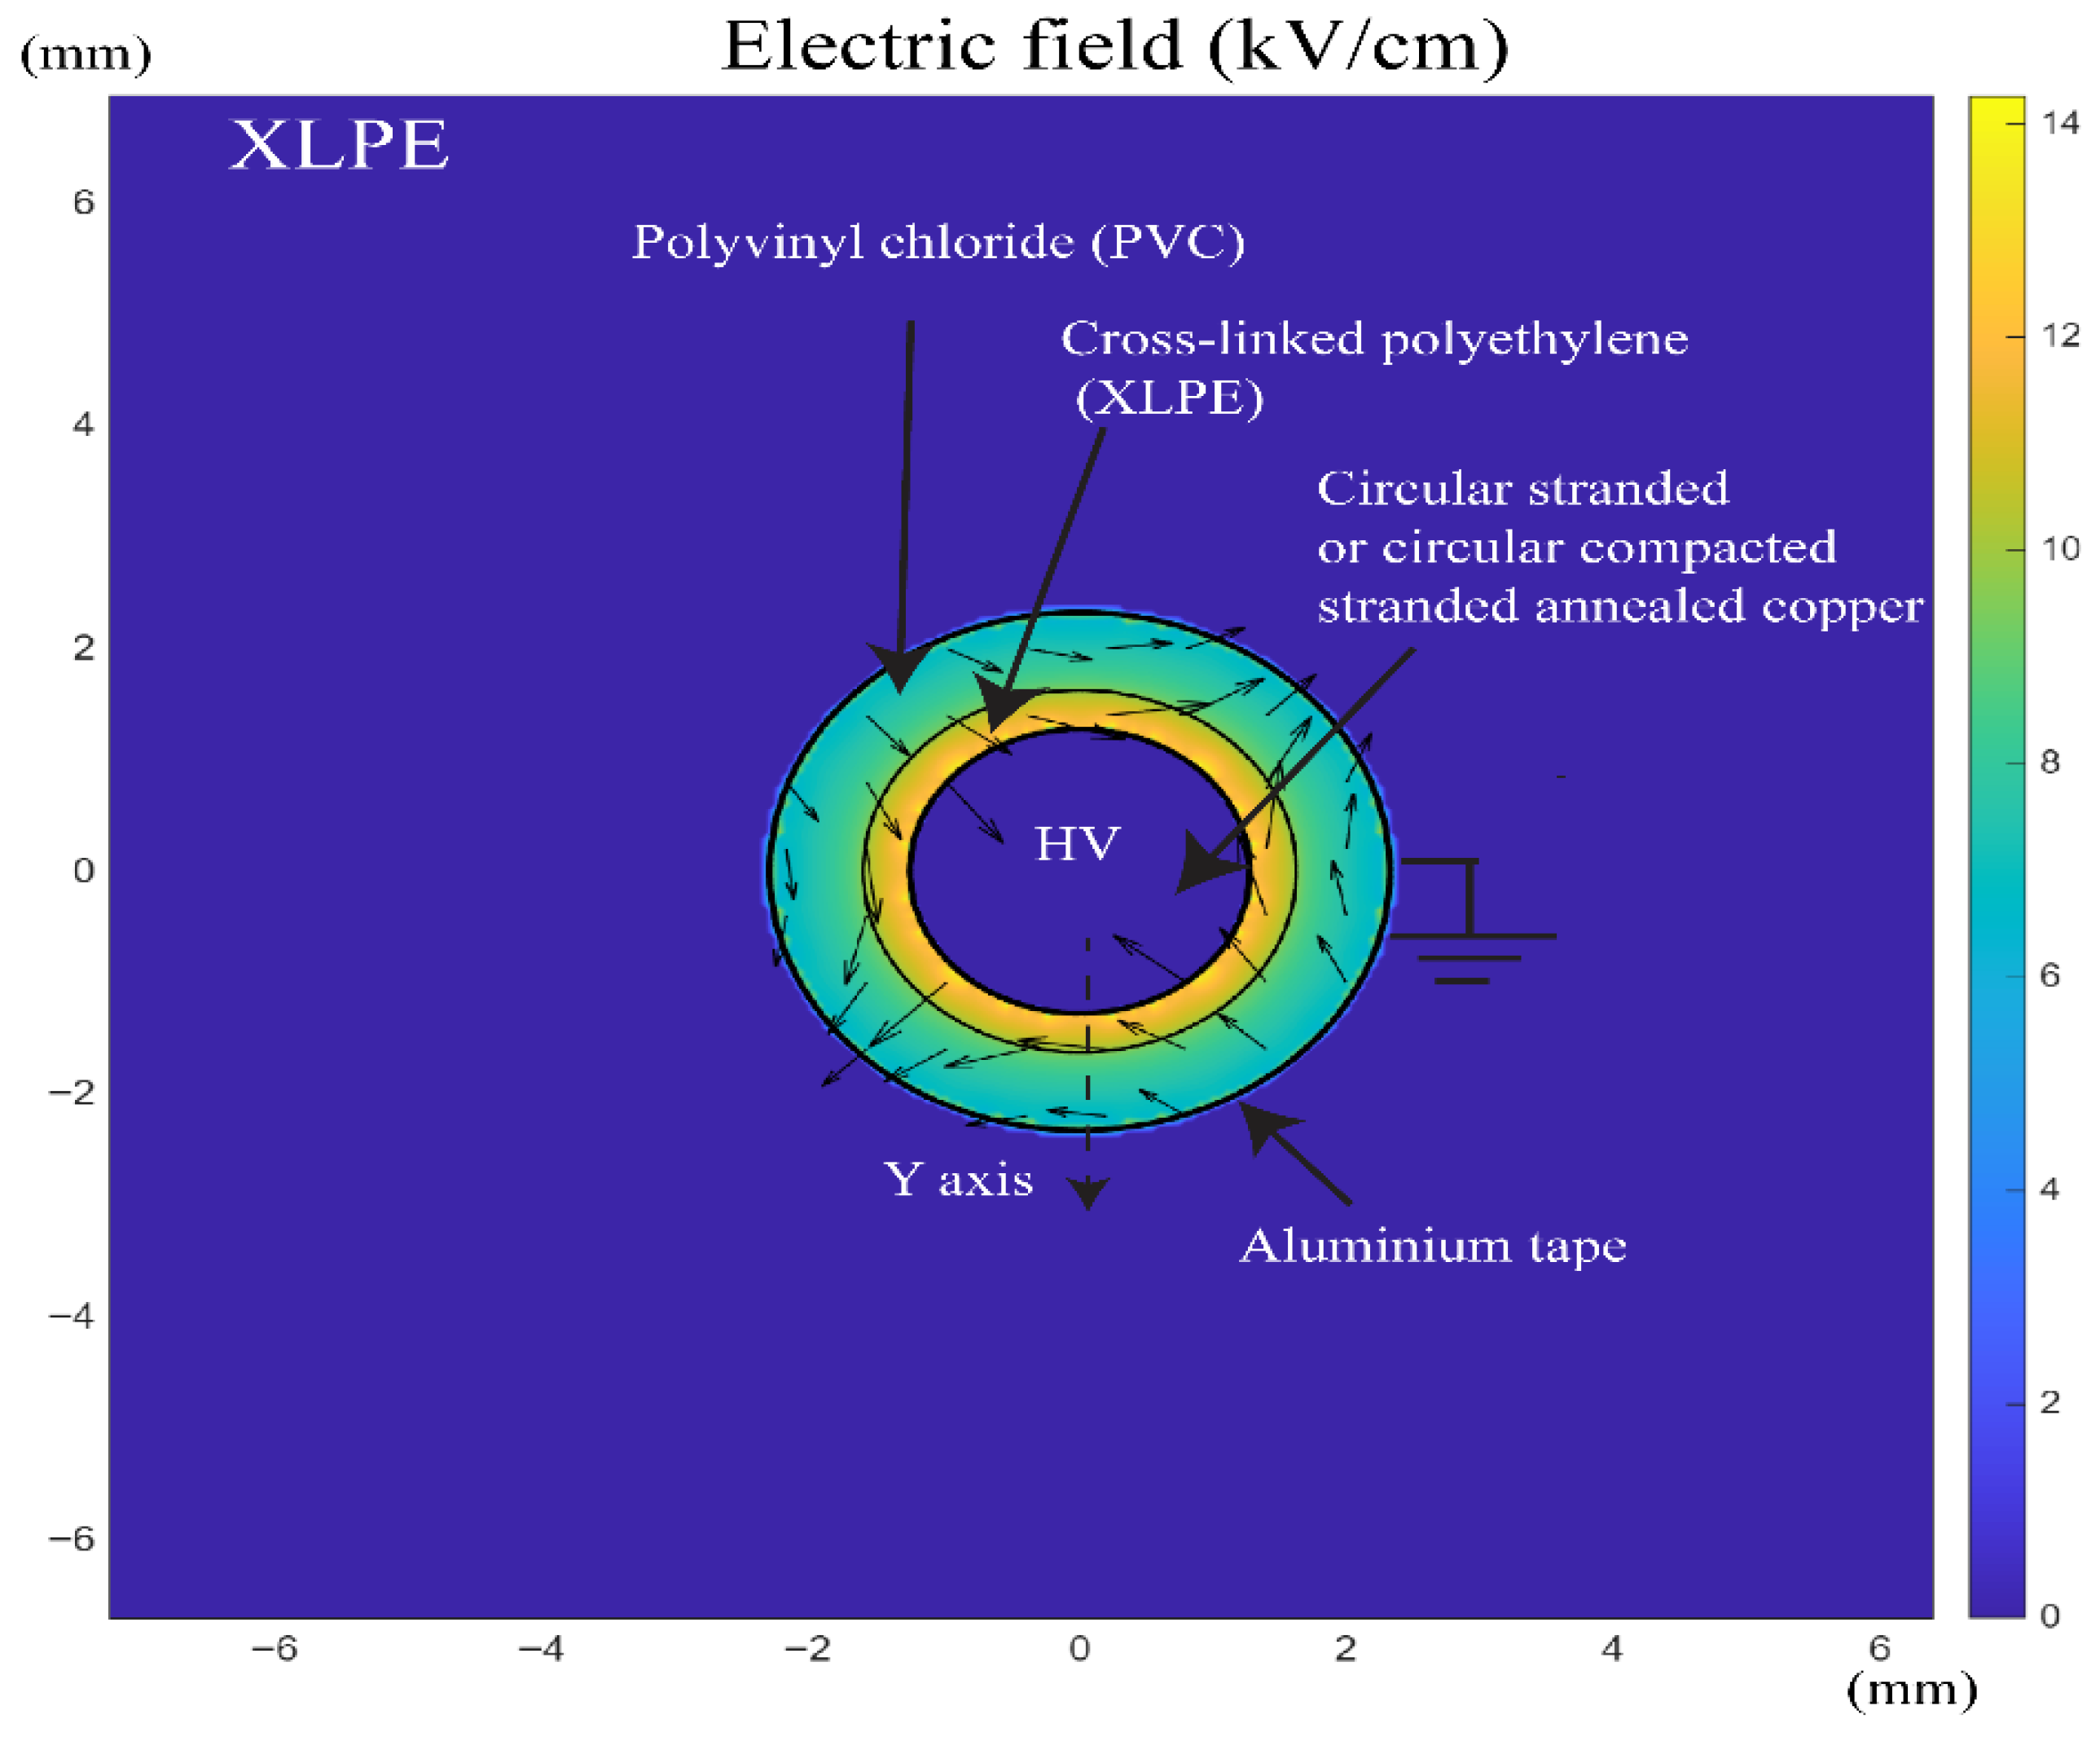
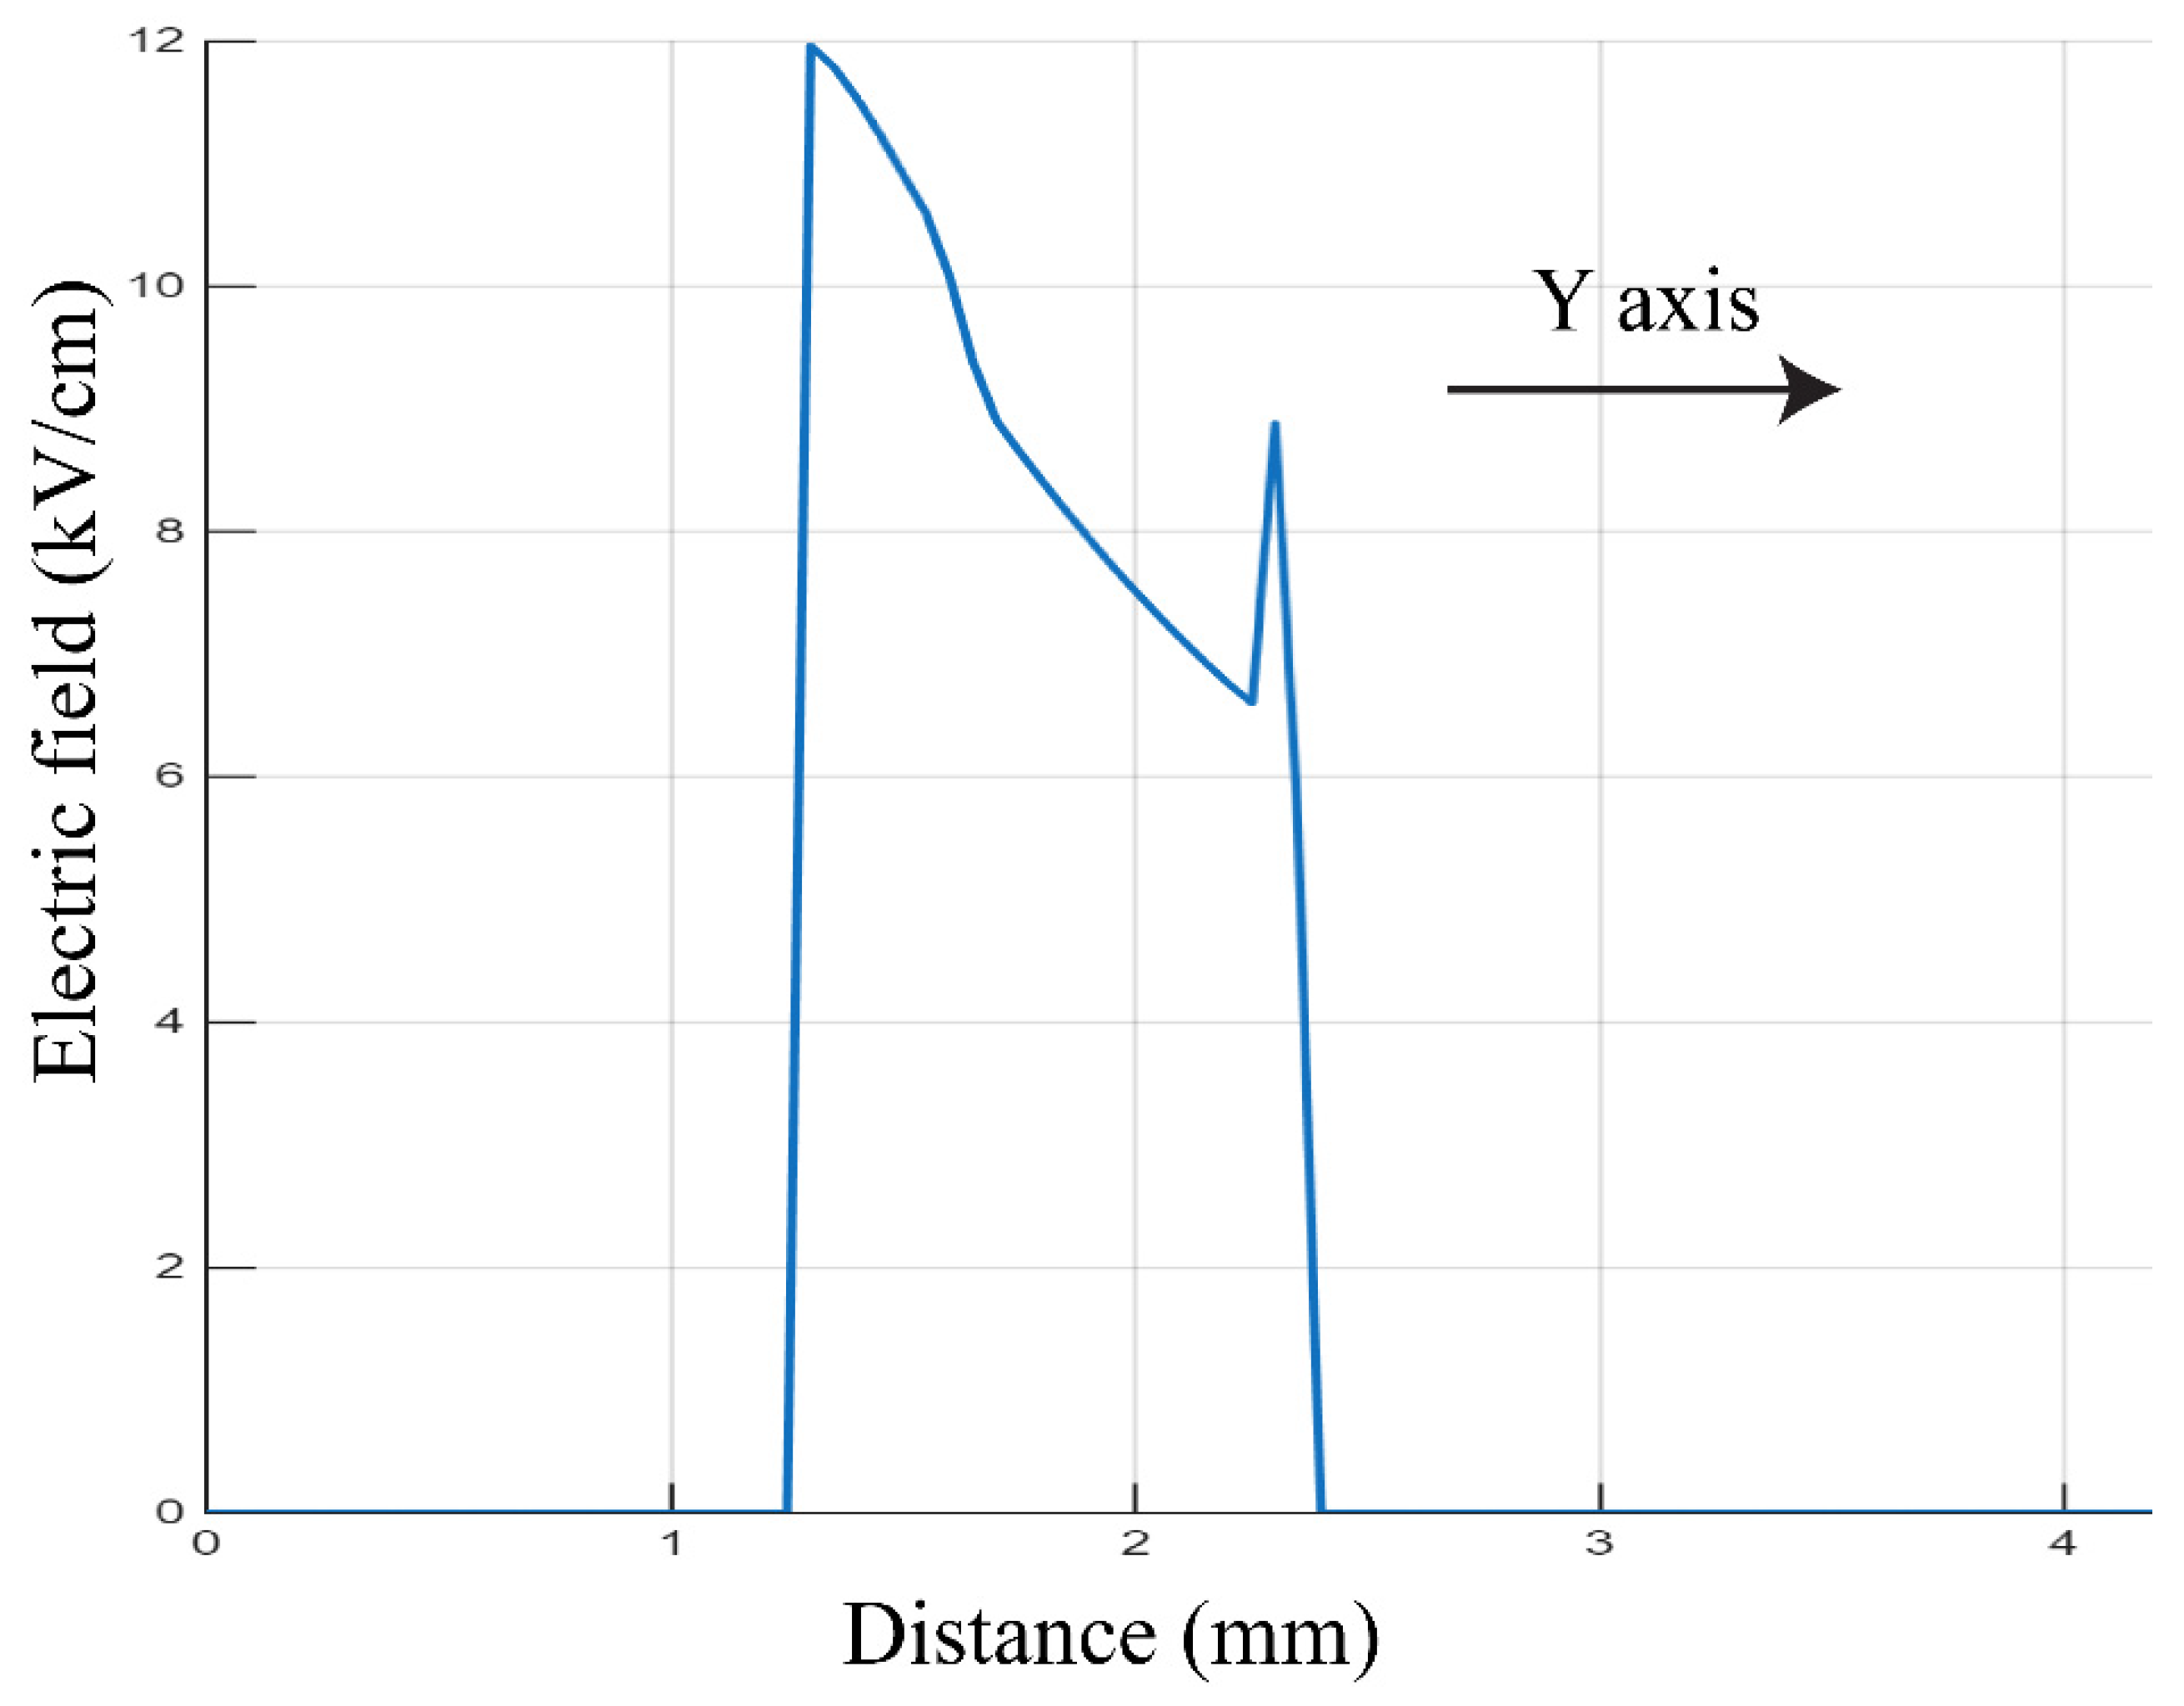
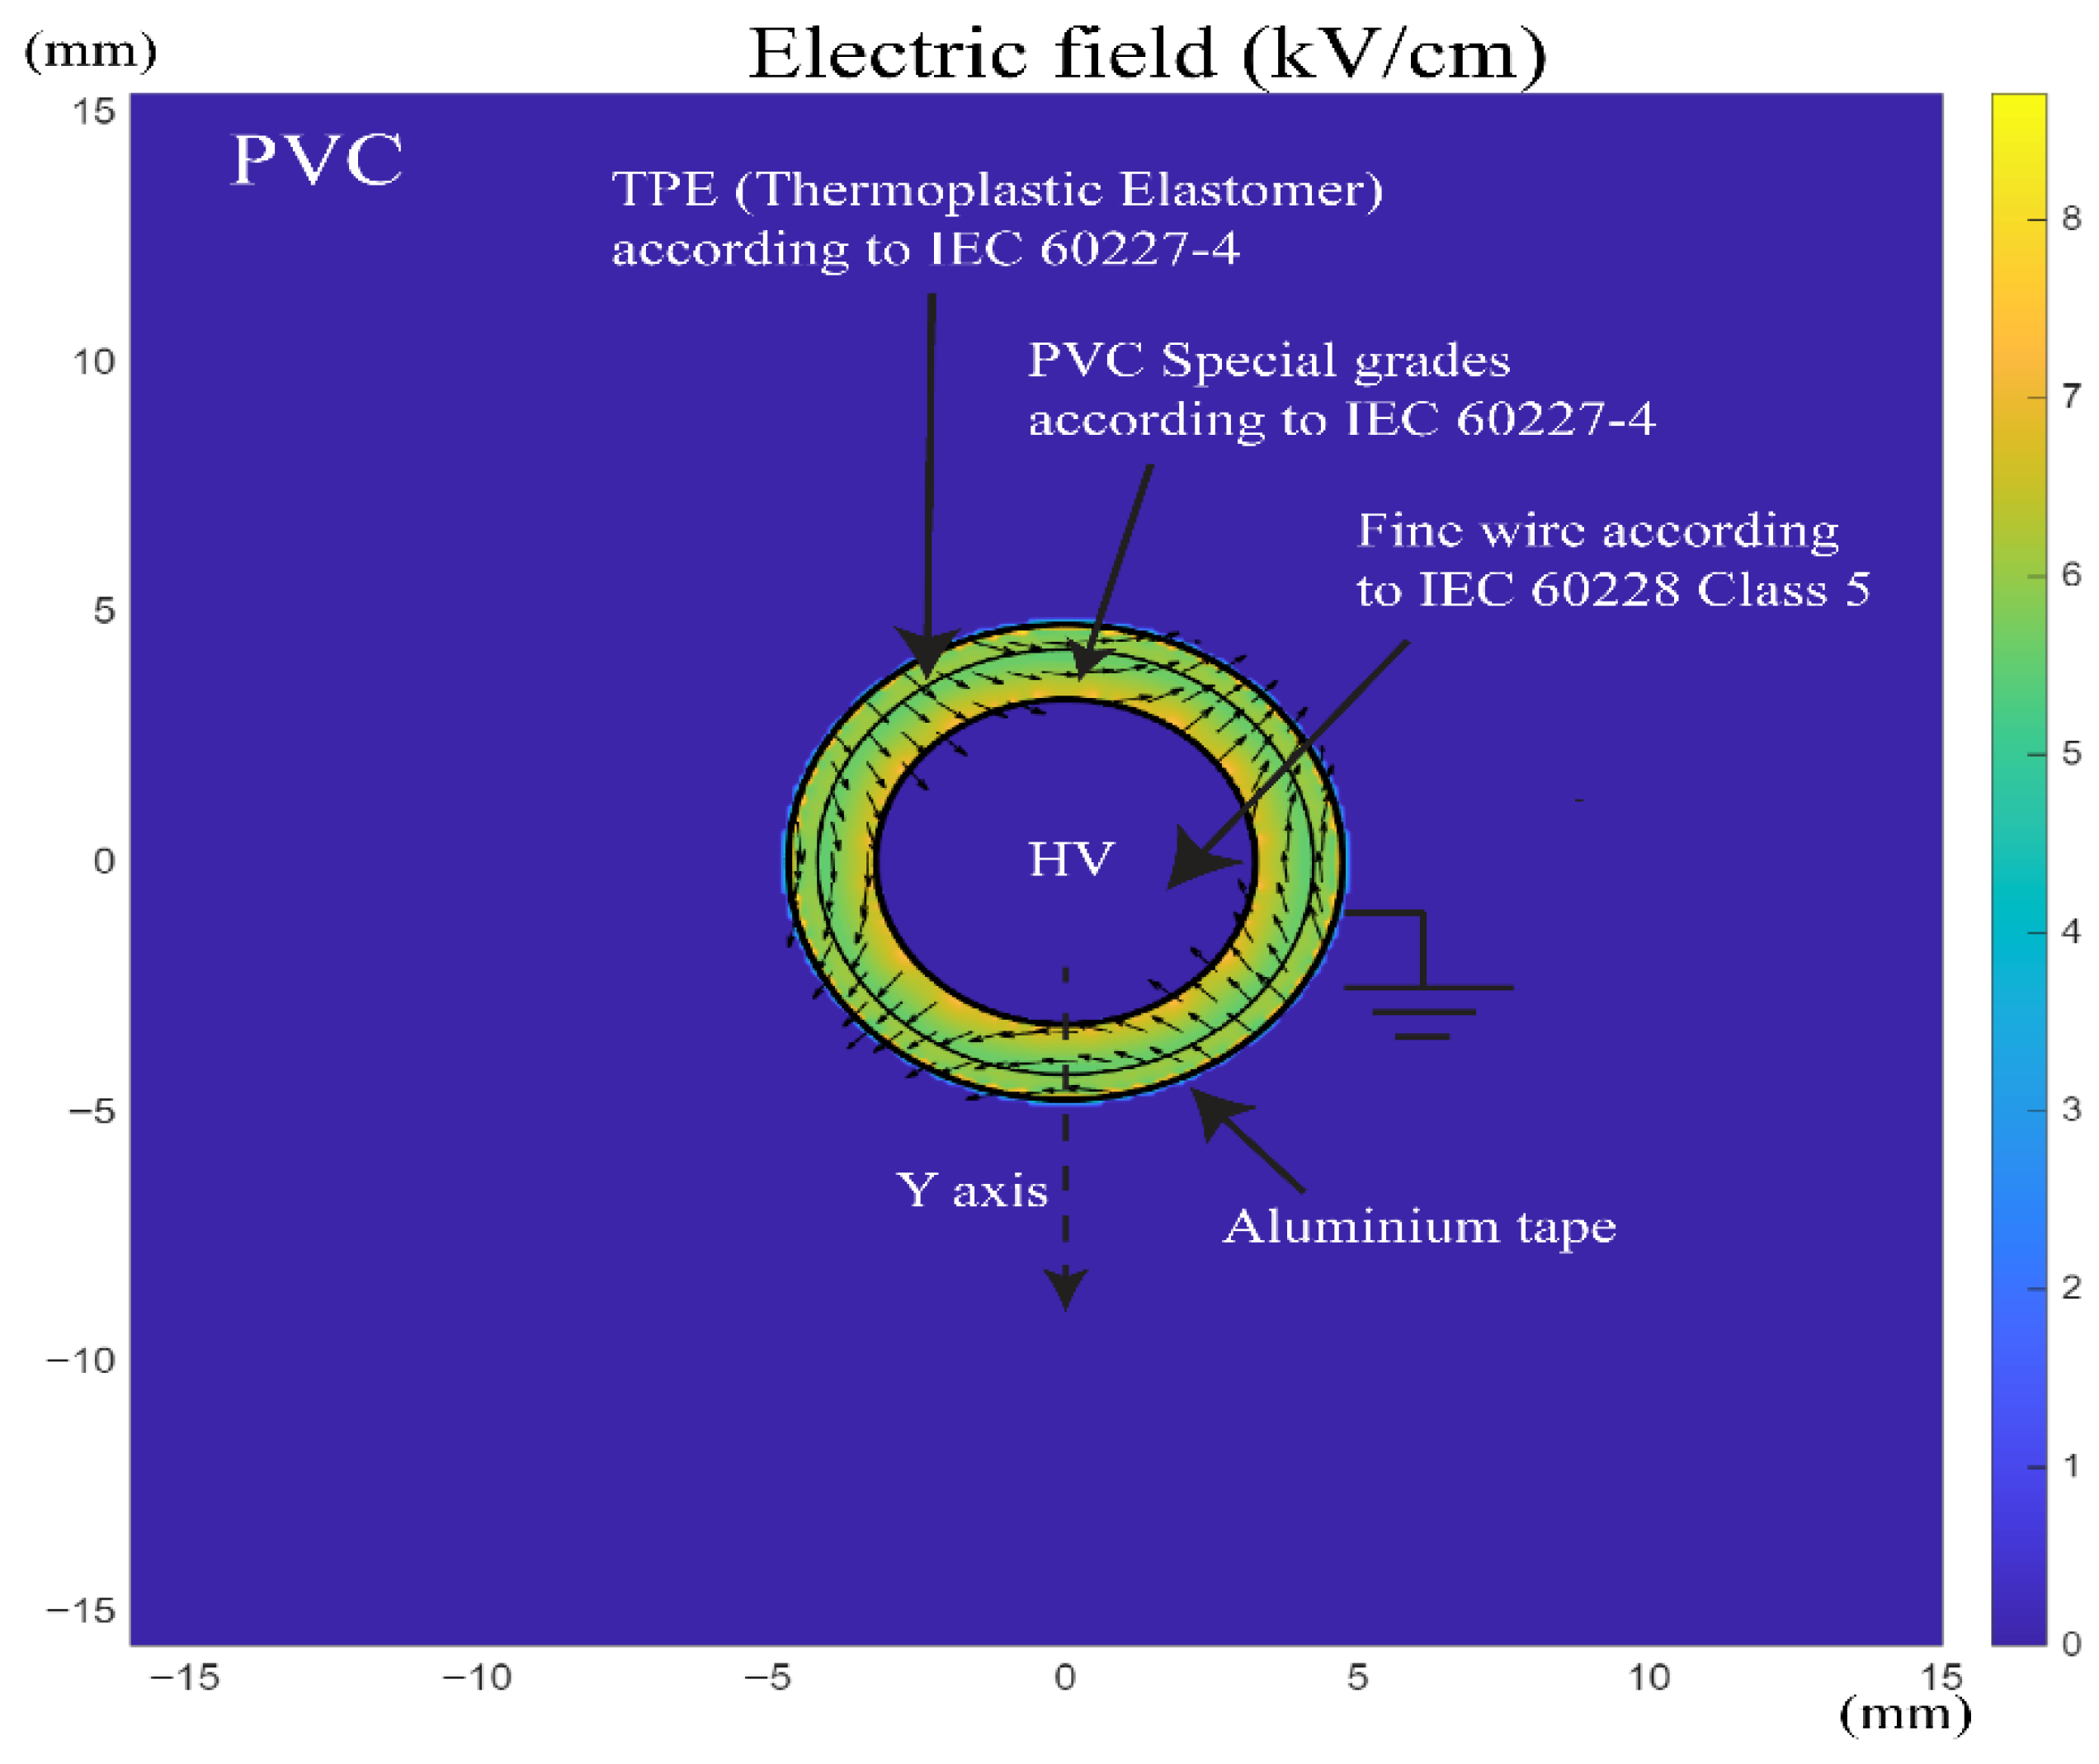
This study involves a finite element simulation of the radial electric field distribution in a high-voltage direct current (HVDC) cable that is insulated with cross-linked polyethylene (XLPE) and jacketed with polyvinyl chloride (PVC). The simulation utilizes a 2D axisymmetric model. The cable’s core consists of a circular stranded annealed copper conductor that is energized at ±1000 V DC. Surrounding the conductor, there is an XLPE insulation layer with a diameter of 3.25 mm and a relative permittivity of 2.3. This is followed by a PVC sheath with a diameter of 4.65 mm and a relative permittivity of 2.9 [21]. An aluminum tape, which is 0.5 mm thick, acts as a grounded electrode, as shown in Figure 12. The electric field peaks at the interface between the conductor and the insulation, reaching approximately 1.2 kV/mm, and decreases logarithmically toward the grounded sheath. The field profile is symmetric for both positive and negative polarities, indicating that there is no polarity-dependent distortion under steady-state conditions. The gradual transition in electric field intensity across the XLPE–PVC interface is due to the minor dielectric mismatch between the two materials, which effectively reduces interfacial electric stress concentration. These findings confirm that XLPE–PVC insulation systems are suitable for HVDC applications, demonstrating a stable and uniform electric field distribution. This stability is crucial for long-term dielectric reliability under bipolar voltage stress, as shown in Figure 13. The distribution of the electric field in a PVC–TPE insulated high-voltage DC cable was simulated using a 2D axisymmetric finite element model for a voltage of ±1000 V DC. The cable consists of a fine copper conductor (IEC 60228 Class 5), a PVC insulation layer (relative permittivity = 2.9, diameter = 8.5 mm), a TPE sheath (relative permittivity = 2.5, diameter = 9.5 mm), and a grounded aluminum tape that is 0.5 mm thick, as shown in Figure 14 [22,23,24,25]. The electric field peaks near the conductor at approximately 1.1 kV/mm and gradually decreases logarithmically in the radial direction toward the grounded sheath. The transition between the PVC and TPE layers leads to a smooth change in the field gradient without any indication of localized stress enhancement. The symmetric electric field profiles observed under both polarities confirm the polarity-independent dielectric behavior of the cable system. These results demonstrate the electrogeometric compatibility of the PVC–TPE insulation system under high-voltage DC conditions, as shown in Figure 15. The electric field distribution within the multi-layered cable structure was simulated by solving Poisson’s Equation (5):
∇⋅(ε∇V) = −ρ
where ε represents the position-dependent permittivity and ρ is the free charge density. This equation governs the potential distribution in non-homogeneous dielectrics and was solved using the finite element method in MATLAB, following the approaches outlined in [26].

3.3. Analysis of Leakage Current, Insulation Resistance, and Electric Field in XLPO, XLPE, and PVC Under ±1 kV DC

When a DC voltage of ±1 kV is applied to cable insulation (whether XLPO, XLPE, or PVC), the leakage current is initially high. Still, it then decays over time, while the insulation resistance (IR) correspondingly rises. This behavior is evident in the graphs (Figure 4, Figure 6 and Figure 8 for leakage current; Figure 5, Figure 7 and Figure 9 for IR) for all three materials under both polarities. Upon first energization, a significant surge of current flows and then drops rapidly, followed by a slower decrease until reaching a near-steady value. Physically, this surge is due to the capacitive charging current of the insulation and polarization (absorption) currents within the dielectric. As the insulator charges up and its molecular dipoles align with the electric field, these transient currents diminish. Consequently, the insulation resistance, defined, starts low (due to the high initial current) but increases quickly as the current decays, eventually leveling off once the leakage current reaches steady state. This general pattern, a rapid rise in IR (initially from a low value to a stable high value) inversely tracking the decaying leakage current, was observed for XLPO, XLPE, and PVC alike, under both +1000 V and –1000 Vdc excitations. The initial high current thus mainly comprises the charging and polarization currents that taper off as the material approaches equilibrium, leaving only a small steady conduction current through the bulk (actual leakage) [27,28].
A notable finding is that the polarity of the applied DC voltage influences the magnitude of the leakage current and hence the measured insulation resistance. In all three materials, applying a positive voltage to the inner conductor (with the outer grounded or negative) produced a significantly higher leakage current than the same magnitude negative voltage on the inner conductor. In the early moments of the test, the leakage current under +1000 V was about 2–3 times higher than under –1000 V. For example, in XLPE insulation, the peak initial leak current was on the order of ~8 nA with a positive inner electrode, compared to ~3 nA with a negative inner electrode (a similar ratio was seen for XLPO and PVC). Consequently, the insulation resistance in the positive-polarity case is always slightly lower than in the negative-polarity case. This indicates that charge injection and transport mechanisms in the insulation depend on the polarity of the applied field. When the inner conductor is at positive high voltage (and the outer electrode is negative), electrons from the outer (negative) electrode can be injected more easily and in greater quantity into the dielectric. In contrast, if the inner conductor is negative and the outer is positive, charge injection from the now-negative outer surface is less effective (the inner electrode’s smaller surface area and geometry also limit injection), resulting in a lower overall leakage current. One contributing factor is the difference in electrode geometry: in a coaxial cable, the outer electrode (shield) has a much larger surface area in contact with the insulation. With a positive core (outer negative), this large outer electrode can supply ample charge (electrons) into the insulation. In contrast, with a negative core (outer positive), the injection area (the inner conductor surface) is smaller, limiting the charge influx despite a high local field. Our experimental observation that positive polarity drives higher leakage is consistent with reports on other polymer dielectrics, which find that DC positive polarity stress causes more electrical strain and higher leakage/aging than negative polarity. In one study on silicone rubber insulators, the degradation under positive HVDC was measurably worse, with higher leakage currents and more material erosion, compared to negative polarity. This polarity-dependent behavior is an essential consideration for DC insulation design—it suggests that a cable may experience greater electrical stress when its conductor is operated at positive DC relative to the sheath, as opposed to the reverse. Practically, this is reflected in the slightly lower steady-state IR we measured for the positive-core cases. (By definition, a higher leakage current under a given voltage means a lower insulation resistance [27,28]. To further understand the leakage behavior, we consider the electric field distribution in the cylindrical insulation and the role of space charge. Figure 10, Figure 11, Figure 12, Figure 13, Figure 14 and Figure 15 show a MATLAB simulation of the electric field magnitude across the radial thickness of the cable insulation for XLPO, XLPE, and PVC, with the inner conductor at high voltage and the outer grounded. In an ideal steady state (with no space charge accumulation), the field in a homogeneous coaxial insulation follows an inverse-radius dependence. This means the field is strongest at the inner conductor surface and decreases toward the outer shield. Indeed, the simulation confirms that the peak field occurs at the inner conductor and decays with radial distance, reaching a minimum at the outer insulation boundary. All else being equal, the region of insulation nearest to the central conductor experiences the highest electrical stress. This ties back to the leakage current behavior. At the moment of first energization, most of the initial current originates from the regions near the inner electrode where the field is highest, causing rapid charge movement (dipole orientation and any initial charge injection) in those high-stress zones. As time progresses under DC, space charges (accumulated injected charges or oriented dipoles) can build up within the insulation, especially near interfaces, and these charges can alter the local electric field distribution. Charges of opposite polarity to the nearby electrode tend to accumulate at the electrode-dielectric interfaces, partially offsetting the applied field in those regions (a phenomenon often termed space charge shielding). This results in a reduced effective field near the electrodes after some time, which is another reason the leakage current decays toward equilibrium. In high-field DC insulation research, it is well known that space charge accumulation can significantly distort the field distribution from the simple profile, leading to local field enhancements or reductions depending on the charge distribution for instance, studies on XLPE have shown that under prolonged DC stress, negative charges often accumulate near the anode (positive electrode), which can cause a strong distortion and enhancement of the local field in that zone. Such distortions can eventually contribute to insulation failure if the local field exceeds material limits. In our tests, however, the applied voltage (±1 kV) and duration (~1000 s) were relatively modest, and the space charge buildup was not enough to dramatically alter the field profile from its initial shape.
The absence of any long-term increasing trend in current (after the initial decay) suggests that no progressive degradation or space-charge accumulation is occurring; the current remains at a stable plateau. This observation is consistent with prior DC conductivity studies, which report that polymer insulation currents reach an equilibrium plateau if no further degradation ensues [29]. The MATLAB results remained close to the expected static field distribution—highest at the inner conductor and lowest at the outer surface—throughout the test. Any space charge formed would have been small, so the field in the insulation stayed essentially in the stable radial gradient. Nonetheless, it should be noted that different insulation materials have different tendencies for space charge accumulation. Conventional XLPE (cross-linked polyethylene used in AC cables) is known to suffer from space charge buildup under DC, which can lead to long-term distortion and stress enhancement inside the material. Indeed, this was a significant challenge when adapting XLPE for HVDC use—the trapped space charges in XLPE under DC can reduce its adequate dielectric strength over time. To address this, manufacturers developed specially formulated DC-XLPE compounds with additives or modified structures that exhibit much lower space charge accumulation and thus a more uniform field under DC. Our simulation and short-term test did not reach a regime where space charge effects dominate. Still, in extended HVDC service conditions (many years at high voltage), insulation like traditional XLPE could accumulate charge that changes the field distribution. This underscores why material improvements (like DC-optimized XLPE) are crucial for high-voltage DC cable reliability [27,28].
After roughly 200–300 s of applying the DC voltage, the leakage currents in all three materials reached a near steady-state value. This plateau indicates that a balance was achieved between charge injection, polarization, and conduction; essentially, all transient currents subsided, leaving only the true resistive (conductive) current through the dielectric. At this point, XLPO and XLPE exhibited extremely low steady leakage currents on the order of 1–3 nA, corresponding to very high insulation resistance on the order of 1012 Ω (teraohms). These values reflect excellent DC insulation behavior—only a vanishingly small fraction of current continues to flow through the bulk once the material is polarized. Importantly, we did not observe any trend of increasing leakage over time in XLPO or XLPE, which suggests no progressive degradation or heating was causing a runaway in current; the current simply stabilized at a low level. This stability implies that XLPO and XLPE can withstand continuous DC stress with minimal losses (at least at the tested stress level and duration) and without incurring cumulative damage in the short term. PVC, on the other hand, while it did settle to a steady state, did so at a much higher leakage current level (tens of nanoamps, an order of magnitude above XLPE). Its corresponding insulation resistance was around 1010 Ω (tens of gigaohms), significantly lower than that of XLPO/XLPE. This indicates that PVC has substantially higher DC conductivity. In practical terms, a higher steady leakage current means greater dielectric loss (conversion of electrical energy into heat inside the insulation) under DC operation. Even though our ~15-min test did not produce any observable failure or significant temperature rise, the quantitative difference suggests that a PVC-insulated system would continuously dissipate more energy as heat during DC operation, over long durations or higher voltages, which could lead to thermal accumulation and possibly thermal breakdown of the insulation. In contrast, the negligible leakage in XLPE/XLPO means very little heat is generated in those insulations under DC stress, aligning with their known low-loss characteristics. Therefore, material properties: PVC is generally considered to have higher dielectric losses and lower volume resistivity than polyolefin insulations, which is why PVC is not usually used for medium- or high-voltage cables. It tends to warm up more under electric stress. Meanwhile, cross-linked polyethylene has much lower dielectric loss, making it far better suited for continuous HV operation [27,28].

3.4. FTIR Spectral Analysis of Cable Insulation Materials

To investigate the chemical structure and functional groups present in the insulation and sheath materials, Fourier-transform infrared (FTIR) spectroscopy was performed on three types of virgin polymer-insulated cables: XLPO, XLPE, and PVC. The FTIR spectra provide critical insight into the molecular composition and potential additives within each layer.
The vibrational frequencies of molecular bonds follow the harmonic oscillator model and can be estimated by Equation (6):
ν = 1/(2πc) √(k/μ)
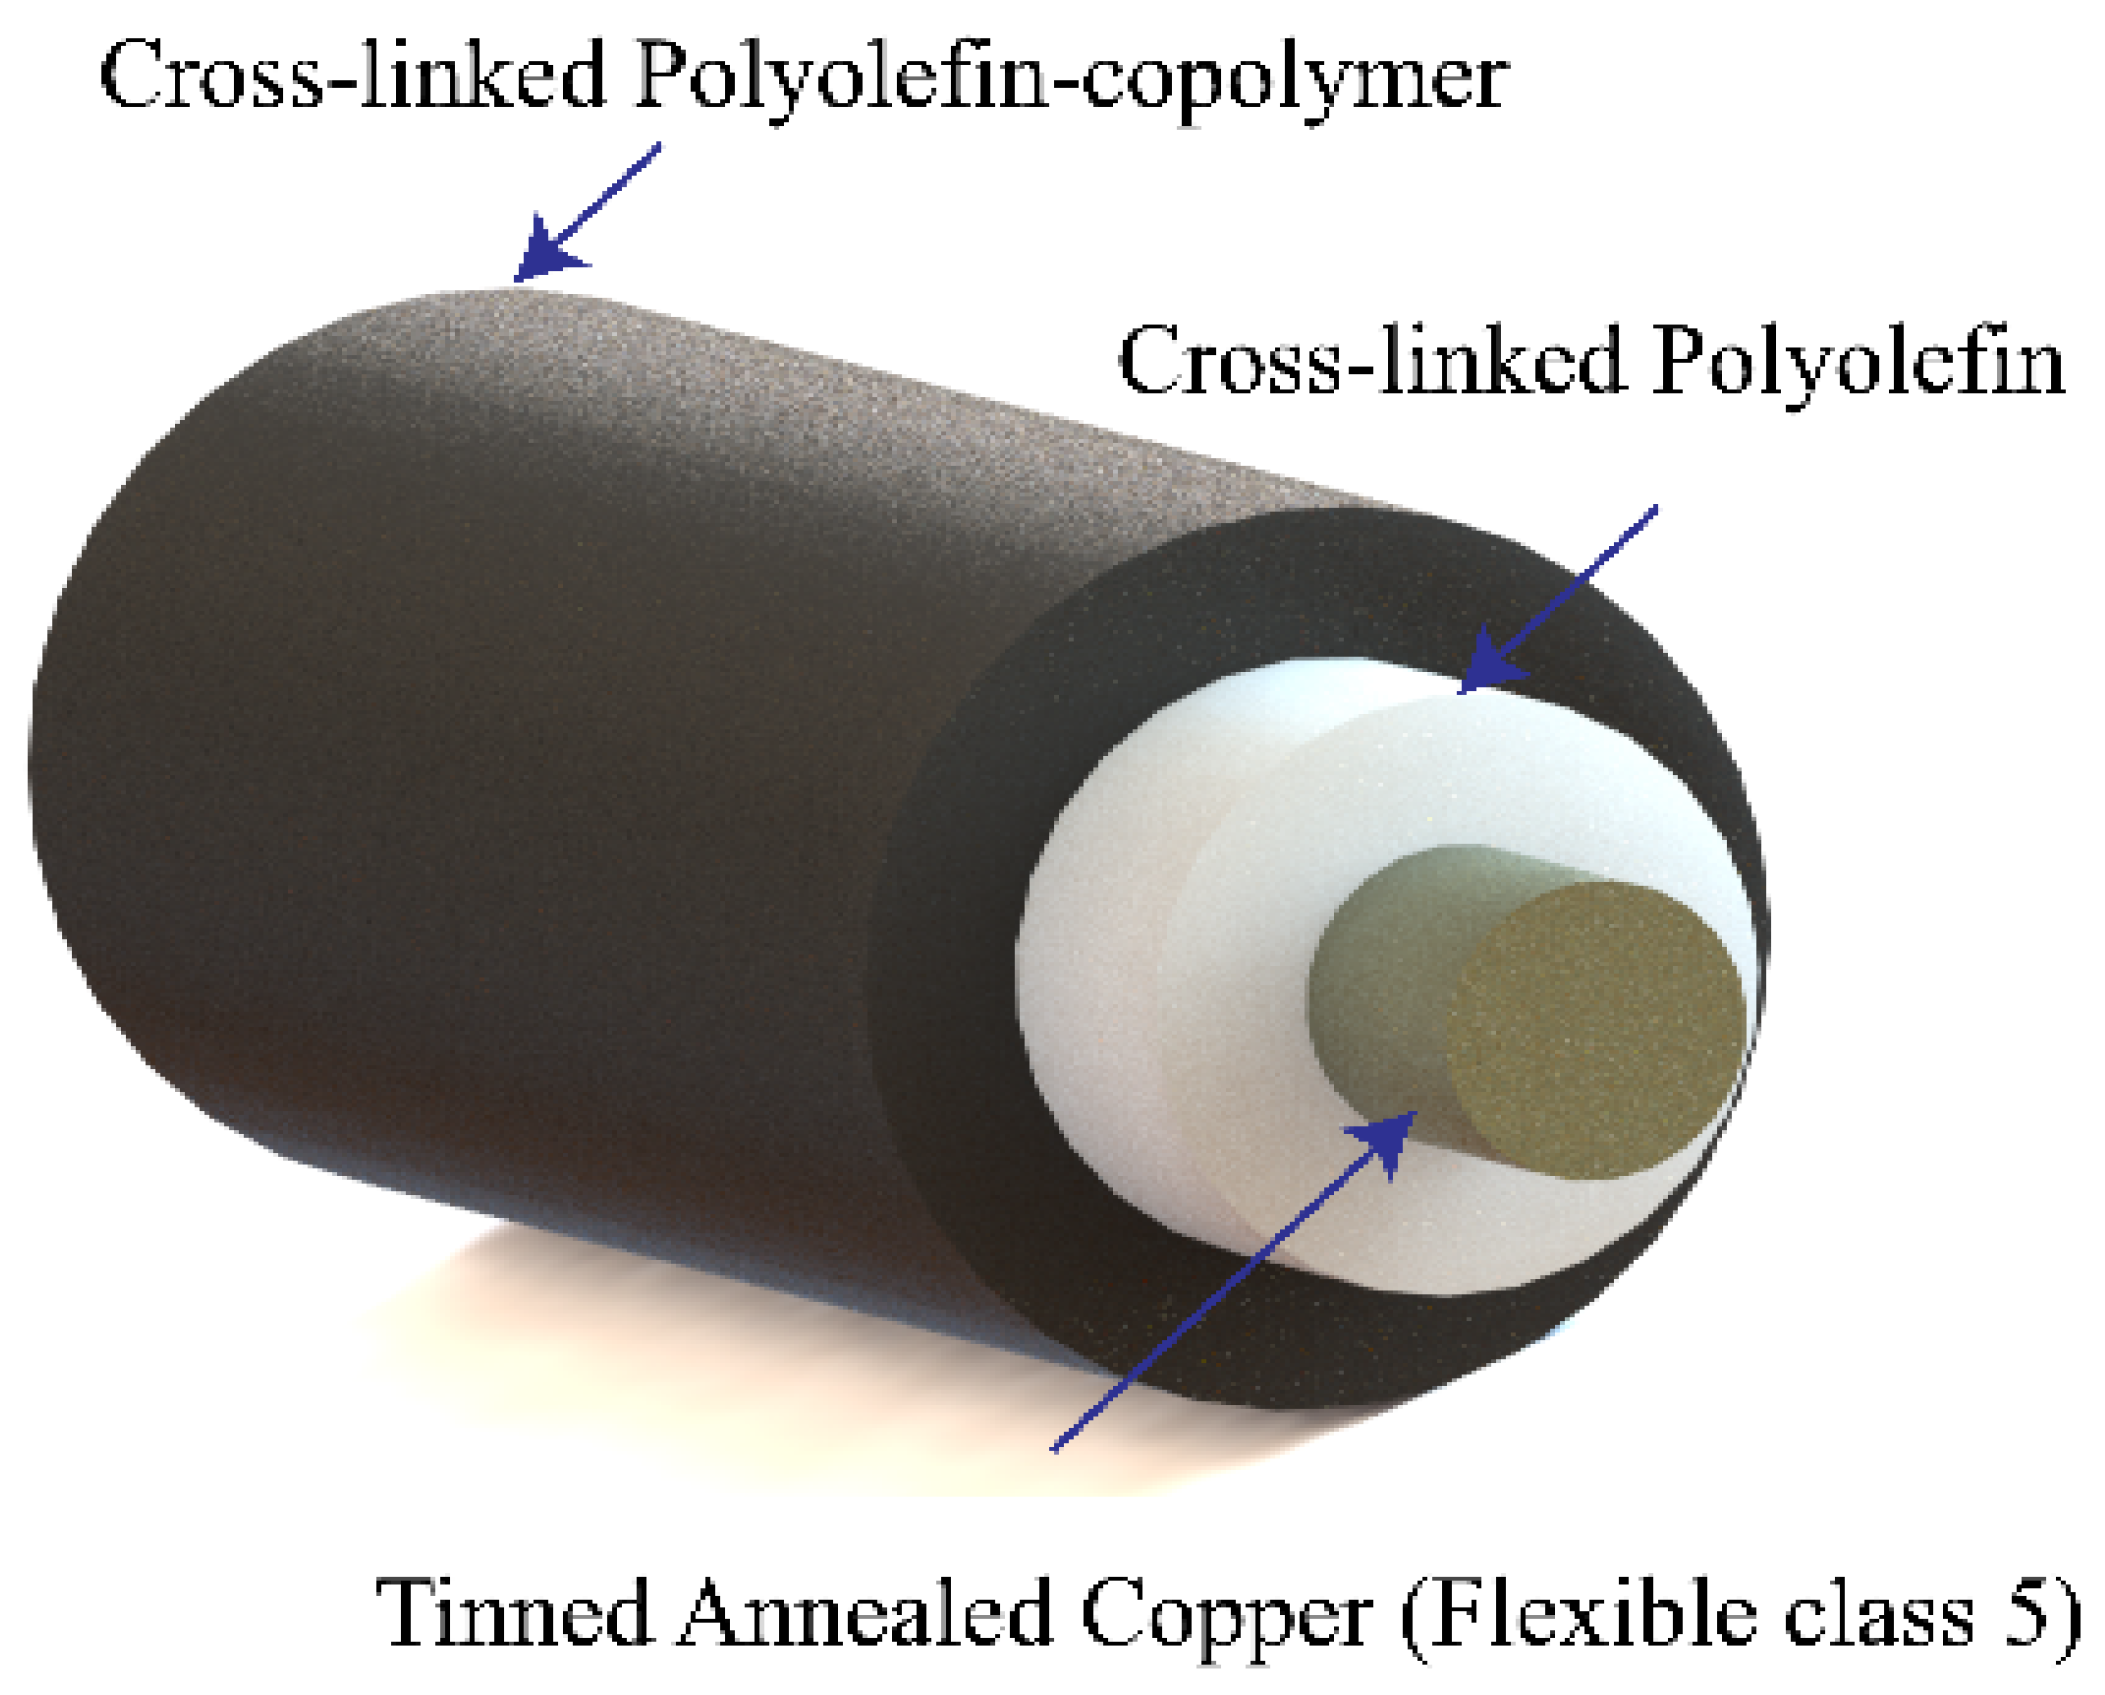
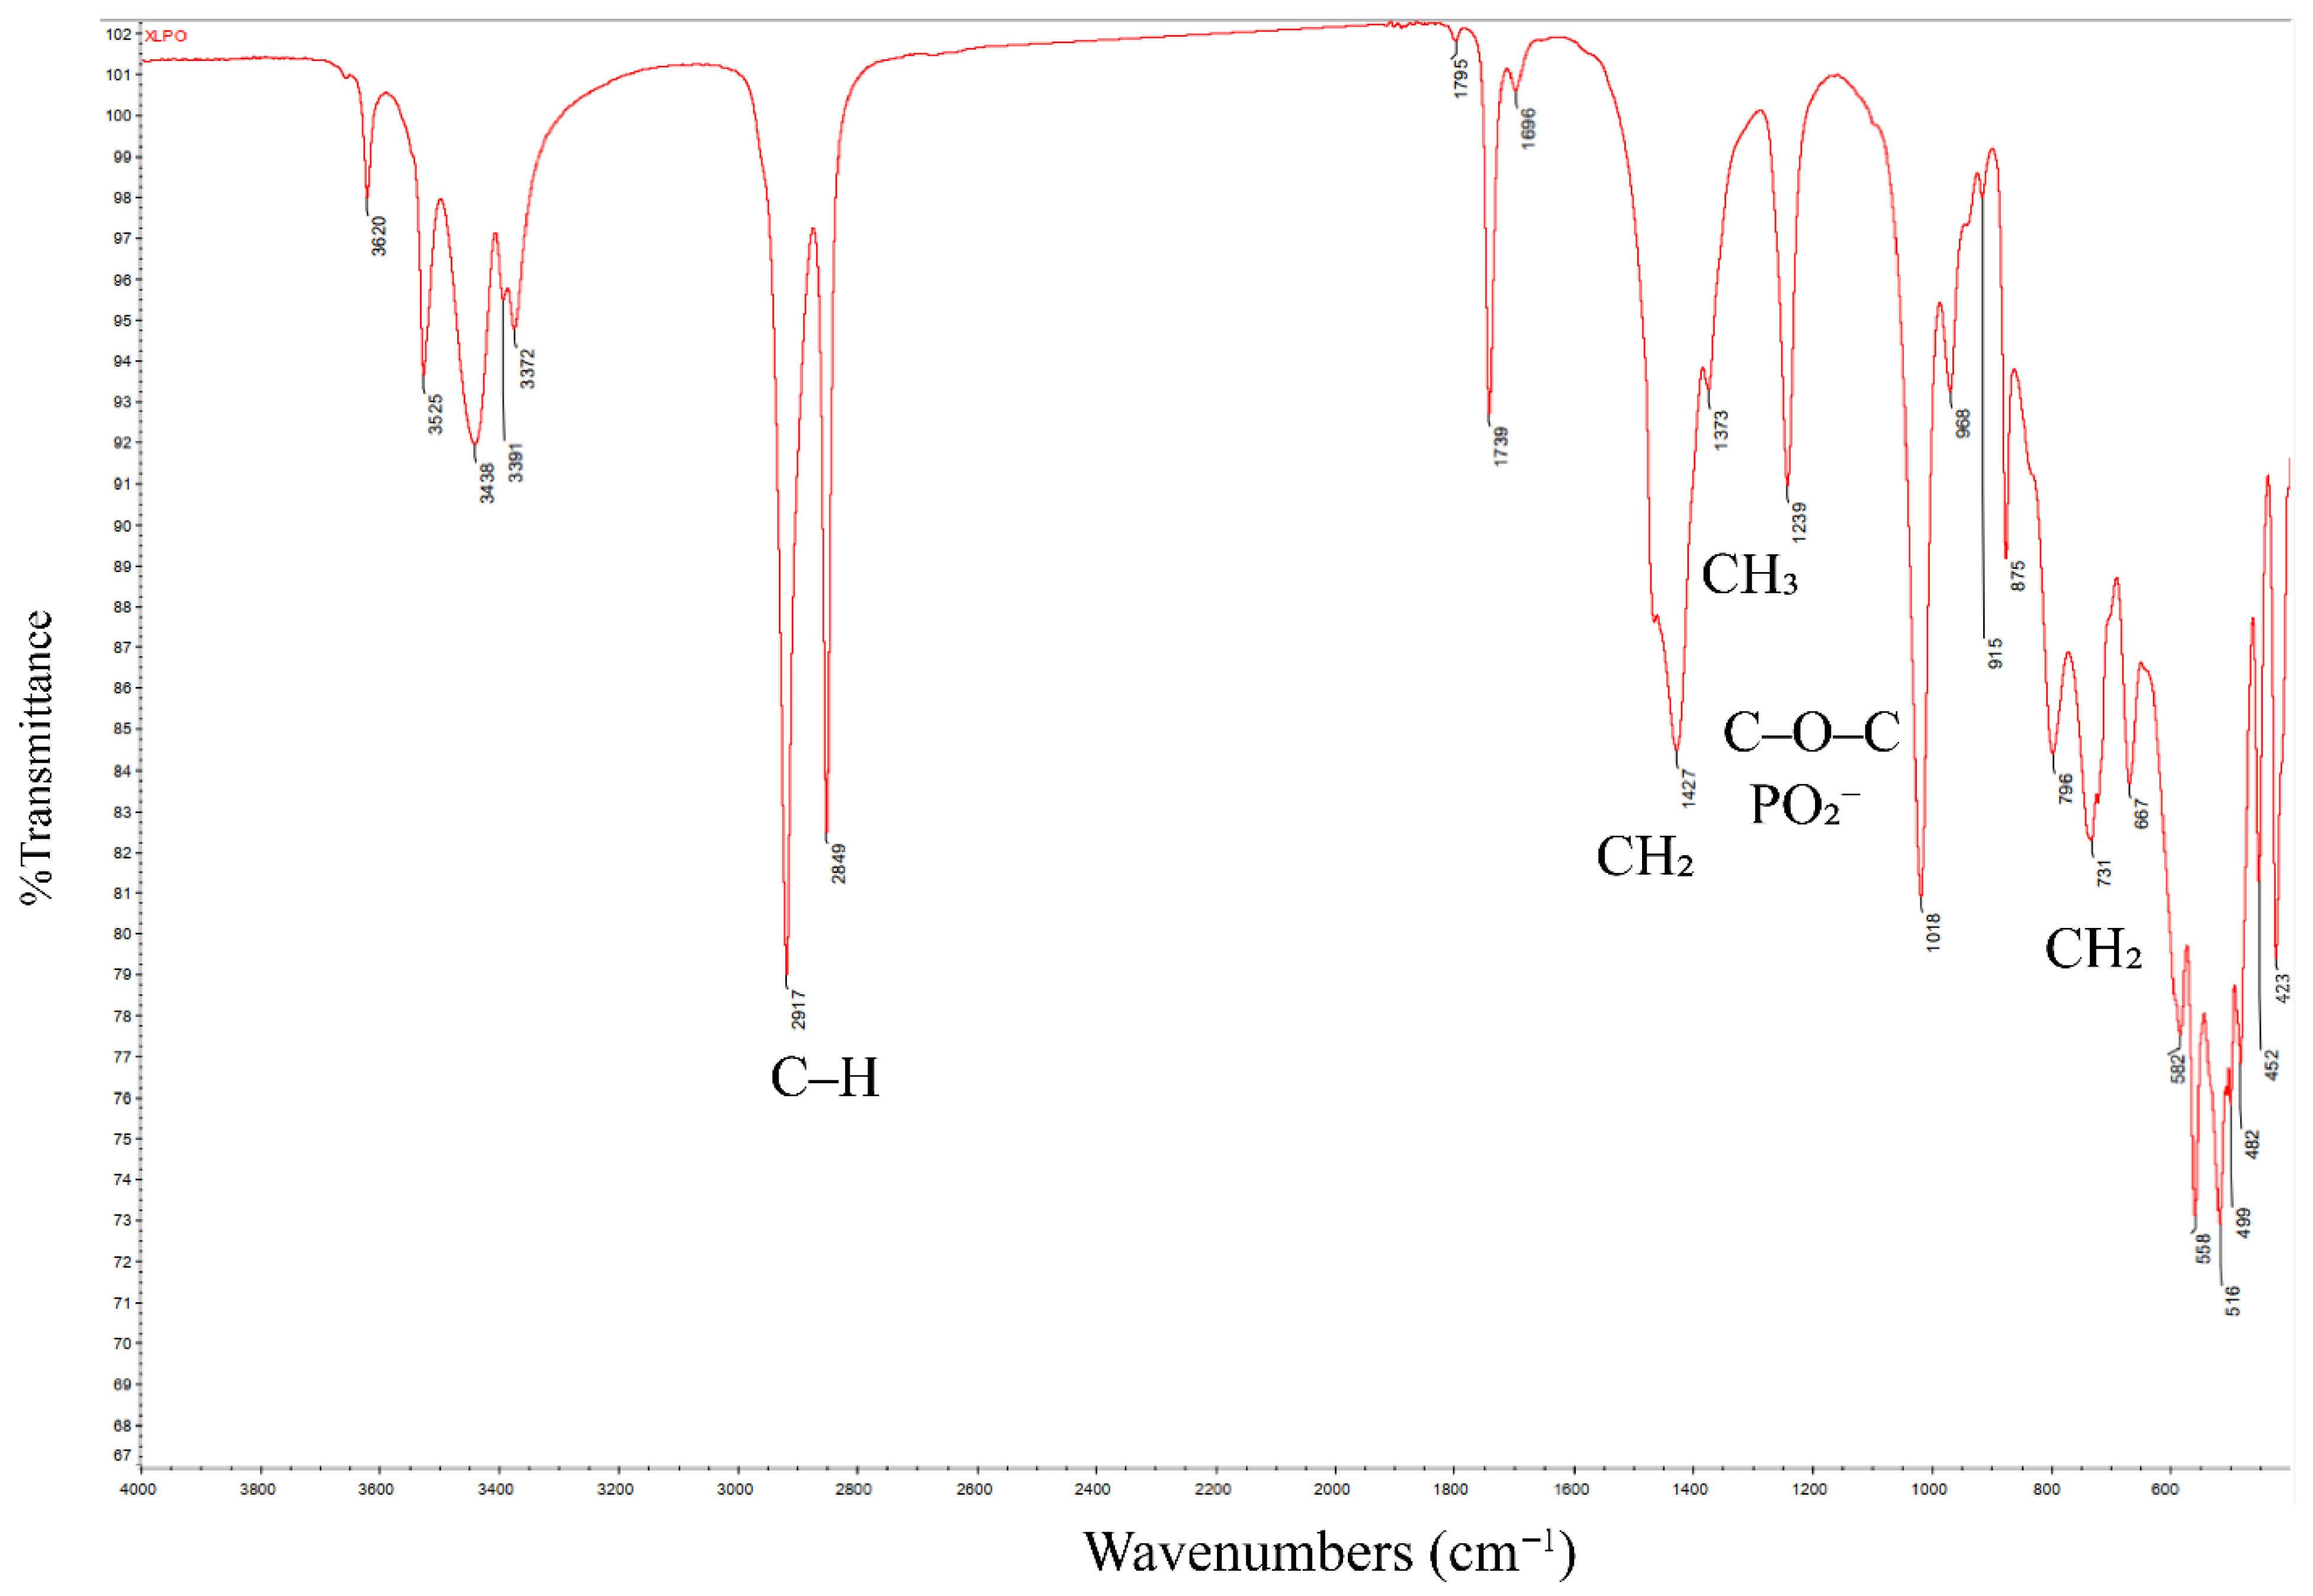
where ν is the wavenumber (cm−1), k is the bond force constant, μ is the reduced mass of the atoms, and c is the speed of light [30,31,32]. This relationship explains why lighter atoms (e.g., C–H) vibrate at higher frequencies than heavier atoms (e.g., C–Cl). Figure 16 and Figure 17 show the cable structure and FTIR spectrum of the XLPO-insulated wire. The spectrum reveals a combination of absorption bands characteristic of both LDPE and EVA components:
  • C–H asymmetric and symmetric stretching: ~2920 and ~2850 cm−1
  • Ester carbonyl (C=O): ~1747 cm−1 (vinyl acetate segment)
  • CH2 and CH3 bending: ~1460 and ~1375 cm−1
  • C–O–C stretching and PO2 (possible additives): ~1233 cm−1
  • CH2 rocking (polyethylene backbone): ~720 cm−1
These peaks indicate a polymer blend composed of ethylene-vinyl acetate (EVA) and low-density polyethylene (LDPE), consistent with the formulation of XLPO as a halogen-free, cross-linked copolymer. The presence of ester and C–O–C bands suggests improved thermal stability, UV resistance, and flexibility—desirable for solar cable applications (e.g., H1Z2Z2-K) [2,6,31]. XLPE Spectrum Analysis Figure 18 and Figure 19 present the structure and spectrum of XLPE. The FTIR peaks are minimal and consistent with saturated aliphatic hydrocarbons:
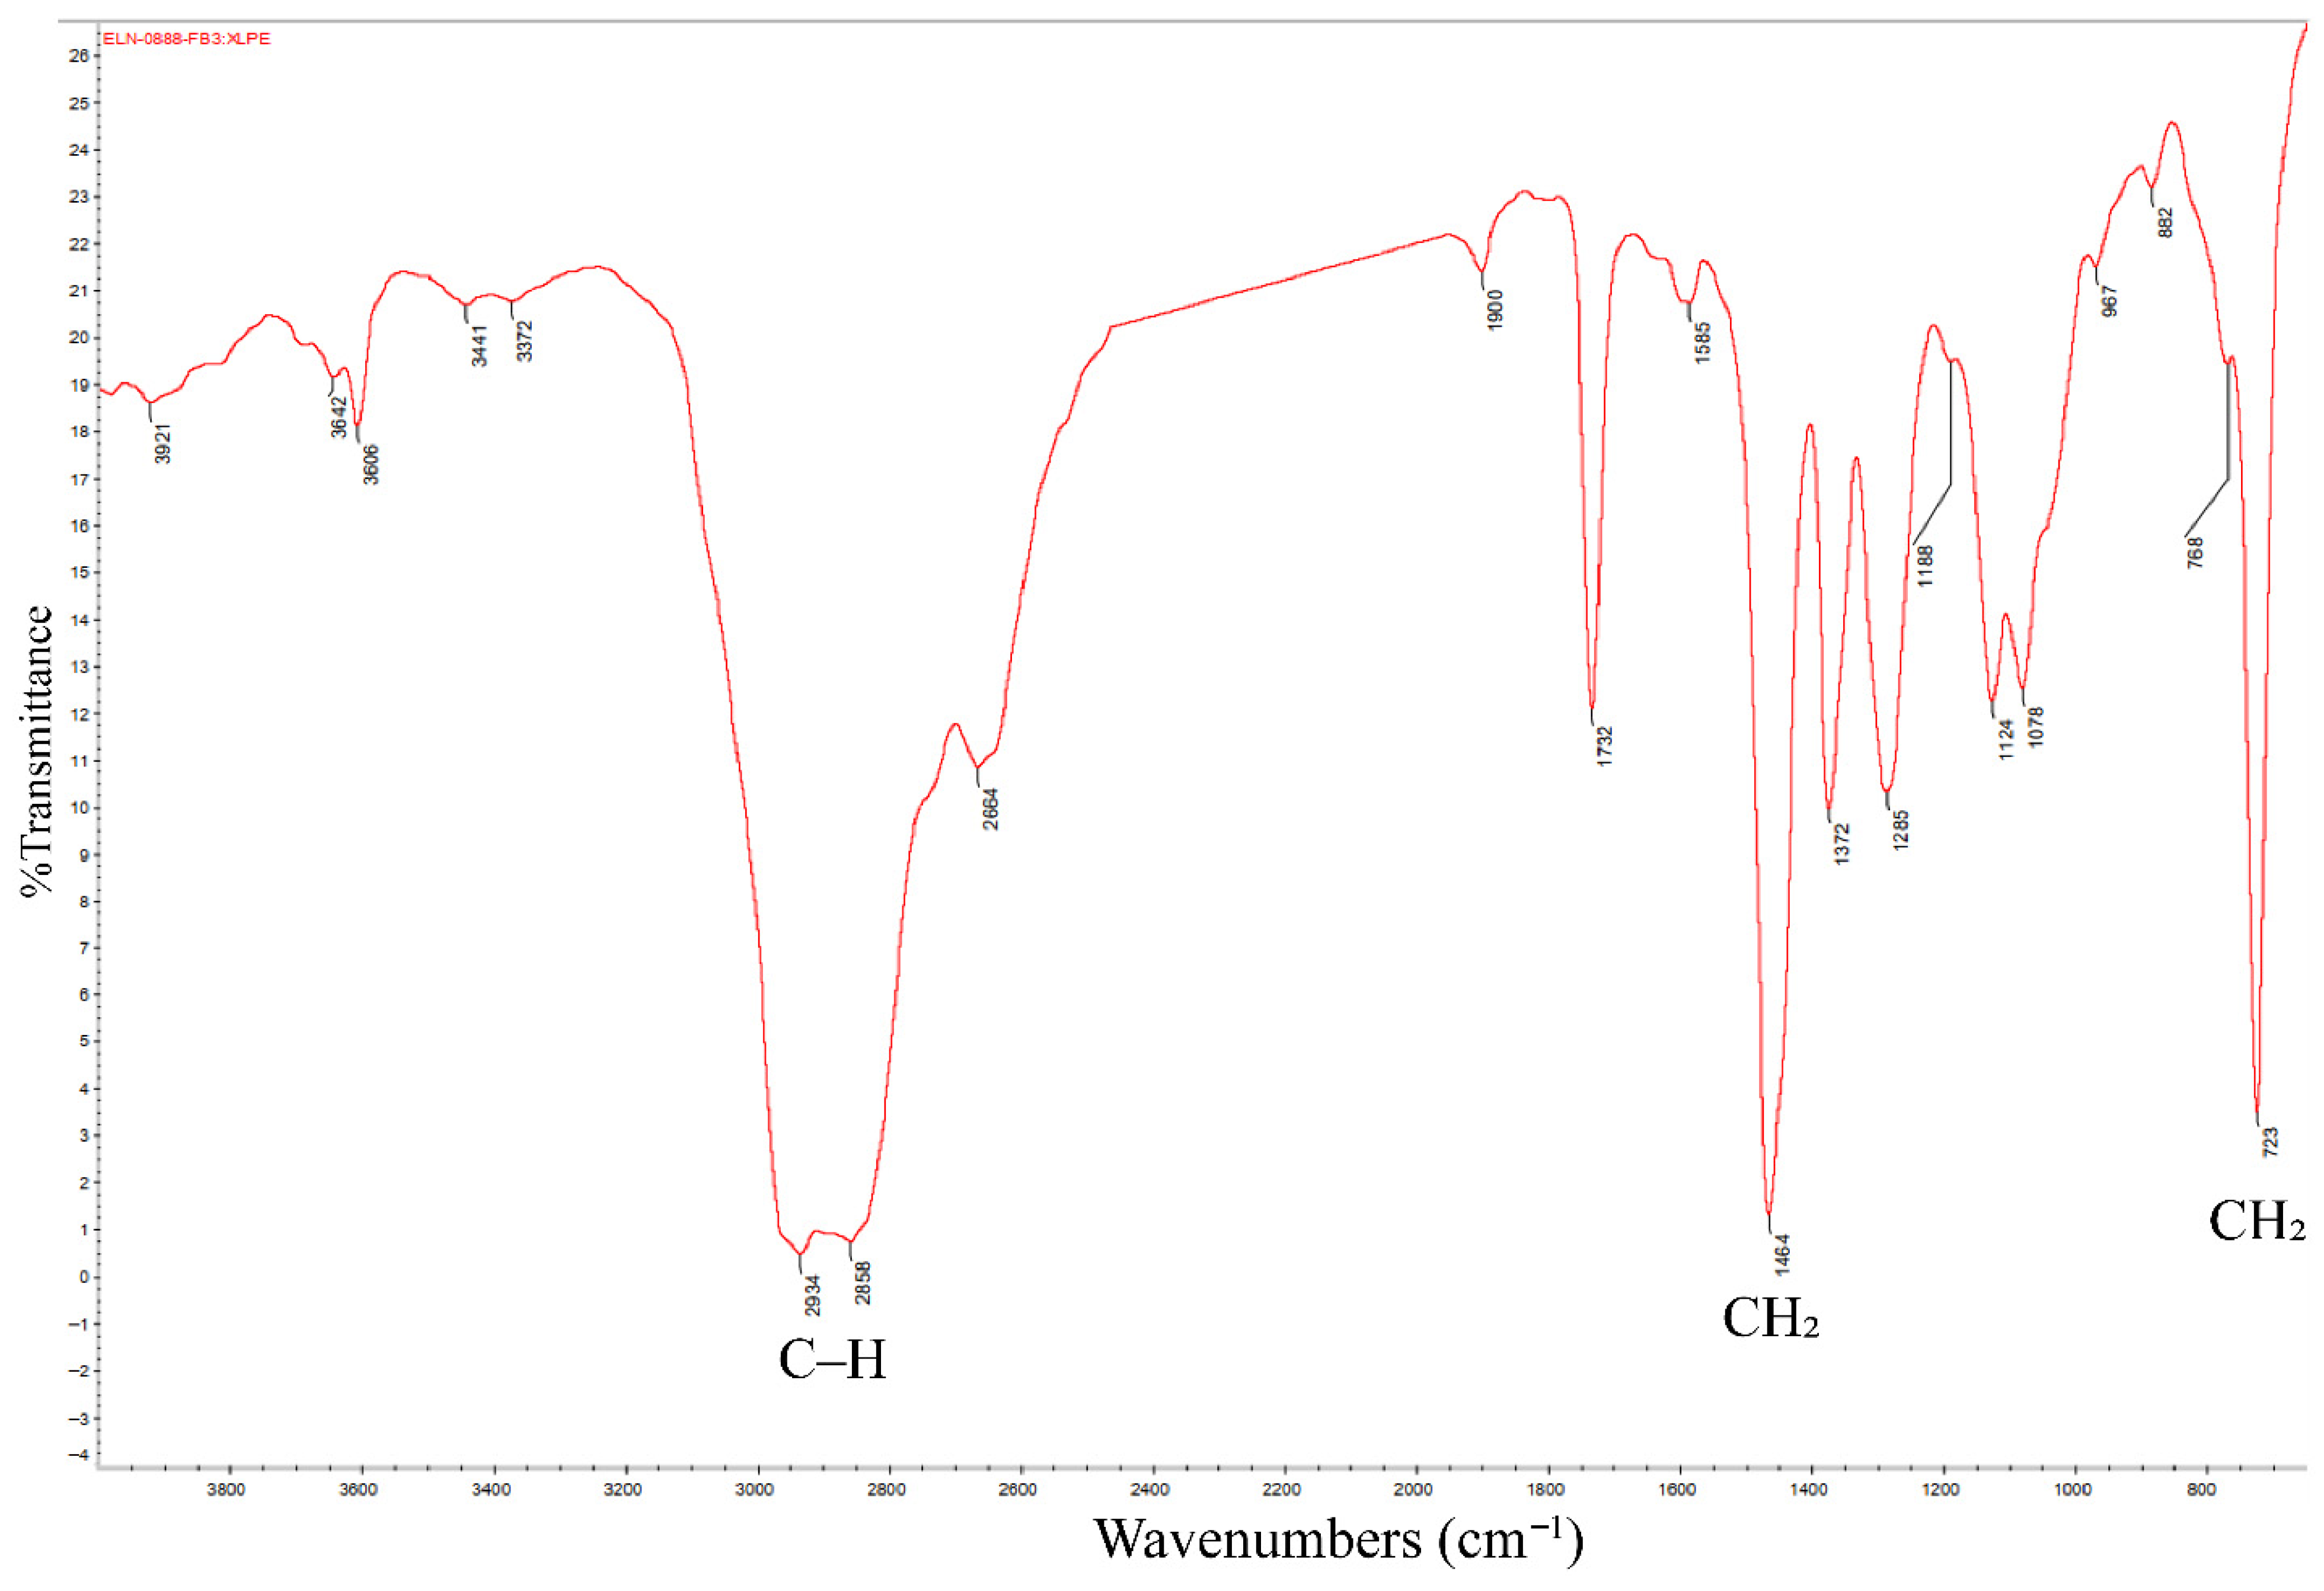
  • C–H stretching: ~2916 and ~2848 cm−1
  • CH2 scissoring: ~1472 and ~1462 cm−1
  • CH2 rocking: ~720 and ~730 cm−1 (doublet due to crystallinity)
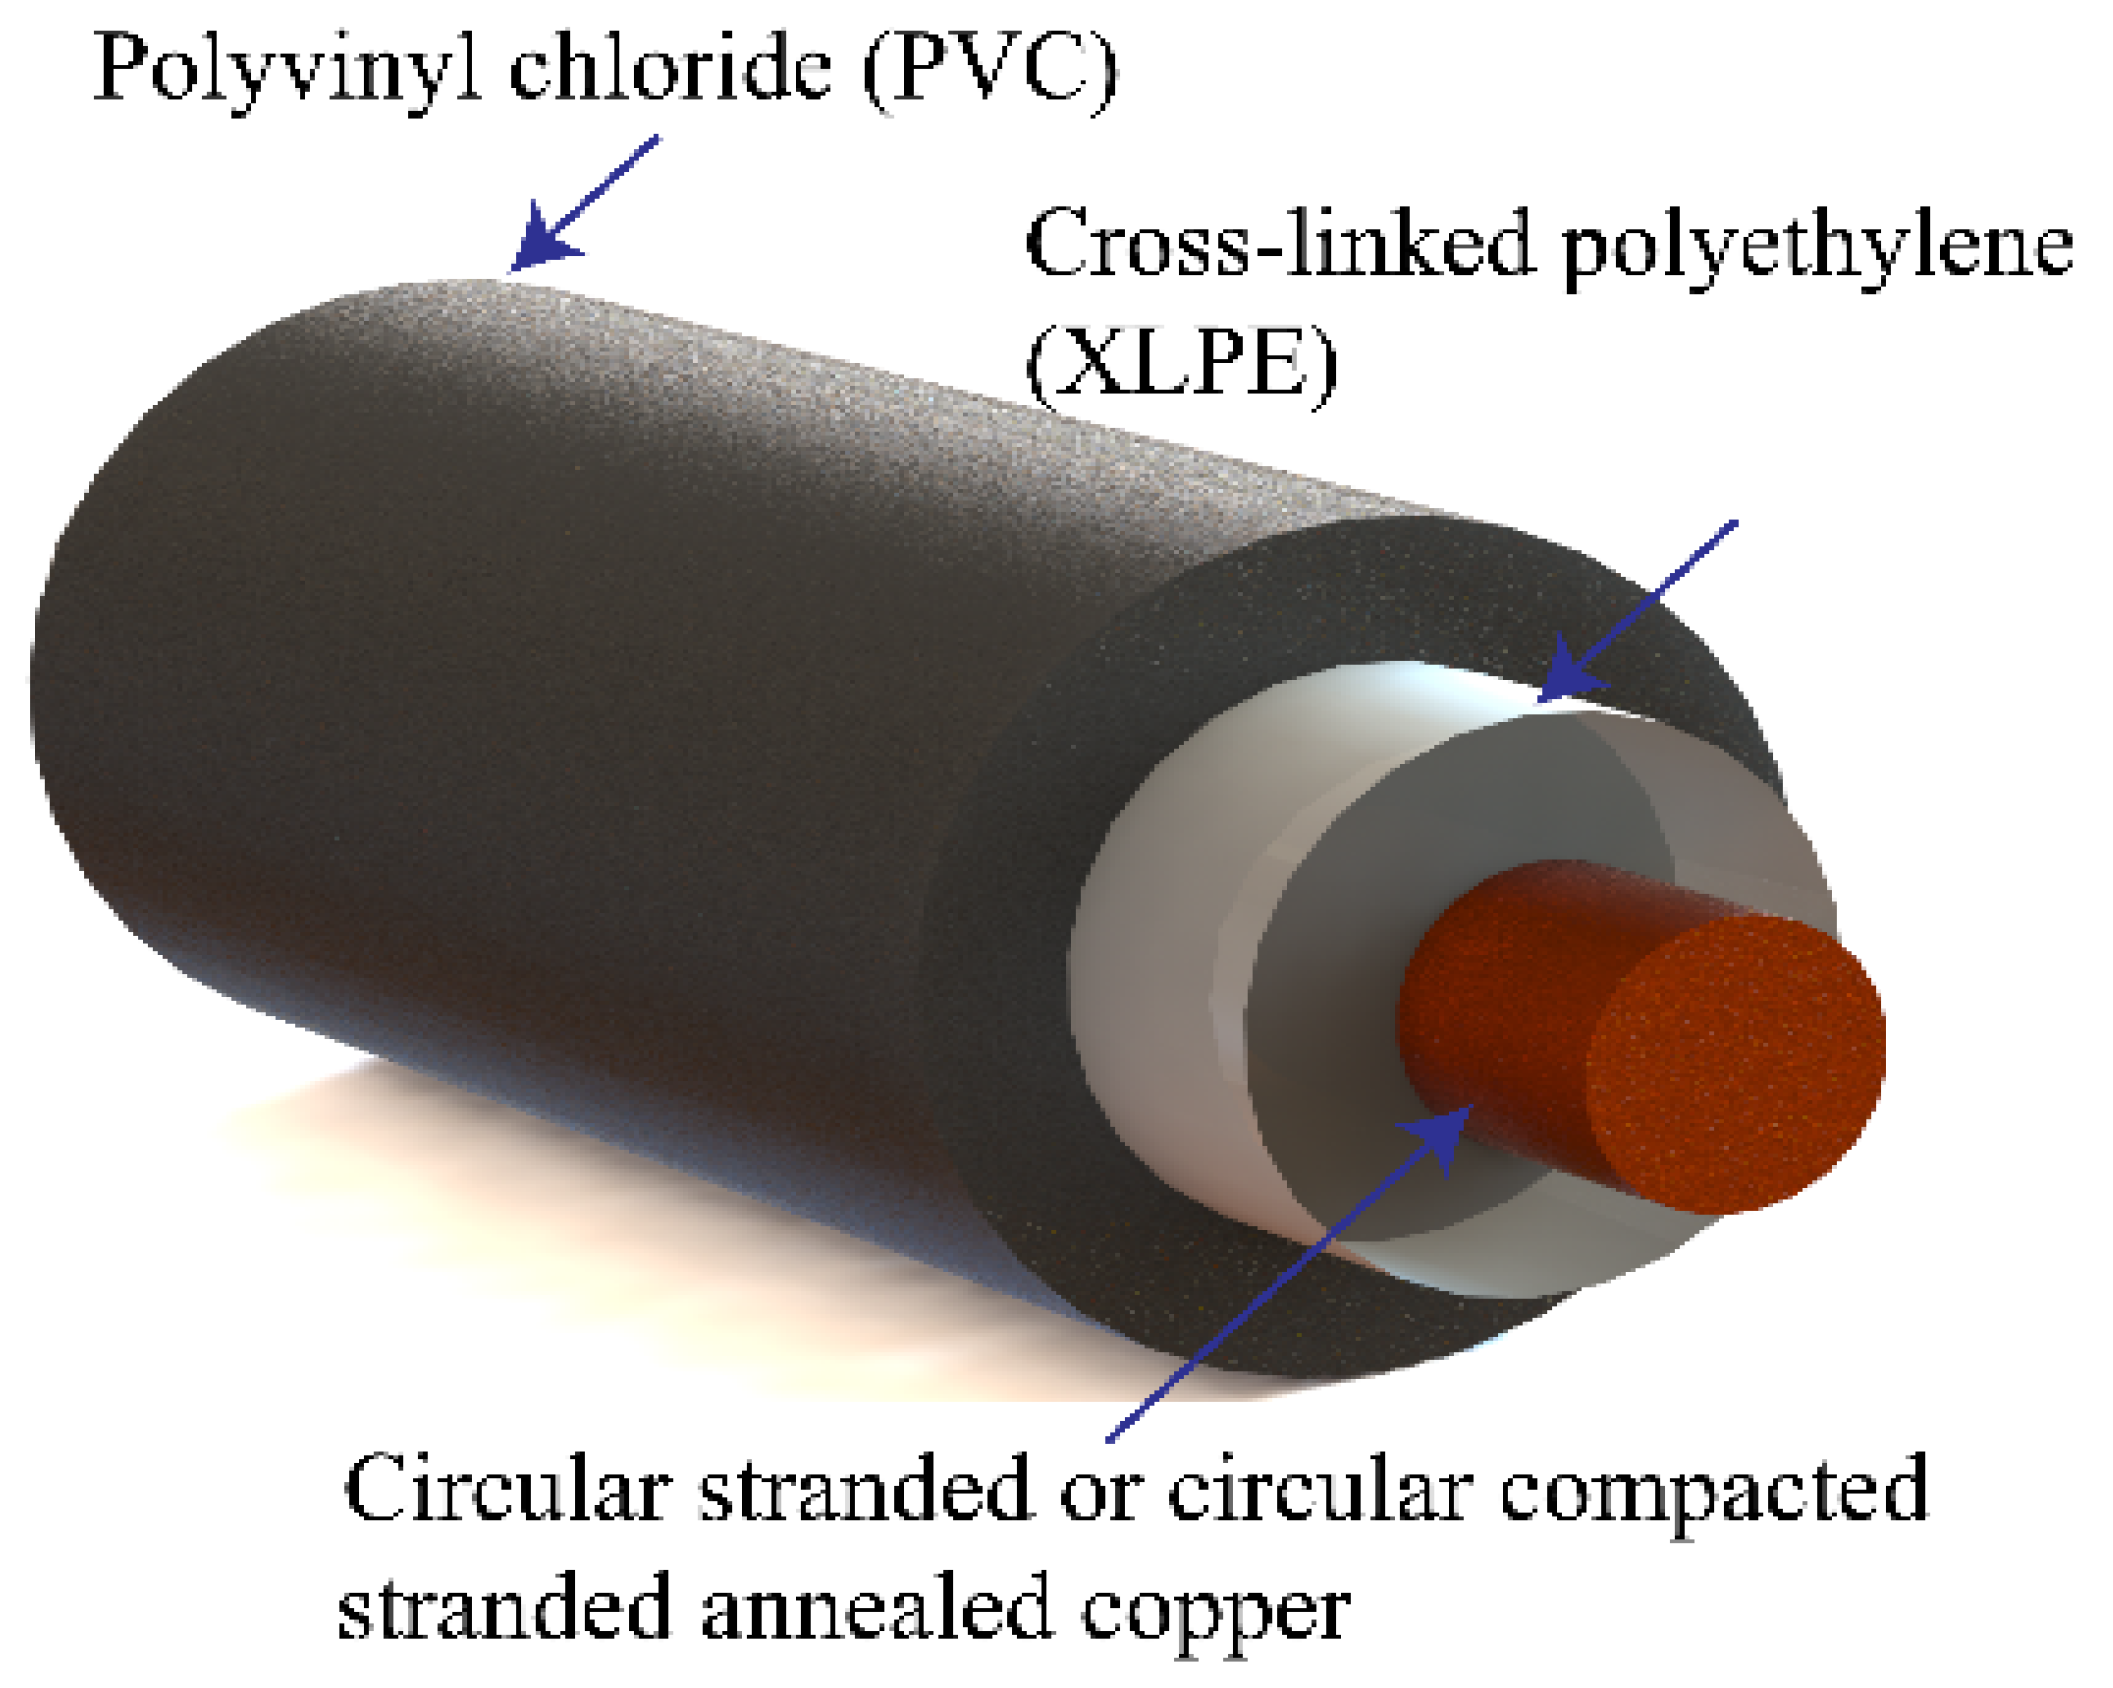
No absorption was observed near 1700 cm−1 or 3300 cm−1, indicating the absence of polar groups such as carbonyls or hydroxyls. This confirms the purity of cross-linked polyethylene with high crystallinity and minimal additives, resulting in excellent dielectric and thermal performance [6,31]. PVC Spectrum Analysis: Figure 20 and Figure 21 illustrate the flexible PVC cable structure and its FTIR spectrum. Characteristic PVC peaks include the following:
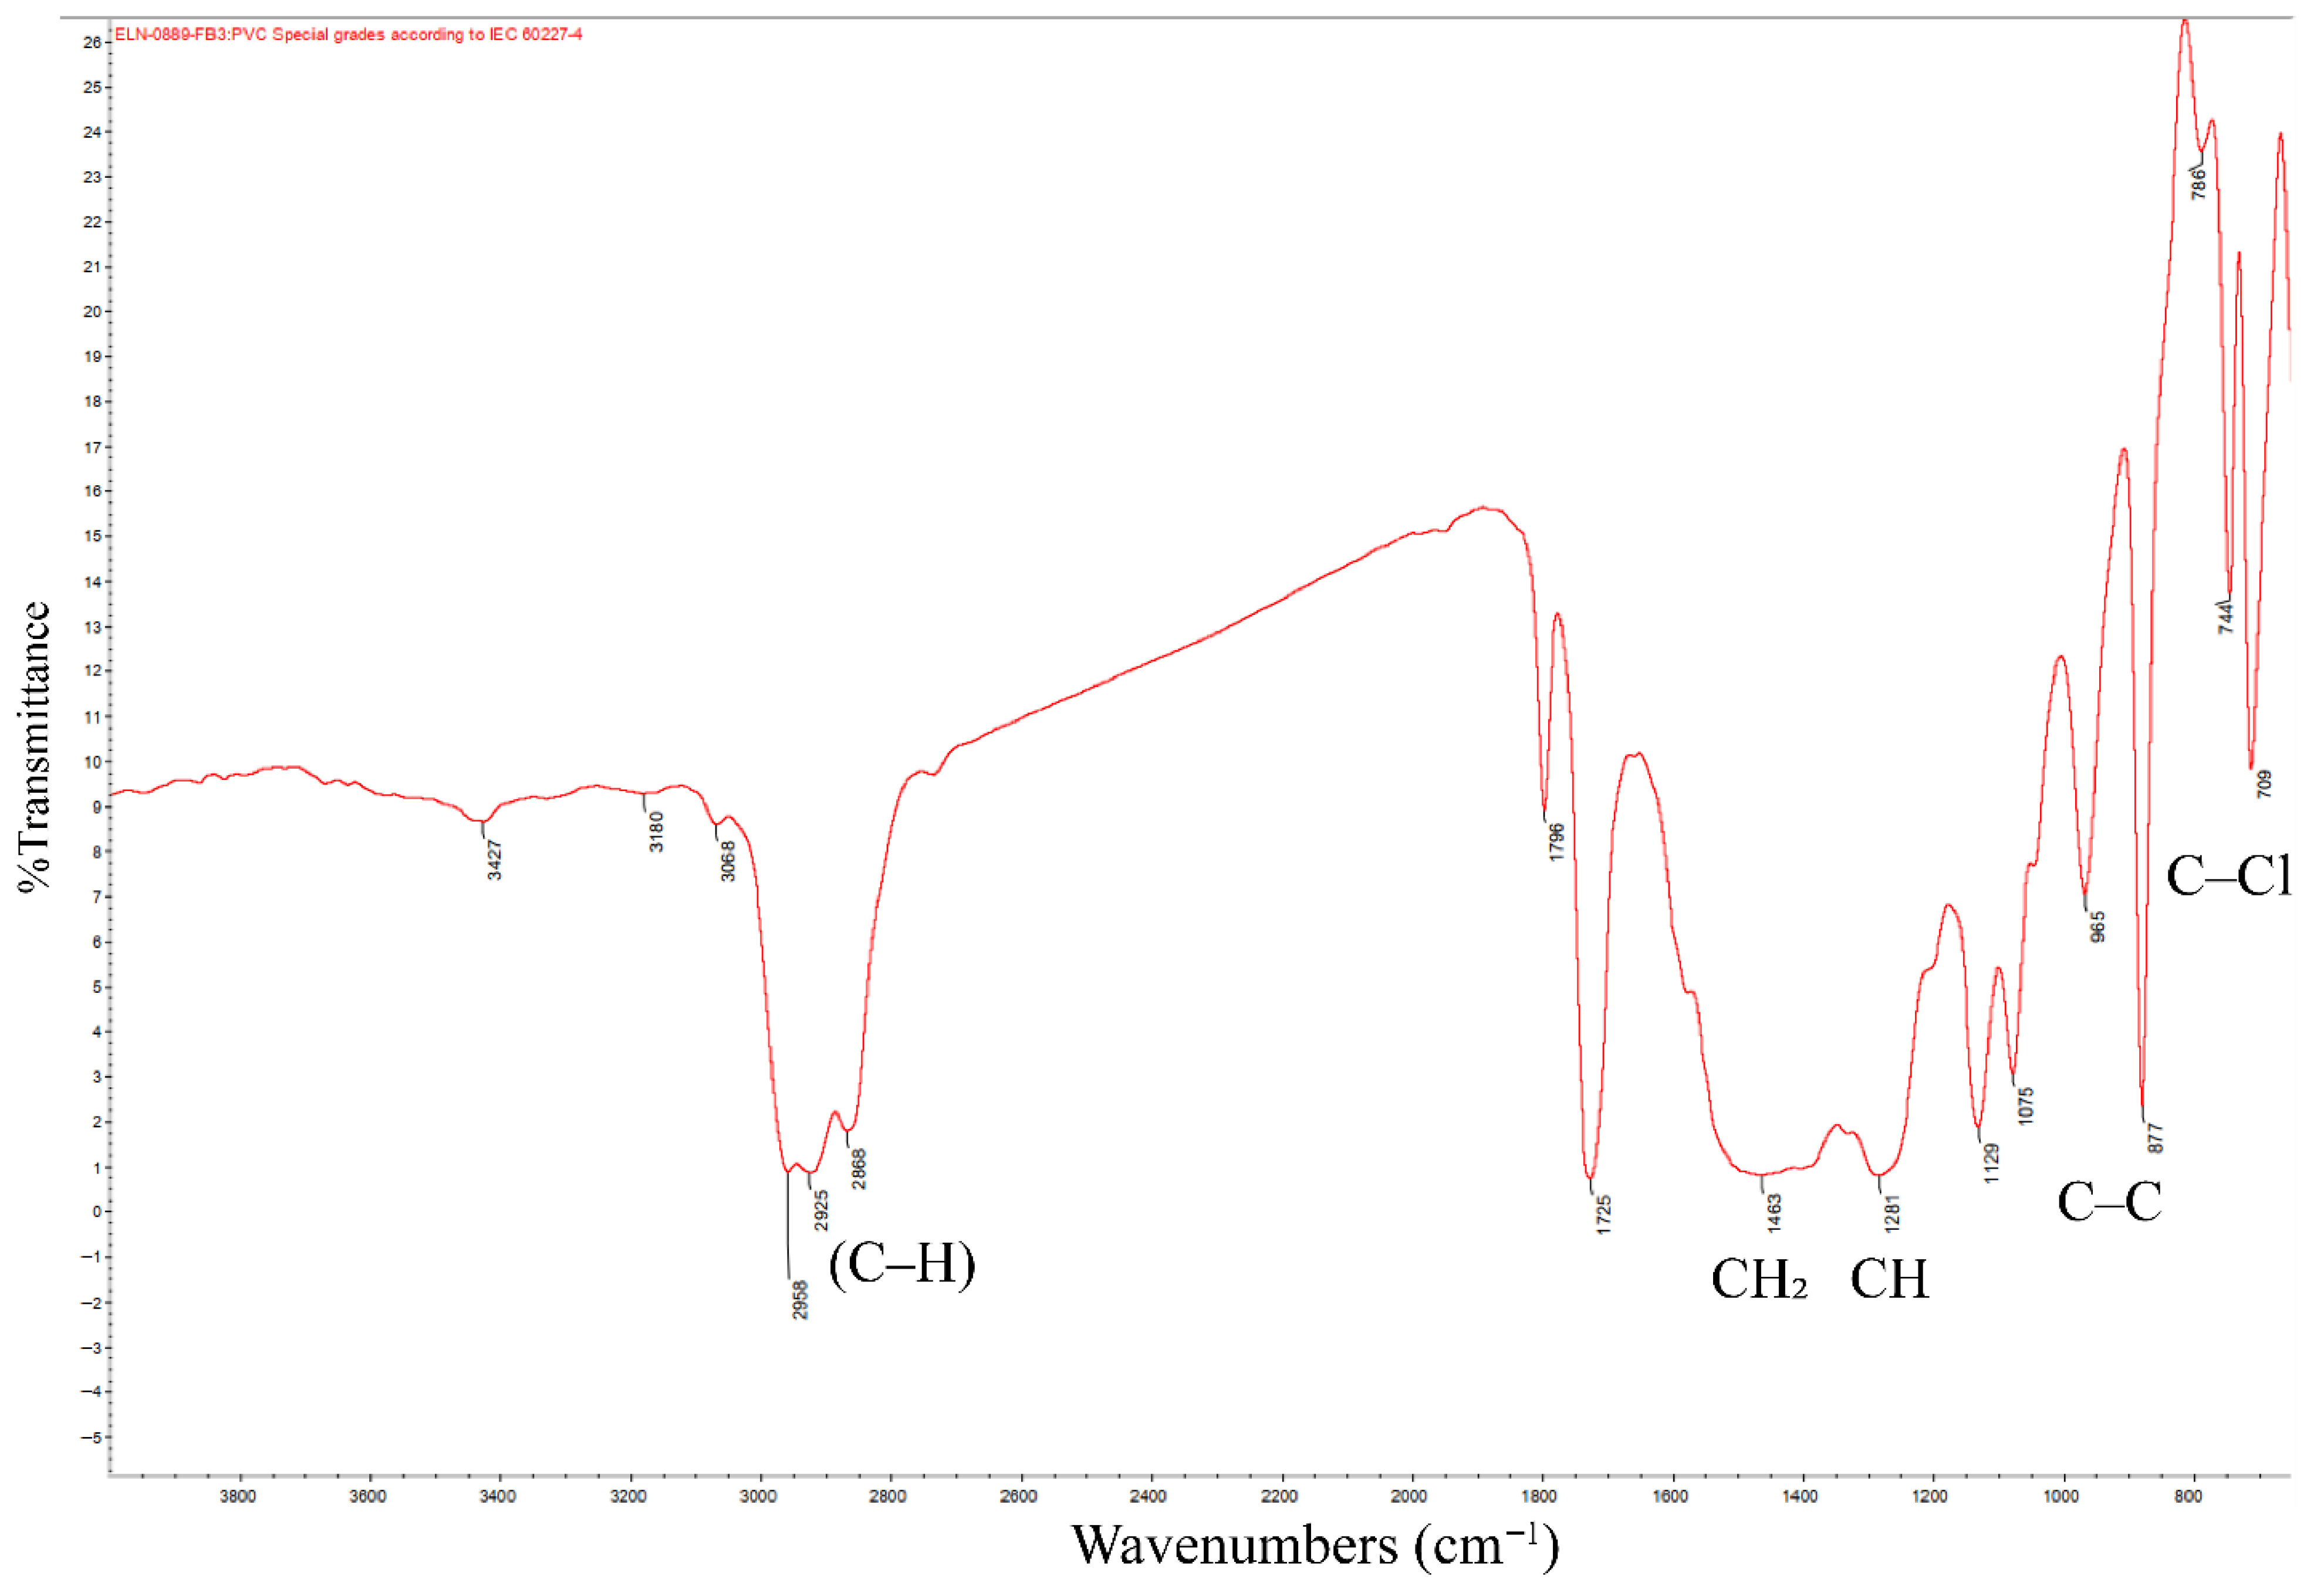
  • C–H stretching: ~2910 and ~2850 cm−1
  • CH2 bending: ~1430 cm−1 (lower than XLPE due to Cl substitution)
  • CH wagging/twisting: ~1330 and ~1250 cm−1
  • C–C stretching: ~960 cm−1
  • C–Cl stretching: multiple peaks in 610–700 cm−1 (halogen signature)
These features clearly distinguish PVC from hydrocarbon polymers. The presence of a plasticizer is suggested by weak C=O absorption near 1730 cm−1. Such additives improve flexibility but contribute to higher dielectric loss and toxic gas emission during combustion, as shown in Table 2 [6,30,31,32].

4. Discussion

The dielectric behavior of XLPO, XLPE, and PVC insulations under ±1 kV DC stress reveals strong correlations between polymer structure and insulation performance. XLPO exhibited the most stable electrical response, with high insulation resistance, balanced polarization indices, and low dielectric loss under both polarities. FTIR analysis confirmed its composition as a cross-linked blend of LDPE and EVA, offering a low-polarity, halogen-free matrix that supports minimal space charge and energy dissipation.
In contrast, XLPE showed polarity-dependent behavior—particularly under positive DC stress—due to charge trapping from peroxide cross-linking byproducts and semi-crystalline interfaces. Although initially resistive, XLPE displayed higher loss indices and asymmetrical discharge currents, aligning with known space-charge concerns in HVDC applications. XLPE’s relative permittivity (~2.3–2.4) is typical for a non-polar hydrocarbon, while PVC’s higher permittivity (~3–4) comes from dipolar polarization of the C–Cl bond [33]. PVC demonstrated the poorest dielectric characteristics, with low IR, near-unity DAR/PI, and high leakage current. FTIR spectra revealed polar groups and grafting polar maleic anhydride (MAH) onto XLPE increased its dielectric loss tangent because the polar moieties participate in orientation polarization, while plasticizers contribute to high conductivity and energy loss [34]. Its chlorinated structure also raises environmental and fire safety concerns. Electric field simulations showed uniform field profiles in XLPO-insulated cables and mild discontinuities at XLPE–PVC and PVC–TPE interfaces. However, only XLPO maintained stable field gradients under both polarities, confirming its suitability for long-term, high-voltage DC applications. Non-polar polyolefins (XLPE, XLPO) have a very low intrinsic charge carrier density and rely on deep traps (formed by impurities or cross-linking byproducts) to capture charge [34]. Electrostatic MATLAB fields are polarity-symmetric by definition; the observed polarity dependence in IR/DAR/PI/LI arises from charge injection barriers, trap-controlled conduction, and release kinetics that evolve over time. Hence, LI > 1 reflects discharge–charge asymmetry and conduction components, while LI < 1 indicates dissipative/irreversible processes.

5. Conclusions

This study provides a rigorous, polarity-dependent comparison of virgin PV cable insulations—XLPO, XLPE, and PVC—under ±1 kV DC, combining time-domain diagnostics (IR, DAR, PI, LI) with electrostatic field modeling and FTIR. Across both polarities, XLPO consistently delivered the highest insulation resistance and low-to-moderate loss indices (≈1.3–1.5), indicating controlled relaxation with limited conduction/trap-release contribution. These results, together with its halogen-free, low-polarity chemistry and cross-linked network, support XLPO as a technically robust choice for long-term DC operation in PV/HVDC cables. XLPE performed well in IR but exhibited polarity-dependent absorption and higher LI, consistent with trap-related effects and cross-linking byproducts under DC stress. XLPE remains viable for HVDC when carefully engineered (e.g., degassing, additive optimization), which aligns with the industry trend toward DC-optimized XLPE formulations. PVC was the least suitable: higher DC conduction and elevated losses imply continuous heating and faster aging in service; combined with halogenated chemistry, this justifies its restriction to low-voltage applications and the preference for halogen-free alternatives. Overall, the data set establishes a polarity-dependent baseline on virgin cables that directly informs material selection and standardization for next-generation PV/HVDC cabling. Future work will extend this baseline to controlled aging, higher field strengths, and alternative polyolefin blends. It may incorporate frequency-domain diagnostics and direct space-charge measurements to resolve mechanisms further.

Author Contributions

Conceptualization, K.R. and N.P.; Methodology, K.R. and N.P.; Software, K.R.; Validation, K.R., N.P. and P.P.; Formal Analysis, K.R.; Investigation, K.R.; Writing—original draft preparation, K.R.; Writing—review and editing, K.R., N.P. and P.P.; Supervision, N.P. All authors have read and agreed to the published version of the manuscript.

Funding

This research received no external funding.

Data Availability Statement

Data are available upon reasonable request from the corresponding author.

Conflicts of Interest

The authors declare no conflict of interest.

References

  1. Mustafa, E.; Afia, R.S.; Tamus, Z.Á. Investigation of complex permittivity of XLPO insulated photovoltaic DC cables due to thermal aging. In Proceedings of the International Symposium on High Voltage Engineering, Budapest, Hungary, 26–30 August 2019; pp. 261–269. [Google Scholar]
  2. Ohki, Y.; Hirai, N. Effects of the structure and insulation material of a cable on the ability of a location method by FDR. IEEE Trans. Dielectr. Electr. Insul. 2016, 23, 77–84. [Google Scholar] [CrossRef]
  3. Krause, C.; Drung, D.; Scherer, H. Measurement of sub-picoampere direct currents with uncertainties below ten attoamperes. Rev. Sci. Instrum. 2017, 88, 024711. [Google Scholar] [CrossRef] [PubMed]
  4. Jarrett, D.G.; Owen, M.C. Traceability for aerosol electrometer in the fA range. In Proceedings of the 19th IMEKO TC4 Symposium Measurements of Electrical Quantities, Barcelona, Spain, 18–19 July 2013; pp. 270–274. [Google Scholar]
  5. Haridoss, S.; Tobazéon, R.; Crine, J.-P. Estimation of water content in cross-linked polyethylene insulated cables by Fourier transform infrared spectroscopy. Appl. Spectrosc. 1988, 42, 186–188. [Google Scholar] [CrossRef]
  6. Nandiyanto, A.B.D.; Oktiani, R.; Ragadhita, R. How to read and interpret FTIR spectroscope of organic material. Indones. J. Sci. Technol. 2019, 4, 97–118. [Google Scholar] [CrossRef]
  7. Bal, S.; Tamus, Z.A. Analyzing the Impact of Short-Term Cyclic Thermal Ageing on PVC Insulated Low Voltage Samples with Polarization/Depolarization Current Measurement. Acta Polytech. Hung. 2023, 20, 77–91. [Google Scholar] [CrossRef]
  8. Xu, X.M.; Smeers, J.; Vereecke, G.; Struyf, H. Investigation of the evaporation and wetting mechanism of IPA-DIW mixtures. Solid State Phenom. 2013, 195, 223–226. [Google Scholar] [CrossRef]
  9. Park, J.-G.; Lee, S.-H.; Ryu, J.-S.; Hong, Y.-K.; Kim, T.-G.; Busnaina, A.A. Interfacial and electrokinetic characterization of IPA solutions related to semiconductor wafer drying and cleaning. J. Electrochem. Soc. 2006, 153, G811. [Google Scholar] [CrossRef]
  10. Dissado, L.A.; Fothergill, J.C. Electrical Degradation and Breakdown in Polymers; IET: Stevenage, UK, 1992; Volume 9. [Google Scholar]
  11. Das-Gupta, D. Conduction mechanisms and high-field effects in synthetic insulating polymers. IEEE Trans. Dielectr. Electr. Insul. 2002, 4, 149–156. [Google Scholar] [CrossRef]
  12. Li, Z.; Chen, G. Space charge in thermally aged polyethylene and its electrical performance. Mater. Res. Express 2018, 6, 035308. [Google Scholar] [CrossRef]
  13. Ma, Z.; Yang, L.; Bhutta, M.S.; Bian, H.; Khan, M.Z. Effect of thickness on the space charge behavior and dc breakdown strength of cross-linked polyethylene insulation. IEEE Access 2020, 8, 85552–85566. [Google Scholar] [CrossRef]
  14. Walker, R.C.; Hamedi, H.; Woodward, W.H.H.; Rajagopalan, R.; Lanagan, M. Impacts of crosslinking and degassing on the conductivity, dielectric loss, and morphology of low-density polyethylene and crosslinked polyethylene. In Broadband Dielectric Spectroscopy: A Modern Analytical Technique; ACS Publications: Washington, DC, USA, 2021; pp. 239–260. [Google Scholar]
  15. Kumara, S.; Hammarström, T.; Serdyuk, Y.V. Polarity effect on electric tree inception in HVDC cable insulation. IEEE Trans. Dielectr. Electr. Insul. 2021, 28, 1819–1827. [Google Scholar] [CrossRef]
  16. Bartnikas, R.; Eichhorn, R. Engineering Dielectrics Volume IIA Electrical Properties of Solid Insulating Materials: Molecular Structure and Electrical Behavior; ASTM International: West Conshohocken, PA, USA, 1983. [Google Scholar]
  17. Nikam, P.N.; Deshpande, V.D. Dielectric behavior of plasticized PVC/alumina nanocomposites influenced with DC biasing field. Mater. Today Proc. 2018, 5, 2254–2262. [Google Scholar] [CrossRef]
  18. Gridnev, S. Dielectric relaxation in disordered polar dielectrics. Ferroelectrics 2002, 266, 171–209. [Google Scholar] [CrossRef]
  19. Carrión-Jaura, R.; Díaz-Sinche, D.; Castillo-Calderón, J.; Caraguay-Correa, C. Practical Approach to the Application of IEEE Standard 43-2013 in the Assessment of the Insulation of Rotating Machines. In Proceedings of the International Conference on Computer Science, Electronics and Industrial Engineering (CSEI), Ambato, Ecuador, 13–17 November 2023; pp. 920–932. [Google Scholar]
  20. Qu, J.; Wang, S.; Li, S. The XLPO cable insulation with synchronous-enhanced DC electrical and high-temperature mechanical properties. APL Mater. 2024, 12, 101122. [Google Scholar] [CrossRef]
  21. Tian, Z.; Sun, L.; Wang, J.; Bai, X. A Study of Simulation on Relationship Between Young’s Modulus of Cable joints and Interface Pressure Based on Finite Element Method. J. Phys. Conf. Ser. 2019, 1187, 022036. [Google Scholar] [CrossRef]
  22. Farshad, M.; Wildenberg, M.; Flüeler, P. Determination of shear modulus and Poisson’s ratio of polymers and foams by the anticlastic plate-bending method. Mater. Struct. 1997, 30, 377–382. [Google Scholar] [CrossRef]
  23. Berrag, A.; Madani, L.; Belkhiat, S. An Experimental Study of the Dielectric Parameters of PVC Nano-Composites under Corona Conditions. Eng. Technol. Appl. Sci. Res. 2023, 13, 10523–10528. [Google Scholar] [CrossRef]
  24. Abdel-Gawad, N.M.; El Dein, A.Z.; Mansour, D.-E.A.; Ahmed, H.M.; Darwish, M.; Lehtonen, M. Enhancement of dielectric and mechanical properties of polyvinyl chloride nanocomposites using functionalized TiO 2 nanoparticles. IEEE Trans. Dielectr. Electr. Insul. 2018, 24, 3490–3499. [Google Scholar] [CrossRef]
  25. Choudhury, S.N.; Nayak, J.; Das, P.; Pal, A.; Katheria, A.; Banerji, P.; Das, N.C. Enhancing electrical characteristics and electromagnetic interference shielding effectiveness in thermoplastic elastomeric polymer blends by utilizing the selective distribution of conductive black. Funct. Compos. Mater. 2024, 5, 4. [Google Scholar] [CrossRef]
  26. Salem, M.; Aldabbagh, O. numerical solution to poisson’s equation for estimating electrostatic properties resulting from an axially symmetric gaussian charge density distribution: Charge in free space. Mathematics 2024, 12, 1948. [Google Scholar] [CrossRef]
  27. Verma, A.R.; Subba, R.B. Understanding surface degradation on polymeric insulators using rotating wheel and dip test under DC stress. IEEE Trans. Dielectr. Electr. Insul. 2018, 25, 2029–2037. [Google Scholar] [CrossRef]
  28. Murata, Y.; Sakamaki, M.; Abe, K.; Inoue, Y.; Mashio, S.; Kashiyama, S.; Matsunaga, O.; Igi, T.; Watanabe, M.; Asai, S. Development of high voltage DC-XLPE cable system. SEI Tech. Rev 2013, 101, 55–62. [Google Scholar]
  29. Du, B.; Han, C.; Li, Z.; Han, C.; Li, J.; Xiao, M.; Yang, Z. Effect of polarity-reversal voltage on charge accumulation and carrier mobility in silicone rubber/silicon carbide composites. IET Sci. Meas. Technol. 2021, 15, 184–192. [Google Scholar] [CrossRef]
  30. Bokobza, L. Some applications of vibrational spectroscopy for the analysis of polymers and polymer composites. Polymers 2019, 11, 1159. [Google Scholar] [CrossRef] [PubMed]
  31. Coates, J. Interpretation of infrared spectra, a practical approach. Encycl. Anal. Chem. 2000, 12, 10815–10837. [Google Scholar]
  32. Zhang, Z.; Wang, B.; Li, J. Effect of the synthesis initiation mode on the structure and properties of sulfadiazine molecularly imprinted polymers. J. Appl. Polym. Sci. 2011, 119, 3189–3198. [Google Scholar] [CrossRef]
  33. Liang, B.; Lan, R.; Zang, Q.; Liu, Z.; Tian, L.; Wang, Z.; Li, G. Influence of thermal aging on dielectric properties of high voltage cable insulation layer. Coatings 2023, 13, 527. [Google Scholar] [CrossRef]
  34. Gao, J.-G.; Liu, L.-W.; Sun, W.-F. Dielectric characteristics of crosslinked polyethylene modified by grafting polar-group molecules. Polymers 2023, 15, 231. [Google Scholar] [CrossRef]
Figure 1. Cable configuration and preparation steps: (a) schematic diagram of a typical single-core low-voltage cable showing the copper conductor, insulation, and aluminium-wrapped outer electrode; (b) XLPO-insulated cable (1 × 4 mm2) prepared with a 10 cm insulation exposure wrapped with aluminium tape; (c) XLPE-insulated cable (1 × 4 mm2) with the same preparation method; (d) PVC-insulated cable (1 × 10 mm2) prepared similarly, with colored marks for traceability. All samples are 40 cm in total length. Scale bars = 1 cm.
Energies 18 05404 g001
Figure 2. Schematic diagram of the insulation resistance test setup. A test voltage of ±1 kV DC is applied to a 40 cm-long cable sample via a Kikusui TOS 9311. The resulting leakage current is converted into a voltage drop across a precision standard resistor (10 MΩ, 100 MΩ), which is then measured using a Hioki DT4281 multimeter. Temperature and humidity are monitored via a Hioki LR 5001. The data are logged in real time for subsequent IR and PDC analysis.
Energies 18 05404 g002
Figure 3. Sample preparation workflow for FTIR analysis of XLPO, XLPE, and PVC insulation. Each material was cut, cleaned, and stored under controlled humidity using silica beads and monitored by a HIOKI LR5001 data logger before being analyzed using FTIR spectroscopy.
Energies 18 05404 g003
Figure 4. Leakage current of virgin under ±1 kV DC stress (XLPO).
Energies 18 05404 g004
Figure 5. Insulation resistance characteristics of under ±1 kV DC stress (XLPO).
Energies 18 05404 g005
Figure 6. Leakage current of virgin under ±1 kV DC stress (XLPE).
Energies 18 05404 g006
Figure 7. Insulation resistance characteristics of under ±1 kV DC stress (XLPE).
Energies 18 05404 g007
Figure 8. Leakage current of virgin under ±1 kV DC stress (PVC).
Energies 18 05404 g008
Figure 9. Insulation resistance characteristics of under ±1 kV DC stress (PVC).
Energies 18 05404 g009
Figure 10. Electric field distribution in the XLPO-insulated HVDC cable.
Energies 18 05404 g010
Figure 11. Electric field profile along the radial direction for XLPO.
Energies 18 05404 g011
Figure 12. Electric field distribution in the XLPE-insulated HVDC cable.
Energies 18 05404 g012
Figure 13. Electric field profile along the radial direction for XLPE.
Energies 18 05404 g013
Figure 14. Electric field distribution in the PVC-insulated HVDC cable.
Energies 18 05404 g014
Figure 15. Electric field profile along the radial direction for PVC.
Energies 18 05404 g015
Figure 16. Cable with XLPO insulation and XLPO–copolymer sheath, featuring a tinned copper conductor.
Energies 18 05404 g016
Figure 17. FTIR spectrum of XLPO/XLPO–C insulation, showing the typical absorption bands of cross-linked polyolefin.
Energies 18 05404 g017
Figure 18. Cable with XLPE insulation using a PVC sheath and an annealed copper conductor.
Energies 18 05404 g018
Figure 19. FTIR spectrum of the XLPE/PVC structure, highlighting polyethylene and vinyl chloride group peaks.
Energies 18 05404 g019
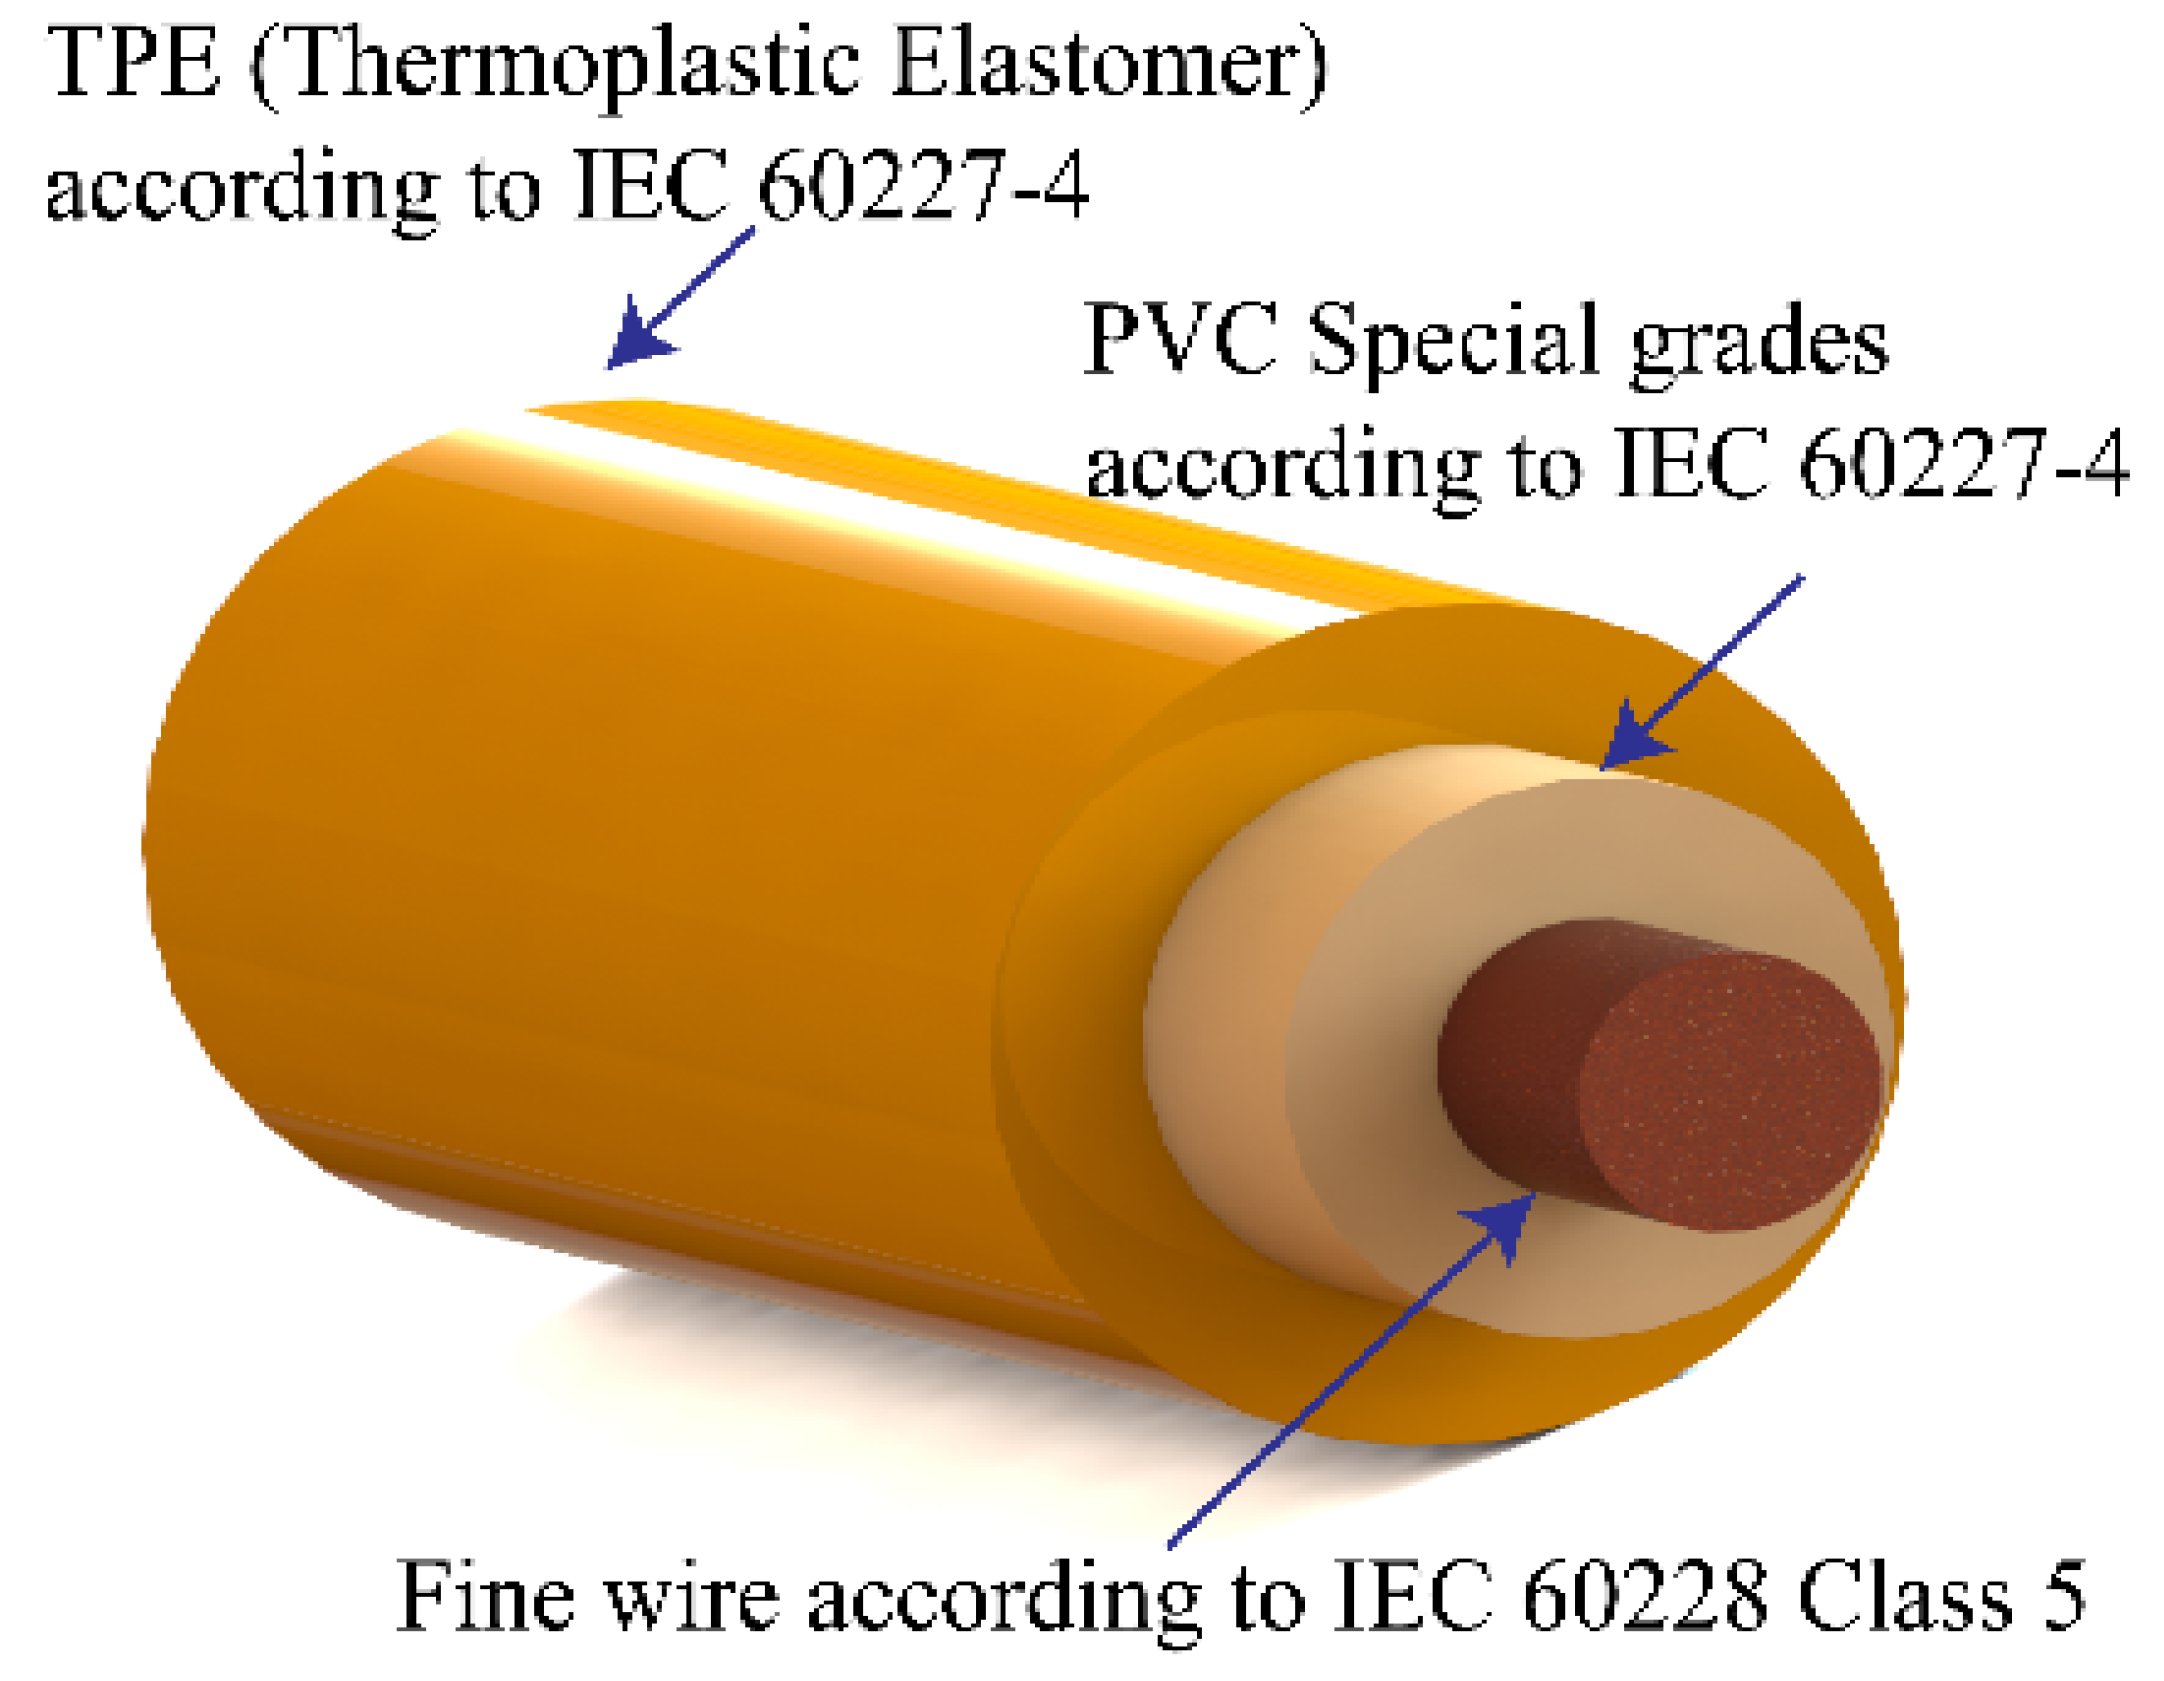
Figure 20. Cable with PVC insulation using a special-grade TPE sheath, complying with IEC 60227-4.
Energies 18 05404 g020
Figure 21. FTIR spectrum of the PVC/TPE system, indicating the complex functional group composition.
Energies 18 05404 g021
Table 1. Polarity-dependent loss index (LI) of virgin PV cable insulations (XLPO, XLPE, and PVC).
MaterialPolarityLI (=Idischarge/Icharge)
XLPO+DC1.36
XLPO−DC1.53
XLPE+DC2.63
XLPE−DC1.46
PVC+DC0.98
PVC−DC1.45
Table 2. FTIR bands (ATR-FTIR, 4000–500 cm−1, 4 cm−1 resolution) and the corresponding assignments for XLPO, XLPE, and PVC.
MaterialWavenumber (cm−1)Band/Assignment
XLPO2920C–H asymmetric stretching (CH2, CH3)
XLPO2850C–H symmetric stretching (CH2)
XLPO1747Ester carbonyl (C=O)
XLPO1460CH2 bending (scissoring)
XLPO1375CH3 bending
XLPO1233C–O–C stretching; PO2 (additives)
XLPO720CH2 rocking
XLPE2916C–H stretching (asym.)
XLPE2848C–H stretching (sym.)
XLPE1472CH2 scissoring
XLPE1462CH2 scissoring
XLPE720CH2 rocking
XLPE730CH2 rocking
PVC2910C–H stretching
PVC2850C–H stretching
PVC1430CH2 bending
PVC1330CH wagging/twisting
PVC1250CH wagging/twisting
PVC960C–C stretching
PVC610–700C–Cl stretching (multiple)
PVC≈1730 (weak)C=O (plasticizer)
Disclaimer/Publisher’s Note: The statements, opinions and data contained in all publications are solely those of the individual author(s) and contributor(s) and not of MDPI and/or the editor(s). MDPI and/or the editor(s) disclaim responsibility for any injury to people or property resulting from any ideas, methods, instructions or products referred to in the content.