Abstract
Corn stover and plastic waste, severely underutilized feedstocks generated in the U.S., could be co-pelletized to produce fuel for cement production. High-density polyethylene bags (0–25% in 5% increments, dry basis) and corn stover were co-pelletized using a flat ring pellet mill with die diameters of 6 and 8 mm. Physical and chemical properties were assessed to determine pellet quality. These results informed techno-economic and life cycle greenhouse gas emissions (GHGe) analyses for a Midwestern plant producing 400,000 metric tons of pellets annually. The system boundary included feedstock acquisition at the pellet plant, size reduction, co-pelletization, and transportation of the pellets to the cement plant by rail. Total resource requirements in terms of raw materials, labor, fuel, equipment, the facility, and utilities were estimated. It was determined that the pellets would be delivered to the cement plant at USD 112.4–138.6/t pellets. The life cycle analysis estimated a total GHGe of 1621.1–1753.1 kg CO2e/t pellets associated with the pellet production, transportation, and combustion. The results suggest that substituting 25% of the thermal energy requirement of a cement plant with a 1.1 million t clinker annual production capacity with plastic–stover pellets would reduce the GHGe by 2.8% compared to 100% of the total energy requirement supplied by coal.
1. Introduction
U.S. plastic waste generation has more than doubled from 15.5 million t in 1990 to 32.4 million t in 2018 [1]. However, less than 25% of this plastic waste was recycled or combusted for energy recovery in 2018: 24.5 million t of energy-dense plastic material was sent to landfills [1]. Concurrently, corn is the most abundantly produced crop in the US and over 379 million t of corn stover was produced in the U.S. in 2024 [2]. Most of this stover remained in the field. Retaining excess stover in the field can reduce grain yield by harboring pests, interfering with planting and stand establishment, and reducing nitrogen availability due to stover decomposition [3,4].
Corn stover without upgrading is inefficient to handle and transport for energy use due to low bulk and energy density. A viable upgrading option is to pelletize it, which can improve material handling and combustion properties compared to raw corn stover. Pelletizing is the most common method used to produce solid fuels with wood, forest residues, and sawdust as feedstocks [5,6]. Recent focus has shifted toward applying this knowledge and technology towards pelletizing novel biomass feedstocks and abundantly available residues in the U.S. such as corn stover, miscanthus, and switchgrass [7,8,9,10,11].
For stover pellets to be suitable as a directly combusted fuel in waste-to-energy (WtE) applications, the heating value needs to be improved, and the ash content needs to be reduced or standardized. Stover pellets have a low heating value of 16.5–20 MJ/kg and highly variable ash content of 4.2–23% due to their varying harvest methods and field conditions [12,13]. This could be achieved by pelletizing stover and plastic waste, given the higher heating value of plastic. However, limited studies have been published on the densification of biomass residue and plastic waste. Previous research has characterized the densification of plastic wastes such as high-density polyethylene (HDPE), linear low-density polyethylene (LLDPE), and polyethylene terephthalate (PET) with biomass residues including beech sawdust, corn stover, and torrefied wheat and barley, using single-pellet presses and briquetting [14,15,16,17]. These studies found that pelleting of biomass and plastic improved combustion properties and mechanical strength. However, the use of single pellet presses and briquetting would not be conducted at an industrial scale; this study seeks to build upon the knowledge base of co-pelletizing biomass and plastic by demonstrating the co-pelletization of stover and plastic waste at the laboratory scale with a flat mill die as a steppingstone to industrial application. While remaining work will be required to bring this technology from the laboratory to industrial scale, these results will then inform techno-economic and life cycle greenhouse gas emissions (GHGe) feasibility analyses of stover–plastic pellets as fuel in a suitable industry.
The cement industry was identified as a possible candidate for the utilization of stover–plastic pellets, as the combustion of wastes such as scrap tires, biomass, and plastics is already a standard practice [18,19]. The cement industry is particularly well suited for the use of waste-derived alternative fuel resources (AFR) due to its high energy demand, tolerance for diverse materials, minimal fuel processing requirements, and ability to incorporate residual ash after combustion in the clinker. In recent years, AFR use in the cement industry has been increasing, contributing to 16% of the energy use [20].
AFR has been shown to have environmental and economic benefits for cement producers. The use of AFR in cement kilns in place of coal can reduce 2–65% of the GHGe at the thermal substitution rates of 5–75% [21,22,23,24], which is significant considering that the cement industry is responsible for approximately 5–8% of global CO2 emissions [21,25]. Waste-derived fuels can also offer cost savings for cement production by providing an alternative for energy that is currently obtained from coal and a revenue stream through tipping fees paid by waste generators, such as material recovery facilities (MRFs) [19,21]. MRFs never achieve a 100% recovery/recycling rate, as 2–30% of the material is landfilled or incinerated [24,26]. Unlike other WtE operations that require landfilling of the residual ash after combustion, cement producers incorporate the residual ash in the clinker, the primary component of cement. This can result in significant savings for cement producers, depending on the location, as areas with high population density and less landfill land availability such as the northeastern states have average tipping fees of USD 93/t, while the fees are lower at 47.6 USD/t (USD 2023) in the Southeast [27].
For an AFR to be applied in the cement industry, its use should be economically viable for stakeholders. One study [28] presented a case for co-located landfill, material recovery, and solid recovered fuel (SRF) facilities and found that SRF could be competitive with coal and natural gas at USD 0.3–1.8/GJ. This value was heavily influenced by geographic region due to the differences in tipping fees for residual waste disposal and electricity and transportation costs across the geographic regions. However, this study does not provide information on capital investment or operating expenses. Also relevant are studies examining the co-firing of biomass in baled, chopped, or pellet forms with conventional fuels such as coal and natural gas for a combined heat and power system for a corn ethanol plant [29,30]. These studies estimated the total baled, chopped, or pelleted corn stover costs to the burner to be USD 73–86/t. However, they are significantly lower than estimates of USD 98–152.3/dry t for baled corn stover to biorefinery gate plus the additional expense of USD 46.2–49.1/t pellets for pelletizing [31,32]. Thus, there is opportunity for this study to add to the body of knowledge by providing information on capital investment and operating expenses for the production of waste-derived fuel. Moreso, co-pelletizing corn stover with plastic waste and the evaluation of its techno-economic feasibility to reflect current costs and associated life cycle GHGe when used as AFR in a cement plant has not been performed before.
2. Materials and Methods
2.1. Experimental Design
Co-pelletization of corn stover and non-recyclable plastic waste was demonstrated. The experiment was conducted implementing a full factorial design with two factors: die diameter with two levels (6 and 8 mm), consistent with typical fuel pellet diameters [33,34,35], and plastic content of the blended feedstock with six levels, 0–25% HDPE in 5% increments on a dry basis blended with corn stover. Plastic fraction was capped at 25%, as prework found that quality pellets could not be produced at greater levels. Each treatment combination was replicated across three pelleting runs, with three sub-samples analyzed per run for pellet mechanical property analyses. Composite samples were prepared for ultimate and proximate analyses for each plastic x die diameter combination by blending a total of 5–8 g of pellets from each run to form a composite sample of ~21 g. Ultimate analysis and determination of heating value was carried out in duplicate for each composite sample, and only one replication per treatment was completed for proximate analysis.
Pellet properties were statistically analyzed using Minitab 18 (Minitab Statistical Software, State College, PA, USA, 2021) at a 5% significance level with Tukey’s test for mean comparisons.
2.2. Experimental Procedure
2.2.1. Feedstock Size Reduction
Feedstock particle size plays a critical role in pellet formation. Finer particles generally yield more durable pellets but can increase grinding energy demands and may clog the die if too fine (<0.5 mm) [36,37,38]. Conversely, coarser particles also risk die blockage and tend to produce less durable pellets. In this study, corn stover was ground using a hammermill (Model 10HMDB, C.S. Bell Co., Tiffin, OH, USA) with a 3 mm screen. The plastic component—high-density polyethylene (HDPE) retail bags (0.5 mil, Uline)—was processed using a knife mill (Laboratory Mill Model 4, Thomas Wiley, NJ, USA) with a 1 mm screen.
2.2.2. Feedstock Conditioning
Feedstock temperature and moisture content are critical for inducing glass transition, which enhances flowability and pellet durability, often visible as a glossy pellet surface [36,37]. This transition generally occurs between 50 and 113 °C for corn stover and switchgrass [39] and improves the hydrophobicity and storability of the pellets. Typical pelleting is in the range of 30–130 °C, which can be achieved by steaming the feedstock or heating the hopper and the die. However, preheating the feedstock has been deemed unnecessary in some studies, as heat is also generated during pelleting due to friction between the feedstock and the die [34,40,41,42,43] and reaching stable temperatures of 80–130 °C [8,40,43]. Moisture creates cohesive forces between particles [39] and binds the material together during pelleting. However, the moisture content needs to be optimal as pellets will not form with overly dry feedstock [8], and excess moisture content can decrease the flowability of the material by clogging the die. For this experiment, 1.5 kg (wet basis) of the correct feedstock blends were produced by mixing the ground plastic (0% moisture) and corn stover (3–12% initial moisture) in 5-gallon plastic buckets. Water was added to increase the overall moisture content of the feedstock to 20%, and the sealed buckets were stored overnight at room temperature to allow the moisture content to stabilize [8,16]. This moisture content was selected to be consistent with stover as it might be delivered from field to a pelletization plant [31]. Additionally, pelletizing at this moisture content would suggest the possibility of eliminating standard biomass pelletizing processes—feedstock drying and steam conditioning.
2.2.3. Co-Pelletization
A flat die pellet mill (KL260B/C Pellet Machine, Yantai, China) with a throughput capacity of 400–600 kg/h was used for pelleting. Die temperature was uncontrolled and reached 50 °C when measured using an infrared thermal camera (FLIR E6390, Teledyne FLIR, Wilsonville, OR, USA). Feedstock input rate was manually controlled to avoid overfeeding and clogging the die. The die speed was set to 189 rpm (peripheral pellet speed: 158 m/min) for the 6 mm die and 230 rpm (peripheral speed: 193 m/min) for the 8 mm die and was adjusted, if needed, mid-run to prevent caking and overheating of the feedstock. For feedstock pelleted at room temperature, the die surface temperatures at the end of the run were measured and were 56–100 °C, indicating that frictional heat generated during pelleting was sufficient to reach the stover glass transition temperature. Pellets are usually allowed to cool after exiting the mill to enhance pellet durability and strength. Therefore, pellets were completely air cooled and stored for 7–18 days before further property characterization for this study.
2.2.4. Property Characterization
Quality standards defined by The Pellet Fuels Institute (PFI), a North American trade association for wood pellets, were used to evaluate the characteristics of the pellets in this study [44]. These standards provide a starting point to assess the basic physical and chemical properties of stover–plastic pellets as they impact material handling, environmental control, combustion, and emissions. Durability, bulk and particle density, moisture content, heating value, and elemental composition were analyzed for all treatment combinations.
Durability index refers to resistance to breakage and loss of fines from the pellets. Excessive pellet fragmentation and fines create environmental control and safety issues at the production facility during manufacturing, transfers, and loading/unloading, as well as in transportation to the end user and at the end user’s facility [11,45]. Durability testing for these pellets was adapted from ISO 556:1980 to measure the mechanical strength of coke [46,47,48,49]. Tumbling drums with inner diameter of 94 mm were equipped with inner opposite baffles of 77 × 23 mm to represent the standard tumblers used for durability testing. A total of 40 pellets from each run were tumbled for 3000 rotations at 33 rpm. The contents of the tumbler were then emptied onto a 2 mm sieve to separate the fines. Durability index (Equation (1)) was calculated as the ratio of pellet mass larger than 2 mm to the initial pellet mass.
Pellet bulk density impacts logistics metrics, process capacity, and system operations for end users. Low bulk density can result in exceeding volumetric capacity before the weight limit of railcars and trucks used for transportation. For industrial end users that accept diverse alternative waste-derived fuels, differences in fuel bulk density can negatively affect system operation due to variable material flow rates. Bulk density was measured according to an ASABE standard, i.e., ASAE S269.5 [50], using a 250 mL container with length–diameter ratio of 1.36. The container was filled with pellets, leveled, tapped 6 times on the counter, and then any gaps were filled again, and the weight of the pellets were recorded. Unit density of the individual pellets was measured to assess uniformity of co-pelletization. For unit density, 10 pellets were examined per run; pellet ends were smoothed with a file, the dimensions of the pellets were measured with a digital dial caliper, and their weights were recorded following ASAE S269.5 [50].
Heating value is a defining factor for fuel quality, as more thermal energy is available during combustion from the pellets with higher heating value. Lower heating value (LHV) for the pellets produced for this study was determined in reference to ASTM standard D2015-96 [51] for verification using oxygen bomb calorimeter (Model C2000 isothermal calorimeter, IKA Works, Inc., Wilmington, NC, USA).
Ultimate analysis was performed with the ‘Vario MICRO cube’ elemental analysis system (Elementar Americas Inc., New York, NY, USA) to evaluate the carbon, hydrogen, oxygen, sulfur, and nitrogen contents of the pellets. This analysis can provide information about the heating value and potential emissions when combusted.
2.3. Techno-Economic Analysis (TEA) Methodology
2.3.1. System Overview
The pellet plant modeled for this study was considered to have a production capacity of 400,000 t pellets (wet basis)/y consistent with large pellet production capacities of >272,155 t/y for existing Southeastern U.S. pellet mills [5] and within the range of capacities considered for other TEAs of stover pelletization [29,30,32]. This pellet plant is considered to supply the pellets to multiple cement operations with the goal of substituting up to 25% of their thermal requirement. The cement plants considered are assumed to already be adapted to receive diverse solid AFRs; thus, the costs to retrofit are excluded from this model. Midwestern U.S. was the geographical region considered in this study, as this region grows the most corn [52], and corn stover, which would be required in large quantities, would be more readily available in this region. There are also MRFs scattered throughout the region that process comingled residential waste, which could supply non-recyclable plastic for co-pelletization [53]. This facility was considered to produce 6 mm diameter pellets composed of 75% corn stover and 25% non-recyclable plastic on a dry basis; this pelleting ratio was selected to maximize plastic fraction to reduce stover costs and improve heating value and produce pellets that could meet industrial standards for wood pellets, as suggested by our experimental results (Section 3.1). Although incorporating more plastic into the pellets would improve the heating value, this was the maximum amount that could be incorporated based on our experiments while still forming pellets and meeting durability standards.
The system boundary (Figure 1) for this study included the acquisition of corn stover and baled non-recyclable plastic at the pellet plant gate, size reduction, conditioning, pelleting, and rail transportation of the pellets to the cement plant. Results are presented in “t/pellets”, referring to wet basis (3–9% moisture content) unless otherwise specified; the moisture content was modeled as a range to reflect realistic operating conditions. Pellets with a moisture content greater than 9% would not be shipped to customers, and it is assumed that moisture content could vary during storage, as is consistent with our laboratory observations.
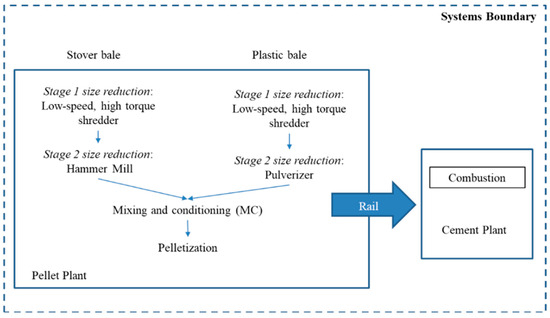
Figure 1.
System boundary considered for the analyses.
2.3.2. Unit Operations Considered for Modeling
Feedstock Acquisition and Handling
Corn stover bales arriving at the pellet plant gate were assumed to possess 10–30% moisture content and be priced at USD 98–152.3/dry t [31,32,54]. GHGe associated with stover harvest, storage, fertilizer replacement, and transport logistics were considered.
Plastics considered for co-pelletization were rejected baled plastic waste from MRFs and were considered to be delivered to the pellet plant for a tipping fee of USD 47.1/t, consistent with industry practice for municipal solid waste (MSW) and MRF residue tipping fees [21,28,55]. This would generate revenue and offset operational costs. The analysis also considered operations such as separating plastic waste from the mixed waste stream, baling, and transportation of the bales to the pellet plant, all of which would not be necessary if the plastic waste was simply landfilled, as mixed waste streaming from MRFs is usually transported in bulk to the landfill. Differences in transporting loosely packed and baled plastic waste were considered for this study. It was assumed that a waste collection vehicle with 13.6 t/load capacity would transfer the loosely packed bulk MRF residue to a landfill, while a semi-truck/tractor trailer (Class 8) with 20.9 t/load capacity would transfer baled plastic residue to the pellet plant for the same transportation distance of 81 km [24,56]. The average reported fuel efficiency for refuse trucks that consider stop-and-go drive cycles is 1.1 km/L [57]; however, as the MRF residue would be transferred directly to the landfill in this study, the fuel efficiency was assumed to be 2.2 km/L, the same as the average fuel economy for Class 8 trucks used to transfer plastic bales to the pellet plant [57]. Squeeze loaders were considered for handling the plastic waste and stover bales arriving at the pellet plant gate, including offloading from the delivery trucks and feeding into shredders for Stage 1 size reduction [31].
Feedstock Preparation
Multi-stage size reduction is a standard practice for biomass preprocessing due to their bulky nature and fibrous properties [32,58,59]. Low-speed, high-torque (LSHT) dual shear shredders were considered for initial size reduction, as they are commonly used for MSW shredding to reduce the particle size of the material due to its capacity to handle bulky and tough material at low power consumption with low fire risk [60]. This reduced the size of the feedstock to 25.4–50.8 mm, which is similar to the output of a tub grinder that is used for biomass bale size reduction [61]. A 149–186 kW LSHT shredder with throughput capacity of 10–15 t/h for initial size reduction was selected for primary plastic size reduction [62], and a 597 kW shredder with 36–45 t/h capacity was selected for primary stover size reduction of 42–45 t stover/h in this system [62].
Based on our experimental runs, size reduction using a 3.2 mm screen produced durable 6 mm and 8 mm diameter plastic–stover pellets, and further reduction was not necessary. Thus, a hammermill with a screen size of 3 mm was considered for the second stage size reduction in corn stover, as hammermills are commonly used for biomass size reduction [59]. Hammermilling stover at 30% moisture in a 2 t/h hammermill with a 4.8 mm screen required 107 kWh/t [32]. Thus, a 186 kW hammermill with capacity 30–300 t/h was selected to process 42–45 t/h of stover [63]. For secondary stage particle size reduction in the plastics from 25.4–50.8 mm to 1 mm, multiple pulverizers with a throughput of 0.75–1.2 t/h and power requirement of 90–160 kW were considered [64].
Stover is usually pelletized at 15–30% moisture content [8,32], which is common harvest moisture, eliminating the need for addition of water that is required for the bonding between the particles during the pelleting process. The moisture content of stover used for this study was considered to be in the suitable pelletizing range and thus would not require a mixing operation if the feedstock was just corn stover. However, the mixing operation was necessary in this study to homogenize the plastic–stover feedstock as this can affect the bonding between the particles and ultimately the durability of the pellets. An 18.6 kW ribbon mixer [65] was considered to mix the feedstock blend for 5 min and would be fed continuously to produce 57 t/h of blended feedstock.
Co-Pelletization
A ring die pellet mill was selected because ring die pellet mills require less energy and are more commonly used in industrial pellet plants [8]. Recent advances in pelleting have historically increased the capacity of pellet mills from 0.2–7.2 t/h [32,54] to 80 t/h with a single unit now [66]. A 60 t/h pellet mill with a 470–585 kW motor [66] was selected for this system. Additional feedstock preheating before pelleting was not considered for this system, as industrial die temperatures can reach 80–130 °C, which is sufficiently over the stover glass transition [8,39,43]. Frictional heating and cooling can result in the removal of 5–10% moisture of the feedstock [32] during pelletizing and was considered in this study. A 3.4 kW crossflow pellet cooler was considered to cool the pellets to approximately room temperature [67]. Based on the experimental results, it was assumed that the pellets continued to dry to <9% moisture in open storage for 7–18 days prior to being shipped to the cement plant.
Pellet Transportation
Pellets in bulk are commonly transported by rail, truck, or ship [68,69]. While 56–75% of the pellets produced in the U.S. are exported primarily to Europe [6], domestic distribution for distances greater than 100 km is mostly performed by rail due to their low costs and carbon dioxide emissions [68,69]. Thus, pellet delivery by rail was considered, as the cement plant was estimated to be 160.9 km (100 mi) away. The transportation cost was estimated to be USD 0.06 t−1 km−1 using Equation (2) based on the wood pellet shipping rate from the literature [68].
2.3.3. Modeling Overview
A spreadsheet-based model was developed to evaluate the techno-economic feasibility and GHGe of the plastic–stover co-pelletization system considered in this study (Figure 1). The pelleting plant was considered to start operation in 2024, with 330 working days per year to provide enough downtime for maintenance. The plant service life was selected as 15 years due to the heavy wear and tear associated with feedstock processing and pelleting. Input data for the model (Table 1) were obtained from co-pelletization experiments, the literature, and manufacturer technical data. Material, energy and labor requirements, capital and operating costs, and GHGe were estimated per t of pellets produced. Sensitivity analysis was conducted to show the effect of variabilities in input parameters for model outputs, i.e., the operational cost and the GHGe. It was conducted through Monte Carlo simulations (10,000 trials) with Microsoft Excel (Microsoft, Redmond, WA, USA) and Crystal Ball (Oracle, Austin, TX, USA) using model inputs as probability distribution functions.

Table 1.
Process parameters and distributions considered for the model.
Table 1.
Process parameters and distributions considered for the model.
| Values | ||||
|---|---|---|---|---|
| System Process Parameters | Baseline | Std. Deviation | Minimum | Maximum |
| Pellet parameters | ||||
| 1 Pellet lower heating value (MJ/kg) | 21.2 | 0.2 | - | - |
| 1 Plastic–stover pellet bulk density (kg/m3) | 503.7 | 46.5 | - | - |
| 1 Pellet C content (%) | 46.3 | 0.03 | - | - |
| 1 Fixed carbon (%), dry basis | 10 | - | - | - |
| 1 Moisture (%) | 7 | - | 3 | 9 |
| Feedstock parameters | ||||
| Stover moisture content (%) [31] | 20 | - | 10 | 30 |
| Dry matter loss (%) [31] | 6.5 | 1.5 | - | - |
| Plastic baling factors | ||||
| Separating plastic waste (kWh/t waste) [60,70] | 9.1 | - | 4.7 | 13.8 |
| Baling plastic energy (kWh/t) [71] | 29.9 | - | - | - |
| Plastic bale weight (kg/bale) [72] | 1300 | - | 1200 | 1400 |
| 2 Plastic baling wire (kg/bale) | 0.18 | - | - | - |
| Refuse truck capacity [56] | 13.6 | - | - | - |
| Class 8 truck capacity (t/truck) [73] | 20.9 | - | - | - |
| Class 8 truck fuel consumption (km/L) [57,74] | 2.25 | - | 2.1 | 3.4 |
| Fuel and power requirements | ||||
| Squeeze loader diesel consumption (L/h) [31] | 20.8 | 5.7 | - | - |
| Plastic primary shredder (kW) [62] | 167.5 | - | 149 | 186 |
| Stover primary shredder (kW) [62] | 597 | |||
| Stover hammermill (kW) [63] | 186 | - | - | - |
| Plastic pulverizer (kW) [64] | 125 | - | 90 | 160 |
| Mixer (kW) [65] | 18.6 | - | - | - |
| Pellet mill (kW) [66] | 532 | - | 470 | 585 |
| Cooler (kW) [67] | 3.4 | - | - | - |
| Transport parameters | ||||
| Rail car volume (m3) [75] | 138.8 | - | 130.3 | 147.2 |
| Wood pellet bulk density (kg/m3) [44] | 42 | - | 38 | 46 |
| Train fuel consumption (L/t km) [76] | 0.005 | - | - | - |
1 Experimental data; 2 polypropylene, ULINE.
2.3.4. Economic and Financial Considerations
The total capital investment (TCI) was calculated as the sum of direct fixed capital (capital equipment purchase and installation cost), start-up cost (one-time expenses associated with opening a facility), and 30-day working capital needed to cover 30 days of labor, raw material, and utility costs [77]. The cost of the different inputs including the raw materials, utilities, and fuel and their distributions were obtained from the literature and are summarized in Table 2.
Table 2.
Economic analysis parameters and distributions considered in the model.
Table 2.
Economic analysis parameters and distributions considered in the model.
| Parameters | Baseline | Minimum | Maximum |
|---|---|---|---|
| Financial Analysis year | |||
| 2024 | |||
| Project life (years) | 15 | ||
| Discount rate (%) | 7 | ||
| Annual operational time (h) | 7884 | ||
| Installation factor [78] | 3.1 | ||
| Income tax rate (%) | 35 | ||
| Maintenance (%) | 0.1–0.4 | ||
| Start-up cost (%) | 5 | ||
| Operating costs | |||
| Raw materials | |||
| Stover (USD/dry t stover) [31] | 121.9 | 98.9 | 152.3 |
| Tipping fee credit (USD t/plastic) [21] | 47 | - | - |
| Utilities | |||
| Electricity (USD/kWh) [79] | 0.075 | 0.065 | 0.084 |
| Diesel (USD/L) [80] | 0.41 | 0.27 | 0.41 |
| Labor | |||
| Operators per shift | 3 | ||
| Operator hourly rate (USD/h) | 18.3 | ||
| Supervisors per shift | 1 | ||
| Supervisor, annual salary (USD/y) | 67,100 | ||
| Benefits (%) | 15 |
Minimum selling price (MSP) of the pellets was determined at 10% internal rate of return (IRR) used for other biomass conversion TEAs [81,82,83]. Cost per GJ of energy produced was calculated for direct comparison with coal as fuel for clinker production. Total delivered price of the pellets at the cement plant was estimated as the sum of MSP and transportation cost from the pellet to the cement plant.
2.3.5. Inventory for GHG Emissions
Coal is the primary fuel used in cement production and contributed to 45% of the energy requirement for cement production in 2017 [84]. For this study, a 25% pellet thermal substitution rate (TSR) was assumed and compared to the baseline of 100% coal to supply thermal energy for clinker production, the primary component of cement. The emissions associated with coal mining and logistics and combustion were 128 kg CO2/t coal [85] and 2176 kg CO2/t coal, respectively [86]. For the pellets, total and fixed carbon from ultimate and proximate analyses were used to estimate plastic–stover pellet combustion emissions based on the experimental results. All emissions were converted to CO2 emissions by using the global warming potential (GWP) of 28 and 265 kg CO2 equivalent (kg CO2e)/kg for methane and nitrogen dioxide, respectively [86]. The emissions associated with different inputs used in the model are summarized in Table 3.
Nitrogen dioxide emissions are important when estimating the field emissions avoided due to stover removal. The nitrogen conversion parameters listed in Table 3 are default factors and have wide variations, as they are ranges developed from global data [87]. The soil carbon cycle is excluded from this analysis, as the credit is applied only if stover removal does not exceed thresholds reported to maintain soil carbon balance (5.25–12.50 t/ha) [88]; it is assumed the proposed operation could be met with current US corn production without removing stover beyond those thresholds [2].
Table 3.
GHGe parameters and distributions considered in the model.
Table 3.
GHGe parameters and distributions considered in the model.
| Values * | |||
|---|---|---|---|
| Parameters | Baseline | Minimum | Maximum |
| Nitrogen removed with stover (kg-N/t) [31] | 7.7 (0.3) | - | - |
| Stover emissions avoided [87] | |||
| N to N2O-N (kg/kg) | 0.01 | 0.003 | 0.03 |
| N to NH3-N (stover) (kg/kg) | 0.2 | 0.05 | 0.5 |
| NH3-N to NO-N (kg/kg) | 0.01 | 0.002 | 0.05 |
| N to NO3-N (kg/kg) | 0.3 | 0.1 | 0.8 |
| NO3-N to N2O-N (kg/kg) | 0.0075 | 0.0005 | 0.025 |
| Stover supply chain | |||
| Stover supply chain (kg CO2e/dry t) [4] | 95.2 | 80.1 | 114.7 |
| Utilities | |||
| Electricity (kg CO2/kWh) [86] | 0.5 | 0.3 | 0.8 |
| Diesel (kg CO2/L) [89] | 74.0 | - | - |
| Coal mining (kg CO2/t coal) [85] | 128.0 | - | - |
| Coal combustion emissions (kg CO2/t coal) [86] | 2303.9 | - | - |
| Plastic baling wire (kg CO2e/kg plastic) [90] | 4.4 | - | - |
| Mobile combustion emissions [89] | |||
| Locomotive (g CH4/L) | 0.21 | - | - |
| Locomotive (g N2O/L) | 0.07 | - | - |
| Medium- and heavy-duty vehicles (g CH4/km) | 0.006 | - | - |
| Medium- and heavy-duty vehicles (g N2O/km) | 0.03 | - | - |
| Industrial/Commercial equipment (g CH4/L) | 0.06 | - | - |
| Industrial/Commercial equipment (g N2O/L) | 0.1 | - | - |
| Clinker production | |||
| Annual average U.S. clinker capacity (million t/y) [91] | 1.1 | - | - |
| Clinker heating value (MJ/t) [84] | 4000 | 3200 | 7600 |
| Heating value, coal (MJ/kg) [86] | 23.36 | - | - |
* Normal distributions were used when applicable for data with average and standard deviations. Triangular distribution assumptions were selected for parameters where limited data was available.
3. Results
3.1. Co-Pelletization Results
The co-pelletization of stover–plastic pellets was successfully demonstrated (Figure 2). Initial moisture content of the pellets right after pelleting was 8.4–19.9%. These results indicate that drying or storage would be required in commercial-scale pelleting, as the initial moisture content of plastic–stover pellets exceeds the maximum limits for moisture content for utility and standard pellets (≤10%) and premium (≤8%) moisture [44]. The moisture content decreased to 2.5–5.6% at the time of analysis after 7–18 days of curing at ambient temperature. Ambient curing suggests that storage can reduce moisture without dedicated infrastructure.
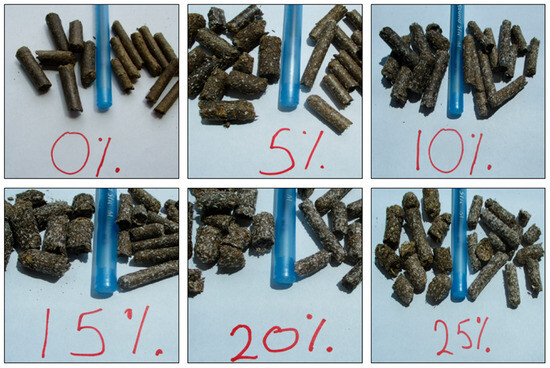
Figure 2.
Plastic–stover pellets. The 8 mm pellets are on the left and 6 mm pellets on the right for each plastic fraction.
Stover–plastic pellets (0–25% plastic content) had durability indices of 90.9–99.0% (Table 4). The lowest durability index of 90.9% was recorded for 8 mm pellets with 25% plastic content. The statistical analysis showed that the interaction effect of the die diameter and plastic fraction was significant at p < 0.05. These results suggested that increasing the plastic content decreased the durability of the pellets. The durability of 6 mm pellets decreased as the plastic fraction increased but remained above 95%, which is the minimum durability standard for standard and utility-grade pellets [44]. For 8 mm pellets, the results suggest that plastic incorporation beyond 15% interferes with the durability, as the durability of 20% and 25% plastic pellets decreased to 91.1% and 90.9%, respectively. This is most likely attributed to the larger diameter size, which exerted less pressure on the blend, producing less durable pellets.
Bulk density of the pellets was 417–638 kg/m3 and unit density was 839–1136 kg/m3 (Table 4). The minimum standard for wood pellet bulk density is 609 kg/m3 [44]; only 6 and 8 mm stover-only pellets met this standard. Unit density values (839–1136 kg/m3) suggest that the intrinsic material compaction was adequate, but inconsistencies in packing efficiency at the bulk level likely lowered the overall bulk density. Since bulk density directly affects transportation and storage economics, strategies such as optimizing the particle size distribution and applying higher compaction pressures with a smaller die diameter could be examined as a strategy to reduce costs. For certain industrial applications, such as the use of AFR in the cement industry, the bulk density of a single fuel source is less critical of a quality parameter, as cement manufacturers often accept a diverse range of solid fuels, including denser materials such as waste tires. The low- and high-density AFR will be mixed prior to combustion to create a more homogenous blend for stable kiln operation [18].
LHV of the plastic–stover pellets increased significantly with the increase in plastic content. This increase in the heating value as the plastic content increased was expected as the LHV of just corn stover is 15.9–16.8 MJ/kg [13,92,93] and the LHV of HDPE was found to be 34.1 MJ/kg [94]. This highlights a trade-off: increasing the plastic improves the energy quality but can reduce the durability and bulk density. Therefore, the optimal plastic fraction may depend on whether the application prioritizes energy content or the mechanical and logistical performance.
Ultimate analysis results are summarized in Table 4. Carbon content and hydrogen content increased with the increasing plastic content for both diameters, and the carbon content was higher in 6 mm than 8 mm diameter pellets. This was consistent given the chemical composition (ethylene monomers) of HDPE. Sulfur, oxygen, and nitrogen content decreased with the increase in plastic content for both diameters; these elements are contributed by the corn stover and thus decreased with the increasing plastic content in the pellets.
Table 4.
Physio-chemical pellet characterization.
Table 4.
Physio-chemical pellet characterization.
| Values * | |||||||
| Diameter (mm) | 0% | 5% | 10% | 15% | 20% | 25% | |
| Bulk density (kg/m3) | 6 | 638 (52.2) | 600.3 (33.4) | 613.5 (19.7) | 541.4 (21.1) | 528.1 (33.5) | 523.7 (54.2) |
| 8 | 633.4 (34) | 550.9 (79.8) | 551.1 (22.9) | 493.3 (17.9) | 475.8 (20.7) | 417.1 (67.6) | |
| Unit density (kg/m3) | 6 | 1090 (0.964) | 1096.7 (71.3) | 1135.7 (51.5) | 1011.0 (37.3)) | 1015.0 (33.7) | 1015.0 (27.2) |
| 8 | 1093 (15.3) | 1033.3 (140) | 963.3 (56.9) | 870.0 (60.8) | 840 (26.5) | 838.7 (68.2) | |
| Durability (%) | 6 | 99.04 (0.39) | 98.40 (0.97) | 98.24 (0.67) | 97.25 (0.91) | 97.36 (0.70) | 95.27 (1.48) |
| 8 | 98.15 (0.40) | 95.64 (2.52) | 96.19 (0.69) | 96.66 (1.40) | 91.10 (0.54) | 90.86 (0.30) | |
| LHV, Proximate, and Ultimate Analyses ** | |||||||
| Moisture content (%) | 6 | 5.91 | 4.39 | 4.88 | 5.74 | 5.17 | 5.01 |
| 8 | 5.25 | 5.20 | 5.30 | 5.09 | 4.76 | 4.76 | |
| LHV (MJ/kg) | 6 | 16.61 (0.29) | 15.89 (0.39) | 17.32 (0.27) | 18.56 (0.19) | 19.39 (0.057) | 21.23 (0.21) |
| 8 | 15.50 (0.071) | 15.62 (0.01) | 17.41 (0.27) | 18.93 (0.035) | 20.35 (0.31) | 20.34 (0.15) | |
| N (%) | 6 | 0.64 (0.0) | 0.545 (0.06) | 0.45 (0.12) | 0.5 (0.03) | 0.51 (0.02) | 0.49 (0.03) |
| 8 | 0.57 (0.02) | 0.64 (0.01) | 0.67 (0.04) | 0.71 (0.2) | 0.57 (0.03) | 0.62 (0.06) | |
| C (%) | 6 | 39.93 (0.08) | 42.37 (0.59) | 41.05 (3.46) | 44.06 (0.29) | 45.47 (0.93) | 46.33 (3.10) |
| 8 | 44.96 (0.07) | 43.71 (0.44) | 43.19 (0.47) | 46.06 (1.33) | 47.75 (0.88) | 49.95 (2.14) | |
| H (%) | 6 | 5.77 (0.02) | 6.47 (0.17) | 5.94 (1.06) | 6.83 (0.22) | 6.93 (0.37) | 7.04 (0.87) |
| 8 | 6.13 (0.44) | 6.32 (0.18) | 6.55 (0.29) | 6.88 (0.04) | 7.23 (0.02) | 7.65 (0.54) | |
| S (%) | 6 | 0.17 (0.0) | 0.11 (0.0) | 0.10 (0.04) |
0.0925 (0.0) | 0.06 (0.05) | 0.08 (0.01) |
| 8 | 0.32 (0.05) | 0.21 (0.02) | 0.09 (0.01) | 0.20 (0.02) | 0.15 (0.01) | 0.20 (0.01) | |
| O (%) | 6 | 53.49 (0.07) | 50.51 (0.36) | 52.46 (4.31) | 48.52 (0.48) | 46.91 (1.45) | 46.07 (4.01) |
| 8 | 48.032 (0.44) | 49.12 (0.26) | 49.51 (0.70) | 46.15 (1.34) | 44.3 (0.82) | 41.58 (2.64) | |
| Ash content (%) | 6 | 12.05 | 14.80 | 18.01 | 15.20 | 9.50 | 14.69 |
| 8 | 14.66 | 17.47 | 15.91 | 17.22 | 15.81 | 17.12 | |
| Volatile combustible matter (%) | 6 | 75.83 | 75.66 | 74.52 | 75.68 | 74.58 | 75.84 |
| 8 | 72.03 | 67.42 | 68.52 | 75.83 | 76.58 | 75.63 | |
| Fixed carbon (%) | 6 | 6.21 | 5.15 | 2.59 | 3.38 | 10.85 | 4.46 |
| 8 | 8.06 | 9.91 | 10.27 | 1.86 | 2.85 | 2.49 | |
* Mean (standard deviation); ** LHV, proximate, and ultimate analyses determined at corresponding moisture content.
3.2. Modeling Results
3.2.1. Materials Requirements
For the plastic–stover co-pelletization plant considered in this study, producing pellets with 25% plastic at a 6 mm diameter and at a 3–9% moisture content required 273,000–291,000 dry t/y of stover and 91,000–97,000 t/y of plastic waste. Energy requirements are summarized in Table 5.
Table 5.
Co-pelletization energy requirements.
3.2.2. Utilities and Fuel Requirements
The total energy requirement for pellet production at this capacity was 151.7 kWh/t pellets of electricity and 1.3 L diesel/t pellets produced (Table 5). This is within the range (100–200 kWh/t pellets) of energy consumption required for biomass pelletization [95] but greater than the 65.3–96.2 kWh/t required to produce solid recovered fuel (SRF) pellets from industrial wastes [28]. However, the feedstocks in our study were reduced to a much finer size to produce a 6 mm diameter pellet, as opposed to a 31.75 mm diameter [28]. Feedstock size reduction had the highest electrical requirement, with the primary stage of stover size reduction being the most energy intensive operation of all, requiring 63% of the electrical energy requirement. This is due to the high volume of feedstock processed and the consequent energy needed to operate equipment of that capacity.
3.2.3. Operating Expenses
Operating expenses are presented in Figure 3. Tipping fees (USD 4.4 M/y) from plastic waste reduced some expenses, but stover costs still contributed 89.0–90.2% of the operating costs, as the per unit feedstock cost is unaffected by the economy of scale. Other studies have found that feedstock cost can make up 40–50% of the total operating cost for biomass plants [96].
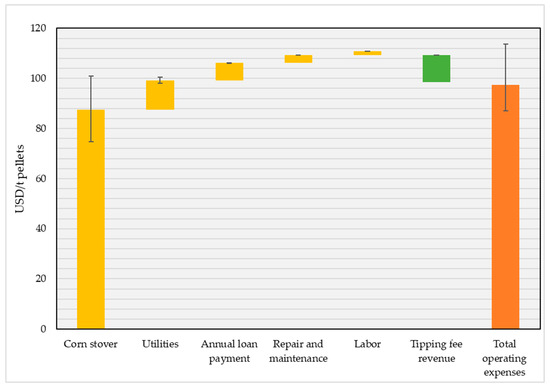
Figure 3.
Breakdown of operating expenses.
3.2.4. Financial Results
Key financial results are summarized in Table 6. The MSP was USD 112.1 (central range (CR): USD 99.5–125.7)/t pellets. The total delivered price (TDP) was estimated as the sum of the MSP of the pellets and the transportation cost of pellets, USD 13/t pellets, from the pellet plant to the cement plant 160.9 km (100 miles) apart. In comparison to conventional fuels, the TDP of the plastic–stover pellets was estimated to be USD 5.3–6.8/GJ, which is approximately double the delivered price of coal at USD 3.3/GJ [97] and roughly half the cost of wood pellets at USD 14/GJ [98]. Thus, these results suggest stover–plastic pellets could be an economically viable solid fuel alternative for some industrial applications.
Table 6.
Key financial results.
3.2.5. Sensitivity Analysis
A sensitivity analysis (Figure 4) identified the five most influential factors affecting the operating cost, with the price of corn stover delivered to the pellet plant as the most influential factor. Since all costs associated with corn stover are for the harvest and post-harvest logistics, any improvements in the supply chain logistics would decrease its cost and improve the marketplace competitiveness of plastic–stover pellets. The operational cost is also sensitive to factors associated with preprocessing feedstock, such as electricity rate, pulverizer energy consumption, and pulverizer capacity. This is consistent with the TEA finding that size reduction requires 93% of the co-pelletization electricity consumption.
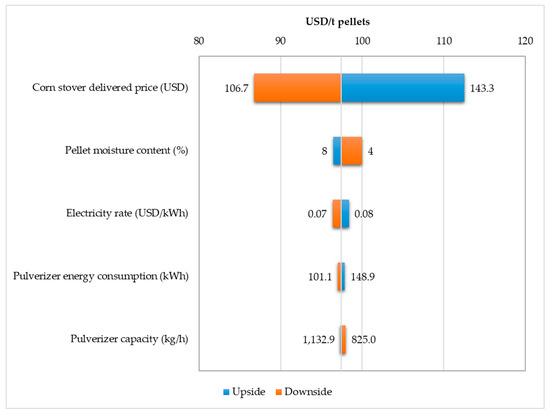
Figure 4.
Operating cost sensitivity analysis of plastic–stover pellet production.
3.2.6. GHGe Analysis
The total GHGe associated with the production and logistics of plastic–stover pellets (Table 7) delivered to a cement plant 160.9 km (100 miles) from the pellet plant was estimated to be 189.7 (95% CR: 180.5–199.1) kg CO2e/t pellets. Size reduction contributed to 36–38% of the GHGe, given the high electrical energy demands. Removing stover from the field can decrease nitrogen dioxide emissions from decaying the stover, which is significantly more impactful on global warming than methane and carbon dioxide. The analysis found that the removal of stover from the field in this scenario resulted in an average decrease of 51.3 (95% CR: 28.5–78.7) kg CO2e/t pellets in field emissions. Thus, this can be applied as a credit, reducing overall system emissions to 1656.2 (CR: 1542.4.1–1724.6) kg CO2e/t pellets.
Table 7.
GHGe associated with co-pelletization operations, delivery, and combustion as kg CO2e/t pellets.
This study also analyzed the difference in emissions compared to coal with 25% TSR of plastic–stover pellets. The use of plastic–stover pellets at 25% TSR decreased clinker emissions (mean: 435.9 kg CO2e/t clinker; CR (318.9–590.9 kg CO2e/t clinker)) by 2.8% compared to 100% coal used (328.5–579.2 kg CO2e/t clinker) for clinker production, the primary component of cement. This reduction is small compared to other methods proposed for reducing cement emissions, such as adjusting the clinker formula or replacement with supplementary cementitious materials that have potential for a 20–40% decrease in GHGe [99,100]. However, this technology has the potential to be rapidly implemented in cement operations that already process solid fuels, as opposed to the aforementioned methods that would require overhauls of material supply streams and extensive investigation into how concrete strength would be affected prior to adoption.
3.2.7. GHGe Sensitivity Analysis
A GHGe sensitivity analysis of co-pelletization operations and delivery to cement plants (Figure 5) found that emissions associated with the stover supply chain, stover moisture content upon delivery, the pulverizer energy demand, and pellet moisture content were the most sensitive. This was expected, given that electricity is the most used utility in this system and that the plastic pulverizer processed 20% of feedstock to the pellet mill but required 19.4% of system electricity due to the high speed and finer particle size. Stover supply chain emissions and moisture content are also significant factors, given the large volume of stover required to support the system capacity.
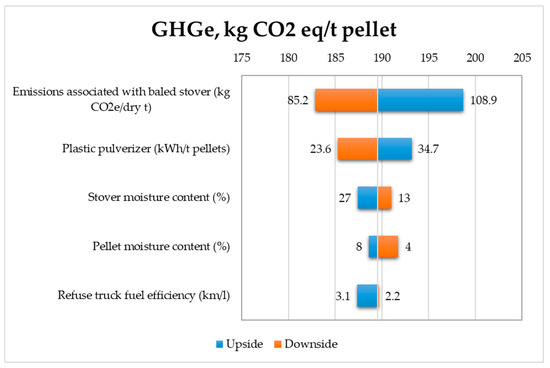
Figure 5.
Stover–plastic pellet GHGe sensitivity analysis.
4. Discussion
The outcome of this study could encourage the use of abundant plastic waste and stover materials to provide a reliable source of sustainable fuel and reduce GHGe in cement production. While the plastic–stover pellets did not meet all the quality standards (bulk and unit density) set by the PFI, 6 mm, 25% pellets did meet the durability standards and showed improvement in valuable fuel properties, the heating value, and decreased sulfur content when compared against just corn stover pellets.
Demonstrating the production of quality pellets is an important first step towards industrial application. However, this technology would benefit most from efforts to streamline stover logistics, as the TEA found that the total delivered price of plastic–stover pellets at current stover supply costs is not economically competitive with coal, primarily due to the delivered price of corn stover. Additionally, the results of this TEA suggest that future experimental work should focus on increasing the maximum plastic content, which would reduce operational costs and improve the heating value.
Moreover, the value of this technology lies in the potential for the diversion of waste from landfills and GHGe reductions in cement production. The results of this study found that substituting 25% of the thermal energy with plastic–stover pellets reduced CO2 emissions per t of clinker by 2.8% compared to the use of just coal. As with the TEA, the life cycle assessment (LCA) also identified GHGe associated with the stover supply chain to be the most sensitive factor on GHGe associated with stover–plastic pellets. Optimization of stover supply logistics could further reduce GHGe, and reduced GHGe could lead to financial incentives for cement producers to adopt stover–plastic pellets as an alternative fuel resource. Future TEA could consider the impact of plastic–stover pellet use on the costs for the cement operation when subjected to carbon cap-and-trade policies.
Author Contributions
Conceptualization, H.S.; methodology, H.S.; software, H.S.; validation, A.K. and A.S.; formal analysis, H.S.; investigation, H.S. and S.A.; resources, H.S. and A.K.; data curation, H.S.; writing—original draft preparation, H.S.; writing—review and editing, A.K. and A.S.; supervision, A.K. and A.S. All authors have read and agreed to the published version of the manuscript.
Funding
This research received no external funding.
Data Availability Statement
The data that support the findings of this study are not publicly available due to privacy restrictions but are available from the corresponding author upon reasonable request and with permission from The Ohio State University.
Conflicts of Interest
The authors declare no conflicts of interest. The funders had no role in the design of the study; in the collection, analyses, or interpretation of data; in the writing of the manuscript; or in the decision to publish the results.
Abbreviations
The following abbreviations are used in this manuscript:
| AFR | Alternative fuel resource |
| CO2e | Carbon dioxide equivalent |
| CR | Central range |
| GHGe | Greenhouse gas emissions |
| GWP | Global warming potential |
| HDPE | High density polyethylene |
| IRR | Internal rate of return |
| LCA | Life cycle assessment |
| LHV | Lower heating value |
| LLDPE | Linear low-density polyethylene |
| LSHT | Low speed-high torque |
| MRF | Material recovery facility |
| MSP | Minimum selling price |
| MSW | Municipal solid waste |
| PET | Polythylene terephthalate |
| SRF | Solid recovered fuel |
| TEA | Techno-economic analysis |
| TCI | Total capital investment |
| TDP | Total delivered price |
| WtE | Waste-to-energy |
References
- United States Environmental Protection Agency. Advancing Sustainable Materials Management: 2018 Fact Sheet; United States Environmental Protection Agency: Washington, DC, USA, 2020. [Google Scholar]
- United States Department of Agriculture. ‘News Release’. 10 January 2025. Available online: https://www.nass.usda.gov/Newsroom/printable/2025/2025_Jan_10_Crop_Production_News_Release.pdf (accessed on 3 August 2025).
- Jeschke, M.R.; Heggenstaller, A. Sustainable Corn Stover Harvest for Biofuel Production. Crop Insights 2012, 22, 1–6. [Google Scholar]
- Shah, A.; Darr, M. Modeling and Analysis greenhouse gas emissions analysis of the corn stover feedstock supply system for cellulosic biorefineries. Biofuels Bioprod. Bioref. 2017, 11, 648–664. [Google Scholar] [CrossRef]
- Lamers, P.U.S. Pellet Industry Overview; Idaho National Laboratory: Idaho Falls, ID, USA, 2017. [Google Scholar]
- Dale, V.H.; Kline, K.L.; Parish, E.S.; Cowie, A.L.; Emory, R.; Malmsheimer, R.W.; Slade, R.; Smith, C.T., Jr.; Wigley, T.B.; Bentsen, N.S.; et al. Status and Prospects for Renewable Energy Using Wood Pellets from the Southeastern United States; Wiley: Hoboken, NJ, USA, 2017; pp. 1296–1305. [Google Scholar] [CrossRef]
- Jacobson, M.; Ciolkosz, D.; Evans, A.M.; Perschel, R.T.; Langholtz, M.; Canham, C.D.; Herr, J.R.; Carlson, J.E.; Wang, J.; Hartley, D.; et al. Wood-Based Energy in the Northern Forests; Jacobson, M., Ciolkosz, D., Eds.; Springer Science + Business Media: New York, NY, USA, 2013. [Google Scholar] [CrossRef]
- Jackson, J.; Turner, M.; Mark, T.; Montross, M. Densification of biomass using a pilot scale flat ring roller pellet mill. Fuel Process. Technol. 2016, 148, 43–49. [Google Scholar] [CrossRef]
- García, R.; Gil, M.V.; Rubiera, F.; Pevida, C. Pelletization of wood and alternative residual biomass blends for producing industrial quality pellets. Fuel 2019, 251, 739–753. [Google Scholar] [CrossRef]
- Setter, C.; Borges, F.A.; Cardoso, C.R.; Mendes, R.F.; Oliveira, T.J.P. Industrial Crops & Products Energy quality of pellets produced from coffee residue: Characterization of the products obtained via slow pyrolysis. Ind. Crops Prod. 2020, 154, 112731. [Google Scholar] [CrossRef]
- Tumuluru, J.S. Chapter 2: Binding Mechanism, Densification Systems, Process Variables, and Quality Attributes. In Biomass Densification; Springer: Cham, Switzerland, 2020; pp. 23–61. [Google Scholar]
- Demirbas, A. Combustion characteristics of different biomass fuels. Prog. Energy Combust. Sci. 2004, 30, 219–230. [Google Scholar] [CrossRef]
- Lizotte, P.; Savoie, P.; De Champlain, A. Ash Content and Calorific Energy of Corn Stover Components in Eastern Canada. Energies 2015, 8, 4827–4838. [Google Scholar] [CrossRef]
- Zannikos, F.; Kalligeros, S.; Anastopoulos, G.; Lois, E. Converting Biomass and Waste Plastic to Solid Fuel Briquettes. J. Renew. Energy 2013, 2013, 360368. [Google Scholar] [CrossRef]
- Auprakul, U.; Promwungkwa, A. Densified Fuels from Mixed Plastic Wastes and Corn Stover Densified Fuels from Mixed Plastic Wastes and Corn Stover. Adv. Mater. Res. 2014, 931–932, 1117–1121. [Google Scholar] [CrossRef]
- Emadi, B.; Iroba, K.L.; Tabil, L.G. Effect of polymer plastic binder on mechanical, storage and combustion characteristics of torrefied and pelletized herbaceous biomass. Appl. Energy 2017, 198, 312–319. [Google Scholar] [CrossRef]
- Rezaei, H.; Panah, F.Y.; Jim Lim, C.; Sokhansanj, S. Pelletization properties of refuse-derived fuel—Effects of particle size and moisture content. Fuel Process. Technol. 2020, 205, 106437. [Google Scholar] [CrossRef]
- Ziegler, D.; Schimpf, W.; Dubach, B.; Degre, J.-P.; Mutz, D. Guidelines on Co-processing Waste Materials in Cement Production. GTZ-Holcim Public Priv. Partnersh. 2006, 20, 1–46. Available online: https://optoce.no/wp-content/uploads/2019/03/Holcim-GTZ-guideline_coprocem_v06-06.pdf (accessed on 8 December 2020).
- Geocycle USA. Available online: https://www.geocycle.com/usa?address=United States (accessed on 8 July 2021).
- American Cement Association. U.S. Cement Industry Hits Energy Efficiency Milestones. Available online: https://www.cement.org/2024/10/24/u-s-cement-industry-hits-energy-efficiency-milestones/ (accessed on 3 August 2025).
- Bourtsalas, A.C.T.; Zhang, J.; Castaldi, M.J.; Themelis, N.J. Use of non-recycled plastics and paper as alternative fuel in cement production. J. Clean. Prod. 2018, 181, 8–16. [Google Scholar] [CrossRef]
- Hossain, M.U.; Sun Poon, C.; Lo, I.M.C.; Cheng, J.C.P. Comparative LCA on using waste materials in the cement industry: A Hong Kong case study. Resour. Conserv. Recycl. 2017, 120, 199–208. [Google Scholar] [CrossRef]
- Hossain, U.; Sun Poon, C.; Kwong Wong, M.Y.; Khine, A. Techno-environmental feasibility of wood waste derived fuel for cement production. J. Clean. Prod. 2019, 230, 663–671. [Google Scholar] [CrossRef]
- Fyffe, J.R.; Breckel, A.C.; Townsend, A.K.; Webber, M.E. Use of MRF residue as alternative fuel in cement production. Waste Manag. 2016, 47, 276–284. [Google Scholar] [CrossRef]
- Miller, S.A.; Horvath, A.; Monteiro, P.J.M. Readily implementable techniques can cut annual CO2 emissions from the production of concrete by over 20%. Environ. Res. Lett. 2016, 11, 074029. [Google Scholar] [CrossRef]
- Ecology Center. Why It Matters Who Runs Your MRF. Available online: https://www.ecocenter.org/why-it-matters-who-runs-your-mrf (accessed on 22 August 2025).
- Environmental Research and Education Foundation. Analyzing Municipal Solid Waste Landfill Tipping Fees. Available online: https://erefdn.org/analyzing-municipal-solid-waste-landfill-tipping-fees/ (accessed on 3 August 2025).
- Fyffe, J.R.; Breckel, A.C.; Townsend, A.K.; Webber, M.E. Residue-Derived Solid Recovered Fuel for Use in Cement Kilns; University of Texas at Austin: Austin, TX, USA, 2012. [Google Scholar]
- Sokhansanj, S.; Mani, S.; Tagore, S.; Turhollow, A.F. Techno-economic analysis of using corn stover to supply heat and power to a corn ethanol plant—Part 1: Cost of feedstock supply logistics. Biomass Bioenergy 2010, 34, 75–81. [Google Scholar] [CrossRef]
- Mani, S.; Sokhansanj, S.; Tagore, S.; Turhollow, A.F. Techno-economic analysis of using corn stover to supply heat and power to a corn ethanol plant—Part 2: Cost of heat and power generation systems. Biomass Bioenergy 2010, 34, 356–364. [Google Scholar] [CrossRef]
- Shah, A.; Darr, M. A techno-economic analysis of the corn stover feedstock supply system for cellulosic biorefineries. Biofuels Bioprod. Bioref 2016, 10, 542–559. [Google Scholar] [CrossRef]
- Tumuluru, J.S.; Cafferty, K.G.; Kenney, K.L. Techno-economic Analysis of Conventional, High Moisture Pelletization and Briquetting Process. In Proceedings of the 2014 ASABE—CSBE/SCGAB Annual International Meeting Paper, Montreal, QC, Canada, 13–16 July 2014; pp. 1–13. Available online: https://elibrary.asabe.org/abstract.asp?aid=45007 (accessed on 9 February 2021).
- Kocsis, Z.; Csanády, A. Chapter 3: The Practice of Pellet Making. In Theory and Practice of Wood Pellet Production; Springer: Cham, Switzerland, 2019; pp. 77–109. Available online: https://link.springer.com/chapter/10.1007/978-3-030-26179-5_3 (accessed on 8 October 2025).
- Tumuluru, J.S. High moisture corn stover pelleting in a flat die pellet mill fitted with a 6 mm die: Physical properties and specific energy consumption. Energy Sci. Eng. 2015, 3, 327–341. [Google Scholar] [CrossRef]
- Mani, S.; Sokhansanj, S.; Bi, X.; Turhollow, A. Economics of producing fuel pellets from biomass. Appl. Eng. Agric. 2006, 22, 421–426. [Google Scholar] [CrossRef]
- Stelte, W.; Holm, J.K.; Sanadi, A.R.; Barsberg, S.; Ahrenfeldt, J.; Henriksen, U.B. A study of bonding and failure mechanisms in fuel pellets from different biomass resources. Biomass Bioenergy 2010, 35, 910–918. [Google Scholar] [CrossRef]
- Stelte, W.; Sanadi, A.R.; Shang, L.; Holm, J.K.; Ahrenfeldt, J.; Henriksen, U.B. Recent developments in biomass pelletization—A review. BioResources 2012, 7, 4451–4490. [Google Scholar] [CrossRef]
- Shaw, M. Feedstock and Process Variables Influencing Biomass Densification. Master’s Thesis, University of Saskatchewan, Saskatoon, Saskatchewan, 2008. [Google Scholar]
- Kaliyan, N.; Morey, R.V. Natural binders and solid bridge type binding mechanisms in briquettes and pellets made from corn stover and switchgrass. Bioresour. Technol. 2010, 101, 1082–1090. [Google Scholar] [CrossRef] [PubMed]
- Nielsen, N.P.K.; Gardner, D.J. Importance of temperature, moisture content, and species for the conversion process of wood residues into fuel pellets. Wood Fiber Sci. 2009, 41, 414–425. [Google Scholar]
- Tumuluru, J.S. Effect of pellet die diameter on density and durability of pellets made from high moisture woody and herbaceous biomass. Carbon Resour. Convers. 2018, 1, 44–54. [Google Scholar] [CrossRef]
- Tumuluru, J.S. Pelleting of pine and switchgrass blends: Effect of process variables and blend ratio on the pellet quality and energy consumption. Energies 2019, 12, 1198. [Google Scholar] [CrossRef]
- Lavergne, S.; Larsson, S.H.; Da Silva Perez, D.; Marchand, M.; Campargue, M.; Dupont, C. Effect of process parameters and biomass composition on flat-die pellet production from underexploited forest and agricultural biomass. Fuel 2021, 302, 121076. [Google Scholar] [CrossRef]
- PFI. Pellet Fuels Institute Standard Specification for Residential/Commercial Densified Fuel Pellet Fuels Institute Standard Specification for Residential/Commercial Densified Fuel; PFI: Seattle, WA, USA, 2011; pp. 1–10. Available online: https://www.pelletheat.org/assets/docs/pfi-standard-specification-november-2011.pdf (accessed on 12 March 2021).
- Lehtikangas, P. Quality properties of pelletised sawdust, logging residues and bark. Biomass Bioenergy 2001, 20, 351–360. [Google Scholar] [CrossRef]
- ISO 556:1980; Coke (Greater than 20 mm in Size)—Determination of Mechanical Strength. ISO: Geneva, Switzerland, 1980.
- Gil, M.V.; Oulego, P.; Casal, M.D.; Pevida, C.; Pis, J.J.; Rubiera, F. Mechanical durability and combustion characteristics of pellets from biomass blends. Bioresour. Technol. 2010, 101, 8859–8867. [Google Scholar] [CrossRef]
- Reza, M.T.; Lynam, J.G.; Vasquez, V.R.; Coronella, C.J. Pelletization of biochar from hydrothermally carbonized wood. Environ. Prog. Sustain. Energy 2012, 31, 676–680. [Google Scholar] [CrossRef]
- Hoekman, S.K.; Broch, A.; Warren, A.; Felix, L.; Irvine, J. Laboratory pelletization of hydrochar from woody biomass. Biofuels 2014, 5, 651–666. [Google Scholar] [CrossRef]
- ASAE S269.5 OCT2012 R2016; Densified Products for Bulk Handling—Definitions and Methods. ASABE: St. Joseph, MI, USA, 2016.
- ASTM standard D2015; Standard Test Method for Gross Caloric Value of Coal and Coke by the Adiabatic Bomb Calorimeter. ASTM International: Conshohocken, PA, USA, 1998.
- United States Department of Agriculture. Corn for All Purposes 2024 Planted Acres by County for Selected States; United States Department of Agriculture: Washington, DC, USA, 2024. [Google Scholar]
- The Recycling Partnership. Map of Comingled Residential MRFs in the US. Available online: https://recyclingpartnership.org/residential-mrfs/ (accessed on 19 September 2025).
- Lamers, P.; Roni, M.S.; Tumuluru, J.S.; Jacobson, J.J.; Cafferty, K.G.; Hansen, J.K.; Kenney, K.; Teymouri, F.; Bals, B. Techno-economic analysis of decentralized biomass processing depots. Bioresour. Technol. 2015, 194, 205–213. [Google Scholar] [CrossRef]
- Staub, C. Israeli Business Says It Wants the Material MRFs Reject. Available online: https://resource-recycling.com/recycling/2019/10/15/israeli-business-says-it-wants-the-material-mrfs-reject/ (accessed on 8 August 2021).
- Route Ready Trucks. What You Should Know About the 4 Major Types of Garbage Trucks. 2019. Available online: https://routereadytrucks.com/blogs/know-4-major-types-garbage-trucks/ (accessed on 8 September 2021).
- United States Department of Energy. Average Fuel Economy by Major Vehicle Category. Altern. Fuels Data Cent. 2020, 2020. Available online: https://afdc.energy.gov/data/10310 (accessed on 20 August 2021).
- Zhu, J.Y. Chapter 4: Physical Pretreatment—Woody Biomass Size Reduction—For Forest Biorefinery. In Sustainable Production of Fuels, Chemicals and Fibers from Forest Biomass. American Chemical Society; Zhu, J.Y., Zhang, X., Pan, X., Eds.; ACS Symposium Series; American Chemical Society: Washington, DC, USA, 2011; pp. 89–107. [Google Scholar]
- Bitra, V.S.P.; Alvin, R.W.; Chevanan, N.; Miu, P.I.; Igathinathane, C.; Sokhansanj, S.; Smith, D.R. Direct mechanical energy measures of hammer mill comminution of switchgrass, wheat straw, and corn stover and analysis of their particle size distribution. Powder Technol. 2009, 193, 32–45. [Google Scholar] [CrossRef]
- Fitzgerald, G.C.; Themelis, N.J. Technical and Economic Impacts of Pre-Shredding the MSW Feed to Moving Grate WTE Boilers. In Proceedings of the 17th Annual North American Waste-To-Energy Conference, ASME, Chantilly, VA, USA, 18–20 May 2009; pp. 1–7. [Google Scholar]
- Mani, S.; Tabil, L.G.; Sokhansanj, S. Grinding performance and physical properties of wheat and barley straws, corn stover and switchgrass. Biomass Bioenergy 2004, 27, 339–352. [Google Scholar] [CrossRef]
- United States Environmental Protection Agency. Fine Shredding of Municipal Solid Waste; Industrial Environmental Research Laboratory, Office of Research and Development: Research Triangle Park, NC, USA, 1976. [Google Scholar]
- Stedman Machinery Company. Industrial Hammer Mill Grinders. Available online: https://www.stedman-machine.com/hammer-mill-grinders.html (accessed on 22 August 2025).
- Pallmann Industries. Pulverizing of Plastics; Pallmann Industries: Clifton, NJ, USA, 2013. [Google Scholar]
- Sudenga Industries Inc. Horizontal Mixers. Available online: https://www.sudenga.com/our-products/feed-processing/horizontal-mixer (accessed on 8 December 2021).
- Buhler. Kubex T. Available online: https://www.buhlergroup.com/content/buhlergroup/global/en/products/kubex_t_pellet_mill.html (accessed on 8 December 2021).
- TonDE Pellet Mill. Counterflow Wood Pellet Cooler. Available online: https://www.tondepelletmill.com/biomass-pellet-machine/counterflow-wood-pellet-cooler.html (accessed on 8 August 2021).
- Lacoa, U.; Velarde, G.; Kay, M.; Blanco, E.; Salonim, D. Design and Development of Logistics Models for Residential and Commercial Biomass Pellets for Heat. BioResources 2018, 12, 1506–1531. [Google Scholar]
- Qian, Y.; McDow, W. The Wood Pellet Value Chain; US Endowment of Forestry and Communities: Greenville, SC, USA, 2013; pp. 1–59. [Google Scholar]
- Pressley, P.N.; Levis, J.W.; Damgaard, A.; Barlaz, M.A.; DeCarolis, J.F. Analysis of material recovery facilities for use in life-cycle assessment. Waste Manag. 2015, 35, 307–317. [Google Scholar] [CrossRef] [PubMed]
- Menikpura, N.; Totoki, Y.; Sang-arun, J. The Implications of Packaging Plastic Recycling on Climate Change Mitigation and Fossil Resource Savings—A Case Study in Japan. In Proceedings of the 3R International Scientific Conference on Material Cycle and Waste Management, Kyoto, Japan, 10–12 March 2014. [Google Scholar]
- Plastic Film Recycling. Bale Specs. Available online: https://www.plasticfilmrecycling.org/recycling-commercial-film/businesses-post-consumer-bag-film-recycling/set-up-a-collection-program/design-collection-strategy-educate/bale-specs/ (accessed on 20 August 2021).
- United States Department of Transportation. Commercial Vehicle Size and Weight Program. Available online: https://ops.fhwa.dot.gov/freight/sw/overview/index.htm (accessed on 8 September 2021).
- Jennifer, K. The Best Specs and Fuel Mileage for Class 8 Trucks. Available online: https://itstillruns.com/specs-mileage-class-8-trucks-7668977.html (accessed on 22 August 2025).
- Union Pacific. Covered Hoppers. Available online: https://www.up.com/customers/all/equipment/descriptions/covered_hoppers/index.htm (accessed on 22 August 2025).
- CSX Corporation. Fuel Efficiency. Available online: https://www.csx.com/index.cfm/about-us/the-csx-advantage/fuel-efficiency/ (accessed on 8 September 2021).
- Shah, A.; Baral, N.R.; Manandhar, A. Technoeconomic Analysis and Life Cycle Assessment of Bioenergy Systems, Advances in Bioenergy. J. Clean. Prod. 2017, 166, 601–614. [Google Scholar] [CrossRef]
- Lang, H.J. Simplified approach to preliminary cost estimates. Chem. Eng. 1948, 55, 112. [Google Scholar]
- United States Energy Information Administration. Electricity Power Monthly. Available online: https://www.eia.gov/electricity/monthly/ (accessed on 6 August 2025).
- United States Energy Information Administration. U.S. No 2 Diesel Wholesale/Resale Price by Refiners. 1 June 2022. Available online: https://www.eia.gov/dnav/pet/hist/LeafHandler.ashx?n=PET&s=EMA_EPD2D_PWG_NUS_DPG&f=M (accessed on 6 August 2025).
- Khanal, A.; Manandhar, A.; Adhikari, S.; Shah, A. Techno-economic analysis of novolac resin production by partial substitution of petroleum-derived phenol with bio-oil phenol. Biofuels Bioprod. Bioref. 2021, 15, 1611–1620. [Google Scholar] [CrossRef]
- Dutta, A.; Sahir, A.; Tan, E.; Humbird, D.; Snowden-Swan, L.J.; Meyer, P.; Ross, J.; Sexton, D.; Yap, R.; Lukas, J. Process Design and Economics for the Conversion of Lignocellulosic Biomass to Hydrocarbon Fuels. NREL/TP-5100-62455 and PNNL-23823’. NREL Tech. Rep. 2015. [Google Scholar]
- Wright, M.M.; Daugaard, D.E.; Satrio, J.A.; Brown, R.C. Techno-economic analysis of biomass fast pyrolysis to transportation fuels. Technical Report NREL/TP-6A20-46586’. NREL Tech. Rep. 2010, 89, 463–469. [Google Scholar] [CrossRef]
- Curry, K.C.; van Oss, H.G. 2017 Minerals Yearbook. CEMENT—2017. 2020. Available online: https://d9-wret.s3.us-west-2.amazonaws.com/assets/palladium/production/atoms/files/myb1-2017-cemen.pdf (accessed on 31 July 2021).
- ANL. GREET_1_2020 Model. Available online: https://greet.es.anl.gov/ (accessed on 8 August 2021).
- United States Environmental Protection Agency. Greenhouse Gases Equivalences Calculator—Calculations and References. Available online: https://www.epa.gov/energy/greenhouse-gas-equivalencies-calculator-calculations-and-references (accessed on 21 August 2025).
- De Klein, C.; Novoa, R.S.A.; Ogle, S.; Smith, K.A.; Rochette, P.; Wirth, T.C.; McConkey, B.G.; Mosier, A.; Rypdal, K.; Walsh; et al. Chapter 11: N2O emissions from managed soils, and CO2 emissions from lime and urea application. In Agriculture Forestry and Other Land Use; IPCC: Geneva, Switzerland, 2006; Volume 4, pp. 1–54. [Google Scholar]
- Wilhelm, W.W.; Johnson, J.M.F.; Karlen, D.L.; Lightle, D.T. Corn stover to sustain soil organic carbon further constrains biomass supply. Agron. J. 2007, 99, 1665–1667. [Google Scholar] [CrossRef]
- United States Environmental Protection Agency. Direct Emissions from Mobile Combustion Sources (EPA430-K-08-004). Climate Leaders GHG Inventory Protocol, 2020.
- Zheng, J.; Suh, S. Strategies to reduce the global carbon footprint of plastics. Nat. Clim. Change 2019, 9, 374–378. [Google Scholar] [CrossRef]
- Datis Export Group. How Many Cement Plants Are Producing in the USA in 2020? Available online: https://datis-inc.com/blog/how-many-cement-plants-are-producing-in-the-usa-2020/ (accessed on 9 August 2021).
- Helsel, Z.R.; Wedin, W.F. Direct combustion energy from crops and crop residues produced in Iowa. Energy Agric. 1981–1983, 1, 317–329. [Google Scholar] [CrossRef]
- Tumuluru, J.S.; Fillerup, E. Briquetting characteristics of woody and herbaceous biomass blends: Impact on physical properties, chemical composition, and calorific value. Biofuels Bioprod. Bioref. 2020, 14, 1105–1124. [Google Scholar] [CrossRef]
- Areeprasert, C.; Asingsamanunt, J.; Srisawat, S.; Kaharn, J.; Inseemeesak, B.; Phasee, P.; Khaobang, C.; Siwakosit, W.; Chiemchaisri, C. Municipal plastic waste composition study at transfer station of Bangkok and possibility of its energy recovery by pyrolysis. In Proceedings of the 3rd International Conference on Energy and Environment Research, ICEER 2016, Barcelona, Spain, 7–11 September 2016. [Google Scholar] [CrossRef]
- World Bioenergy Association. Pellets—A Fast Growing Energy Carrier. Available online: https://www.worldbioenergy.org/uploads/Factsheet%20-%20Pellets.pdf (accessed on 18 September 2025).
- Makepa, D.C.; Chihobo, C.H.; Ruziwa, W.R.; Musademba, D. A systematic review of the techno-economic assessment and biomass supply chain uncertainties of biofuels production from fast pyrolysis of lignocellulosic biomass. Fuel Commun. 2023, 14, 100086. [Google Scholar] [CrossRef]
- United States Energy Information Administration. Coal Explained: Coal Prices and Outlook. Available online: https://www.eia.gov/energyexplained/coal/prices-and-outlook.php (accessed on 6 August 2025).
- United States Energy Information Administration. Monthly Densified Biomass Fuel Report. Available online: https://www.eia.gov/biofuels/biomass/#table_data (accessed on 16 August 2025).
- World Economic Forum. Cement Is a Big Problem for the Environment. Here’s How to Make It More Sustainable. Available online: https://www.weforum.org/stories/2024/09/cement-production-sustainable-concrete-co2-emissions/ (accessed on 18 September 2025).
- Barcelo, L.; Kline, J.; Walenta, G.; Gartner, E. Cement and carbon emissions. Mater. Struct. 2013, 47, 1055–1065. [Google Scholar] [CrossRef]
Disclaimer/Publisher’s Note: The statements, opinions and data contained in all publications are solely those of the individual author(s) and contributor(s) and not of MDPI and/or the editor(s). MDPI and/or the editor(s) disclaim responsibility for any injury to people or property resulting from any ideas, methods, instructions or products referred to in the content. |
© 2025 by the authors. Licensee MDPI, Basel, Switzerland. This article is an open access article distributed under the terms and conditions of the Creative Commons Attribution (CC BY) license (https://creativecommons.org/licenses/by/4.0/).