Article

Thermal Performance of Double-Glass Evacuated Tube Solar Collectors: Flow Rate Variation Under International Standard Testing Conditions

Korea Institute of Energy Research, 152 Gajeong-ro, Yuseong-gu, Daejeon 34129, Republic of Korea
*
Author to whom correspondence should be addressed.
Energies 2025, 18(20), 5388; https://doi.org/10.3390/en18205388
Submission received: 8 September 2025 / Revised: 1 October 2025 / Accepted: 10 October 2025 / Published: 13 October 2025
(This article belongs to the Section A2: Solar Energy and Photovoltaic Systems)

Abstract

Renewable energy sources are among the most promising alternatives to fossil fuels, and solar thermal energy stands out due to its high conversion efficiency and direct thermal utilization. The performance of solar collectors is evaluated under standardized procedures, including ISO 9806:2025. In the Republic of Korea, KS B 8295:2023 is applied for certification; however, it lacks clear guidance on the selection of the working fluid mass flow rate during experimental testing. This study experimentally investigates the thermal performance of a double-glass evacuated tube solar collector under varying flow rates, tested in accordance with both KS B 8295:2023 and ISO 9806:2025 standards. Three flow rates (0.042, 0.067, 0.092 kg/s) were tested at four inlet temperature levels. Unlike most previous studies, which were primarily based on simulations and lacked standardized experimental validation, this work provides empirical results obtained under fully standard testing conditions, thereby filling an important research gap. Instantaneous efficiency curves were derived, showing that increasing the flow rate enhanced the average thermal output by approximately 6%. These results highlight the necessity of defining optimal flow rate conditions in KS B 8295:2023, and the empirical correction factor proposed herein can support future standard revisions and promote international harmonization.

1. Introduction

Carbon neutrality has become a crucial global policy for sustainable development, and an international consensus has already been established to reduce carbon emissions in response to global warming. Achieving this target requires a comprehensive re-evaluation of fossil fuel-based energy systems. Although national policies may differ, there is a broad global agreement that renewable energy sources represent one of the most effective alternatives to fossil fuels [1,2].
Among various renewable energy sources, solar thermal energy is one of the oldest technologies utilized by humankind. Since ancient times, civilizations have harnessed solar energy—for example, by orienting buildings southward to maximize solar heat gain or using black containers to heat water. In the late 18th century, Horace de Saussure developed the world’s first solar collector, which was used for cooking [3]. With continuous development throughout history, modern solar thermal technologies began to advance rapidly during the 20th century.
During the 1900s, research on solar energy accelerated, leading to the commercialization of solar collectors and their integration into building HVAC systems. Concentrated solar power (CSP) technologies also emerged, with large-scale deployment in regions such as Spain, the United States, and the Middle East. More recently, photovoltaic-thermal (PVT) systems, capable of producing both electricity and heat, have attracted growing attention in research and development. Evacuated tube solar collectors (ETCs) in particular have been recognized for their high thermal efficiency and excellent insulation properties, making them suitable for diverse climatic conditions [4,5,6].
Since 2017, the authors have performed internationally accredited performance testing of solar collectors at the Korea Institute of Energy Research, a KOLAS-accredited laboratory (Accreditation No. KT203) recognized under the ILAC Mutual Recognition Arrangement [7,8]. This accreditation ensures that the testing procedures and results comply with internationally recognized standards and are consistent with the competence requirements specified in ISO/IEC 17025 [9]. The tests follow the national standard KS B 8295:2023, which incorporates elements from ISO 9806:2025 [10,11]. Notably, ISO 9806:2025 evolved from established test methods such as EN 12975-2 and ASHRAE Standard 93, which together underpin today’s internationally harmonized collector testing framework [12,13].
In this experimental context, multiple testing standards were reviewed, with attention directed to the mass-flow condition, a key determinant of solar-collector thermal performance. Although mass flow rate strongly influences output, standardized tests typically treat it as a fixed parameter, whereas temperature conditions are systematically varied. This analysis revealed a substantive limitation in KS B 8295:2023 with respect to the specification of flow rate conditions. According to Section 8.1.4.3.3 of KS B 8295:2023, in the absence of manufacturer specifications, the recommended mass flow rate for outdoor thermal efficiency testing is “approximately 0.02 kg/s per square meter of collector area.” Despite this recommendation, the term “collector area” is not explicitly defined. In practice, it may refer to either the gross (total frontal) area or the aperture area. While these areas are nearly identical in flat-plate collectors, the aperture area of ETCs is typically 40% smaller than the gross area, resulting in different flow rate settings and potentially significant performance discrepancies [14,15,16]. ISO 9806:2025 clearly specifies that gross area should be used for the flow rate calculation, whereas the latest Korean standard KS B 8295:2023 does not provide this clarification, potentially leading to inconsistencies in test results.
Furthermore, Table 2 of KS B 8295:2023 (Section 6.1) stipulates minimum thermal performance requirements of 530 W/m2 for flat-plate collectors and 560 W/m2 for ETCs; collectors failing to meet these thresholds cannot be certified [11]. In Republic of Korea, compliance with KS B 8295:2023 forms part of the national product certification program for solar collectors, as administered at the national level [17].
While the influence of flow rate variation on collector performance has been investigated through both simulations and experiments, no studies have experimentally quantified the average thermal output strictly in accordance with standardized international test methods. Given that evacuated tube collectors are widely deployed worldwide [18], this study examines a double-glass ETC—a low-loss design—and investigates its thermal performance across multiple flow rates in full compliance with KS B 8295:2023 and ISO 9806:2025, with the aim of clarifying how flow rate selection affects intrinsic collector performance.

Previous Studies

Numerous studies have investigated the influence of mass flow rate variations on the thermal performance of solar collectors, as summarized in Table 1. Plaza Gomariz et al. modeled a flat-plate solar collector to evaluate heat production, initial investment cost, and operational expenses under both low- and high-flow conditions. They reported that increasing the flow rate improved the solar fraction by 4.6% and reduced total pump operation time by 4.4%, although no significant enhancement in the efficiency curve was observed [19]. Razika et al. experimentally examined flat-plate collectors, finding a linear relationship between efficiency and flow rate described by efficiency = 0.6818 × flow rate + 49.79 [20].
Beyond conventional flat-plate collectors, flow rate variation also influences photovoltaic-thermal (PVT) systems. Talib et al. simulated a flat-plate-based PVT system and found that higher flow rates increased both thermal energy gain and electrical efficiency by lowering surface temperatures [21].
A substantial body of research has examined ETCs, which are widely used due to their high efficiency and low thermal losses. Nugroho et al. used MATLAB simulations to analyze flow rate variation in ETCs, reporting a positive trend in efficiency with increasing flow rate, although their model was fixed [22]. Elsheniti et al. experimentally investigated ETCs at high inlet temperatures (70–90 °C) and confirmed improved efficiency with higher flow rates [23]. Vig et al., through TRNSYS simulations, observed that ETC thermal efficiency saturated when the flow rate exceeded a certain threshold [14]. Gao et al. compared U-pipe and water-in-glass ETCs, finding that U-pipe efficiency was more sensitive to flow variation and could decrease beyond a specific flow rate, whereas water-in-glass systems maintained stable performance [15]. Li et al. integrated phase change material (PCM) into a U-type (same as U-pipe) ETC, showing that optimal PCM arrangement and flow conditions improved both heat storage and discharge [24]. Farhadi et al. developed an analytical and machine learning model for heat pipe ETCs, enabling accurate performance prediction and optimization [16]. Kumar et al. provided a comprehensive review of ETC designs, highlighting how geometric modifications, flow rate adjustments, and absorber enhancements affect thermal efficiency [25].
While the majority of previous studies indicate that increasing flow rate generally improves thermal performance, most of them rely heavily on simulations, and the few experimental works conducted have not strictly followed standardized international testing protocols. To date, no study has experimentally quantified the intrinsic performance of evacuated tube collectors under fully standardized conditions. In light of this gap, the present study provides the first systematic experimental assessment of a double-glass ETC across multiple flow rates in full compliance with both KS B 8295:2023 and ISO 9806:2025. By explicitly addressing the impact of flow rate selection on collector performance under these internationally recognized standards, this work highlights its novelty and provides empirical evidence that has been missing in prior experimental research.

2. Specimen

The tested double-glass evacuated tube solar collector used in this study is detailed in Table 2.
The gross area of the tested collector is 3.42 m2, and the aperture area is 2.10 m2, corresponding to approximately 61% of the gross area. This implies that if the working fluid flow rate is determined based on gross area, the resulting flow rate will be approximately 1.63 times greater than that based on the aperture area.
The tested collector represents the most widely used type of heat pipe-based double-glass ETC in Republic of Korea. To enhance insulation, an aluminum absorber plate is located inside the dual vacuum glass tubes. This absorber transfers heat to a heat pipe, where the working fluid vaporizes and transfers latent heat to the manifold through condensation in the condenser section. The structural connection between the heat pipe’s condenser section and the absorber plate is shown in Figure 1.

3. Methodology

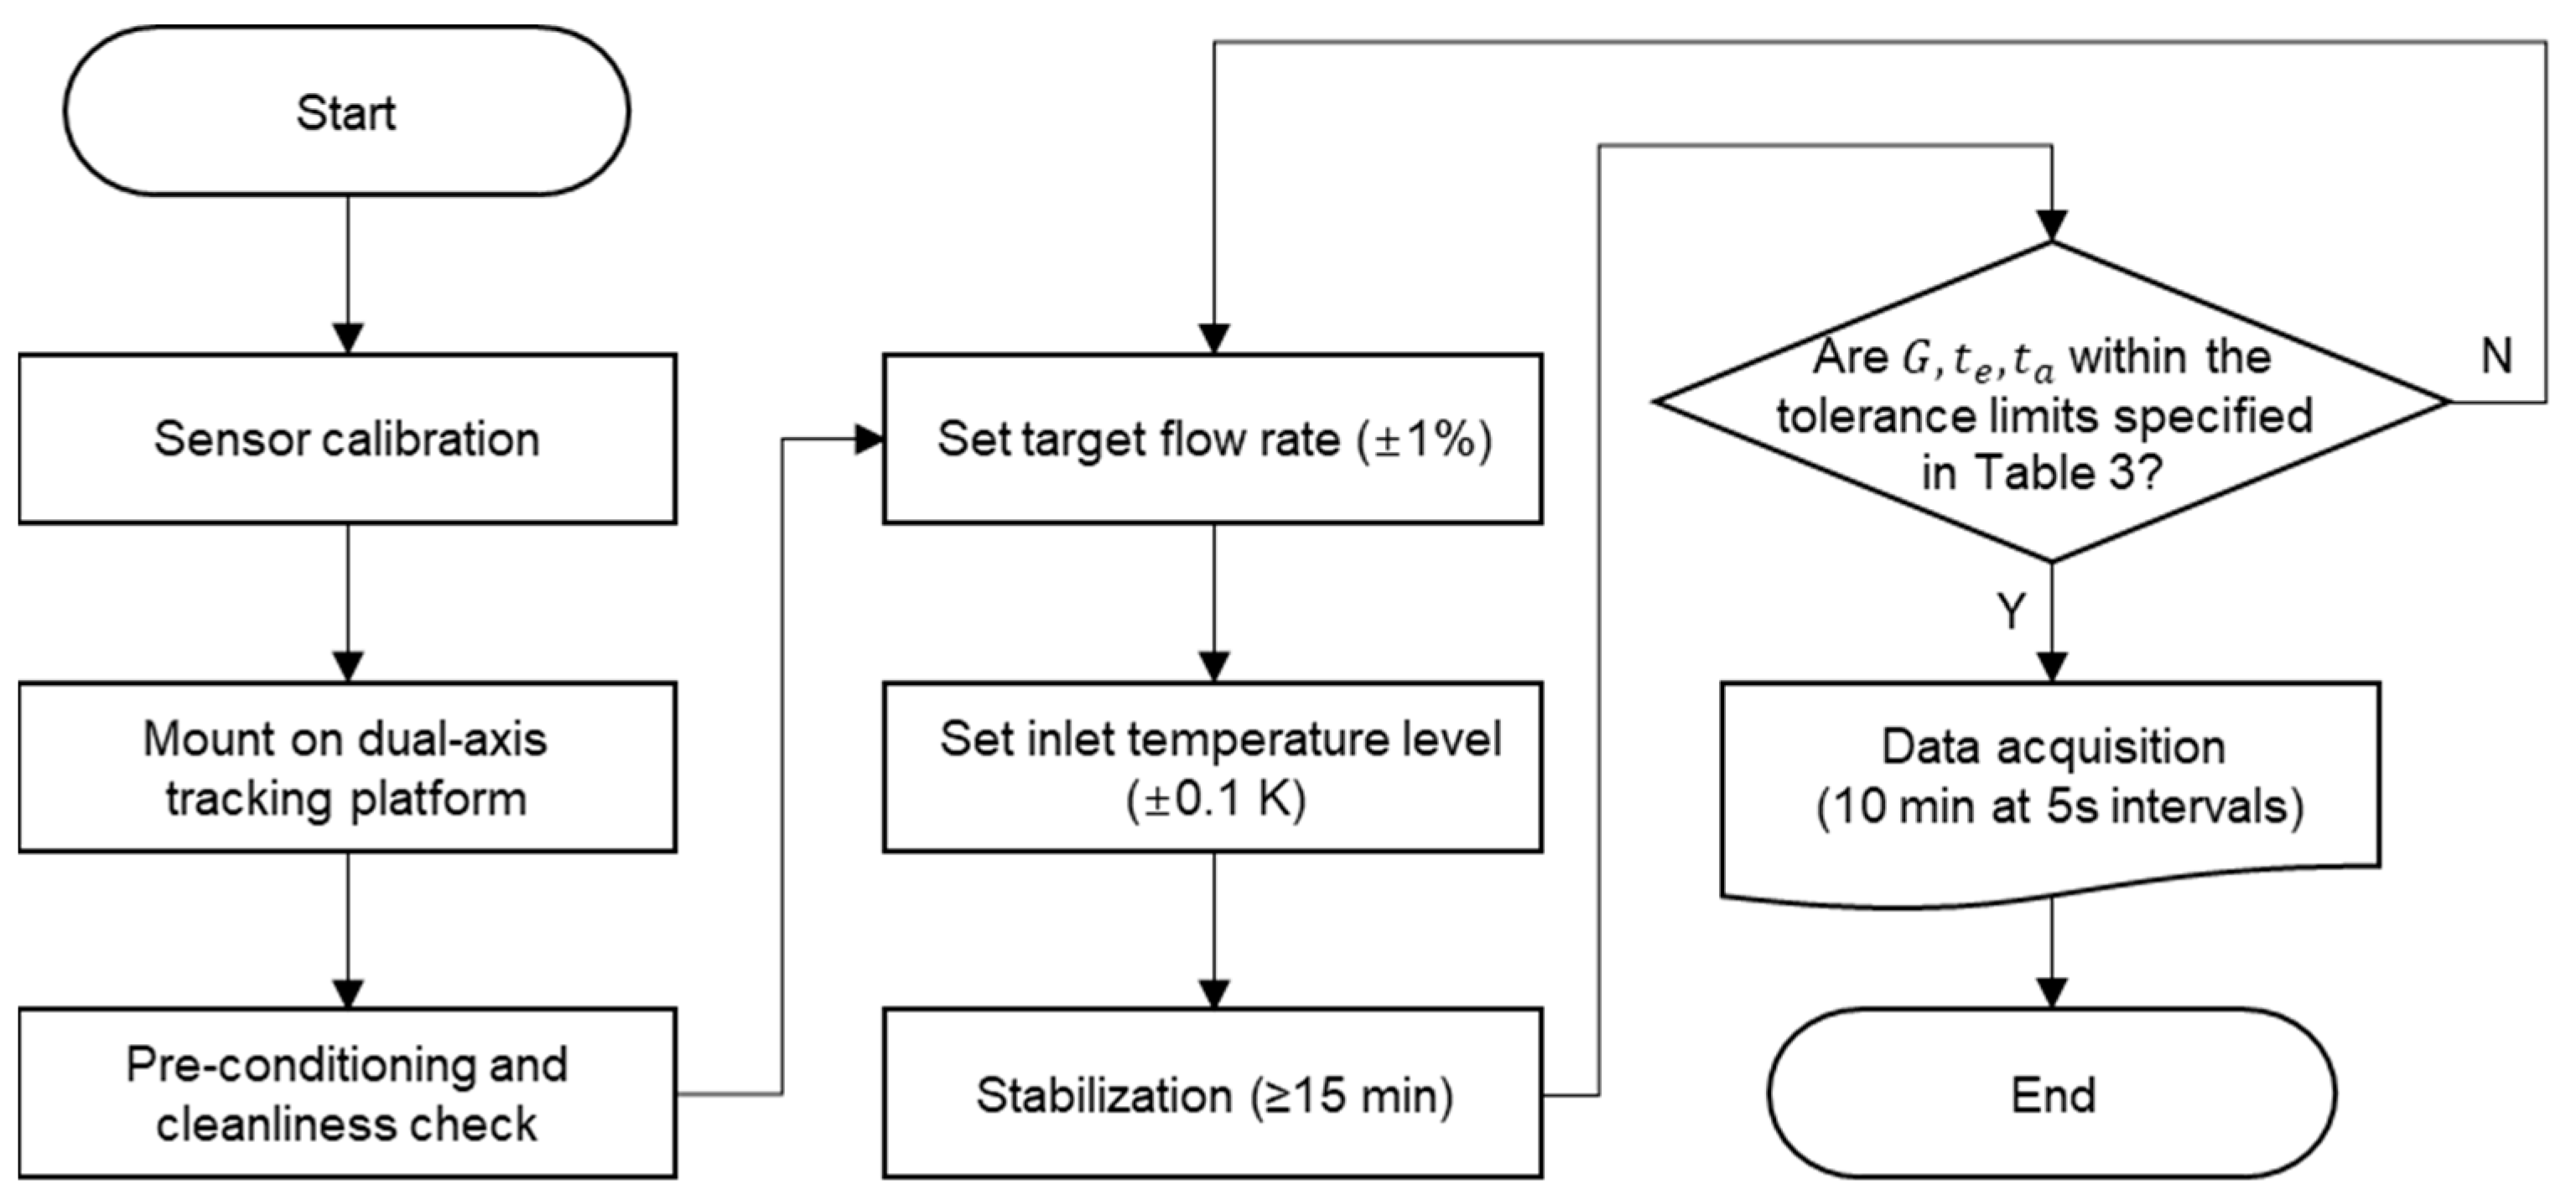
The experimental procedure was carried out in full compliance with the national standard KS B 8295:2023, which incorporates key elements of ISO 9806:2025. Outdoor thermal efficiency testing was conducted using a dedicated test apparatus designed to meet the dimensional, operational, and measurement requirements specified in the standards, as illustrated in the flow diagram in Figure 2. All instrumentation, data acquisition methods, and environmental conditions adhered strictly to the prescribed guidelines to ensure the reliability and reproducibility of the results.

3.1. Experimental Setup

The experimental setup was designed to fully comply with the thermal performance testing requirements of KS B 8295:2023 and ISO 9806:2025 (Figure 3). The test loop was thermally insulated to ensure a heat loss rate of less than 0.2 W/K, as specified in the standards. A circulation pump provided continuous flow of the working fluid, while a chiller dissipated excess heat from the collected fluid. A thermostatic bath, combined with a high-precision temperature controller, was employed to maintain a stable inlet temperature throughout the test.
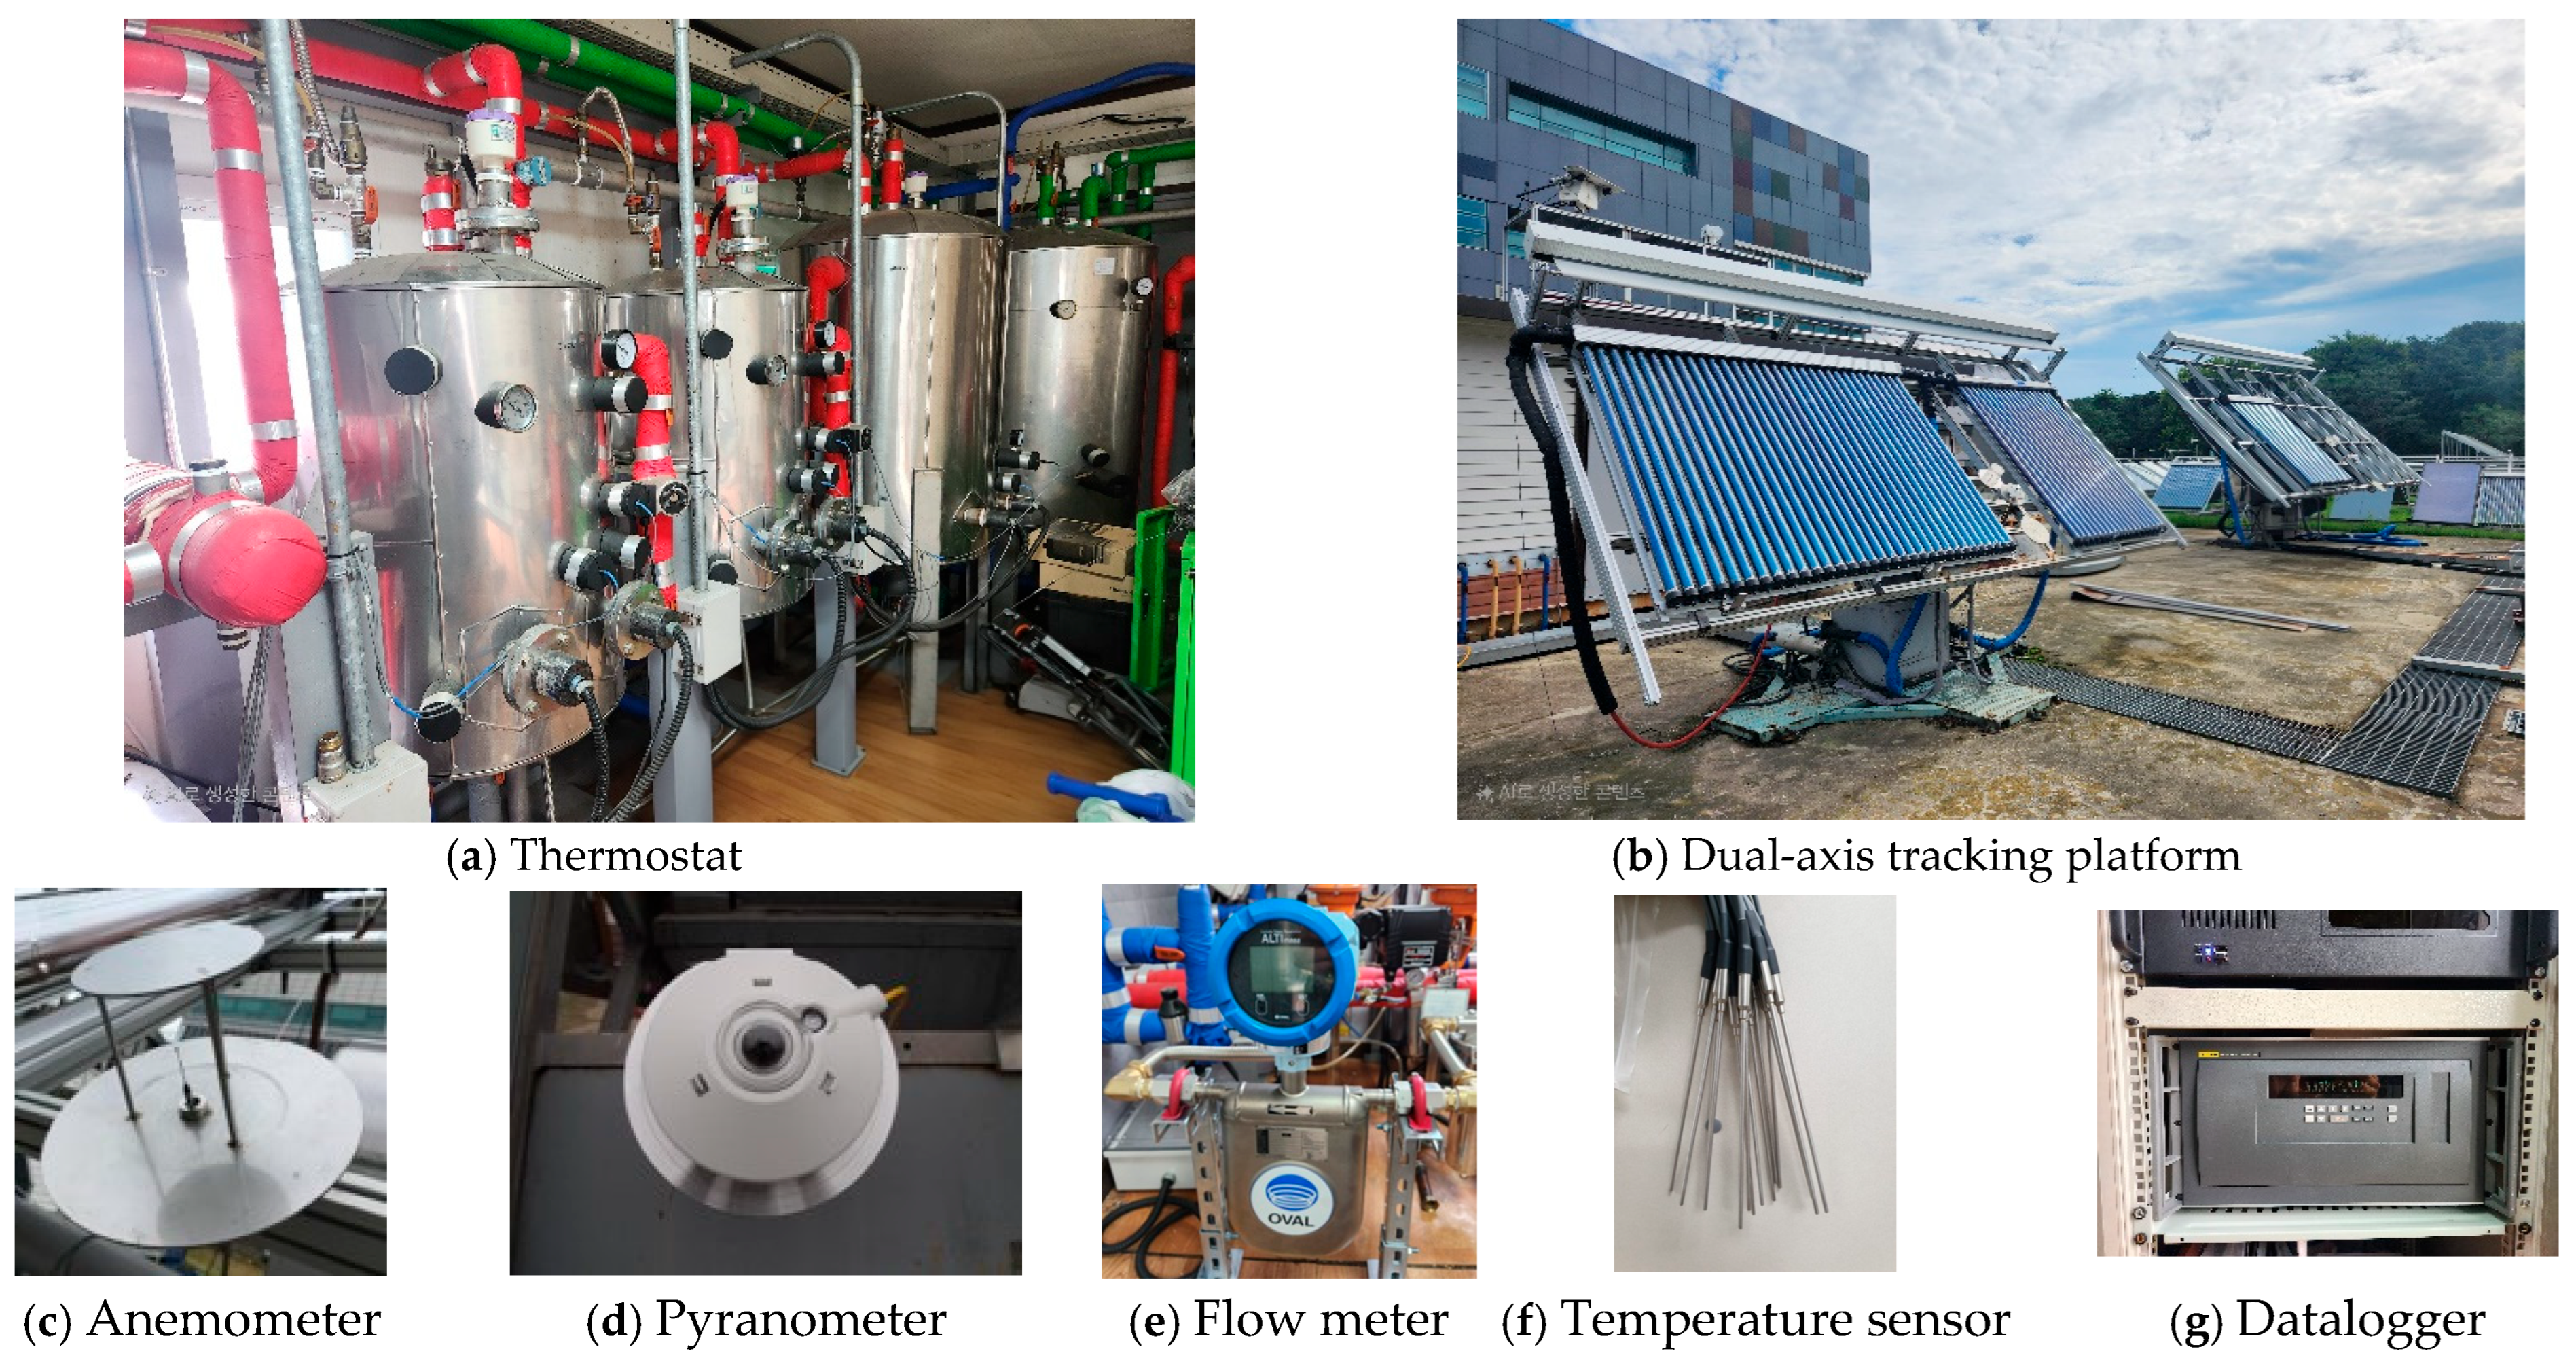
The solar collector was mounted on an automatic dual-axis tracking platform (Figure 4), which continuously adjusted azimuth and tilt angles to maintain optimal solar alignment. The measurement instruments included a thermostat, anemometer, pyranometer, flow meter, temperature sensors, and a data logger, as labeled in Figure 4a–g.
Table 3 summarizes the standard requirements for measurement instruments alongside the specifications of the equipment used in this study. Notably, several devices exceeded the minimum accuracy requirements; for example, a Class A pyranometer (KS B ISO 9060:2018) was used instead of the Class B minimum requirement, thereby reducing uncertainty in solar irradiance measurements [26]. Similarly, temperature sensors achieved a standard uncertainty of 0.045 K—well within the specified ±0.1 K.

3.2. Experimental Method

The thermal performance test aimed to derive the collector’s instantaneous efficiency model as a function of operating temperature, in full compliance with KS B 8295:2023 (Section 8.1.4: Outdoor thermal efficiency test) and ISO 9806:2025 (Section 22: Thermal performance test procedures). These standards were selected to ensure that the results are directly comparable with both national certification requirements and internationally recognized testing standards.
The experiment was conducted under outdoor conditions meeting the minimum test requirements of ISO 9806:2025, with global solar irradiance above 700 W/m2, wind speed below 4 m/s, and clear-sky conditions. The solar collector was installed on a dual-axis solar tracker, maintaining an incidence angle of 0° in both horizontal and vertical planes for optimal solar alignment throughout the day.
Prior to testing, a pre-conditioning stage was performed, including a visual inspection to verify the absence of moisture within the transparent cover and confirmation of surface cleanliness. Following installation, the collector was brought to steady-state operation by circulating the working fluid at the target flow rate and inlet temperature for at least 10 min before data acquisition. Thermal performance indicators—such as inlet/outlet temperatures, flow rate, and irradiance—were recorded at 5 s intervals.

3.2.1. Test Conditions

During testing, the incident solar radiation was maintained at a minimum of 700 W/m2. Experiments were performed across the full operating temperature range of the collector under clear sky conditions.
Initially, the collector inlet temperature was adjusted within ±3 K of the ambient air temperature, and the maximum inlet temperature was raised above 80 °C. For each inlet temperature interval, at least four independent data points were collected.
To evaluate the effect of flow rate on thermal performance, tests were conducted under three flow rate conditions. The lowest flow rate was set at 0.042 kg/s based on the collector’s aperture area of 2.10 m2. The flow rate was then increased in increments of 0.025 kg/s.
For each temperature level, the flow rate was maintained within ±1% of the target value and was controlled to avoid deviations exceeding ±10% between different temperature intervals.

3.2.2. Steady-State Test Procedure

After the pre-conditioning procedure, tests were conducted once the solar collector had reached a steady-state condition. A minimum stabilization period of 15 min was observed prior to data collection. Data was then recorded for 10 min under steady-state conditions.
Only data that met the allowable error limits presented in Table 4 was considered valid for analysis.

3.3. Instantaneous Efficiency of the Collector

Under steady-state conditions, the instantaneous efficiency of a solar collector is defined as the ratio of the useful heat collected to the solar radiation incident on the aperture area. The collected heat Q ˙ can be expressed as:
Q ˙ = A a G η
where A a is the aperture area, G is the solar irradiance on the collector plane, and η is the instantaneous efficiency.
Alternatively, the collected thermal energy can be calculated based on the specific heat of the working fluid, the mass flow rate, and the inlet-outlet temperature difference:
Q ˙ = m ˙ c f t i n Δ T
Here, the specific heat c f t i n of the fluid is evaluated at the inlet temperature and can be expressed as a polynomial function of temperature:
c f t i n = z 0 + z 1 t i n + z 2 t i n 2 + z 3 t i n 3 + z 4 t i n 4 + z 5 t i n 5 + z 6 t i n 6

3.4. Modeling of Instantaneous Efficiency

The instantaneous efficiency model is derived using the least-squares method and expressed as a quadratic function of the modified temperature difference:
η = η 0 a 1 T m a 2 G T m 2
The modified temperature difference Tm∗ is calculated as:
T m = t m t a G
where t m is the mean fluid temperature and t a is the ambient temperature.
The average collector output over the operating temperature ( t m t a ) range of 0 °C to 80 °C and at a solar irradiance of 1000 W/m2 is calculated by integrating the efficiency function as follows:
Q ¯ = G t m t a 0 80 η 0 a 1 t m t a G a 2 G t m t a G 2 d ( t m t a )

4. Results

In this study, steady-state outdoor thermal performance tests were conducted for a double-glass evacuated tube solar collector under three different mass flow rate conditions. Based on these tests, the instantaneous efficiency model equations were developed.
The results for each flow rate and inlet temperature range, along with the method for deriving the instantaneous efficiency models, are presented below.

4.1. Collector Efficiency Test Results

To analyze the effect of the mass flow rate of the working fluid on thermal performance, steady-state experiments were conducted under the following three flow rate conditions:
F1: 0.092 kg/s (highest flow rate)
F2: 0.067 kg/s
F3: 0.042 kg/s (lowest flow rate)
These conditions were used to evaluate how thermal performance varies with respect to flow rate.

Measurement Data

To develop the instantaneous efficiency models for each flow rate condition, solar irradiance, mass flow rate, inlet and outlet fluid temperatures, and ambient temperature were measured. All measurements complied with the allowable error ranges specified in Table 3, ensuring data reliability.
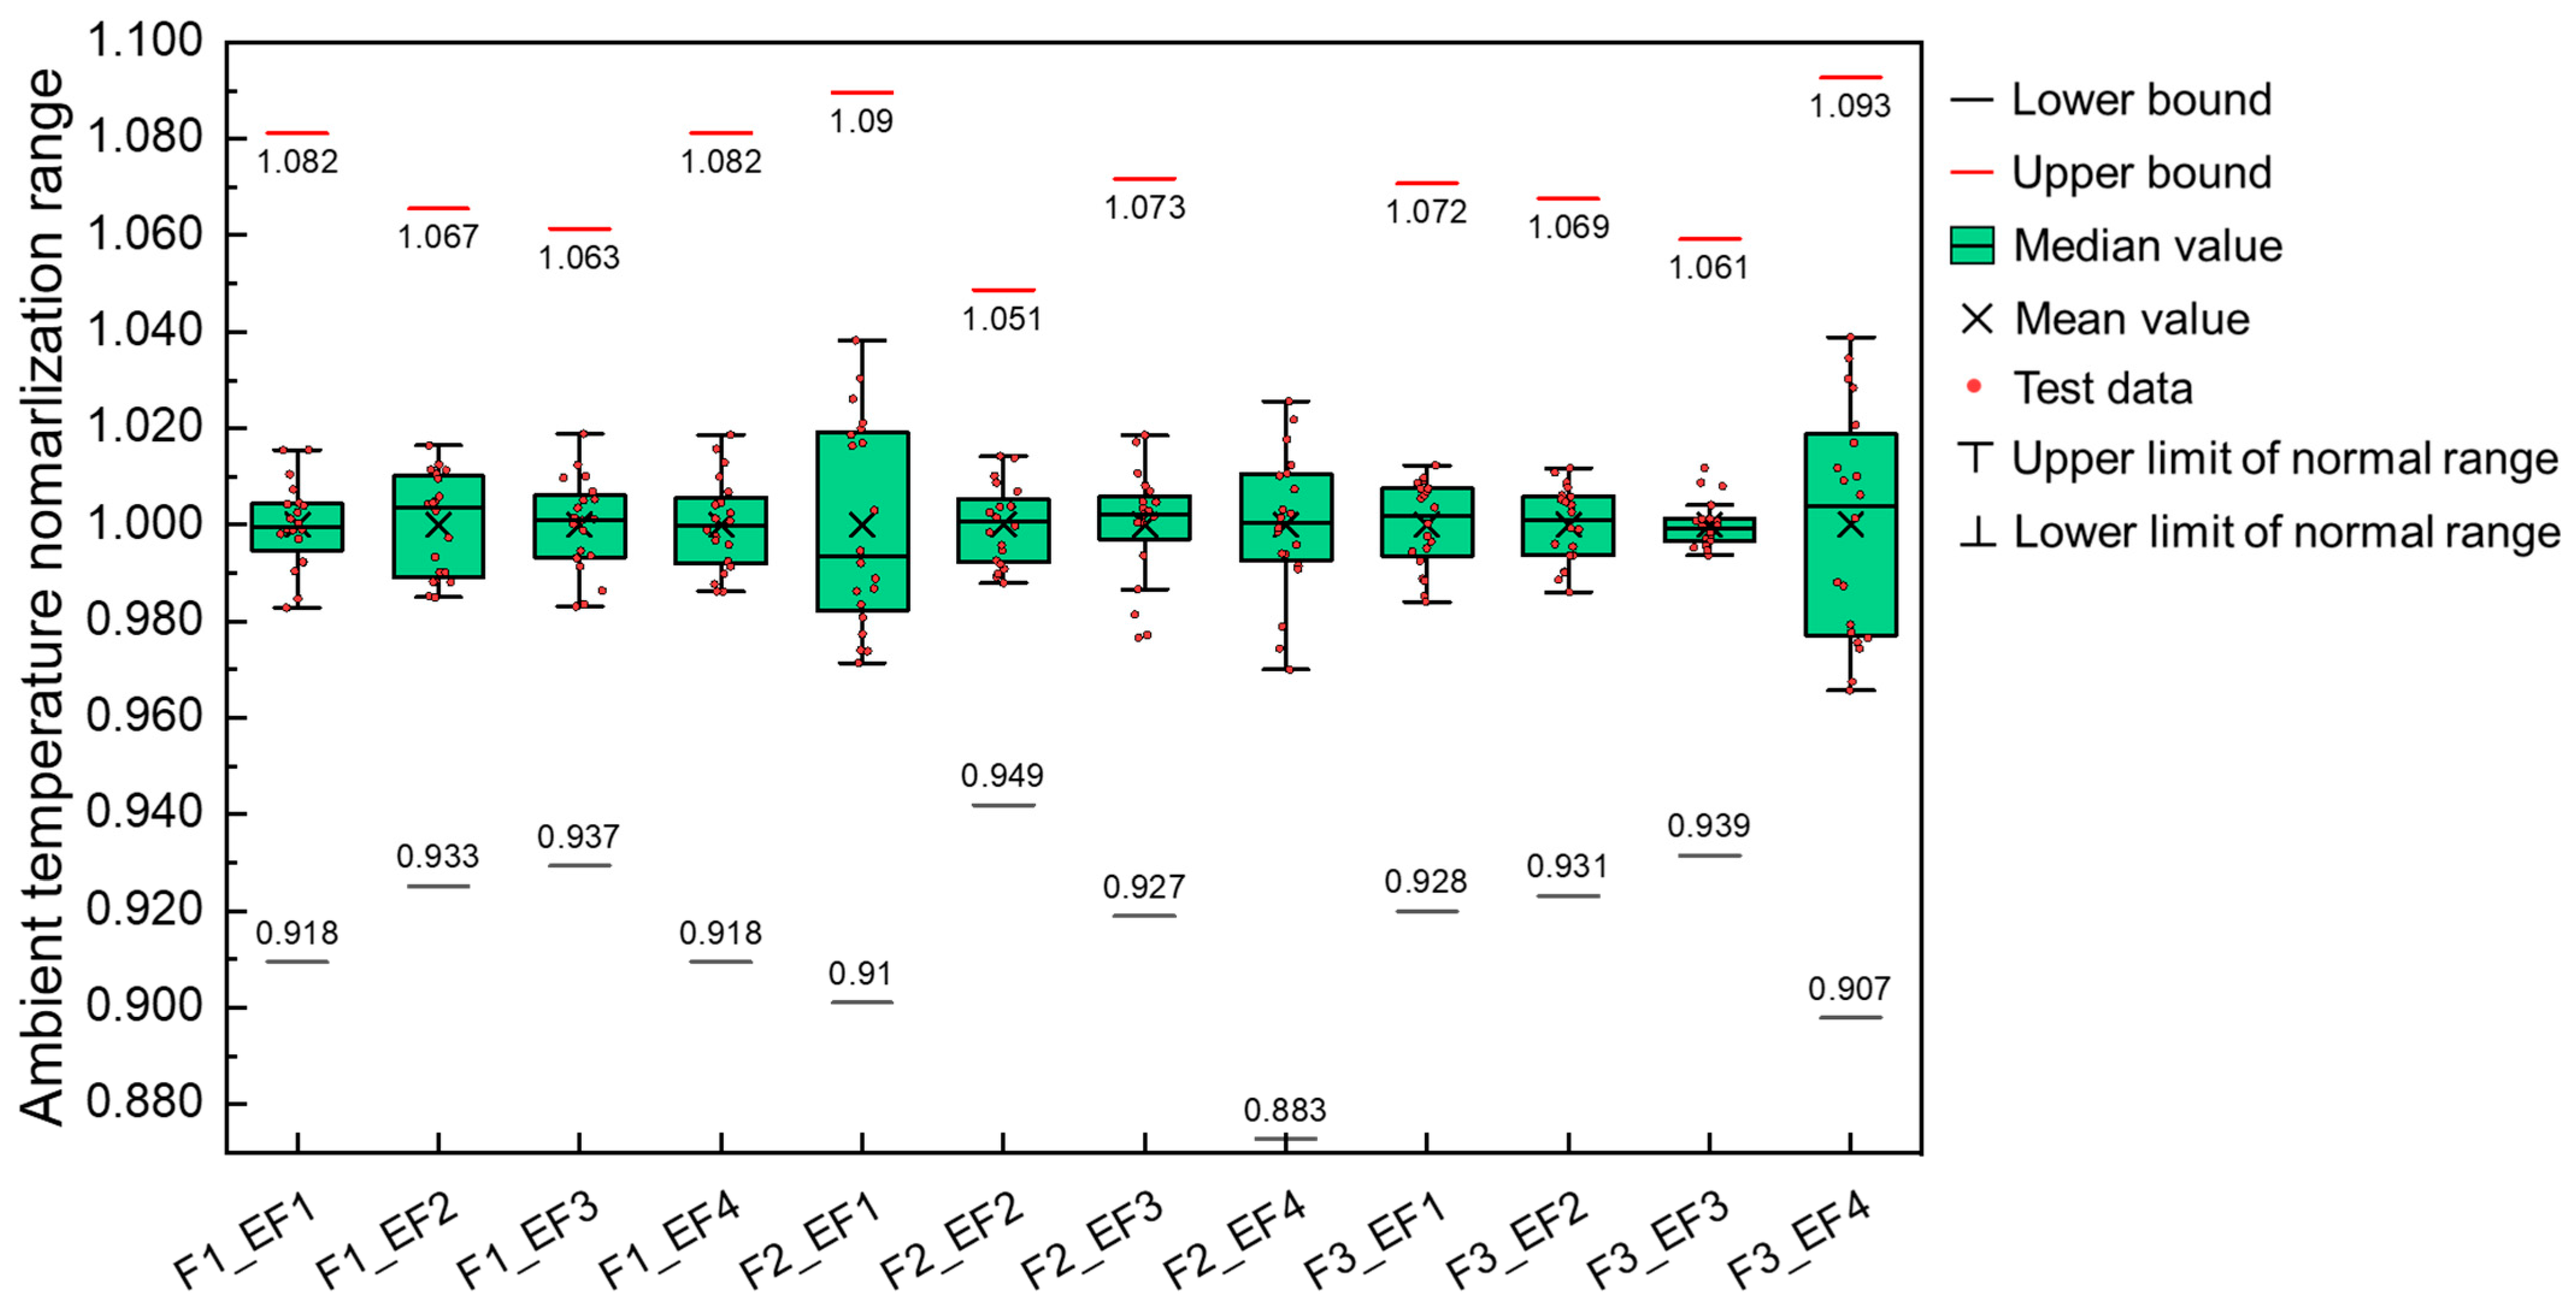
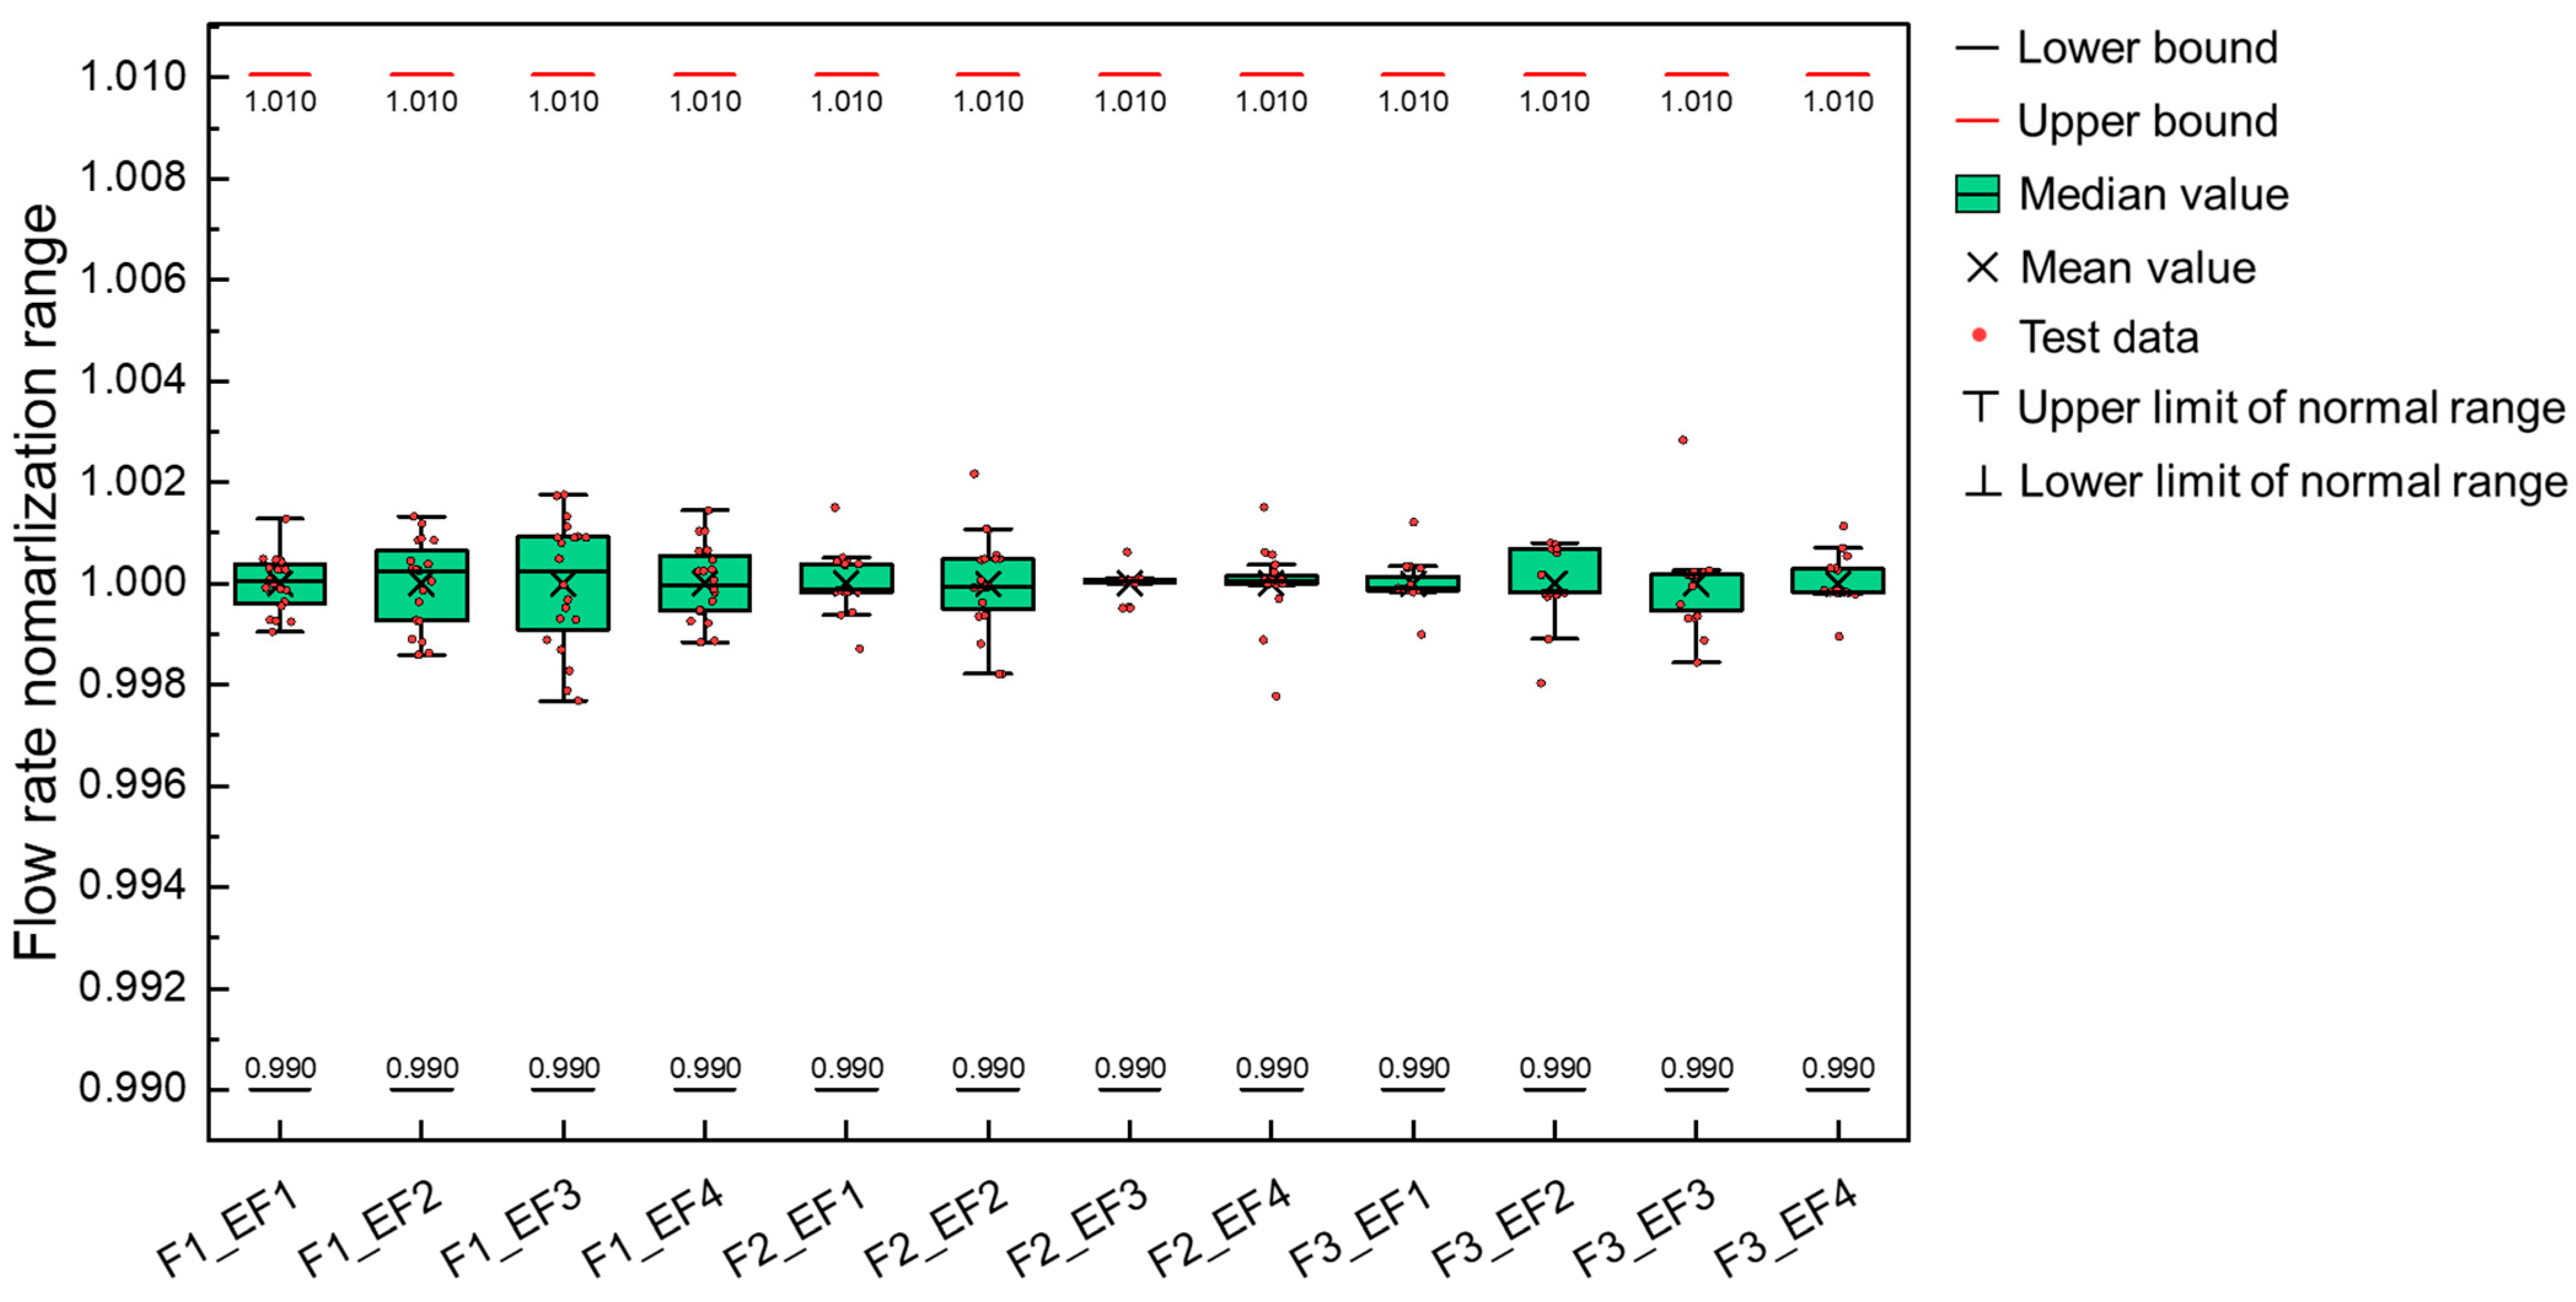
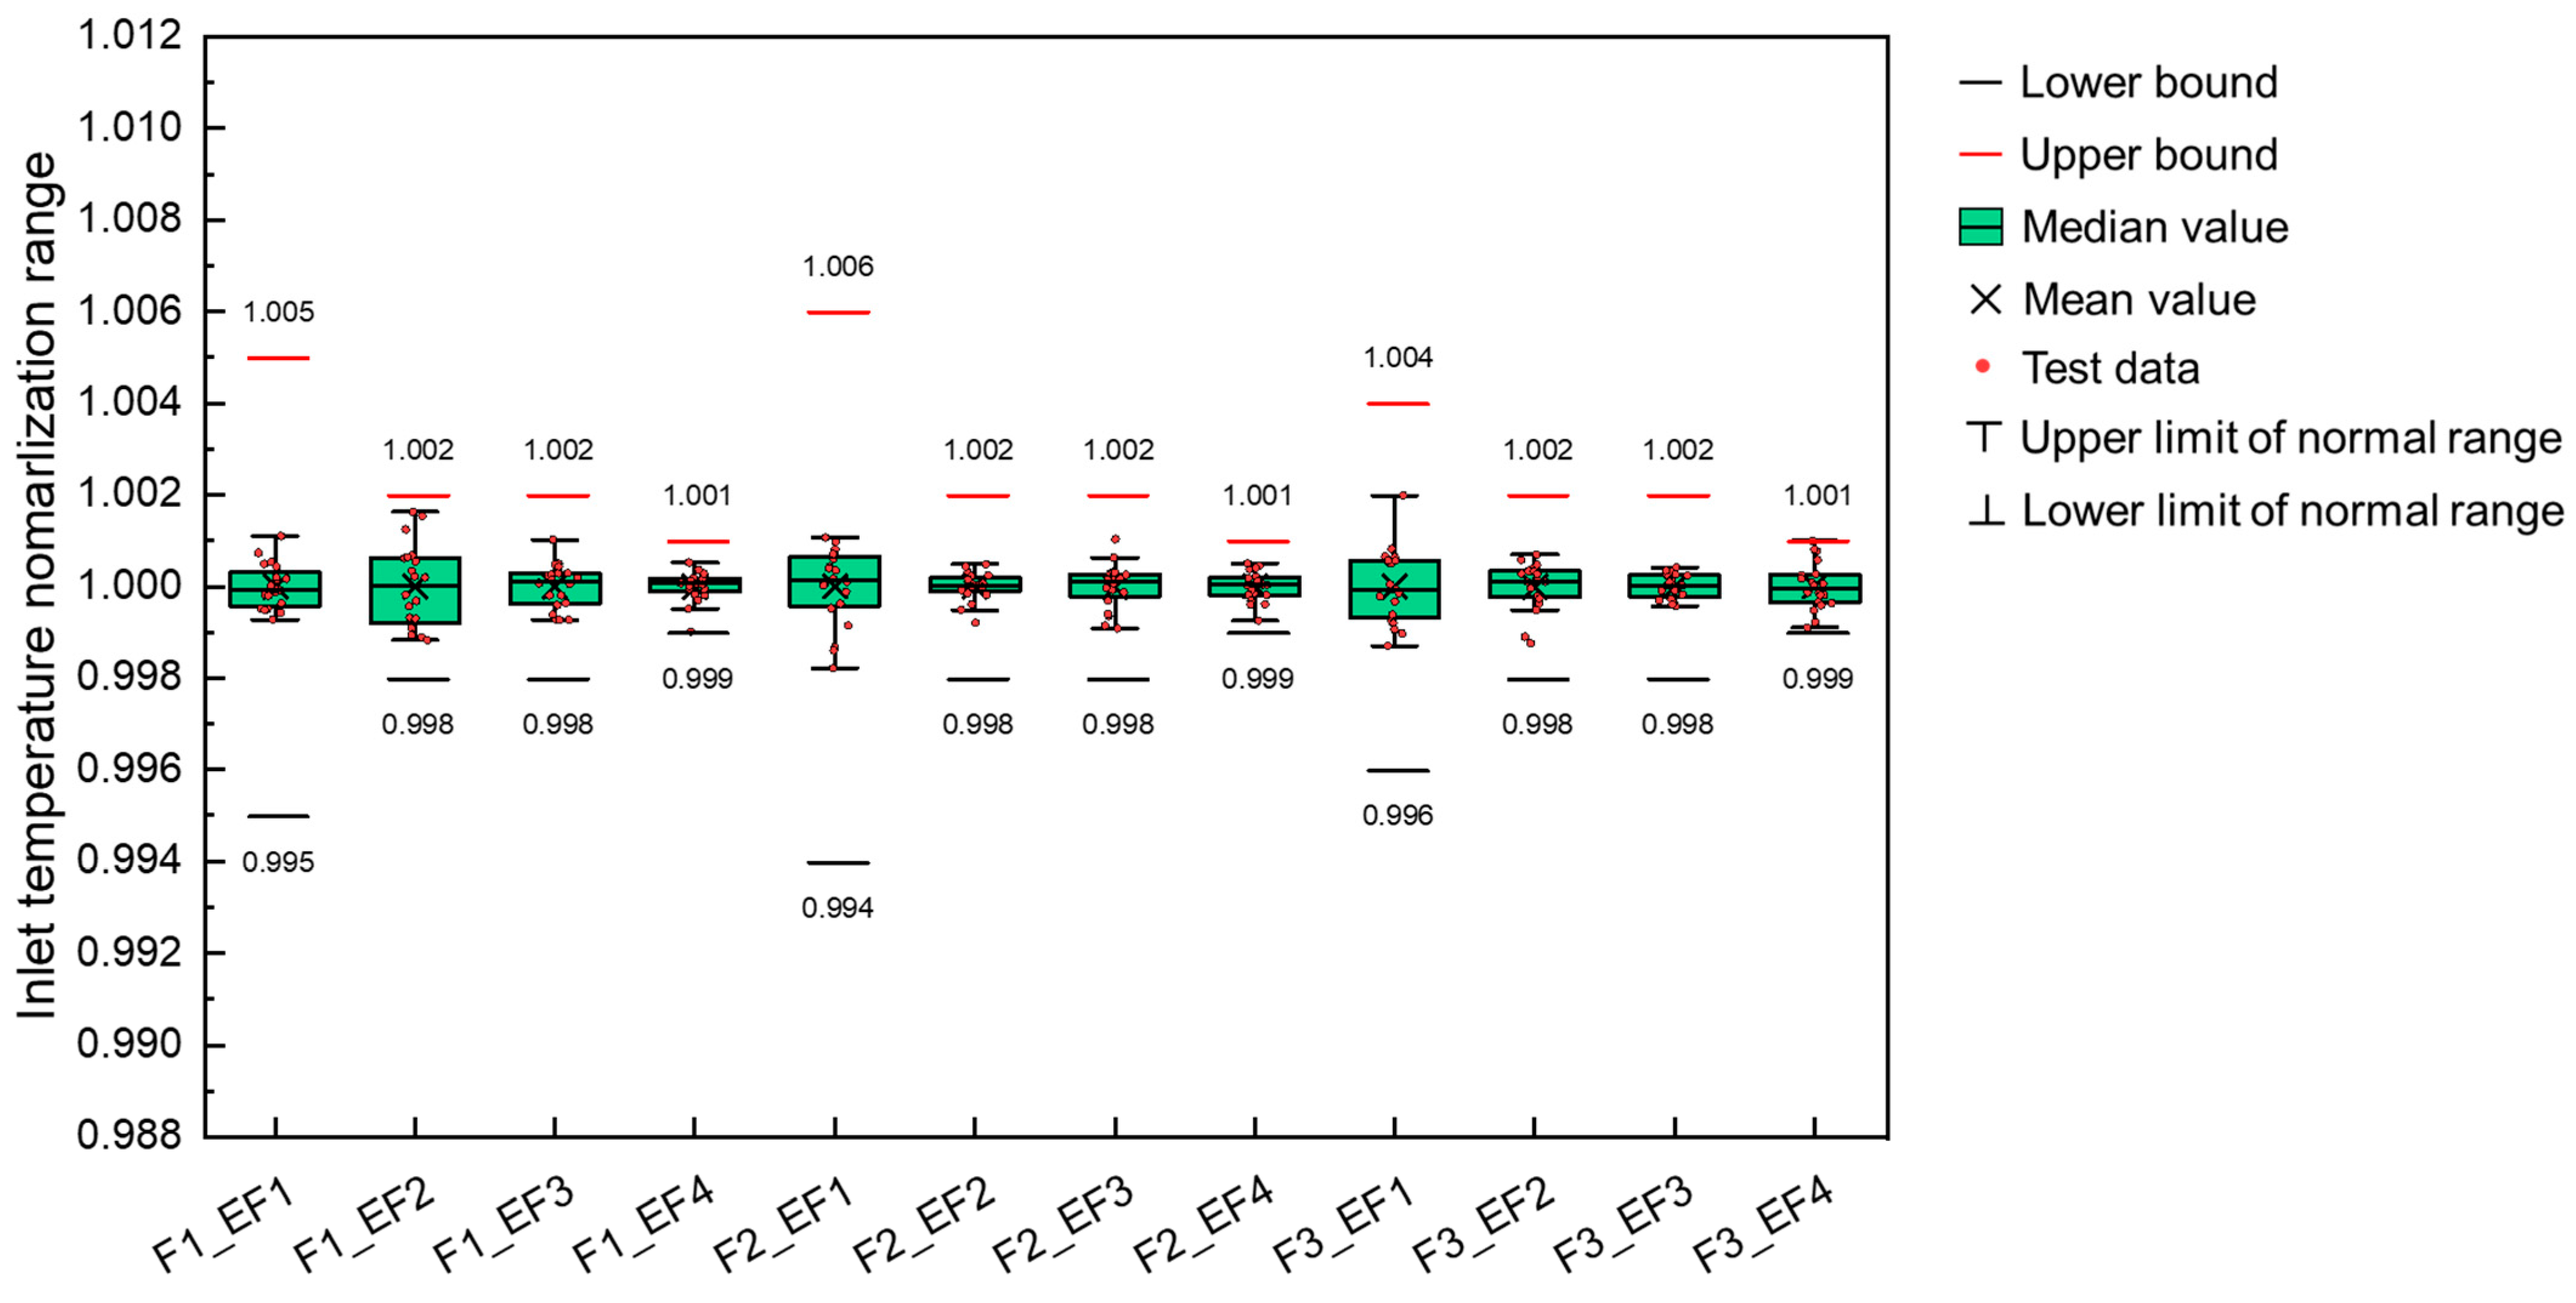
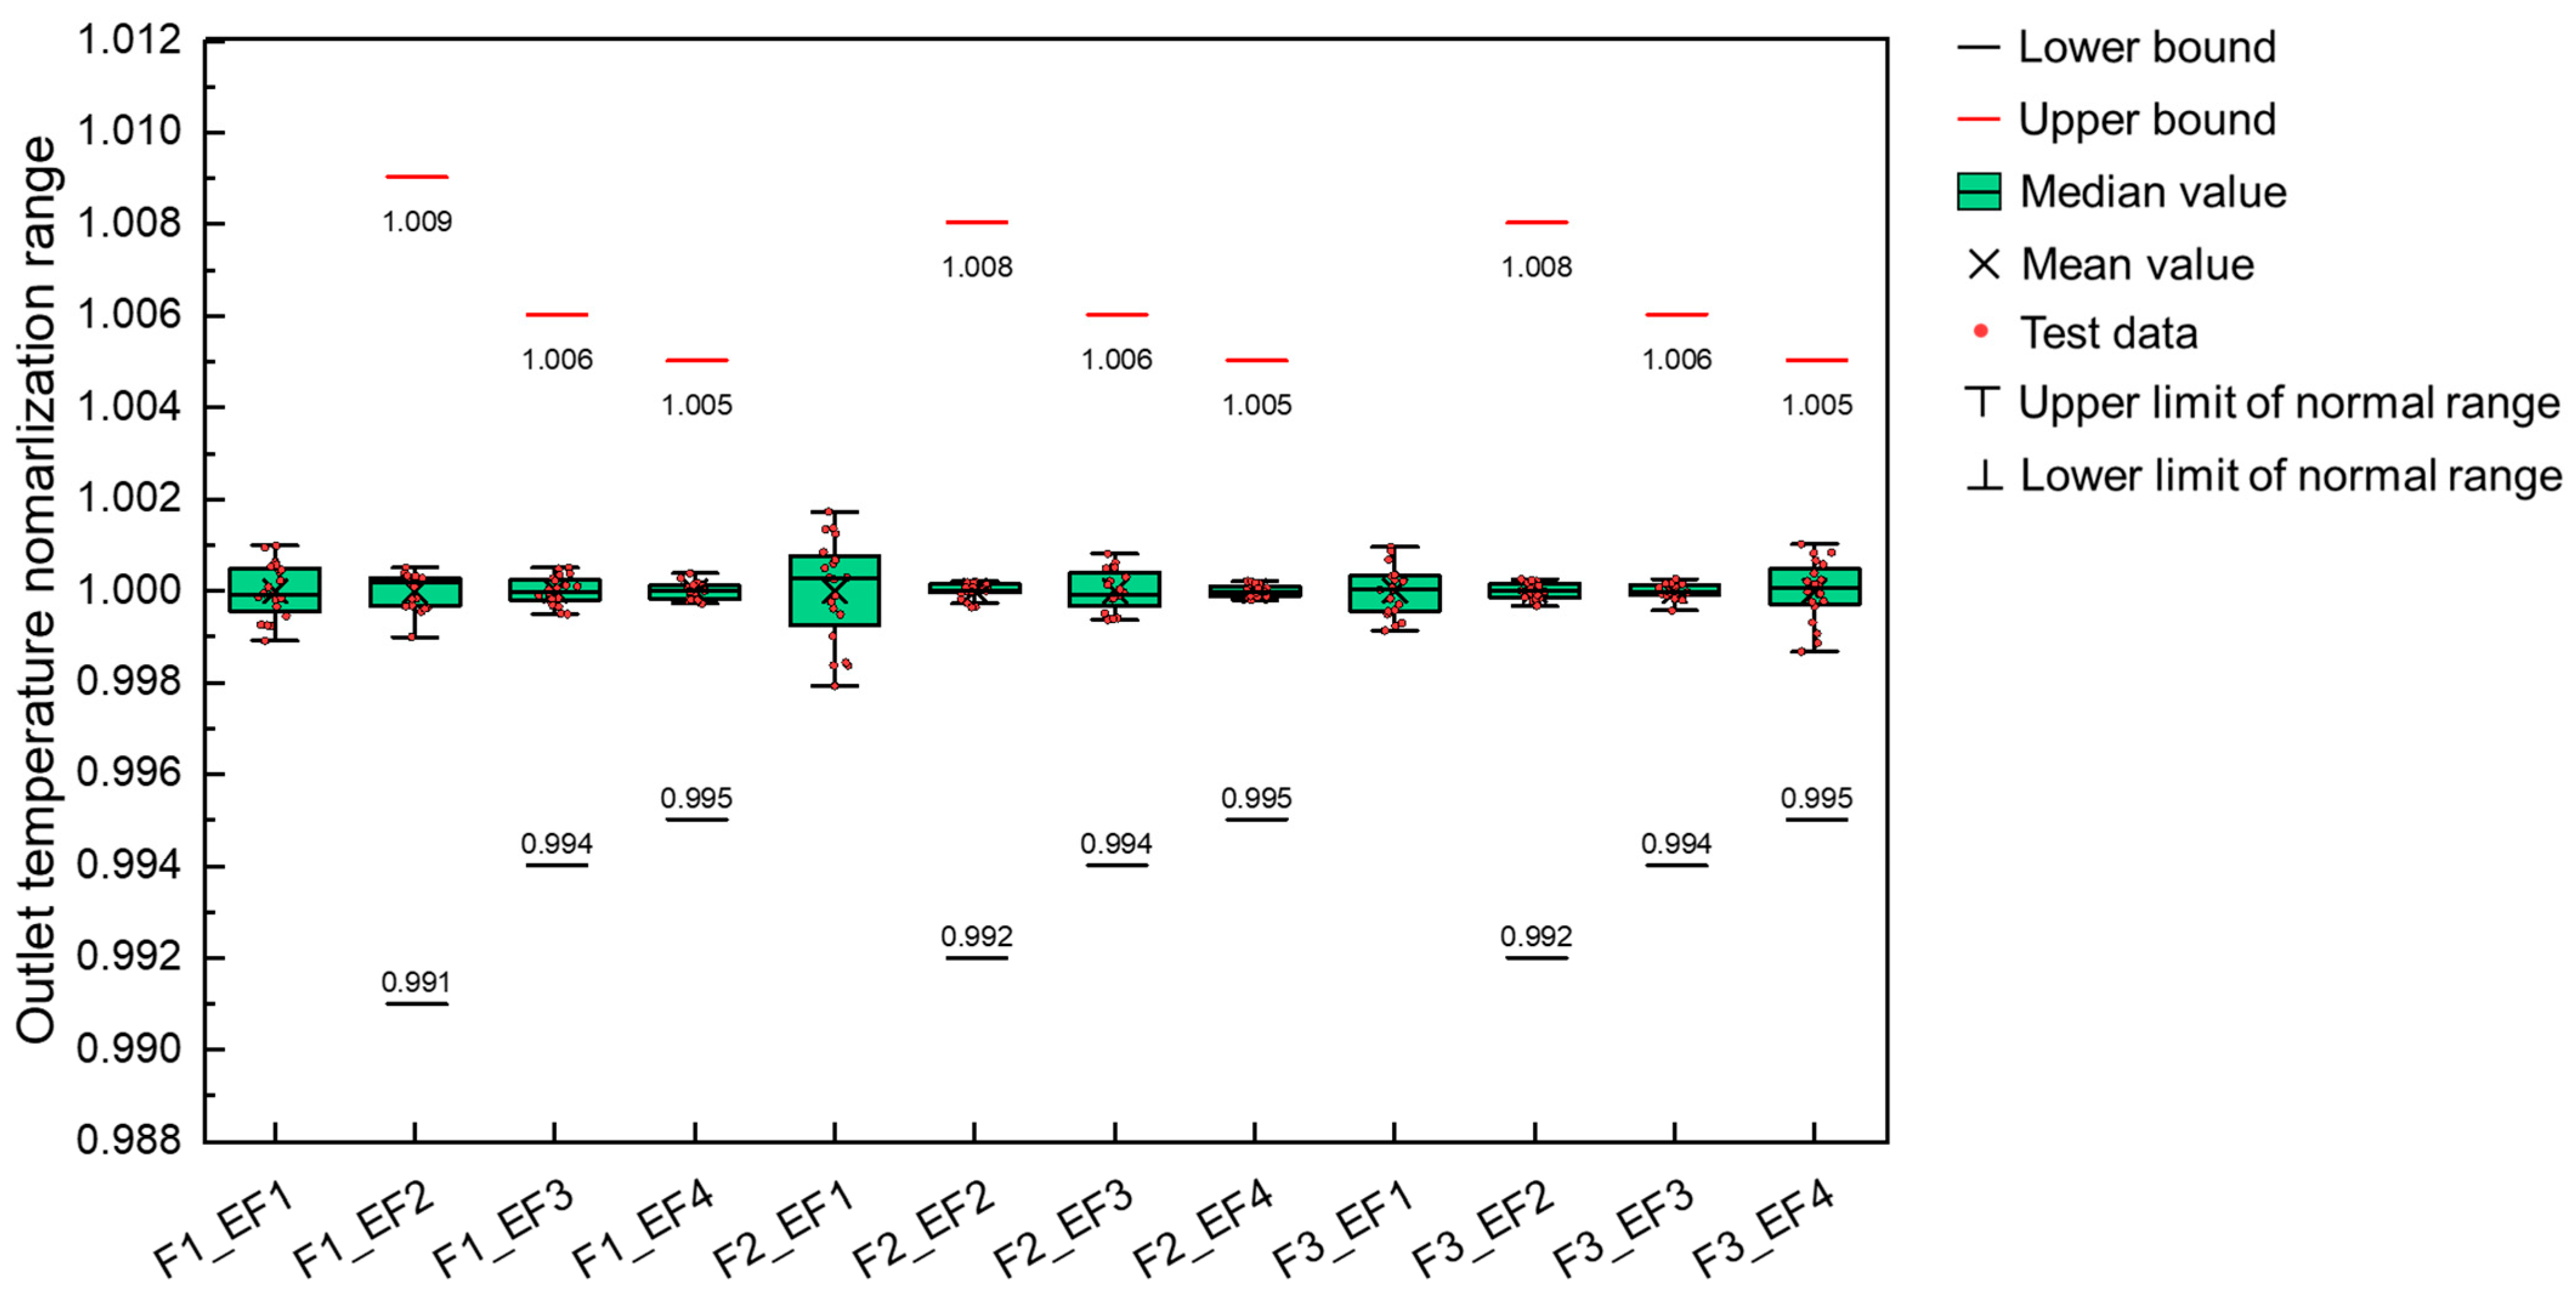
Figure 5, Figure 6, Figure 7, Figure 8 and Figure 9 illustrate the normalized values of the five key parameters for each test condition, obtained by dividing each measurement by its respective time-averaged value. The graphs also include the upper and lower tolerance limits for each parameter, enabling visual verification of measurement stability and compliance with the standard requirements.
Measurement data for instantaneous efficiency calculation were recorded at 5 s intervals over a 10 min period after the collector had reached steady-state operation. For subsequent analysis, 5 min averaged values were computed to minimize short-term fluctuations and measurement noise. All recorded values satisfied the accuracy and tolerance criteria specified in the relevant standards. The averaged results for each test case are presented in Table 5.

4.2. Instantaneous Efficiency Modeling

According to the relevant standards, the instantaneous thermal efficiency of a solar collector can be expressed as a quadratic function of the reduced temperature difference, as shown in Equation (4): The coefficient a 1 (first-order heat loss coefficient) represents thermal losses primarily due to convection and conduction between the collector surface and the ambient air. The coefficient a 2 (second-order heat loss coefficient) accounts for radiation-related losses and internal fluid dynamics. The intercept η 0 corresponds to the theoretical maximum efficiency of the collector under ideal conditions.
This model equation is widely adopted in international testing standards (e.g., ISO 9806:2025 and KS B 8295:2023) due to its capability to capture both linear and nonlinear thermal loss mechanisms, thereby enabling reliable performance prediction under varying operating conditions.

Instantaneous Efficiency Model

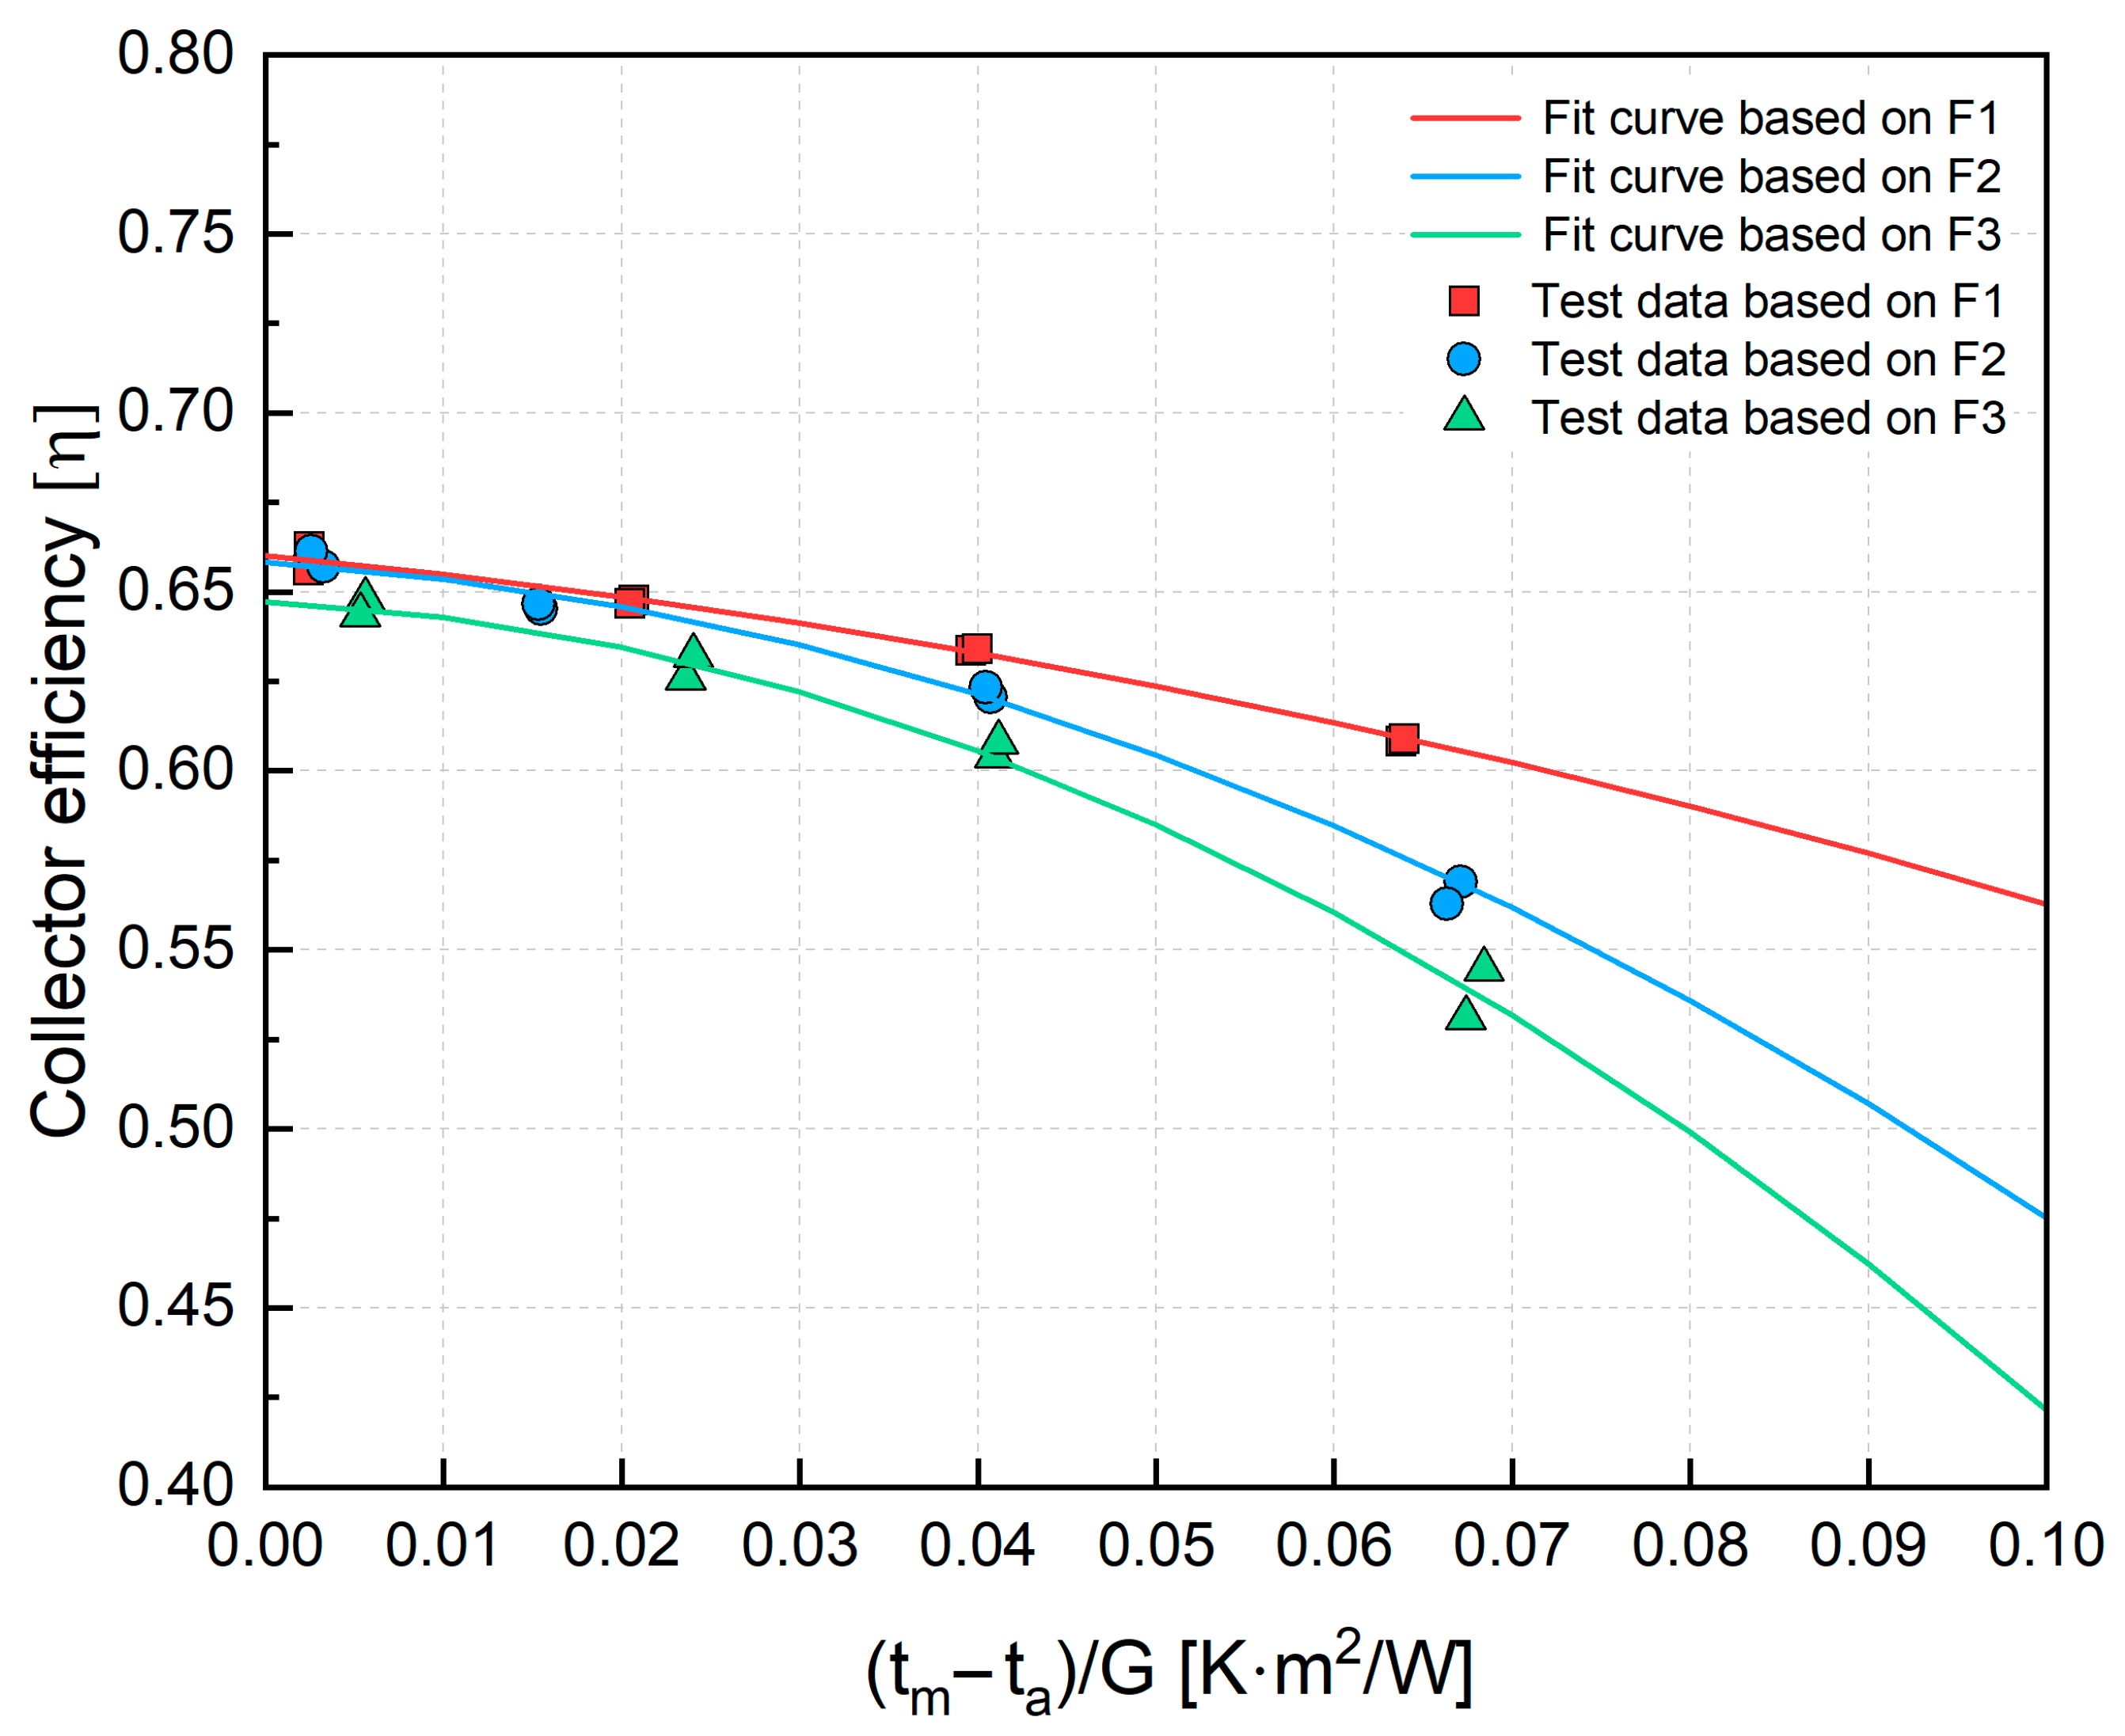
Figure 10 presents the instantaneous efficiency curves for each mass flow rate condition, while Table 6 summarizes the fitted coefficients—maximum efficiency ( η 0 ), first-order heat loss coefficient ( a 1 ), second-order heat loss coefficient ( a 2 )—and the corresponding average thermal outputs ( Q ¯ ).
As the flow rate increased, the maximum efficiency exhibited only minor changes (variation within 2%), indicating that η 0 is relatively insensitive to flow rate changes under the tested conditions. In contrast, a 1 increased with higher flow rates, whereas a 2 decreased. This trend suggests that:
At lower flow rates, internal convective heat transfer between the heat pipe and the working fluid weakens, increasing internal thermal resistance and thus raising a 2 . This aligns with reduced Nusselt numbers and less effective heat removal from the absorber [27].
At higher flow rates, better internal heat transfer is achieved, lowering a 2 , but enhanced external convective losses from the collector surface to the ambient air increase a 1 .
The average thermal output ( Q ¯ ) was calculated by integrating the efficiency equation—comprising η 0 , a 1 , and a 2 —over the tested operating temperature range as shown in Equation (6). Table 7 presents the contribution of each coefficient to the total output.
The results show that a 2 had the most pronounced influence on Q ¯ . Under low-flow conditions (F3), the influence of a 2 on heat loss was more than four times greater than in high-flow conditions, leading to a ~6% drop in average output compared with F1. Physically, at low flow rates, heat is not extracted quickly enough, increasing collector temperature and thus radiative and high-temperature convective losses (ΔT2-dependent). As established by Duffie and Beckman [28], these losses are strongly influenced by the transparent cover design (for convection and radiation) and by the insulation quality of the cover and frame (for conduction).
Within the tested range, increasing the flow rate by approximately 37% above the reference condition increased average thermal output by 2.8%, while a 37% reduction in flow decreased it by 3.0%. The non-linear relationship indicates diminishing returns at higher flow rates. This dependency can be described by the empirical correlation:
Q r e f Q t Q r e f = α m ˙ r e f m ˙ t m ˙ r e f
where Q t and m ˙ t are the thermal output and mass flow rate under test conditions, Q r e f and m r e f are reference values, and α is approximately 0.08. This equation enables estimation of collector output under non-standard flow rates.
In summary, while low-flow operation slightly reduces low-temperature (linear) losses represented by a 1 , it substantially increases high-temperature (nonlinear) losses represented by a 2 , making the latter the dominant factor in performance degradation at reduced flow rates.
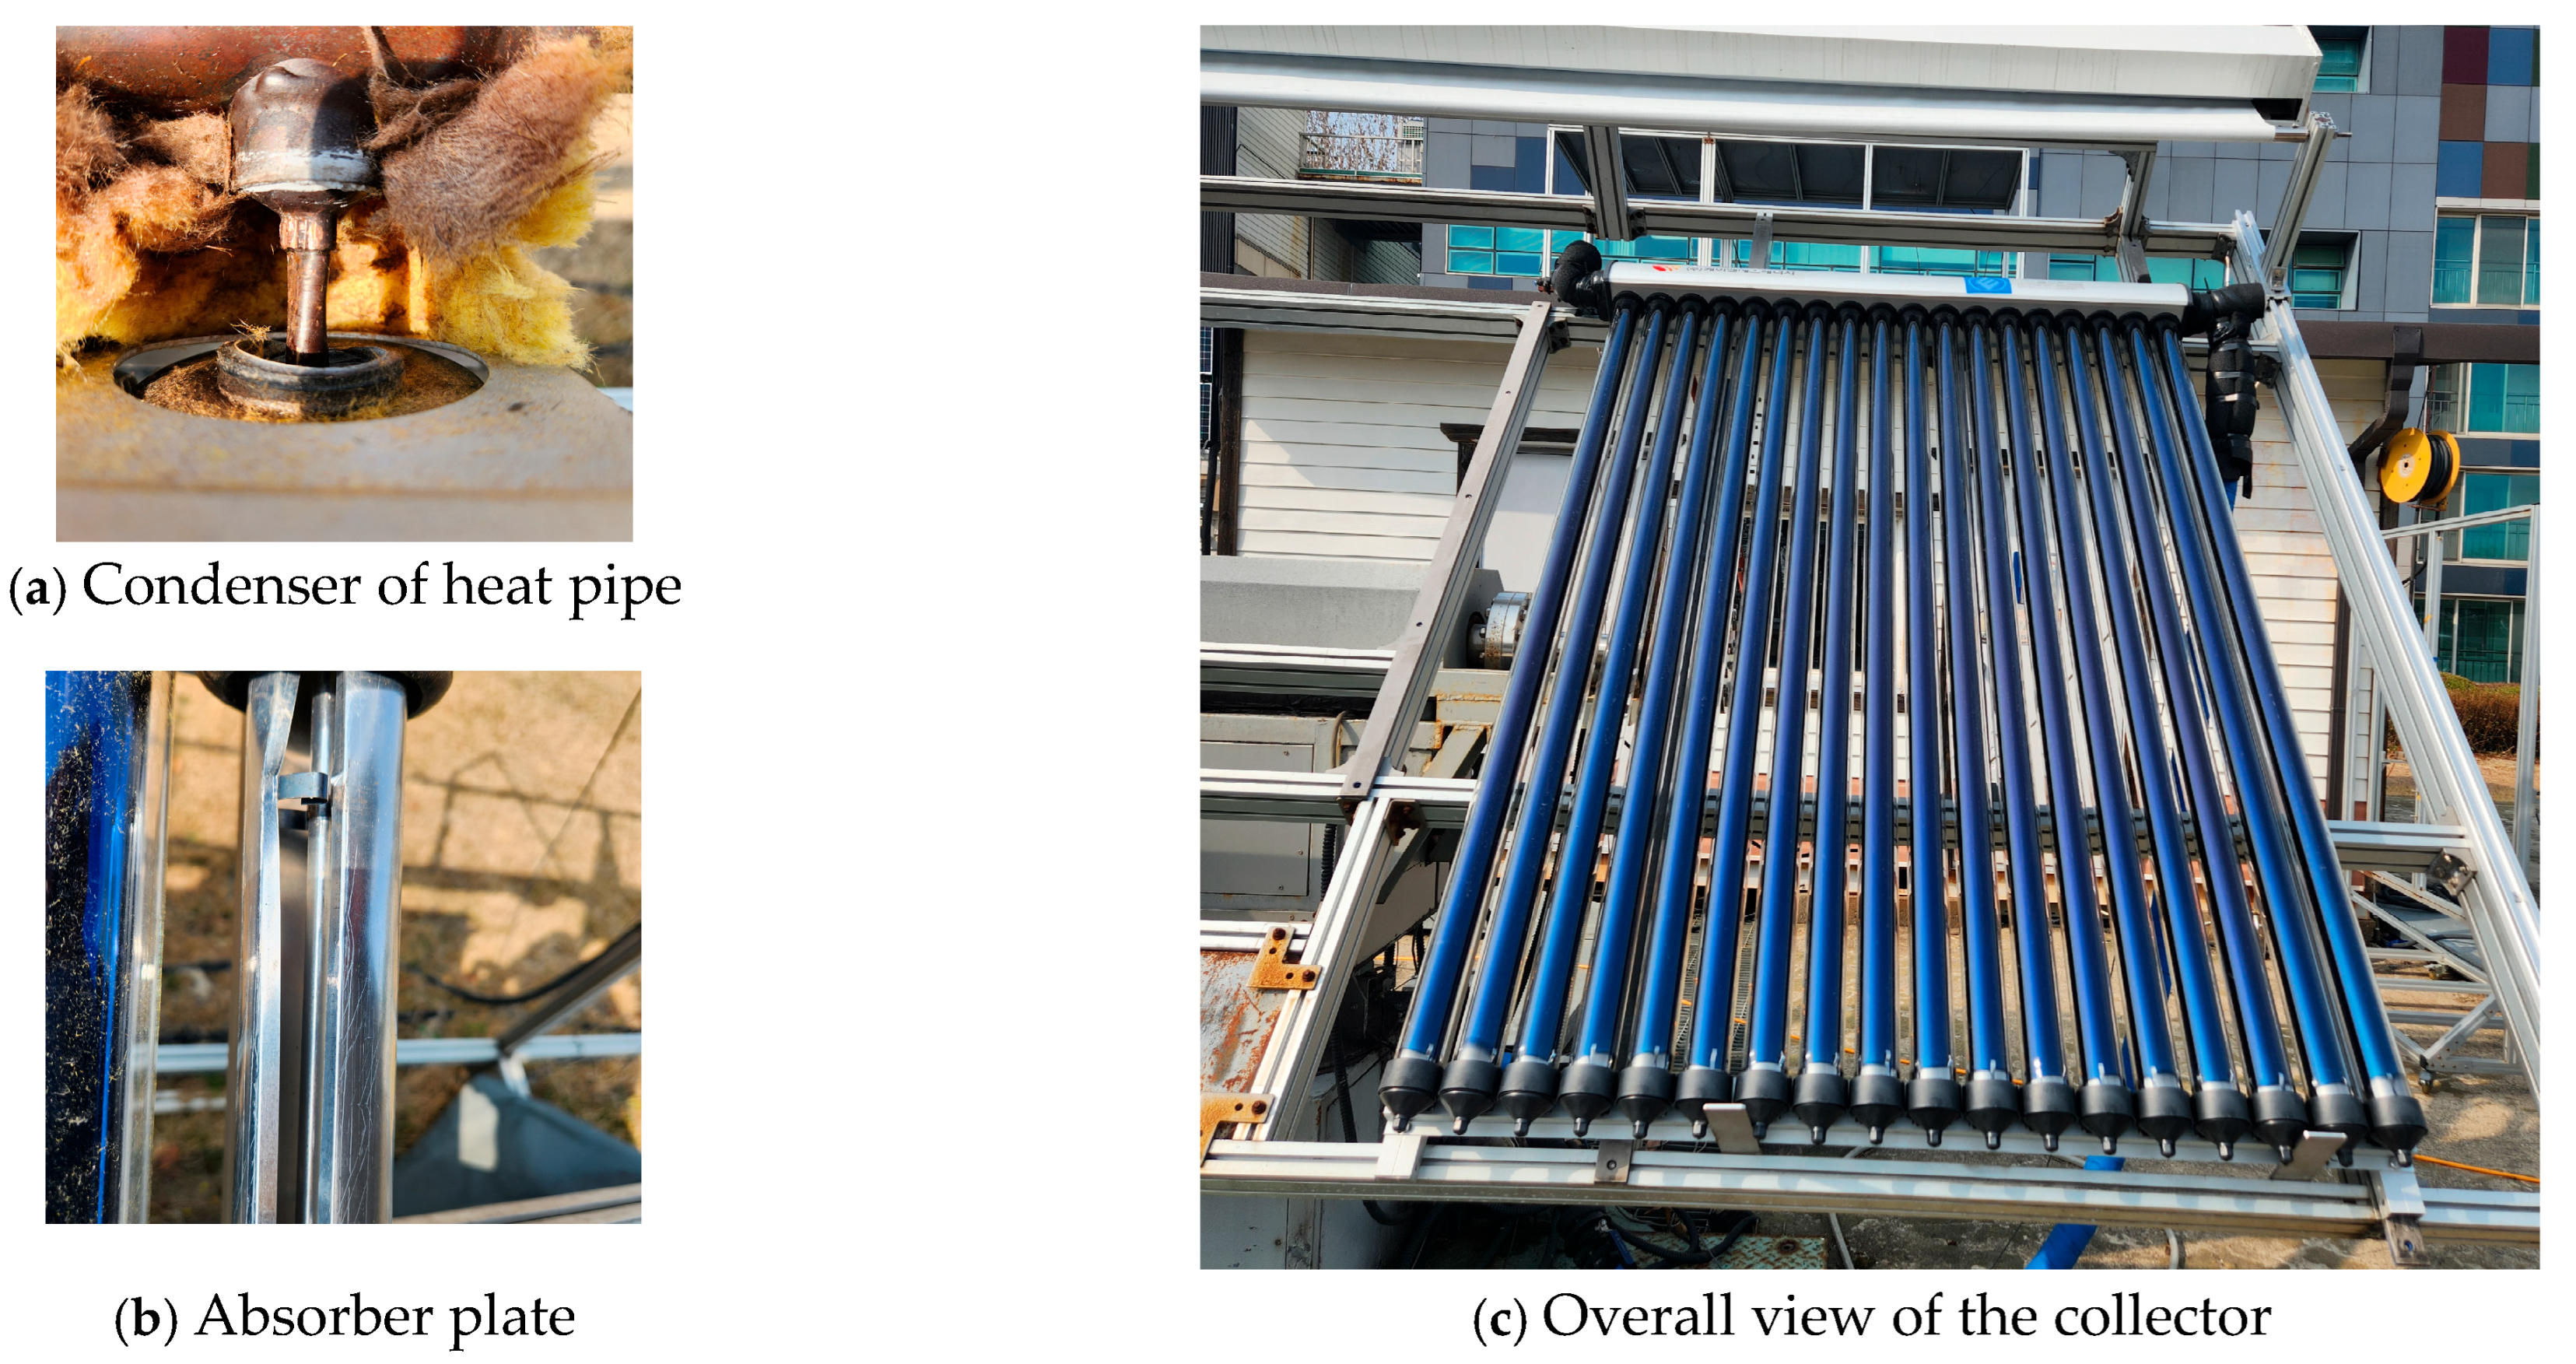
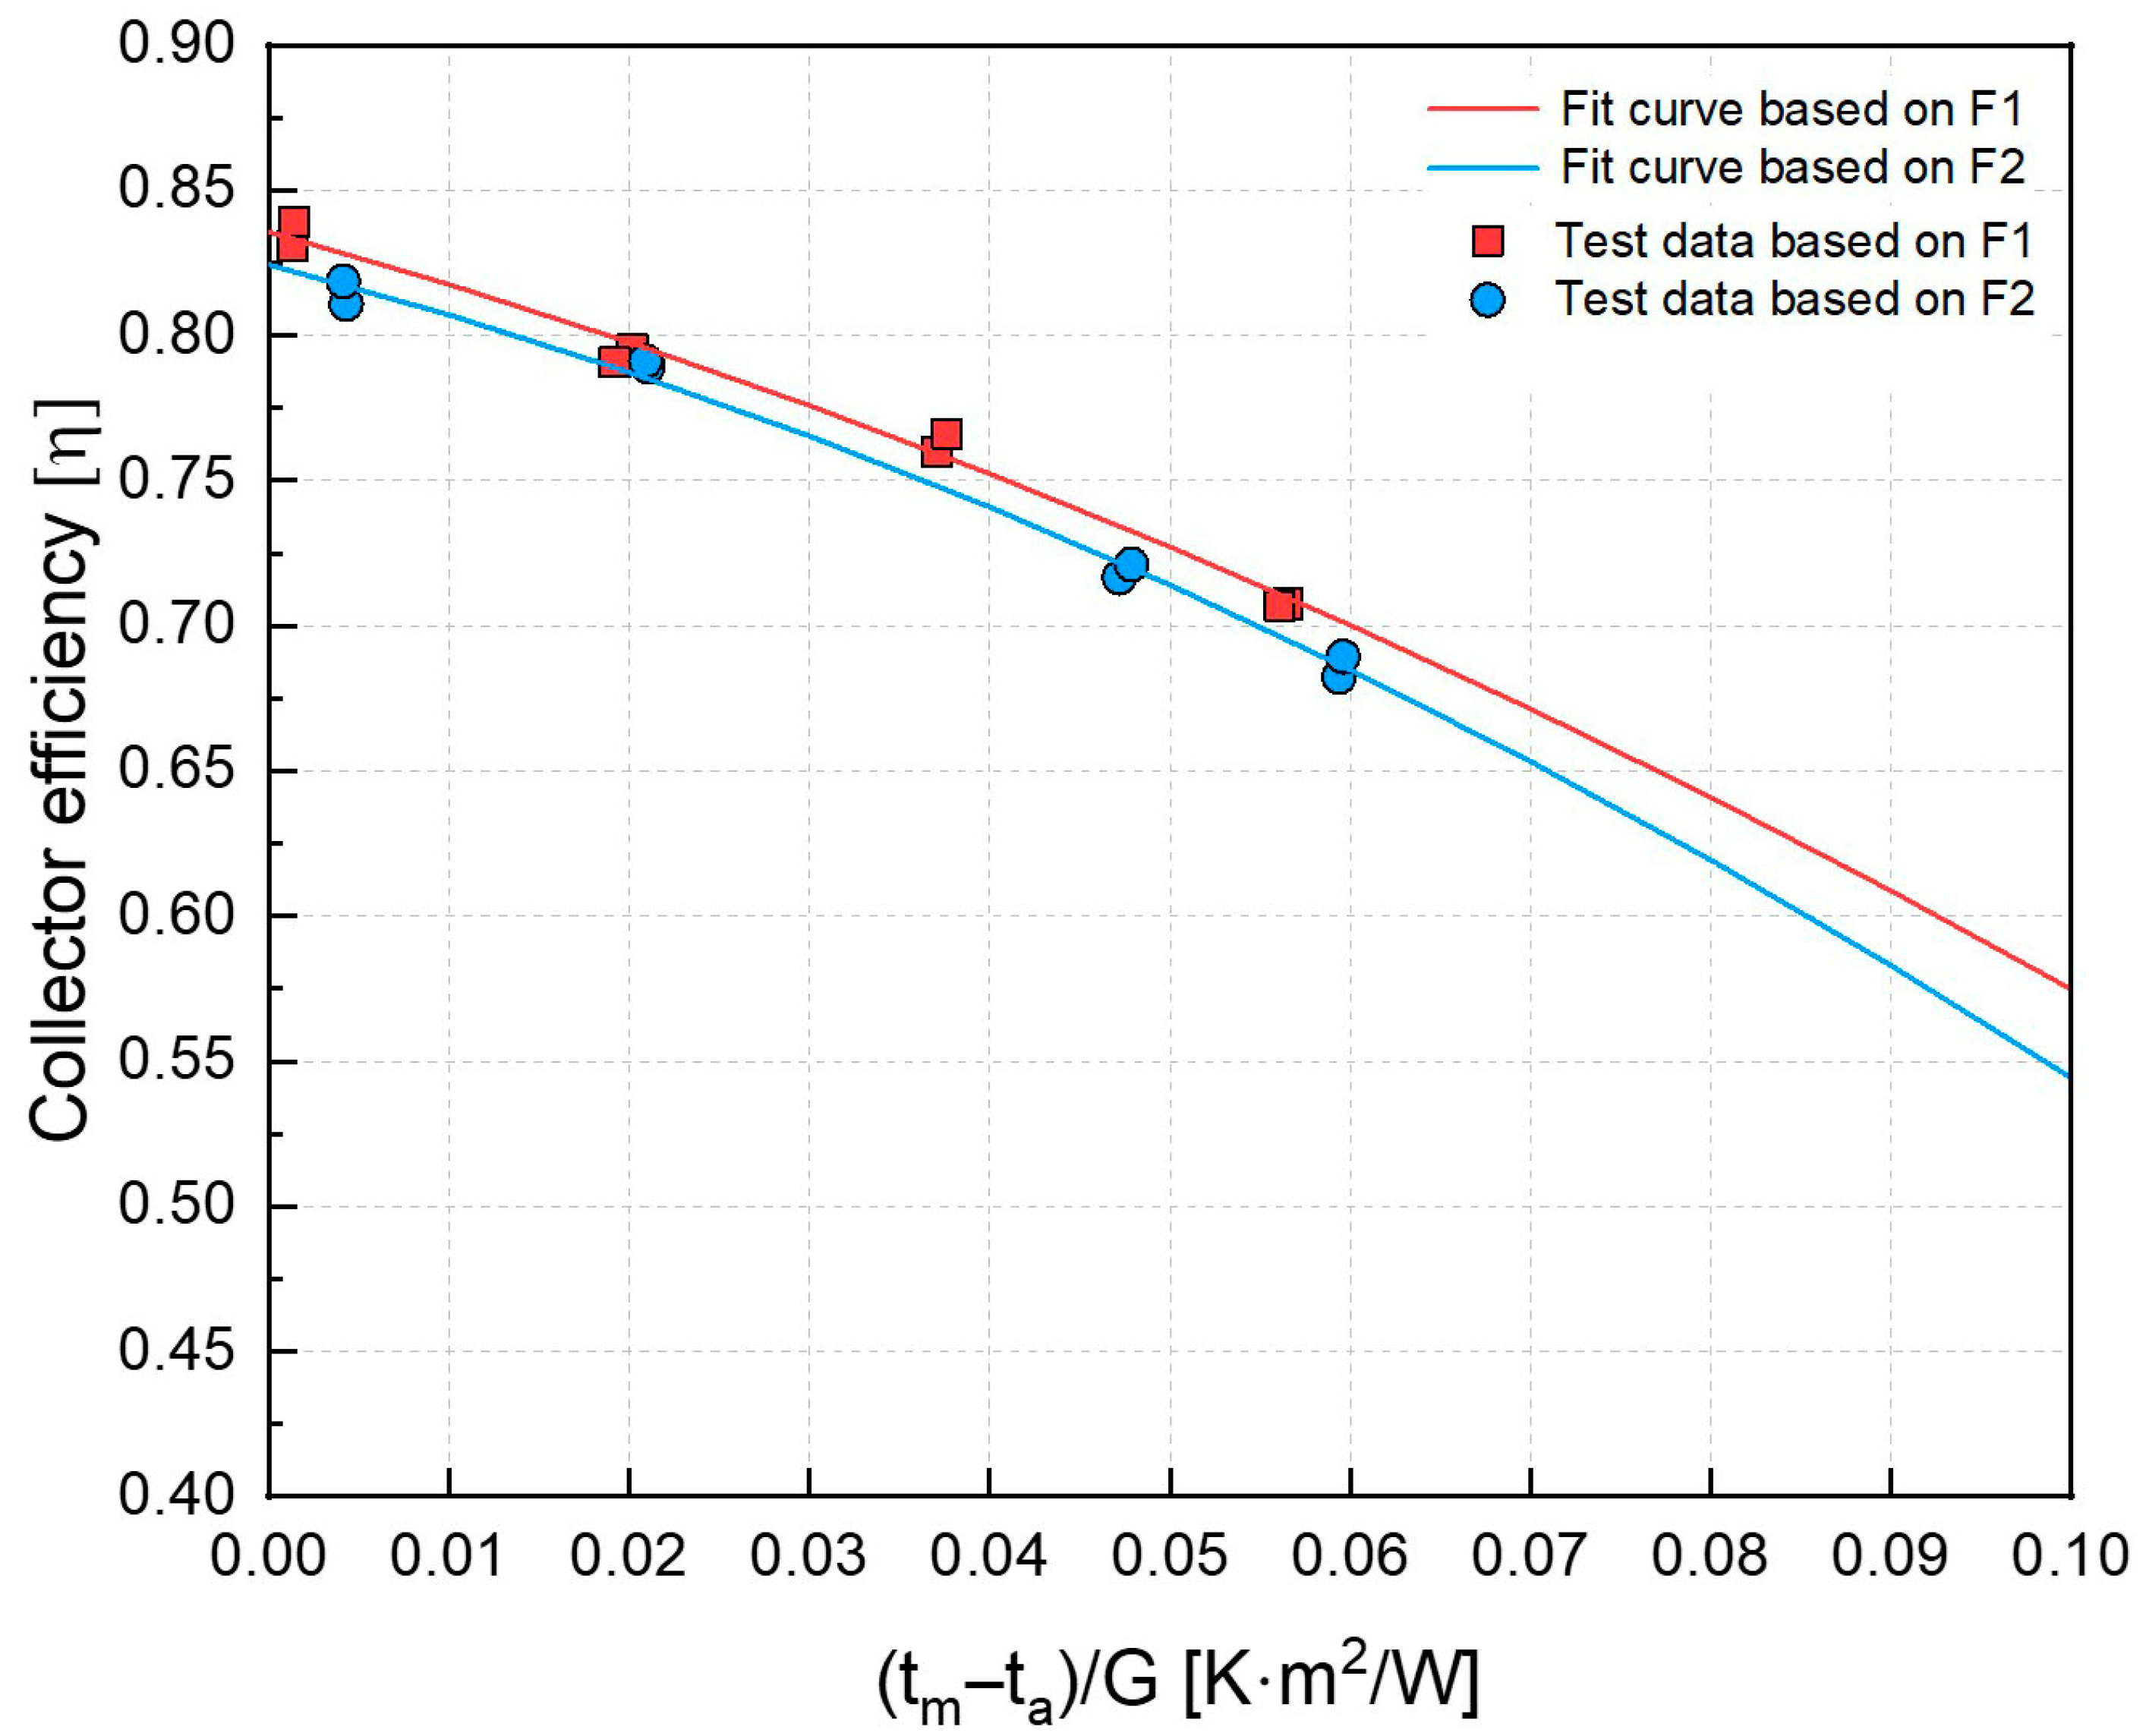
Additional experiments were conducted on an evacuated tube solar collector of the same type as the specimen analyzed in this study. The tests were performed under both the gross-area-based reference flow condition and an increased flow condition to determine the average thermal output. The general specifications of the collector are presented in Table 8, and its main features are shown in Figure 11. The experimental results are summarized in Figure 12. As shown in Table 9, at the reference flow rate of 0.0495 kg/s (based on gross area), the average thermal output was measured as 727.3 W/m2, whereas at the increased flow rate of 0.0672 kg/s, it rose to 741.0 W/m2. From the correlation given in Equation (5), the corresponding α value was calculated to be approximately 0.05. Although the α value may vary depending on the collector characteristics, the results clearly confirmed that the average thermal output increases with higher flow rates.

5. Conclusions

This study investigated the effect of the mass flow rate on the thermal performance of a double-glass evacuated tube solar collector through ISO 9806:2025-compliant steady-state outdoor testing. The experimental results yielded the following key findings:
  • Thermal output trends and flow rate sensitivity
Under the given testing conditions, the examined double-glass evacuated tube collector exhibited a non-linear relationship between mass flow rate variation (based on the gross area) and average thermal output, showing a characteristic trend of approximately 0.08. Additional experiments conducted with the same type of collector demonstrated a similar trend of about 0.05 relative to the reference flow rate. Although the magnitude of this dependency varied depending on the collector, the overall tendency of increased average thermal output with increasing flow rate was consistently observed.
  • Implications for national standards and certification
KS B 8295:2023 requires a minimum thermal output of 560 W/m2 (aperture basis) at 1000 W/m2 irradiance. The ~6% difference between maximum- and minimum-flow conditions in this study demonstrates that flow rate selection can affect certification outcomes. This underscores the need for explicit flow rate guidelines in future revisions of KS B 8295:2023.
  • Future work
Future research will evaluate dynamic flow rate control using inverter-driven circulation pumps in field-scale demonstration systems. Long-term monitoring will examine not only collector performance but also pump energy use and seasonal solar utilization, providing a comprehensive basis for operational optimization.
In summary, appropriate flow rate selection is critical for both accurate performance evaluation and real-world system design. These results are expected to inform revisions of KS B 8295:2023 and contribute to improved experimental protocols and optimized solar thermal system configurations.
  • Study limitations
This study is limited to a single ETC design and manufacturer, as well as a restricted flow rate range near the reference condition. As noted by Víg et al. (2021), increasing the mass flow rate does not necessarily lead to proportional gains in average thermal output, and therefore the present results should be generalized with caution to broader operating conditions [14].

Author Contributions

Methodology, D.-W.K. and K.-h.L.; Investigation, D.-W.K. and W.L.; Writing—original draft, D.-W.K.; Supervision, K.-h.L. All authors have read and agreed to the published version of the manuscript.

Funding

This research was supported by the Energy Technology Development Program of the Korea Institute of Energy Technology Evaluation and Planning (KETEP), funded by the Ministry of Trade, Industry and Energy (MOTIE) of the Republic of Korea (Project No. 20220810100020).

Data Availability Statement

The original contributions presented in this study are included in the article. Further inquiries can be directed to the corresponding author.

Conflicts of Interest

The authors declare no conflict of interest.

Nomenclature

Q ˙ Useful power extracted from collectorW
Q ¯ Average power extracted from collectorW
A a Aperture aream2
G Hemispherical solar irradianceW/m2
η Collector efficiency based on hemispherical irradiance G-
m ˙ Mass flow rate of heat transfer fluidkg/s
T Temperature difference between fluid outlet and inlet ( t e t i ) K
t i n Collector inlet temperature°C
t e Collector outlet temperature°C
t m Mean temperature of heat transfer fluid°C
t a Ambient temperature of heat transfer fluid°C
C f ( t i n ) Specific heat capacity of heat transfer fluid at the collector inletkJ/(kgK)
z 0 Coefficient of specific heat capacity, 4.2184 kJ/(kgK)
z 1 Coefficient of specific heat capacity, 2.8218 × 10 3 kJ/(kgK2)
z 2 Coefficient of specific heat capacity, 7.3478 × 10 5 kJ/(kgK3)
z 3 Coefficient of specific heat capacity, 9.4712 × 10 7 kJ/(kgK4)
z 4 Coefficient of specific heat capacity, 7.2869 × 10 9 kJ/(kgK5)
z 5 Coefficient of specific heat capacity, 2.8098 × 10 11 kJ/(kgK6)
z 6 Coefficient of specific heat capacity, 4.4008 × 10 14 kJ/(kgK7)
η 0 Peak collector efficiency ( η at t m t a = 0 K ) based on hemispherical irradiance G-
a 1 First-order heat loss coefficient (EU standard)W/(m2 K)
a 2 Second-order heat loss coefficient (EU standard)W/(m2 K2)
b 1 First-order heat loss coefficient (ASHRAE standard)W/(m2 K)
T m * Modified temperature difference(m2 K)/W
F 1 Test conditions at a flow rate of 0.092 kg/s
F 2 Test conditions at a flow rate of 0.067 kg/s
F 3 Test conditions at a flow rate of 0.042 kg/s
E F 1 First inlet temperature condition
E F 2 Second inlet temperature condition
E F 3 Third inlet temperature condition
E F 4 Final inlet temperature condition
  Q t Thermal output at flow rates deviated from the reference flow rates (W)
Q r e f Thermal output under reference flow rate condition (W)
m ˙ t Flow rate under altered conditions (kg/s)
m ˙ r e f Reference flow rate (kg/s)
α Correction factor for thermal output difference due to flow rate variation
CSP Concentrated Solar Power
PVT Photovoltaic-Thermal
ETC Evacuated Tube Solar Collector
KOLAS Korea Laboratory Accreditation Scheme
ISO International Organization for Standardization
IEC International Electrotechnical Commission
ILAC International Laboratory Accreditation Cooperation
EN European Norm
ASHRAE The American Society of Heating, Refrigerating and Air-conditioning Engineers
KSKorea Industrial Standards
B Letter classification of mechanical engineering
TRNSYS Transient System Simulation Tool
PCM Phase change material
Class A Highest-performance pyranometer classification
Class B Intermediate-performance pyranometer classification
WGET Water in glass evacuated tube collector
UpET U-pipe evacuated tube collector

References

  1. IPCC. Climate Change 2023: Synthesis Report. Contribution of Working Groups I, II and III to the Sixth Assessment Report of the Intergovernmental Panel on Climate Change; Cambridge University Press: Cambridge, UK, 2023. [Google Scholar]
  2. IRENA. World Energy Transitions Outlook 2021: 1.5 °C Pathway; International Renewable Energy Agency: Abu Dhabi, United Arab Emirates, 2021. [Google Scholar]
  3. Sigrist, R. Le Capteur Solaire de Horace-Benedict de Saussure: Genese d’une Science Empirique; Jullien: Geneva, Switzerland, 1993. [Google Scholar]
  4. Evangelisti, L.; De Lieto Vollaro, R.; Asdrubali, F. Latest advances on solar thermal collectors: A comprehensive review. Renew. Sustain. Energy Rev. 2019, 114, 109318. [Google Scholar] [CrossRef]
  5. Kalogirou, S.A. Solar thermal collectors and applications. Prog. Energy Combust. Sci. 2004, 30, 231–295. [Google Scholar] [CrossRef]
  6. Chow, T.T. A review on photovoltaic/thermal hybrid solar technology. Appl. Energy 2010, 87, 365–379. [Google Scholar] [CrossRef]
  7. ILAC. ILAC Mutual Recognition Arrangement (MRA). International Laboratory Accreditation Cooperation. 2021. Available online: https://ilac.org (accessed on 7 September 2025).
  8. Korea Institute of Energy Research (KIER). Certificate of Accreditation–KOLAS Internationally Accredited Testing Laboratory (No. KT203). In Korea Laboratory Accreditation Scheme (KOLAS); Korea Institute of Energy Research (KIER): Daejeon, Republic of Korea, 2025. [Google Scholar]
  9. ISO/IEC 17025:2017; General Requirements for the Competence of Testing and Calibration Laboratories. International Organization for Standardization and International Electrotechnical Commission: Geneva, Switzerland, 2017.
  10. ISO 9806:2025; Solar Energy—Solar Thermal Collectors—Test Methods. International Organization for Standardization: Geneva, Switzerland, 2025.
  11. KS B 8295:2023; Solar Thermal Collectors (Flat Plate, Evacuated-Tube, Fixed Concentrating Type). Korea Standardization Agency: Eumseong-gun, Republic of Korea, 2023.
  12. EN 12975-2:2006; Thermal Solar Systems and Components—Solar Collectors—Part 2: Test Methods. European Committee for Standardization: Brussels, Belgium, 2006.
  13. ANSI/ASHRAE Standard 93-2010 (RA 2014); Methods of Testing to Determine the Thermal Performance of Solar Collectors. American Society of Heating, Refrigerating and Air-Conditioning Engineers (ASHRAE): Atlanta, GA, USA, 2014.
  14. Víg, P.; Seres, I.; Vladár, P. Improving efficiency of domestic solar thermal systems by a flow control. Sol. Energy 2021, 230, 779–790. [Google Scholar] [CrossRef]
  15. Gao, Y.; Zhang, Q.; Fan, R.; Lin, X.; Yu, Y. Effects of thermal mass and flow rates on forced- circulation solar hot water system: Comparison of water-in-glass and U-pipe evacuated-tube solar collectors. Sol. Energy 2013, 98, 290–301. [Google Scholar] [CrossRef]
  16. Farhadi, S.; Atrian Seresht, H.; Aghakhani, H.; Baghapour, B. Performance prediction of heat pipe evacuated tube solar collectors: Analytical modeling and data-driven machine learning/ANN approach with developing web application. Energy 2025, 321, 135512. [Google Scholar] [CrossRef]
  17. KNREC (Korean New & Renewable Energy Center). KS-Based National Certification Overview for Renewable Energy Equipment (in Korean). 2025. Available online: https://www.knrec.or.kr/biz/introduce/new_cert/intro_energyks.do?gubun=A (accessed on 24 September 2025).
  18. Weiss, W.; Spörk-Dür, M. Solar Heat Worldwide: Global Market Development and Trends 2023, Detailed Market Figures 2022; IEA Solar Heating & Cooling Programme; AEE—Institute for Sustainable Technologies: Gleisdorf, Austria, 2024. [Google Scholar] [CrossRef]
  19. Plaza Gomariz, F.; Cejudo López, J.M.; Domínguez Muñoz, F. An analysis of low flow for solar thermal system for water heating. Sol. Energy 2019, 179, 67–73. [Google Scholar] [CrossRef]
  20. Razika, I.; Nabila, I.; Madani, B.; Zohra, H.F. The effects of volumetric flow rate and inclination angle on the performance of a solar thermal collector. Energy Convers. Manag. 2014, 78, 931–937. [Google Scholar] [CrossRef]
  21. Talib, M.A.; Eidan, A.A.; Tawfeeq, A.H.; AL-Fatlawe, F.M.K. Effect of changing the water flow rate on the efficiency of hybrid PVT uncovered collectors without glass: Numerical study. CFD Lett. 2024, 16, 91–104. [Google Scholar] [CrossRef]
  22. Nugroho, R.; Idrusalhamid, M.; Lubis, A. Investigation of the fluid flow rates effect on the characteristics and performance of evacuated tube solar collector in a parallel-series arrangement. Int. J. Mech. Prod. Eng. 2021, 9. Available online: https://www.iraj.in/journal/journal_file/journal_pdf/2-725-16251239377-11.pdf (accessed on 9 October 2025).
  23. Elsheniti, M.B.; Kotb, A.; Elsamni, O. Thermal performance of a heat-pipe evacuated-tube solar collector at high inlet temperatures. Appl. Therm. Eng. 2019, 154, 315–325. [Google Scholar] [CrossRef]
  24. Li, Y.; Liang, X.; Song, W.; Li, T.; Wang, D.; Liu, Y. Optimization and thermal performance of U-type evacuated tube solar collector filled with phase change material. Energy Rep. 2022, 8, 6126–6138. [Google Scholar] [CrossRef]
  25. Kumar, A.; Said, Z.; Bellos, E. An up-to-date review on evacuated tube solar collectors. J. Therm. Anal. Calorim. 2021, 145, 2873–2889. [Google Scholar] [CrossRef]
  26. KS B ISO 9060:2018; Specification and Classification of In-Struments for Measuring Hemispherical Solar and Direct Solar Radiation. Korea Industrial Standards: Seoul, Republic of Korea, 2018.
  27. Tekir, M.; Taskesen, E.; Gedik, E.; Arslan, K.; Aksu, B. Effect of constant magnetic field on Fe3O4-Cu/water hybrid nanofluid flow in a circular pipe. Heat Mass Transf. 2022, 58, 707–717. [Google Scholar] [CrossRef]
  28. Duffie, J.A.; Beckman, W.A. Solar Engineering of Thermal Processes, 4th ed.; Wiley: Hoboken, NJ, USA, 2013. [Google Scholar]
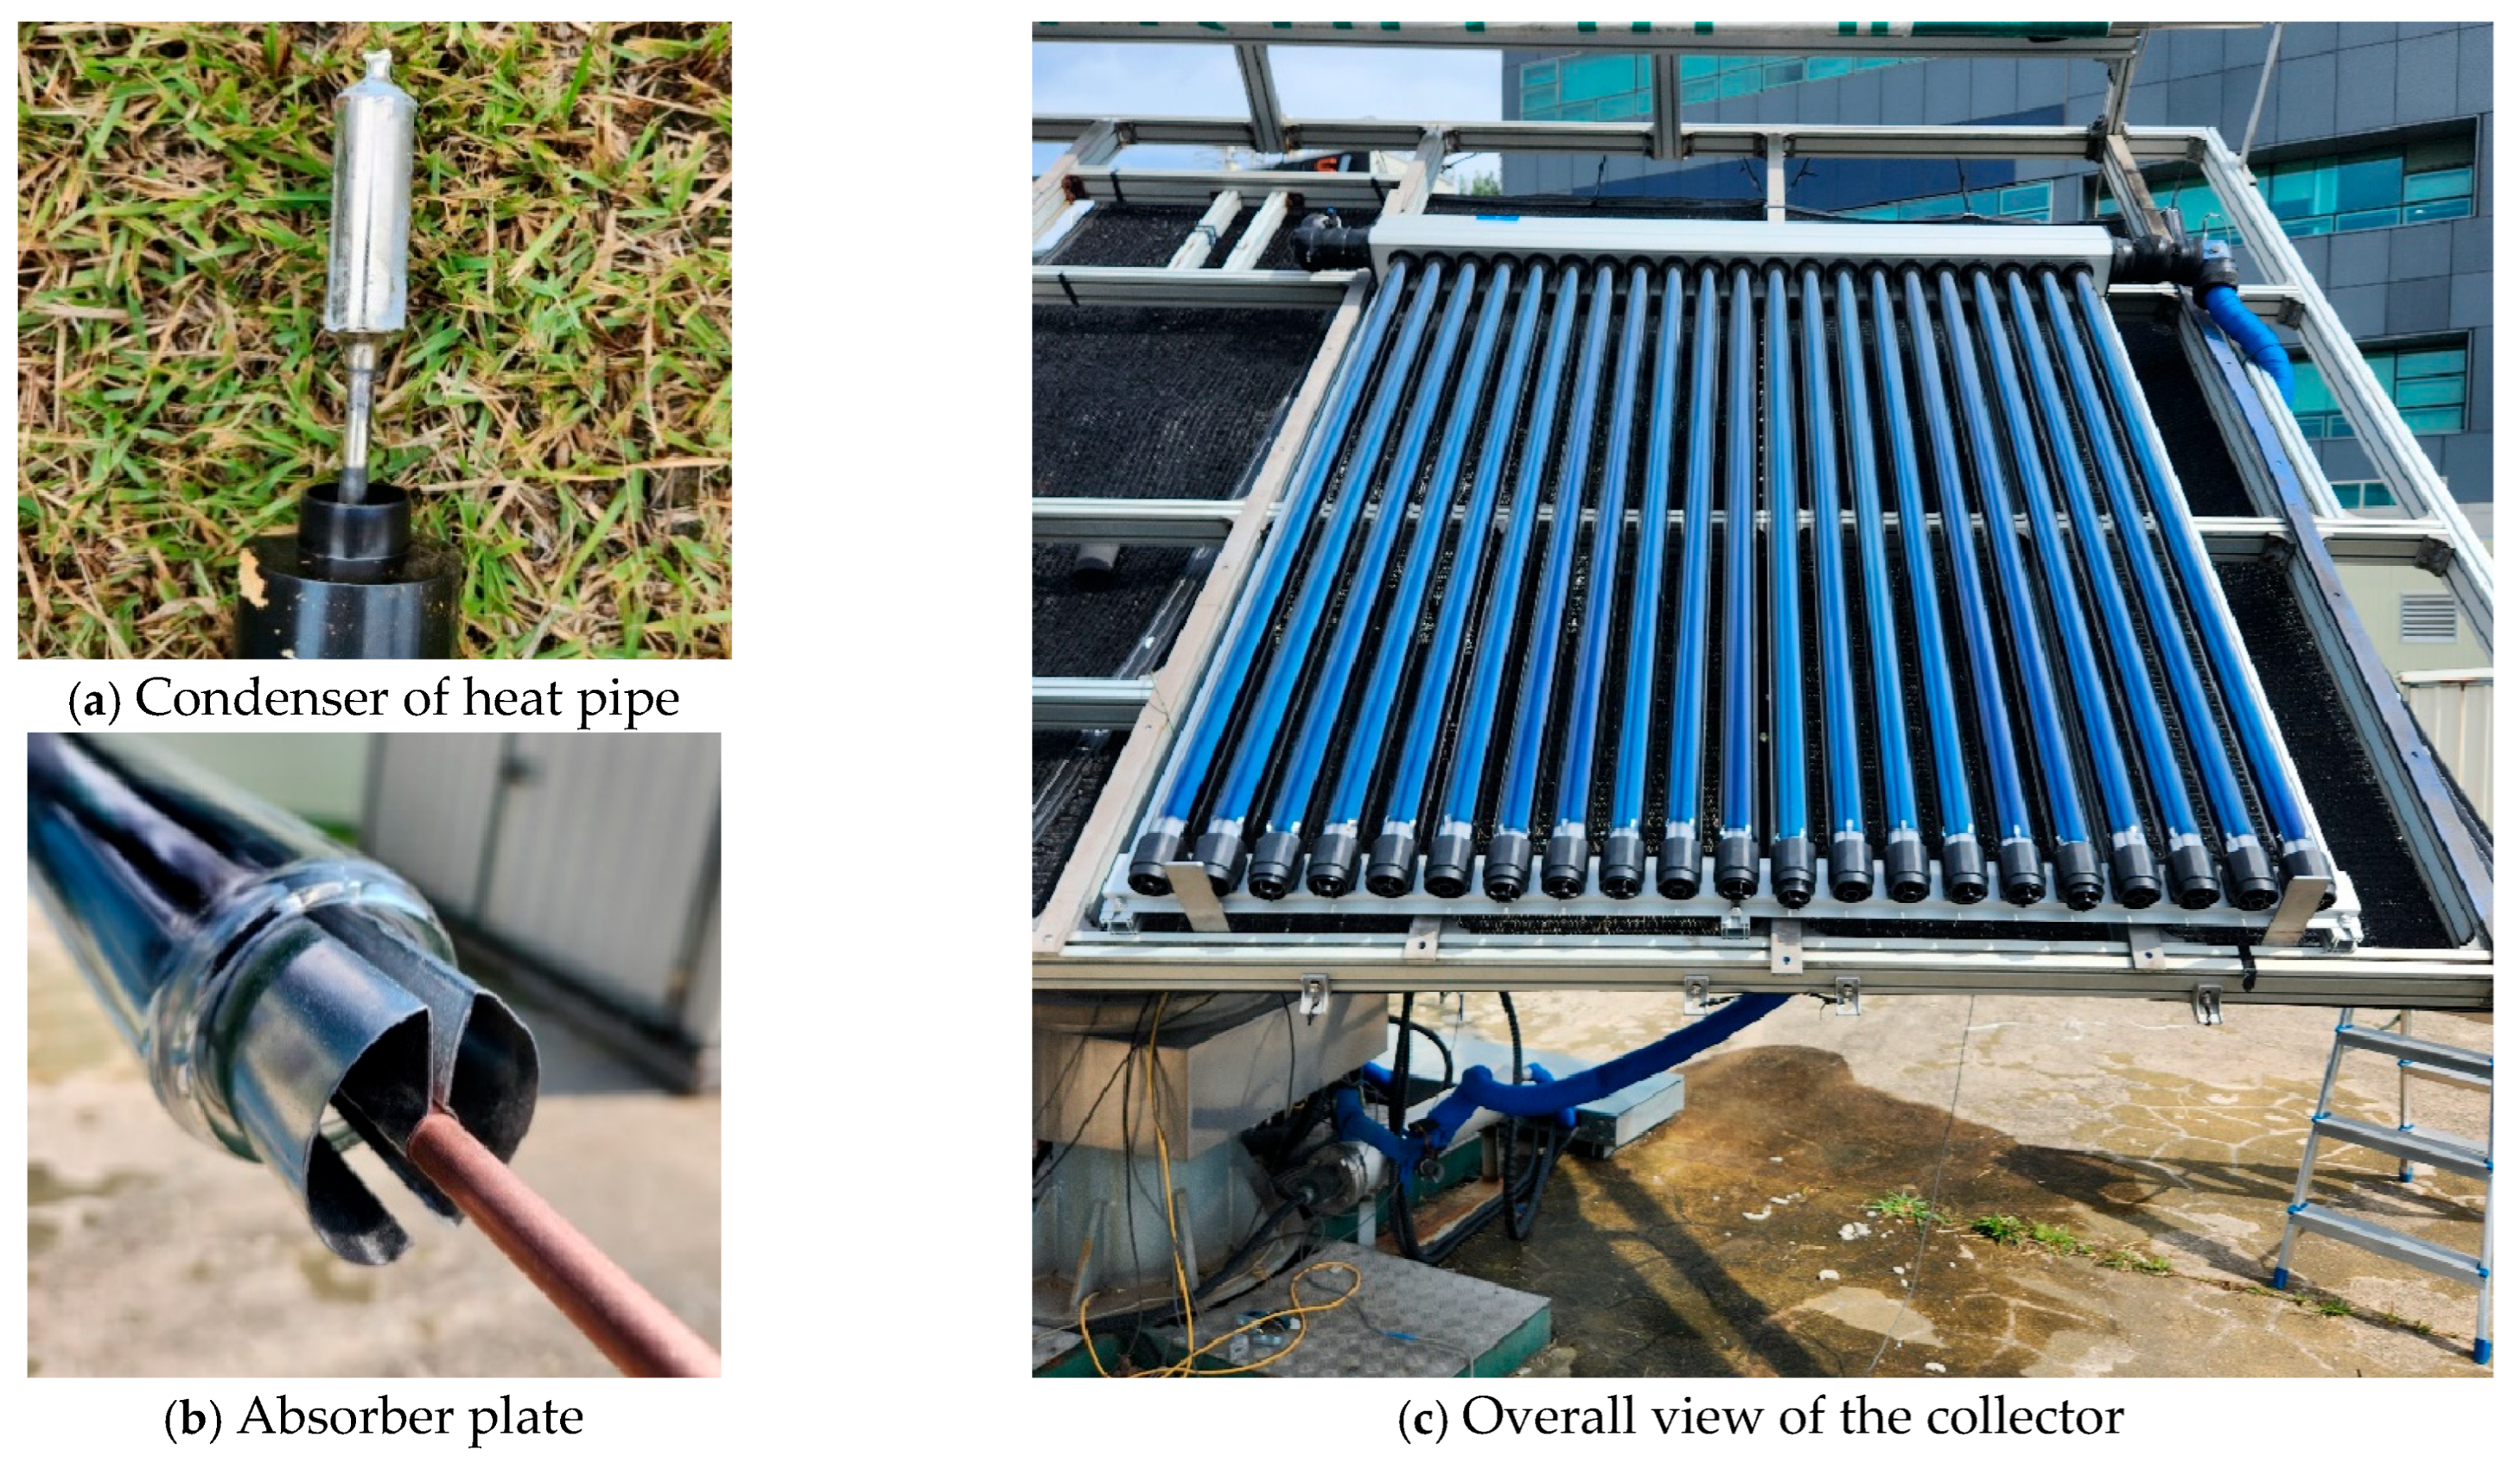
Figure 1. Components and overall view of the tested double-glass evacuated tube solar collector: (a) heat pipe condenser section, (b) absorber plate, (c) assembled collector.
Energies 18 05388 g001
Figure 2. Flow diagram of the test procedure.
Energies 18 05388 g002
Figure 3. Test loop for the solar collector complying with KS B 8295:2023 and ISO 9806:2025.
Energies 18 05388 g003
Figure 4. Solar collector installed on an automatic tracking platform and measurement instruments: (a) thermostat, (b) solar tracking platform, (c) anemometer, (d) pyranometer, (e) flow meter, (f) temperature sensor, (g) data logger.
Energies 18 05388 g004
Figure 5. Normalized solar irradiance measurements for each test condition.
Energies 18 05388 g005
Figure 6. Normalized ambient temperature measurements for each test condition.
Energies 18 05388 g006
Figure 7. Normalized mass flow rate measurements for each test condition.
Energies 18 05388 g007
Figure 8. Normalized inlet temperature measurements for each test condition.
Energies 18 05388 g008
Figure 9. Normalized outlet temperature measurements for each test condition.
Energies 18 05388 g009
Figure 10. Instantaneous efficiency curves of the solar collector under different flow rate conditions.
Energies 18 05388 g010
Figure 11. Components and overall view of the additional tested double-glass evacuated tube solar collector: (a) heat pipe condenser section, (b) absorber plate, (c) assembled collector.
Energies 18 05388 g011
Figure 12. Instantaneous efficiency curves of the additional solar collector under different flow rate conditions.
Energies 18 05388 g012
Table 1. Summary of previous studies and present study on solar collectors under varying flow conditions.
AuthorAnalysis MethodCollector TypeMetricMain Findings
Plaza Gomariz et al. [19]Experiment and simulation
(TRNSYS)
Flat plate collector (serpentine type)Solar fraction (%)
Useful energy gain (kWh/year)
Hours of operation (h/year)
Pump energy consumption (kWh/year)
Investment cost (€)
Higher flow slightly increases efficiency and solar fraction, but differences are minimal.
Low-flow extends operation time and reduces pump power (11–34%).
Initial cost is ~11% lower, with 14–18 years payback for high-flow.
Razuja et al. [20]ExperimentFlat plate collector (covered)Collector efficiency (%)
Storage tank temperature (K)
Temperature difference(K)
At 1.033 kW/m2 and 0° tilt, efficiency increases linearly with flow rate (η = 0.68Qv + 49.79, R2 = 0.9898).
Efficiency also rises linearly with inclination angle from 0° to 60° (η = 0.43α + 53.07, R2 = 0.967).
However, horizontal operation (0°) is more effective for water heating (higher storage temperature).
Temperature difference is larger at low flow, but high flow is more effective for efficiency.
Talib et al. [21]Simulation
(CFD: ANSYS)
PVT collector(uncovered)Panel temperature (K)
Collector efficiency (%)
Outlet temperature (K)
Increasing flow reduces panel temperature, increases efficiency, and slightly raises outlet temperature.
Maximum efficiency of 95% is achieved at 0.03 kg/s.
Efficiency improvement is due to increased heat absorption, with heat transfer proportional to flow rate.
Higher flow enhances heat removal, lowering panel temperature and improving performance.
Nugroho et al. [22]Simulation
(Matlab)
Evacuated tube collectorOutlet temperature (K)
Thermal output (kW)
Collector efficiency (%)
Higher flow increases efficiency and heat absorption but decreases outlet temperature.
Maximum efficiency of ~68.65% is achieved at 4.72 kg/s (800 W/m2).
Highest outlet temperature of 87.5 °C occurs at the minimum flow rate (1.6 kg/s).
Optimal flow depends on the objective (temperature gain vs. efficiency improvement).
Elsheniti et al. [23]Experiment and simulation (Matlab)Evacuated tube collector (heat pipe)Outlet temperature (K)
Thermal output (kW)
Collector efficiency (%)
Considering thermal capacity improves prediction accuracy (max error 12.5% → 4.4%).
Higher flow increases efficiency but lowers outlet temperature, while lower flow does the opposite.
Beyond certain flow and irradiance conditions, adding more tubes has no further effect on efficiency.
At 0.01 kg/s and 800 W/m2, outlet temperature stops rising after ~150 tubes (≈119 °C).
Efficiency decreases as tube number increases (e.g., 42% → 27% for 15 → 150 tubes).
Vig et al. [14]Experiment
and simulation
(TRNSYS)
Evacuated tube collector (heat pipe)Collector efficiency (%)
Daily collected heat (kWh), Temperature difference (K)
Higher flow increases efficiency but saturates above 2.5 kg/min (maximum ≈ 86%).
High flow is more effective when storage temperature is low and solar irradiance is high.
Gao et al. [15]Experiment and simulation (TRNSYS)Evacuated tube collector (water in glass, U-pipe)Useful energy delivered to storage(kWh/m2)
Collector efficiency (%)
Pump operation hour(h)
Thermal mass must be considered; neglecting it causes large simulation errors.
WGETsc stores 25–35% less useful energy than UpETsc due to large internal volume (~30 L/m2).
Pump operation: 736 h/year (UpETsc) vs. 397 h/year (WGETsc).
Optimal flow: 20–60 kg/h·m2 (WGETsc), 20–40 kg/h·m2 (UpETsc).
Li et al. [24]Experiment and simulation
(CFD: ANSYS)
Evacuated tube collector (U-type, with aluminum fins and embedded PCM)Collector efficiency (%)
Outlet temperature (K)
Hot water supply duration (min)
PCM Liquid fraction (%)
Applying PCM (323 K) reduces peak HTF temperature by ~7.4 K and extends hot water supply time by 160 min.
High flow shortens hot water duration and lowers PCM liquid fraction despite higher temperature output.
Present studyExperimentEvacuated tube collector (heat pipe)Collector efficiency (%)
Thermal output(W)
Empirical flow rate correction factor (-)
Thermal output increases by ~6% as flow rises (0.042 → 0.092 kg/s).
High flow enhances heat removal but raises external losses.
Output shows non-linear dependence on flow (α ≈ 0.05–0.08).
Table 2. Test collector data sheet.
ComponentSpecification
TypeEvacuated tube solar collector (double-glass, heat pipe type)
DimensionsWidth: 1720 mm, Height: 1990 mm
AreaGross area: 3.42 m2, Aperture area: 2.10 m2
Design specifications
Operating temperature(−20 to 120) °C/Optimal: (10 to 85) °C
Working fluid flow rate(0.01 to 0.04) kg/s/Optimal: (0.018 to 0.037) kg/s
Manifold
Outer casingMaterial: Aluminum, Thickness: 1.8 mm, Dimensions: 1720 mm × 156 mm
Main pipeHeat transfer pipe: Copper (Outer Ø 37 mm, Thickness: 1.0 mm, Length: 1800 mm, Qty: 1)
Connector: Copper (Outer Ø 27 mm, Thickness: 1.2 mm)
InsulationPrimary: Rock wool, Thickness: 20 mm, Heat resistance: 410 °C
Secondary: Polyurethane, Thickness: 40 mm, Heat resistance: 120 °C
Absorber unit
Transparent coverMaterial: Double borosilicate glass, Thickness: 1.8 mm, Outer Ø 58 mm, Inner Ø 47 mm, Length: 1800 mm, Qty: 21
Absorber plateMaterial: Aluminum, Thickness: 1.6 mm, Width: 47 mm, Length: 1721 mm, Qty: 21, Coating: Selective absorber coating
Heat pipeCondensation section: Copper Ø 24 mm, Thickness: 1.0 mm, Length: 95 mm, Qty: 21
Evaporation section: Copper Ø 8 mm, Thickness: 0.6 mm, Length: 1705 mm, Qty: 21
ReflectorNone
Table 3. Specifications and requirements of measurement equipment and available equipment specifications.
EquipmentStandard RequirementsAvailable Equipment Specification
PyranometerClass B pyranometer as defined in KS B ISO 9060Class A pyranometer as defined in KS B ISO 9060
Temperature sensorsMeasurement uncertainty within 0.1 K; high resolution of ±0.02 K required for detecting temperature variations over time
Outdoor air temperature: accuracy of 1 K and uncertainty within 0.5 K
Collector and ambient temperature sensors
Standard uncertainty: 0.045 K
Resolution: 0.01 K
Flow meterAccuracy within ±1% of the mass flow rate measured per hour; calibration must cover the full range of flow and temperature used in collector testingCalibration range: (2–20) kg/min
Deviation: (−0.56% to 0.53%)
Table 4. Allowable error of experimental data under steady-state conditions.
ParameterTolerance from Average Value
Global irradiance on collector plane±50 W/m2
Ambient temperature (outdoor test)±1.5 K
Mass flow rate of working fluid±1%
Inlet fluid temperature±0.1 K
Outlet fluid temperature±0.4 K
Table 5. Five-minute averaged data for five key variables used in collector efficiency modeling under different flow rate conditions.
Test DateSolar
Irradiance
Mass Flow RateAmbient TemperatureInlet TemperatureOutlet Temperature
W/m2kg/s°C°C°C
11 November 2024 11:39:56 a.m.949.10.092718.2518.8522.22
11 November 2024 11:44:56 a.m.946.40.092718.2218.8522.24
4 October 2024 1:57:55 p.m.1043.80.092722.2242.0245.68
4 October 2024 2:02:55 p.m.1038.20.092722.6242.0745.70
4 October 2024 2:59:55 p.m.1002.60.092523.8361.8265.26
4 October 2024 3:04:55 p.m.993.10.092423.8561.8265.24
24 October 2024 12:29:56 p.m.1025.90.092818.1381.8585.21
24 October 2024 12:34:56 p.m.1019.70.092818.3081.8585.19
8 November 2024 11:52:26 a.m.1022.30.067416.3917.2322.22
8 November 2024 11:57:26 a.m.1020.00.067417.1317.2522.25
30 September 2024 2:04:59 p.m.1024.40.067429.1542.5647.48
30 September 2024 2:09:59 p.m.1020.00.067429.3842.5547.47
31 October 2024 11:49:56 a.m.1038.60.067420.3460.2365.02
31 October 2024 11:54:56 a.m.1038.90.067420.6460.2665.07
6 November 2024 11:04:56 a.m.1036.20.067412.9480.3184.68
6 November 2024 11:09:56 a.m.1051.00.067412.7480.2884.66
2 October 2024 1:44:55 p.m.1060.00.042120.7422.6030.78
2 October 2024 1:49:55 p.m.1063.80.042121.0222.6230.78
2 October 2024 2:44:55 p.m.1025.90.042021.8042.1749.84
2 October 2024 2:49:55 p.m.1017.20.042021.5442.1549.83
31 October 2024 2:19:56 p.m.955.20.042124.4460.1166.98
31 October 2024 2:24:56 p.m.947.40.042124.5460.1166.98
7 November 2024 1:39:56 p.m.1002.70.042116.4680.8887.20
7 November 2024 1:44:56 p.m.997.60.042115.7980.8387.28
Table 6. Coefficients of the fitted efficiency model and average thermal output under each flow rate condition.
Condition a 1 a 2 η 0 Q ¯
F1−0.4850−0.00490.6602630.4
F2−0.3192−0.01510.6583613.2
F3−0.2304−0.02030.6472594.8
Table 7. Parameter analysis for estimating average thermal output.
Condition a 1 Parameter (W) a 2 Parameter (W) η 0 Parameter (W) Q ¯ t (W)
F1−19.4−10.4660.2630.4
F2−12.8−32.3658.3613.2
F3−9.2−43.2647.2594.8
Table 8. Additional test collector data sheet.
ComponentSpecification
TypeEvacuated tube solar collector (double-glass, heat pipe type)
DimensionsWidth: 1270 mm, Height: 1950 mm
AreaGross area: 2.48 m2, Aperture area: 1.60 m2
Manifold
Outer casingMaterial: Aluminum, Thickness: 2.0 mm, Dimensions: 1950 mm × 146 mm
Main pipeHeat transfer pipe: Copper (Outer Ø 39 mm, Thickness: 2.0 mm, Length: 1950 mm, Qty: 1)
Connector: Copper (Outer Ø 22 mm, Thickness: 2.0 mm)
Absorber unit
Transparent
cover
Material: Double borosilicate glass, Thickness: 1.6 mm, Outer Ø 58 mm, Inner Ø 47 mm, Length: 1800 mm, Qty: 18
Absorber plateMaterial: Aluminum, Width: 37 mm, Length: 1800 mm, Qty: 18, Coating: Selective absorber coating
Heat pipeCondensation section: Copper Ø 20 mm, Thickness: 1.0 mm, Length: 70 mm, Qty: 18
Evaporation section: Copper Ø 8 mm, Thickness: 0.6 mm, Length: 1655 mm, Qty: 18
ReflectorNone
Table 9. Coefficients of the fitted efficiency model and average thermal output under each flow rate condition (additional test).
Condition a 1 a 2 η 0 Q ¯
F1−1.7326−0.00880.8358741.0
F2−1.6108−0.01190.8244727.3
Disclaimer/Publisher’s Note: The statements, opinions and data contained in all publications are solely those of the individual author(s) and contributor(s) and not of MDPI and/or the editor(s). MDPI and/or the editor(s) disclaim responsibility for any injury to people or property resulting from any ideas, methods, instructions or products referred to in the content.