Abstract
The globalization of electric vehicle development and production is a significant goal. The availability of charging stations helps to encourage the global transition to electric vehicles, which may lead to a decrease in traditional fuel consumption. Nevertheless, the rise in the number of electric vehicles is accompanied by sustainability issues, such as managing the grid’s electrical demand, building more charging stations, and providing electricity from renewable resources in an efficient and sustainable manner, especially in Saudi Arabia. This work focused on three challenges regarding the installation of fast charging stations (FCSs) for electric vehicles (EVs) on highways. The first challenge is choosing optimal locations on highways to address the range of anxiety of EV drivers. The second challenge is to fuel these FCSs using renewable resources, such as photovoltaic (PV) panels, to make FCSs sustainable. The last challenge is to design FCSs by considering both highway driving behavior and the available renewable energy resources in order to cover charging demand. All of these challenges should be considered while planning the EV charging infrastructure of Saudi highways from both technical and economic perspectives. Thus, using the HOMER® Grid software (version 1.10.1 June 2023), locations on Saudi Arabian highways were selected based on the renewable resources of several roads that support a large number of vehicles traveling on them. These roads were the Makkah to Riyadh, Makkah to Abha, Riyadh to Dammam, Riyadh to NEOM, and Jeddah to NEOM roads. Electric vehicle charging stations with a capacity of 200 kW, 300 kW, and 500 kW were designed on these roads based on their natural renewable resources, which is PV energy. These roads are the most important roads in the Kingdom and witness heavy traffic. An economic study of these stations was carried out in addition to considering their efficiency. This study revealed that the 500 kW station is ideal for charging electric vehicles, with an annual energy production of 3,212,000 kWh. The 300 kW station had better efficiency but higher capital expenses. The 200 kW station could charge 6100 vehicles annually. The three stations on the Makkah to Riyadh, Makkah to Abha, and Riyadh to Dammam roads can charge 65,758 vehicles annually. The total cost of the project was USD 2,786,621, with the 300 kW plant having the highest initial investment, which can be potentially justified due to its higher power output. This study provides a comprehensive overview of the project costs and the potential returns of using solar power plants for charging electric vehicles.
1. Introduction
In an effort to help mitigate greenhouse gas emissions, an EU rule (2019/631) has set emission reduction targets that are required for new cars manufactured between 2025 and 2030 [1,2,3,4]. This regulation lays out a precise plan for reducing CO2 emissions from the transportation industry. For example, starting on 1 January 2025, the average emissions of new passenger car fleets should be reduced by 15%, and starting on 1 January 2030, they should be reduced by 37.5%. In order to meet these goals, electric vehicles are emerging as a strong contender to effectively replace conventional cars with internal combustion engines that run on fossil fuels [5,6,7]. Nevertheless, the creation of novel technologies to improve the environmental friendliness and efficiency of using conventional resources for vehicles has not been able to significantly slow down the rate at which air pollution and global warming are increasing. Thus, it is necessary to take safety measures to reduce the amount of fuel used by vehicles. Over the past ten years, the popularity of electric vehicles (EVs) has grown quickly. As an example, the global inventories of electric passenger cars hit 5 million in 2022, representing a 63% increase from the year before [7]. Figure 1 shows the International Energy Agency’s forecast for EV sales from 2018 to 2030.
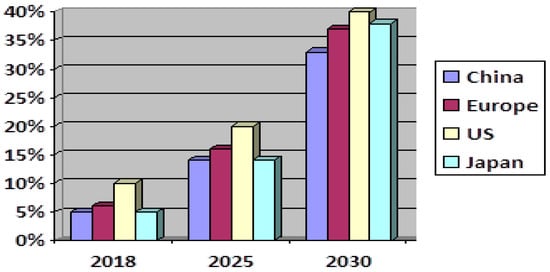
Figure 1.
The International Energy Agency’s forecast for EV sales from 2018 to 2030.
The National Renewable Energy Laboratory (NREL) of the US Department of Energy created the HOMER program, which is intended to be used in the design of hybrid energy systems [8]. It takes the type of energy source, its constituent parts, its storage capacity, its electrical load, and the prices of each part as the input data. The system’s utilization of renewable energy, the fuel consumption of excess energy, the total net present cost (TNPC), and the cost of energy (COE) are the output values. Additionally, the software is made to allow for automation, which regulates the characteristics of the system, including load flow and cycle charging. With performance tests on the technical and economic analysis parameters, this software also allows for the optimization of the size of a chosen hybrid energy system. HOMER is a popular and widely used program for various hybrid system applications; some of these studies are listed in Table 1.

Table 1.
The main findings in the literature on modeling EV charging stations using the HOMER software.
Table 1 discusses the ability of HOMER software in previous research to model EV charging stations with renewable resources, including a variety of technical and economic parameters. Since our main objective in this work was to optimally design FCSs on Saudi Arabia’s main highways, similar projects discussed in related works were reviewed [14,15,16,17,18,19,20]; in addition, EV infrastructure-related works conducted in Saudi Arabia [1,2] are highlighted in the following paragraphs.
The primary contributions of the work in Ref. [14] are given as follows: (i) the minimization of the system’s net present cost (NPC) and levelized cost of energy (LCOE) while maintaining 0% unmet hybrid renewable energy (HRE); (ii) an analysis of the effects of the demand response program (DRP), battery energy storage system (BESS), operating reserve power, and renewable penetration percentage on the load of EVs with HRE integration; and (iii) a techno-economic analysis of the various hybrid energy source combinations, such as solar, wind turbine, diesel generator, and BESS energy, while accounting for growth in the electric vehicle load. When considering the DRP, the annual energy sold and bought from the grid grew by 42.98% and decreased by 15.35%, respectively. The system’s NPC decreased by 62.62% when the BESS was taken into account. In order to analyze the viability of energy storage on Hawaii Island, USA, this study considered a techno-economic, cost-effective, and economic dispatch when managing the EV load [14].
The study in [15] provides a techno-economic assessment of a revolutionary stand-alone hybrid PV–hydrogen energy-based charging station in Jamshoro, Sindh, Pakistan, in order to meet the daily charging demand for plug-in electric vehicles (EVs). To explore the conceptual system, HOMER software was used to model and simulate the suggested design. With a unit cost of power of 0.379 Rs/kWh compared to 0.432 Rs/kWh for the PV–hydrogen energy system, the hybrid PV–hydrogen–battery energy system was found to be more cost-effective than the PV–hydrogen energy system. Based on a daily load demand of 1750 kWh, the simulation results indicated that fuel cells (10.6%) and solar PV cells (89.4%) produced the majority of the overall energy. These results show that an EV charging station powered by renewable energy is a financially sensible choice for the suggested location. The significant proportion of the overall electricity generated by solar PV cells demonstrates the practicality of a renewable-energy-powered charging station for the specified site and load requirement. Overall, the analysis showed that the area could benefit from the installation of affordable, sustainable EV charging infrastructure [15].
In Ref. [16], the design of Denmark’s hybrid energy-based EVCS (electric vehicle charging station) was examined, and a performance analysis was conducted. The HOMER program was utilized to develop and evaluate the performance of energy-conserving PV systems, wind turbines, diesel generators, and storage batteries at four different locations in Denmark. The techno-economic performance characteristics were analyzed and compared through system modeling and analyses. Furthermore, a comparison was made between the fuel usage and CO2 emissions at the four locations. At Aalborg, a sensitivity analysis was conducted to determine how uncertainty affected the EVCS’s performance. This system demonstrated its efficiency for the EV charging station [16].
In Ref. [17], two systems—a grid-connected system and an off-grid-connected system—were taken into consideration when analyzing a total of 42 charging station scenarios. Three distinct designs of the charging stations were set up to examine each system: design A, which was an electrical load; design B, which was a hydrogen load; and design C, which was an integrated system with both an electrical and hydrogen load. Additionally, for every system, seven possible wind turbines with varying capacities were chosen from the HOMER database. After integrating the simulation tool results, a total cost of USD 2,833,465 for the one-stop charging station was determined. The analysis showed that, for an integrated energy system with RESs, the one-stop charging station with a grid connection was able to meet the charging demand in an economical and environmentally responsible manner.
In Ref. [18], the EV load unpredictability was taken into account when analyzing the best form of planning for grid-connected EVCSs with RESs. In order to demonstrate the effect of the EV load on the net present cost (NPC) and to illustrate the connection between the ideal capacity and energy flow, nine scenarios were established, each based on a distinct EV load characteristic. The findings demonstrated that EV loads with varying characteristics affect the capacity of each device (PV, battery, and converter) in the optimal planning for an EVCS, highlighting the financial benefits of implementing RESs in EVCSs [18].
In Ref. [19], a design was proposed, and a feasibility analysis was conducted for the EVCSs in India’s major cities, utilizing hybrid energy sources such as solar PV, biomass, and diesel generators. With HOMER software, the intended EVCS was accurately modeled and simulated. Several configurations were used to analyze the EVCS’s performance, and the techno-economic performance of the suggested system is provided in full. The best possible design for the system was determined by taking into account the various case studies, and the outcomes were compared. Furthermore, a comparison of the performance criteria was made between the design and the operation of the EVCS for four major Indian cities: Delhi, Bombay, Bangalore, and Chennai. According to the findings, the EVCS designs for these four Indian metropolises were optimized using diesel, biomass, and solar power generators.
The authors of Reference [20] examined the technical and financial viability of an EV charging network based on the availability of renewable energy sources in six locations that represented different Nigerian climatic and geographic circumstances. The results demonstrated that the hybrid system of EVs and RE sources might reduce the emissions of carbon and other pollutants.
In Saudi Arabia, several related publications have attempted to model and design electric vehicle charging stations. In Ref. [1], the use of EV charging stations (EVCSs) in off-grid areas was suggested. A unique off-grid strategy that combines renewable energy resources to supply clean electricity for EV charging stations was investigated techno-economically in that study. With the use of distance restrictions and economic criteria assessment metrics, the strategy was contrasted with the alternative option of grid extension. The findings of comparative and optimization research showed that the best standalone hybrid charging station was a cost-effective, environmentally responsible, and sustainable solution compared to grid expansion.
In Ref. [2], using an optimization model in conjunction with geographic information system (GIS) analysis, the cost, footprint, and reliability implications of implementing hydrogen-based generation in off-grid electric car charging stations (CSs) in the city of Riyadh, Saudi Arabia, were quantified. It was shown that the necessary footprint of the CSs fell by 60%, becoming as low as 5% of the annual load that was unmet. Based on learning-curve assumptions, the levelized cost of energy values for CSs by 2030 may vary from 0.13 to 0.20 USD/kWh. Following that, the computed footprints were mapped to the following five categories of land parcels in Riyadh: schools, universities, malls, gas stations, and hospitals. By lowering the PV array needed, the number of parcels that could support CSs was boosted by 15–45% when hydrogen was incorporated into the design of the system.
From the literature, establishing electric vehicle charging stations powered by renewable energy is of great importance for enhancing environmental sustainability by reducing greenhouse gas emissions resulting from the use of conventional cars. For this reason, this study aimed to design electric vehicle charging stations with different capacities (200 kW, 300 kW, and 500 kW) for the most important highway roads in the Kingdom of Saudi Arabia, in addition to providing an economic study of these stations as well as their efficiency.
This research has four main sections. The introduction in Section 1 covers the importance of this area of research, the main work objectives, and a detailed review of the literature on HOMER software’s capability and similar EV charging stations that integrate RESs globally and locally. In Section 2, the methodology and modeling of EV charging stations and PV sources using HOMER software are presented. Section 3 of this work provides six case studies for five different highway locations of EV charging stations. Both technical and economic analyses of the best design of these stations are discussed, with the results for the LCOE as well as a feasibility analysis for each location. The main conclusions are discussed in Section 4.
2. Schematic Diagram and Methodology
Using the HOMER software to model EV charging stations with the integration of RESs is a topic that has been investigated in many related works. However, to the best of the author’s knowledge, a limited number of papers have focused on highway roads, especially in Saudi Arabia. Connecting the high demand for EV charging stations to distribution networks requires upgrading the electrical grid. Therefore, utilizing all the available resources, especially RESs, in remote areas—including highway roads—is an option that should be considered during the planning process of installing EV charging infrastructure. Many similar projects have been conducted in the literature; however, each project has its own parameters in terms of the variety of available RESs, the diversity of travel behaviors, and different climate change regulations. Hence, this work fills the gap in investigating the optimal design of EV charging stations with the integration of solar energy on the main highway roads in Saudi Arabia.
This section provides an estimation of the available solar energy on the main highway roads in Saudi Arabia. The estimation model for the EV charging demand of highway roads mimics a similar technology available for gasoline cars. The proposed model for EV charging estimation considers uncertainty in travel behaviors by taking field measurements of gasoline stations on highways with a diversity of refueling times and amounts of gasoline used. This proposed model for estimating the EV charging demand is one of the main contributions of this work since none of the previous works conducted in Saudi Arabia—to the best of the author’s knowledge—have considered field measurements of a similar technology. In addition, electric vehicle charging stations with different capacities (200 kW, 300 kW, and 500 kW) and their components, including the PV array, battery, and converter, were modeled using the HOMER® Grid software. Finally, a comprehensive techno-economic feasibility analysis is presented.
2.1. Geographical Location and Solar Energy Resources
This section includes the distances on the Saudi roads under study that had electric vehicle charging stations designed. These included the Makkah to Riyadh road, which is about 870 km; the Makkah to Abha road, which is about 600 km; the Riyadh to Dammam road, which is about 400 km; the Riyadh to NEOM road, which is about 1200 km; and finally, the Jeddah to NEOM road, which is about 1000 km, as shown in Figure 2.
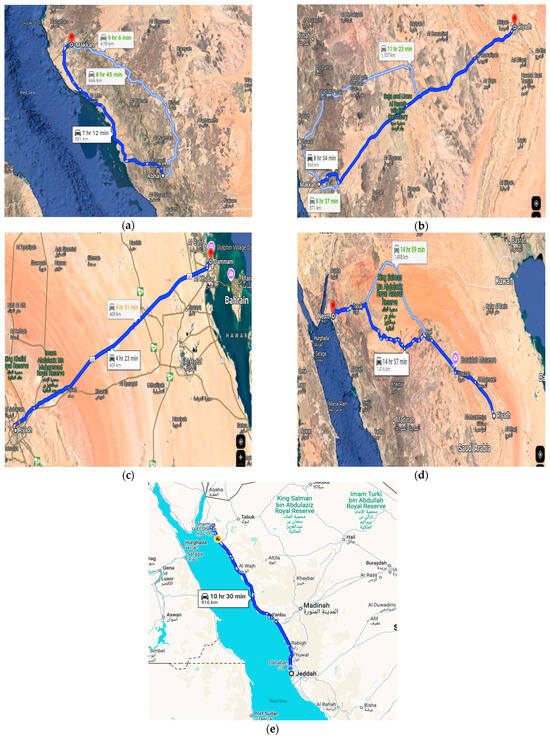
Figure 2.
(a) The Makkah to Abha road, (b) the Makkah to Riyadh road, (c) the Riyadh to Dammam road, (d) the Riyadh to NEOM road, and (e) the Jeddah to NEOM road.
Long distances require careful planning for charging electric vehicles, including careful testing of the location of charging stations based on the solar energy sources available on each individual route. Three stations with a capacity of 200, 300, and 500 kW were designed at equal distances. Solar energy sources were taken into account when selecting the site for all the study routes except for the Riyadh to NEOM and Jeddah to NEOM routes. Six charging stations were designed on the two routes: two with a capacity of 200 kW, two with a capacity of 300 kW, and two with a capacity of 500 kW because the distance between the two routes was almost twice the distance of the other study routes. When installing a PV system, the daily radiation (kWh/m2/day) and the clearness index related to the location coordinates must be defined and used properly. In accordance with NASA surface meteorology, these data were received directly from the HOMER database to address the uncertainty in the available solar energy, and Figure 3 depicts the daily radiation during the months of the year. The max daily radiation (kWh/m2/day) was 7.6, 7.3, 7, and 6.9 during June, July, May, and Aug., respectively. The daily radiation per min (kWh/m2/day) was 3.8 and 4.1 during Dec. and Nov., respectively.
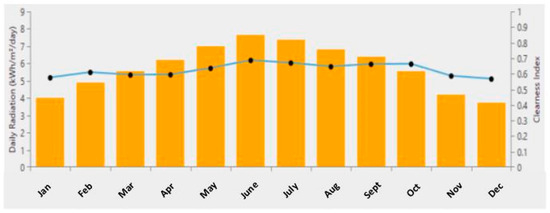
Figure 3.
Daily radiation in Saudi Arabia during the months of the year.
In this subsection, both the EV charging station locations and the available solar energy are justified, including the diversity of PV energy available in each location. In order to optimally design the EV charging stations, the EV charging demand for a variety of travel behaviors should be met with the available resources in these remote highway road areas. Hence, the following subsection presents the EV charging demand model.
2.2. EV Charging Load Model
Over the past few decades, there has been a substantial increase in the use of solar PV systems, mostly because the cost of PV solar modules and their installation as a whole has decreased. Governments have also put in place financial incentives and supporting regulations such as net metering, feed-in tariffs, and net-billing arrangements [20,21]. Another topic that has interested the scientific community and others is the idea of PV self-consumption. This is defined as the portion of PV electricity production that a system owner uses directly [2,22,23]. However, estimating the EV electrical charging load is a crucial step in designing EVCSs. Due to the limited number of EVs on the road, the conventional refueling of cars at gas stations is considered the best practice for estimating the EV charging load. Field measurements of the number of cars per hour, the average fueling times, and the number of gasoline liters used per refueling event were recorded at a gasoline station at the beginning of the Makkah–Riyadh highway. Converting the gasoline data to KWh made it possible to estimate the EV charging load based on the size of a charger inside an EVCS (50 kW) and on the number of chargers (4, 6, or 10 chargers) according to the capacities of 200 kW, 300 kW, and 500 kW. Table 2 shows the electrical load of the EV charging stations with capacities of 200 kW, 300 kW, and 500 kW.
Table 2.
Gasoline station refueling data and the compatible EV charging load.
The uncertainty in travel behaviors was considered in the field measurements by recording the arrival rate, arrival time, and service time parameters for three different gas stations (small, medium, and large) during weekdays and weekends. Then, these data were fit into a normal distribution curve to obtain all the design parameters shown in Table 3.
Table 3.
Design parameters estimated from gas station data.
In this subsection, the EV charging demand is modeled and estimated based on the gasoline station data. The diversity of travel patterns was considered in terms of the arrival rates, arrival times, and refueling times. The output from this part is the main input in the following two subsections.
2.3. System Schematic
The proposed modeling configurations are based on a typical community load of electric vehicle stations (4000–500 kW peak, 4020 kWh/d; 300 kW, 2776 kWh/d; and 200 kW, 1666 kWh/d) powered by a PV system (Schn680, HOMER® Grid software, version 1.10.1 June 2023) connected to an AC bus. An ESS (100 kWh nominal capacity) is used to provide electrical power when the PV system’s output is insufficient (due to maintenance issues or the PV system not producing enough energy), and a DC/AC converter (Leonics 900 kW) is used to transfer power between the DC and AC buses. The project schematic is displayed in Figure 4. This equipment was considered in our work based on the best practices in similar projects conducted in this field worldwide [14,15,16,17,18,19,20].
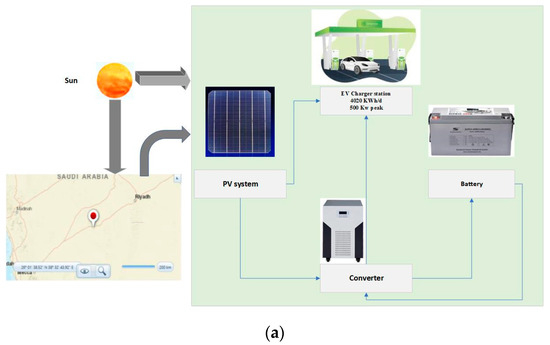
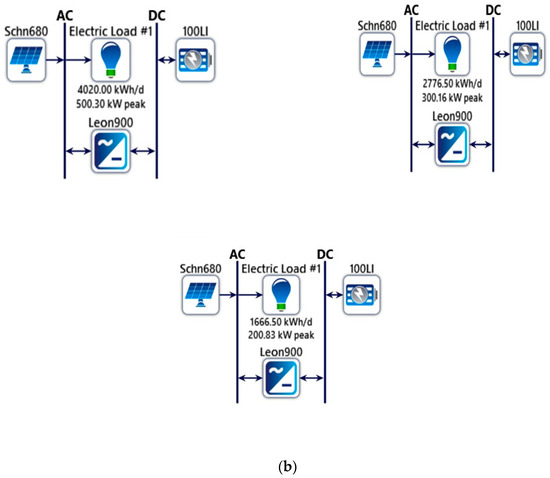
Figure 4.
(a) A schematic diagram of the system; (b) the system’s schematic on HOMER Grid software.
The net present cost (NPC) was used as an important economic metric and target for the classification of different configurations. The NPC subtracts the present value of all costs incurred by the system during its lifetime from the present value of all profits accrued during its lifetime:
where is the total annual cash flow of the system, i is the interest rate, and n is the project lifetime. is a recovery factor that gives the present value as a function of the annuity and can be expressed as follows:
Another economic factor that was used to compare different configurations is the levelized cost of energy (LCOE), which accounts for the cost of electricity generated per kWh of electrical energy over the life of each integrated renewable energy system, which can be determined as follows:
where is the primary electricity load used as the input data and is the total electricity sold to the grid utility.
2.4. System Component Modeling
Equation (4) [24] can be used to estimate the power produced by a solar PV system based on solar irradiation and the ambient temperature. The PV module is made up of a series and parallel arrangement of solar cells that can convert solar irradiation into a direct current through the PV phenomenon.
where and (kW/m2) represent the solar radiation incident on the PV array and the incident radiation, represents the temperature coefficient of power, and represents the rated capacity of the PV array under standard test conditions (kW). The Schneider Context-Core-XC 680 kW (version 1.10.1 june 2023) with a generic PV system (3000 kW of rated capacity) from the HOMER library was selected. Table 4 shows the PV system’s characteristics, as determined using HOMER software.
Table 4.
PV panel characteristics.
The high DoD rate (=80%) of the “generic 100 kWh Li-ion” battery made it possible for the system to use more stored energy without damaging the battery, which is why it was selected for this investigation. Details about the battery are shown in Table 5.
Table 5.
Generic 100 kWh Li-ion battery characteristics.
The battery characteristics, including its capacity, voltage, depth of charge (DoD), state of charge (SoC), and days of autonomy, are critical for building a microgrid system. The maximum limit at which the battery may be charged is indicated by the maximum SoC. On the other hand, the minimum SoC, which is represented as a percentage of the total capacity, establishes the minimum discharge rate, below which the battery should not be exhausted, as shown in Equation (5) [15,19].
One important factor to take into account when designing the system is the battery bank’s autonomy. In particular, the autonomy of the battery bank from a “fully charged” battery state to the maximum DoD, Abatt, is the number of potential days that the battery bank may power an electrical load without any additional energy contribution. Specifically, Abatt is defined as the battery bank size to the electrical load ratio, as shown in Equation (6):
where is the average daily load (kWh), is the nominal battery capacity (Ah), is the nominal voltage of each battery, and Nbatt is the number of battery units. Another crucial factor is the battery life cycle Bcycle, which is largely responsible for lowering the project’s overall battery replacement cost. The battery life cycle, which is determined by the battery float life and overall life, is calculated as follows in Equation (7):
For the converter, the Leonics GTP519S was chosen. The total rated power capacity of the converter (kW) was determined using Equation (8) [3,18]:
where is the maximum AC load, is the converter efficiency, and is the safety factor. It should be noted that several sizes of converters could be utilized in the system design to effectively convert electrical energy and fulfill the load demand, as shown in Table 5. Details about the converter are displayed in Table 6.
Table 6.
Converter characteristics.
3. Results and Discussion
This section presents the results of modeling three electric vehicle charging stations for five highway roads in Saudi Arabia.
For the 500 kW station, a sizable 3000 kW solar PV array, which has a substantial ability to produce renewable energy, was used with 37 strings of 100 kWh Li-ion batteries, and the energy storage system had a 3700 kWh total storage capacity. During low solar irradiation, the storage capacity of the station enabled it to meet charging requests. For the 300 kW and 200 kW stations, according to the PV type used in this modeling, their size was 3000 kW. The number of generic 100 kWh Li-ion strings was 21 and 11, and the number of Leonics GTP519S strings was 322 and 130 kW, respectively. As a result, EV charging stations can offer EV users a reliable, continuous, and reasonably priced charging service according to the modeling of three stations for charging electric vehicles along these roads. The resilience and sustainability of the stations can be improved by improving their capacity to store and handle energy, as shown in Table 7, according to the optimal modeling case on HOMER software.
Table 7.
PV system architecture.
The solar PV system had the highest annual cost when looking at annualized costs, which divides the total lifespan costs evenly throughout the system’s lifetime. The battery storage system came in second, followed by the power conversion system. When analyzing the financial data for different solar energy systems (500 kW, 300 kW, and 200 kW), the total costs were analyzed to conclude the preference for an electric car charging station. The 500 kW station offers the highest power and charging capacity, making it ideal for locations with a high level of vehicle traffic; the operating costs were USD 67,000, and the total costs were USD 1,050,000. The 300 kW station offers a good balance between cost and capacity, making it suitable for a moderate volume of traffic volume; the operating costs were USD 51,000, and the total was USD 913,230. As for the charging station with a capacity of 200 kW, the operating costs were USD 41,000, and the total costs were USD 823,391. Therefore, the total cost of the three stations on the road between Makkah and Riyadh was USD 2,786,621, as shown in Table 8 and Table 9.
Table 8.
Annualized costs for 500, 300, and 200 kW stations on the Makkah–Riyadh road.
Table 9.
The excess and unmet electricity for the 500 kW, 300 kW, and 200 kW stations.
Table 10 shows the production of components for each solar power system with different capacities (500 kW, 300 kW, and 200 kW), focusing on the Schneider Conext-Core-XC system with a capacity of 680 kW. The energy production was found to be 6,191,884 kWh/year at a percentage of 100%.
Table 10.
The production of electricity.
The component consumption of each solar power system with varying capacities (500 kW, 300 kW, and 200 kW) is displayed in Table 10. For 500 kW, the annual energy consumption was 1,466,584 kWh, and for 300 and 200 kW, it was 1,012,819 kWh. The consumption of both the 300 kW and 200 kW systems was very similar (1,012,819 kWh/year), suggesting that there may be other factors influencing operating efficiency and that the production capacity is not always proportionate to the consumption. In comparison to the other two systems, the larger system (500 kW) used a lot more energy, suggesting that it is able to manage heavier loads and provide more energy, as shown in Table 11.
Table 11.
The consumption of electricity.
Table 12 shows the data related to solar energy systems with different capacities (500 kW, 300 kW, and 200 kW). The maximum production (kW) was 3212 kW for the three capacities (500, 300, and 200 kW). As for the PV penetration (%), it was 422, 1018, and 611% for 500, 300, and 200 kW, respectively. It appears that the PV penetration rate for the 300 kW system was high, which means that it uses solar energy more efficiently. The other ratios do not reflect production efficiency, which indicates the weakness of the smaller and larger systems in this context. The operating hours (hours/year) were constant for the three systems at 4370 h. The levelized cost (USD/kWh) was constant at USD 0.117 for the three systems.
Table 12.
The Schneider Conext-Core-XC 680 kW with generic PV system electrical summary.
The output of the solar panels is shown in kilowatts (kW). The solar power system may produce a maximum of 24 kW, as indicated by the values, which range from 0 to 24 kW. A year’s worth of time is represented by the horizontal axis, which spans 360 days. The output of the solar power system seemed to change over time. There were times during the year when solar production was low (blue), such as at night or during the winter. The yellow and red regions had a stronger solar output; these could represent daytime or summertime, as shown in Figure 5. For 500 kW, the system’s total cost-effectiveness can be evaluated by comparing its levelized cost of electricity, which stands at USD 0.117 per kWh, to alternative energy sources or grid power rates in order to determine its financial feasibility. The PV penetration rate of 422% indicates that the solar PV system is disproportionately large in relation to the need for EV charging, which could result in a substantial surplus of power generation that could be utilized for other purposes or sold to the grid. The system’s steady and dependable performance was also demonstrated by its 4370 annual hours of operation; it ran for a substantial portion of the year in order to satisfy the needs of EV charging.
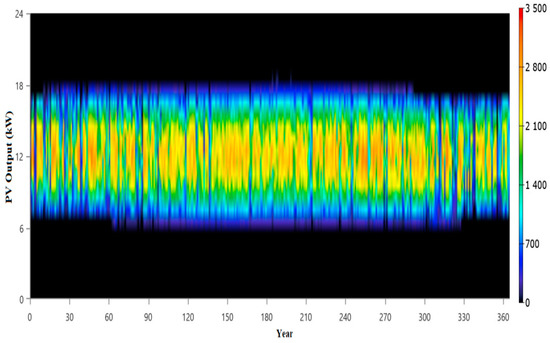
Figure 5.
Schneider Conext-Core-XC 680 kW with generic PV output (kW).
The system may totally shut down during times of little or no demand thanks to its minimal output of 0 kW, which maximizes its efficiency and minimizes needless energy loss. The system has a significant generation capability, as seen by its maximum output of 3212 kW, which can support high-peak charging demands, as shown in Table 12. For the 300 kW and 200 kW systems, respectively, the system consisted of 21 and 11 batteries, with a bus voltage of 600 V for both systems. The batteries produced annual internal energy in the amounts of 424,584 and 235,559 kWh, while the output energy was 382,858 and 212,419 kWh, reflecting a storage drain of 772 and 438 kWh per year and losses of 42,498 and 23,578 kWh. The cost of corrosion during storage was equivalent to USD 0.246 per kWh for both systems. The nominal capacity of the systems was 2100 and 1100 kWh, while the usable capacity was 1680 and 880 kWh. The lifetime productivity of the systems was 6,053,512 and 3,300,000 kWh, with expected lifespans of 15 and 14.7 years. Thus, both systems have good energy efficiency, but losses and costs associated with storage can affect the long-term economic return.
The productivity of the photovoltaic solar power system (PV output) is shown in Figure 6 in kilowatts (kW). There is variation in productivity in the early and late sections of the figure (from 0 to 30 and from 330 to 360 days during the year). This might point to periods of reduced solar radiation or seasonality, both of which have an impact on the output. The image illustrates that, although the solar power system can produce large amounts of energy over extended periods of time, there are sometimes brief dips in productivity, as shown in Figure 6.
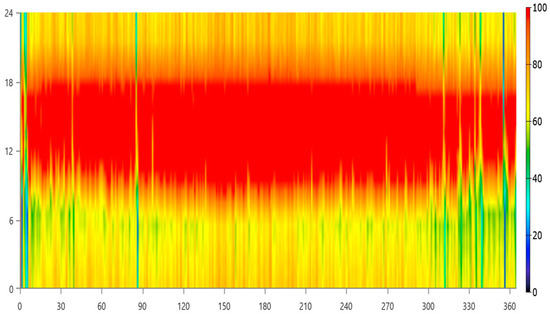
Figure 6.
Generic 100 kWh Li-ion state of charge (%).
For the 500 kW system, Table 13 indicates 4696 h of operation annually, which is a large number and suggests that the plant was used extensively. It produced 457,060 kWh annually—a high productivity level corresponding with extended working hours—and 476,104 kWh/year, indicating a 19,044 kWh/year loss, or 4% of the energy input.
Table 13.
The generic 100 kWh Li-ion battery results.
The transfers and connections within the station could be the cause of these losses. A capacity of 400 kilowatts is a substantial capacity that matches the high output power. The system ran for 4639 and 4553 h a year for the 300 kW and 200 kW power systems, respectively. This resulted in an annual total output of 367,543 and 203,922 kWh, whereas the intake was 382,858 and 212,419 kWh, with annual losses of 15,314 and 8497 kWh. With an average output of 42 and 23.3 kW, a minimum output of 0 kW, and a maximum output of 221 and 120 kW, the systems’ real capacities were 322 and 130 kW. The capacity ratios of 17.9% and 13.0 indicate that the systems’ efficiency was mediocre, as shown in Table 14 and Figure 7.
Table 14.
The Leonics GTP519S 900 kW 700 Vdc electrical results for the 3 stations.
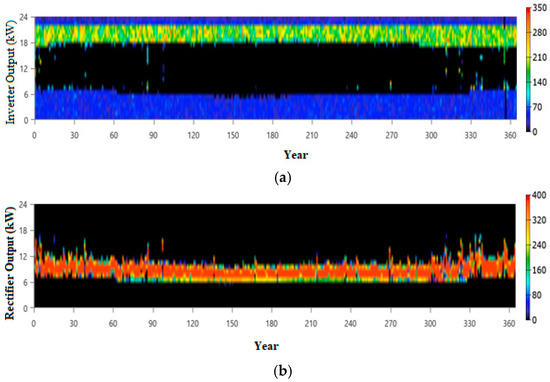
Figure 7.
(a) Leonics GTP519S 900 kW 700 Vdc inverter output (kW); (b) Leonics GTP519S 900 kW 700 Vdc rectifier output (kW).
The Makkah to Riyadh, Makkah to Abha, and Riyadh to Dammam roads are the three Saudi highways for which three electric vehicle charging stations (500, 300, and 200 KW) were planned. With a total cost of USD 2,786,621, the project’s three stations—500, 300, and 200 kW—would cost USD 1,050,000, USD 913,230, and USD 823,391 in total. The 300 kW plant represents the highest capital expense in terms of its initial investment, but since it produces more power, the price might be justified. The 500 kW plant is appealing in terms of economic efficiency because it has the lowest running expenses when compared to the other plants. Three stations (500, 300, and 200 kW) were designed, with two of each implemented for two Saudi highway roads (Riyadh to Neom and Jeddah to Neom) due to their substantial length of greater than 1000 km. The total project costs were calculated to be USD 2,100,000, USD 1,826,460, and USD 1,646,782 for the 500, 300, and 200 kW plants, respectively, with a total cost of USD 5,573,242. This economic study provides a comprehensive overview of the project costs and potential returns that must be considered when setting up solar power plants for charging electric vehicles.
4. Conclusions
The objective of this study was to develop 200 kW, 300 kW, and 500 kW electric vehicle charging stations for the Kingdom of Saudi Arabia’s most significant routes. The study also included an efficiency and cost analysis of these stations. These routes were defined as the Makkah to Riyadh, Makkah to Abha, Riyadh to Dammam, Riyadh to NEOM, and Jeddah to NEOM roads. The goal of this modeling was to determine the performance, behavior, and sustainability of charging electric vehicles. Using HOMER software, the results showed that the 500 kW station provided the highest energy production, making it ideal for meeting high demands. According to the annual energy production of 3,212,000 kWh, the average electric car consumes about 20 kWh per 100 km. Given the assumption that the average electric car’s battery capacity is 60 kWh, which means that the car needs to be fully charged once, the number of vehicles that can be charged annually could reach 53,533 vehicles. The 300 kW station provided good production but had less efficiency than the larger station. According to the annual energy production of 367,543 kWh, the number of vehicles that can be charged annually could reach 6125 vehicles. Finally, the 200 KW station could charge 6100 vehicles annually. Thus, the three stations on the Makkah to Riyadh, Makkah to Abha, and Riyadh to Dammam roads could charge 65,758 vehicles annually. On the Riyadh to NEOM and Jeddah to NEOM roads, 131,516 vehicles could be charged annually. This indicates that operating efficiency could be improved, and the available energy could be used more efficiently. This also shows that there may be sufficient electricity in the system to cover the demand for electric vehicle charging. Generally, the system can optimize the performance and the characteristics of modeling EV charging stations. Future work will involve modeling photovoltaic systems in addition to wind energy in different locations with different scenarios to reach an optimized case.
Funding
This research received no external funding.
Data Availability Statement
The author confirms that the data supporting the findings of this study are available within the article.
Conflicts of Interest
The author declares no conflicts of interest.
References
- Oladigbolu, J.O.; Mujeeb, A.; Al-Turki, Y.A.; Rushdi, A.M. A Novel Doubly-Green Stand-Alone Electric Vehicle Charging Station in Saudi Arabia: An Overview and a Comprehensive Feasibility Study. IEEE Access 2023, 11, 37283–37312. [Google Scholar] [CrossRef]
- Elshurafa, A.M.; Muhsen, A.R.; Felder, F.A. Cost, footprint, and reliability implications of deploying hydrogen in off-grid electric vehicle charging stations: A GIS-assisted study for Riyadh, Saudi Arabia. Int. J. Hydrogen Energy 2022, 47, 32641–32654. [Google Scholar] [CrossRef]
- Nara, K. Next-generation power delivery system with resiliency and environmental affinity. Glob. Energy Interconnect. 2022, 5, 274–280. [Google Scholar] [CrossRef]
- Hou, H.; Wang, Z.; Hou, T.; Fang, R.; Tang, J.; Xie, C. Optimal schedule of 100% renewable energy microgrid considering demand response of EVs. Energy Rep. 2023, 9, 1743–1750. [Google Scholar] [CrossRef]
- Chai, Y.T.; Che, H.S.; Tan, C.K.; Tan, W.N.; Yip, S.C. A two-stage optimization method for Vehicle to Grid coordination considering building and Electric Vehicle user expectations. Int. J. Electr. Power Energy Syst. 2023, 148, 108984. [Google Scholar] [CrossRef]
- Chen, X.; Dong, W.; Yang, Q. Robust optimal capacity planning of grid-connected microgrid considering energy management under multi-dimensional uncertainties. Appl. Energy 2022, 323, 119642. [Google Scholar] [CrossRef]
- Ekren, O.; Canbaz, C.H.; Güvel, B. Sizing of a solar-wind hybrid electric vehicle charging station by using HOMER software. J. Clean. Prod. 2021, 279, 123615. [Google Scholar] [CrossRef]
- Eltamaly, A.M.; Alotaibi, M.A. Novel fuzzy-swarm optimization for sizing of hybrid energy systems applying smart grid concepts. IEEE Access 2021, 9, 93629–93650. [Google Scholar] [CrossRef]
- Zhang, Y.; Yan, S.; Yin, W.; Wu, C.; Ye, J.; Wu, Y.; Liu, L. HOMER-based multi-scenario collaborative planning for grid-connected PV-storage microgrids with electric vehicles. Processes 2023, 11, 2408. [Google Scholar] [CrossRef]
- Mazlan, M.A.A.; Dahlan, N.Y. Energy Management Strategies of Solar Rooftop Campus with Battery Energy Storage System (BESS) And EV Supply Equipment (EVSE) using HOMER. In IOP Conference Series: Earth and Environmental Science; IOP Publishing: Bristol, UK, 2023; Volume 1281. [Google Scholar]
- Haffaf, A.; Lakdja, F.; Abdeslam, D.O. Experimental performance analysis of an installed microgrid-based PV/battery/EV grid-connected system. Clean Energy 2022, 6, 599–618. [Google Scholar] [CrossRef]
- Barakat, S.; Mageed, H.M.A.; Samy, M. Eco-Efficient Mobility: Comparative Optimization of PV-Wind EV Charging Solutions. In Proceedings of the 2023 24th International Middle East Power System Conference (MEPCON), Mansoura, Egypt, 19–21 December 2023; IEEE: Piscataway, NJ, USA, 2023. [Google Scholar]
- Kumar, P.; Channi, H.K. Optimal Site Selection and Economic Scheduling of Electric Vehicle Charging Station using HOMER: A Case Study of TOHANA, Haryana. In Proceedings of the 2024 Fourth International Conference on Advances in Electrical, Computing, Communication and Sustainable Technologies (ICAECT), Bhilai, India, 11–12 January 2024; IEEE: Piscataway, NJ, USA, 2024. [Google Scholar]
- Singh, B.; Kumar, A. Optimal energy management and feasibility analysis of hybrid renewable energy sources with BESS and impact of electric vehicle load with demand response program. Energy 2023, 278, 127867. [Google Scholar] [CrossRef]
- Shaikh, A.; Soomro, A.M.; Kumar, M.; Shaikh, H. Assessment of a Stand-alone Hybrid PV-Hydrogen Based Electric Vehicle Charging Station Model Using HOMER. J. Appl. Eng. Technol. 2022, 6, 11–20. [Google Scholar] [CrossRef]
- Boddapati, V.; Kumar, A.R.; Daniel, S.A.; Padmanaban, S. Design and prospective assessment of a hybrid energy-based electric vehicle charging station. Sustain. Energy Technol. Assess. 2022, 53, 102389. [Google Scholar] [CrossRef]
- Li, C.; Shan, Y.; Zhang, L.; Zhang, L.; Fu, R. Techno-economic evaluation of electric vehicle charging stations based on hybrid renewable energy in China. Energy Strategy Rev. 2022, 41, 100850. [Google Scholar] [CrossRef]
- Long, Y.; Li, Y.; Wang, Y.; Cao, Y.; Jiang, L.; Zhou, Y.; Deng, Y.; Nakanishi, Y. Impact of EV load uncertainty on optimal planning for electric vehicle charging station. Sci. China Technol. Sci. 2021, 64, 2469–2476. [Google Scholar] [CrossRef]
- Boddapati, V.; Kumar, A.R.; Prakash, D.B.; Daniel, S.A. Design and feasibility analysis of a solar PV and biomass-based electric vehicle charging station for metropolitan cities (India). Distrib. Gener. Altern. Energy J. 2022, 37, 793–818. [Google Scholar] [CrossRef]
- Oladigbolu, J.O.; Mujeeb, A.; Imam, A.A.; Rushdi, A.M. Design, Technical and Economic Optimization of Renewable Energy-Based Electric Vehicle Charging Stations in Africa: The Case of Nigeria. Energies 2022, 16, 397. [Google Scholar] [CrossRef]
- Rahman, M.M.; Al-Ammar, E.A.; Das, H.S.; Ko, W. Optimal design of grid connected pv battery system for probabilistic EVCS load. In Proceedings of the 2020 Advances in Science and Engineering Technology International Conferences (ASET), Dubai, United Arab Emirates, 4 February–9 April 2020; IEEE: Piscataway, NJ, USA, 2020. [Google Scholar]
- Abdelrahim, M.; Alkawsi, G.; Alkahtani, A.A.; Alhasan, A.M.W.; Khudari, M.; Kadir, M.R.A.; Ekanayake, J.; Tiong, S.K. Techno-economic analysis of a wind-energy-based charging station for electric vehicles in high-rise buildings in Malaysia. Energies 2022, 15, 5412. [Google Scholar] [CrossRef]
- Bilal, M.; Ahmad, F.; Rizwan, M. Techno-economic assessment of grid and renewable powered electric vehicle charging stations in India using a modified metaheuristic technique. Energy Convers. Manag. 2023, 284, 116995. [Google Scholar] [CrossRef]
- Solanki, L.; Vadhera, S.; Sandhu, K.S. 10.3-kW Solar PV Grid-Tied Charging of Li-Ion Batteries in Battery Swapping Stations for EVs Using HOMER Pro. In Renewable Resources and Energy Management; CRC Press: Boca Raton, FL, USA, 2023; pp. 341–348. [Google Scholar]
Disclaimer/Publisher’s Note: The statements, opinions and data contained in all publications are solely those of the individual author(s) and contributor(s) and not of MDPI and/or the editor(s). MDPI and/or the editor(s) disclaim responsibility for any injury to people or property resulting from any ideas, methods, instructions or products referred to in the content. |
© 2025 by the author. Licensee MDPI, Basel, Switzerland. This article is an open access article distributed under the terms and conditions of the Creative Commons Attribution (CC BY) license (https://creativecommons.org/licenses/by/4.0/).