Author Contributions
Conceptualization, S.A.; methodology, S.A., I.B. and M.G.; software, I.B.; validation, S.A. and M.G.; formal analysis, I.B.; investigation, I.B.; resources, P.M.; data curation, I.B.; writing—original draft preparation, I.B.; writing—review and editing, S.A. and M.G.; visualization, I.B.; supervision, S.A. and P.M.; project administration, P.M.; funding acquisition, P.M. All authors have read and agreed to the published version of the manuscript.
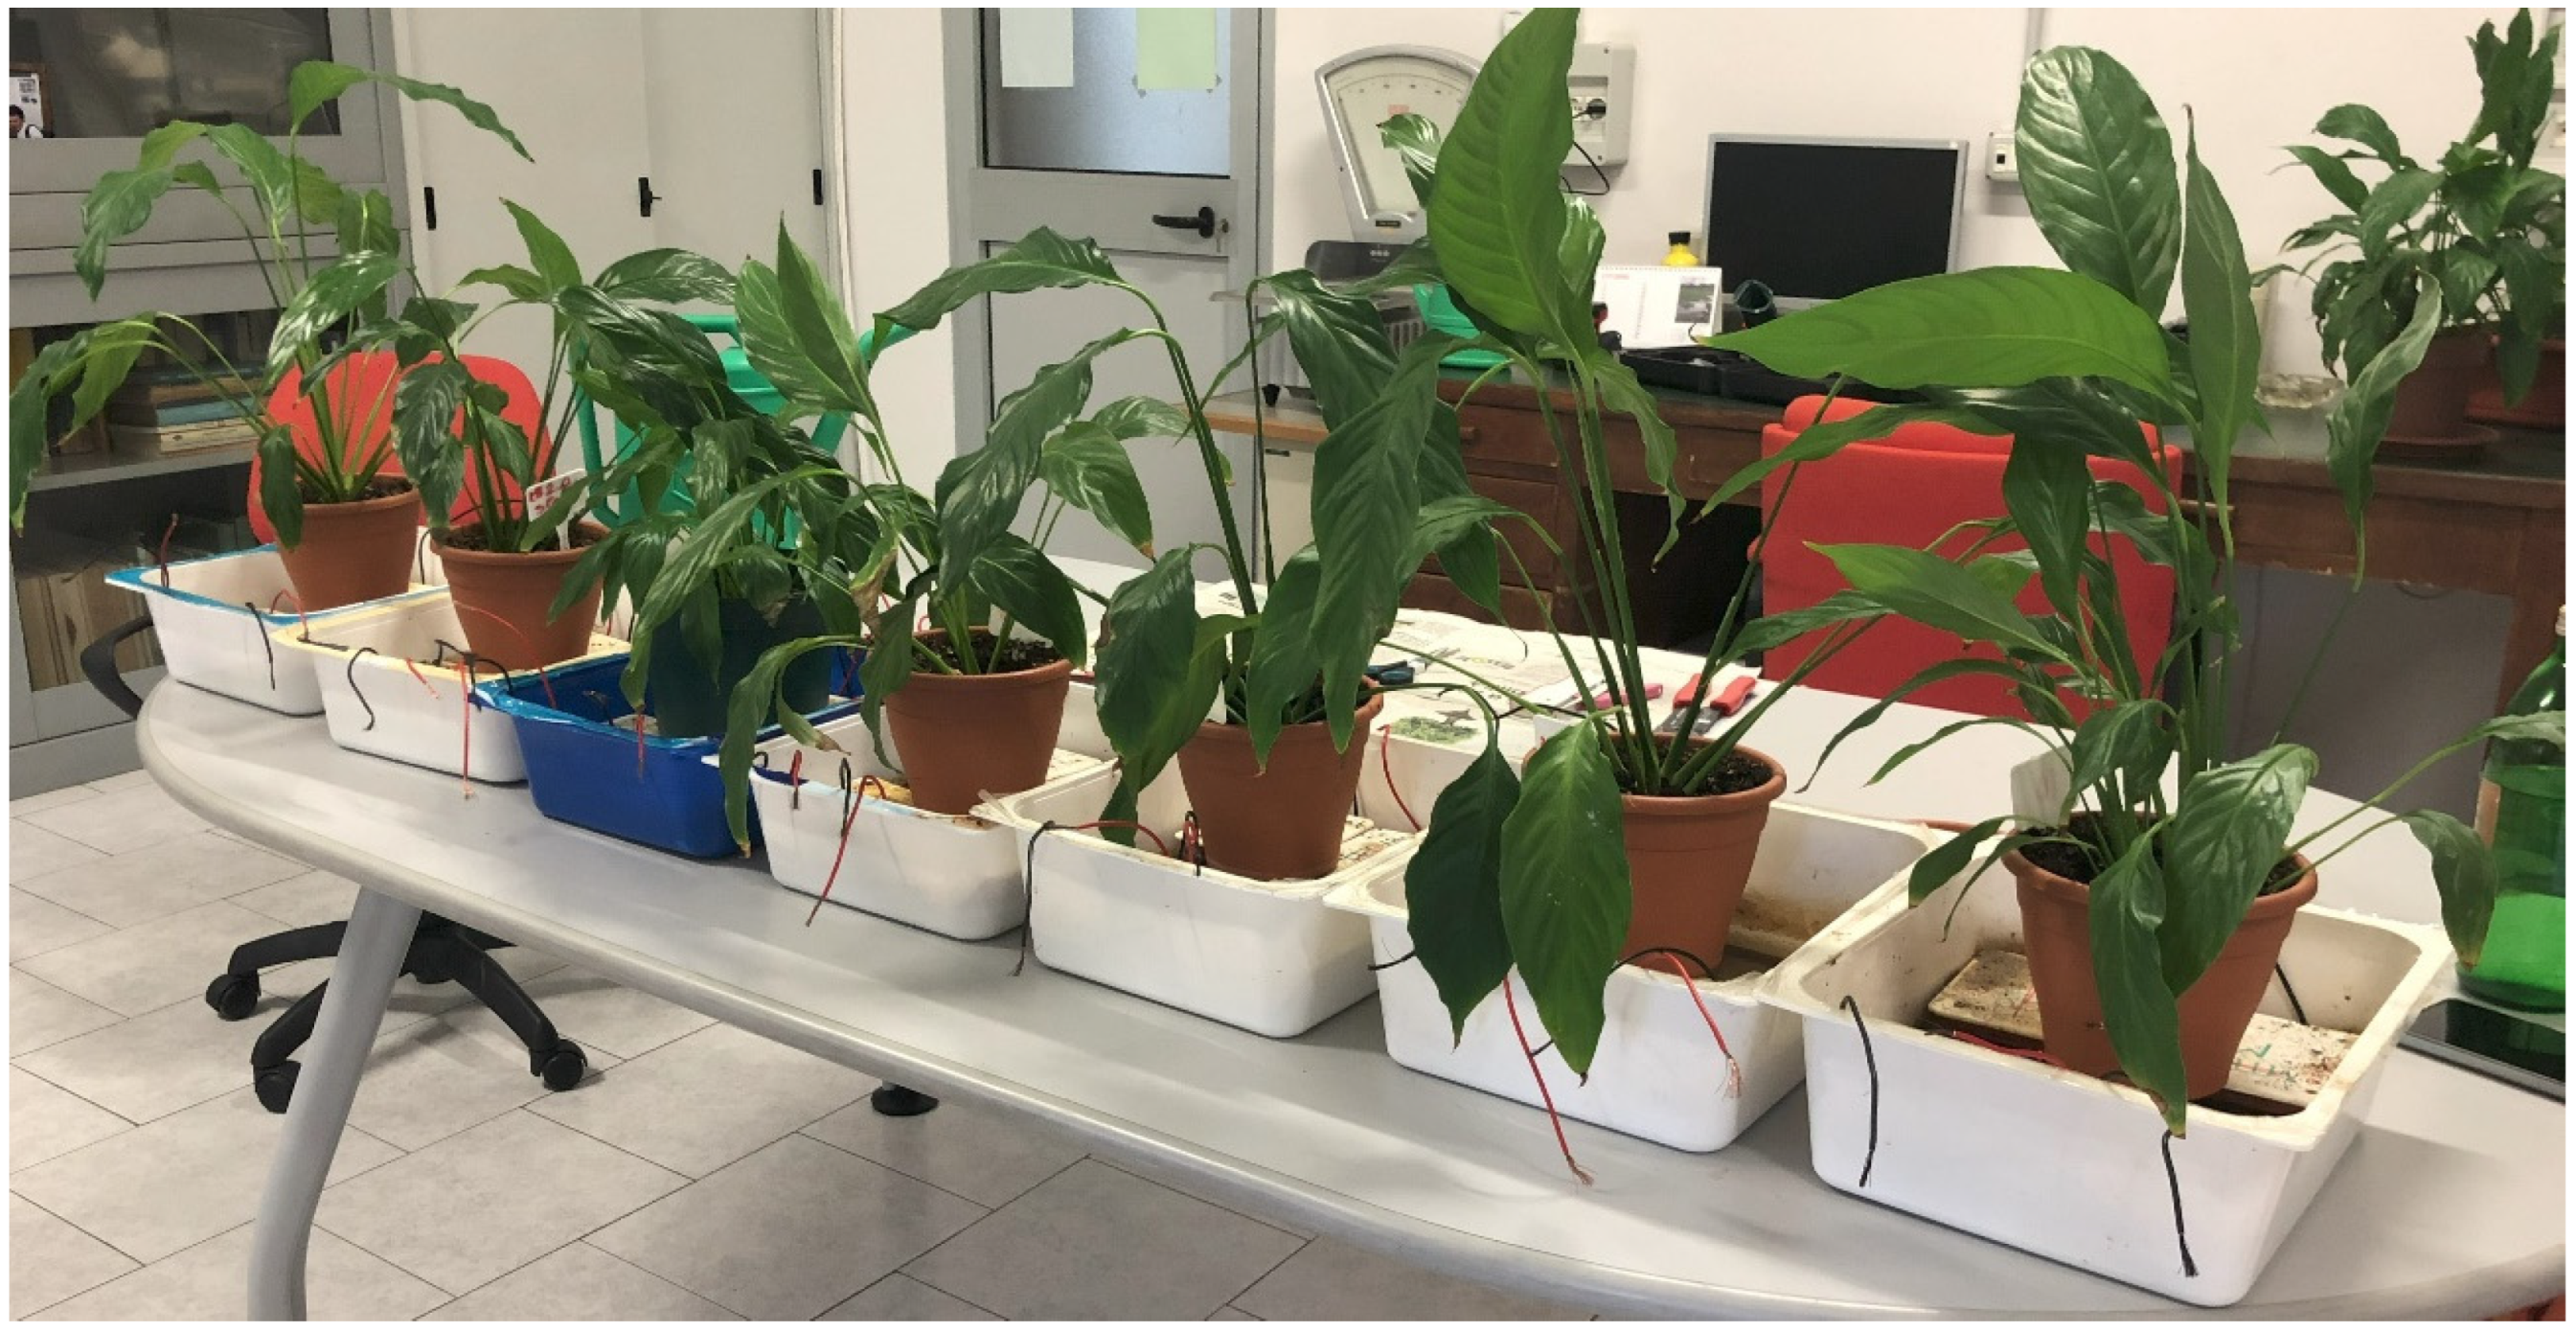
Figure 1.
Novel prototype of PMFC.
Figure 1.
Novel prototype of PMFC.
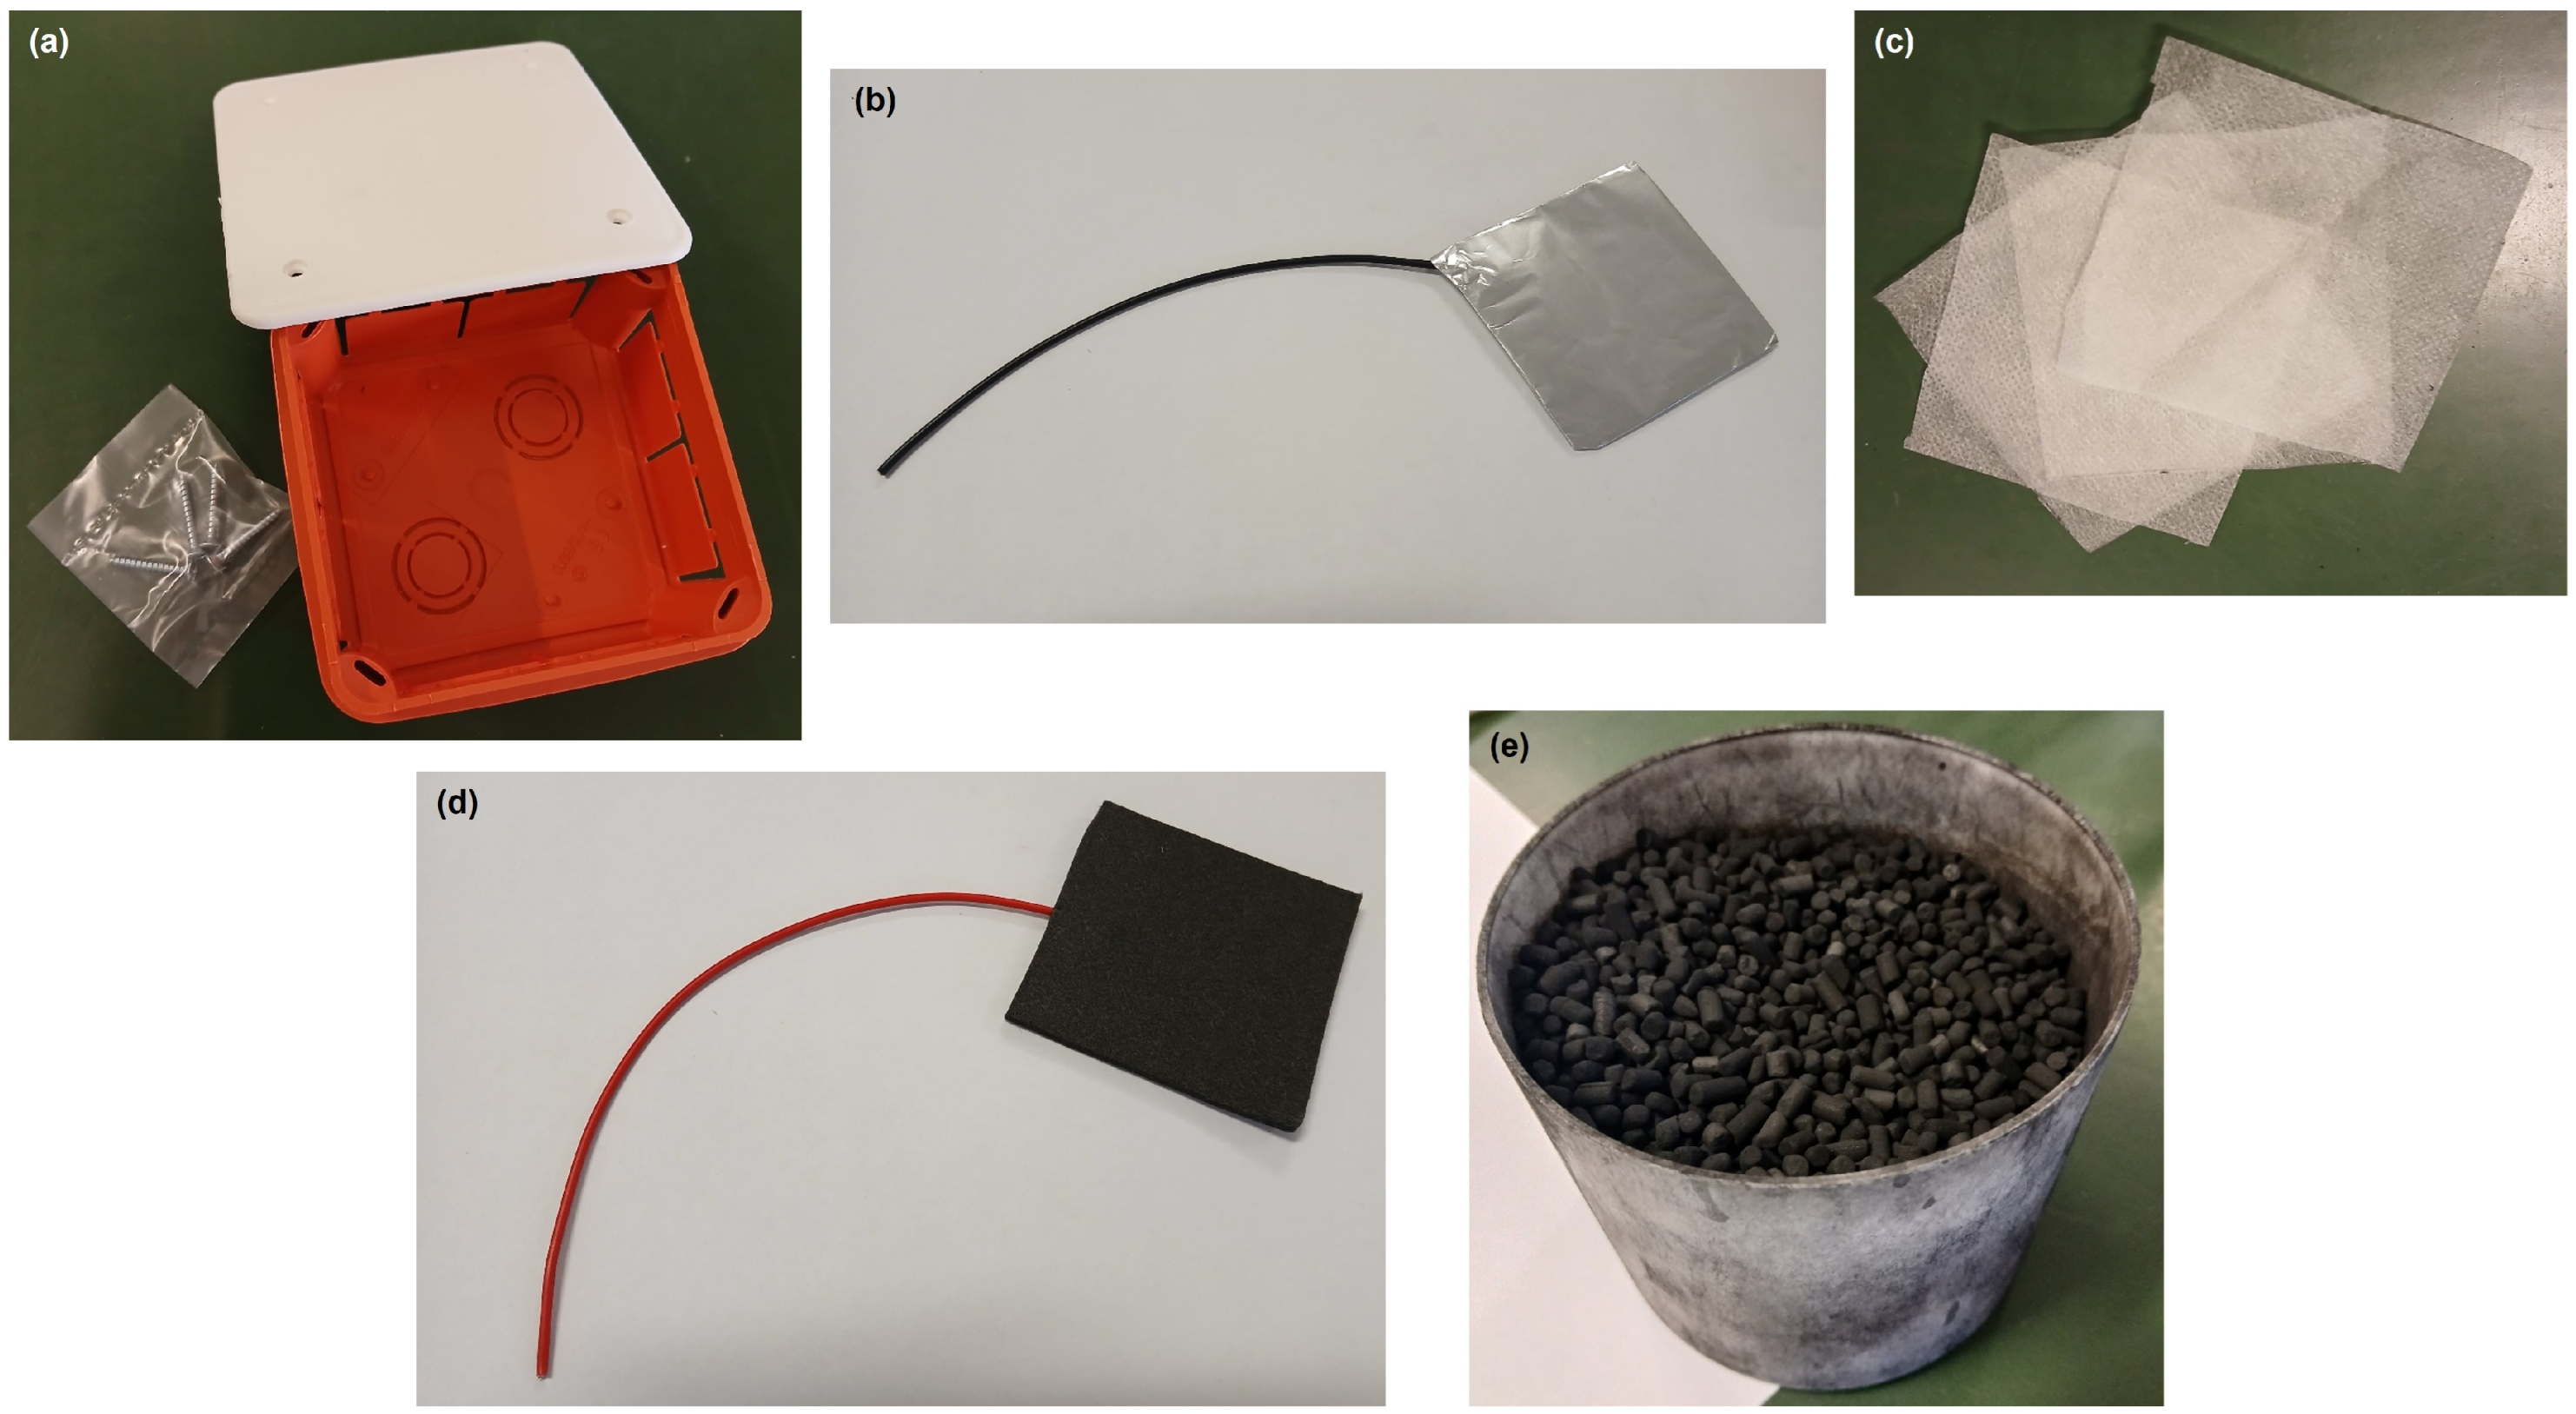
Figure 2.
MFC’s construction material: (a) derivation box; (b) aluminum anode; (c) membrane; (d) carbon felt cathode; (e) carbon pellet.
Figure 2.
MFC’s construction material: (a) derivation box; (b) aluminum anode; (c) membrane; (d) carbon felt cathode; (e) carbon pellet.
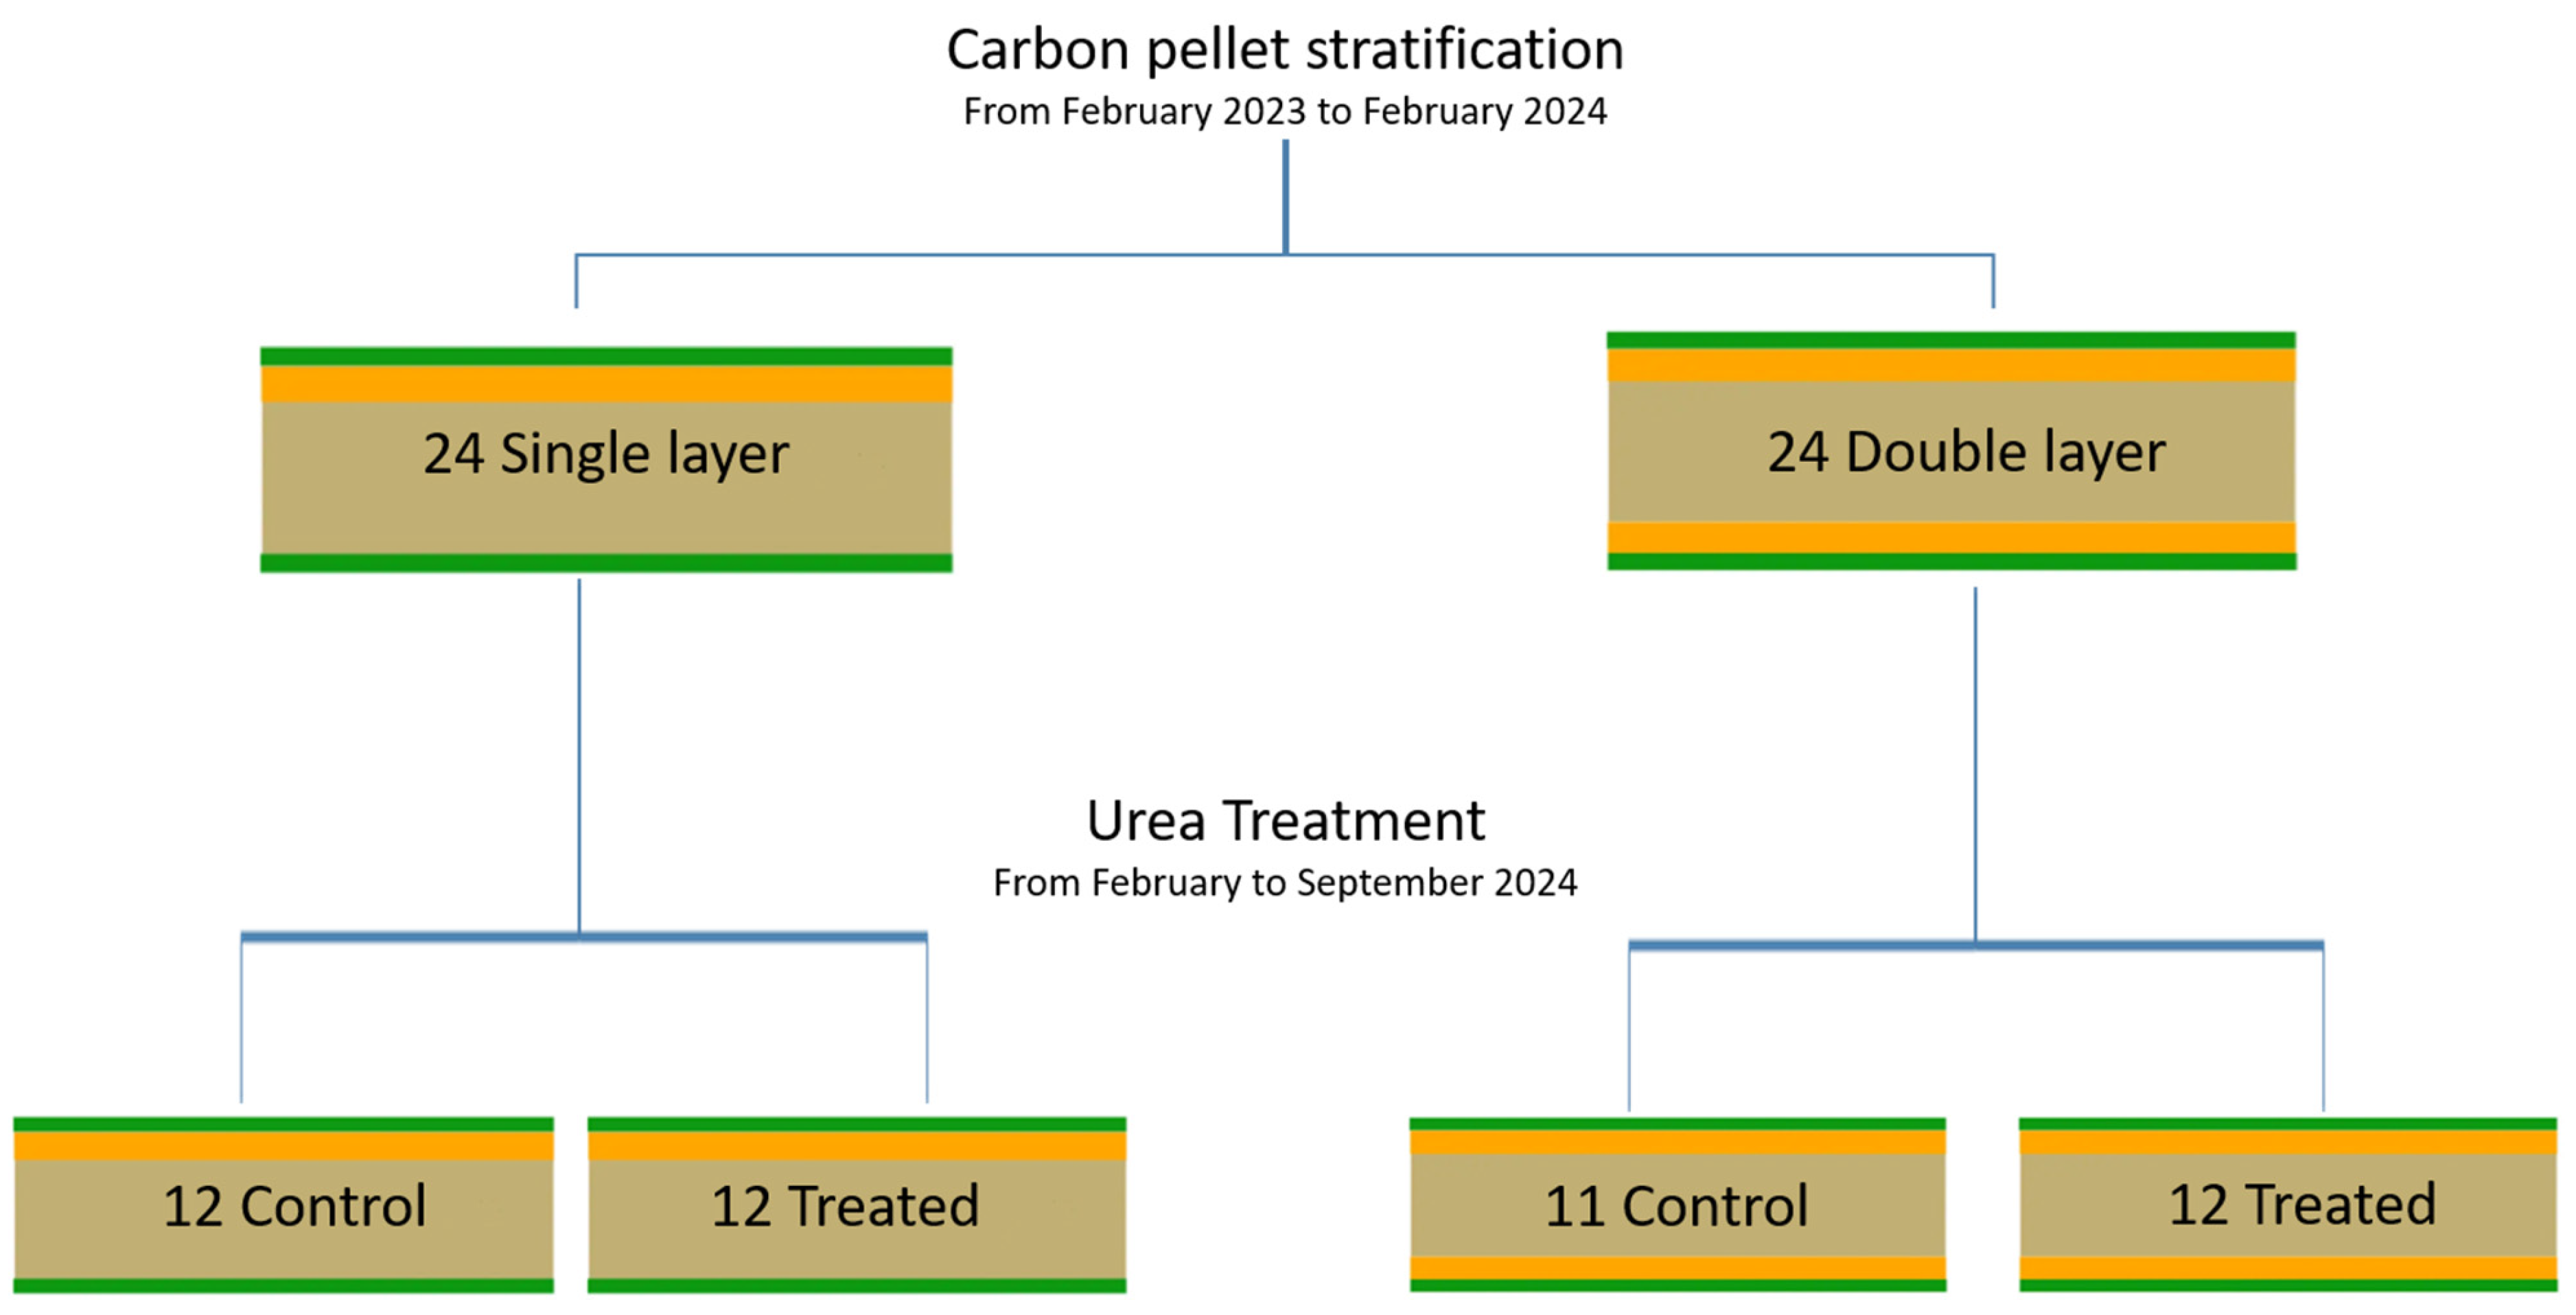
Figure 3.
Schematic diagram of the laboratory setup.
Figure 3.
Schematic diagram of the laboratory setup.
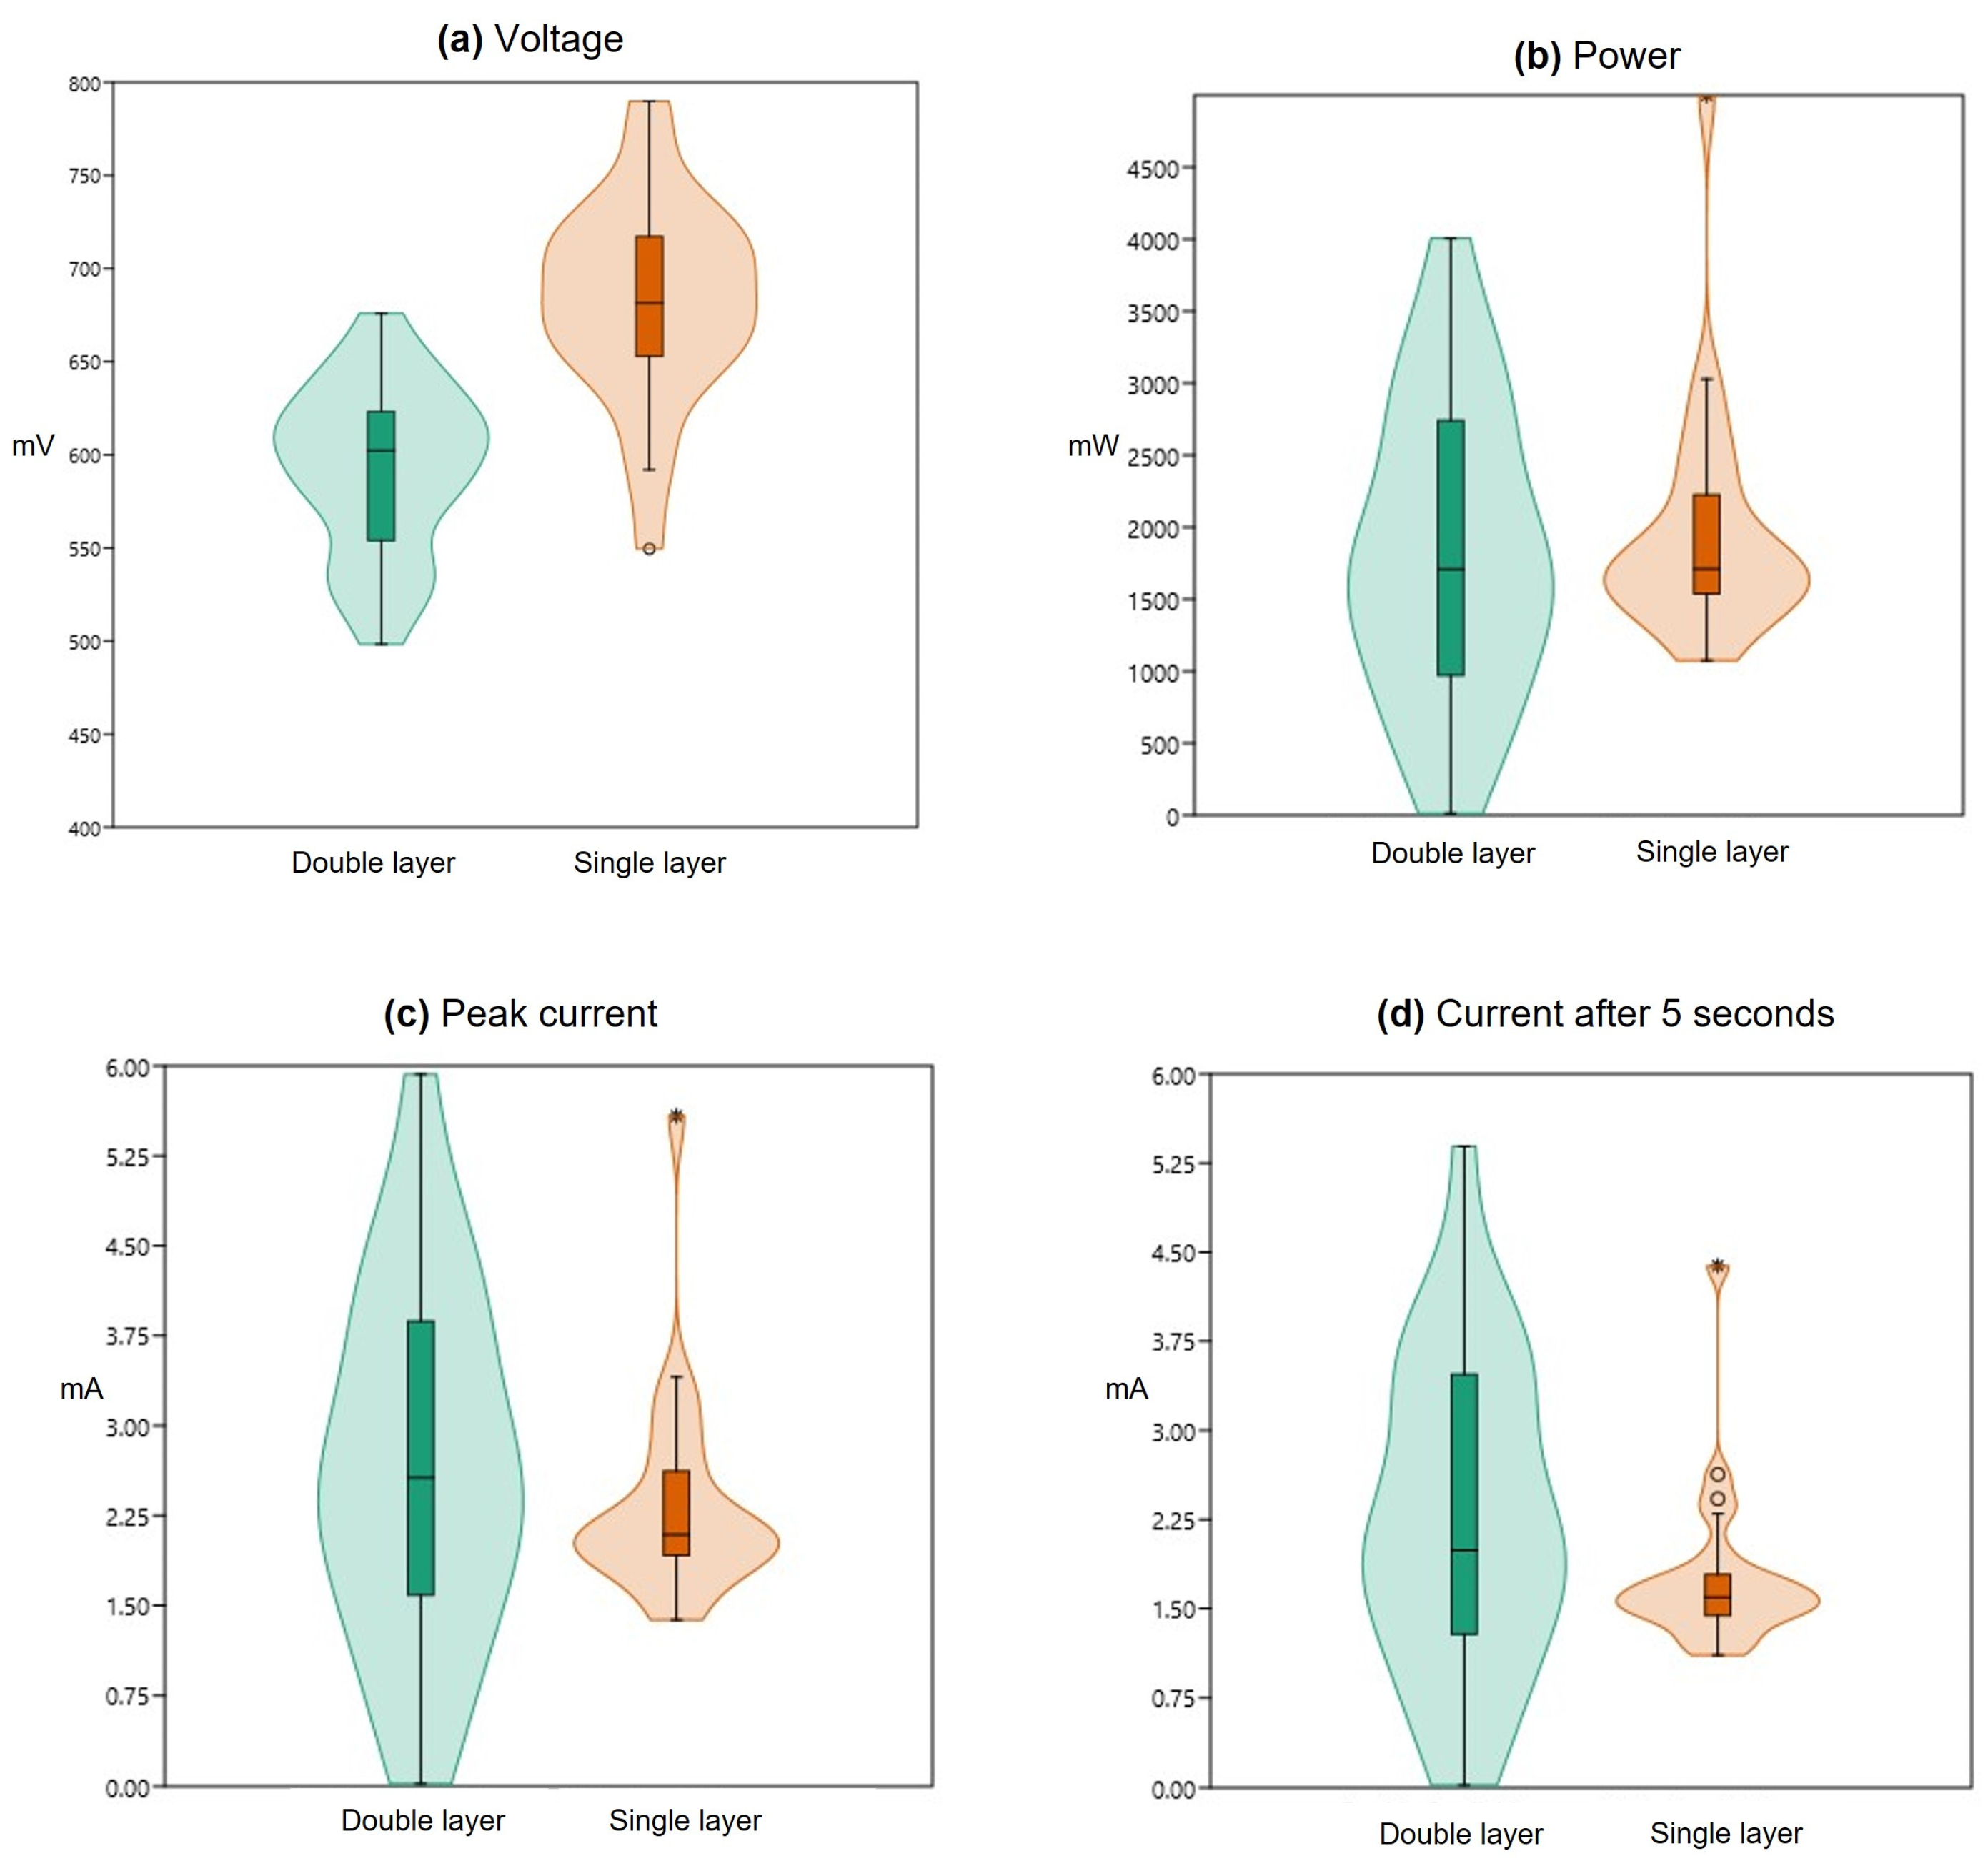
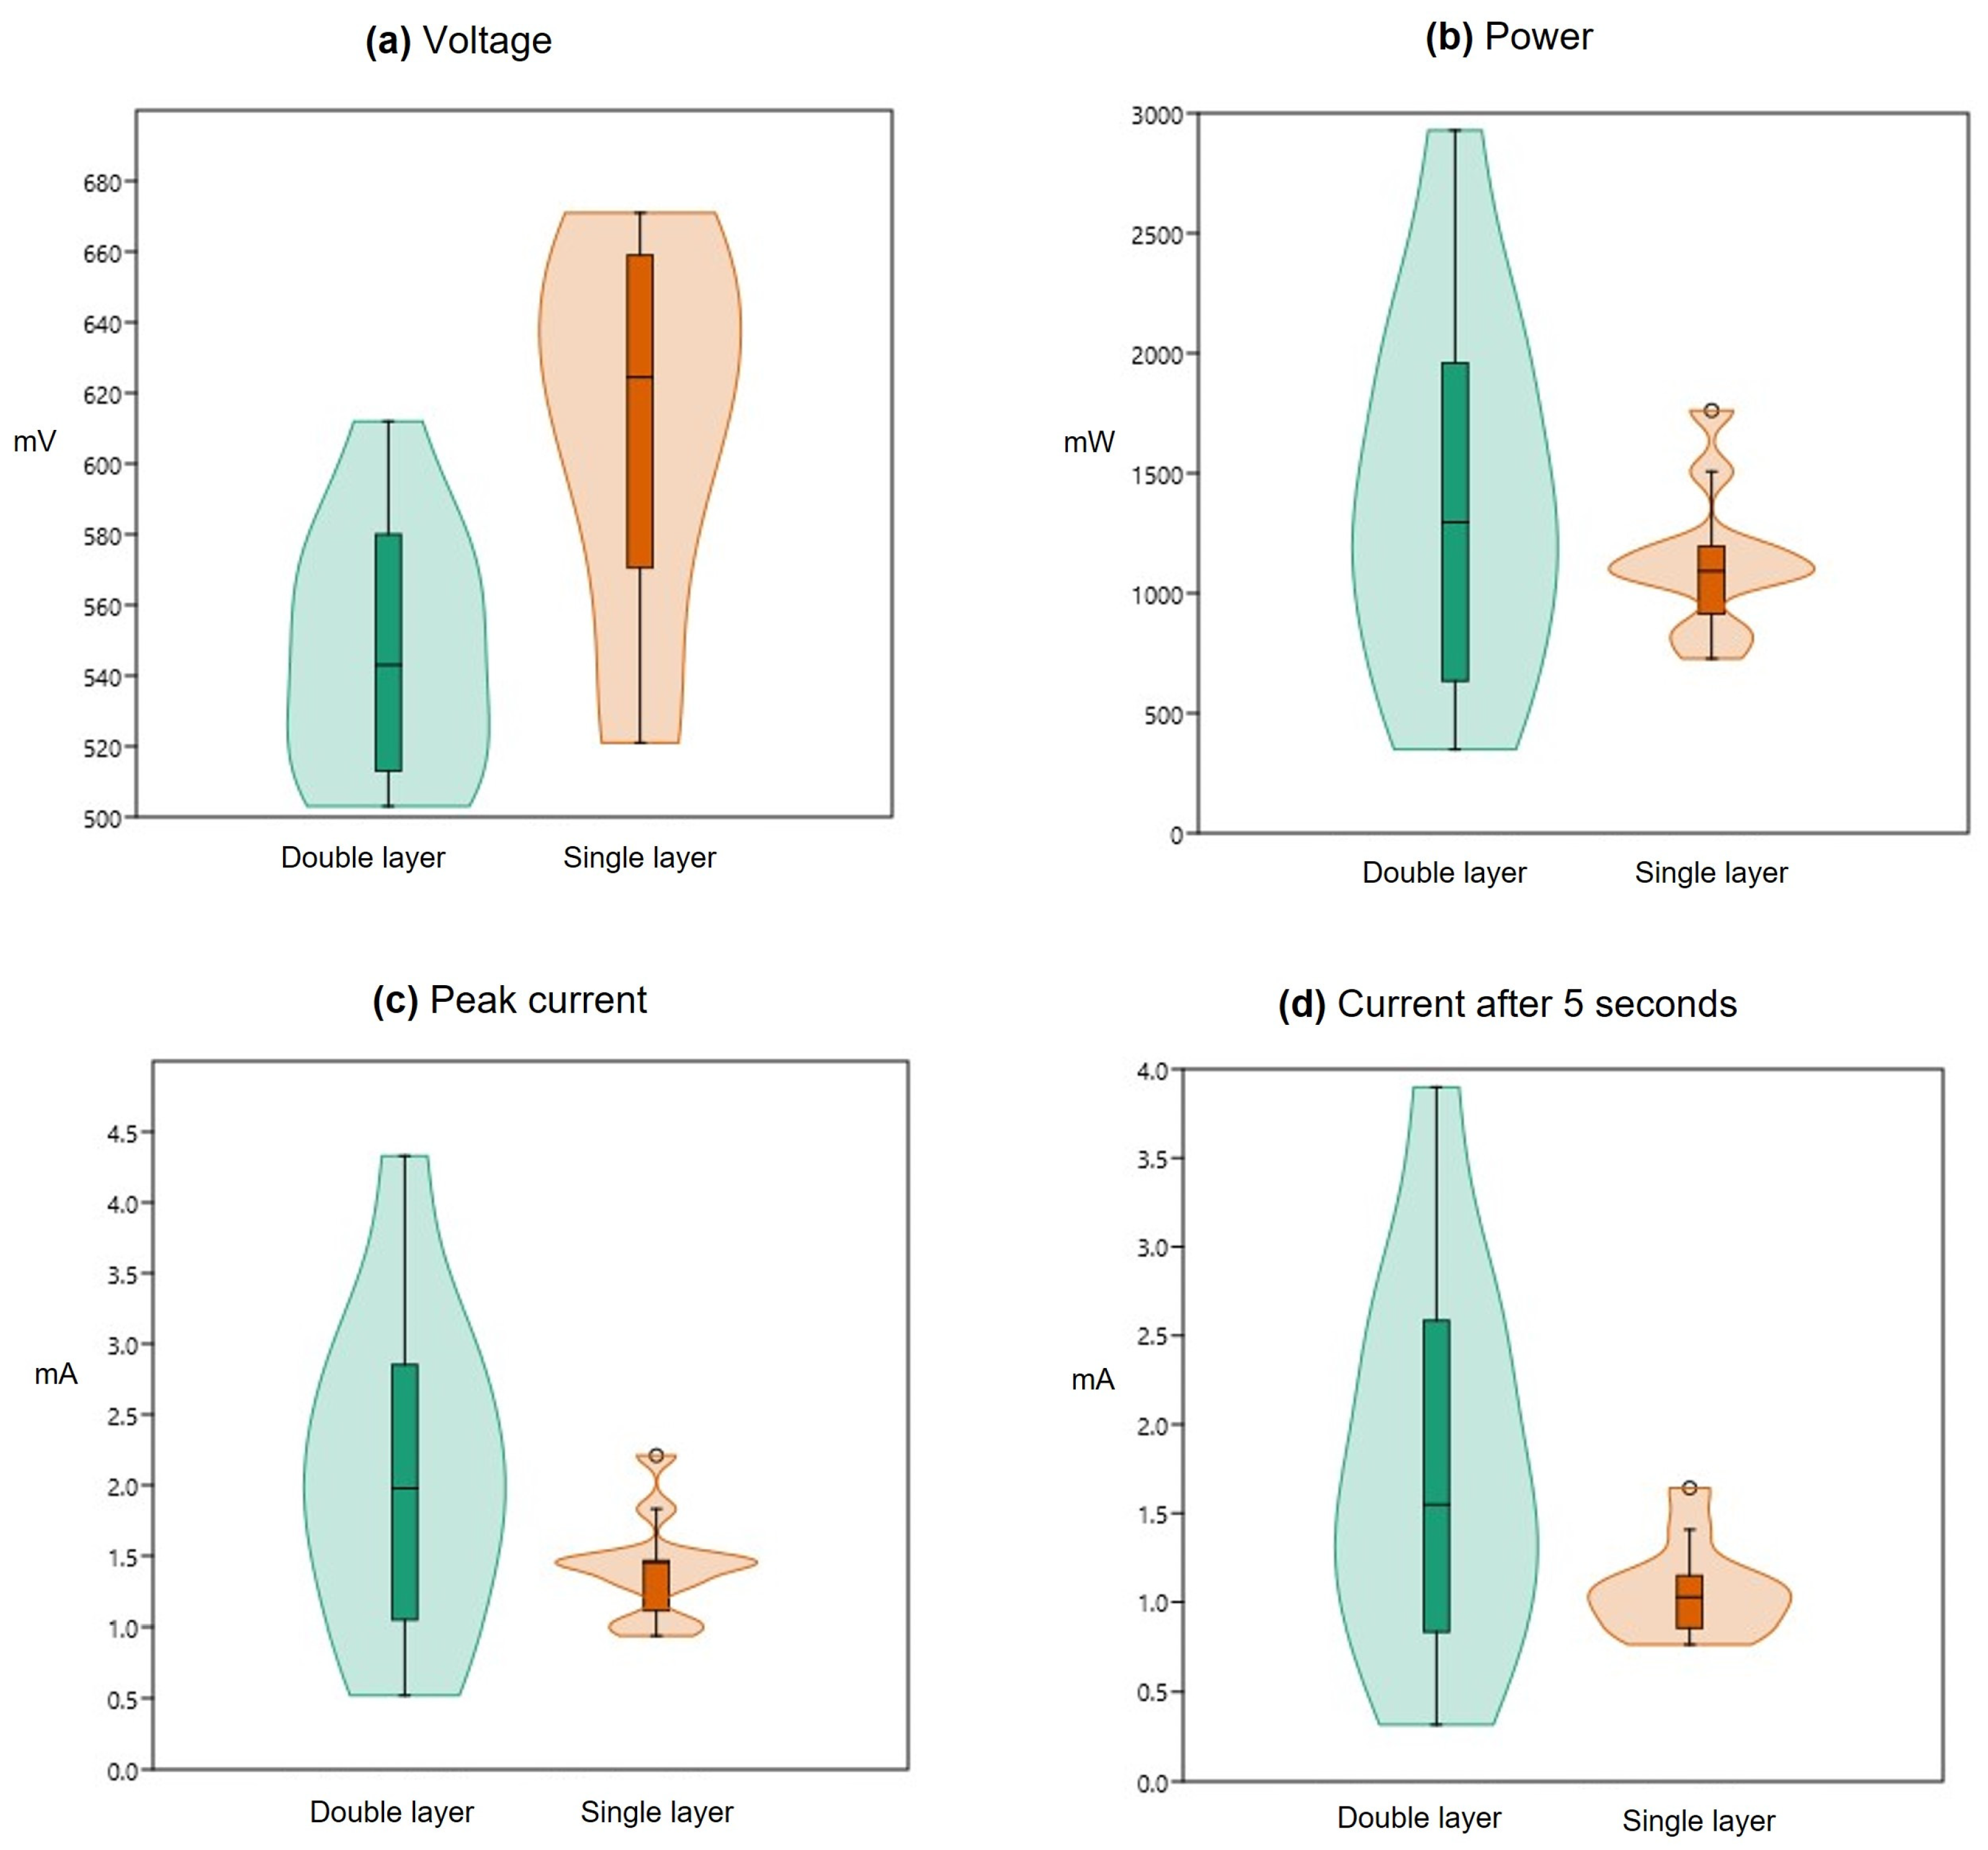
Figure 4.
Violin and box plots comparing “Single layer” and “Double layer” groups in terms of distribution of PMFCs mean values for each variable: (a) open circuit voltage, (b) power, (c) peak current, (d) current after 5 s.
Figure 4.
Violin and box plots comparing “Single layer” and “Double layer” groups in terms of distribution of PMFCs mean values for each variable: (a) open circuit voltage, (b) power, (c) peak current, (d) current after 5 s.
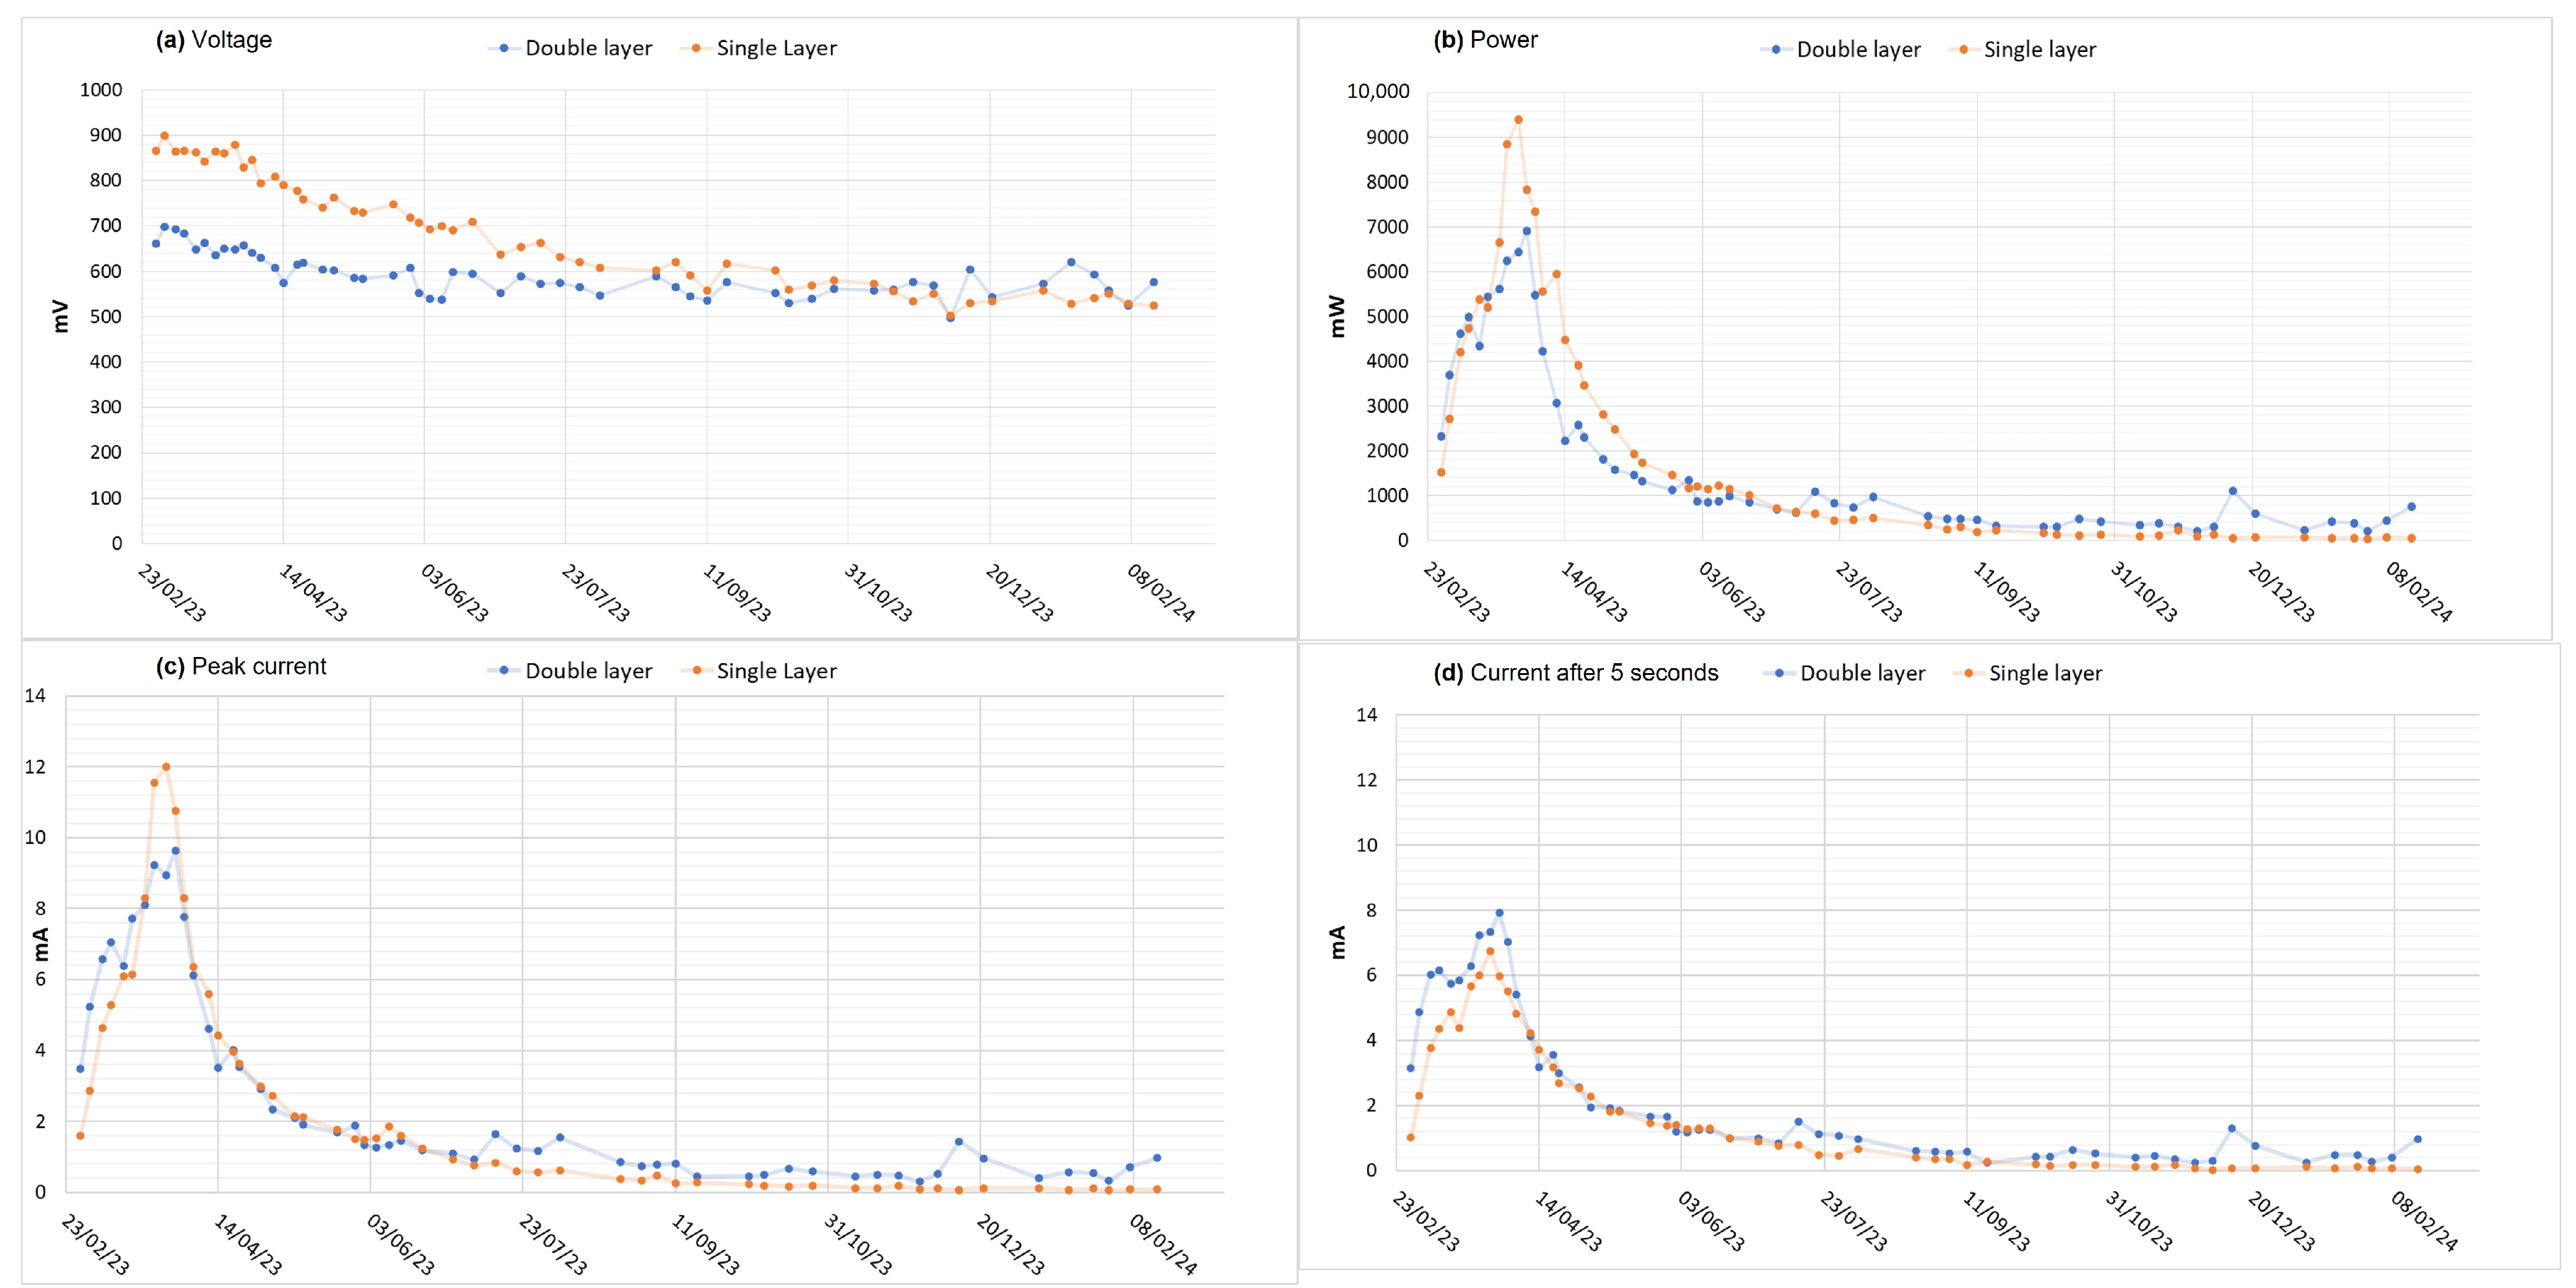
Figure 5.
Comparison of group mean between “Double layer” and “Single layer” of carbon pellets from 28 February 2023 to 16 February 2024 (24 “Double layer” PMFCs vs. 24 “Single layer” PMFCs in one year) for each variable: (a) open circuit voltage, (b) power, (c) peak current, (d) current after 5 s.
Figure 5.
Comparison of group mean between “Double layer” and “Single layer” of carbon pellets from 28 February 2023 to 16 February 2024 (24 “Double layer” PMFCs vs. 24 “Single layer” PMFCs in one year) for each variable: (a) open circuit voltage, (b) power, (c) peak current, (d) current after 5 s.
Figure 6.
Violin and box plots comparing “Single layer” and “Double layer” “Control” groups in terms of distribution of PMFCs mean values for each variable: (a) voltage, (b) power, (c) peak current, (d) current after 5 s.
Figure 6.
Violin and box plots comparing “Single layer” and “Double layer” “Control” groups in terms of distribution of PMFCs mean values for each variable: (a) voltage, (b) power, (c) peak current, (d) current after 5 s.
Figure 7.
Comparison of sample averages between “Control Double layer” and “Control Single layer” groups from 28 March 2023 to 5 September 2024 (12 “Double layer” PMFCs vs. 12 “Single layer” PMFCs in one year and a half) for each variable: (a) open circuit voltage, (b) power, (c) peak current, (d) current after 5 s.
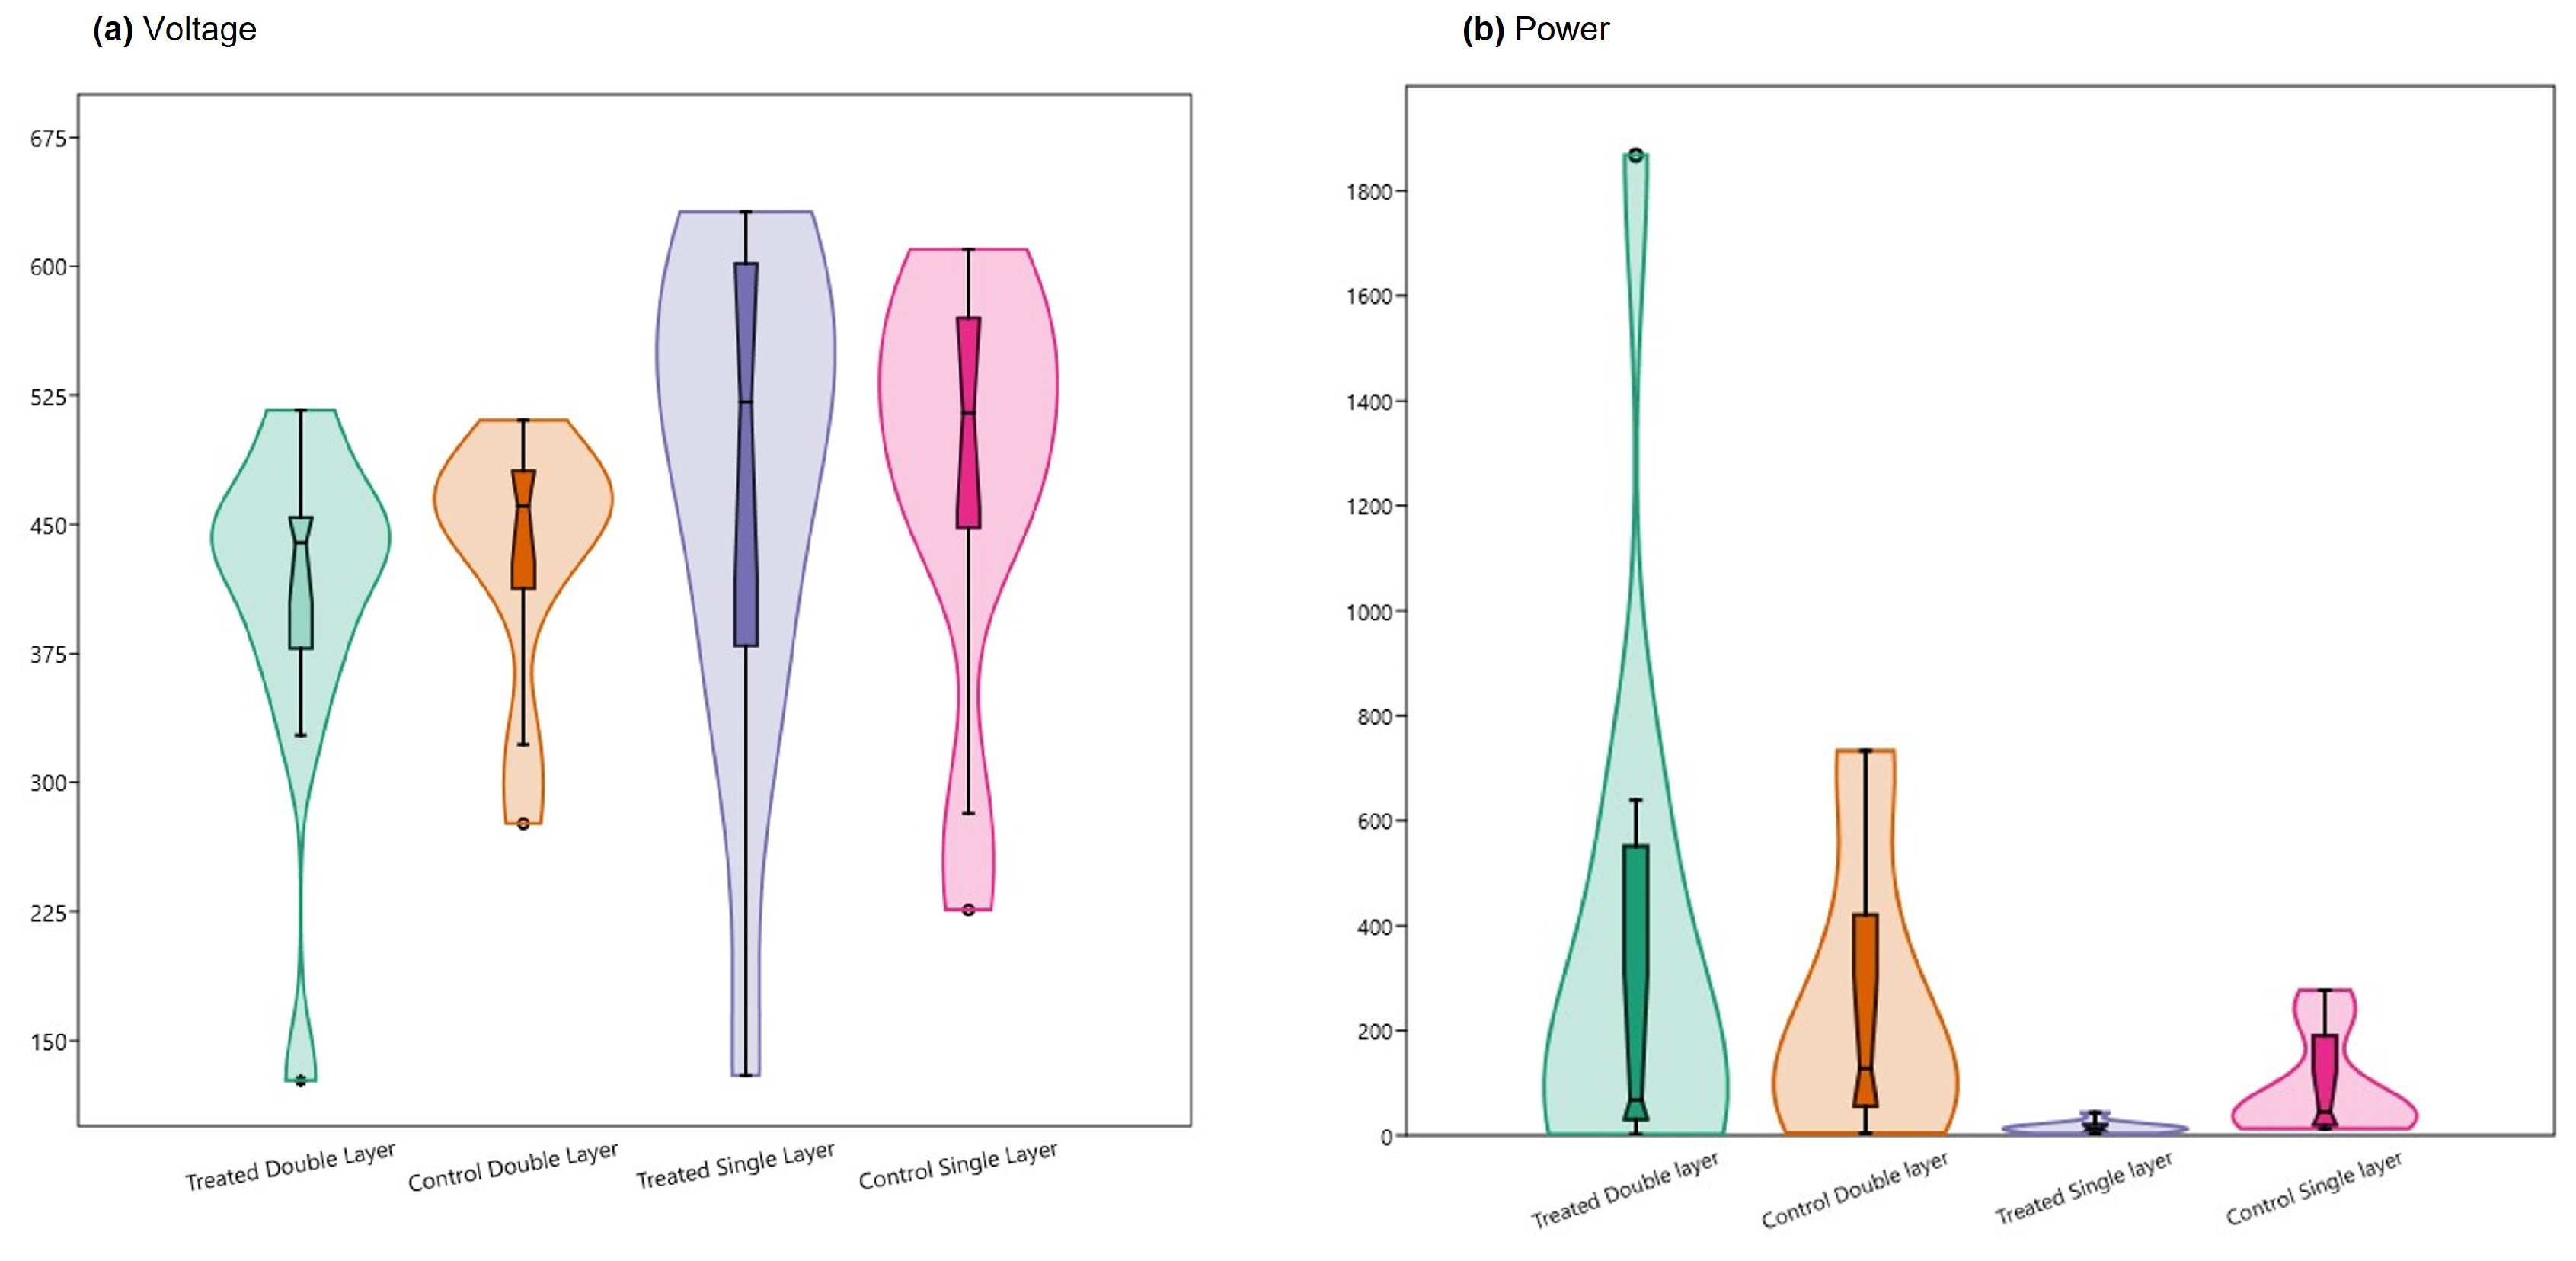
Figure 8.
Violin and box plots comparing “Treatment Double layer”, “Control Double layer”, “Treatment Single layer”, and “Control Single layer” groups of PMFCs in terms of distribution of mean values for the variable: (a) voltage, (b) power.
Figure 8.
Violin and box plots comparing “Treatment Double layer”, “Control Double layer”, “Treatment Single layer”, and “Control Single layer” groups of PMFCs in terms of distribution of mean values for the variable: (a) voltage, (b) power.
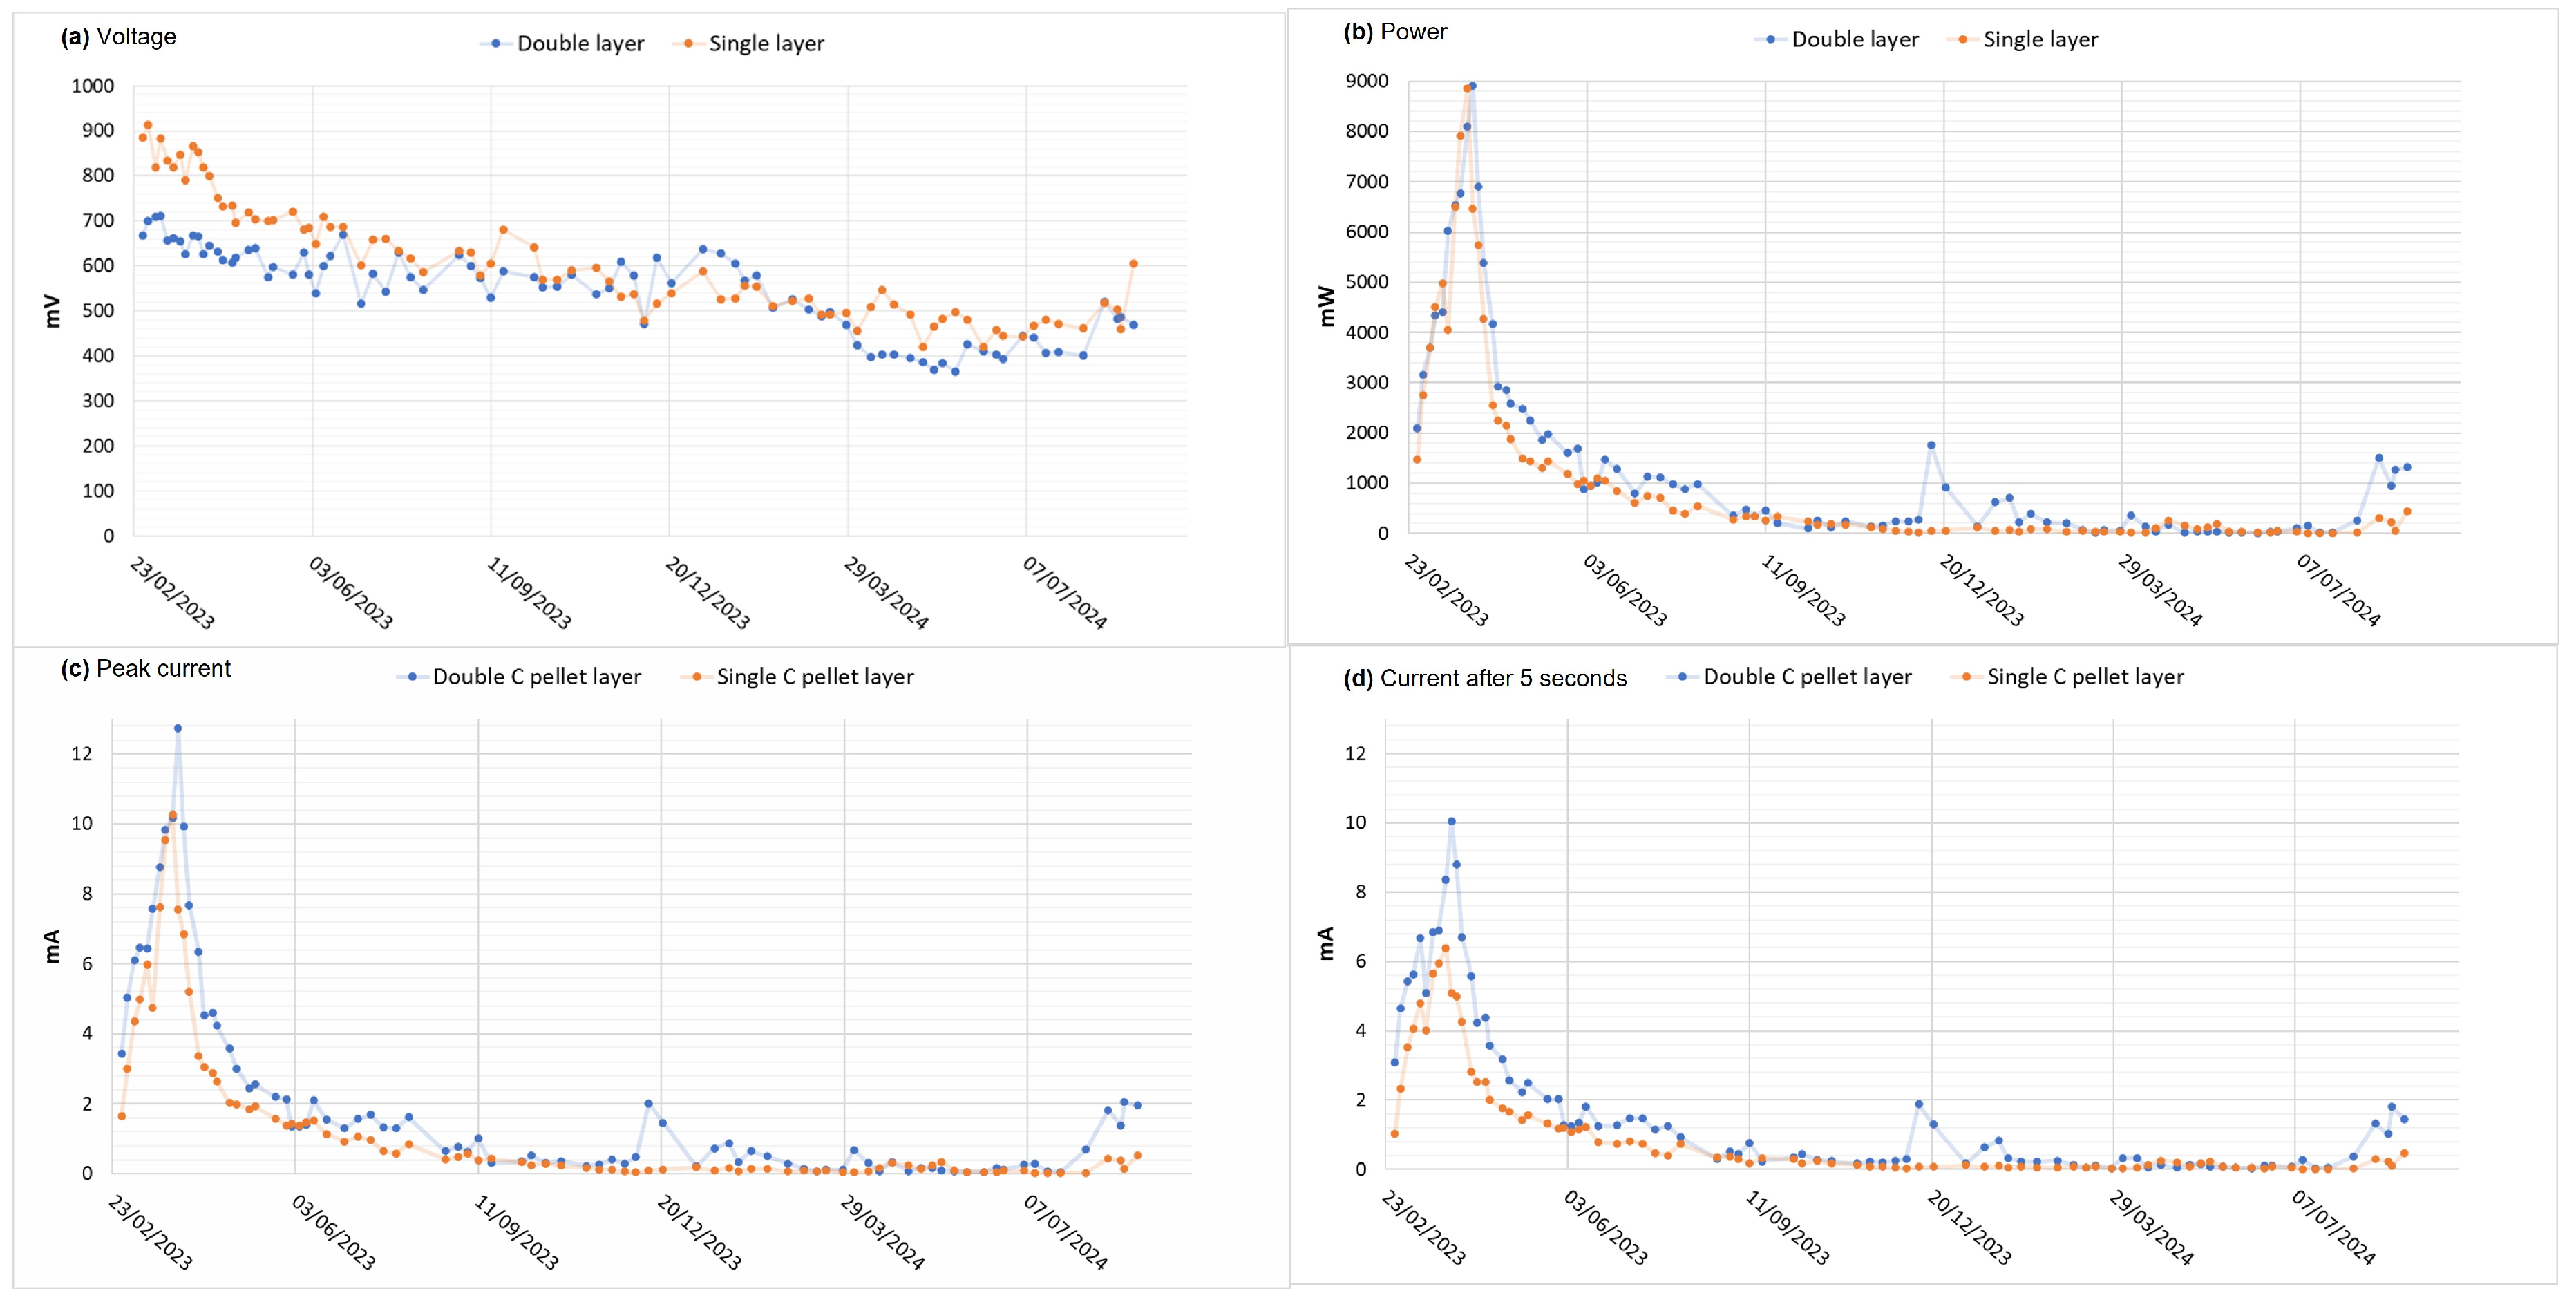
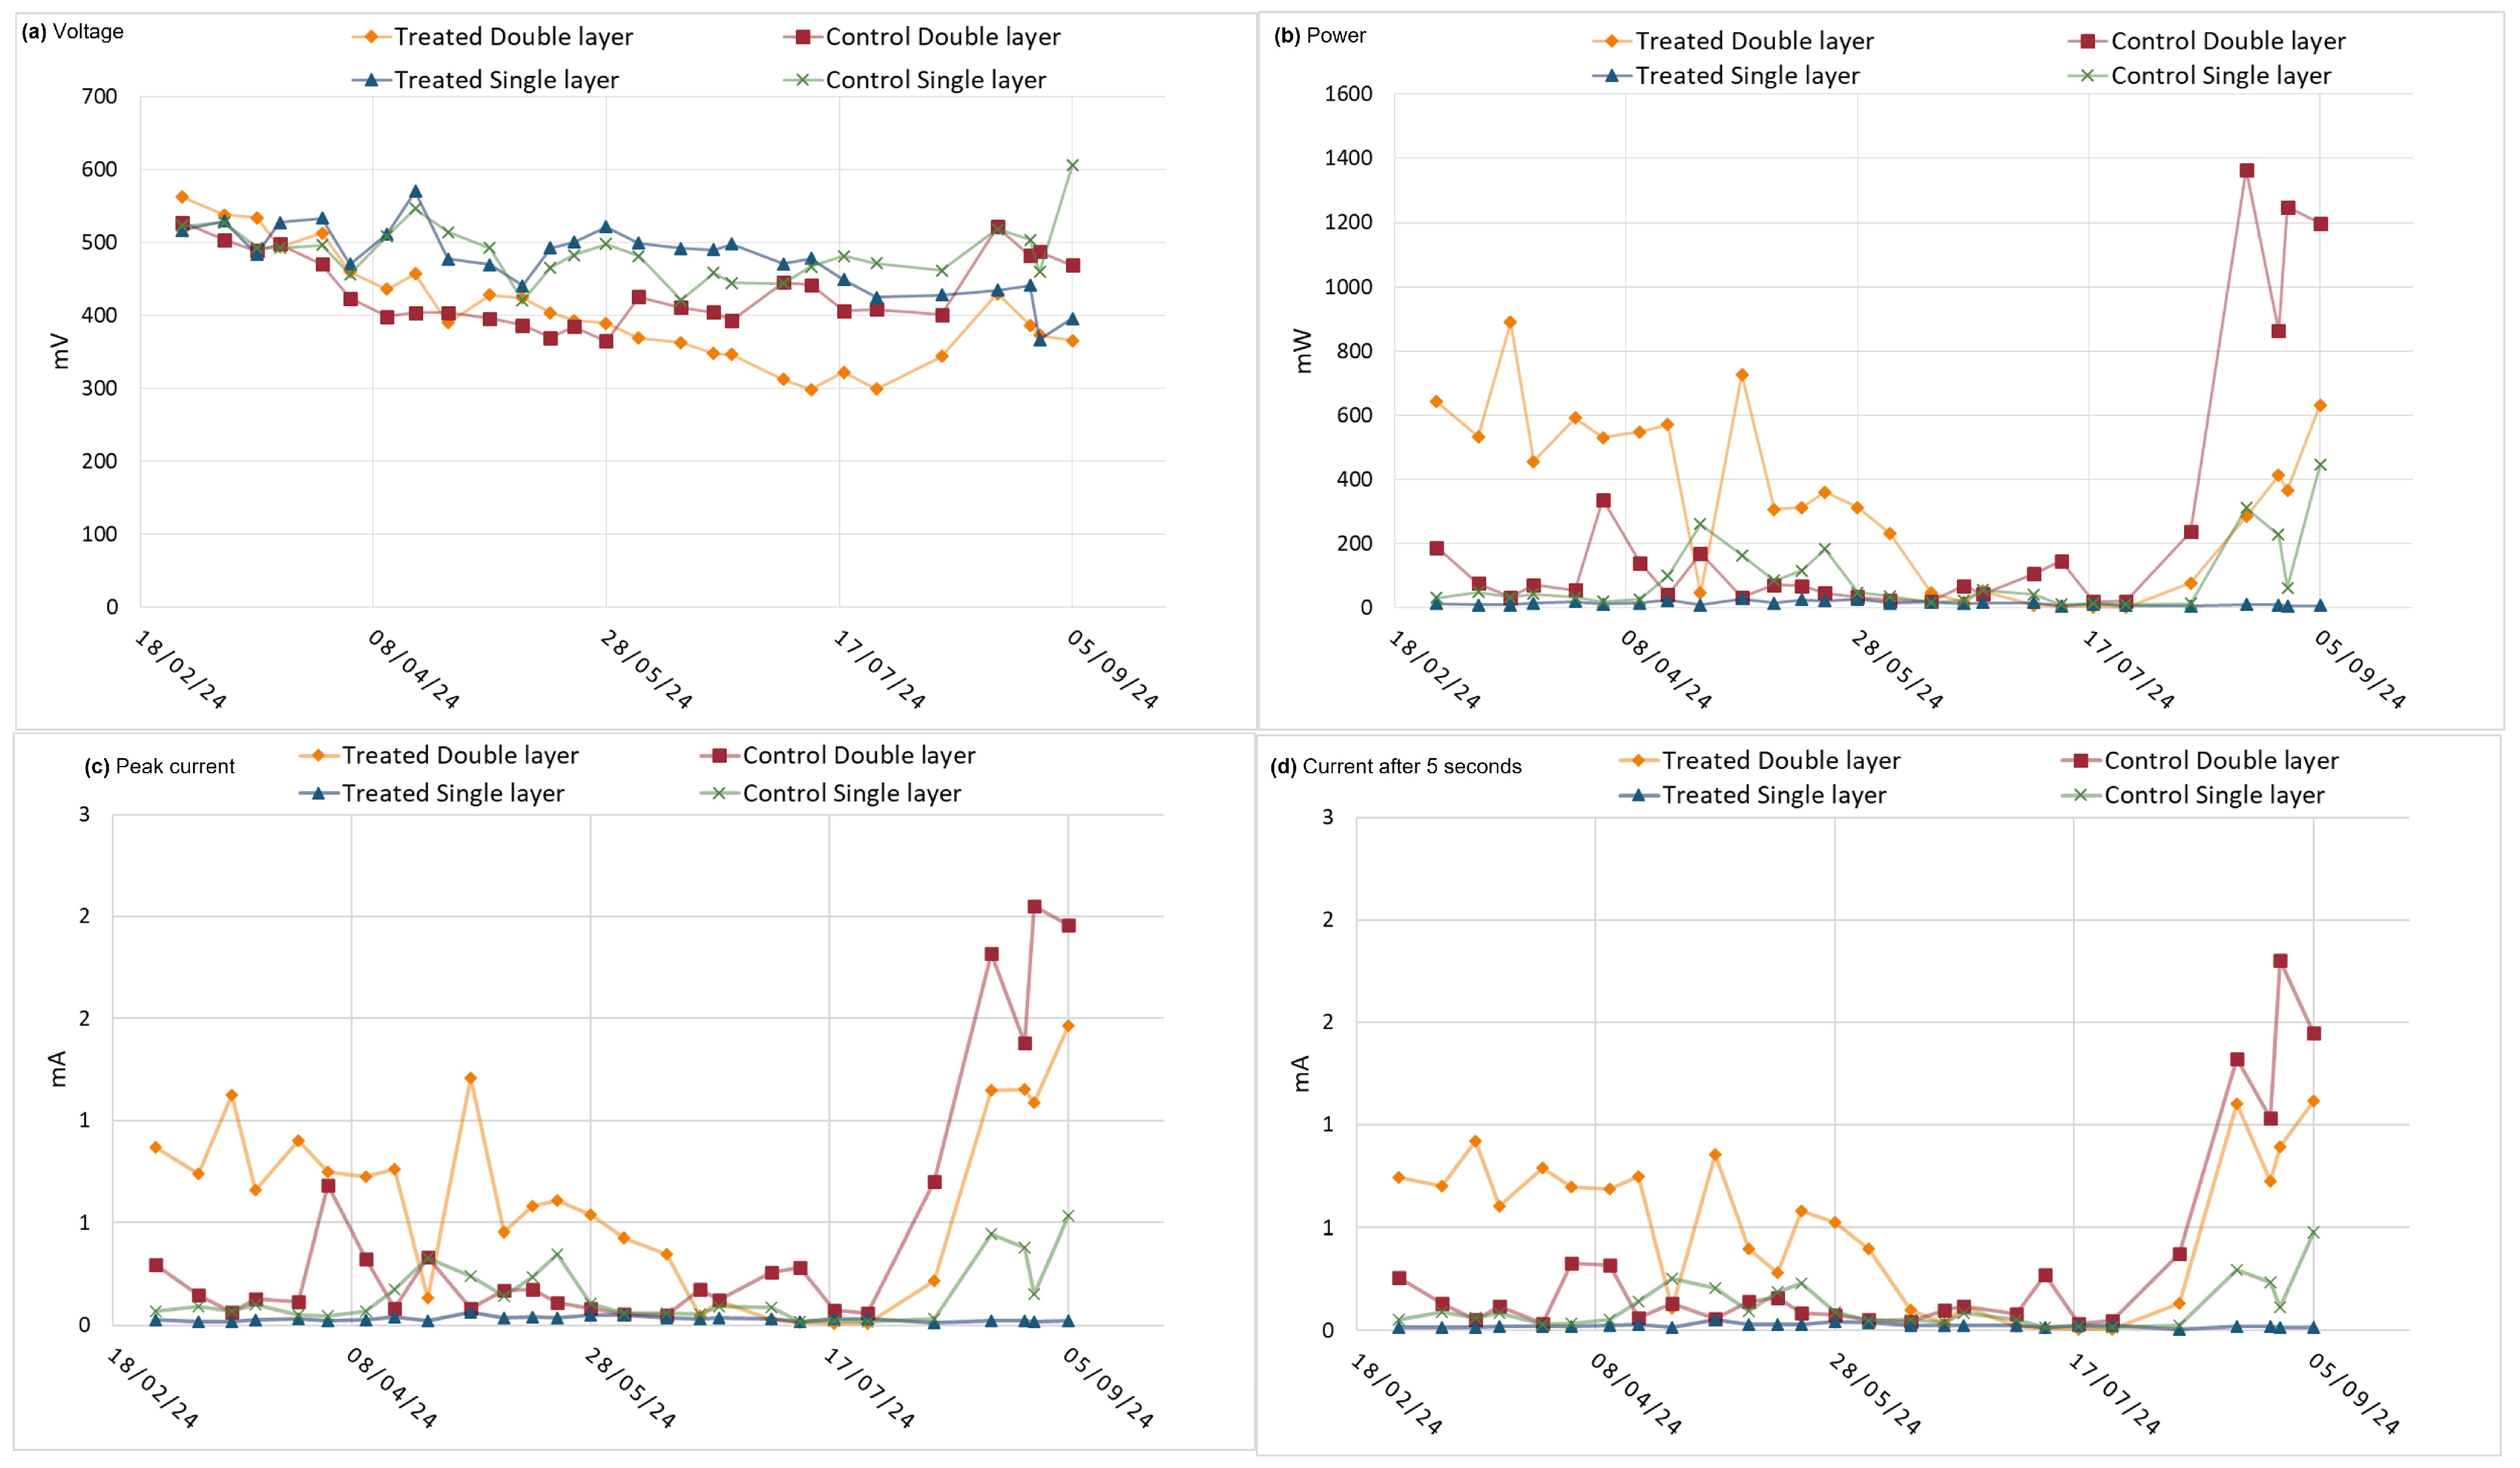
Figure 9.
Comparison of sample averages of “Treated Double layer”, “Control Double layer”, “Treated Single layer”, and “Control Single layer” groups from 27 February 2024 to 5 September 2024 for each variable: (a) voltage, (b) power, (c) peak current, (d) current after 5 s.
Figure 9.
Comparison of sample averages of “Treated Double layer”, “Control Double layer”, “Treated Single layer”, and “Control Single layer” groups from 27 February 2024 to 5 September 2024 for each variable: (a) voltage, (b) power, (c) peak current, (d) current after 5 s.
Table 1.
Main technical data of carbon pellets.
Table 1.
Main technical data of carbon pellets.
| Main Technical Data of Carbon Pellets |
|---|
| Pellet diameter | 4 mm |
| Abrasion resistance | 98% |
| Bulk density | 490 Kg/m3 |
| Ash content | 0% |
| Moisture at bagging | 2% |
| Internal surface area | 900 m2/m3 |
| Combustion temperature | 480 °C |
| Vapor pressure (mm Hg at 20 °C) | 0 |
| Solubility | not soluble |
Table 2.
Summary of the results of carbon pellet stratification from Feb 2023 to Feb 2024 [p (same mean) when normal distributions were tested, p (same median) when non-normal distributions were tested, calculated using Montecarlo permutation]. Significantly different results are highlighted.
Table 2.
Summary of the results of carbon pellet stratification from Feb 2023 to Feb 2024 [p (same mean) when normal distributions were tested, p (same median) when non-normal distributions were tested, calculated using Montecarlo permutation]. Significantly different results are highlighted.
| | 24 Double Layer vs. 24 Single Layer PMFCs |
|---|
| Open circuit voltage | p (same): 0.0001 |
| Peak current | p (same): 0.3274 |
| Current 5 s | p (same): 0.0797 |
| Power | p (same): 0.6131 |
Table 3.
Minimum, maximum, and median values of the average distributions of open circuit voltage, peak current, current after 5 s, and power in “Single layer” and “Double layer” groups.
Table 3.
Minimum, maximum, and median values of the average distributions of open circuit voltage, peak current, current after 5 s, and power in “Single layer” and “Double layer” groups.
| | Voltage (mV) | Peak Current (mA) | Current at 5 s (mA) | Power (mW) |
|---|
| | Double Layer | Single Layer | Double Layer | Single Layer | Double Layer | Single Layer | Double Layer | Single Layer |
|---|
| Max | 676 | 790 | 5.929 | 5.582 | 5.391 | 4.385 | 4006.571 | 4998.021 |
| Min | 498 | 550 | 0.020 | 1.379 | 0.019 | 1.106 | 11.110 | 1074.454 |
| Median | 602 | 682 | 2.567 | 2.090 | 1.991 | 1.594 | 1708.636 | 1709.784 |
Table 4.
Summary of the results of carbon pellet stratification of “Control” PMFCs from Feb 2023 to Sep 2024 [p (same mean) when normal distribution was tested, p (same median) when non-normal distribution was tested, calculated using Montecarlo permutation] of the conducted statistical analysis. Significantly different results are highlighted.
| | 11 Double Layer vs. 12 Single Layer “Control” PMFCs |
|---|
| Open circuit voltage | p (same): 0.0034 |
| Peak current | p (same): 0.0903 |
| Current 5 s | p (same): 0.0314 |
| Power | p (same): 0.2555 |
Table 5.
Minimum, maximum, and median values of the average distributions of open circuit voltage, peak current, current after 5 s, and power for carbon pellet stratification of “Control” PMFCs.
Table 5.
Minimum, maximum, and median values of the average distributions of open circuit voltage, peak current, current after 5 s, and power for carbon pellet stratification of “Control” PMFCs.
| | Voltage (mV) | Peak Current (mA) | Current After 5 s (mA) | Power (mW) |
|---|
| | Double Layer | SINGLE LAYER | Double Layer | Single Layer | Double Layer | Single Layer | Double Layer | Single Layer |
|---|
| Max | 612 | 671 | 4.329 | 2.210 | 3.899 | 1.642 | 2928.805 | 1761.741 |
| Min | 503 | 521 | 0.518 | 0.938 | 0.316 | 0.764 | 348.722 | 806.163 |
| Median | 543 | 624 | 1.977 | 1.453 | 1.548 | 1.026 | 1295.568 | 1092.269 |
Table 6.
Summary of the results of urea treatment p (same mean) when normal distribution was tested, p (same median) when non-normal distribution was tested, calculated using Montecarlo permutation] of the conducted statistical analysis. Significantly different results are highlighted.
Table 6.
Summary of the results of urea treatment p (same mean) when normal distribution was tested, p (same median) when non-normal distribution was tested, calculated using Montecarlo permutation] of the conducted statistical analysis. Significantly different results are highlighted.
| | Multiple Samples Tested: 11 “Control Double Layer”, 12 “Control Single Layer”, 12 “Treated Double Layer”, 12 “Treated Single Layer” |
|---|
| Open circuit voltage | p (same): 0.0503 |
| Peak current | p (same): 0.0008 |
| Current 5 s | p (same): 0.0014 |
| Power | p (same): 0.0009 |
Table 7.
Minimum, maximum, and median values of the average distributions of open circuit voltage, peak current, current after 5 s, and power for “Treated” and “Control” groups.
Table 7.
Minimum, maximum, and median values of the average distributions of open circuit voltage, peak current, current after 5 s, and power for “Treated” and “Control” groups.
| | | Maximum | Minimum | Median |
|---|
| Voltage (mV) | Treated Double layer | 516 | 127 | 439 |
| Control Double layer | 510 | 276 | 461 |
| Treated Single layer | 632 | 130 | 521 |
| Control Single layer | 610 | 226 | 515 |
| Peak current (mA) | Treated Double layer | 2.386 | 0.003 | 0.183 |
| Control Double layer | 1.068 | 0.010 | 0.313 |
| Treated Single layer | 0.077 | 0.006 | 0.028 |
| Control Single layer | 0.406 | 0.025 | 0.103 |
| Current after 5 s (mA) | Treated Double layer | 2.224 | 0.002 | 0.154 |
| Control Double layer | 0.983 | 0.008 | 0.233 |
| Treated Single layer | 0.059 | 0.003 | 0.021 |
| Control Single layer | 0.309 | 0.018 | 0.079 |
| Power (mW) | Treated Double layer | 1867.956 | 1.320 | 67.961 |
| Control Double layer | 733.357 | 3.947 | 128.440 |
| Treated Single layer | 42.868 | 2.694 | 12.857 |
| Control Single layer | 277.253 | 12.500 | 44.909 |
