1. Introduction
Colombia, like many countries in Latin America and the Global South, faces multiple crises and political challenges, including social, ecological, economic, public finance, security, and internal public order issues. Climate change, along with its impacts and the need for adaptation and mitigation, adds to these problems. All these crises—common to many countries of the Global South—converge in what may be the greatest global challenge in human history: the energy transition as a response to the climate crisis resulting from the historical project of modernity/coloniality [
1].
As a signatory to the 2015 Paris Agreement and subsequent Conferences of the Parties (COP), Colombia committed to reducing its Greenhouse Gas (GHG) emissions by 20% by 2030. However, this is not the only reason to pursue an energy transition. Beyond complying with international climate agreements, reducing significant emissions, or mitigating adverse effects despite the environmental and social impacts of fossil fuel extraction, the energy transition is also linked to the fact that Colombia risks becoming a fossil fuel importer in the near future. This would lead to a loss of export revenues and reduced industrial competitiveness if the country does not decarbonize [
2].
As part of its energy transition efforts, Colombia has been promoting natural gas production and its use in electricity generation as a cleaner energy source. Currently, energy consumption relies on oil, coal, and, increasingly, on natural gas [
3].
At the end of 2024, the Agencia Nacional de Hidrocarburos (ANH) of Colombia reported that the Reserves-to-Production (R/P) ratio for natural gas is 5.9 years. This indicates that, if no new reserves are explored, hydrocarbon reserves could be depleted by 2030.
Because energy systems are characterized by complex interactions among sources, technologies, infrastructure, and socio-environmental impacts, simulation models provide a powerful means to understand their behavior and dynamics. These models allow researchers and stakeholders to explore different scenarios, assess potential outcomes, and make informed decisions [
4]. This research project specifically employs System Dynamics (SD), a methodology considered suitable and useful for evaluating long-term impacts on energy systems and particularly relevant for analysing energy transitions [
5]. Evaluations of five applied models to energy transitions conclude that SD successfully captures the necessary characteristics to deliver realistic results [
6].
Several studies have applied System Dynamics to the analysis of natural gas systems in Colombia. For instance, Becerra-Fernández et al. modeled the natural gas supply chain to support sustainable growth policies [
7]. In a related work, the same authors examined reserves, production, and transportation under different levels of government policy implementation [
8]. Insuasty-Reina et al. developed a model to evaluate CO
2 emissions when hydrogen derived from coal is incorporated into the energy matrix [
9]. Finally, Caicedo-Avellaneda et al. assessed Colombia’s long-term hydrocarbon planning scenarios using the TIMES-O&G model [
10]. Together, these studies underscore the relevance of simulation models for evaluating energy transitions. However, none explicitly integrates natural gas supply and demand within a single, unified framework. This gap motivates the present study.
In this context, the present study aims to evaluate the long-term dynamics of Colombia’s natural gas supply chain, taking into account social and economic effects within an energy transition policy framework. Scenarios are analysed that involve the introduction of clean energies as replacements for natural gas, along with the addition of new gas wells.
The study concludes that although the use of alternative sources to natural gas in various consumption sectors extends the period during which 100% of projected demand can be met, it does not solve the issue of natural gas reserve availability. This suggests that the best outcome for the country would be the incorporation of a new well, which is expected to begin production in 2027 [
11].
2. Methodology
The framework for this research is based on a tool from Industrial Engineering known as System Dynamics Modelling, which includes the Causal Loop Diagram, the Forrester Diagram, and Simulation.
Causal Loop Diagram. This diagram is used to conceptualize the system by creating a schematic outline of the elements that are interrelated. The variables are connected by arrows representing positive or negative relationships. A positive relationship means that the two connected variables change in the same direction—if one increases, the other also increases. A negative relationship indicates the opposite: if one variable increases, the other decreases. When a variable is linked to itself through a chain of variables, a feedback loop is formed, indicating that the variable is both a cause and an effect. System feedback can be reinforcing, where an increase in a variable amplifies further growth, or balancing, where an increase eventually induces a counteracting decrease.
Forrester Diagram. After building the Influence Diagram, it is transformed into a Forrester Diagram to obtain a mathematical or quantitative representation that can be programmed on a computer. This step involves translating the variables from the Influence Diagram into one of three main types used in Forrester Diagrams: level variables, flow variables, and auxiliary variables.
Level variables represent the state of the system and accumulate the results of past actions. Flow variables express changes in level variables over time, while auxiliary variables provide a clearer view of factors influencing the flows. Computer processing is required for this step, known as system simulation, and relies on appropriate software tools. In system dynamics, commonly used tools include Professional DYNAMO, STELLA, i-think, PowerSim, Mosaikk-SimTek, and VenSim.
The third step in developing a system dynamics model is its validation. This process checks both the logical consistency of the hypotheses and variables and the fit between the model’s generated trajectories and real-world data.
Once the model is validated, the base scenario is simulated to predict how the studied problem will behave in the real system. Subsequently, alternative policies are analyzed by proposing different scenarios—whether to represent possible future situations, compare management strategies, or study the effects of implementing changes within the system.
3. Natural Gas Demand Model in Colombia
Natural gas plays a crucial role in Colombia, reaching over 11 million users, including industries, businesses, and households [
12]. Natural gas consumption in Colombia is categorised into six sectors: Industrial, Thermoelectric, Residential, Oil, Vehicular, and Petrochemical.
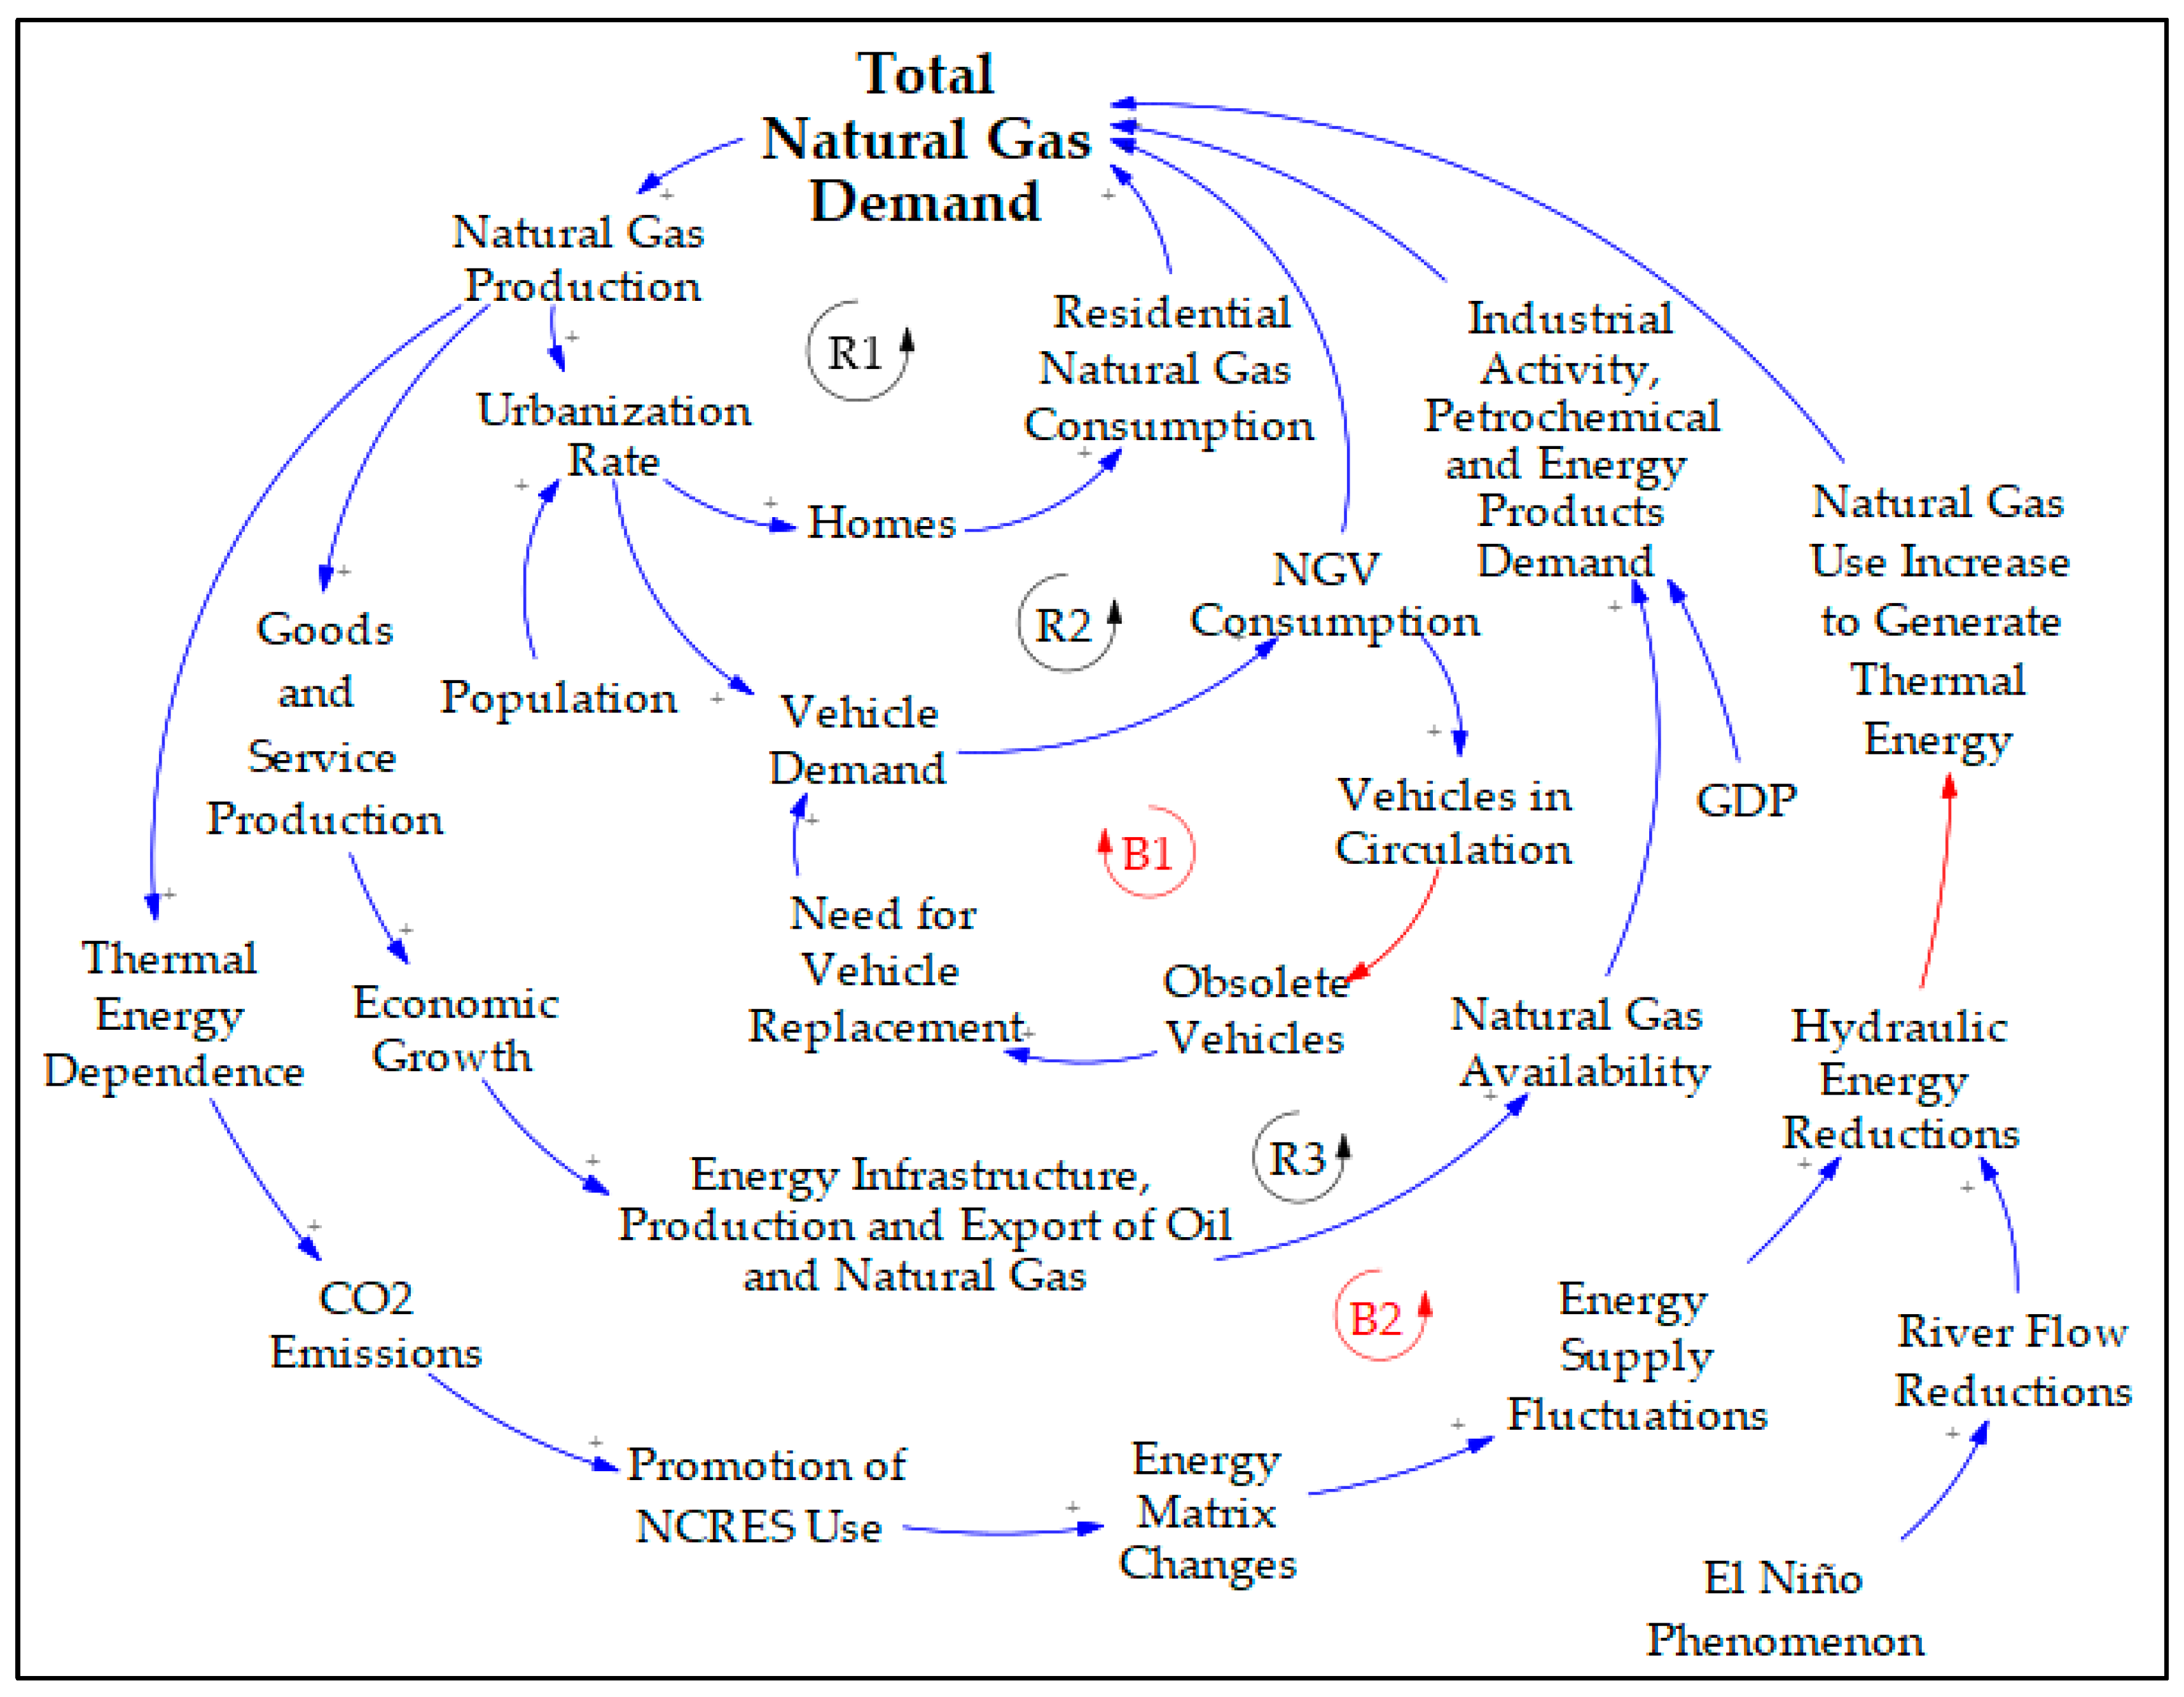
A total of 26 variables were defined as determinants in the dynamics of Natural Gas demand in Colombia. The variables are shown in
Table 1, and the causal loop diagram is shown in
Figure 1.
The causal loop diagram for the demand consists of three reinforcing loops and two balancing loops. These are explained in detail in the text that follows
Figure 1.
In the causal loop diagram, the symbols “+” and “–” denote the nature of the causal relationships among variables. A “+” symbol represents a positive or direct relationship, whereas a “–” symbol indicates a negative or inverse relationship. Negative relationships and balancing feedback loops are highlighted in red to facilitate their identification and interpretation.
Reinforcing Loops
Residential Sector (R1): The larger the population, the higher the urbanisation rate (percentage of people living exclusively in municipal capitals), and thus the greater the number of households, leading to increased natural gas consumption in the Residential Sector. This generates a rising Natural Gas Demand, which in turn requires increased Natural Gas Production. This may encourage more people to migrate to cities due to the availability of this resource, further boosting the urbanisation rate.
Vehicular Sector (R2): As the population increases, the urbanisation rate rises, which leads to greater Vehicle Demand. The higher the vehicle demand, the greater the number of vehicles powered by natural gas. This increases Natural Gas Demand, necessitating higher production.
Oil, Industrial, and Petrochemical Sectors (R3): GDP growth leads to increased industrial activity, demand for petrochemical products, and energy products, raising Natural Gas Demand. This requires greater Natural Gas Production. With more natural gas available as fuel, the production of goods and services increases, driving economic growth. In turn, this enables the expansion of energy infrastructure and the production and export of oil and gas, further increasing natural gas availability, which reinforces industrial and petrochemical growth tied to GDP increases.
For this study, consumption in the industrial and petrochemical sectors is based on projected growth rates from [
13]. The oil sector consumption is based on forecasts provided by Ecopetrol, related to natural gas use in the production of crude oil, natural gas, and refined products in Colombia.
Balancing Loops
Vehicular Sector (B1): Higher vehicle demand increases Vehicular Natural Gas Consumption due to more vehicles in circulation. More vehicles on the road eventually become obsolete, increasing the need for replacements, which once again raises vehicle demand. This model is based on [
14].
Thermoelectric Sector (B2): During El Niño events, river flows decrease, resulting in less water available for hydropower generation. As hydropower capacity diminishes, Thermoelectric generation using natural gas is required to meet internal electricity demand. This leads to increased Natural Gas Demand and higher production. Greater natural gas availability increases dependence on thermal energy, leading to higher CO2 emissions. This promotes the use of Non-Conventional Renewable Energy Sources (NCRES) like wind and solar. These changes in the energy mix and the El Niño phenomenon together cause fluctuations in energy supply, which, in turn, affect hydropower generation.
3.1. Use of Natural Gas as Backup in the Thermoelectric Sector
Natural gas is crucial in the energy transition process, as it helps meet growing demand while reducing greenhouse gas emissions and improving air quality. It is an effective backup for renewable energy sources, particularly hydroelectricity, by ensuring a stable power supply during periods of insufficient rainfall—especifically during the so-called El Niño phenomenon (characterised by droughts that reduce river flows and threaten hydroelectric production in the country [
15]).
To model natural gas consumption in the thermoelectric sector, it is important to consider water flow projections for the hydroelectric sector, as fluctuations in this sector directly affect thermal and NCRES power generation.
Flow projections were taken from [
13]. Historical data analysis revealed that river flow behaviour closely resembles that of hydroelectric power generation. Therefore, hydroelectric generation from 2023 onward (marked by a dotted line) was projected based on flow variations, as shown in
Figure 2:
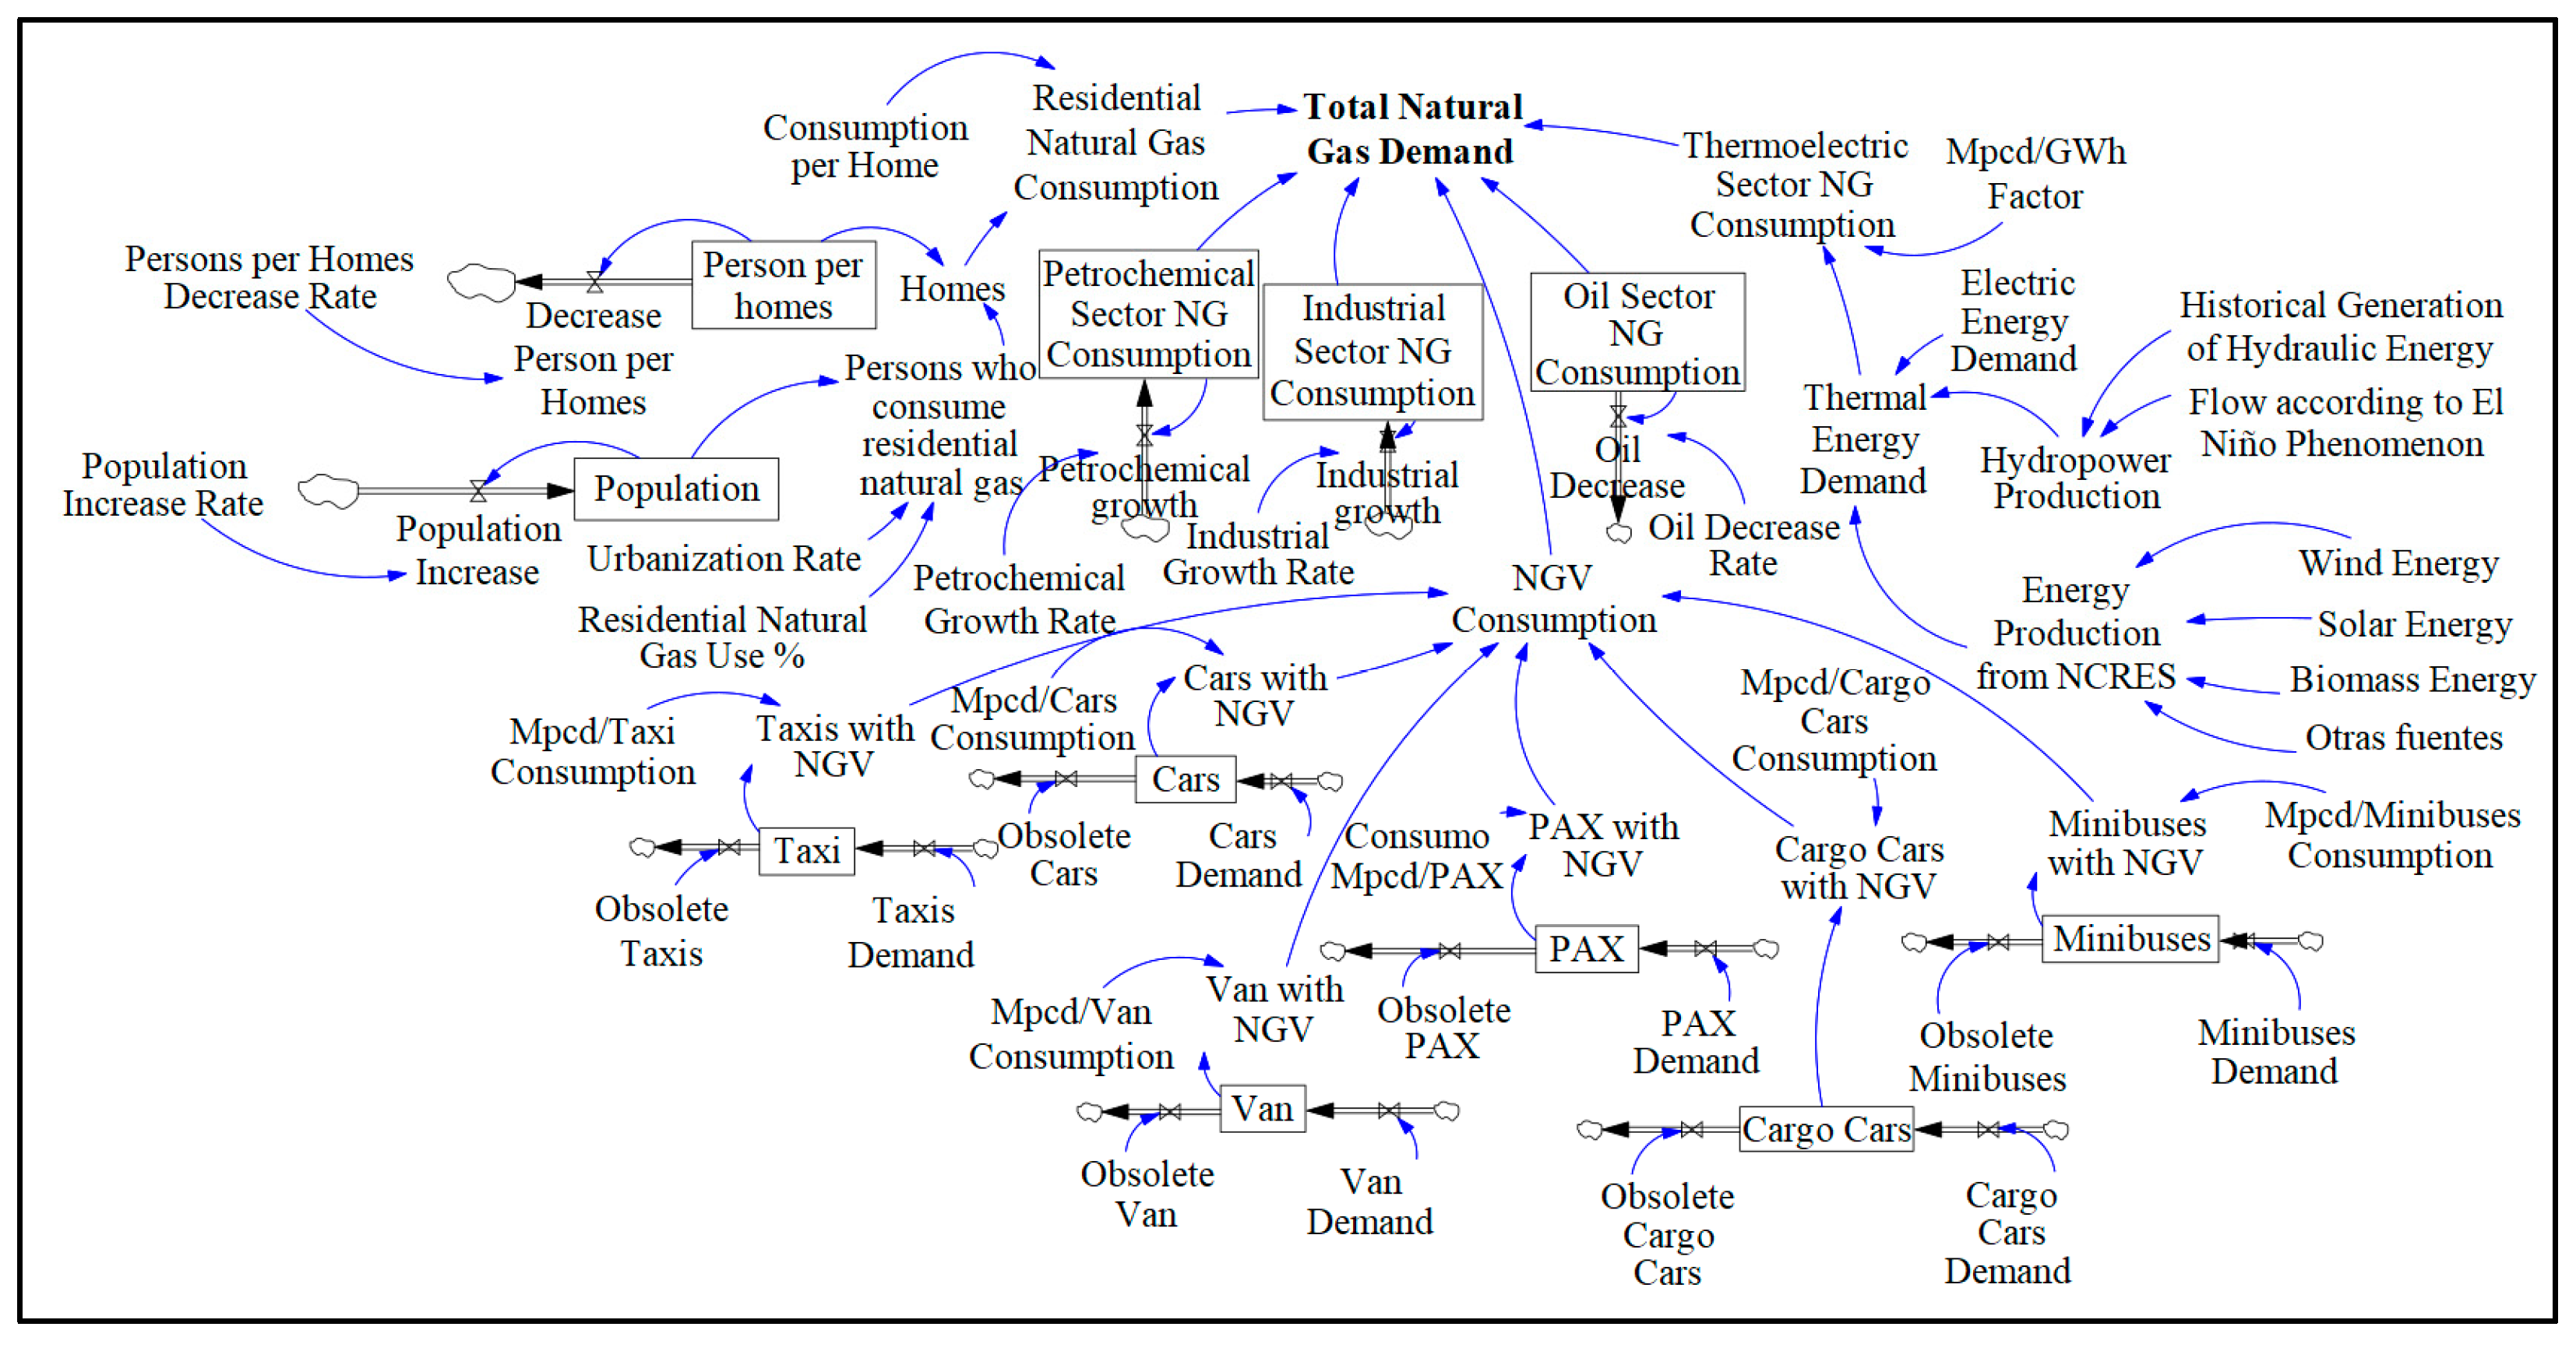
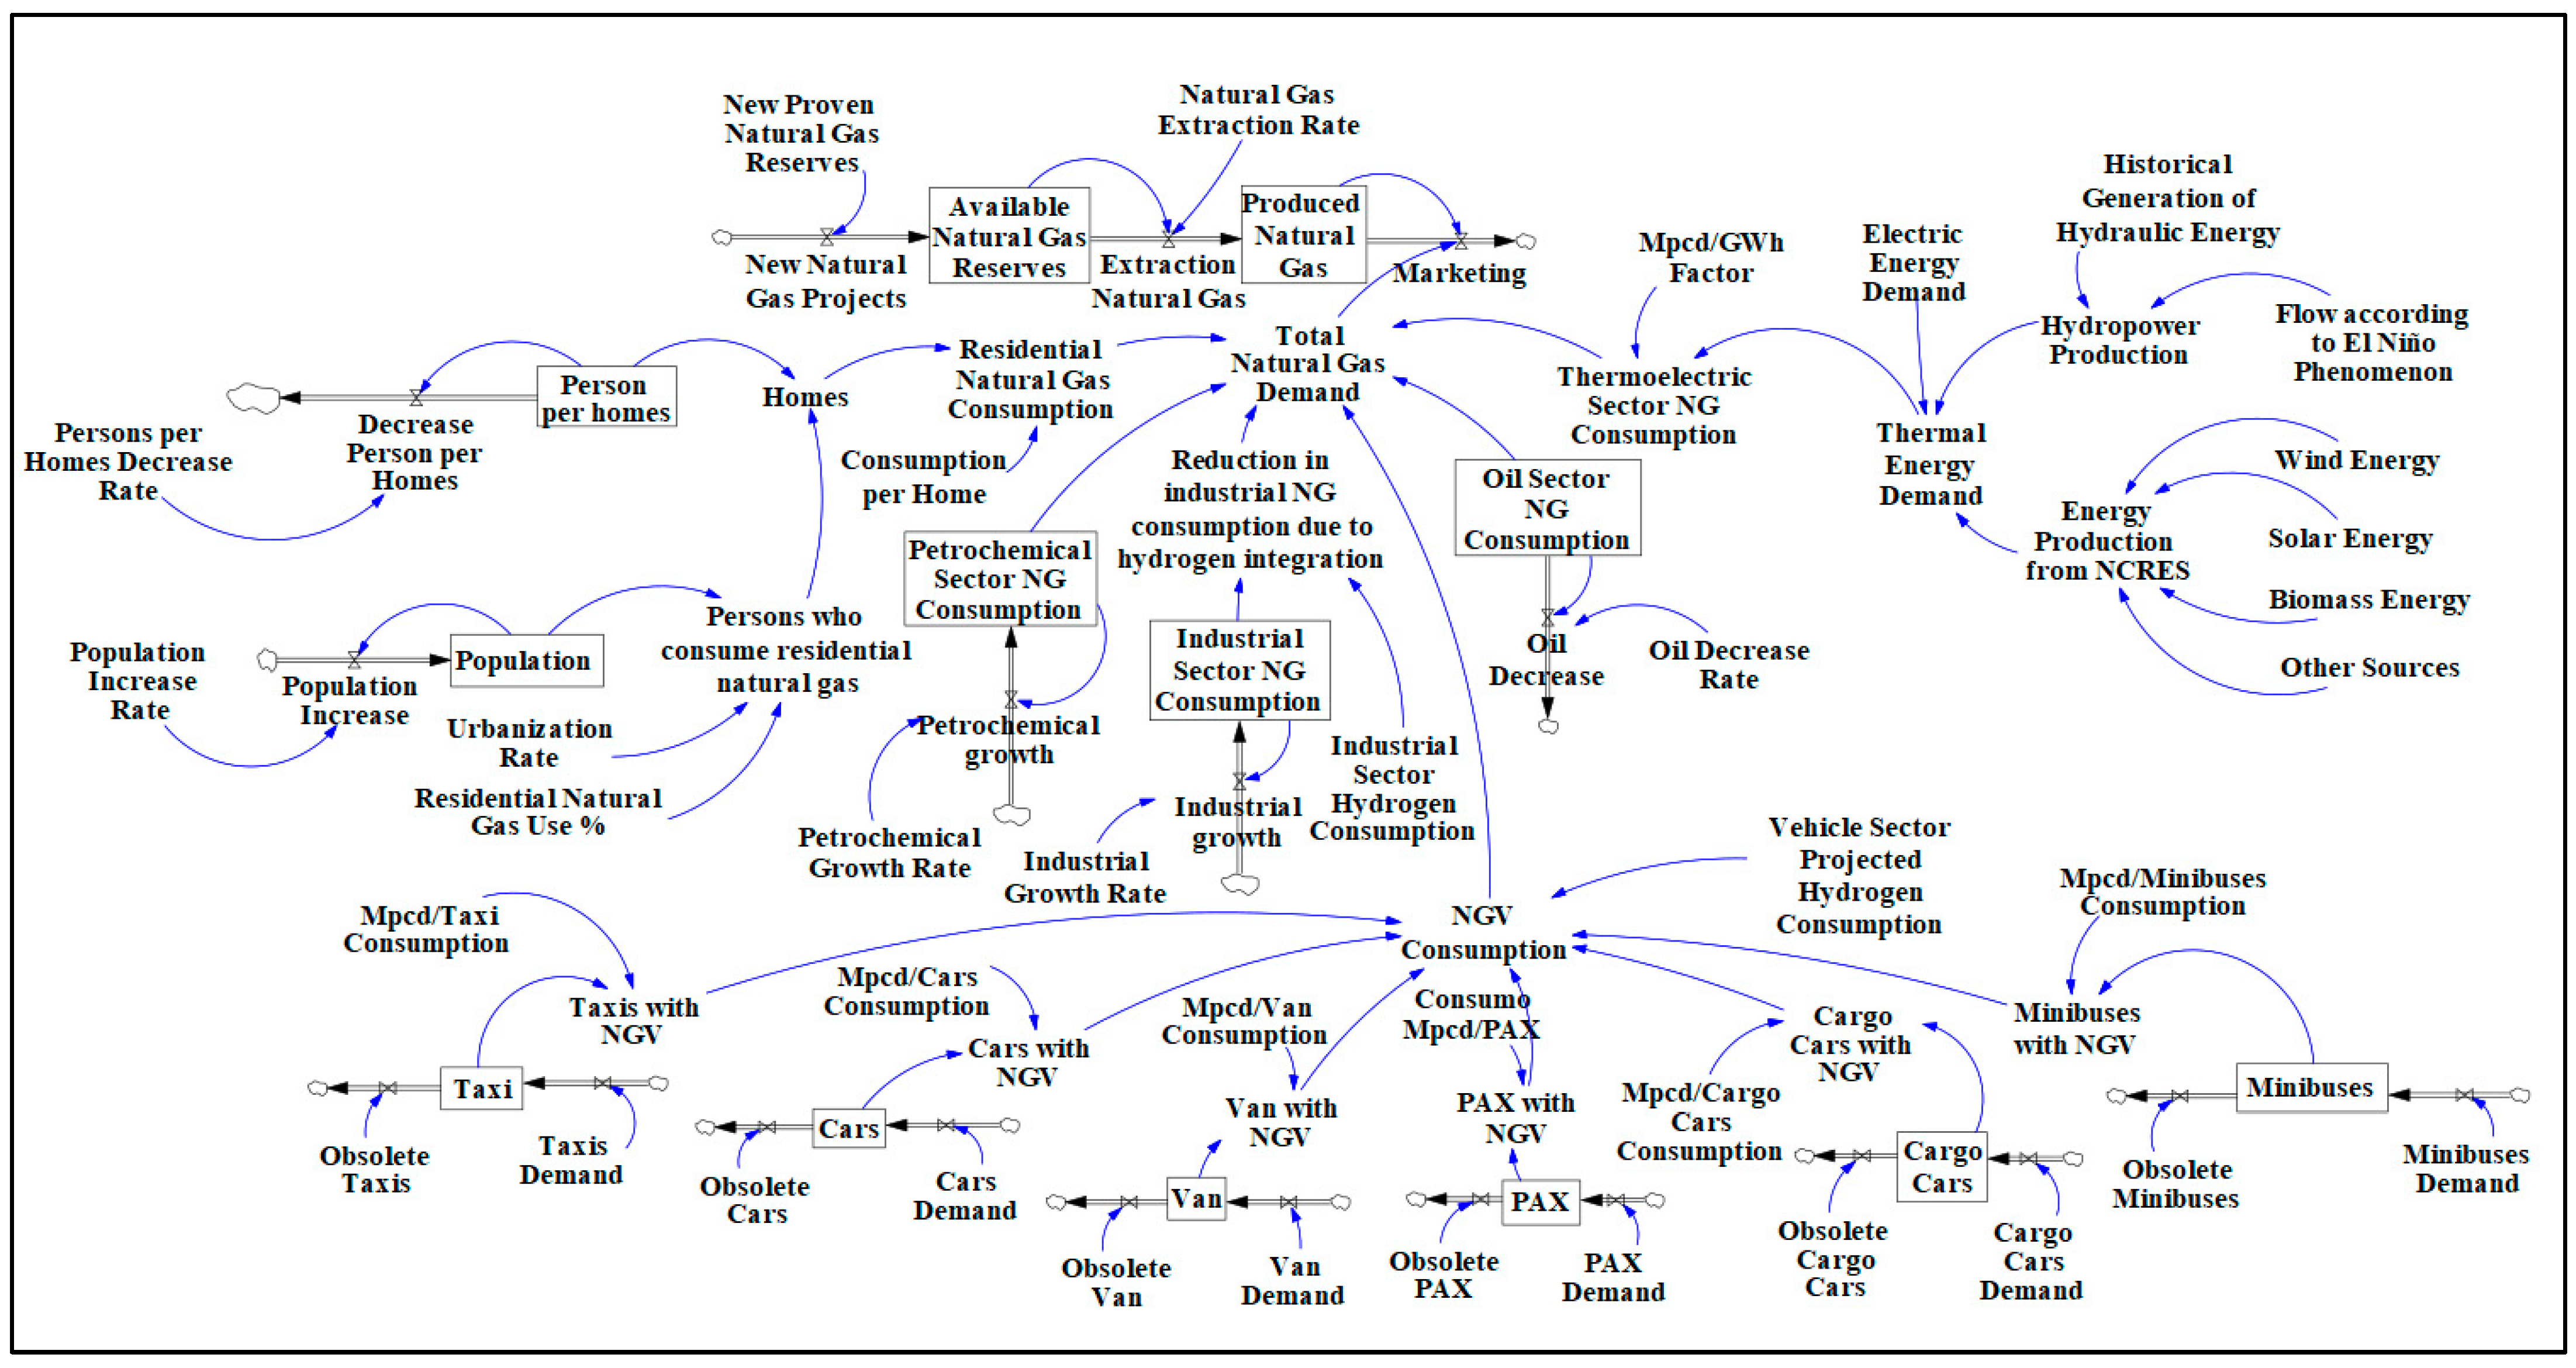
After defining the system’s main variables and their interrelationships, a Forrester diagram was developed, presented in
Figure 3.
The data used in this model were obtained from References [
16,
17,
18,
19,
20,
21,
22].
3.2. Validation of the Natural Gas Demand Model
To evaluate how effectively the model replicates key behavioral patterns observed in the real system, the methodology proposed by [
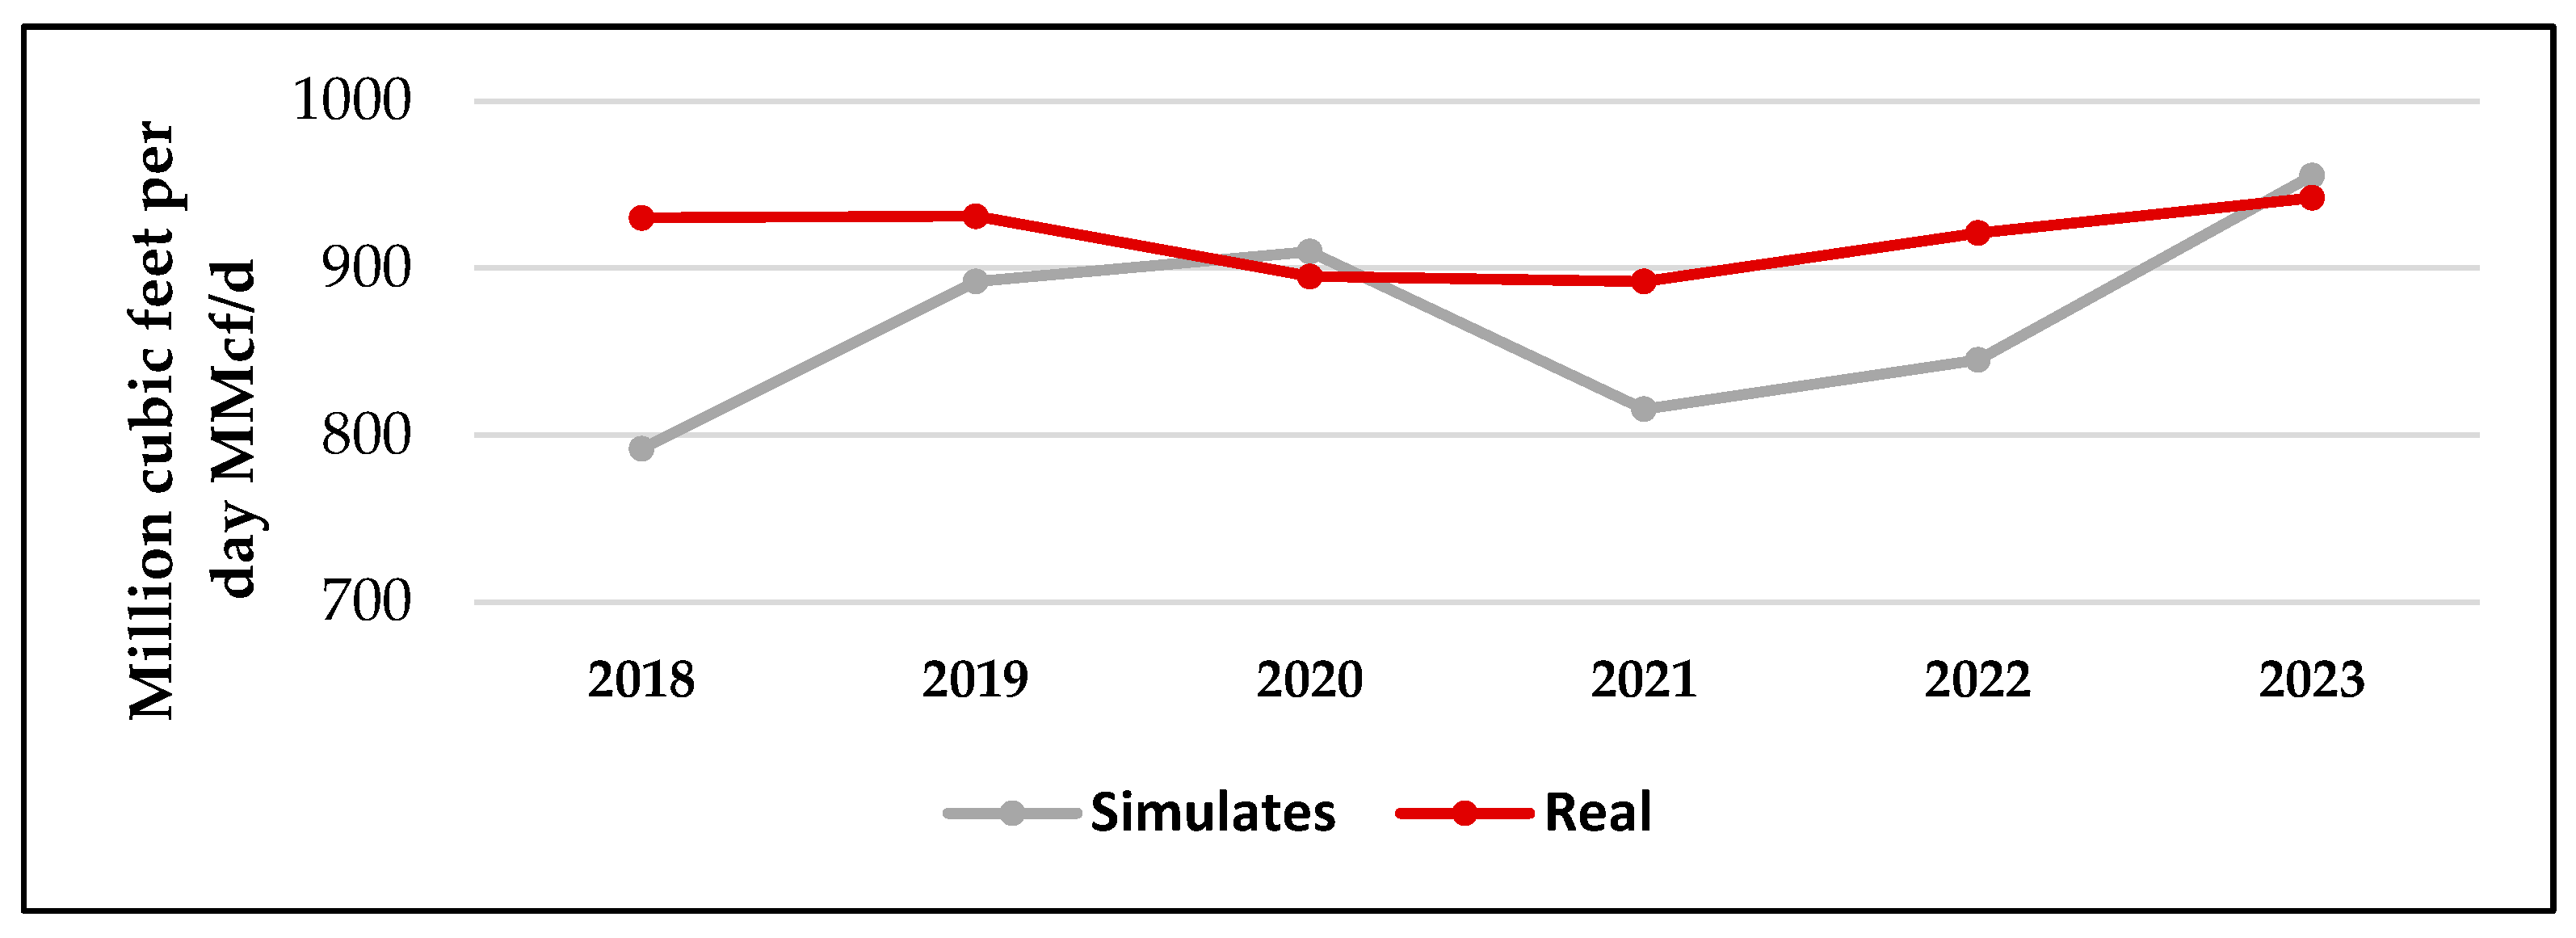
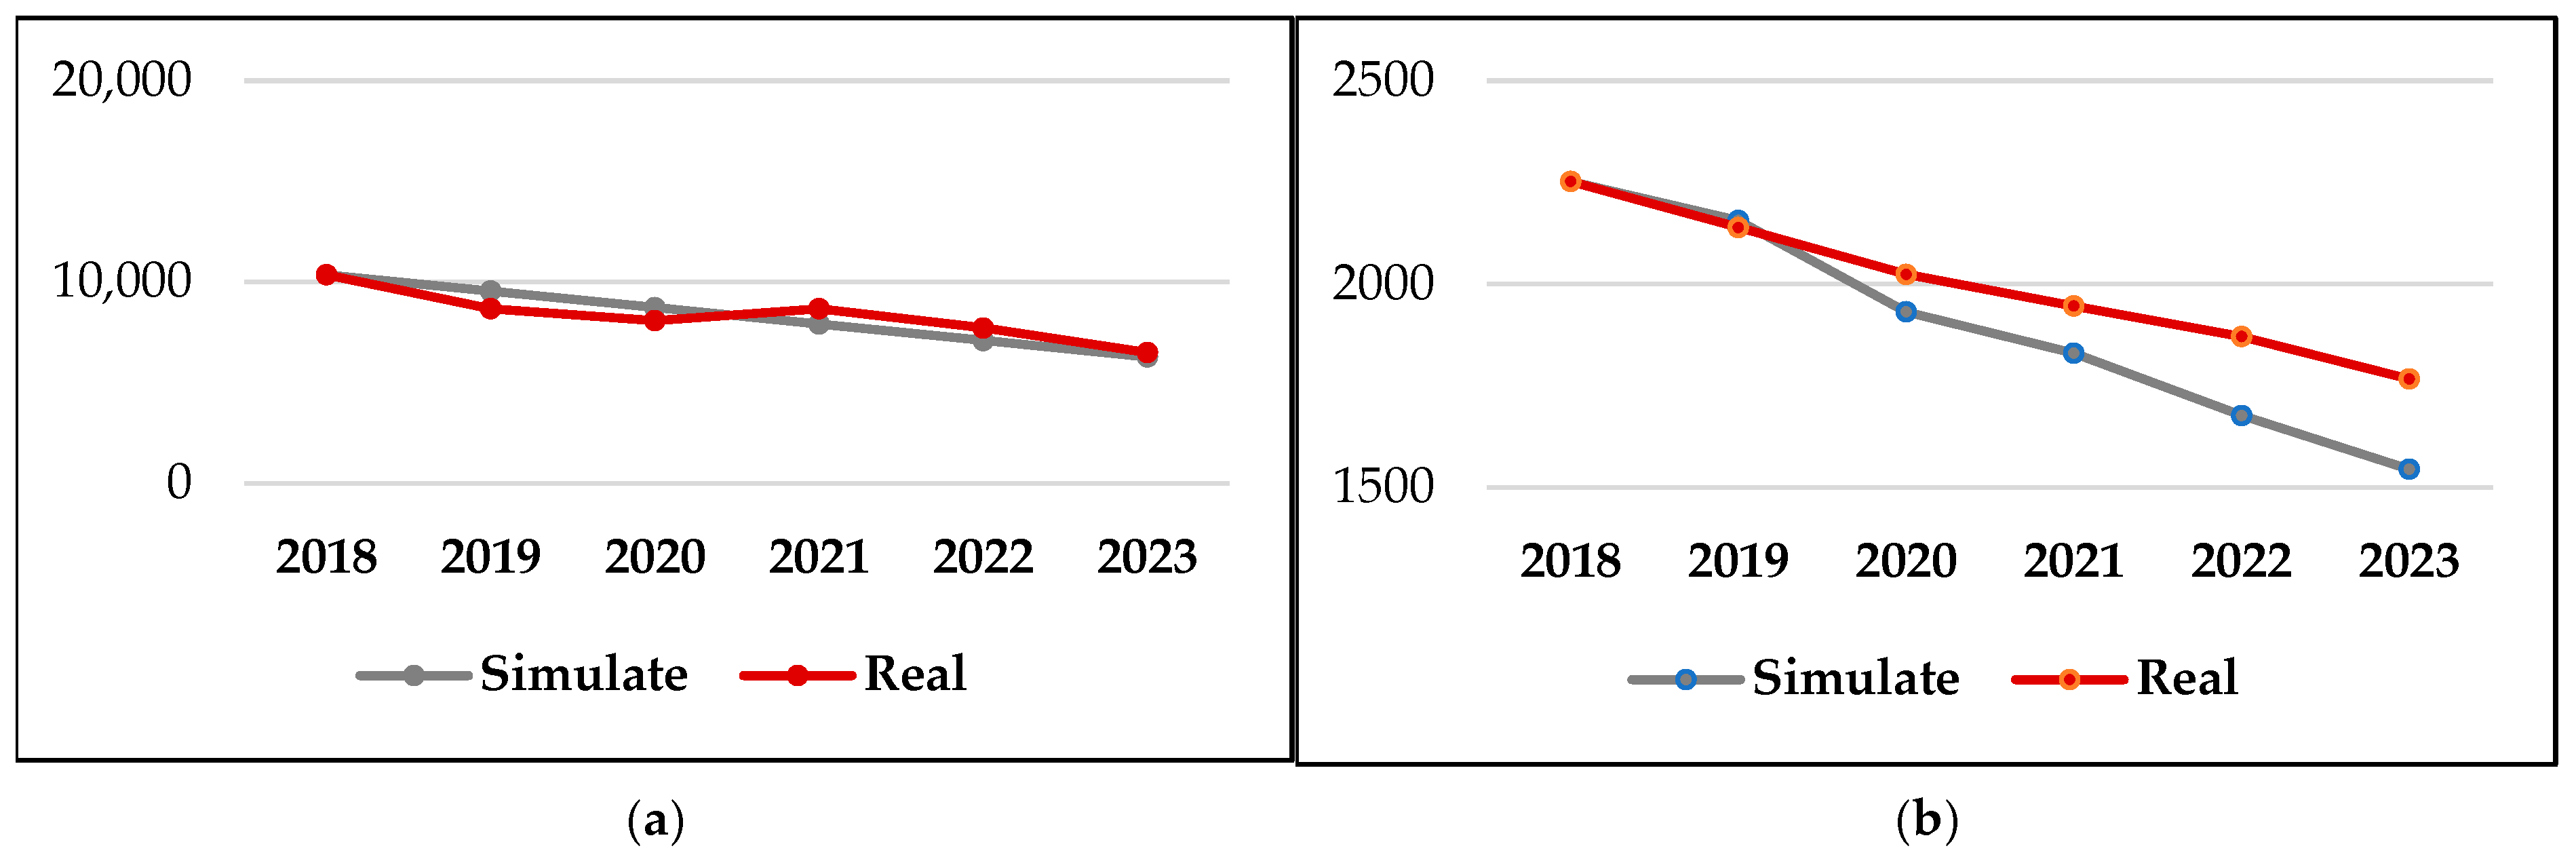
23] was followed, involving both structural and behavioral validation. Structural validation involved verifying that data sources were reliable (governmental and official) and ensuring the consistency of measurement units. Behavioral validation used historical data and compared them against simulated data. The comparison is displayed in
Figure 4.
As shown in
Figure 4, the simulated behavior closely matches the actual observed behavior.
3.3. Comparative Analysis of the Official Demand Forecast and the Projection from This Study
The Unidad de Planeacion Minero-Energetica (UPME) prepares annual projections of natural gas demand and publishes its estimates and scenarios in the Energy Planning section of Colombia’s Ministerio de Minas y Energia. These projections are based on a statistical analysis that uses historical consumption data along with economic and demographic variables to estimate the country’s future demand [
13].
This research, however, employs a different methodology: system dynamics. Accordingly, a comparative graph is presented showing a strong correlation between the results of both approaches in the
Figure 5. Notably, unlike UPME’s model, this study incorporates additional factors such as the purchase and retirement dynamics of vehicles in each identified category; the behavior of natural gas demand in the thermoelectric sector in relation to river flow variations caused by the El Niño phenomenon; the level of urbanization in the residential sector; and the influence of GDP on the industrial and petrochemical sectors.
As shown in
Figure 5, the values remain in the same range.
4. Natural Gas Supply Model in Colombia
The supply of natural gas is determined by the available reserves and the logistical capacity associated with them. It is therefore important to define what constitutes a reserve. Reserves refer to quantities of hydrocarbons anticipated to be commercially recoverable through development projects in known accumulations, from a given date onward, under defined conditions.
Based on Colombia’s consumption level in 2024, current natural gas reserves will last for 5.9 years. Given the country’s substantial potential reserves—estimated at over 70 TCF (trillion cubic feet)—it is essential to continue exploration campaigns to ensure medium- and long-term energy supply security.
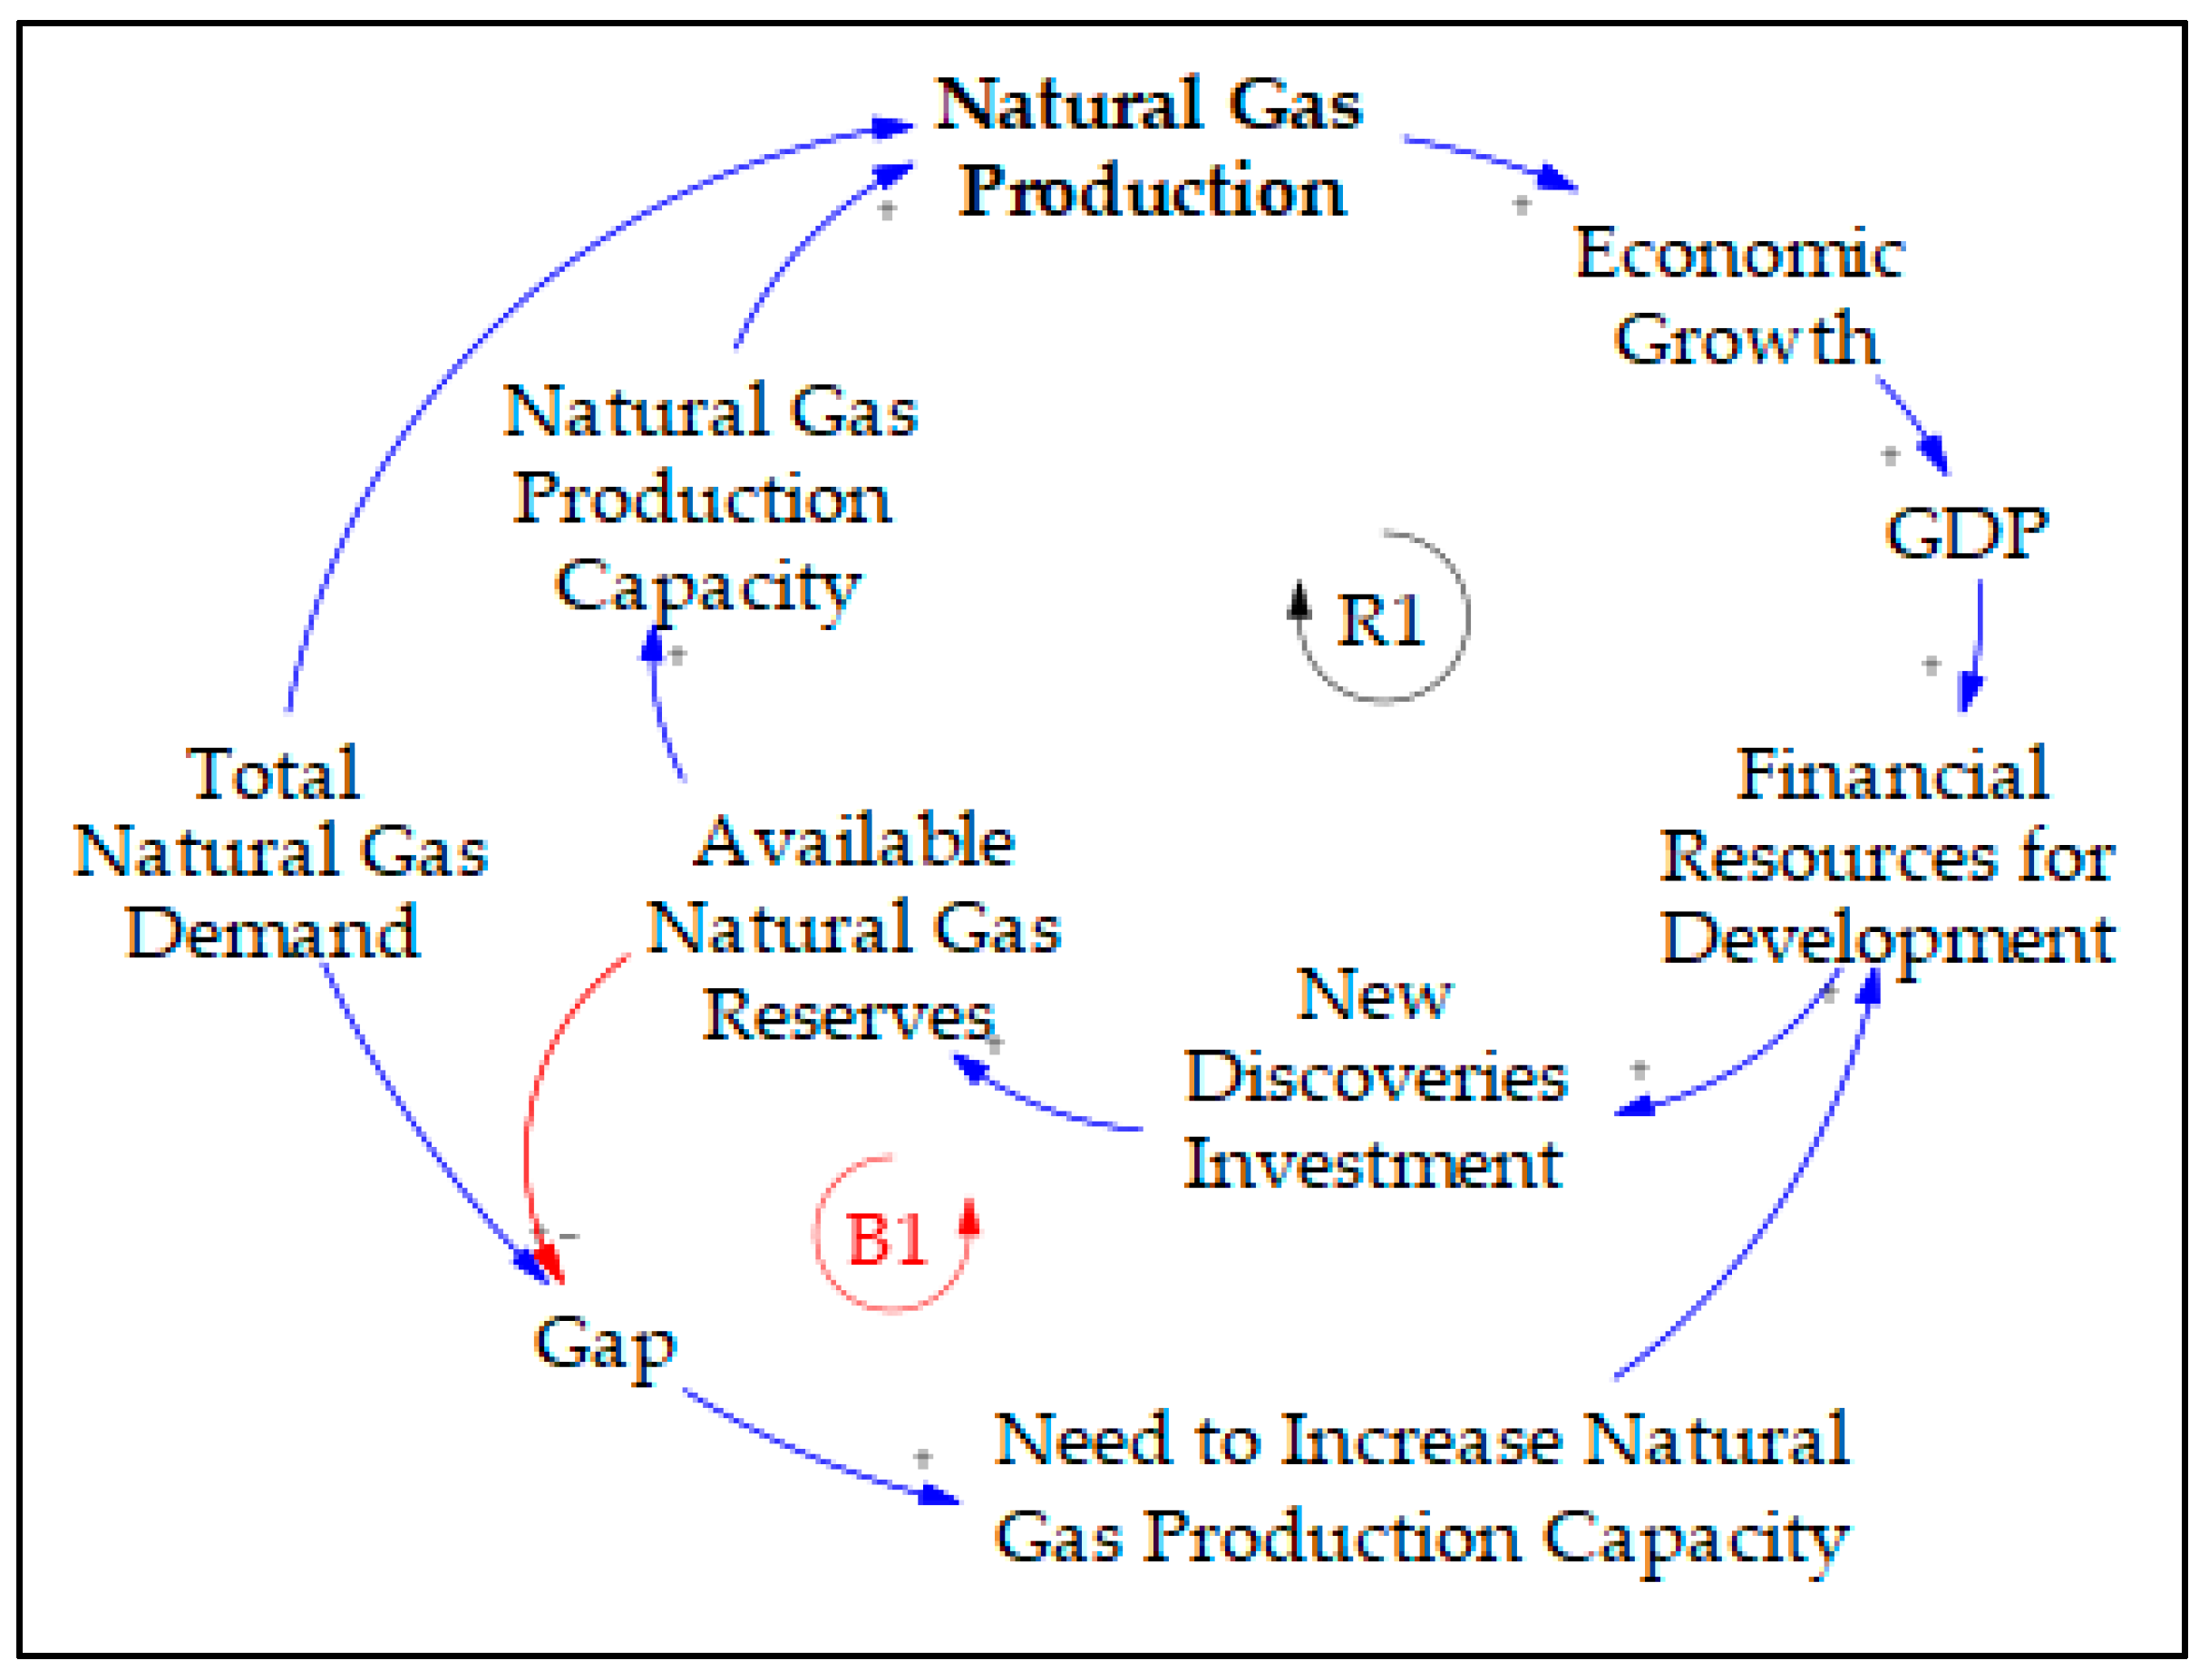
For the natural gas supply model, ten (10) variables were defined as key determinants of the dynamics of supply in Colombia. The variables are shown in
Table 2 and are illustrated in
Figure 6:
The supply causal loop diagram consists of one reinforcing loop and one balancing loop, described as follows:
Reinforcing Loop—Natural Gas Production (R1): An increase in Natural Gas Demand requires higher production, which leads to greater economic growth and a larger contribution to GDP. With a higher GDP, more financial resources become available for investment in new discoveries and production expansion. This results in greater Available Gas Reserves. As reserves grow, so does the need to expand production capacity, leading to higher levels of natural gas output.
Balancing Loop—Demand/Availability Gap (C1): As demand increases, the gap between demand and availability widens, since availability is decreasing. This larger gap increases the need to expand production capacity, which in turn requires more financial resources for gas development and production. Greater financial resources lead to more investment in new discoveries, increasing the available gas reserves. As reserves increase, the demand–availability gap narrows.
Natural Gas Produced (NGP) is calculated as the sum of Natural Gas Extracted (NGE) plus Natural Gas Inventory (NGI), minus Total Demand (TD):
After defining the system’s main variables and their interactions, the Forrester diagram for the supply model was constructed, as shown in
Figure 7.
Validation of the Natural Gas Supply Model
Similar to the demand model, both structural and behavioral validation were conducted. For behavioral validation, historical data were used to simulate and compare with actual trends. The comparison is illustrated in
Figure 8.
Figure 8 shows the comparison between real and simulated data since 2018.
As seen in
Figure 8, the simulated behavior closely matches real-world data.
5. Natural Gas Demand and Supply Models Integration
Figure 9 presents the Forrester Diagram integrating the demand and supply models of natural gas in Colombia.
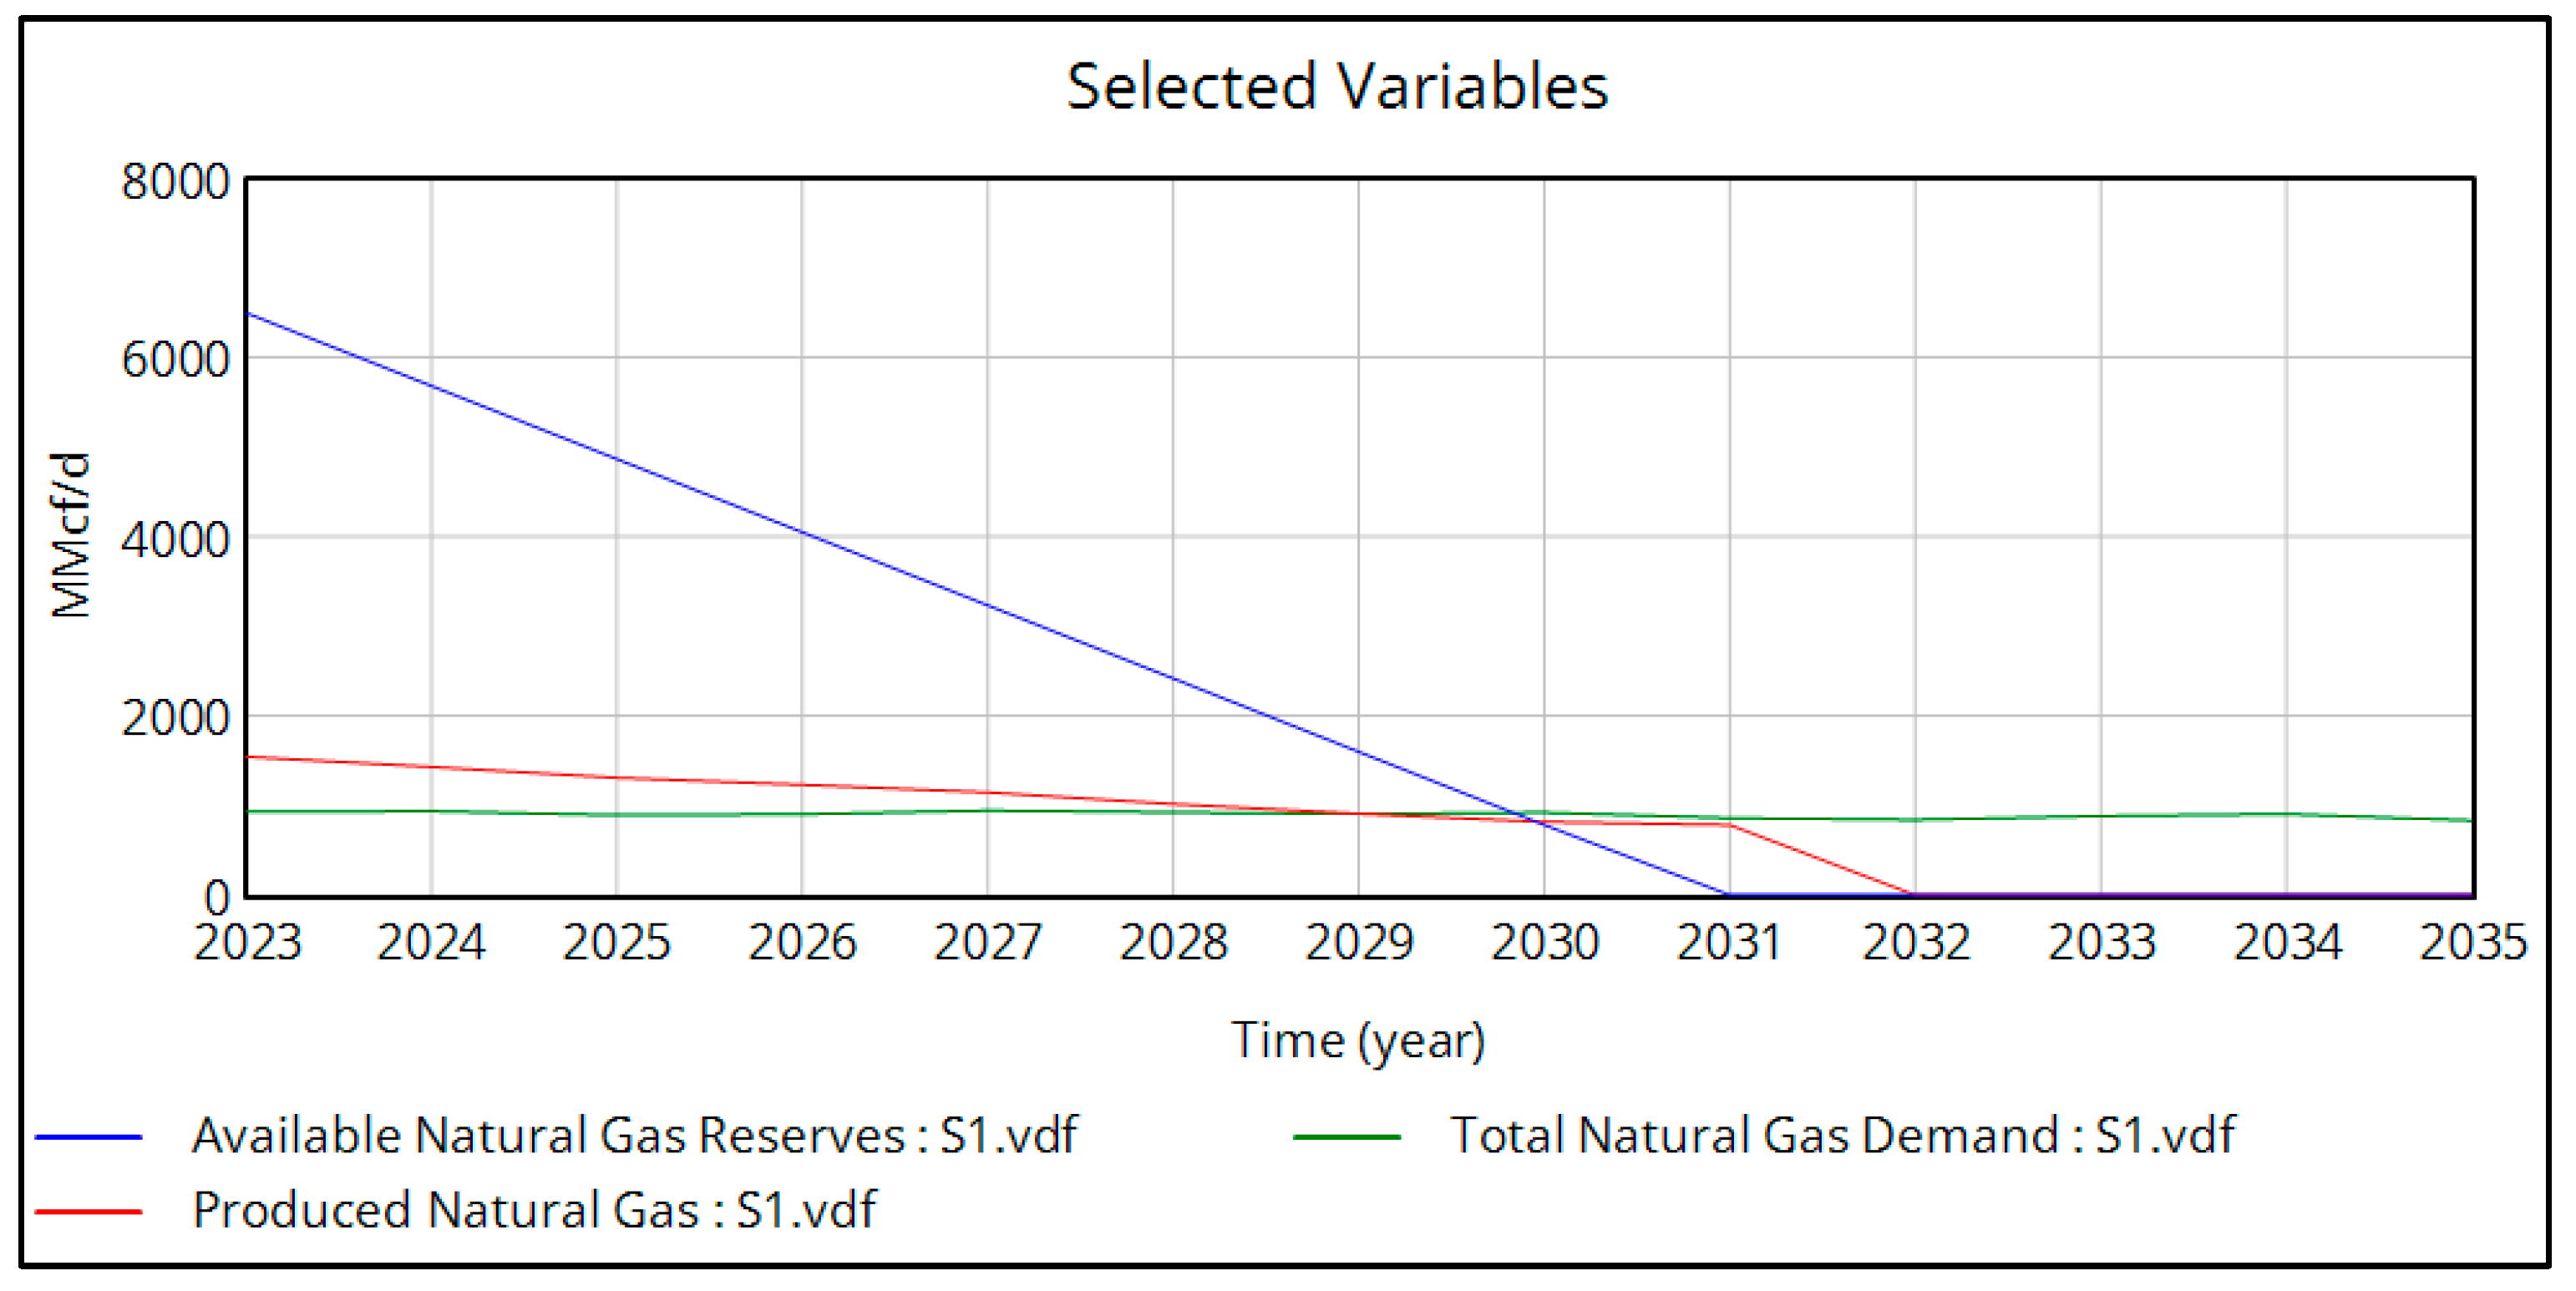
Once the values from the demand and supply tables were integrated into the simulation using the Vensim software (Version 5.10a), the results were obtained as shown in
Figure 10:
As shown in
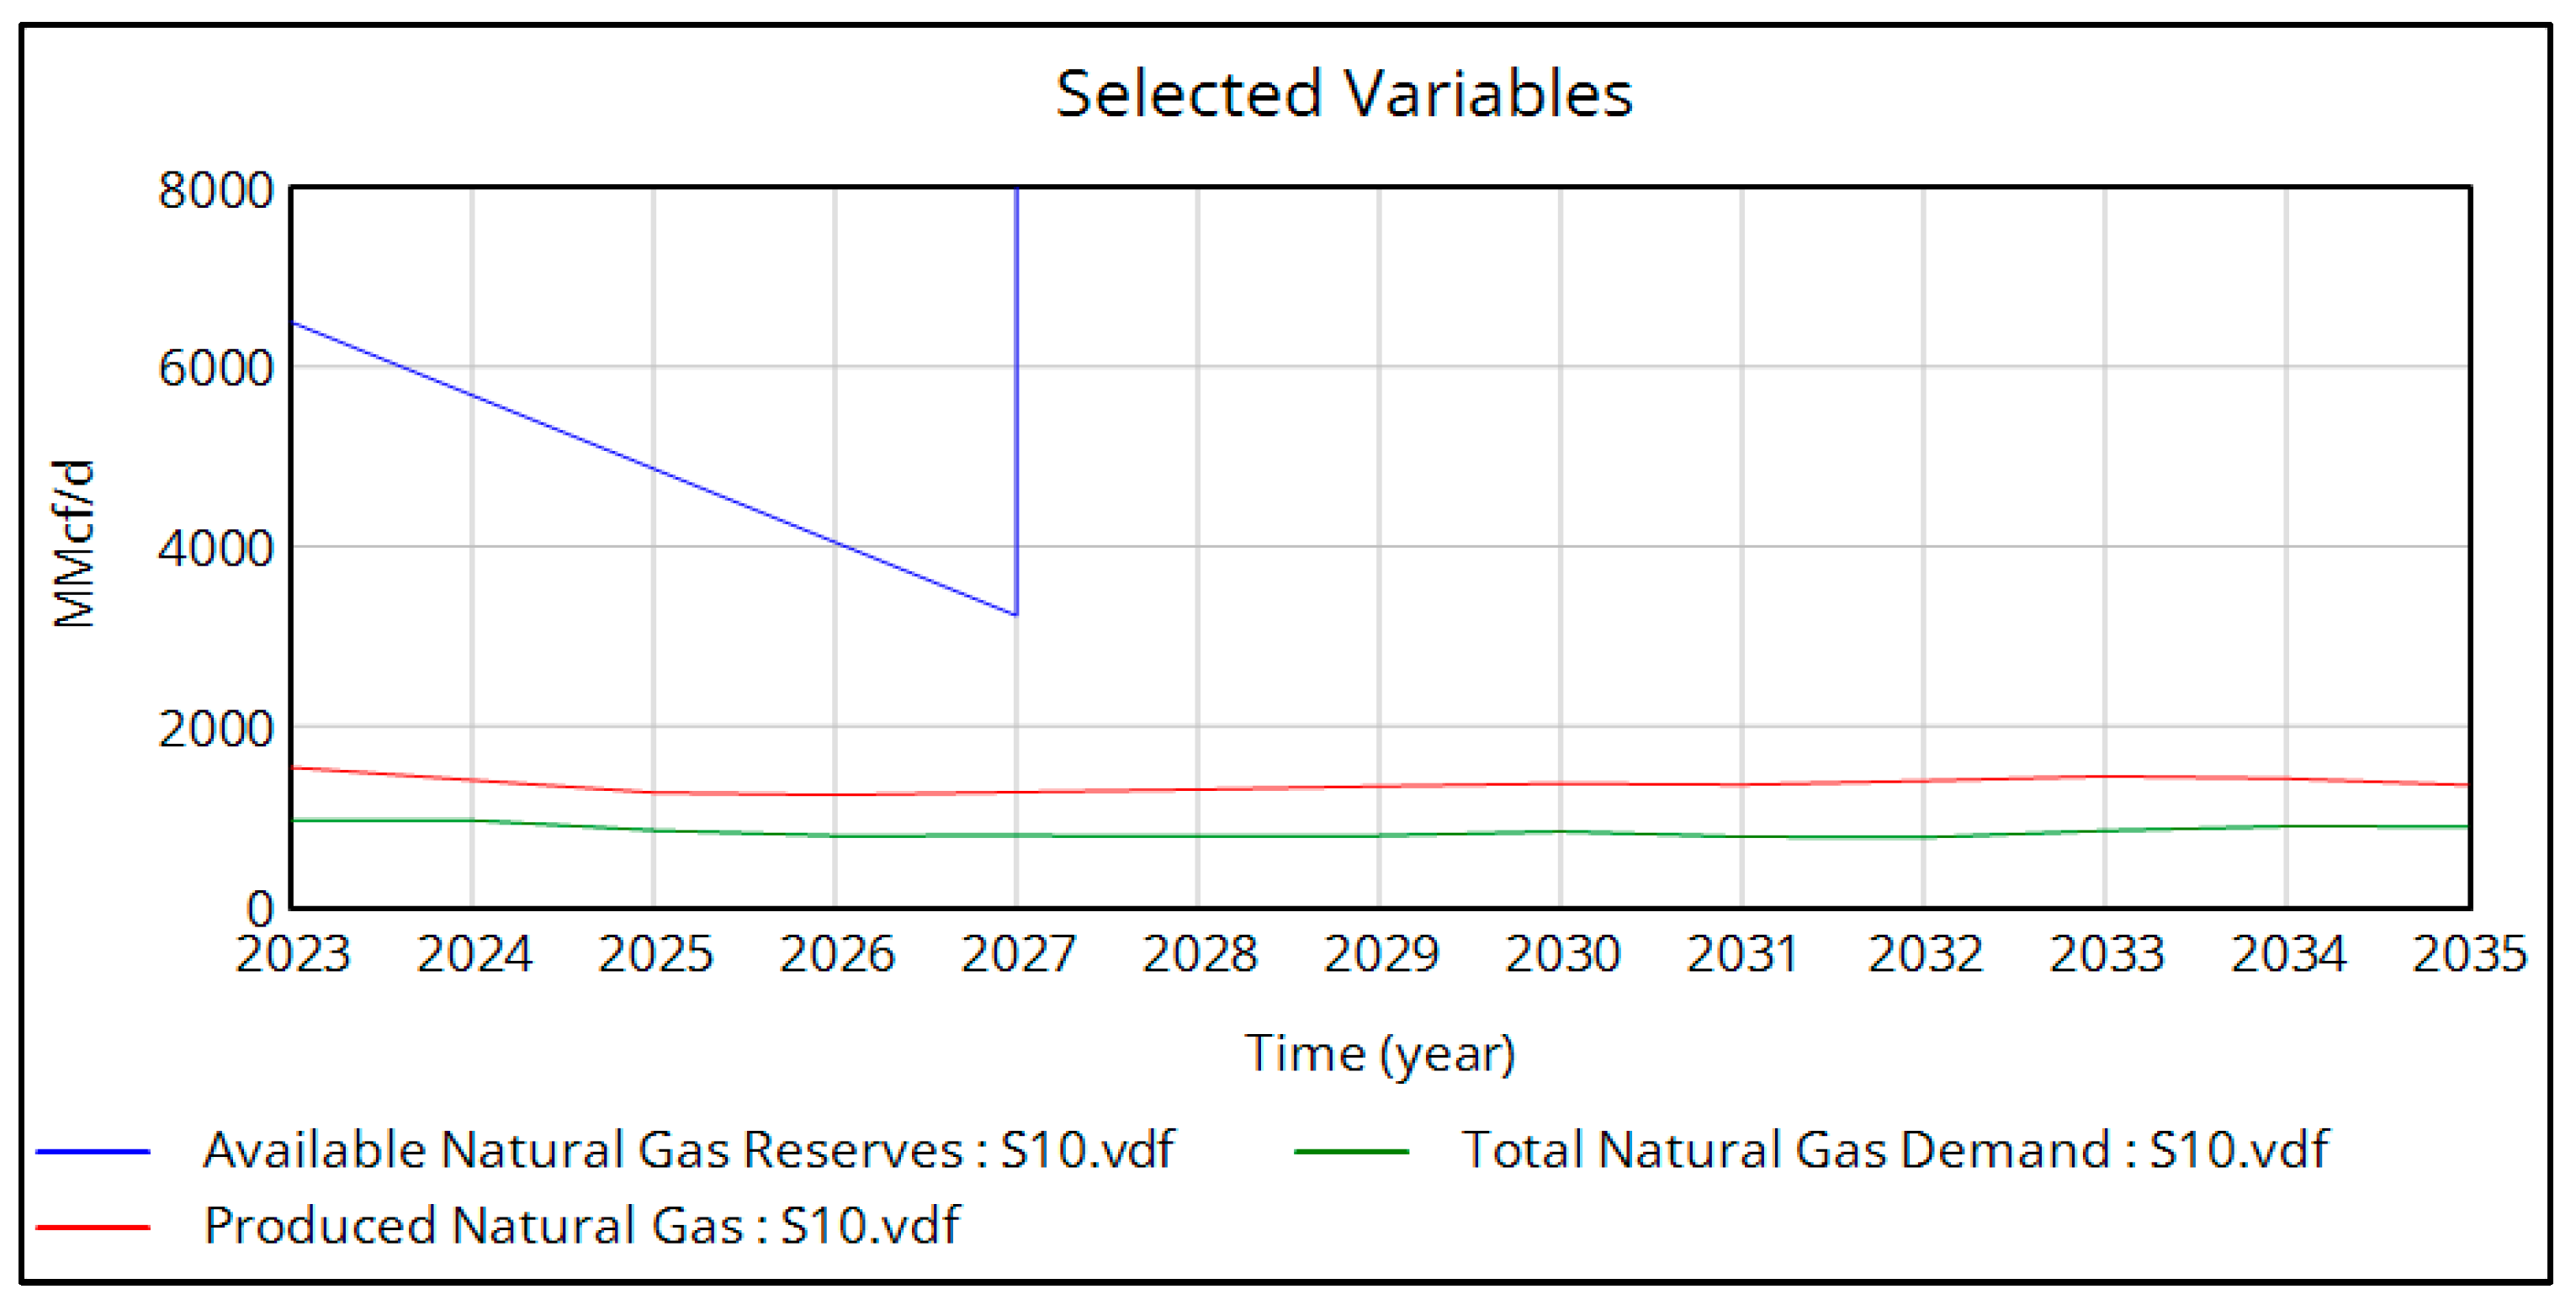
Figure 10, during the second half of 2026, the Natural Gas Produced (red line) intersects with the Total Natural Gas Demand (green line), indicating that, up to that point, the extracted gas meets the projected consumption. From that year onward, a deficit appears as demand surpasses available gas, suggesting the need for new strategies to meet future demand. By the second half of 2030, the Available Natural Gas Reserves (blue line) reach zero, meaning domestic gas resources would be completely depleted by that year. The Natural Gas Produced (red line) falls to zero by the second half of 2031, meaning that despite the depletion of reserves in 2030, existing inventories allow part of the demand to be covered until 2031. In conclusion, from 2027 onward, alternative measures such as imports must be considered to meet the projected demand.
Simulation Scenarios
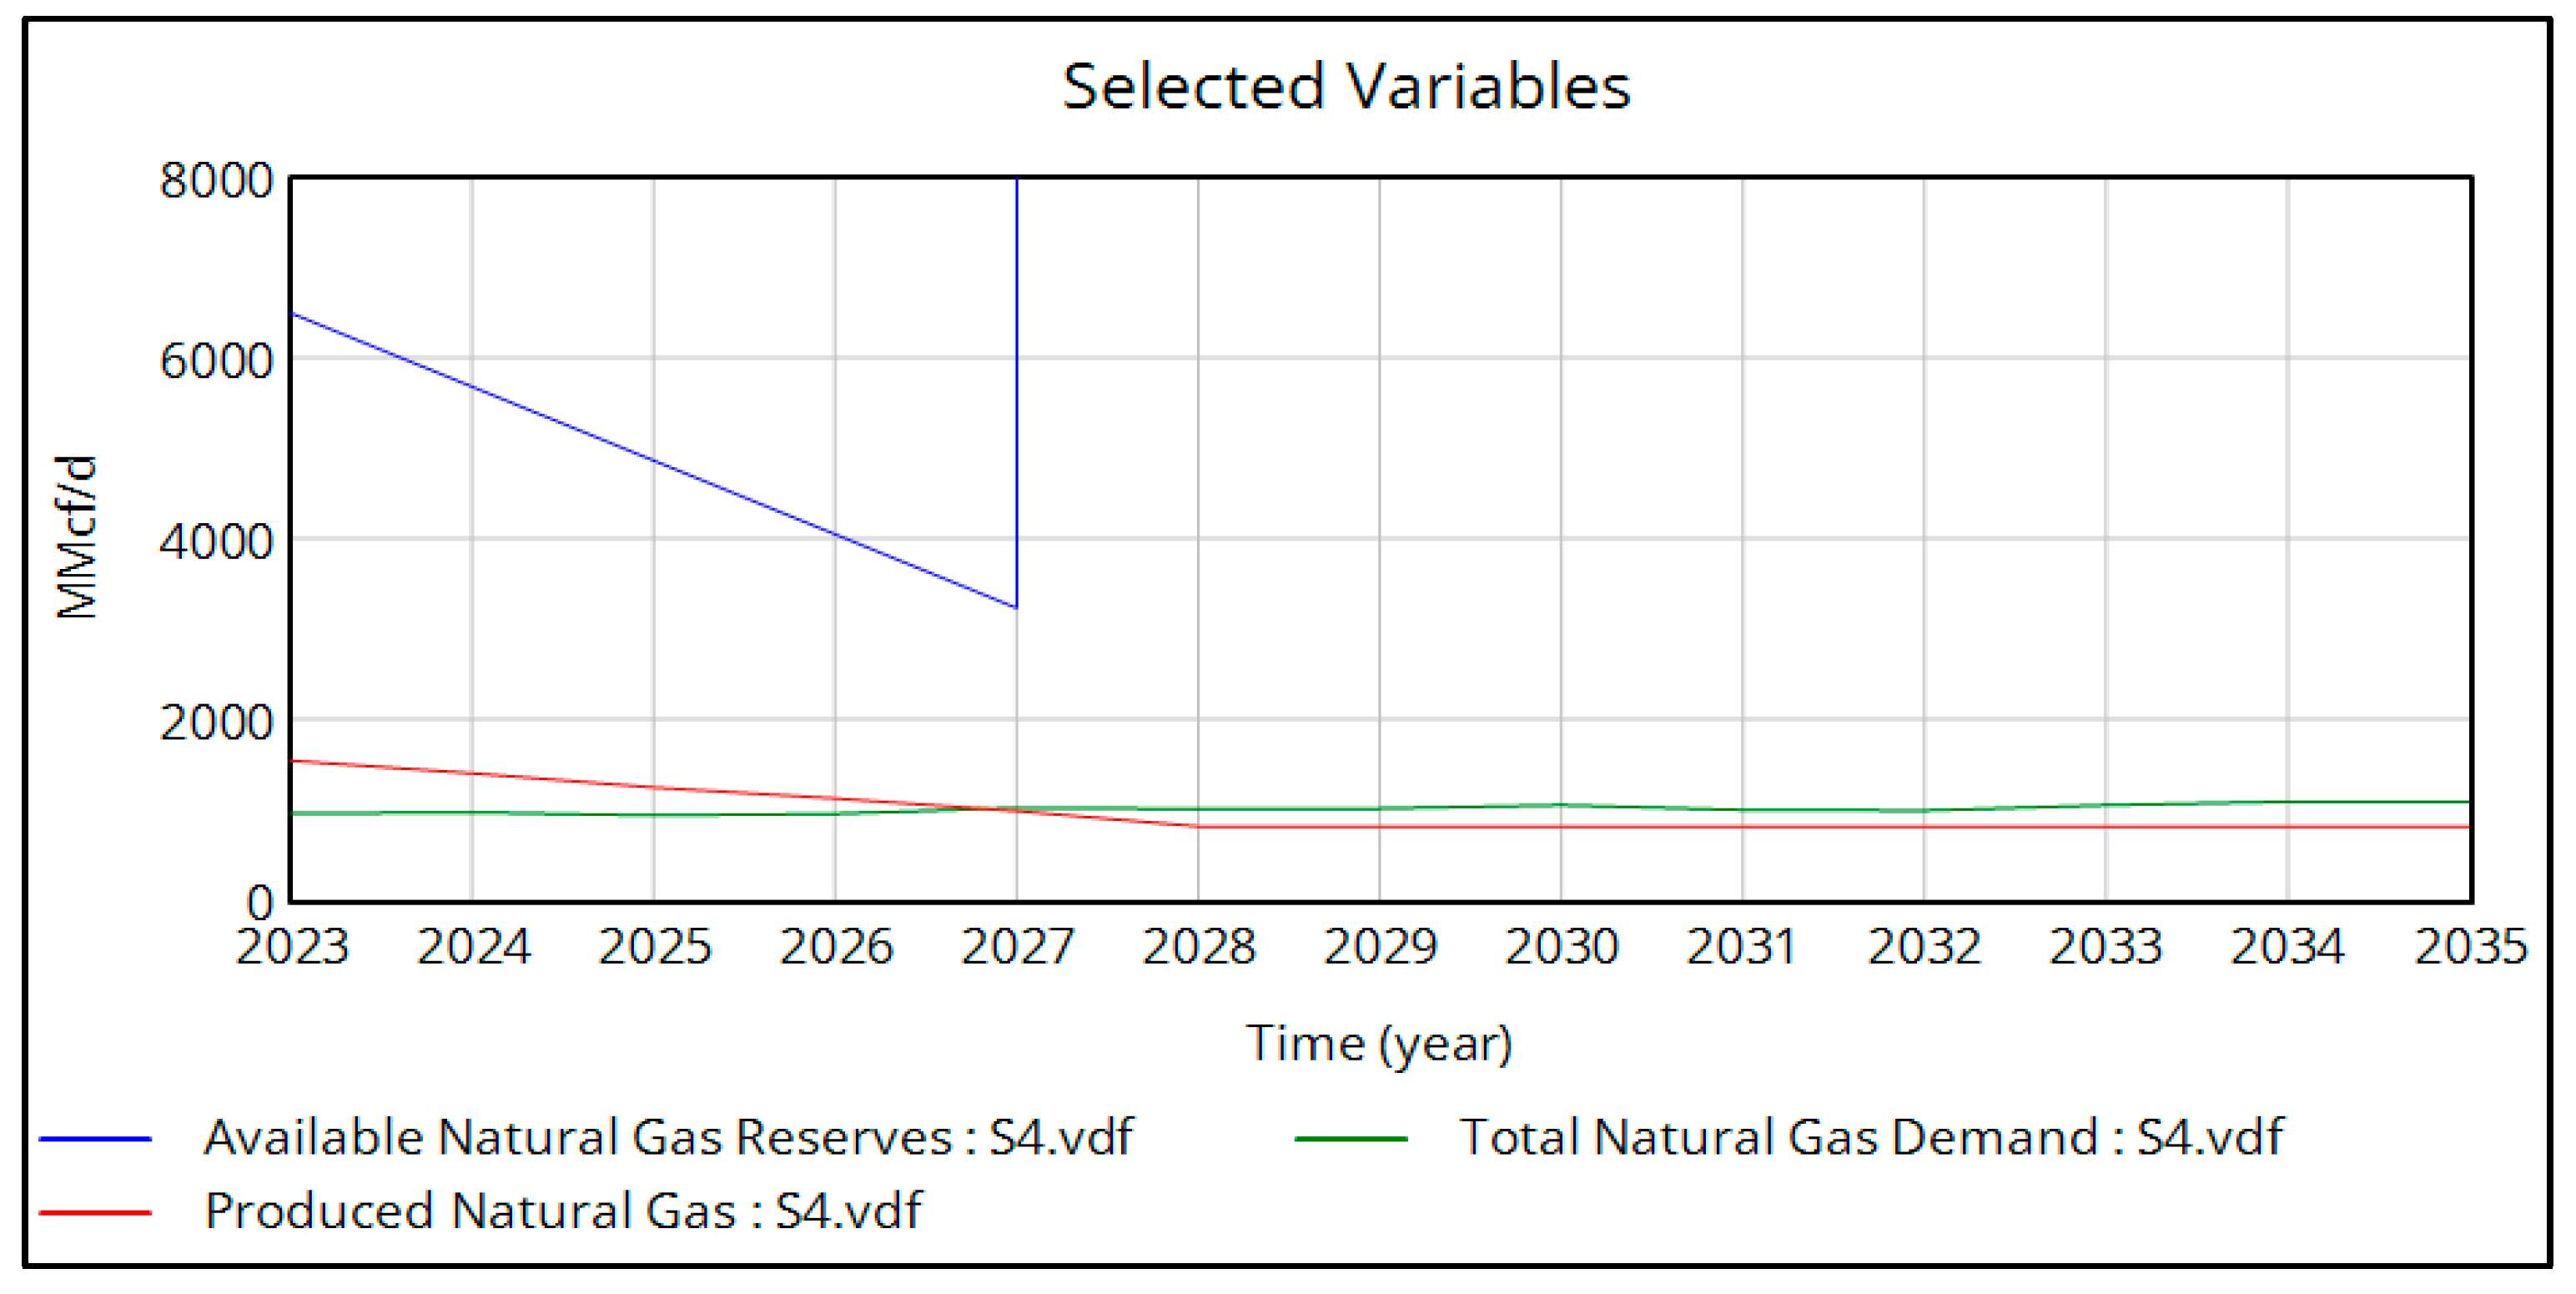
After observing that the integrated natural gas supply-and-demand model shows 100% of domestic demand being met with locally produced gas until 2027, four main scenarios—and combinations among them—are defined to analyze how the situation changes in each case.
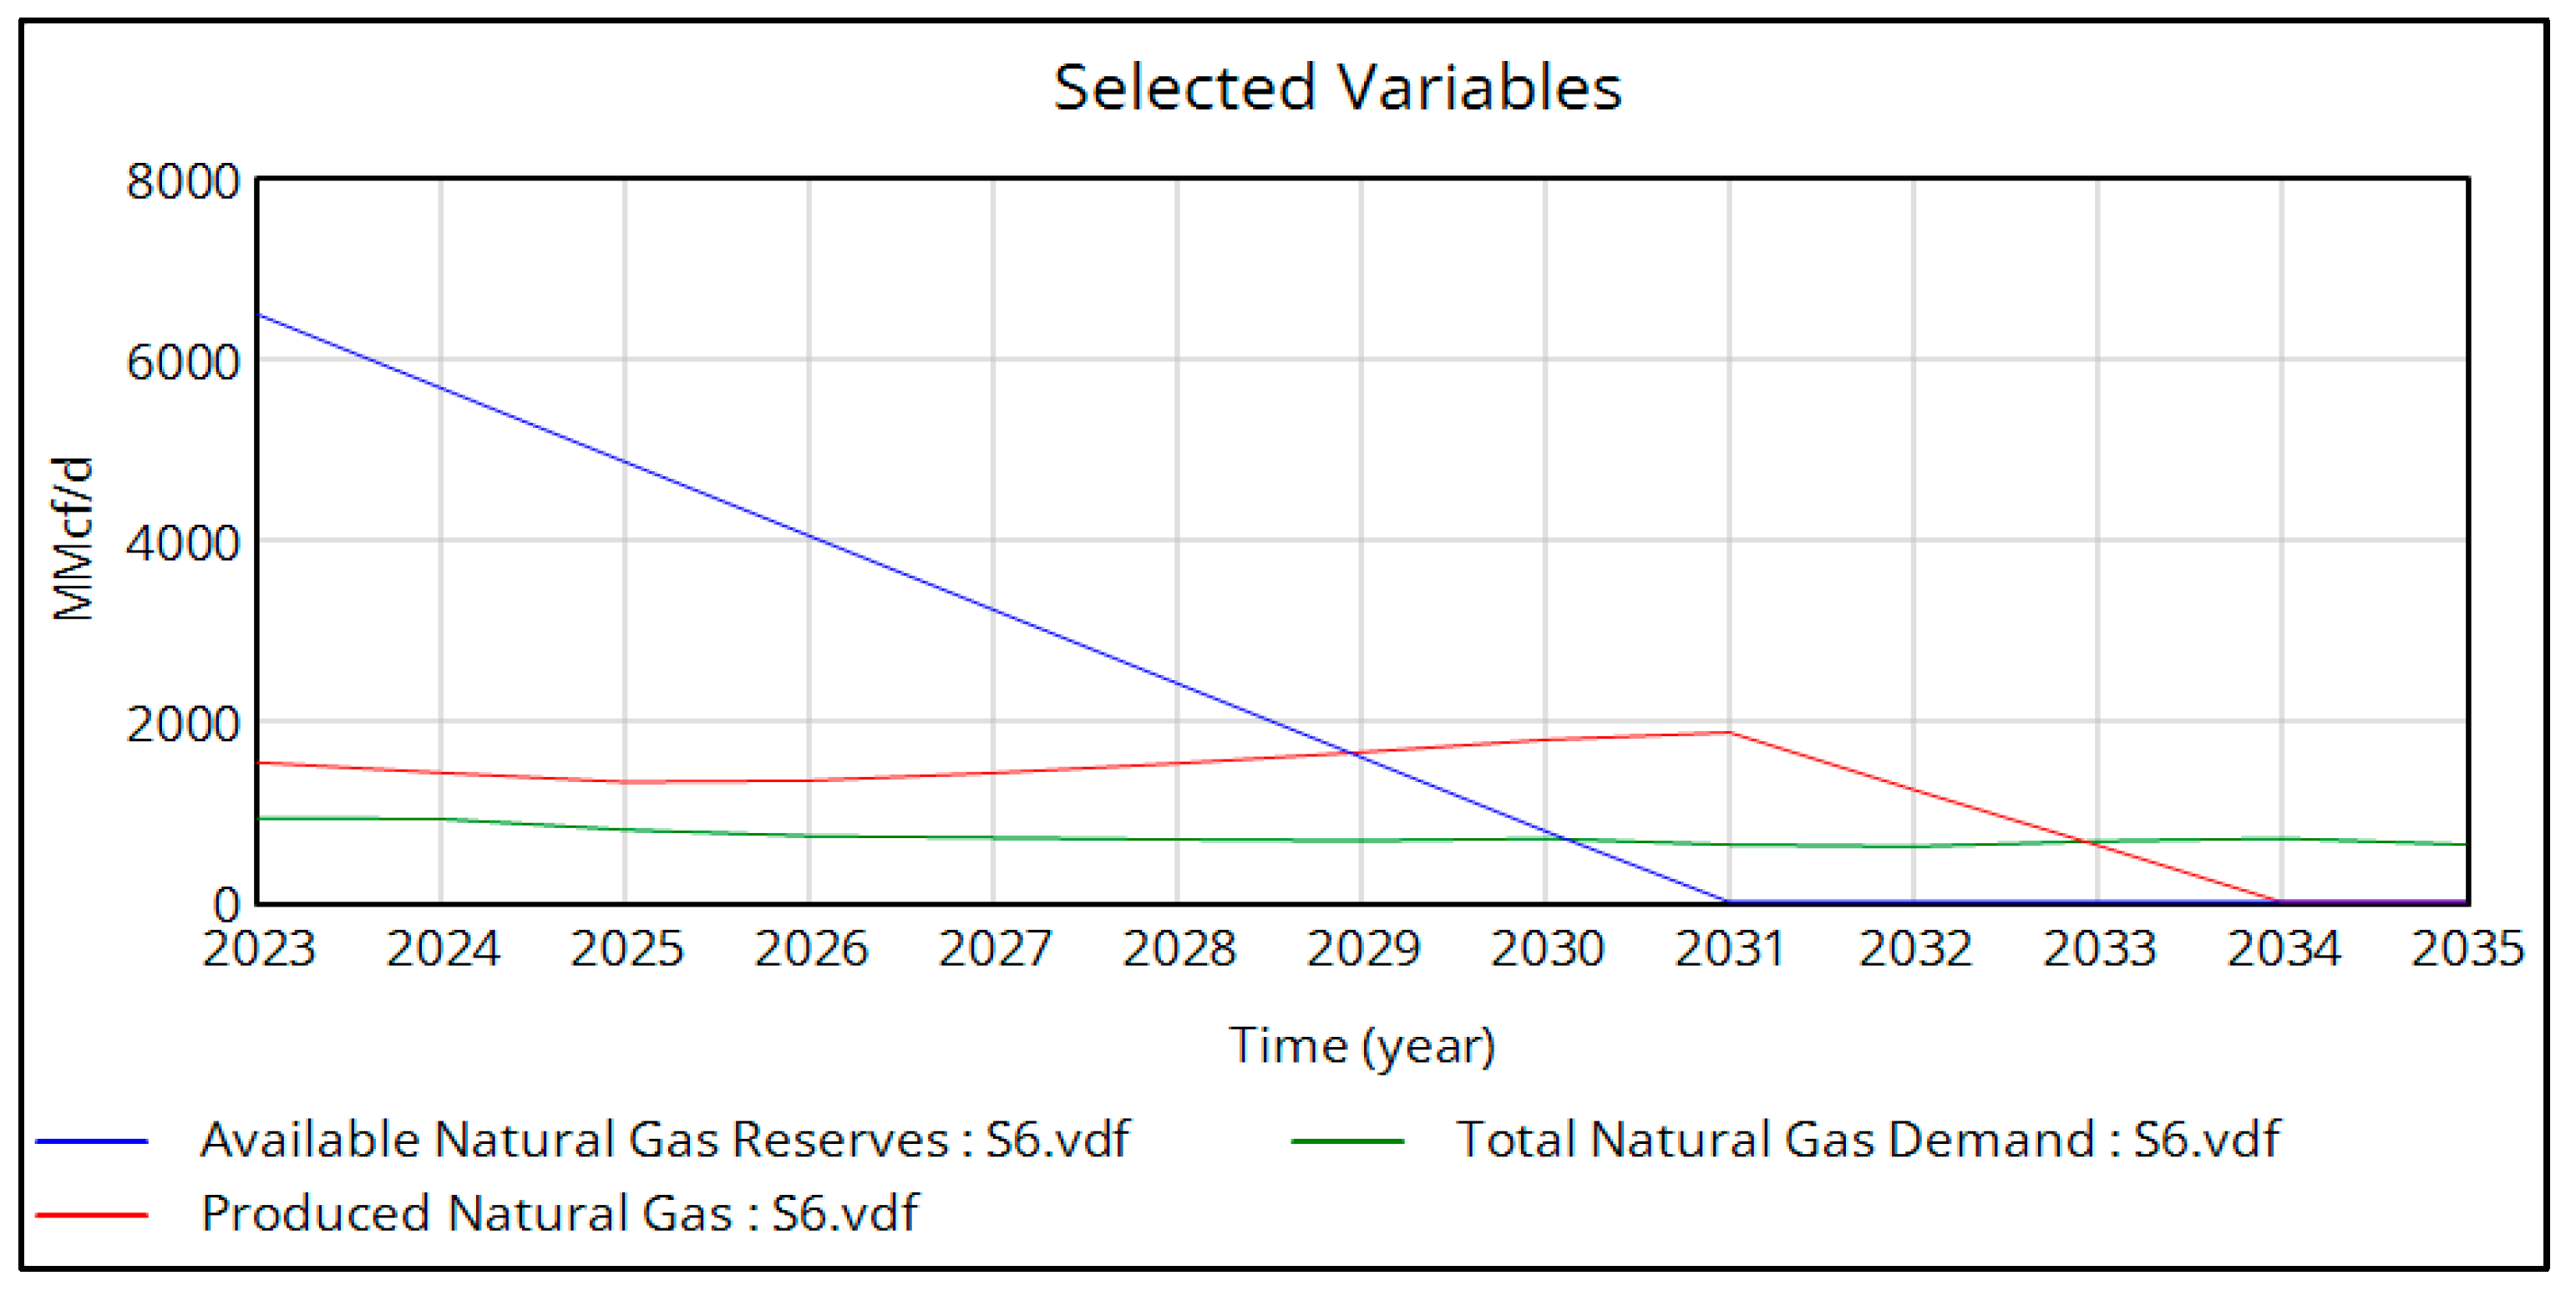
Scenario 1 incorporates the projected hydrogen demand for the transportation, industrial, and electric power generation sectors, based on Colombia’s Hydrogen Roadmap [
24]. The data are presented in
Table 3.
Scenario 2 includes projections for the growth of wind-power generation capacity to replace natural gas in the thermoelectric sector. The information is provided in
Table 4, following the Indicative Generation Expansion Plan 2023–2037 [
24].
Scenario 3 considers projections for the expansion of solar-power generation capacity to substitute natural gas in the thermoelectric sector. The relevant data, according to the same Indicative Generation Expansion Plan 2023–2037 [
24], appear in
Table 4.
Scenario 4 adds new natural gas reserves to the supply model, specifically, the Sirius-2 well, located 77 km offshore from Santa Marta, Colombia. Drilling began in June 2024 and confirmed in-place gas volumes exceeding 6 trillion cubic feet, which could increase the country’s current reserves by 200%. Production is expected to start three years after all environmental licenses are obtained and the commercial viability of the discovery is confirmed, projected for 2027 [
11].
A summary of the scenarios reviewed is presented in
Table 5.
For the development of this research, the following assumptions were applied:
The extraction rate remains constant.
No new natural gas discoveries are added to the model.
There is neither import nor export of natural gas.
There are no limits on natural gas storage capacity.
The proportion of vehicles that consume natural gas within the six presented categories remains unchanged.
The fuel used for thermal power generation is exclusively natural gas.
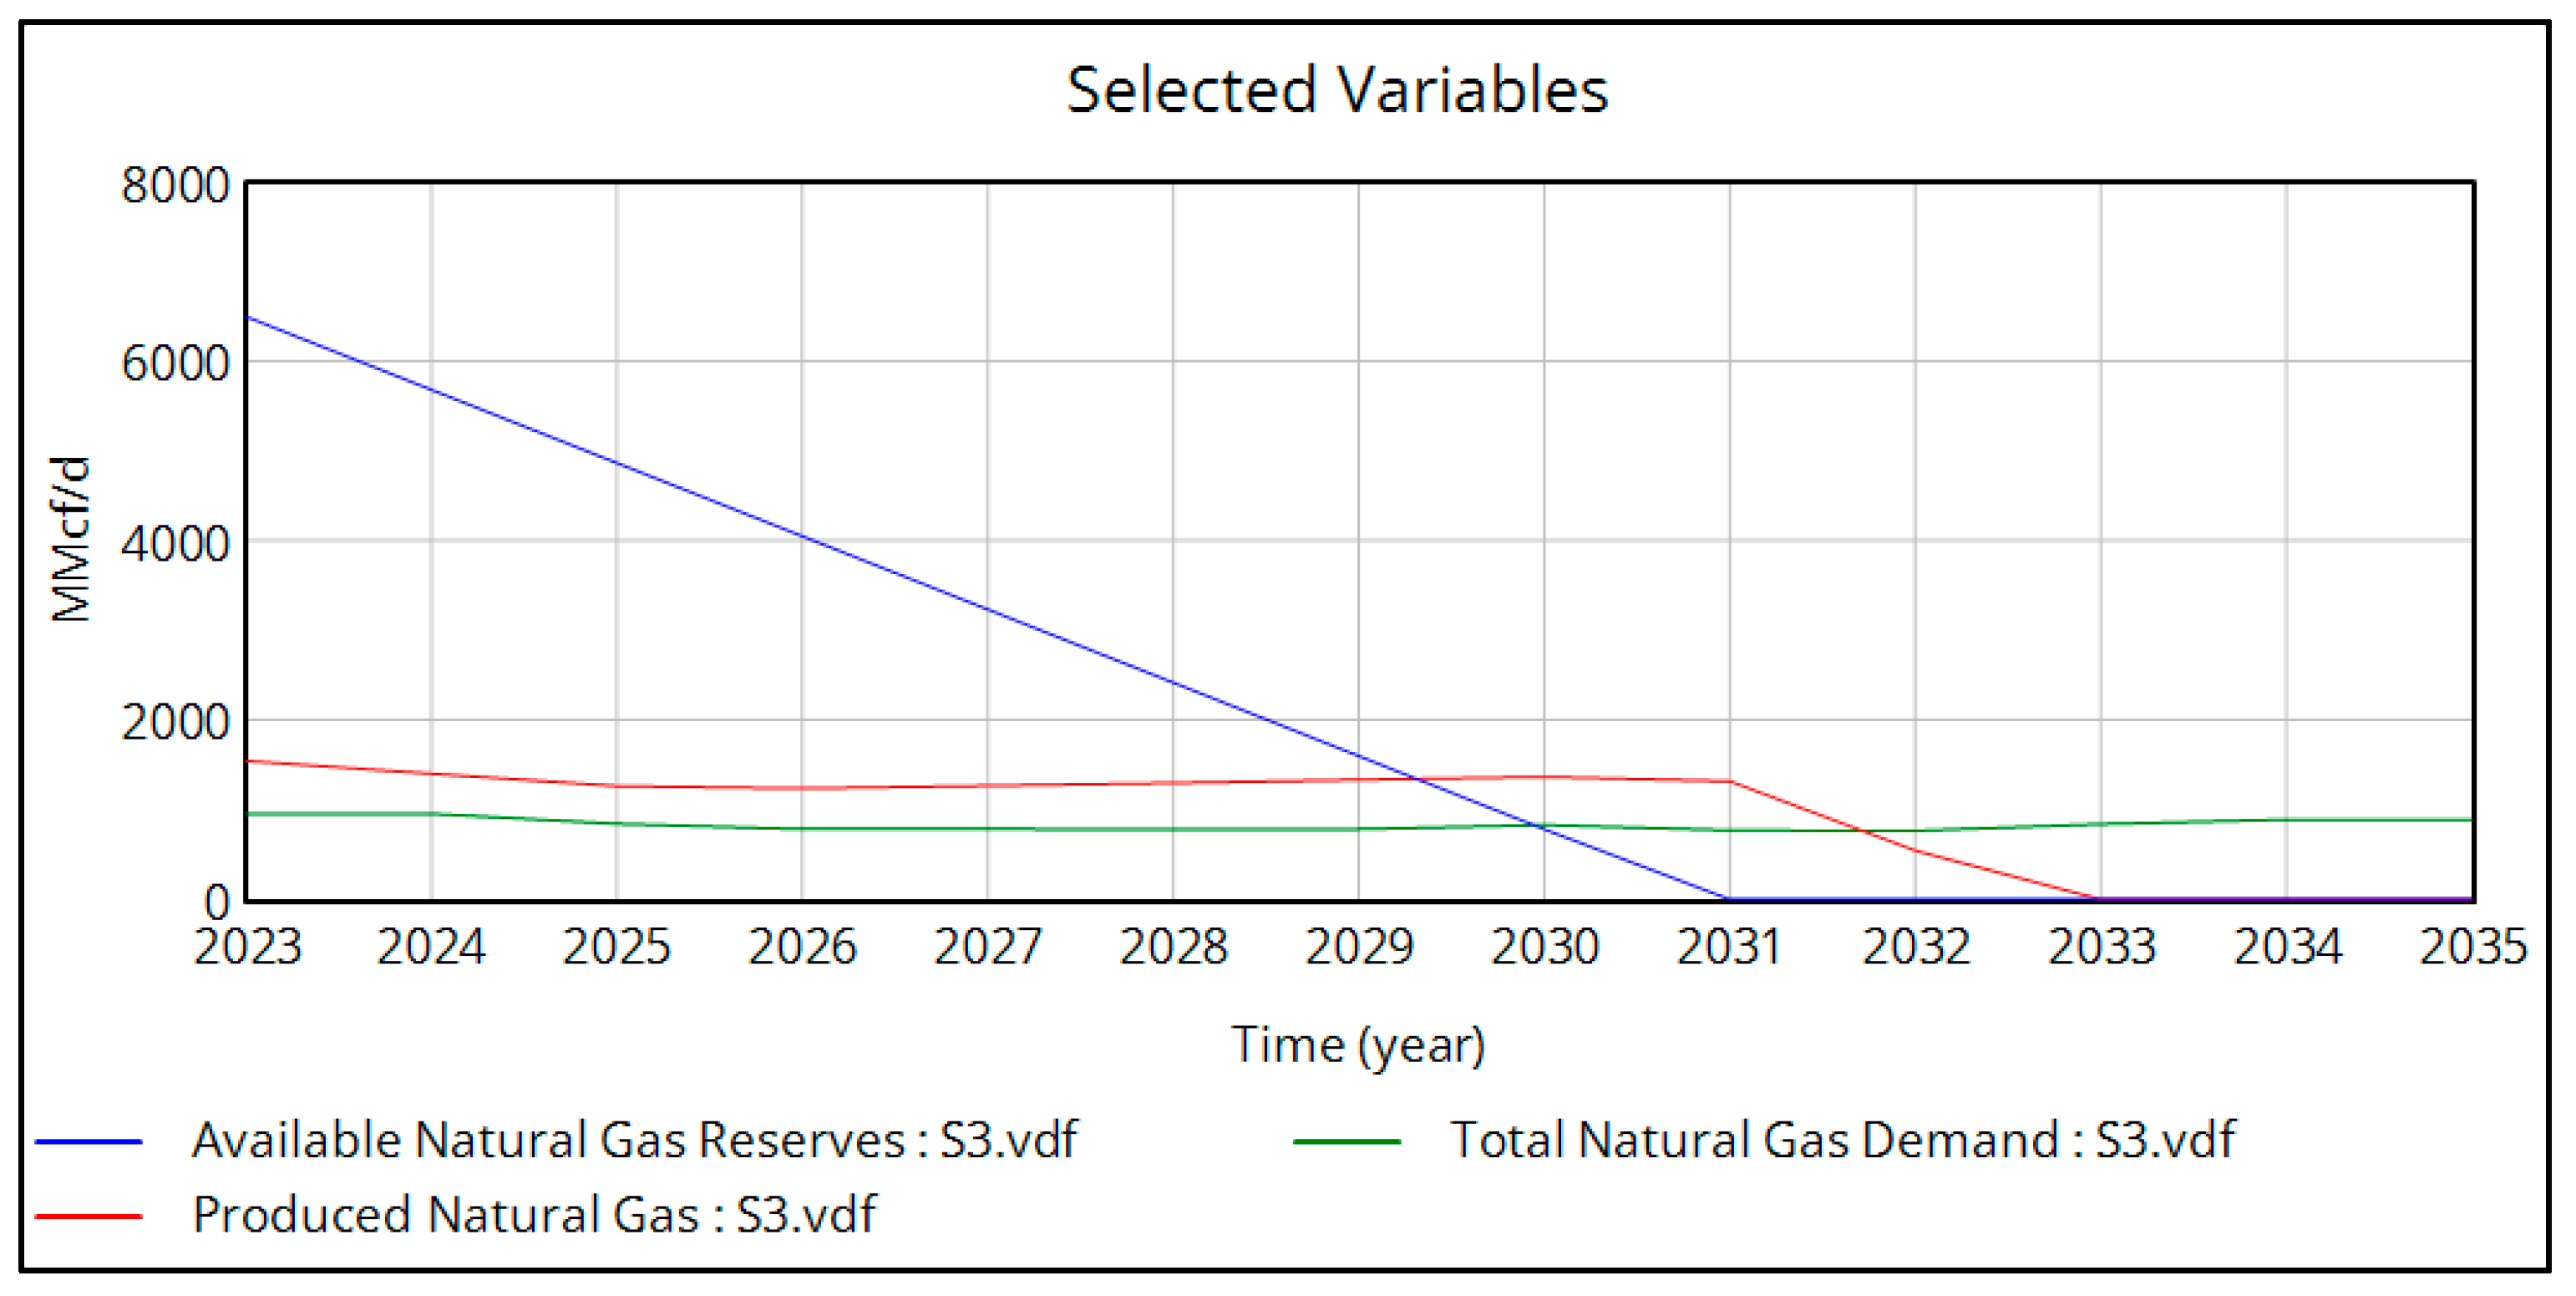
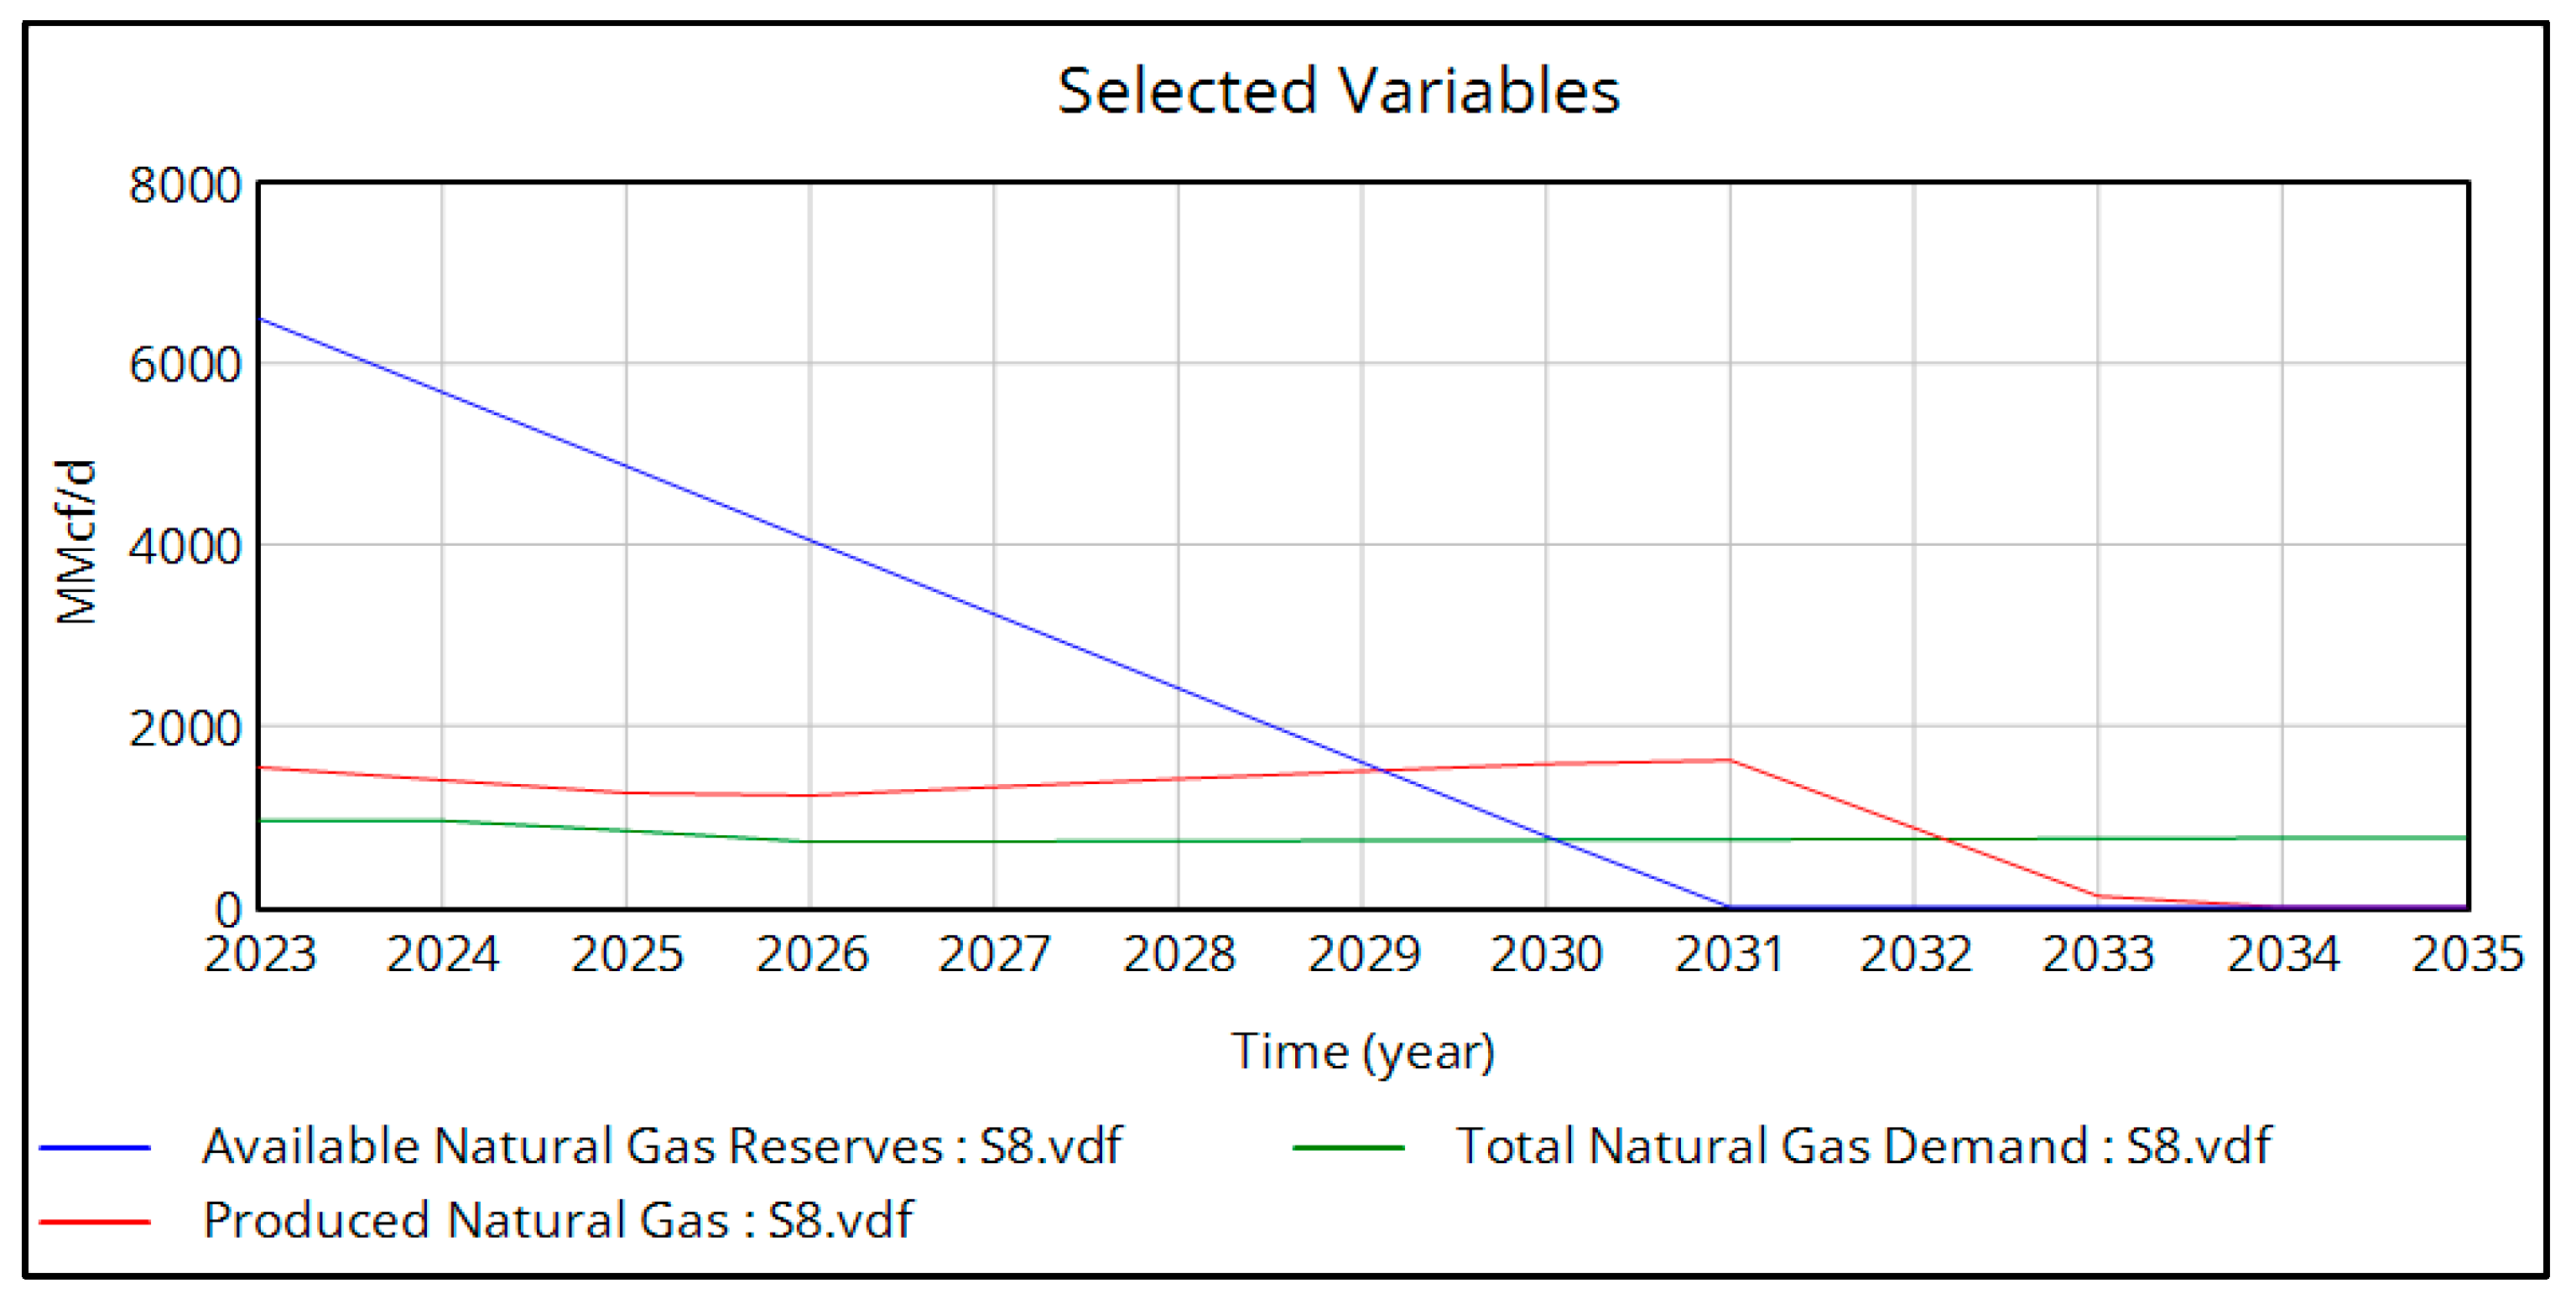
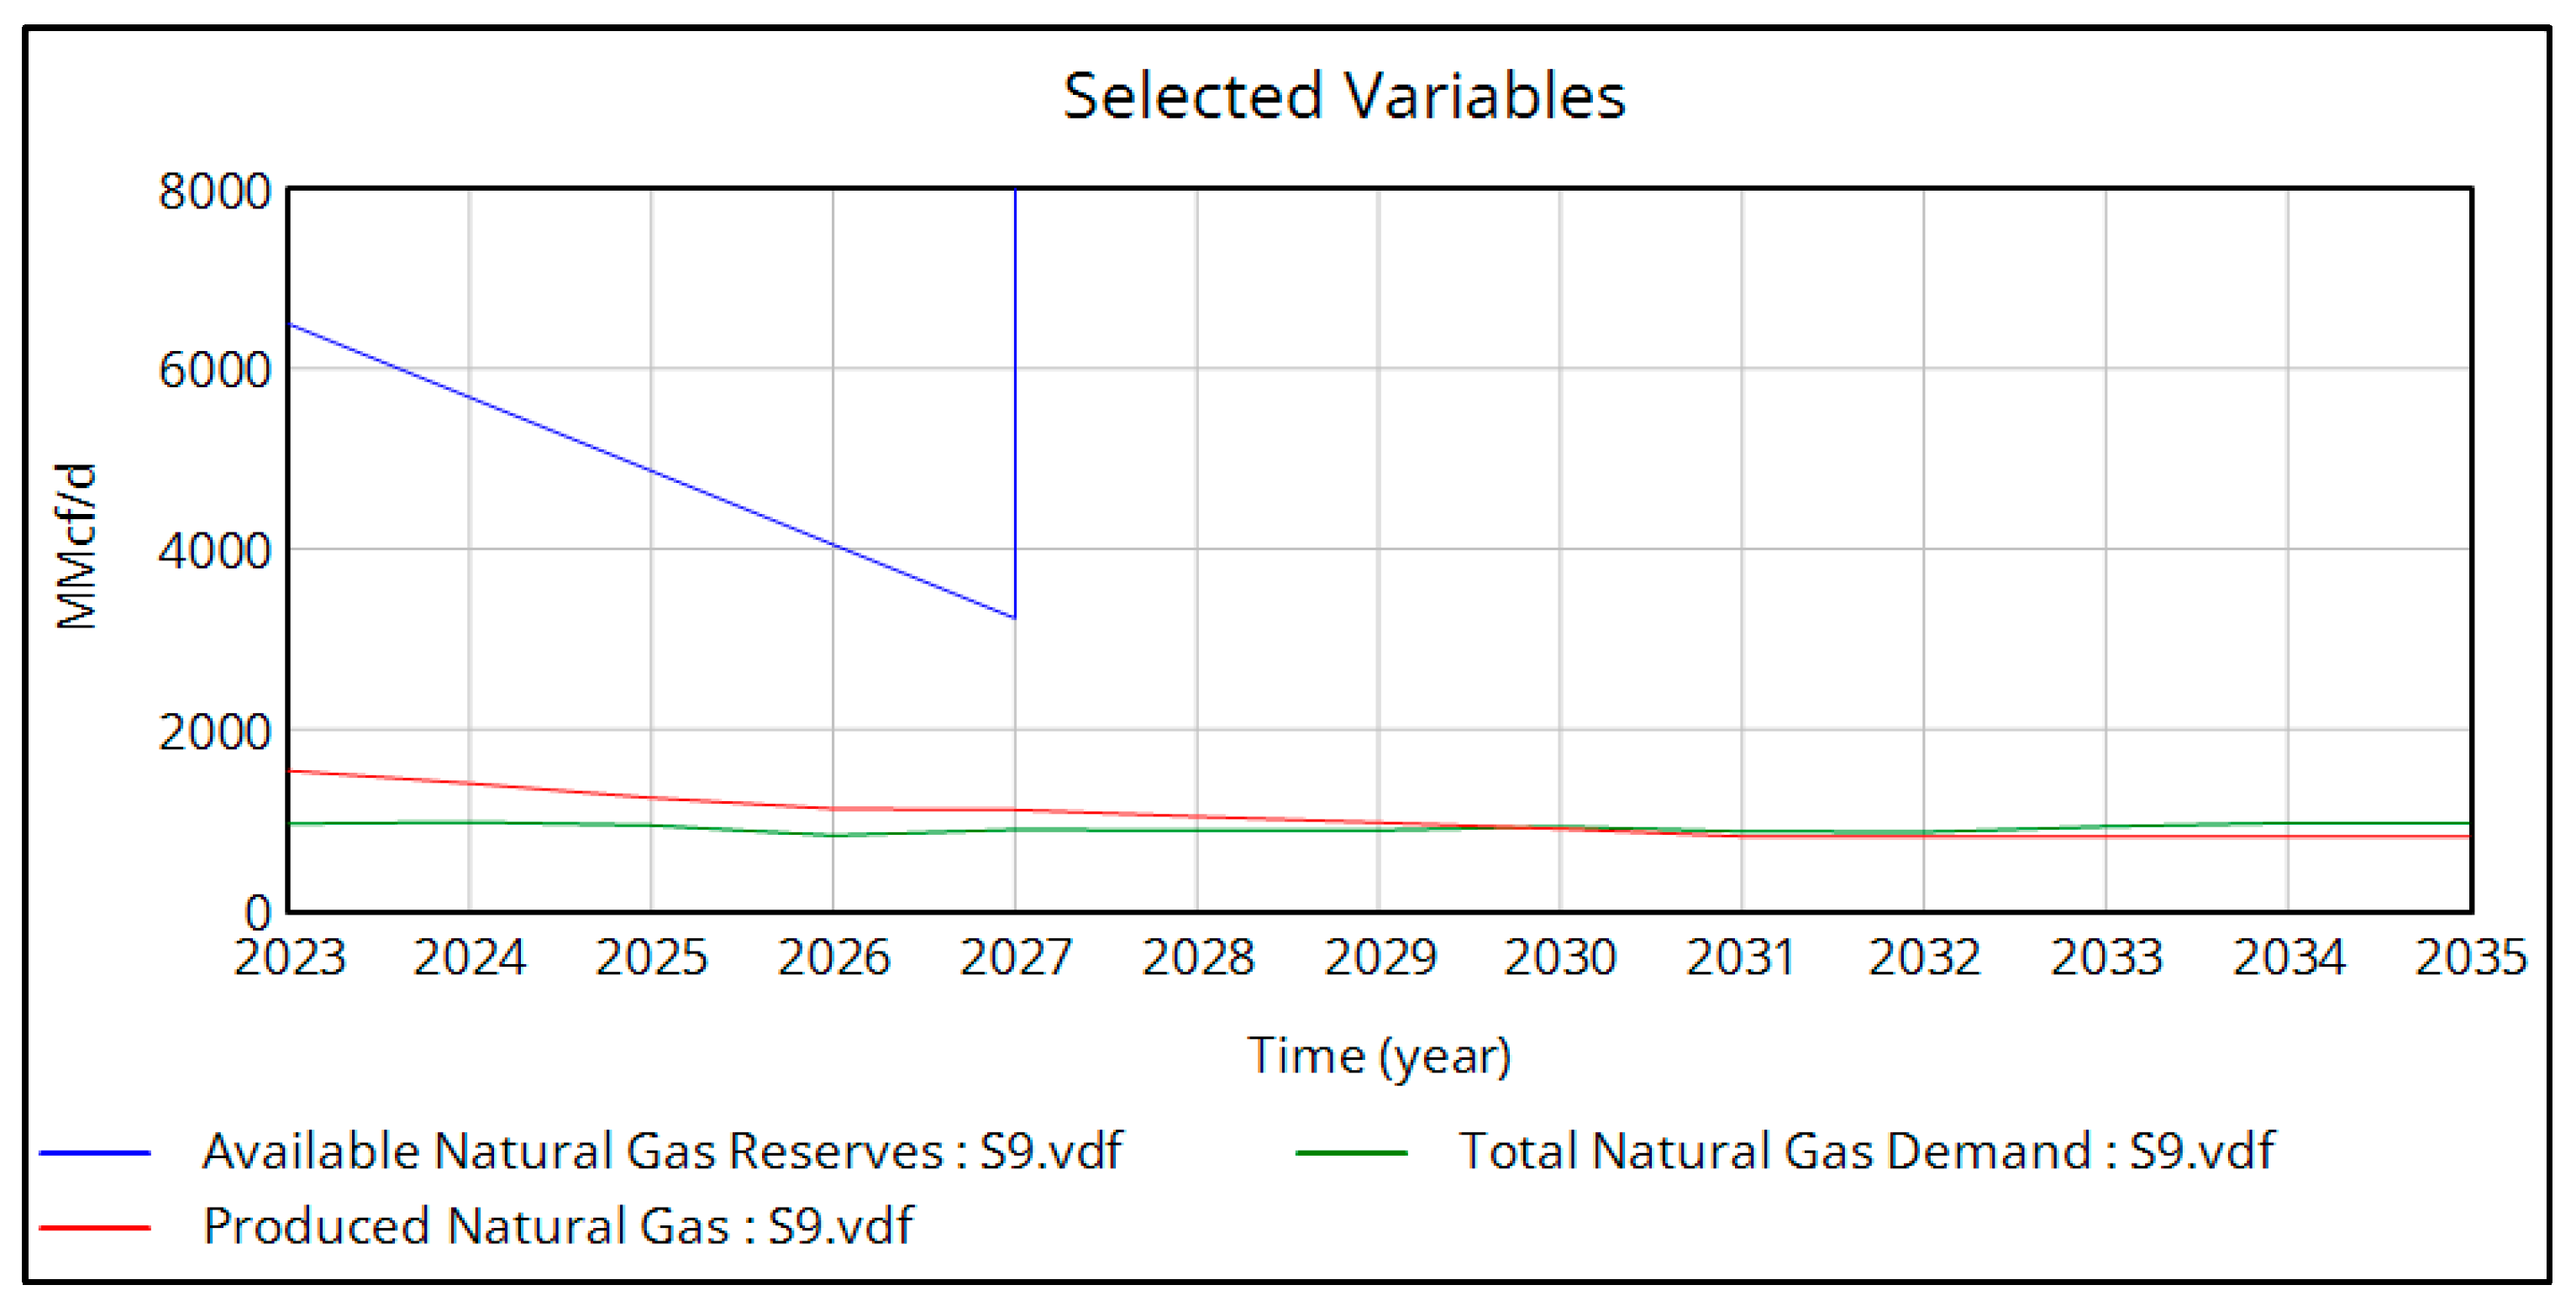
Figure 11,
Figure 12,
Figure 13,
Figure 14,
Figure 15,
Figure 16,
Figure 17,
Figure 18,
Figure 19,
Figure 20,
Figure 21 and
Figure 22 present the simulation results corresponding to the twelve scenarios.
6. Discussion
Table 6 presents a summary of the results regarding the depletion of natural gas reserves and production coverage under each scenario:
According to
Table 6, under current conditions in the integrated demand and supply model, Natural Gas Production meets 100% of projected demand until the second half of 2026 and is depleted by the second half of 2030.
In Scenarios 10 and 12, throughout the 2023–2035 period, Natural Gas Production consistently meets projected demand. These are the ideal scenarios under current national conditions. Both include the addition of gas from the new Sirius-2 well and expanded solar capacity projected by Unidad de Planeación Minero Energética (UPME).
It is important to note that, in Scenarios 4, 7, and 9, where the new well is included, there is still unmet demand—not due to a lack of gas, but because the extraction rate remains constant. This suggests that increasing the extraction rate would be necessary to meet projected consumption.
Without the addition of new gas reserves, Scenario 11 is the most favorable. It provides full demand coverage until the second half of 2033, even though reserves are depleted by 2030. This outcome is explained by a significant decline in projected demand, driven by two factors: (1) reduced gas use in the thermoelectric sector due to expanded wind and solar capacity, and (2) substitution of gas with hydrogen in industrial and transport sectors.
The constant extraction rate, coupled with reduced gas usage, results in accumulated reserves that extend gas availability.
Scenario 3, involving solar capacity expansion, offers a notable improvement over the initial model—extending 100% demand coverage from 2026-II to 2031-II. Combining wind energy expansion with hydrogen use (Scenario 5) yields the same demand coverage duration as Scenario 3—five additional years beyond the baseline scenario.
7. Conclusions
The results confirm that Colombia’s available natural gas reserves will be depleted by mid-2030, in line with projections reported by UPME. While alternative sources such as hydrogen, solar, and wind can significantly postpone the year of full demand coverage, they cannot eliminate the risk of depletion. Under current conditions, supply is sufficient to meet demand until the second half of 2026. With the integration of hydrogen, wind and solar energy, this coverage could be extended by up to seven years, reaching the second half of 2033. Nevertheless, ensuring long-term supply security requires the incorporation of new reserves, such as those expected from the Sirius-2 well in 2027.
Scenarios including the new well reveal that shortages arise not from a lack of gas but from a fixed extraction rate, highlighting the importance of adjusting production parameters to fully capture the benefits of new discoveries. By contrast, scenarios that combine renewable expansion with hydrogen integration demonstrate the highest potential for reducing gas dependence, even without new reserves.
This study provides decision-makers with valuable insights into how different policy and investment strategies could shape Colombia’s energy transition. In particular, it identifies which combinations of renewable integration and new exploration are most effective in extending natural gas availability. Future research should explore how adjustments to the extraction rate—accounting for infrastructure and transportation constraints—could further enhance Colombia’s natural gas security.
