Article

A Capacity Optimization Method of Ship Integrated Power System Based on Comprehensive Scenario Planning: Considering the Hydrogen Energy Storage System and Supercapacitor

1
School of Electrical Engineering, Yanshan University, Qinhuangdao 066004, China
2
Pujiang CJLU Gongxing Industrial Design Research Co., Ltd., Hangzhou 322299, China
*
Author to whom correspondence should be addressed.
Energies 2025, 18(19), 5305; https://doi.org/10.3390/en18195305
Submission received: 2 September 2025 / Revised: 1 October 2025 / Accepted: 5 October 2025 / Published: 8 October 2025

Abstract

Environmental pollution caused by shipping has always received great attention from the international community. Currently, due to the difficulty of fully electrifying medium- and large-scale ships, the hybrid energy ship power system (HESPS) will be the main type in the future. Considering the economic and long-term energy efficiency of ships, as well as the uncertainty of the output power of renewable energy units, this paper proposes an improved design for an integrated power system for large cruise ships, combining renewable energy and a hybrid energy storage system. An energy management strategy (EMS) based on time-gradient control and considering load dynamic response, as well as an energy storage power allocation method that considers the characteristics of energy storage devices, is designed. A bi-level power capacity optimization model, grounded in comprehensive scenario planning and aiming to optimize maximum return on equity, is constructed and resolved by utilizing an improved particle swarm optimization algorithm integrated with dynamic programming. Based on a large-scale cruise ship, the aforementioned method was investigated and compared to the conventional planning approach. It demonstrates that the implementation of this optimization method can significantly decrease costs, enhance revenue, and increase the return on equity from 5.15% to 8.66%.

1. Introduction

1.1. Background

Environmental pollution from the shipping industry is a pressing issue of international concern. The International Maritime Organization (IMO) has issued policies to reduce ship pollution, aiming to eliminate greenhouse gas emissions from international shipping in the 21st century. The 70th IMO Conference on Shipping Environmental Protection mandated that ships built after 2025 must have an energy efficiency design index (EEDI) at least 30% higher than that of ships built in 2005 [1,2]. Some countries have also proposed regional laws, such as China’s goal of achieving carbon neutrality by 2050 and a peak in carbon emissions by 2060 [3]. These mandatory emission reduction mandates compel the shipping industry to substantially decrease its reliance on fossil fuels and lower pollutant emissions. The conventional heavy fuel oil and diesel utilized by ocean-going vessels have struggled to comply with the pertinent regulations and standards. Consequently, the exploration of alternative fuels, renewable energy sources, and energy-efficient, environmentally friendly technologies has emerged as a pivotal development trajectory for the shipping sector.

1.2. Literature Review

In recent years, a variety of renewable energy technologies such as dual-fuel engines, solid oxide batteries, and photocatalysis have been demonstrated and applied on ships [4,5]. In addition to renewable energy technologies, photovoltaic or wind power generation technologies can be integrated into the ship system [6,7,8]. Zhang, W. et al. designed an energy management controller for a hybrid ship consisting of solar, ESS, and diesel generators, which takes the power required by the hybrid system as input and the power of the DC bus as output [6]. Gaber, M. et al. designed a ship that is entirely powered by solar energy, taking into account the design specifications of photovoltaic modules with regard to light intensity, angle, temperature, and illuminated surface area [7]. In addition to solar energy, wind power can also be integrated into hybrid energy systems for ship propulsion. Huang, X. et al. proposed a power generation scheme that combines wind and solar energy, wherein wind is utilized to drive the rotation of turbine blades, converting mechanical energy into electrical energy. This energy is then stored in batteries and ultimately used to power the ship [8]. For the ship energy storage system (SESS), Yang, X. et al. proposed a hybrid configuration approach that combines lithium batteries with supercapacitors for a raking suction dredger. They solved the optimization model by integrating the particle swarm optimization algorithm with a fitness value evaluation [9]. Lai, W. et al. established a capacity allocation strategy for energy storage devices based on a quadratic planning algorithm to obtain the optimal capacity allocation of lithium batteries and the efficiency of diesel generators [10]. Wen, S. et al. used the particle swarm optimization algorithm to analyze the cost of different energy storage system combinations and obtained the optimal energy storage type and capacity configuration [11]. Li, Y. et al. proposed a decision-making approach that utilizes the NSGA-II algorithm in conjunction with the cost–benefit method for optimizing the allocation of energy storage capacity in electric ships [12]. Wu, S. et al. proposed a method for determining power capacity that takes into account both energy density and load response, aiming to integrate reciprocating gas engines with the ship’s energy storage system [13]. Wu, N. et al. developed an integrated modeling approach for multi-objective optimization and evaluation of the ship’s energy system, which they solved using mixed integer nonlinear programming (MINLP) [14]. However, their study did not incorporate renewable energy units. In the realm of integrated energy systems for ships, existing projects often fail to simultaneously consider both renewable energy and energy storage systems (ESS).
In terms of capacity optimization and energy management of systems with renewable energy, most of the existing research focuses on terrestrial micro-grids. However, given that the integrated ship power system can be regarded as a “mobile isolated micro-grid” [15], research on capacity optimization and energy management in terrestrial micro-grids can also offer valuable insights and serve as a reference for this study [16,17,18]. Ju, C. et al. proposed a two-layer predictive energy management system (EMS) for a micro-grid that incorporates a hybrid energy storage system (HESS) comprising both batteries and supercapacitors. By integrating the degradation costs of the HESS, which are related to charging depth and lifetime, they modeled the long-term costs of batteries and supercapacitors and translated them into short-term costs associated with real-time operation [16]. Fang, S. et al. mixed the two types of ESSs and proposed a two-stage multi-objective optimization hybrid ESS management method [17]. Hassanzadeh Fard, H. et al. proposed an optimization framework to minimize the operating cost of a hybrid micro-grid that comprises a photovoltaic cell array, wind turbine, electrolytic cell, hydrogen storage system, converter, and fuel cell [18]. Considering the ship integrated energy system, existing studies primarily investigate methods to enhance the energy efficiency of real ships from the perspectives of optimal scheduling and operation management [19]. Xu, L. et al. proposed an economically viable heuristic optimization algorithm, namely the multi-population particle swarm optimization algorithm (MPPSO), to address the computational complexity and non-convexity of the energy scheduling problem in hybrid energy ship integrated power systems (HESIPS) [20]. In [21], Xu, L. et al. proposed an energy management optimization method for hybrid energy ship power systems (HESPS) based on the multi-population moth-flame adaptive optimization algorithm (AMFOMP). The proposed AMFOMP has a good performance in terms of total operating cost, GHG emissions, and feasibility, and can coordinate electrical and thermal energy among its components. However, energy management and optimal scheduling require a scientifically and reasonably designed power capacity. Most of the existing literature focuses on optimizing the overall capacity of traditional engines and energy storage systems, without considering the optimization of renewable energy generation equipment capacity and the specific power distribution of energy storage systems.

1.3. Contribution

Inspired by the above challenges and considering the uncertainty of the output power of renewable energy units, this paper proposes an optimal planning method for the power capacity of the hybrid energy ship integrated power system (HESIPS) based on comprehensive scenario planning (COMP). The main contributions of this paper are as follows:
  • This paper proposes an improved design for the integrated power system (IPS) of a large cruise ship, incorporating renewable energy and a hybrid energy storage system. The power generation unit comprises a photovoltaic power generation system, diesel engines, and micro gas turbines, while the hybrid energy storage system integrates a hydrogen storage system and a supercapacitor.
  • A bi-level optimal power capacity configuration model is established, which integrates planning and operation. The upper layer optimizes the capacity of each power generation unit, aiming to maximize the HEIPS’s Return on Equity (ROE) under COMP. The lower layer allocates the power deficit from the upper layer to the hybrid energy storage systems (HESS), determines the corresponding equipment capacities, and feeds this information back to the upper tier for iterative optimization.
  • Within this bi-level framework, we propose an energy control strategy based on time gradient control has been proposed, which takes into account the dynamic response of the load. Additionally, an energy storage power allocation method that considers the characteristics of energy storage devices has been developed. These methods can dynamically adjust the charging and discharging strategy of the energy storage system according to the real-time operating conditions of HESIPS.
This study is organized as follows: Section 2 establishes the mathematical model of the ship’s IPS, energy management strategy, and energy storage allocation method. Section 3.1 describes the COMP method. Section 3.2 describes the optimization objectives, constraints, and algorithms. Section 4 presents the case study and discusses the results. Section 5 summarizes the conclusions and main contributions of this paper.

2. Modeling and Control of Hybrid Energy Ship Power System

This study designs, models, and optimizes the ship’s integrated energy system for a large-scale cruise ship that sails year-round in the Bahamas and the Eastern Caribbean with an average capacity of approximately > 5500 passengers. The ship is 360 m long and 47 m wide, details of which can be found in Section 5.
The integrated ship model is constructed based on a hybrid energy power system (Figure 1), employing an all-electric propulsion configuration. The power generation unit comprises photovoltaic cells (PV), a diesel engine (DE), and a micro-gas turbine (MG). DE features a small single module capacity, enabling rapid start-up and load response with excellent dynamic performance. MG, characterized by high rotational speed and power density, serves as an effective power balancing solution for sudden power demands and minor power shortages, thereby minimizing the need for frequent DE startups and shutdowns. The HESS, composed of a hydrogen energy storage system and a supercapacitor, balances the power between the power source and the load. Furthermore, since DE and MG produce AC output, conversion to DC is necessary between the generator sets and the energy storage system. In summary, IPS comprises numerous highly coupled devices, some of which are costly. Therefore, a prudent capacity configuration strategy is crucial for ensuring that the ship operates economically while adhering to green and low-carbon standards.

2.1. Subsystem Modeling

2.1.1. Photovoltaic Power Model (PV)

PV system comprises a plywood PV system and a simulated cruise ship cabin PV system [22]. Within the cruise ship cabin PV system, each cabin balcony is equipped with two modules, each measuring 250 × 50 cm2 in area and containing 48 cells. With a photoelectric conversion efficiency of 22%, the PV power can be calculated as follows:
P p v . s . t = 0.22 A p v I t
where A p v is the total area built for PV on the cabin balcony and plywood, and I t is the total irradiance during the voyage.

2.1.2. Diesel Engine (DE)

Operating at extreme power levels and excessive power ramp rates not only impairs the physical properties of the internal components of DE but also diminishes its overall service life. Consequently, the output limits and power ramp rates for DE are specified as follows:
P d i e s e l P d i e s e l . max P d i e s e l . s . t P d i e s e l . s . t 1 P d i e s e l + P d i e s e l . max
where P d i e s e l + and P d i e s e l represent the maximum climbing power and landslide power ratio coefficient of DE.
P d i e s e l . min P d i e s e l . s . t P d i e s e l . max
where P d i e s e l . min and P d i e s e l . max represent the minimum and maximum output power of DE, P d i e s e l . s . t denotes the actual output power at time t under case s.

2.1.3. Micro-Gas Turbine (MG)

Comparable to DE, the output limitations and power ramp rates of MG are outlined as follows:
P g a s P g a s . max P g a s . s . t P g a s . s . t 1 P g a s + P g a s . max
where P g a s + and P g a s represent the maximum climbing power and landslide power of the ratio coefficient MG.
P g a s . min P g a s . s . t P g a s . max
where P g a s . min and P g a s . max represent the minimum and maximum output power of the MG, P g a s . s . t denotes the actual output power at time t under case s.

2.1.4. Hydrogen Energy Storage System

The hydrogen energy storage system primarily consists of three key components: an electrolytic cell (EC), hydrogen storage equipment (HSE), and a fuel cell (FC). EC generates hydrogen through the electrolysis of water, while HSE is responsible for storing the produced hydrogen. When power is required, FC converts the stored chemical energy of the hydrogen into electricity to supply the load.
n H 2 = P e l e . s . t η E L E / H H H V
P f u . s . t = n H 2 H H H V η F U
Q t . s . t = n H 2 η S T H
where n H 2 represents the amount of hydrogen produced, H H H V denotes the heating value of hydrogen, which stands at 0.039 MWh/kg; P e l e . s . t signifies the input power of EC, while P f u . s . t indicates the output power of FC; Q t . s . t denotes the amount of hydrogen stored in HSE; the subscript s.t represents the time t under case s. The electrolysis efficiency of EC, the conversion efficiency of FC, and the storage efficiency of HESS are denoted by η E L E , η F U , η S T H , respectively.
The current amount of hydrogen stored in the hydrogen storage equipment is utilized to define the state of charge (SOC) of the hydrogen energy storage system, and the calculation formula is as follows:
S O C h y . s . t = Q t . s . t Q N
where Q N represents the rated hydrogen storage capacity of HSE.

2.1.5. Supercapacitor

The output characteristics of the SC are expressed in SOC. The output of the energy storage device and the remaining power in the charging and discharging states are as follows:
S O C c . s . t = S O C c . s . t 1 P cab . s . t η C Δ t / E n         P cab . s . t < 0 S O C c . s . t = S O C c . s . t 1 P c a b . s . t Δ t / ( η D E n )   P cab . s . t > 0
E c . s . t = E c . s . t 1 σ c s d r Δ t E c . s . t 1 P cab . s . t Δ t η C         P cab . s . t < 0 E c . s . t = E c . s . t 1 σ c s d r Δ t E c . s . t 1 P c a b . s . t Δ t η D       P cab . s . t > 0
where S O C c . s . t denotes the SOC of SC; P cab . s . t represents the charging or discharging power of SC, respectively, taking negative values during charging and positive values during discharging; η C , η D are the charging and discharging efficiencies of SC, both assumed to be 95%; E n is the rated capacity of SC, σ c s d r is the self-discharge rate of SC (per minute), which translates to 0.05%/h, Δ t represents the time interval.

2.1.6. Load Model

The power demand of ships at sea can be categorized into propulsion load and service load.
P l o a d . s . t = P p r o . s . t + P s e r . s . t
where P p r o . s . t and P s e r . s . t represent the propulsion load and service load.

2.2. Analysis of Hybrid Energy Storage Characteristics

The key to hydrogen energy storage systems lies in EC. In comparison to traditional hydrogen production methods, electrolytic hydrogen production boasts lower environmental pollution and higher conversion efficiency. Currently, ensuring the safety and efficiency of EC during the hydrolysis process for hydrogen production is a focal area of research within the hydrogen energy storage domain. Consequently, a thorough analysis of the efficiency characteristics of EC is of paramount importance. This paper will delve into the efficiency properties of Proton Exchange Membrane (PEM) electrolytic cells.
The efficiency of PEM pertains to the water electrolysis efficiency of the equipment under constant temperature and pressure conditions. This efficiency is primarily influenced by two factors: current efficiency and voltage efficiency [23]. The overall efficiency of the EC can be mathematically expressed as follows:
η E L E = η I η U
where η I and η U represent the current efficiency and voltage efficiency.
At the rated operating state, the current efficiency approximates 100%, and under constant temperature conditions of 313.5 K, the current efficiency can be mathematically represented as follows:
η I = 96.5 e 0.09 / I 75.5 / I 2
The voltage efficiency of EC can be expressed as the ratio of thermo-neutral voltage U tn to the electrolytic voltage U E L E :
η U = U tn U E L E × 100 %
U E L E = U r e v + U v d r + U H 2 + U o 2
where U r e v represents the reversible voltage at the operating temperature and pressure, U v d r denotes the voltage drop attributable to resistance; U H 2 signifies the hydrogen super-potential, and U o 2 indicates the oxygen super-potential, both generated at a constant current density under the specified operating temperature.
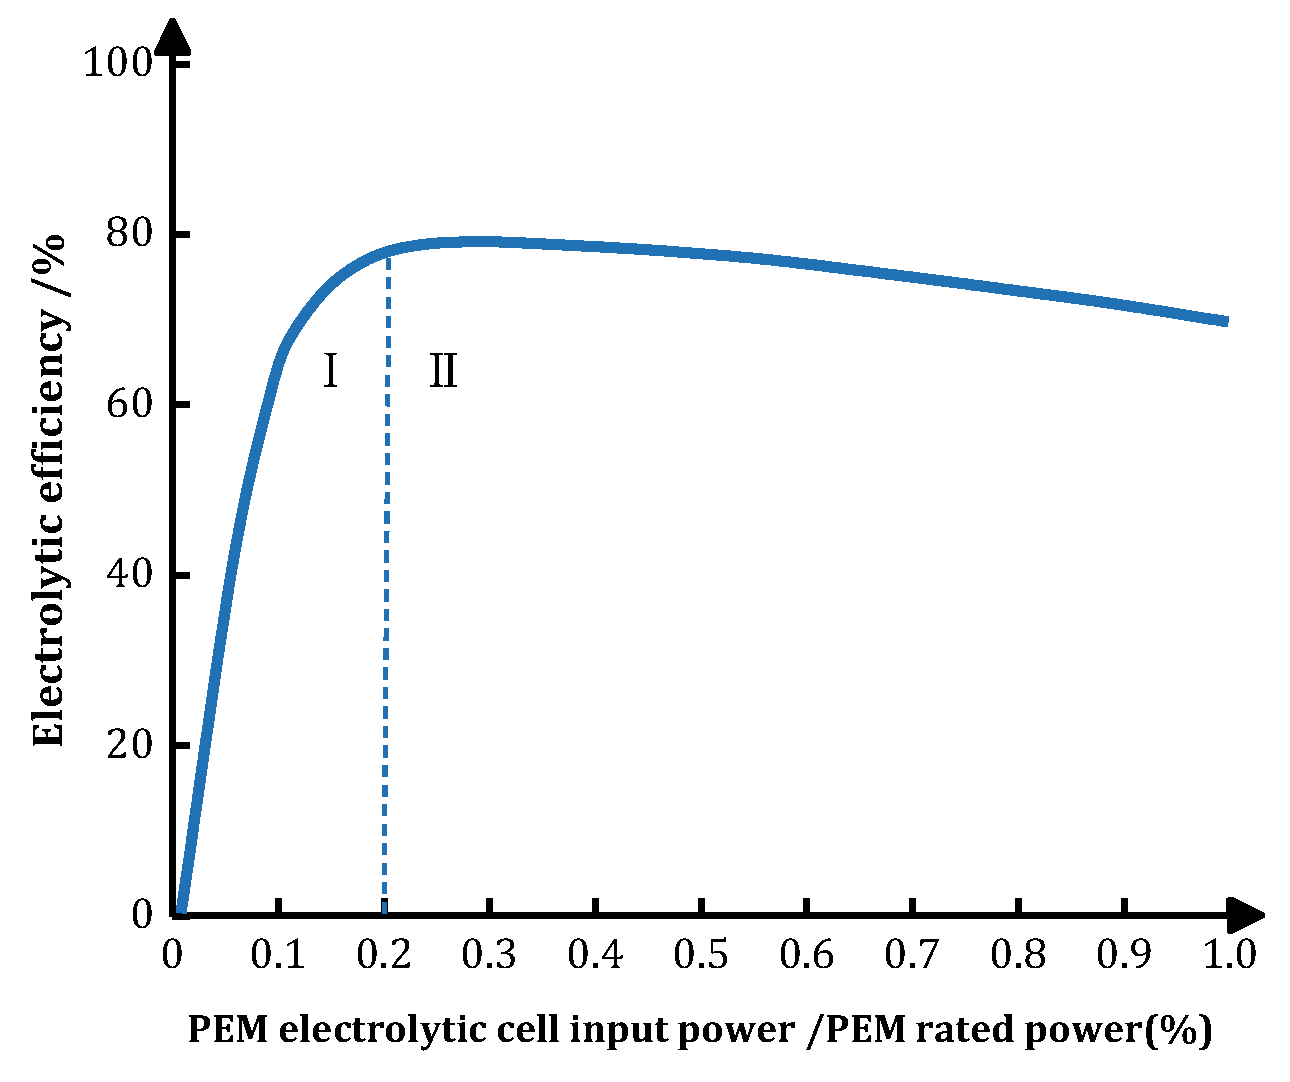
Based on the research cited in reference [24], the correlation between the efficiency of the EC and its input power is illustrated in Figure 2. The observation reveals that the efficiency of EC enhances as the input power increases, ultimately peaking when this power reaches approximately 80%, as shown in Figure 2. However, as the input power further increases beyond its optimal level, the efficiency of EC begins to decline gradually, ultimately decreasing to approximately 70% at the rated power. This underscores the notion that EC operates most efficiently at a particular power point [25]. The focus of this study’s optimal configuration problem is on achieving the overall optimal state of the system.
Consequently, EC should operate within a relatively optimal power range. In region I, where the input power is low, both EC efficiency and hydrogen production are correspondingly low. Conversely, in region II, where the input power is higher, EC efficiency reaches a superior level, resulting in a hydrogen production rate that surpasses that of region I. Taking into account both efficiency and hydrogen production capacity, region II emerges as the optimal operating range for the EC.
The advantages of SC, including their safety, reduced toxicity, and minimal fire hazard, align well with the requirements of ship power systems. When compared to lithium batteries, from a durability standpoint, SC can offer a cycle life that surpasses 100,000 cycles, with some reaching up to 500,000 cycles—a figure that exceeds that of lithium batteries by more than 50 times. Although SC cost 3–5 times more than lithium-ion batteries, they offer a trouble-free operational lifespan of 8–10 years with minimal maintenance requirements and high reliability. From an application perspective, the current mainstream charging rates for lithium batteries range from 1C to 3C, with the fastest mass-produced models capable of reaching 6C. In contrast, SC offers charging speeds within 1 to 30 s. When comparing battery and SC systems, the physical footprint required by an SC-based system is just 9% to 15% of that needed for a battery system. Under equivalent power and duration requirements, the cost of an SC system may amount to 10% to 20% of that of a battery-based system. Meanwhile, lithium batteries impose stringent temperature requirements, whereas SC offer flexible charging and discharging capabilities between −40 °C and 65 °C, allowing them to adapt to virtually all ambient temperatures encountered during a ship’s navigation.

2.3. Energy Storage Power Distribution Method Considering Device Characteristics (ESPD)

The energy storage power allocation method is shown in Figure 3, when the total energy storage is in a state of charge where the generated power exceeds the load demand, P p v . s . t + P g a s . s . t + P d i e s e l . s . t > P l o a d . s . t , that is, P E S S . s . t < 0 , EC and SC are activated, while FC is deactivated. Subsequently, the amount of hydrogen must be updated each time: Q t + 1 = Q t + P e l e . s . t η E L E / H H H V .
  • Mode 1 (SC charging normally): when the system meets | P E S S . s . t | P c a b . s . t c h , SC is charged, the absorbed power is | P E S S . s . t | = P c a b . s . t . ( P c a b . s . t c h defined as the maximum allowable value of SC charging power, Equation (35)).
  • Mode 2 (SC charging normally, EC operating in the optimal interval): when the system meets | P E S S . s . t | > P c a b . s . t c h , | P E S S . s . t | > P E L E . min and | P E S S . s . t | P c a b . s . t P E L E . min , SC is charged first P c a b . s . t = P c a b . s . t c h . EC absorbs the residual power P e l e . s . t = | P E S S . s . t | P c a b . s . t . .
  • Mode 3 (SC charging partially, EC operating in the optimal interval): when the system meets | P E S S . s . t | > P c a b . s . t c h , | P E S S . s . t | > P E L E . m i n and | P E S S . s . t | P c a b . s . t c h < P E L E . m i n . EC absorbs the power first P e l e . s . t = P E L E . min and SC is charged second P c a b . s . t = | P E S S . s . t | P E L E . m i n .
  • Mode 4 (SC charging normally, EC operating outside the optimal interval): when the system meets | P E S S . s . t | > P c a b . s . t c h , | P E S S . s . t | P E L E . min , SC is charged first P c a b . s . t = P c a b . s . t c h . EC absorbs the residual power P e l e . s . t = | P E S S . s . t | P c a b . s . t . .
When the entire energy storage system is in a discharge state, where P p ν . s . t + P g a s . s . t + P d i e s e l . s . t P l o a d . s . t , implying P E S S . s . t > 0 , are operational, while EC is deactivated. The quantity of hydrogen must be updated iteratively as follows: Q t + 1 = Q t P f u . s . t / H H H V η F U .
  • Mode 5 (SC discharging normally): when the system meets P E S S . t P c a b . s . t dis , SC is charged, the absorbed power is P E S S . s . t = P c a b . s . t ( P c a b . s . t dis defined as the maximum allowable value of SC charging power, Equation (35)).
  • Mode 6 (SC and FC discharging normally): when the system meets P E S S . t > P c a b . s . t dis , SC is charged first, and the absorbed power is P c a b . s . t = P c a b . s . t dis . FC is then discharged P f u . s . t = P E S S . s . t P c a b . s . t .

2.4. EMS Based on Time Gradient Control and Considering Dynamic Load Response

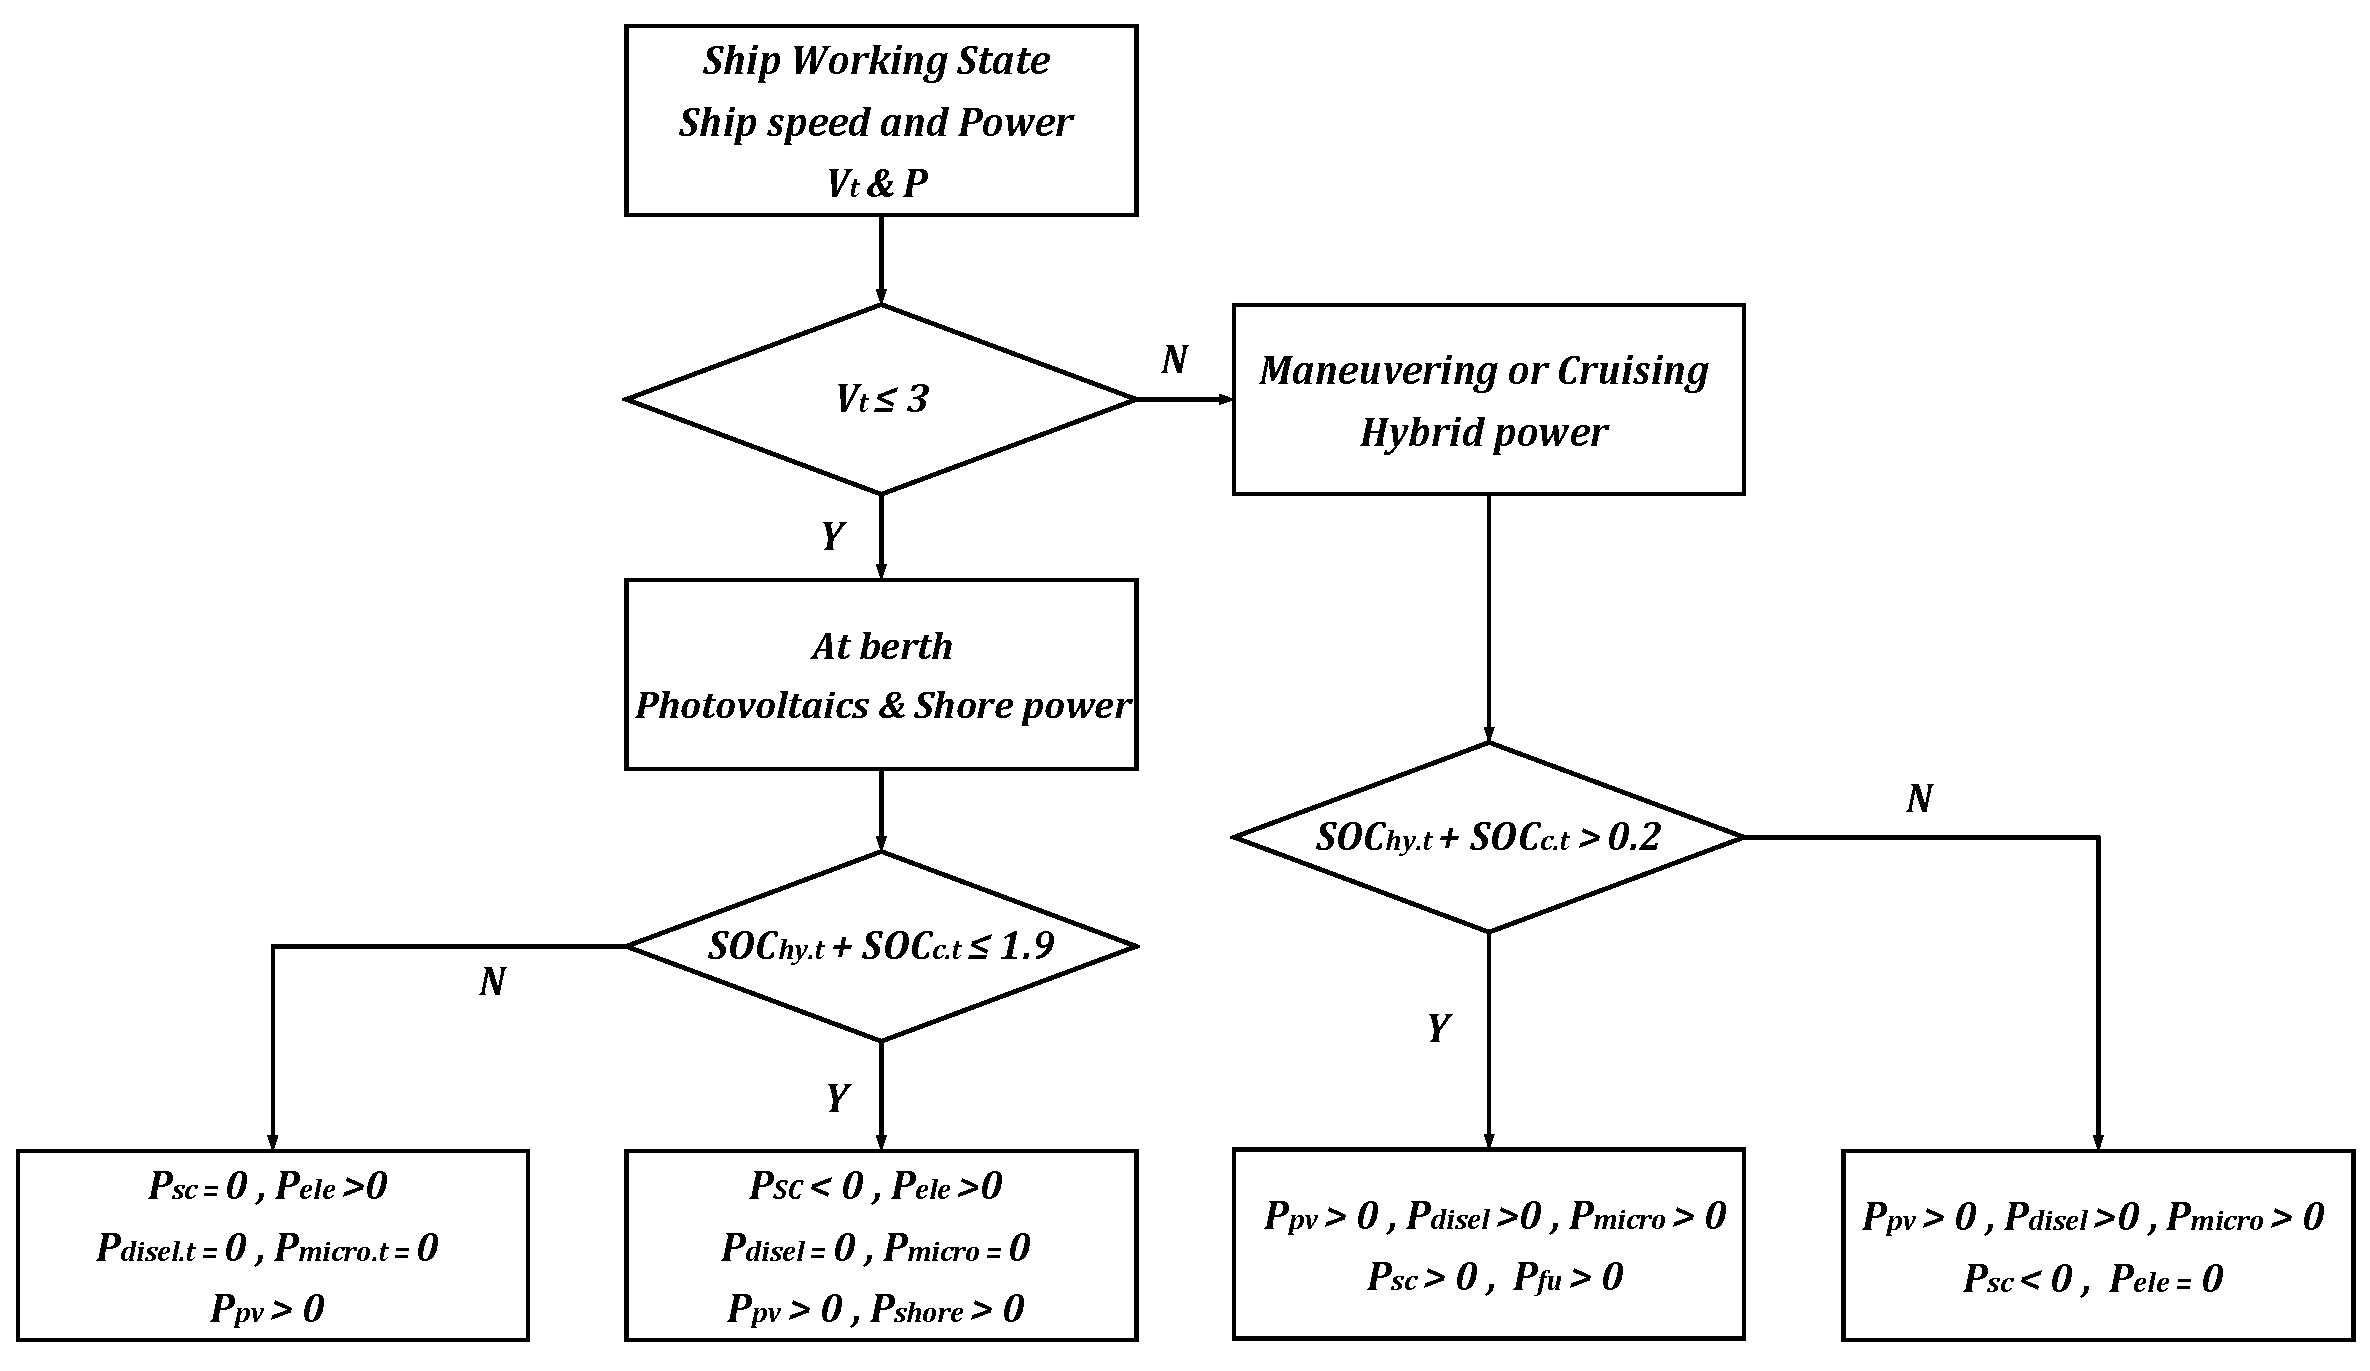
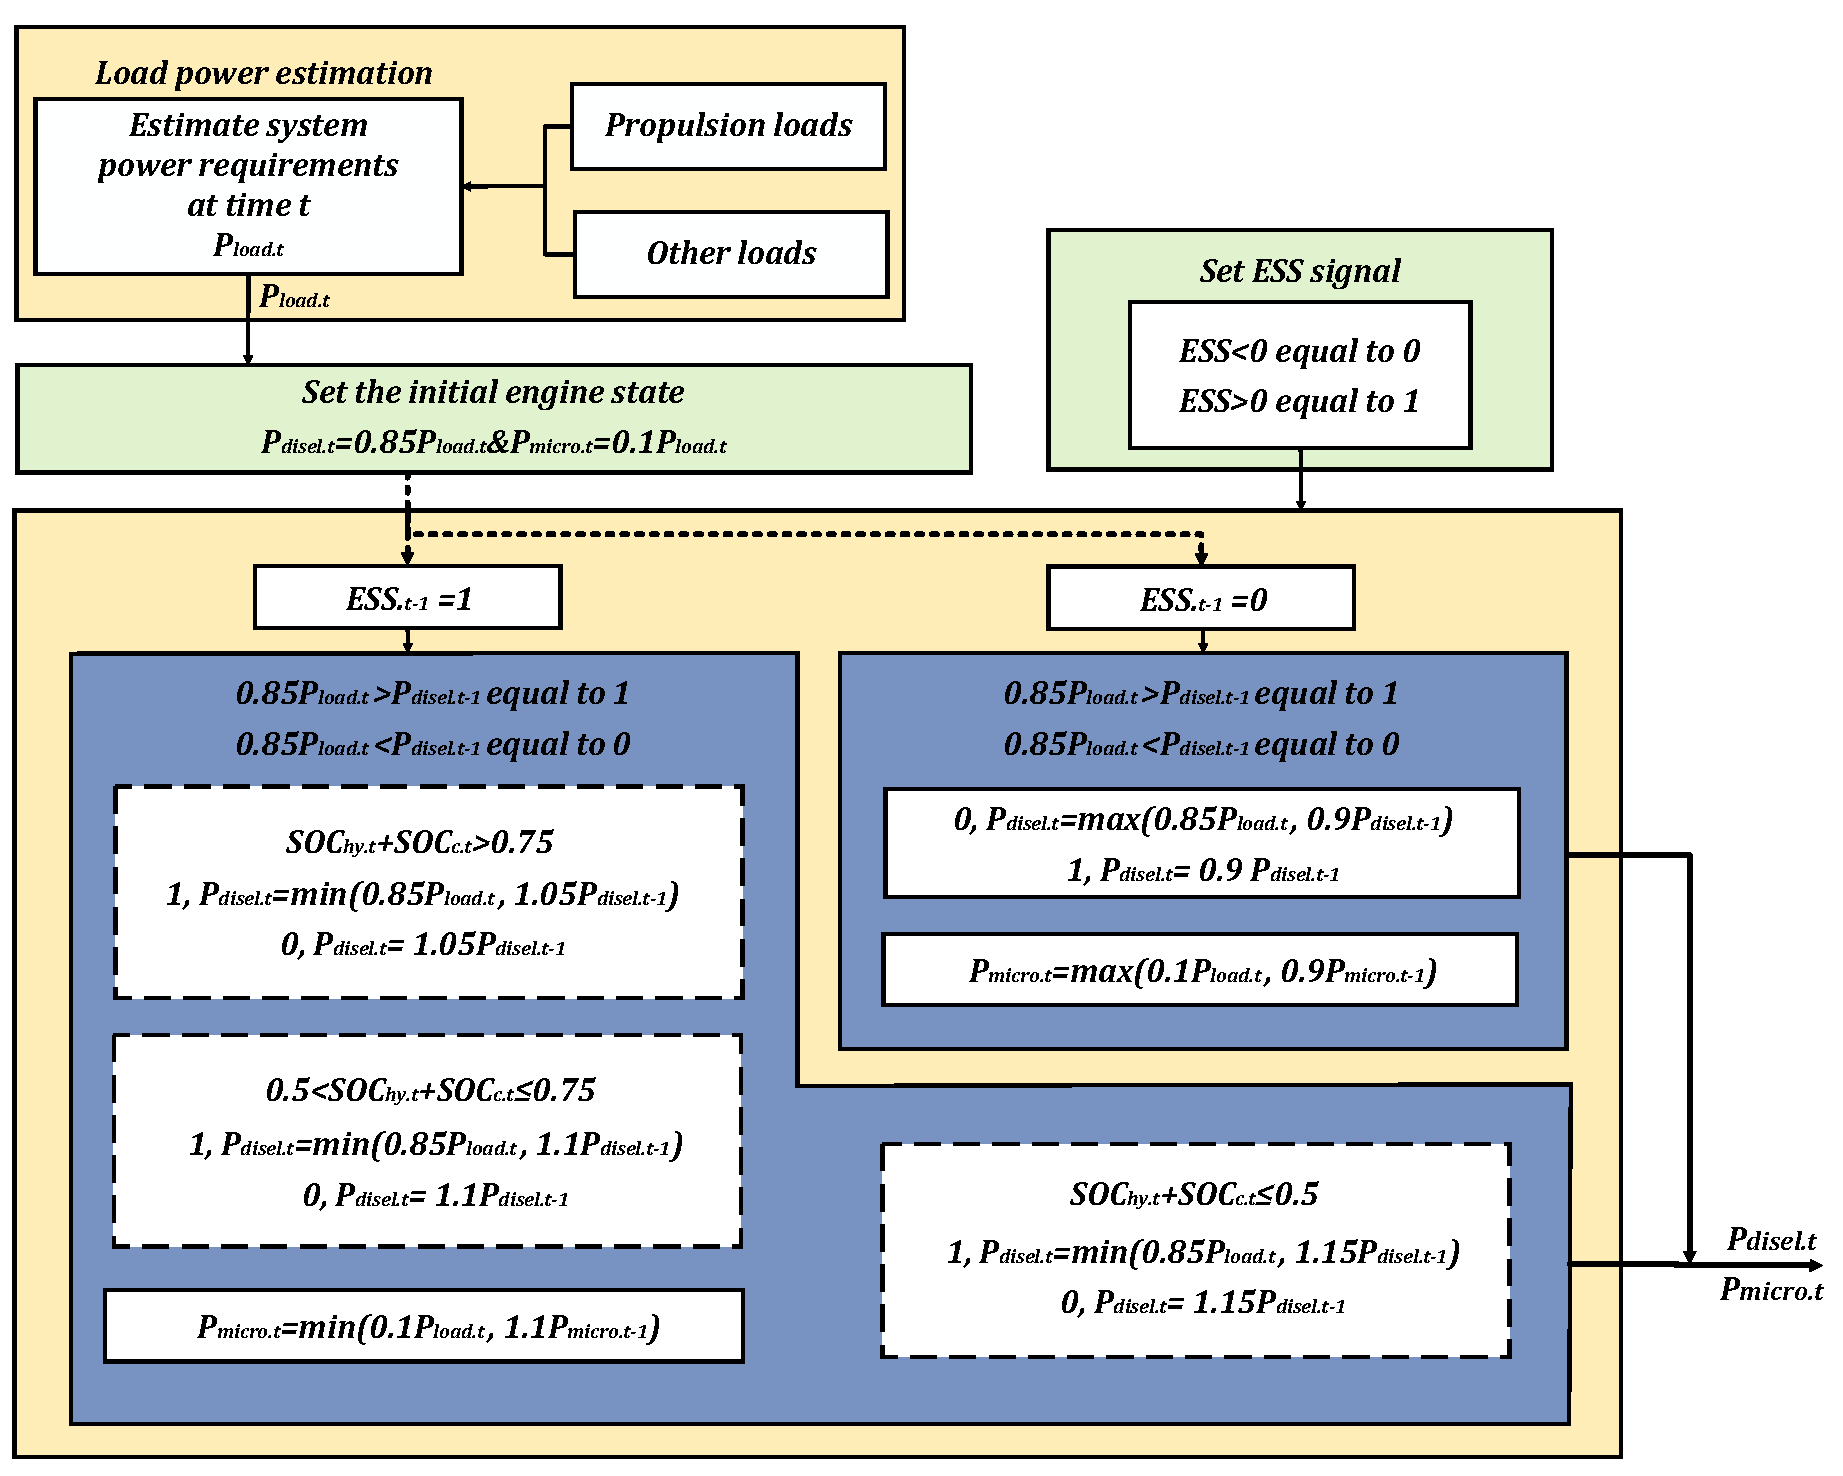
To achieve power balance between the engine and the energy storage system, an energy management strategy (EMS) was established, incorporating time gradient control and accounting for the dynamic load response. This strategy facilitates seamless power coordination and distribution between the engine and the energy storage system, as depicted in Figure 4. The EMS operates by classifying ship speeds and identifying the ship’s operational status, which is categorized into three distinct types: berthing and anchoring (0–3 knots), maneuvering (3–5 knots), and cruising (over 5 knots) [26]. The required power capacity during operation is determined by distributing the total power demand of the ship. When the ship is berthed, its main propulsion engine is shut down, and instead, PV and shore power supply the ship’s operational load while also charging the HESS, when leaving the port, S O C t = 0 = 2 . During the berthing process, if S O C h y . s . t + S O C c . s . t 1.9 and specifically, S O C h y . s . t = 1 , indicating that HSE has reached its storage capacity limit, PV will supply power to EC for water electrolysis to produce hydrogen.
This hydrogen can then be sold to generate profits. Upon entering the maneuvering state, the system adopts a flexible approach, with power being supplied jointly by the power generation unit and HESS in a hybrid mode. To ensure system reliability in emergency situations, it is imperative to maintain at least one DE in operation. After the cruise, the propulsion load is shared between DE and MG, while other loads are powered collaboratively by PV panels and HESS in a hybrid operation mode. If the output power of PV is low, DG and MG will provide power based on real-time demand. The power dispatch is controlled by assessing the SOC of both energy storage components and the ship’s operational status. In both maneuvering and cruising states, DE primarily provides power while maintaining a load point close to 85%. HESS then supplements the required power based on its SOC. If S O C h y . s . t + S O C c . s . t 0.2 , HESS will be charged either by shore power or by the power generation unit, depending on the ship’s location.
Considering the load dynamic response and SOC of HESS, the EMS is designed to obtain precise power distribution between the engine and ESS. Specifically, adjustments to the engine’s real-time power output are made based on the SOC signal from the previous time step of the ESS. The determination of the engine’s output power is influenced by both the SOC and the load response, as shown in Figure 5.

3. Optimization Model

In this section, the optimization model comprises a COMP model addressing the uncertainty of PV power and a bi-level capacity optimization model for integrated marine power systems. The output results of the former serve as the data foundation for the latter in subsequent optimization processes.

3.1. Comprehensive Scenario Planning Model (COMP)

The unpredictability of PV power generation increases the complexity of system design. Overlooking this uncertainty introduces a significant risk of suboptimal decision-making during the planning phase [27]. When utilizing a probability model to characterize the uncertainty of PV power, it is commonly presumed that the light intensity conforms to a particular distribution, such as the Beta distribution. Essentially, this involves a parameter estimation problem, which necessitates the incorporation of subjective prior knowledge. The selection of parameter values significantly influences the precision of the model. Therefore, this paper adopts nonparametric kernel density estimation as a means to delineate the uncertainty associated with PV power. Kernel density estimation belongs to the category of non-parametric estimation and does not require any prior knowledge. Instead, it is data-driven, adhering to the inherent characteristics and properties of the data to fit the distribution. As a result, compared to parametric estimation, it produces a more precise probability model, enabling a thorough consideration of PV power uncertainty during the system planning phase.
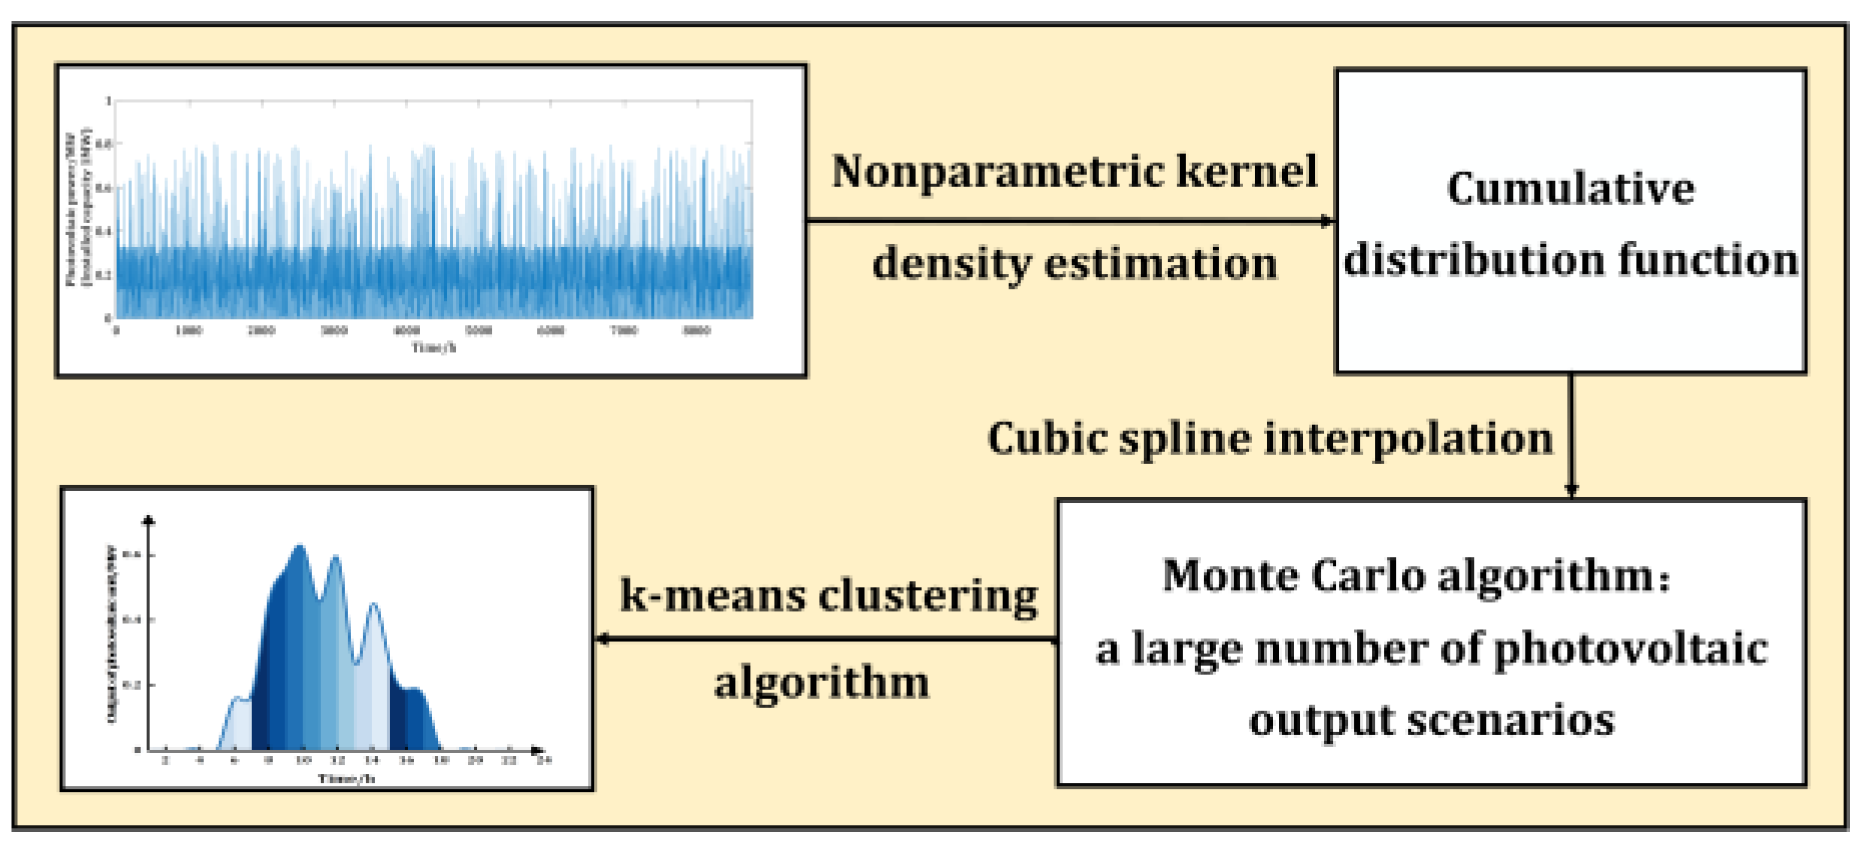
In this paper, non-parametric kernel density estimation is utilized to address the correlation present in the initial sampled data, thereby obtaining the probability density function. Based on the probability density function obtained, the cumulative distribution function is derived. Subsequently, a multitude of scenarios are generated through Monte Carlo simulation. Ultimately, relevant algorithms are employed to determine the optimal number of scenarios, and the refined k-means clustering technique is utilized to condense these large-scale scenarios and ascertain the corresponding scenario probabilities. Given that the probability density function derived from nonparametric kernel density estimation is expressed in a summation form, it is challenging to solve for the inverse of its cumulative distribution function. Consequently, the cubic spline interpolation method is adopted to determine the sample value corresponding to a given cumulative probability, as shown in Figure 6.
In summary, the specific steps outlined in this paper for comprehensive scenario generation, taking into account PV uncertainty, are as follows:
  • Utilizing historical PV output data spanning m days (with a sampling interval of 1 h), a Gaussian kernel function was chosen to produce the probability density function for PV output during each time period within a 24 h cycle, employing the nonparametric kernel density estimation technique [28].
g ^ ( x t ) = 1 m h d = 1 m H ( x t X t d h )
where t = 1, 2, …., 24 refers to 24 periods; x t denotes the output of PV at time period t, X t d represents the PV output at time period t on day d; h denotes the bandwidth and H ( · ) signifies the Gaussian kernel function as follows:
H ( x t X t d h ) = ( 1 2 π ) e x p ( ( x t X t d ) 2 2 h 2 )
2.
Based on the probability density function for each period of PV output, we obtain the cumulative distribution function G ^ X t ( x t ) , and set u t = G ^ X t ( x t ) .
3.
The cumulative distribution function values for each time period are sampled, and the cubic spline interpolation method is applied to determine the corresponding PV output values for each time period based on their cumulative probabilities. Subsequently, Monte Carlo simulation is employed to generate a vast number of PV output scenarios.
Firstly, the cumulative probability interval [ 0 , 1 ] is divided into (d − 1) subintervals. For any subinterval G ^ X t d ( x t d ) , G ^ X t d + 1 ( x t d + 1 ) , with the cumulative probability u serving as the independent variable and x as the dependent variable, the cubic spline interpolation method is applied to derive the cubic spline polynomial within this interval, as follows:
x = ( G ^ X t d ) 1 ( u ) = l d + a d u + b d u 2 + c d u 3
where d = 1 , 2 , , m .
Since any sampling cumulative probability value u f t must lie within a specific subinterval G ^ X t d ( x t d ) , G ^ X t d + 1 ( x t d + 1 ) , it can be substituted u f t into Equation (19) to compute the sampled PV output for each period.
4.
Before clustering the sampled data, it is essential to determine the optimal number of clusters. This selection is pivotal for the subsequent optimization process, significantly impacting both the calculation speed and the rationality of capacity planning. Therefore, the accuracy of the method used to determine the optimal number of clusters must be rigorously tested. The testing methodology is shown in Appendix A.
5.
The algorithm that demonstrates higher accuracy in step 4 is utilized to ascertain the optimal number of clusters. Subsequently, the K-means clustering algorithm is employed to reduce the large-scale scenarios simulated in step 3 and to calculate the probability of each scenario. Since this algorithm is not the primary focus of this paper, the specific clustering steps are omitted here for brevity.

3.2. A Bi-Level Capacity Optimization Model

The primary aim of the power capacity optimization method introduced in this paper is to plan the capacity of each unit in the ship’s IPS, comprising PV, MG, DE, and HESS. Essentially, it takes into account both the annualized investment cost and the first-year ROE. In this section, a brief description of the optimization variables, objectives, constraints, and the applied algorithmic procedure is given in Section 3.3.

3.2.1. Upper Objective Function

The upper objective function is to maximize ROE:
max ( R O E ) = max ( R f C I N T . s C i + C e q u ω e q u )
C I N T . s = i = 1 N A C i + i = 1 N O M . i + C F C . s + A O E S S
where R f is the sailing revenue of the ship, C I N T . s represents the total cost, including the annualized investment cost of each device of the power generation unit A C i , operation and maintenance cost O M . i , fuel consumption cost C F C . s of DE and MG, which is returned from the lower layer, as detailed in Section 3.2.2, and energy storage investment and operation, and maintenance cost A O E S S .
According to the equivalent cost method, the cost of each device can be expressed as follows:
A C i = i = 1 N C i i c ( 1 + i c ) n i ( 1 + i c ) n i 1
where N = 3 is the total number of devices, namely PV C 1 , MG C 2 , and DE C 3 ; i c is the discount rate and n i represents the service life of the equipment.
C i = X i ω i
Equation (23) represents the multiplication of each unit capacity with its investment cost per unit capacity. X i is the upper optimization variable, namely PV capacity X 1 , MG capacity X 2 , and DE capacity X 3 .
The operation and maintenance cost of each device is calculated as a percentage of its investment cost, which can be expressed as:
O M i = l i C i
where l i is the ratio of the operation and maintenance costs of each piece of equipment to the investment costs.
The cost of the energy storage system is calculated according to the following formula:
A O E S S = e q u 4 C e q u
C e q u = ρ e q u ( 1 + ρ e q u ) n e q u ( 1 + ρ e q u ) n e q u 1 C a e q u ω e q u + C a e q u ω e q u l e q u
where C a e q u = C a e l e , C a f u , C a c a b , C a s t h represent the equipment capacity of HESS; ρ equ is the service life of each device in HESS, ω e q u is the investment cost of the unit capacity of each equipment, l e q u denotes the ratio of operation and maintenance, and the investment cost of each equipment.

3.2.2. Lower Objective Function

The system operating cost is mainly related to the costs of DE and MG. Therefore, the lower-level optimization goal is to minimize the fuel consumption
min C F C . s = min D s = 1 N s θ ( s ) t = 1 T ( P d i e s e l . s . t c F C D + P g a s . s . t c F C G )
where D indicates the total number of sailing days in a year, N s denotes the number of scenarios. θ ( s ) means the scenario probability. T is the number of time periods in a day, and is taken as 24; c F C D and c F C G are the fuel prices of DE and MG, respectively.
Due to the correlation between the real-time power of DE and MG and that of the energy storage system equipment, the real-time power of all devices is set as the lower-level optimization variables. Table 1 lists all the optimization variables in the bi-level model.

3.2.3. Power Balance Constraint

P p v . s . t + P g a s . s . t + P d i e s e l . s . t + P E S S . s . t = P l o a d . s . t
If P E S S . s . t is positive, the energy storage system discharges as a whole to provide power to the load; if it is negative, the energy storage system as a whole operates in charging mode.
P E S S . S . t = P e l e . s . t + P c a b . s . t + P f u . s . t
where P e l e . s . t , P f u . s . t and P c a b . s . t represent the consumption power of EC, the discharging power of FC, and the charging or discharging power of SC at time t in each scenario s, respectively.

3.2.4. EC Constraint

P e l e . l i m . s . t = Q t . m a x Q t . s . t η e l e , H H H V P e l e . m a x . s . t = m i n P e l e . l i m . s . t , P E L E . N
where P e l e . l i m . s . t denotes the power of EC constrained by the remaining storage space of HSE, and P e l e . m a x . s . t is the allowable maximum absorbed power of EC; P E L E . N represents the rated power of EC.

3.2.5. EC Optimal Operating Interval Constraint

P E L E . m i n P e l e . s . t P e l e . m a x . s . t
where P E L E . m i n indicate the lower limits of the optimal operating power interval of EC.

3.2.6. FC Power Constraint

P f u . l i m . s . t = ( Q t . s . t Q t . m i n ) H H H V η F U P f u . m a x . s . t = m i n P f u . l i m . s . t , P F U . N
where P f u . m a x . s . t represents the maximum allowed value of the FC discharge power; P f u . l i m . s . t indicate the FC discharge power restricted by the residual hydrogen of HSE; P F U . N is the FC-rated power.
Therefore, the constraint pertaining to the actual FC discharge power in the power balance is as follows:
P f u . s . t P f u . m a x . s . t

3.2.7. SC Power Constraint

S O C c . m i n S O C c . s . t S O C c . m a x
P c a b . s . t c h = m i n P c h . m a x , P C A B . c h . s . t P c a b . s . t d i s = m i n P d i s . m a x , P C A B . d i s . s . t P C A B . c h . s . t = E c . m a x ( 1 σ c s d r Δ t ) E s . t 1 Δ t η C P C A B . d i s . s . t = ( 1 σ c s d r Δ t ) E s . t 1 E c . m i n Δ t / η D
where S O C c . m a x and S O C c . m i n are the upper and lower limits of the SOC of SC; P c a b . s . t c h and P c a b . s . t d i s represent the maximum allowable charging and discharging power of SC; P c h . m a x and P d i s . m a x represent the maximum continuous charging and discharging powers of SC, respectively, with their values primarily determined by the inherent charging and discharging characteristics of the energy storage device itself; P C A B . c h . s . t and P C A B . d i s . s . t denote the charging and discharging powers of SC constrained by the remaining electrical energy, respectively; E c . m a x = C a c a b and E c . m i n = 0 denote the maximum storage capacity and the minimum residual energy of SC, both of which are also constrained by SOC.
Therefore, the constraints pertaining to the actual charging and discharging powers of SC in the power balance are as follows:
P c a b . s . t P c a b . s . t d i s   P c a b . s . t 0 | P c a b . s . t | P c a b . s . t c h   P c a b . s . t < 0

3.2.8. Ship Emission Constraint

Considering the air quality and greenhouse gas (GHG) emissions associated with ocean navigation, this study adopts the international Energy Efficiency Operation Indicator (EEOI) standard to assess C O 2 emissions [29] and imposes a constraint to limit them below a specified upper bound. The formula for the greenhouse gas emission constraint is presented as follows [30]:
i ( 1 , 2 ) F ( P i , t ) ξ 1 V t Δ t E E O I max , t T
where F ( P i , t ) denotes the emission and ξ 1 = 36 is the load factor of the ship.
F ( P i ( t ) ) = α i ( P i ( t ) ) 2 Δ t + β i ( P i ( t ) ) Δ t + γ i Δ t , t T
where α i , β i , γ i are the power factor of the generating device, here P 1 . s . t = P g a s . s . t , P 2 . s . t = P d i e s e l . s . t .

3.2.9. Capacity Constraint

0 P i . s . t X i 0 P e q u . s . t C a e q u X i , C a e q u R +

3.3. Solution of the Collaborative Optimal Model of Bi-Level

The bi-level model encompasses numerous optimization variables and constraints, some of which are interdependent and possess intricate timing attributes. Consequently, it is challenging to solve using the conventional particle swarm optimization algorithm. To this end, this paper adopts an improved particle swarm optimization (IPSO) algorithm, based on dynamic programming (DP), to solve the aforementioned model. The algorithms used are described in detail in the following two sections.

3.3.1. Improved Particle Swarm Optimization (IPSO)

In standard PSO, all particles learn from the global optimal particle to update their positions and velocities until termination, which makes the algorithm to exhibit good exploitability and fast convergence. However, it performs poorly when handling problems with complex search spaces. The velocity vector Vᵢ = (vᵢ1, vᵢ2, ..., vᵢJ) and position vector Xᵢ = (xᵢ1, xᵢ2, ..., xᵢJ) of particles in standard PSO are updated according to Equations (40) and (41).
v i j k + 1 = ω ν i j k + c 1 r 1 j ( p i j k x i j k ) + c 2 r 2 j ( p g j k x i j k )
x i j k + 1 = p i j k + v i j k + 1 , ( i = 1 , 2 , , I ; j = 1 , 2 , , J ; k = 1 , 2 , , K )
where v i j k denotes the velocity of the i-th particle in the k-th iteration, ω denotes the inertia weight, which is related to the search ability of PSO, p i k is the best historic position of particle i at the k-th iteration, p g k represents the best position among the population at the k-th iteration, c1 and c2 are learning factors, and r1 and r2 are uniform random numbers within [0, 1].
To balance exploitation and exploration, this paper proposes an algorithm with better performance, which is IPSO. In IPSO adopts the tolerance-based search direction adjustment mechanism (TSDM) [31] and a self-learning-based candidate generation strategy (SLCG) [31], which enables the population to adaptively adjust the search direction, avoid falling into local optima, and narrow the search space. On this basis, a curve-increasing strategy is employed to control the variation in the inertia weight parameter ω .
  • Tolerance-based search direction adjustment mechanism (TSDM)
In basic PSO, all particles update towards the global best particle ( p g k ), which makes them prone to falling into local optima. However, the temporary lack of improvement in the particle’s best position over 1–2 iterations does not necessarily mean the algorithm has fallen into a local optimum—it may be a transitional state where p g k is approaching the global optimum. Therefore, it is necessary to accurately judge whether to adjust the search direction to balance the algorithm’s performance. Thus, the core objective of TSDM is to accurately determine whether the population has truly fallen into a local optimum and strike a balance between avoiding local optima and exploiting the potential of p g k .
TSDM monitors the improvement state of the particle’s best position, introduces a tolerance counter ( T c ) and a direction adjustment probability ( P r o b a d j u s t ), and dynamically decides whether to adjust the search direction. The specific logic is as follows.
  • Define the population stagnation state: If the individual best fitness of all particles does not improve in a certain iteration, the population is considered to have entered a stagnation state.
i = 1 I f ( p i k ) f ( p i k 1 ) = 0
where I denotes the population size.
2.
Tolerance Counter ( T c ): The variable tolerance of the population is denoted by T c , which is initialized to 0. If no improvement is achieved by all particles after one iteration, the parameter T c can be updated as T c = T c + 1 .
3.
Calculate the direction adjustment probability P r o b a d j u s t : P r o b a d j u s t is an increasing function based on T c , which is used to quantify the necessity of adjusting the search direction.
P r o b a d j u s t = e x p ( T c ) 1 / e x p ( 10 ) 1
Here, P r o b a d j u s t is updated after each iteration. If P r o b a d j u s t is greater than a random number within [0,1], the population will stop learning from the current p g k and adjust its search direction to the new particle.
Remark 1.
When  T c  is small,  P r o b a d j u s t  is extremely low, and the population still learns from  p g k . When  p g k  is close to the global optimum, this avoids the decrease in convergence efficiency caused by misjudging the stagnation state. As   T c  increases continuously,  P r o b a d j u s t  approaches 1, and the population will inevitably adjust its direction. At this point, by switching the learning target (candidate particle), the search space is re-explored, enabling the population to jump out of local optima.
  • Self-learning-based candidate generation strategy (SLCG)
SLCG, as a supporting strategy for TSDM, aims to address the issues where randomly generated candidate particles lack guaranteed guidance ability and waste the population’s high-quality historical information. When TSDM determines that the population needs to adjust its search direction, SLCG generates new learning targets (candidate particles) with both inheritability and explorability, thereby enabling the population to jump out of local optima. The details of generating candidates are described as follows in Algorithm 1.
Algorithm 1: Self-learning-based candidate generation strategy
1:for each dimension j from 1 to J do
2: Generate a random number of rand ( ) between [0, 1];
3: if  P r o b candidate > rand ( ) then
4:  C a n d i d a t e j = P gj ;
5: else
6: randomly select two P i ( a ) and P i ( b ) from the swarm;
7: if  f ( P i ( a ) ) < f ( P i ( b ) )  then
8:    C a n d i d a t e j = P a j + Gaussin ( σ j ) ;
9: else
10:  C a n d i d a t e j = P b j + Gaussin ( σ j ) ;
11: end if
12: end if
13: end for
Here, P r o b candidate is the probability between [0,1] that C a n d i d a t e j will obtain the structure of P gj in j-th dimension. σ j is standard deviation variable which reflects the distribution of all particles’ best solution, in the swarm with I particles, it is obtained by the following Equations (44) and (45):
A v e r a g e j = 1 I i = 1 I P i j
σ j = 1 I i = 1 I ( P i j A v e r a g e d ) 2
To efficiently guide the swarm to escape from a local optimum, and to avoid the low efficiency and poor quality associated with randomly reconstructing a candidate particle’s solution structure, we randomly select two particles, P i ( a ) and P i ( a ) . The superior of the two is used as an exemplar to generate the candidate particle, incorporating a Gaussian offset value determined by σ j . Because this selection process is random, the search information from all particles in the population can be utilized. This allows the candidate particle to potentially obtain a superior solution structure that is closer to the global optimum, thereby assisting the swarm in escaping the local optimum.
After the candidate particles are generated, a better learning target is selected by calculating the competition index (Equation (46)). In the next iteration, particles learn from both the current p g k and C a n d i d a t e j , and the velocities of these two particles are updated according to the following rules:
C o m p e t i t i v e n e s s L = i = i I f ( x i k + 1 ) f ( x i k )
v i j k + 1 = ω ν i j k + c 1 r 1 j ( p i j k x i j k ) + c 2 r 2 j ( p g j k x i j k ) v i j k + 1 = ω ν i j k + c 1 r 1 j ( p i j k x i j k ) + c 2 r 2 j ( C a n d i d a t e j x i j k )
Here, L stands for the learn object of the swarm. If C o m p e t i t i v e n e s s Candidate is larger than C o m p e t i t i v e n e s s P g k , update p g k to the C a n d i d a t e j and reset the tolerance counter to T = 0; if not, keep p g k unchanged and decrement T by 1.
Remark 2.
This strategy ensures the algorithm’s exploration capability by leveraging the individual best solution structures of all particles, while mitigating its impact on the convergence rate.
  • Curve-increasing strategy
In Equation (40), the inertia weight ω represents the degree to which the original velocity is inherited: a larger ω leads to stronger global convergence capability but weaker local convergence capability; conversely, a smaller ω results in weaker global convergence capability but stronger local convergence capability. In this paper, a curve-increasing strategy based on an exponential function is adopted to control the variation of ω. Given the maximum inertia weight ω max , the curve-increasing formula is as follows:
ω 1 = ω max ω max K k
ω = e ω 1
where ω max is the set larger inertia weight ω max = 0.95 ; k denotes the current number of iterations; and K represents the maximum number of iterations.
Remark 3.
Initially, a smaller ω is employed to encourage fine-grained local search (exploitation), while in later stages, ω is gradually increased to enhance the particle’s ability to escape local optima and conduct a broader global search (exploration).
To summarize, this section improves the standard PSO by incorporating two additional dimensions. TSDM and SLCG constitute a reactive, state-based decision mechanism. Instead of directly interfering with the value of inertia weight ω, they intelligently manage and update the population’s learning exemplar, belonging to the optimization at the strategic level. Conversely, the curve-increasing strategy is employed to adjust the particle’s own motion inertia, which is an optimization at the parametric level. The combination of these two approaches equips the improved algorithm with both a stable foundational behavior model and the flexibility to respond to emergent situations, thereby enabling it to adapt more effectively to complex optimization problems with diverse topological features.

3.3.2. IPSO Based on Dynamic Programming (DP-IPSO)

A standalone IPSO generates particles randomly during initialization. Consequently, a large number of particles are discarded for violating constraints, leading to low search efficiency. The advantage of DP, in contrast, lies in its capacity for sequential decision optimization, which can satisfy constraints proactively through its state transition logic. Therefore, the purpose of incorporating DP into the IPSO initialization phase is to generate a “constraint-feasible initial particle pool.” This approach avoids ineffective searches, thereby enhancing the algorithm’s convergence efficiency and the feasibility of its solutions. The main steps of DP based on this model are summarized as follows:
Step 1: Define the three core elements of DP
a.
Define state variable S t (reflecting the temporal dynamics of the system): State variables need to cover all core parameters associated with constraints. Therefore, define S t = S O C c . s . t , S O C c . s . t , Q t . s . t .
b.
Define decision variables (corresponding to real-time power allocation) D t : Decision variables need to be directly related to the capacity optimization goal of PSO to avoid meaningless decisions. Therefore, let D t = P g a s . s . t , P d i e s e l . s . t , P e l e . s . t , P f u . s . t , P c a b . s . t , Q t . s . t .
c.
DP state transition equation (integrating all timing constraints): Equations (2)–(5), Equations (28)–(39).
Step 2: Setting the DP objective function
The goal of DP is not to optimize ROE directly, but to generate an “initial feasible solution” that satisfies the constraints. Therefore, the objective function aims to minimize the degree of constraint violation
min f D P = s S t = 1 24 P e n a l t y s . t
P e n a l t y s . t = 10 6 Decision   variable   constraint   bias
Step 3: Generate a “feasible decision sequence library” based on DP.
Execute DP solutions for each typical PV output scenario to generate feasible decision sequences that cover different scenarios and comply with EMS and ESPD.
Step 4: Map the DP feasible sequence to the IPSO initial particles (equipment capacity) and infer the capacity parameters through the DP decision sequence.
Step 5: DP-IPSO initialization uses a hybrid strategy of “70%I·(DP feasible particles) + 30%I·(random particles)” to balance feasibility and diversity. However, it requires “constraint pre-verification” (based on DP state transition logic for rapid judgment) to eliminate particles that violate core constraints.
Based on the above, introducing DP in the initialization phase of IPSO can reduce the search space from the full parameter space to the constrained feasible region, allowing IPSO to focus on the area near the optimal solution at a faster speed.

3.3.3. Bi-Level Capacity Optimization Based on DP-IPSO Algorithm

This paper uses IPSO as the main method to solve the bi-level capacity optimization model. In the initialization phase, DP is integrated to generate the upper-level initial particles, which represent the rated capacity of the equipment. These initial particles consist of 70% mapping solutions from DP and 30% randomly generated particles. The lower-level initial particles, representing the real-time power sequence of the equipment, are generated according to the EMS while being constrained by the upper-level capacity. Subsequently, a bi-level iterative optimization is performed. The upper-level IPSO aims to maximize ROE by optimizing the equipment capacity, and these capacity parameters are passed down as hard constraints for the lower-level operation. For each solution from the upper level, the lower-level IPSO iteratively minimizes the total fuel cost under a set of representative PV scenarios. This resulting fuel cost is then fed back to the upper level for the ROE calculation. This process continues until the global optimal solution R O E b e s t ( X 1 , X 2 , X 3 , C a e l e , C a f u , C a c a b , C a s t h ) is found. The pseudo-code of DP-IPSO for the bi-level capacity optimization model is given in Algorithm 2.
Algorithm 2: Solution algorithm of the bi-level capacity optimal model
1: / / System configuration.
2: Set equipment capacity parameters X 1 max C a s t h m a x , X 1 m i n C a sth m i n
3: Set power operating parameters P d i e s e l . m a x , P d i e s e l . m i n , P g a s . m a x , P g a s . m i n , S O C m a x , S O C m i n .
4: Set EEOI parameters ξ 1 , α 1 , β 1 , γ 1 , α 2 , β 2 , γ 2 .
5: / / Upper layer initialization: set algorithm parameters I 1 = 500 , K 1 = 200 , ω m a x = 0.95 , c m a x = 1.5 , c m i n = 0.5 .
6: Population initialization is performed according to DP.
7: / / Lower layer initialization: set algorithm parameters I 2 = 100 , K 2 = 50 , ω m a x = 0.95 , c m a x = 1.5 , c m i n = 0.5 .
8:for  i = 1   t o   I 1 % Corresponding to each particle in the upper layer do
9:  for  s = 1   t o   S % Number of scenarios do
10:  Generate initial power sequence based on EMS and upper layer capacity constraints.
11:  end for
12: end for
13: / / Main loop
14: Upper IPSO iteration
15:for  k 1 = 1   t o   K 1  do
16:  for  i 1 = 1   t o   I 1  do
17:   Lower IPSO iteration
18:   for  k 2 = 1   t o   K 2  do
19:    for  i 2 = 1   t o   I 2  do
20:     for  s = 1   t o   S  do
21: Update the lower individual optimal and global optimal
22:     end for
23: Accumulate the weighted fuel cost of scenario s.
24:    end for
25:   end for
26: Calculate upper layer fitness (ROE).
27: Update the upper individual optimal and global optimal.
28: Upper particle update (integration of TSDM + SLCG mechanism and Curves-increasing strategy).
29: end for
30:   k 1 = k 1 + 1 .
31:   end for
32: / / Output solutions and R O E b e s t ( X 1 , X 2 , X 3 , C a e l e , C a f u , C a c a b , C a s t h ) .
In this study, MATLAB R2024a was employed for system modeling and coding of the energy management system. The optimization toolbox within MATLAB was utilized to implement the proposed methodologies.

4. Results and Discussion

In the following sections, Section 4.1 verifies the efficacy of the COMP approach that has been adopted. Section 4.2 provides an in-depth analysis of the capacity optimization results and explores the advantages of the capacity optimization solution based on the COMP approach. Section 4.3 explores the operation of the power system when a ship is docked at the port. Finally, Section 4.4 provides a comparative evaluation of the stability of currently used optimization algorithms.

4.1. Scenario Generation Results and Correlation Comparative Analysis

4.1.1. Scenario Generation Results Based on COMP

The regional average PV output data from the Caribbean Sea in 2016 were selected and normalized. To incorporate the uncertainty of PV output, the comprehensive scenario generation method outlined in Section 3.1 was employed, with a sampling scale F set at 10,000. To minimize computational load, k-means clustering was utilized to diminish the number of scenarios from the initial 10,000 PV standard data points. The elbow method was employed to ascertain that the optimal cluster count was 4. However, due to the insignificant PV output associated with scenario 4, it was excluded from further consideration. Finally, three typical scenarios of PV output can be obtained, as shown in Figure 7a. The total scenario coverage amounts to 94.53%, with the probability of occurrence for each scenario clearly indicated in the legend. Furthermore, the test results of the algorithm are presented in Appendix A.
As shown in Figure 7a, each scenario exhibits pronounced seasonality and timing patterns. Specifically, Case 1 displays characteristics typical of summer, marked by high-light intensity. Case 2, which has a high probability of occurrence, represents the transitional seasons. Meanwhile, Case 3 features lower light intensity, indicative of winter conditions. In summary, the scenario generation results demonstrate that accounting for the uncertainty of PV output enables a more accurate simulation of the region’s PV output characteristics, thereby facilitating capacity planning for renewable energy units within HESIPS.

4.1.2. Comparative Analysis of Scenarios Generated Using Empirical Distribution (Specifically, the Beta Distribution)

If the Beta distribution is employed to address the uncertainty associated with the PV sequence, the subsequent sampling process remains consistent with the clustering step. The resulting scenario generation, as depicted in Figure 7b, yields a total scenario coverage of 91.156%. Similarly to Section 4.1.1, Case 1 exhibits higher output, reflecting summer characteristics, while Case 2, which has a higher probability of occurrence, represents the transitional seasons. Case 3, characterized by low output, displays winter traits. A comparison between Figure 7a and Figure 7b reveals that, in the PV scenarios simulated using the Beta distribution, the trend among the three groups of PV sequences remains consistent. However, only individual sequences within these groups undergo changes, indicating that the volatility of PV output is not adequately captured. From a numerical perspective, the scenario results generated by both methods are largely similar. The probability of the corresponding scenario during the transition season is the highest, with comparable values for the corresponding scenario probabilities and similar amplitudes for the corresponding sequences.
In conclusion, COMP, which leverages nonparametric kernel density estimation, offers a more objective simulation of the uncertainty and fluctuations associated with PV output.

4.2. Optimization Results and Correlation Analysis

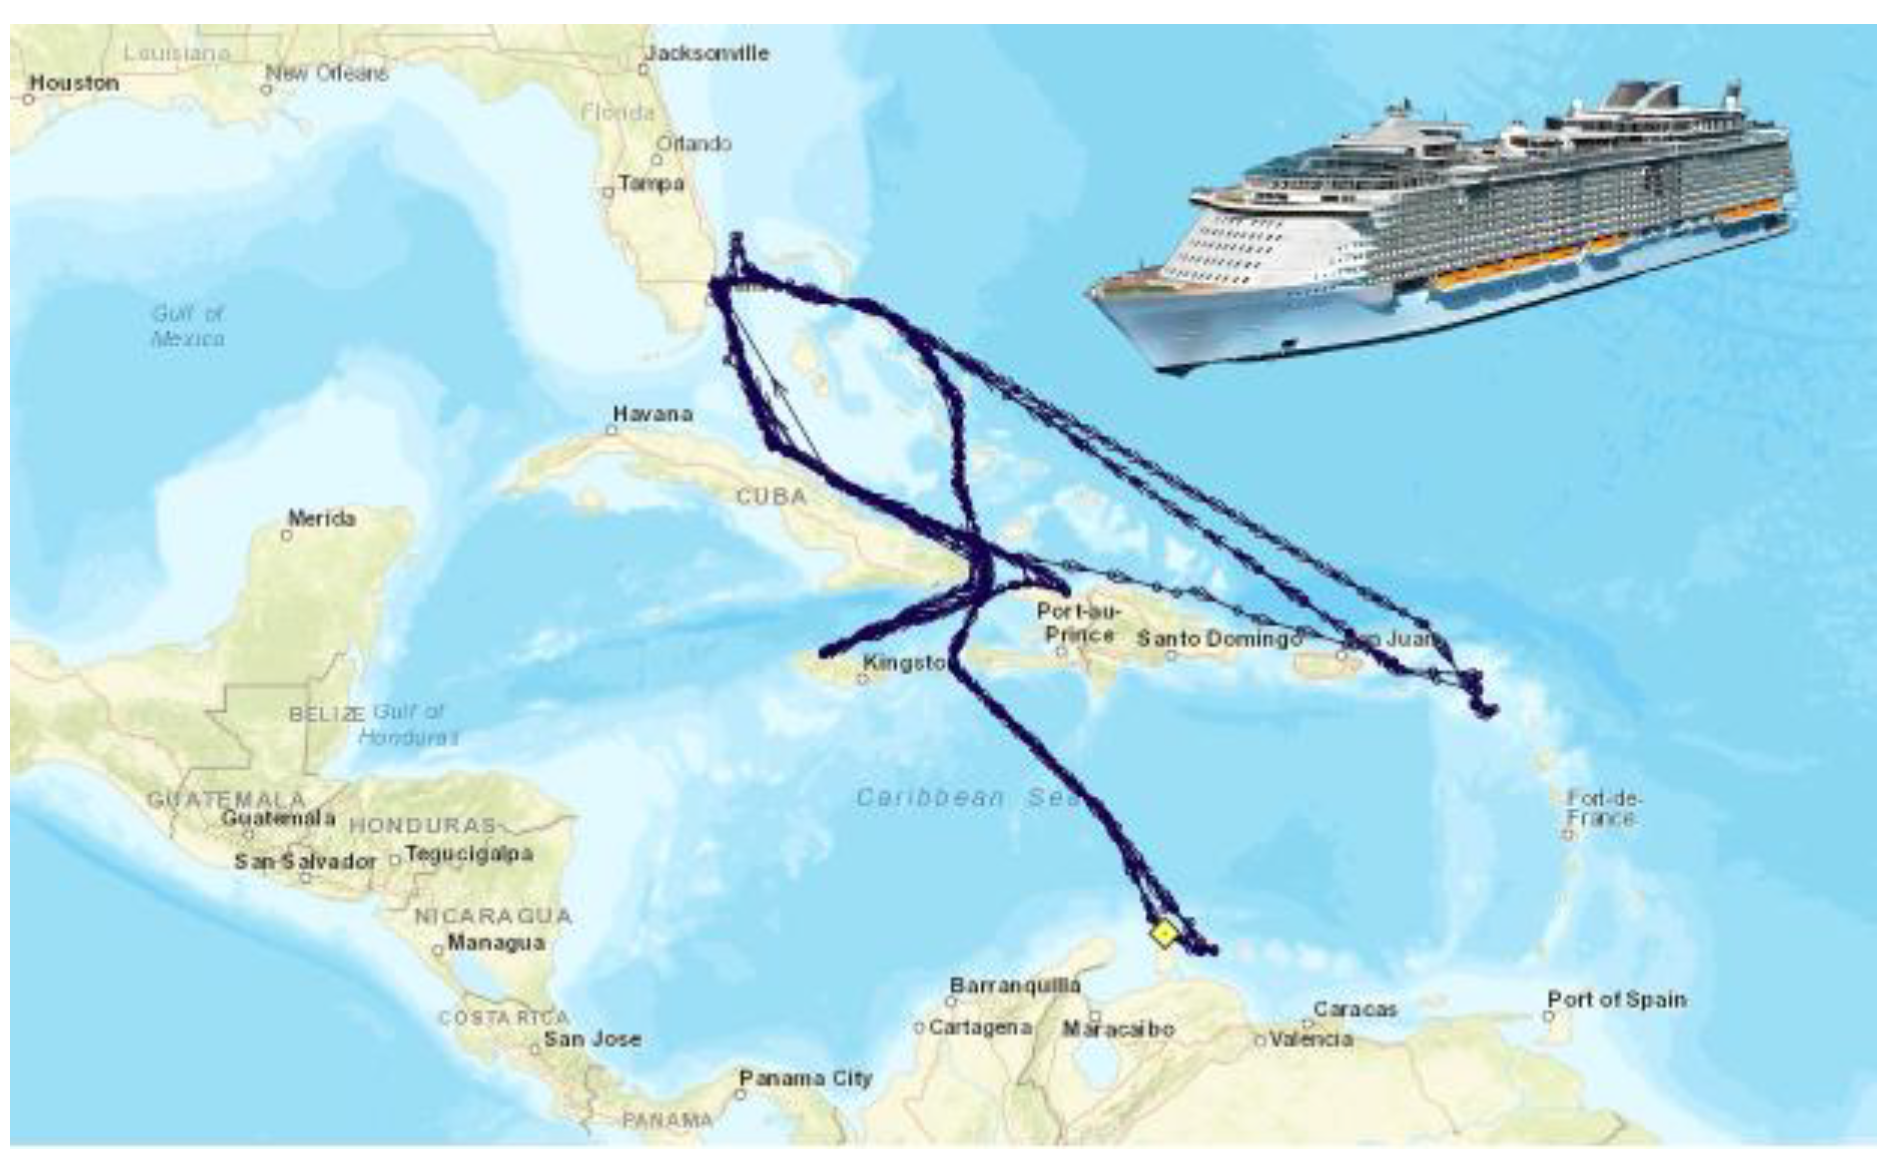
The data utilized for the design, modeling, and optimization of the ship’s energy system is sourced from a large-scale cruise ship. This vessel, which measures 360 m in length and 47 m in width, operates throughout the year in the Bahamas and the Eastern Caribbean, with an average cruise duration of 270 days. The average speed of the ship is 10 knots, as illustrated in Figure 8. In this section, the proposed method will be employed to optimize the power capacity of renewable energy hybrid ships, with a particular focus on achieving economic efficiency and effectiveness. The equipment parameters for HESIPS are outlined in Table 2 [32,33]. The parameters of MG, DE, PV, and HESS are shown in Table 3 and Table 4. In Section 4.2.1, the power capacity configuration of the HESIPS is optimized and compared using various methods, namely COMP, Stochastic Planning (SP), and Robust Planning (ROP). In Section 4.2.2, several typical cases and their corresponding system operation results are analyzed in detail.

4.2.1. Power Capacity Configuration Results and Related Comparative Analysis

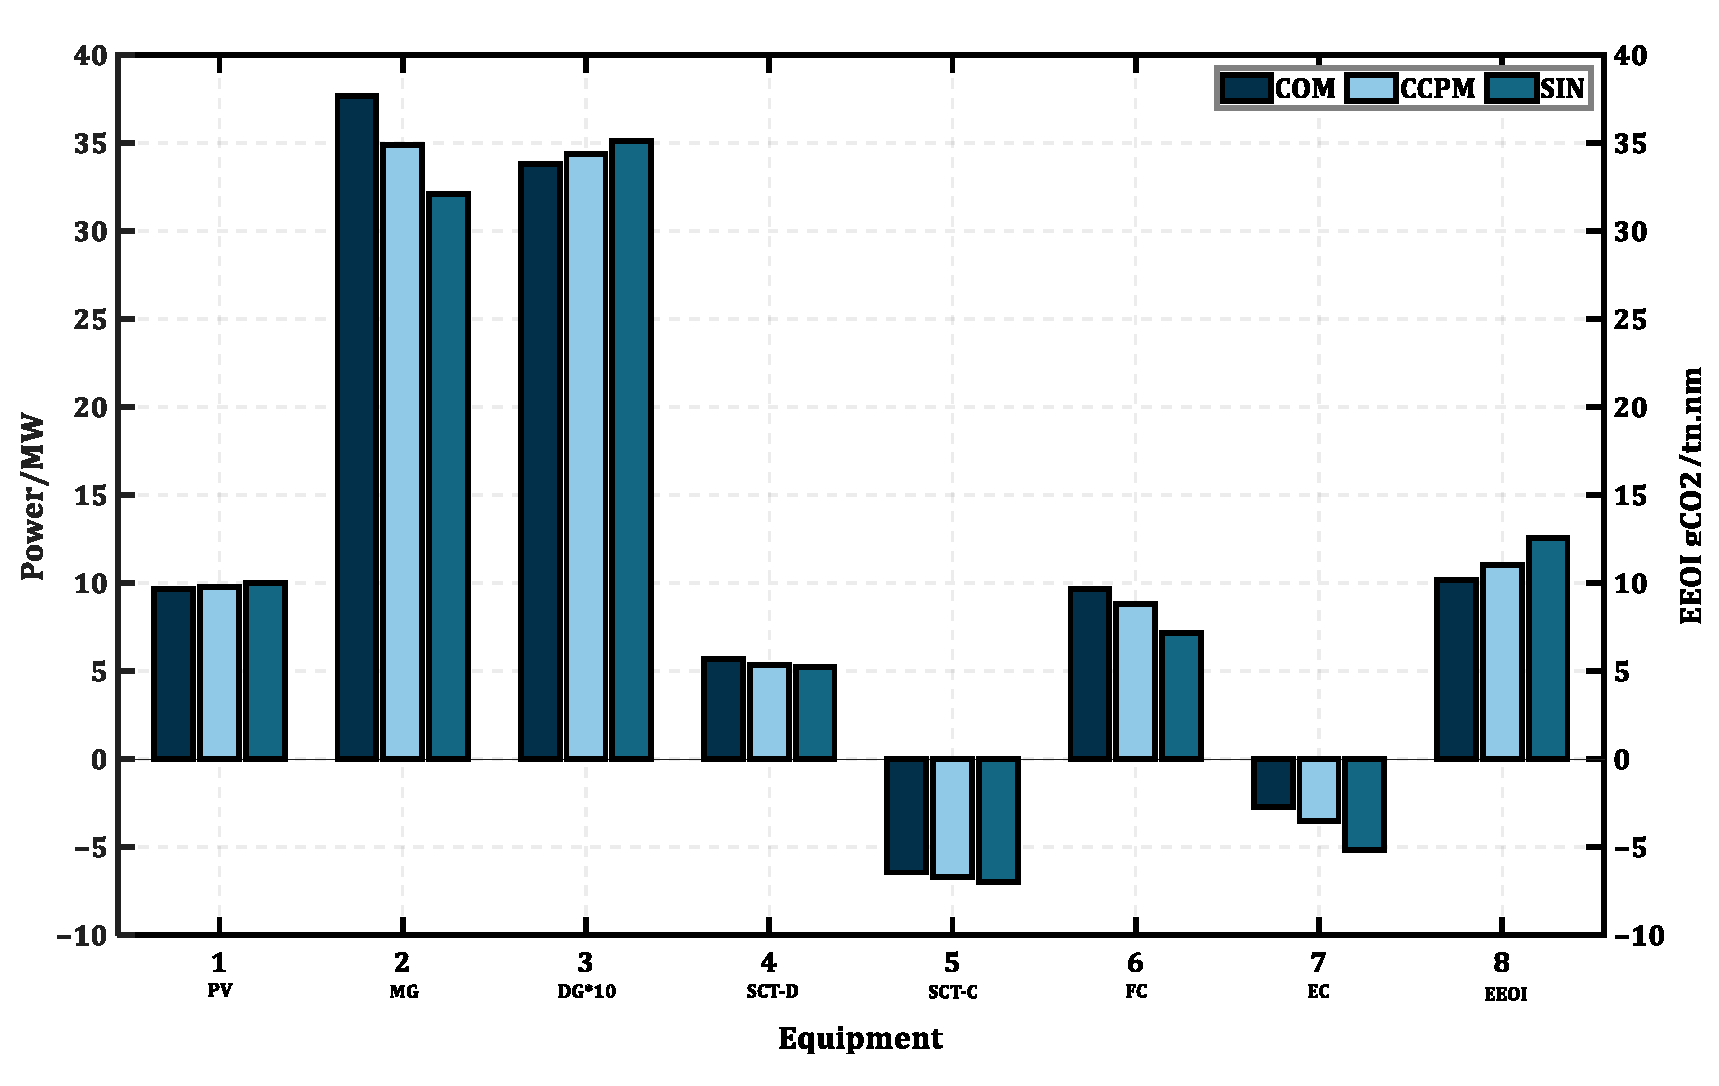
Since the ship predominantly operates in cruise mode, the base load data pertaining to this state is utilized as input. The starting SOC for both the hydrogen energy storage system and the SC is established at 90%. The revenue data for the ship’s voyages were obtained from publicly accessible information provided by the Clarkson Research Network. The outcomes of the power capacity configuration, derived from the planning method proposed in this paper, are presented Table 5, Table 6 and Table 7. To investigate the benefits of our proposed method, we compare its configuration results with those obtained using SP [34] and ROP [35]. Based on the three typical scenarios derived from COMP, SP assigns a probability of 0.33 to each scenario. Given the conservative nature of capacity configuration outcomes, ROP is conducted under Case 3, which features the lowest PV output. Under the load conditions associated with Case 3, the total daily dispatchable power of the equipment and the overall daily carbon emissions resulting from the three planning methods are presented in Figure 9.
As shown in Table 5, Table 6 and Table 7, COMP yields the smallest equipment capacity, except for the EC. This corresponds to the lowest annualized cost, fuel consumption cost, and the highest ROE. Compared to COMP, the equipment capacity resulting from SP exhibits a slight increase, which is accompanied by a decrease in ROE. This is attributed to the increased probability of Case 3 in the planning scenario, leading to an augmentation in the capacity of DE and MG. Furthermore, owing to the decrease in PV output, the capacity of SC that can provide power to the load increases, while the capacity of EC that consumes power decreases. Despite the modest increase in equipment capacity compared to its economic implications, the difference in ROE is significant due to the high cost associated with energy storage equipment. The equipment capacity outcome under ROP, which entails planning for the worst-case scenario, is extremely conservative; however, it results in the poorest economy, yielding the lowest ROE. Likewise, in the worst-case scenario, the capacity of SC is further augmented, while the capacity of EC is diminished. Compared to ROP, despite the greater increase in the capacity of power generation unit equipment and the smaller increase in ESS, the difference in ROE of 2.09% is larger than the ROE difference of 1.42% between COMP and SP. This is attributed to the high overall investment cost of ESS equipment.
It can be observed from Figure 9 that, given the same EMS and energy storage allocation method, the daily power generation of DE under COMP is the lowest, amounting to 337.9 MW, while the power discharge of EC and FC is the highest. Under the ROP, the daily power generation of DE increases by 3.8%, while ESS experiences the smallest discharge and the highest charge. Additionally, the power consumption of EC rises sharply. This indicates that, given the ramp rate limits of DE and MG, the contribution of EC to maintaining power balance is significantly enhanced, as it absorbs a substantial amount of power, thereby reducing the involvement of SC and FC in the power balance. The average EEOI is determined by averaging the ship’s speed. From an environmental standpoint, despite the MG’s total output power being increased to some extent, DE remains the primary power source and emits a high level of pollutants. Consequently, the average daily EEOI of the ship after implementing the COMP is 10.19 gCO2/tn.nm, whereas the average daily EEOI after adopting the ROP is 12.58 gCO2/tn.nm.
In summary, the power capacity configuration results obtained based on COMP are both economical and environmentally friendly. Under this power capacity combination, the overall utilization of energy storage equipment is maximized.

4.2.2. Analysis of Typical Scenarios and Working Conditions

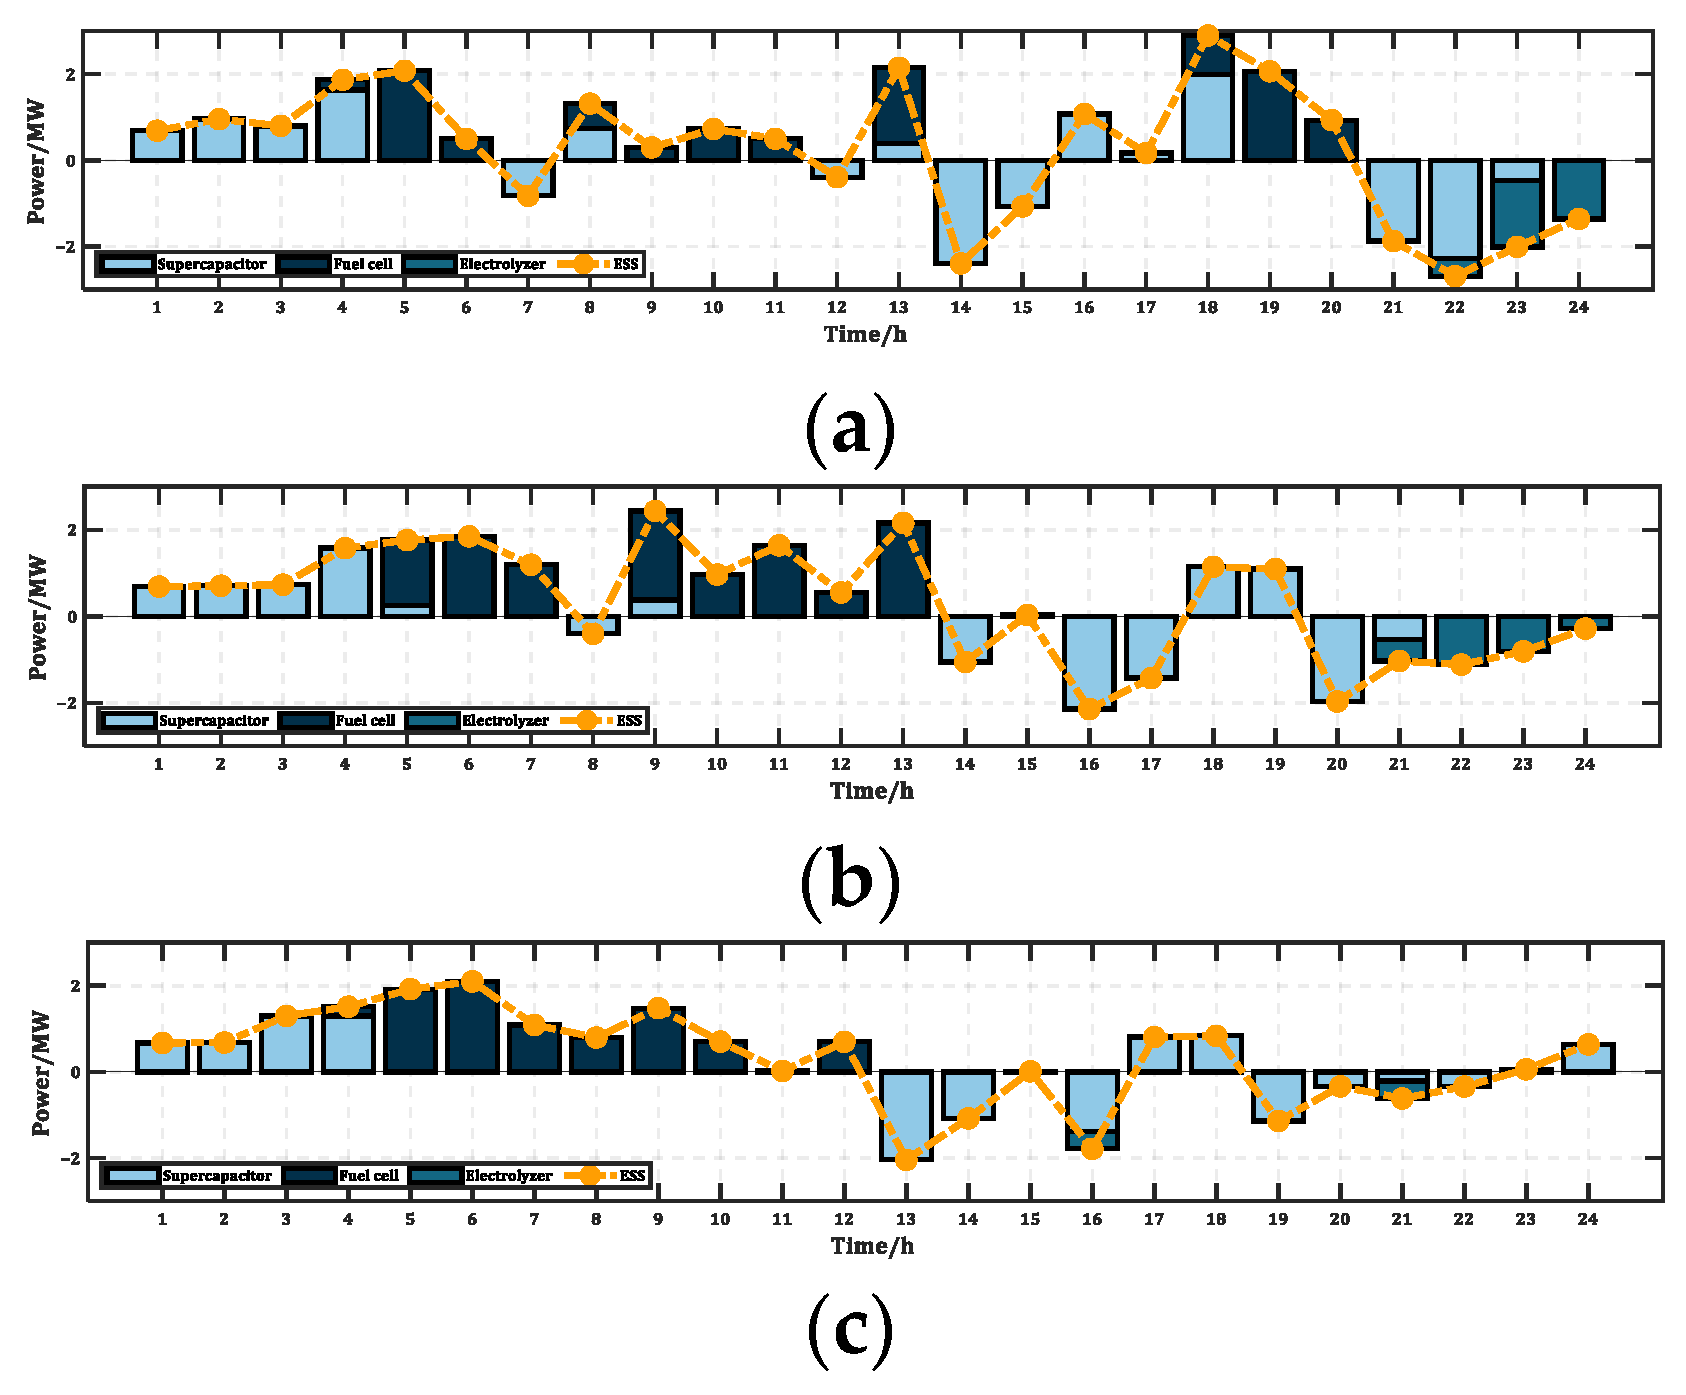
Based on the capacity configuration results obtained by COMP, power dispatch was performed under three PV output scenarios, with both energy storage systems initially set to 90% state of charge. The EEOI values were also calculated, as shown in Figure 10. Following the energy storage power allocation method described in Section 2.3, the corresponding SOC curves (Figure 11) and HESS power allocation results (Figure 12) for the three scenarios were obtained.
As shown in Figure 10, the EEOI values under all three operating conditions are low, all below 20 gCO2/tn.nm, indicating that the ship can easily achieve its green and low-carbon navigation goals while cruising. HESS effectively coordinates with the power generation equipment to perform power scheduling.
When the SC’s SOC (Figure 11) reaches the lower limit between 5:00 and 13:00, the hydrogen energy storage system still has a margin of safety. When the hydrogen energy storage system’s SOC reaches the lower limit, SC has already started charging. Between 20:00 and 24:00, SC is fully charged. DE and MG are limited by their glide rate, and their output power is still greater than the total load power. The excess power is absorbed by EC for hydrogen production, which in turn increases the hydrogen energy storage system’s SOC, thus forming a virtuous cycle.
To further verify the feasibility of this capacity configuration method, it is essential to consider extreme navigation conditions, dispatching the power of other equipment in the absence of PV power. Taking the worst-case load conditions, the power dispatch results are shown in Figure 13. These results demonstrate that even without PV power, system power reliability can still be guaranteed, and the energy storage system performs well.
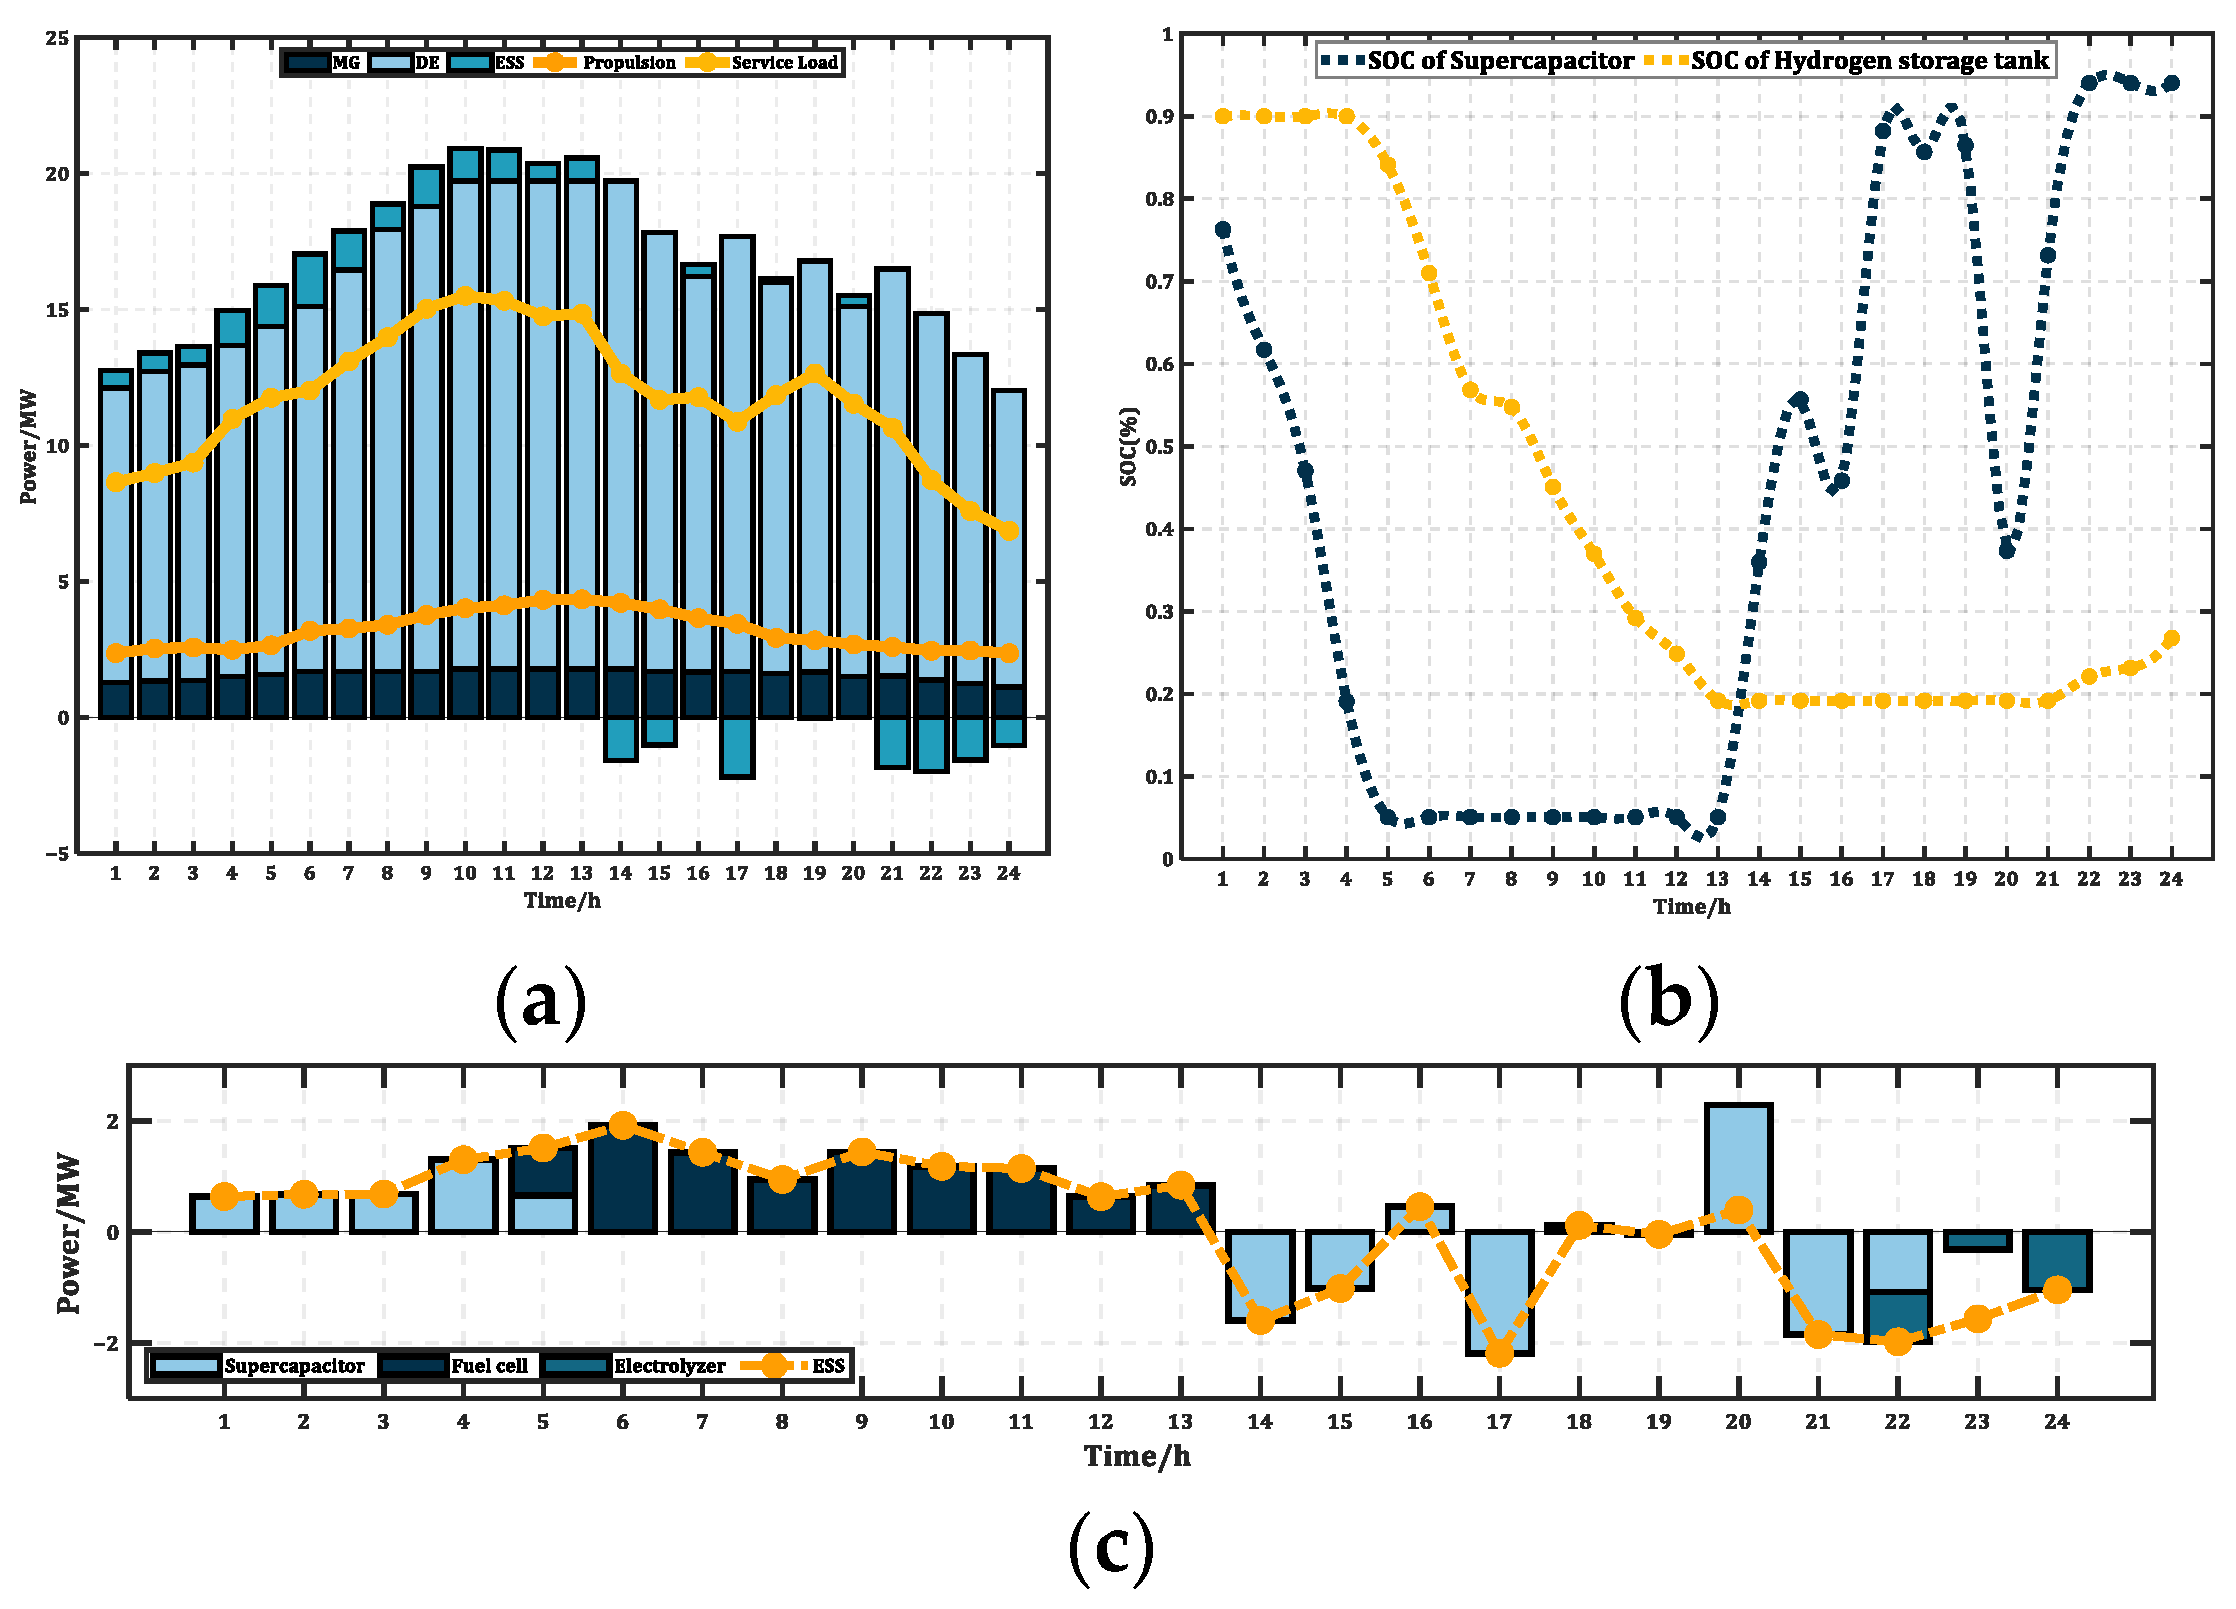
To assess the effectiveness of the optimization design in enhancing energy efficiency, tests were conducted under the load conditions of Case 2. Figure 14a illustrates the system distribution of the system during cruising.
Figure 14b,c shows the influence of EMS on real-time power scheduling. The ESS compensates for the power shortfall through the specified EMS. Clearly, the balance between DE output power and the ESS power varies more flexibly within the allowable range, and the DE output power is lower during multiple time periods. This effectively reduces carbon emissions and significantly reduces fuel consumption, while also ensuring efficient utilization of the ESS equipment.

4.3. Ship Berthing Status Analysis

When docked, the ship connects to shore power to supply loads and power the EC until the hydrogen storage system’s SOC reaches 100%. All PV power is then used to produce hydrogen in the EC. Figure 15 shows the SC’s SOC, EC input power (Figure 16a), and hydrogen revenue (Figure 16b), when the hydrogen price is $8.24/kg. The hydrogen revenue shown in Figure 16b represents only a single day’s docking, reaching a maximum of $2694.48. On an annualized basis, the presence of the EC is projected to generate significant revenue for the ship. Furthermore, the new energy generator set can save the ship 1.892% in fuel costs (per day) while operating in port.

4.4. Algorithm Stability Comparison

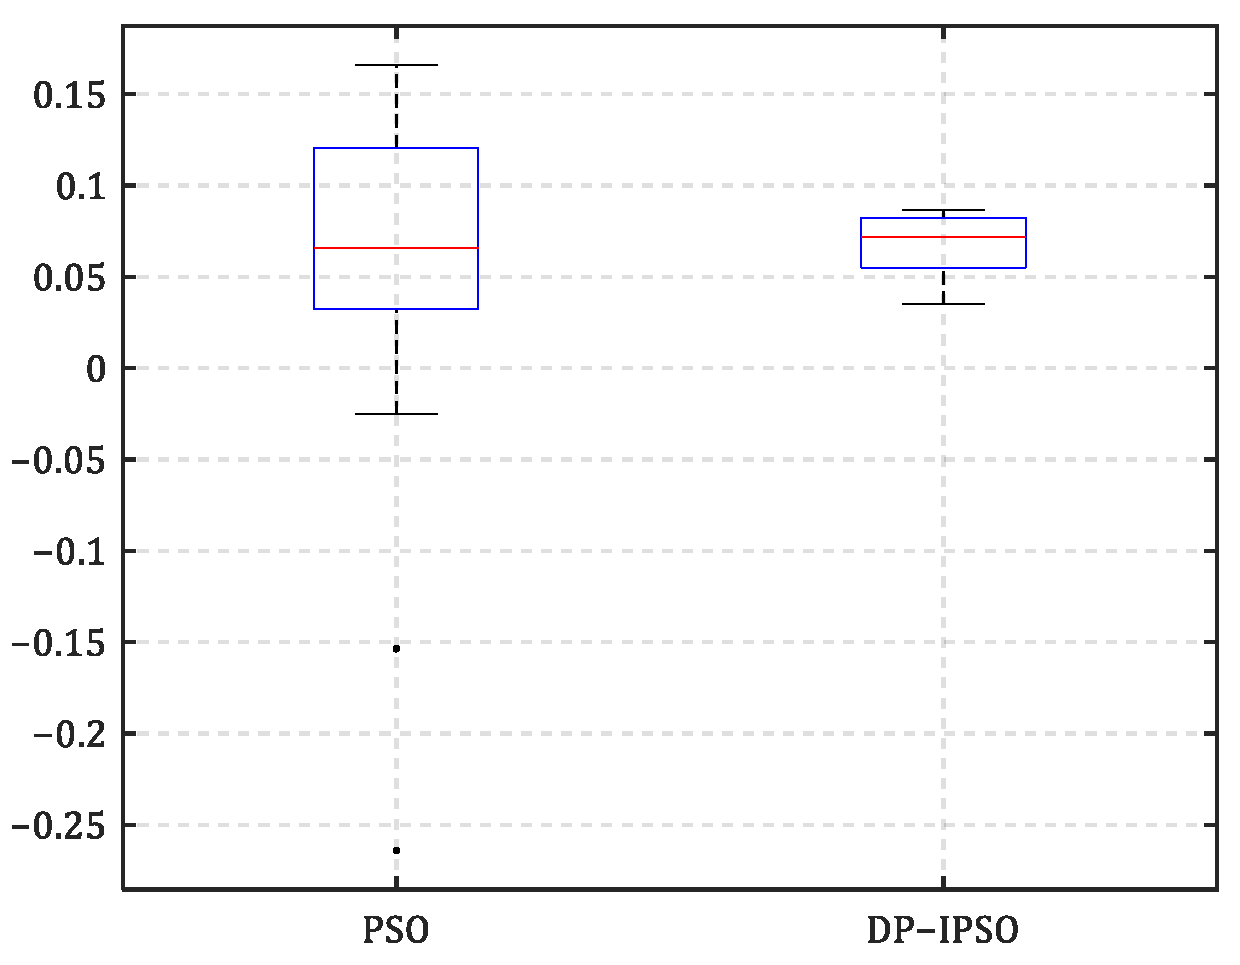
To evaluate the stability of different algorithms, Figure 17 presents the statistical results of 20 simulation experiments conducted in the COMP environment.
Boxplots show that while both algorithms ultimately converge to the expected cost, the median and overall values obtained by DP-IPSO are higher than those of the original PSO, indicating that DP-IPSO is more stable than the original PSO. PSO directly optimizes seven decision variables and, during the optimization process, uses soft constraints to eliminate particles that violate the EMS rules. This operation prolongs the algorithm’s runtime. In contrast, DP-IPSO dynamically adjusts the value range of some optimization variables during the initialization phase, narrowing the search space and concentrating the solution value.

5. Conclusions

From the perspective of investors, this paper introduces an optimal method for configuring the power supply capacity of renewable energy hybrid ships, with the primary objective of maximizing ROE. The key innovation of this method lies in its consideration of the uncertainty of PV power during the planning stage, enabling the configuration of power supply capacity under COMP. Furthermore, this study provides a detailed model for power distribution within the energy storage system and considers the dynamic load-tracking response of the engines. The optimization, utilizing the developed bi-level capacity optimal configuration model, leads to reduced fuel consumption, emissions, and life cycle costs, thereby reflecting long-term benefits.
The optimization model primarily considers fuel cost, lifecycle cost, and equipment operation and maintenance costs in its objective function. The model is solved using a DP-IPSO algorithm. The effectiveness of the proposed method is evaluated through case studies. Furthermore, the energy management strategies employed in the optimization process can reduce fuel consumption and CO2 emission from traditional engines. The main results of this study can be summarized as follows:
  • The proposed method converts uncertain PV power into a set of comprehensive scenarios, which are then integrated into the optimization function. This approach leads to capacity allocation that avoids equipment redundancy, maintains a degree of conservatism, and demonstrates strong environmental performance. Case studies demonstrate that even in the worst-case scenario, the cruise ship can still sail normally.
  • The EMS presented in Section 2.4 is feasible and reasonable and can effectively reduce fuel consumption by 1.64% (per day).
  • Engine load response and power ramping affect the engine’s transient maximum output power, which in turn affects ESS power. To maintain system reliability while using traditional engines for load tracking, the ESS capacity must be expanded. This expansion is necessary to compensate for the power gap between the generation equipment and the load demand.
  • While EC has a relatively low utilization rate compared to SC and FC in terms of power dispatch, its ability to absorb power in real time and with high security makes it one of the excellent options for investors, whether during long voyages, while at anchor, or in the event of a sudden power outage when DE cannot keep up. Furthermore, EC can provide significant long-term benefits.

Author Contributions

Conceptualization, F.J. and Y.Z.; methodology, S.C.; writing—original draft preparation, X.W.; writing—review and editing, F.J. and Y.Z.; visualization, Y.Z. All authors have read and agreed to the published version of the manuscript.

Funding

This work is supported by Hebei Natural Science Foundation under F2025203071 and by Science Research Project of Hebei Education Department under Grant No. BJK2024171.

Data Availability Statement

The data will be made available upon request.

Conflicts of Interest

Author Yuee Zhang was employed by the company Pujiang CJLU Gongxing Industrial Design Research Co., Ltd. The remaining authors declare that the research was conducted in the absence of any commercial or financial relationships that could be construed as a potential conflict of interest.

Abbreviations

The following abbreviations are used in this manuscript:
HESIPSHybrid energy ship integrated power system
HESSHybrid energy storage systems
ROEReturn on Equity
PVPhotovoltaic cell
DEDiesel engine
MGPhoto-gas turbine
ECElectrolytic cell
FCFuel cell
SCSupercapacitor
HSEHydrogen storage equipment
ESPDEnergy storage power distribution method
EMSEnergy management strategy
SOCState of charge
EEOIEnergy Efficiency Operation Indicator
DPDynamic programming
DP-IPSOAn improved particle swarm optimization algorithm integrated with dynamic programming
COMPCOMP
SPStochastic Planning
ROPRobust Planning

Appendix A

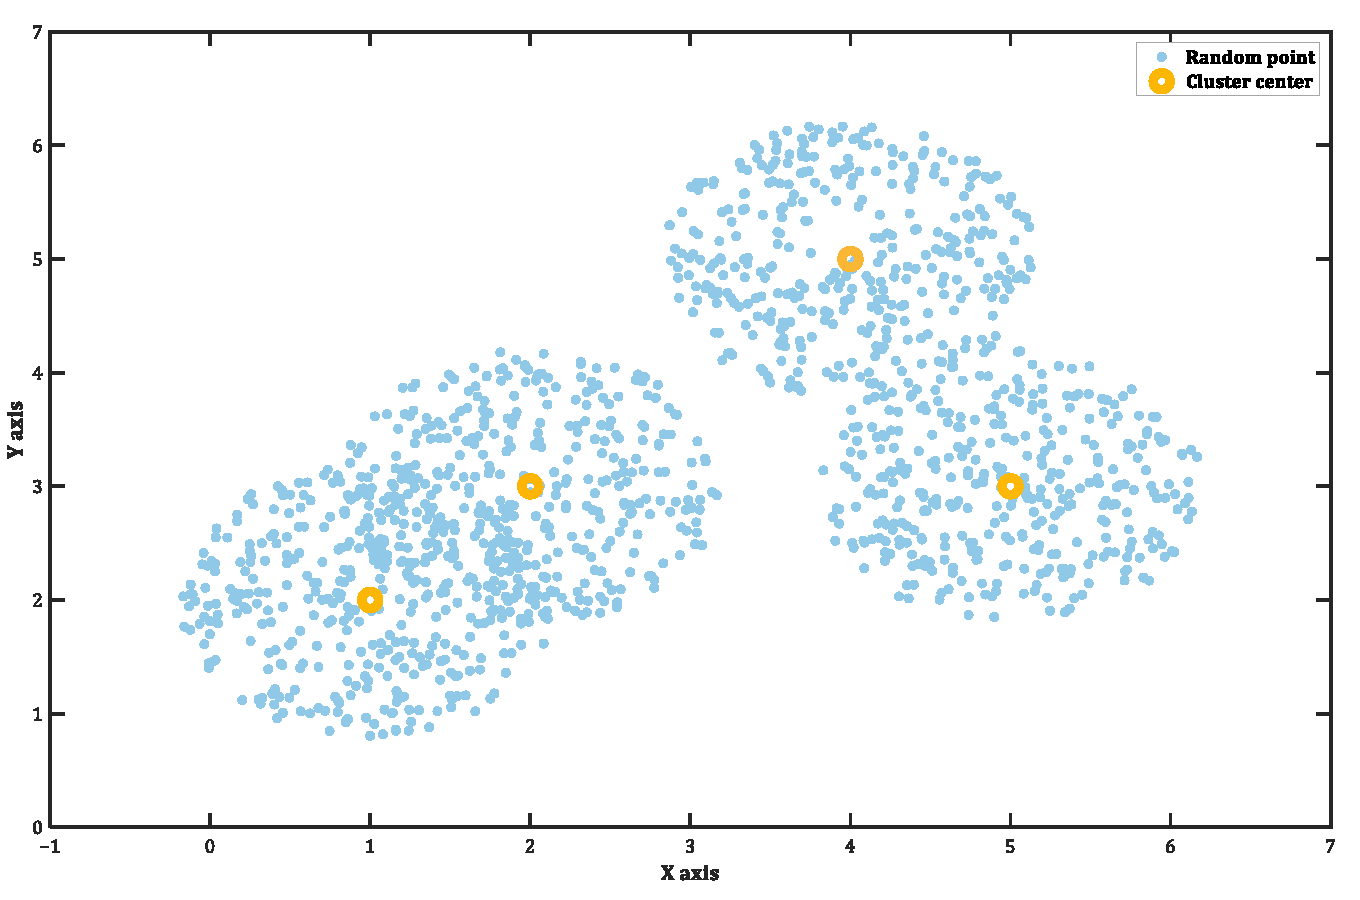
The test method is as follows: select four coordinate points on the coordinate axis, use these selected points as the centers of circles, 300 data points are randomly generated within a radius of 1 around each center of the circle as sample data. The sample comprises four groups of this sample data, as shown in Figure A1.
Figure A1. Sample data.
Energies 18 05305 g0a1
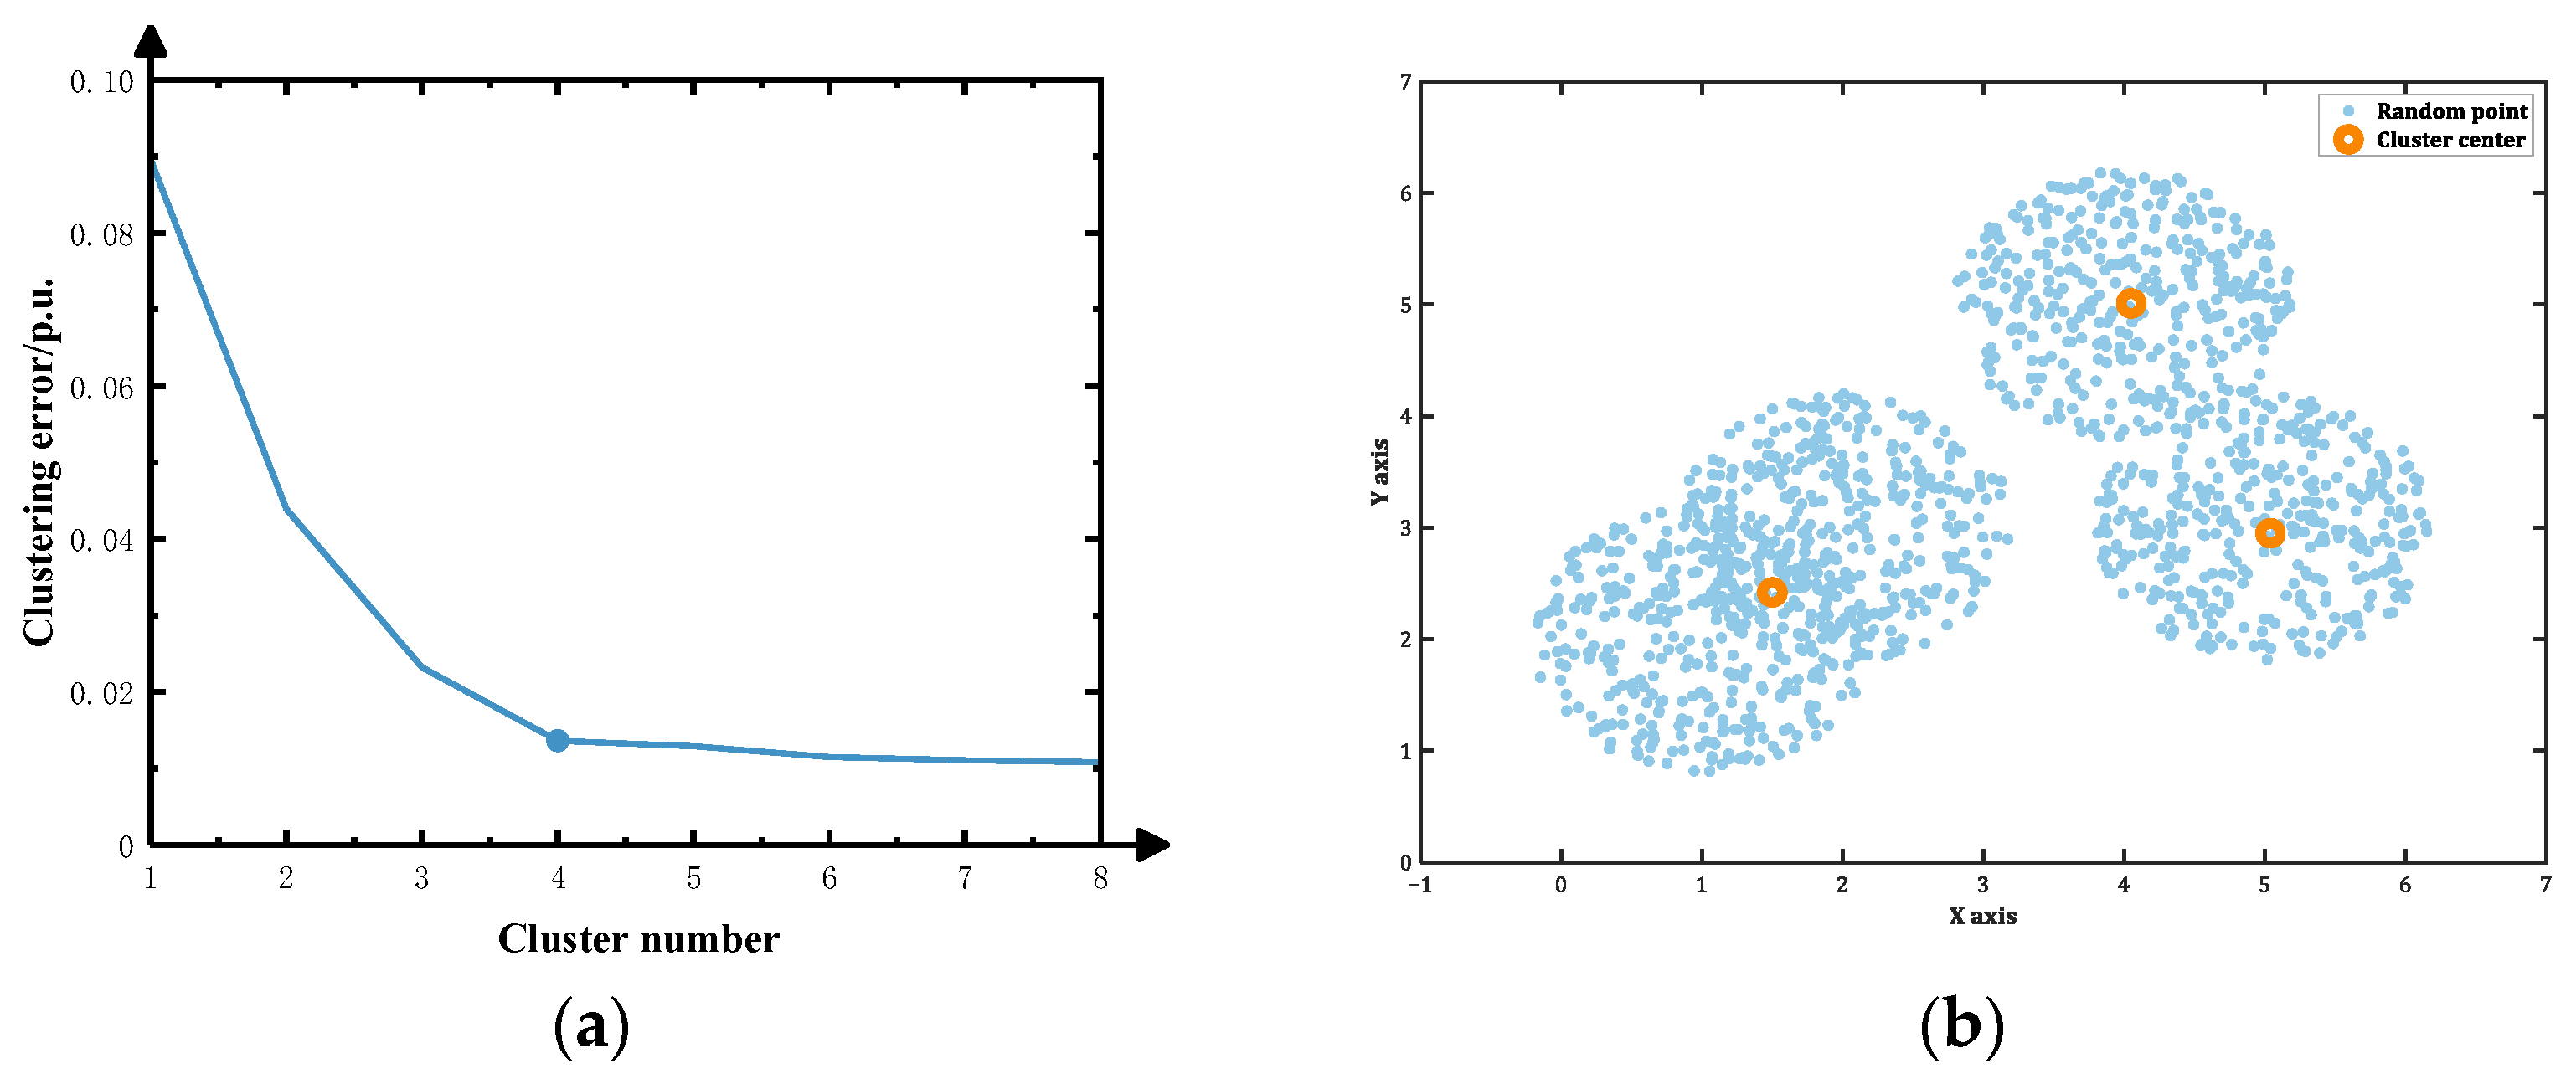
Two clustering algorithms, namely the elbow method [36] which is simple yet effective, and the fuzzy clustering (FCM) algorithm, are compared and analyzed. The test results are presented in Figure A2. In the test using the elbow method, when the optimal clustering number k is less than the optimal classification number, as k increases, the Sum of Squared Errors (SSE) decreases significantly, with a relatively large range of change. This is evident in the k-SSE line relationship diagram, where the line between adjacent points appears steeper. When k exceeds the optimal number of classifications, as k increases, the sum of SSE continues to decrease, but the range of change becomes relatively small. This is reflected in the line relationship chart, where the line between adjacent points appears relatively smooth. The k-SSE (sum of squared errors) line graph exhibits an “elbow” shape, where the k value corresponding to the “elbow” is the optimal number of clusters. As can be seen in Figure A2a, the optimal number of clusters is 4.
Figure A2. Test results. (a) Elbow method result; (b) FCM result.
Energies 18 05305 g0a2
Clearly, in the sample data graph (Figure A1), the data on the right side exhibits a high degree of clustering and clear differentiation, while the data on the left side exhibits a low degree of clustering and lacks clear differentiation. In this case, the optimal number of clusters 3 obtained by FCM (as shown in Figure A2b) does not match the actual optimal number of clusters 4 for the sample data, indicating that the algorithm is not performing well. In contrast, the optimal number of clusters obtained by the elbow rule is still 4, and the clustering effect is satisfactory. Furthermore, PV power data itself is characterized by high data overlap and low differentiation. Therefore, the Elbow Method is a more reliable choice, as it can still accurately cluster data with a low degree of aggregation, thereby determining the optimal number of clusters for PV output scenarios.

References

  1. United Nations Conference on Trade and Development. Review of Maritime Transport 2020 [EB/OL]. Available online: https://unctad.org/publication/review-maritime-transport-2020 (accessed on 8 June 2025).
  2. 2022 Guidelines for the Development of a Ship Energy Efficiency Management Plan (SEEMP). Available online: https://www.imorules.com/MEPC346_78ANN.html (accessed on 8 June 2025).
  3. Tadros, M.; Ventura, M.; Soares, C.G. Review of current regulations, available technologies, and future trends in the green shipping industry. Ocean Eng. 2023, 280, 114670. [Google Scholar] [CrossRef]
  4. Dimopoulos, G.G.; Stefanatos, I.C.; Kakalis, N.M.P. Exergy analysis and optimisation of a marine molten carbonate fuel cell system in simple and combined cycle configuration. Energy Convers. Manag. 2016, 107, 10–21. [Google Scholar] [CrossRef]
  5. Yuan, Y.; Wang, J.; Yan, X.; Li, Q.; Long, T. A design and experimental investigation of a large-scale solar energy/diesel generator powered hybrid ship. Energy 2018, 165, 965–978. [Google Scholar] [CrossRef]
  6. Zhang, W.; Shi, W.; Zhuo, J. Quantum-PSO based system stabilizer optimization for shipboard power system. In Proceedings of the 2016 35th Chinese Control Conference (CCC), Chengdu, China, 27–29 July 2016. [Google Scholar]
  7. Gaber, M.; El-Banna, S.H.; Eldabah, M.; Hamad, M.S. Model and control of naval ship power system by the concept of all-electric ships based on renewable energy. In Proceedings of the 2019 21st International Middle East Power Systems Conference (MEPCON), Cairo, Egypt, 17–19 December 2019. [Google Scholar]
  8. Huang, X.; Sun, S. Application of wind power generation technology in ships. In Proceedings of the 2022 IEEE Asia-Pacific Conference on Image Processing, Electronics and Computers (IPEC), Dalian, China, 14–16 April 2022. [Google Scholar]
  9. Yang, X.; Sun, P.; Yang, C. Multi-Objective Optimization of Capacity of Hybrid Energy Storage Device for Ship Electric Propulsion System. Navig. China 2018, 41, 9–14. [Google Scholar]
  10. Lai, W.; Zhi, Z. Research on Capacity Configuration of Electric Push Ship Energy Storage System. In Proceedings of the 2021 IEEE China Automation Congress (CAC), Beijing, China, 22–24 October 2021. [Google Scholar]
  11. Wen, S.; Lan, H.; Yu, D.C.; Fu, Q.; Hong, Y.; Yu, L.; Yang, R. Optimal sizing of hybrid energy storage sub-systems in PV/diesel ship power system using frequency analysis. Energy 2017, 140, 198–208. [Google Scholar] [CrossRef]
  12. Li, Y.; Liu, X.; Zhao, Y.; He, T.; Zeng, H. Optimization design of hybrid energy storage capacity configuration for electric ship. Energy Rep. 2024, 11, 887–894. [Google Scholar] [CrossRef]
  13. Wu, S.; Li, T.; Xu, F.; Chen, R.; Zhou, X.; Wang, B. Configuration size optimization of gas-electric hybrid power systems on ships considering energy density and engine load response. Energy Convers. Manag. 2024, 301, 118069. [Google Scholar] [CrossRef]
  14. Wu, N.; Zhang, F.; Zhang, F.; Jiang, C.; Lin, J.; Xie, S.; Zhao, Y. An integrated multi-objective optimization, evaluation, and decision-making method for ship energy system. Appl. Energy 2024, 373, 123917. [Google Scholar] [CrossRef]
  15. Fang, S.; Wang, Y.; Gou, B.; Xu, Y. Toward future green maritime transportation: An overview of seaport microgrids and all-electric ships. IEEE Trans. Veh. Technol. 2019, 69, 207–219. [Google Scholar] [CrossRef]
  16. Ju, C.; Wang, P.; Goel, L.; Xu, Y. A two-layer energy management system for microgrids with hybrid energy storage considering degradation costs. IEEE Trans. Smart Grid 2017, 9, 6047–6057. [Google Scholar] [CrossRef]
  17. Fang, S.; Xu, Y.; Li, Z.; Zhao, T.; Wang, H. Two-step multi-objective management of hybrid energy storage system in all-electric ship microgrids. IEEE Trans. Veh. Technol. 2019, 68, 3361–3373. [Google Scholar] [CrossRef]
  18. HassanzadehFard, H.; Tooryan, F.; Collins, E.R.; Jin, S.; Ramezani, B. Design and optimum energy management of a hybrid renewable energy system based on efficient various hydrogen production. Int. J. Hydrogen Energy 2020, 45, 30113–30128. [Google Scholar] [CrossRef]
  19. Xiang, Y.; Yang, X. An ECMS for multi-objective energy management strategy of parallel diesel electric hybrid ship based on ant colony optimization algorithm. Energies 2021, 14, 810. [Google Scholar] [CrossRef]
  20. Xu, L.; Wen, Y.; Luo, X.; Lu, Z.; Guan, X. A modified power management algorithm with energy efficiency and GHG emissions limitation for hybrid power ship system. Appl. Energy 2022, 317, 119114. [Google Scholar] [CrossRef]
  21. Xu, L.; Luo, X.; Wen, Y.; Wu, T.; Wang, X.; Guan, X. Energy management of hybrid power ship system using adaptive moth flame optimization based on multi-populations. IEEE Trans. Power Syst. 2023, 39, 1711–1727. [Google Scholar] [CrossRef]
  22. Schwager, P.; Tiede, L.; Scholz, T.; Gehrke, K.; Vehse, M. Efficiency analysis and performance modelling of a photovoltaic system for cruise ship cabins with battery storage using direct current distribution networks. Int. J. Electr. Power Energy Syst. 2025, 164, 110447. [Google Scholar] [CrossRef]
  23. Villagra, A.; Millet, P. An analysis of PEM water electrolysis cells operating at elevated current densities. Int. J. Hydrogen Energy 2019, 44, 9708–9717. [Google Scholar] [CrossRef]
  24. Deng, Z.; Jiang, Y. Optimal sizing of a wind-hydrogen system under consideration of the efficiency characteristics of electrolysers. Renew. Energy Resour. 2020, 38, 259–266. (In Chinese) [Google Scholar]
  25. Wei, F.; Sui, Q.; Lin, X.; Li, Z.; Chen, L.; Zhao, B.; Owolabi, S.A. Energy control scheduling optimization strategy for coal-wind-hydrogen energy grid under consideration of the efficiency features of hydrogen production equipment. Proc. CSEE 2018, 38, 1428–1439. [Google Scholar]
  26. Faber, J.; Hanayama, S.; Zhang, S.; Pereda, P.; Comer, B.; Hauerhof, E. Fourth IMO GHG Study; International Maritime Organization: London, UK, 2020. [Google Scholar]
  27. Mavromatidis, G.; Orehounig, K.; Carmeliet, J. Design of distributed energy systems under uncertainty: A two-stage stochastic programming approach. Appl. Energy 2018, 222, 932–950. [Google Scholar] [CrossRef]
  28. Bai, K.; Gu, J.; Peng, H.; Zhu, B. Optimal allocation for multi-energy complementary microgrid based on scenario generation of wind power and photovoltaic output. Autom. Electr. Power Syst. 2018, 42, 133–141. [Google Scholar]
  29. Kanellos, F.D.; Prousalidis, J.M.; Tsekouras, G.J. Control system for fuel consumption minimization–gas emission limitation of full electric propulsion ship power systems. Proc. Inst. Mech. Eng. Part M J. Eng. 2014, 228, 17–28. [Google Scholar] [CrossRef]
  30. Shang, C.; Srinivasan, D.; Reindl, T. Economic and environmental generation and voyage scheduling of all-electric ships. IEEE Trans. Power Syst. 2015, 31, 4087–4096. [Google Scholar] [CrossRef]
  31. Wang, F.; Zhang, H.; Li, K.; Lin, Z.; Yang, J.; Shen, X.L. A hybrid particle swarm optimization algorithm using adaptive learning strategy. Inf. Sci. 2018, 436, 162–177. [Google Scholar] [CrossRef]
  32. Kroniger, D.; Madlener, R. Hydrogen storage for wind parks: A real options evaluation for an optimal investment in more flexibility. Appl. Energy 2014, 136, 931–946. [Google Scholar] [CrossRef]
  33. IMO. Studies on the Feasibility and Use of LNG as a Fuel for Shipping; International Maritime Organization: London, UK, 2017; Available online: https://www.uncclearn.org/resources/library/studies-on-the-feasibility-and-use-of-lng-as-a-fuel-for-shipping/ (accessed on 8 June 2025).
  34. Akhavan-Hejazi, H.; Mohsenian-Rad, H. Energy storage planning in active distribution grids: A chance-constrained optimization with non-parametric probability functions. IEEE Trans. Smart Grid 2016, 9, 1972–1985. [Google Scholar]
  35. Ning, C.; You, F. Data-driven stochastic robust optimization: General computational framework and algorithm leveraging machine learning for optimization under uncertainty in the big data era. Comput. Chem. Eng. 2018, 111, 115–133. [Google Scholar] [CrossRef]
  36. Wang, X.; Liu, J.; Liu, Y.; Xu, L.; Ma, T.; Xu, W. Shape clustering algorithm of typical load curves based on adaptive piecewise aggregate approximation. Autom. Electr. Power Syst. 2019, 43, 110–118. [Google Scholar]
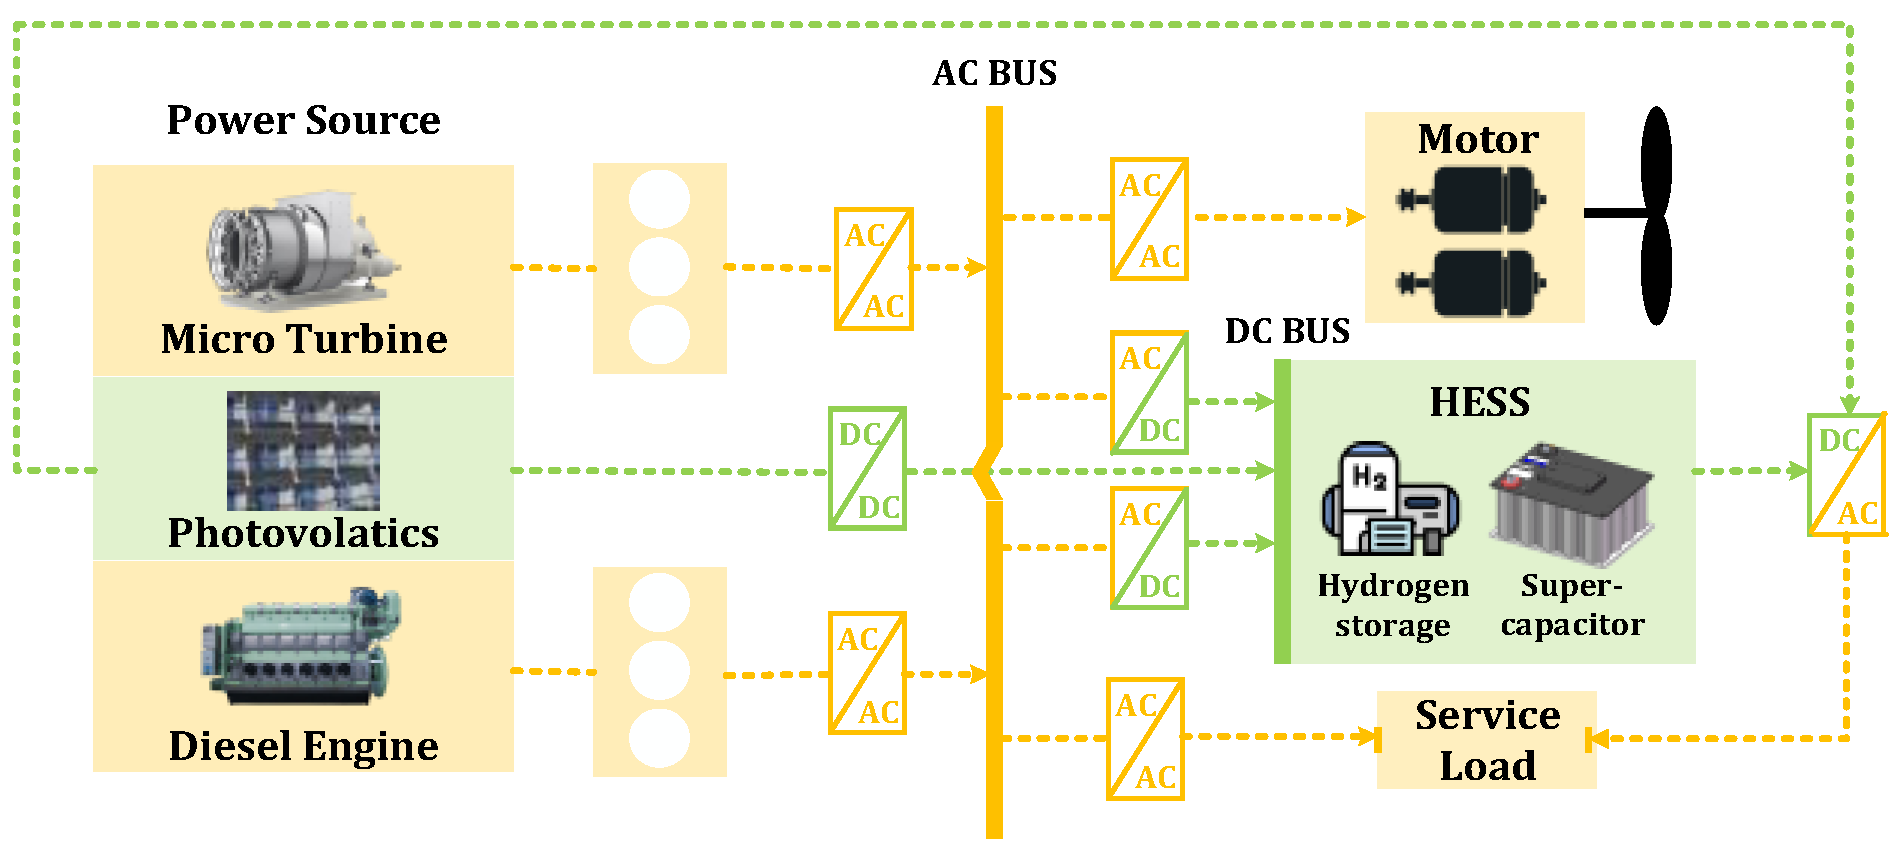
Figure 1. Configuration of a hybrid energy ship power system.
Energies 18 05305 g001
Figure 2. Efficiency characteristic curve of PEM.
Energies 18 05305 g002
Figure 3. Energy storage power allocation method based on device characteristics.
Energies 18 05305 g003
Figure 4. EMS based on the rules in this study.
Energies 18 05305 g004
Figure 5. EMS based on time gradient control and considering dynamic load response.
Energies 18 05305 g005
Figure 6. Comprehensive scenario planning.
Energies 18 05305 g006
Figure 7. The scenario generation results of photovoltaic output by different estimation methods. (a) Nonparametric kernel density estimation; (b) beta distribution. Case 1 refers to the solar power output in summer, Case 2 represents the transition seasons (including spring and autumn), and Case 3 corresponds to winter.
Energies 18 05305 g007
Figure 8. Course of voyage.
Energies 18 05305 g008
Figure 9. Equipment power and daily average EEOI.
Energies 18 05305 g009
Figure 10. Power schedule results. (a) Power schedule result in Case 1; (b) power schedule result in Case 2; (c) power schedule result in Case 3 (Case 1 refers to the solar power output in summer, Case 2 represents the transition seasons (including spring and autumn), and Case 3 corresponds to winter).
Energies 18 05305 g010
Figure 11. SOC in three cases. (a) SOC in Case 1; (b) SOC in Case 2; (c) SOC in Case 3.
Energies 18 05305 g011
Figure 12. Energy storage power distribution results. (a) Energy storage power distribution in Case 1; (b) energy storage power distribution in Case 2; (c) energy storage power distribution in Case 3.
Energies 18 05305 g012
Figure 13. (a) Power scheduling without PV power; (b) SOC without PV power; (c) ESS power distribution without PV power.
Energies 18 05305 g013
Figure 14. The last two subfigures show the effects of EMS.(a) The power traces of the overall power system; (b) the engine, and (c) ESS in Case 2.
Energies 18 05305 g014
Figure 15. Supercapacitor SOC.
Energies 18 05305 g015
Figure 16. Statistical results of 20 simulation experiments conducted in the COMP environment: (a) electrolytic cell input power; (b) hydrogen revenue.
Energies 18 05305 g016
Figure 17. ROE comparison by different algorithms.
Energies 18 05305 g017
Table 1. Optimization variable.
Upper-level optimization variables X i = X 1 , X 2 , X i , C a e q u = C a e l e , C a f u , C a c a b , C a s t h
Lower-level optimization variables x i . s = P g a s . s . t , P d i e s e l . s . t , c e q u = P e l e . s . t , P f u . s . t , P c a b . s . t , Q t . s . t
Table 2. Equipment cost and energy efficiency parameters.
Quantity1234567
EquipmentPVMGDEECHSEFCSC
Cost/MWh382,361550,000400,000878,750122,85644,200823,000
Discount rate6%9.6%9.6%6%6%6%6%
O&M rate (%)511.55151
Lifetime (years)202020520510
Fuel price$/ton-405610----
Efficiency---0.750.950.650.95
Table 3. Equipment operating parameters.
ParameterPVMGDEECHSEFCSC
Maximum capacity (MW)522033036
Maximum power (MW)-0.95 X 2 0.95 X 3 C a e l e C a sth C a f u C a c a b
Minimum power (MW)0000000
Ramp rate limit-+10%, −10%+20%, −10%----
Table 4. Other calculation parameters.
ParameterValue
Ship load factor ξ 1 = 36
EEOI E E O I m a x = 20 g C O 2 / t n . n m
Power factor of MG α 1 = 2.7 , β 1 = 2 , γ 1 = 90
Power factor of DE α 2 = 5.2 , β 2 = 55 , γ 2 = 390
SOC S O C m a x = 95 % , S O C c . m i n = 5 % , S O C h y . m i n = 10 %
Table 5. PV, MG, and DE capacity optimization results.
NamePVMGDE
Capacity (MW)Cost ($)Capacity (MW)Cost ($)Fuel Cost ($)Capacity (MW)Cost ($)Fuel Cost ($)
COMP4.356228,5001.789122,309712,48917.990930,3968,528,447
SP [34]4.398230,6821.803123,225690,82918.025931,5448,679,928
ROP [35]4.512236,6991.815123,963641,80018.350943,6858,997,744
Table 6. HESS equipment capacity optimization results.
NameECHSEFCSC
Capacity (MW)Cost ($)Capacity (kg)Cost ($)Capacity (MW)Cost ($)Capacity (MW)Cost ($)
COMP2.0271,270,5275791,693,5772.09973,7855.0162,551,149
SP2.0041,256,4255931,733,8202.32678,6515.1702,619,079
ROP1.9571,226,3406021,758,8022.47480,2555.1982,633,163
Table 7. ROE under different planning methods.
Planning TypologyCOMPSPROP
ROE (%)8.667.245.15
Disclaimer/Publisher’s Note: The statements, opinions and data contained in all publications are solely those of the individual author(s) and contributor(s) and not of MDPI and/or the editor(s). MDPI and/or the editor(s) disclaim responsibility for any injury to people or property resulting from any ideas, methods, instructions or products referred to in the content.