Abstract
In recent years, the amount of electricity produced by photovoltaic systems in Poland has increased significantly. This paper presents an evaluation of commercial software (PVGIS 5.3, ENERAD, and PVGIS 24) used for simulating energy produced by four photovoltaic installations. The results of the simulation were compared with the real energy production. The installations differ in terms of panel orientation (S, SE, SE-NW), tilt angle (12°, 25°, 37°) and location (roof- or ground-mounted). The average annual electricity production per 1 kW of module power for each installation was as follows: PV1—1104 kWh·kW−1, PV2—1169 kWh·kW−1, PV3—927 kWh·kW−1, and PV4—831 kWh·kW−1. The highest values were recorded for ground-mounted installations facing south. Simulations carried out using computer programs show differences between simulated and real electricity production values of 35–41% for the ENERAD software, 3–13% for the PVGIS 5.3 software, and 3–32% for the PVGIS 24 software. The most accurate forecasts were obtained for the PV2 system in the PVGIS 24 software (MPE 3%, RMSE 12%), and the most unfavorable for the same installation in the ENERAD software (MPE 41%, RMSE 48%).
1. Introduction
The implementation of energy transition is one of the key elements of every country’s policy. It involves developing technologies for obtaining energy from sustainable sources, including renewable energy, thereby contributing to greater climate neutrality by reducing emissions of carbon dioxide and other greenhouse gases [1,2,3,4,5,6]. The European Green Deal regulations adopted by the European Union in 2019 provide for a minimum 55% reduction in net greenhouse gas emissions by 2030 compared to 1990 and for EU countries to achieve climate neutrality by 2050 [7]. In Poland, in 2023, the share of energy obtained from renewable sources in relation to total primary energy was 24.5%, which represented an increase of 5.1% compared to 2019. Solid biofuels (60.1%) and solar energy (7.5%) played a dominant role in energy production from renewable sources. The cumulative annual growth rate of energy production from renewable sources in the period 2019–2023 showed that solar energy recorded the largest increase in share, by 67.1% [8]. This was mainly due to the rapid increase in electricity production from photovoltaic systems (Figure 1). This was driven by the national support program for rooftop photovoltaics and the emergence of larger PV farms [8,9].
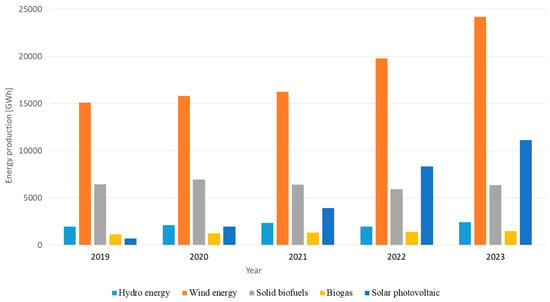
Figure 1.
Production of electricity from renewable energy carriers in 2019–2023 [8].
The legal acts in force in Poland [10,11] define energy standards for buildings and impose the obligation to consider the possibility of using renewable energy sources in their construction or modernization. The most commonly chosen RES systems are heat pumps and photovoltaic installations. The new EU directive on the energy performance of buildings [12] stipulates that from 2029, all new buildings will be constructed to a zero-emission standard. This means that all new residential, public, and commercial buildings will not be allowed to use fossil fuels for energy production, and 100% of their total annual primary energy consumption will have to come from renewable sources. In addition, the Directive requires the installation of solar energy systems on all new buildings by 2030. Furthermore, from 2030, all existing public and commercial buildings that undergo major renovation will have to be equipped with a photovoltaic system.
In Poland, solar energy is mainly used in households. According to the data contained in the Energy Regulatory Office Report [13], the number of micro-installations using solar radiation energy (PV) exceeded 1.5 million in 2024. Most of them (almost 99%) were prosumer installations. However, it should be noted that as a result of the introduction of a changed method of settling prosumers for energy fed into and withdrawn from the grid on 1 March 2022, the number of new photovoltaic installations decreased significantly [14]. The growth rate of micro-installations decreased from approximately 41% in 2022 to 15% in 2023 and to 10% in 2024 (Figure 2).
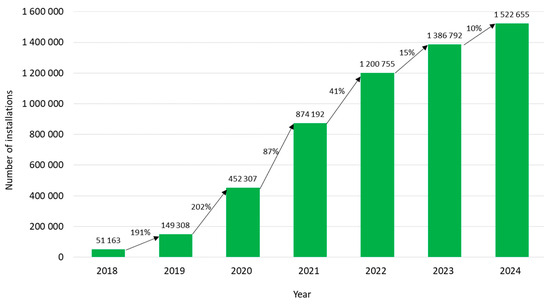
Figure 2.
Number of prosumer micro-installations in 2019–2024 [13].
Decisions regarding the construction of photovoltaic installations are always preceded by a forecast of the electricity production of a given installation in order to determine whether the power and electricity production of the installation will be adequate for the needs of the building. The yield, i.e., the total amount of energy from a photovoltaic installation that will be produced by the system in a given period of time, is influenced by many factors. These can be divided into climatic and technological factors [15,16,17,18].
Climatic factors are primarily related to the geographical location of the building on which the photovoltaic installation is to be installed. It will affect the results obtained depending on sunlight, shade, ambient temperature, and climate change. It is obvious that the more sunlight falls on the photovoltaic panels, the more energy they will produce. Therefore, in regions with high sunlight exposure, such as southern Europe, the panels will be more effective [19,20]. However, it should be taken into account that photovoltaic panels operate most efficiently at moderate temperatures. Excessively high ambient temperatures can cause a drop in their efficiency [21,22,23]. The occurrence of various atmospheric phenomena, such as cloud cover, rain and snowfall, and even air pollution, also have a significant impact on electricity production. Cloud cover and precipitation are associated with a reduction in the amount of solar radiation reaching photovoltaic panels, which directly affects their efficiency. Snow lying on the panels often completely covers them, causing them to stop producing energy [24,25]. Atmospheric pollution, such as smog or dust, can block sunlight from reaching the panels, which also reduces their efficiency [26]. An important factor in increasing the efficiency of energy generation from PV panels is the type of photovoltaic modules. Modern photovoltaic modules retain at least 80% of their original power even after 25 years. In addition, the use of optimizers, trackers, and energy storage systems makes the installation even more efficient [27,28].
Extremely important factors affecting the amount of energy produced are: the location of the panels (roof, ground, facade), the orientation of the panels, and their angle of inclination [29]. It should be remembered that the best place to install panels is on surfaces that are constantly exposed to sunlight, no shadows fall on them. In combination with the orientation of the panels and their angle of inclination, a higher energy yield is often achieved. This is particularly evident when the panels are installed facing south, with an angle of inclination ranging from approximately 20 to 50 degrees, depending on the location and season. A PV module positioned according to the angle of sunlight provides the highest yields (Table 1) [30,31].

Table 1.
Summary of solar energy availability depending on orientation and inclination [30].
Due to the influence of so many factors on the production of energy from photovoltaic cells, it is necessary to plan and calculate the profitability of PV installation construction. There are many pieces of software available on the Internet that can be used to estimate the electricity production of photovoltaic systems. Energy production forecasts often depend on the availability of appropriate tools and data from weather stations, satellites, existing PV systems, or numerical weather forecasts. The yield from a PV installation is a function of relevant weather variables and the characteristics of the system itself. The main factors affecting this yield are the amount of sunlight on the module surface and the ambient temperature. The forecast of electricity production S by photovoltaic installations can be calculated using Formula (1) [30]:
where N—solar radiation on a horizontal surface—data from the PVGIS service, kWh/m2
- wK—coefficient allowing the conversion of sunlight data for an inclined surface of a photovoltaic generator (photovoltaic modules) from sunlight data read from a map, which are for a horizontal surface
- MM—nominal power of modules (PV generator) determined under STC (standard test conditions), i.e., at a temperature of 25 °C and insolation of 1000 W per 1 m2 of module for a period of 1 h. This value can be found in the panel data sheet, kW
- WW—efficiency factor—an indicator that takes into account the level of losses in a photovoltaic installation. In a photovoltaic installation, there are: cable losses—1%, inverter losses—3–7%, module losses due to temperature—4–8%, losses due to low solar radiation—1–3%, losses due to shading and dirt—1–5%, losses due to current mismatch of modules—1%, losses on shunt diodes—0.5%
- IR—standard solar radiation intensity at which photovoltaic modules are tested, kW/m2.
There are few studies comparing the real electricity production of photovoltaic panels with the production predicted by various types of software [29,32]. This paper presents the results of real electricity production for four photovoltaic installations differing in panel orientation (S, SE-NW, SE), tilt angle (12°, 25°, 37°) and location (roof-mounted, ground-mounted). The results were compared with the results of simulations carried out using PVGIS 5.3, PVGIS 24, and ENERAD software.
2. Materials and Methods
2.1. Research Object
The research object includes four photovoltaic installations located in the Lubelskie voivodeship. The location and technical parameters of the analyzed installations are presented in Figure 3 and Table 2.
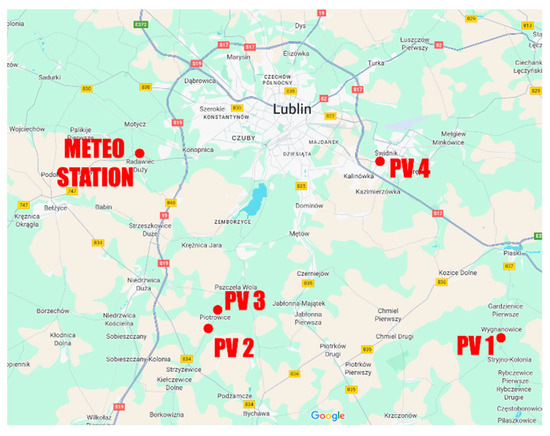
Figure 3.
Location of the analyzed photovoltaic installations and meteorological station.

Table 2.
Technical parameters of analyzed PV systems.
The PV1 installation is located 40 km south-east of the weather station. The installation was fitted in November 2021. There are no elements in the immediate vicinity that could obscure the PV cells. To carry out the analyses the average electricity production obtained from three years of operation of the installation was used.
The PV2 installation is located 20 km south-east of the weather station. The installation was fitted in April 2022. There are no elements in the vicinity of the building that could obscure the PV cells. To carry out the analyses the average electricity production obtained from two years of operation of the installation was used.
The PV3 installation is located 20 km south-east of the weather station. The installation was fitted in September 2021. There are no other elements in the immediate vicinity that could obscure the PV cells. To carry out the analyses the average electricity production obtained from three years of operation of the installation was used.
The PV4 installation is located 20 km east of the weather station. The installation was fitted in September 2019. There are elements in the immediate vicinity that could obscure the PV cells. To carry out the analyses, the average electricity production obtained from five years of operation of the installation was used.
In order to illustrate the climatic conditions prevailing in the vicinity of the analyzed installations, Table 3 presents meteorological data from the Lublin Radawiec weather station. This station constitutes a meteorological database used for simulation calculations. The data on average monthly minimum and maximum values of temperature (T) and wind speed (V) were acquired from the Institute of Meteorology and Water Management (IMGW) [33], data on the number of hours of sunshine per day (DS) and month (MS) come from the meteorological service [34] and data on average global horizontal irradiation (IR) from the Sarah 3 database [35]. All data are average values for the years 2005–2023.

Table 3.
Average monthly weather data in Lublin Radawiec weather station in year 2005–2023.
The lowest air temperatures are observed in the winter months: December, January, and February. These months also have the fewest hours of sunshine and the lowest solar radiation. The warmest months are June, July, and August, which also experience the greatest solar radiation. During these months, days are significantly longer than in winter, which results in a greater number of sunny hours per day. In May, despite its lower air temperatures than in September, there are more hours of sunshine and greater solar radiation.
2.2. Software Used for Forecasting Electricity Production
Data on real energy production by photovoltaic systems was compared with forecasts obtained through simulations by using three types of software: PVGIS 5.3 [36], the ENERAD photovoltaic calculator [37], and PVGIS 24 [38] software. These programs allow us to obtain data on the predicted energy production of photovoltaic systems anywhere in the world. They are available free of charge via websites. The data on insolation and climatic conditions come from the SARAH 2 (ENERAD software) or SARAH 3 (PVGIS 5.3 and PVGIS 24) databases. In each piece of software, the following data must be entered in order to obtain results:
- location of the photovoltaic system—by selecting a location on the map or entering an address
- mounting position
- slope of PV modules,
- azimuth (orientation) of PV modules
- estimated system losses.
In PVGIS 5.3 and ENERAD software, total losses for the entire system are taken into account. For PV1, PV2, and PV3 installations, losses of 14% were assumed, and for PV4 installations—17%. These losses included: cable losses—1%, inverter losses—2%, module losses due to temperature—5%, losses due to low solar radiation—3%, losses due to shading and dirt—2–5%, losses due to current mismatch of modules—1%.
Losses in the PVGIS 24 software are divided into three types: cable losses—1% (the distance between the inverter and the photovoltaic panels is less than 30 m), inverter losses—2% (according to the inverter manufacturer’s data), and PV losses—1% (according to the software manufacturer’s recommendations). However, regardless of the loss values entered, the program additionally estimates the total system losses. For the PV1 installation, it estimated losses at 9.79%, for PV2—9.79%, for PV3—13.83%, for PV4—10.45%.
In PVGIS 5.3, one must also enter information about the type of photovoltaic panels: crystalline silicon cells, thin film modules made from CIS or CIGS, thin film modules made from Cadmium Telluride CdTe, and the installed peak power of the system. An advantage of the program is that it enables us to perform simulations for tracking PV installations. The program window is shown in Figure 4.
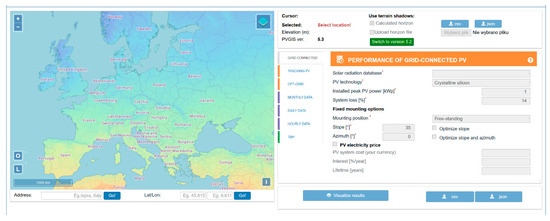
Figure 4.
PVGIS 5.3 window.
When entering data into the ENERAD software, it is necessary to specify the current or planned electricity consumption. The advantage of the application is that it can calculate the energy storage capacity. The disadvantage of the program is that it can only be used for installations with a maximum power of 10.7 kW. The program window is shown in Figure 5.
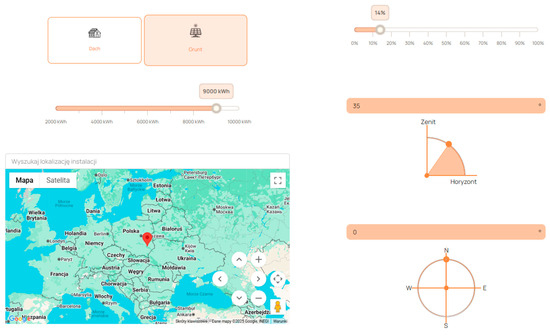
Figure 5.
ENERAD window.
The PVGIS24 software is an extended version of PVGIS 5.3. In addition to the data indicated above, the peak power of the installation must also be specified in order to perform the simulation. Its greatest advantage is the ability to simulate installations divided into sections with different azimuths and module tilt angles. This is particularly useful for buildings with small roof areas, where it is necessary to place PV modules in two different orientations. The software window is shown in Figure 6.
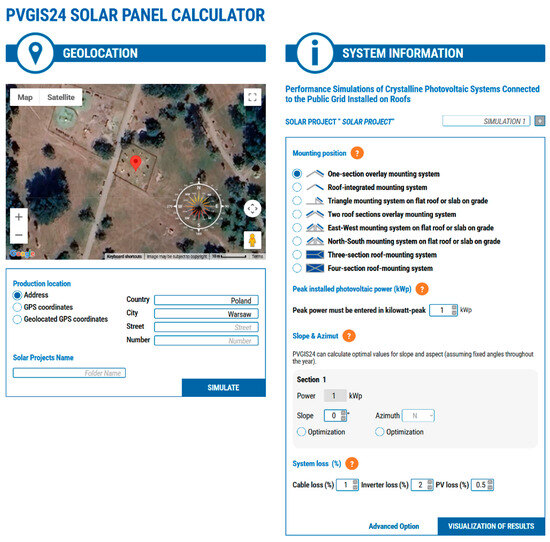
Figure 6.
PVGIS24 window.
The calculation results in all programs include annual and monthly average values for energy production and insolation.
2.3. Assessment of the Correlation of Real and Simulated Results
The assessment of the correlation between the real electricity production results and the values simulated by individual programs was carried out using selected statistical analysis tools. For this purpose, the mean percentage error (MPE) and the root mean square error (RMSE) were used. They were calculated using Equations (2) and (3):
where
- Ri—real electricity production, kWh
- Si—simulated electricity production, kWh
- n—sample size,
- —average real electricity production, kWh
3. Results and Discussion
3.1. Real Electricity Production by the Studied PV Installations
Table 4 shows the monthly electricity production of the PV installations analyzed each year. Figure 7 shows the average values for all years.

Table 4.
Monthly electricity production by PV installations.
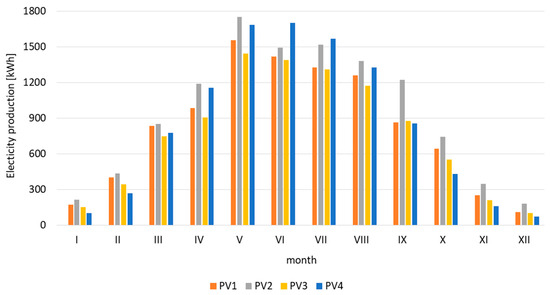
Figure 7.
Average monthly values of electricity production by the analyzed installations.
Energy produced by photovoltaic systems is highly dependent on climate and seasons. The lowest electricity production is observed during the winter months, when air temperatures are lower, when there are only a few sunny days, and snow often covers the panels. The months from May to August are the period of the highest solar radiation, which results in the highest electricity production.
When analyzing the results of monthly energy produced by photovoltaic installations, we can see that May in 2023 and 2024 was much sunnier than the average solar radiation (IR) values indicate. It is during these months that the highest electricity production occurred, while weather data indicate that June and July had the highest solar radiation.
The PV1 installation reached its maximum annual electricity production in 2022. It amounted to 9992 kWh, with an average monthly production of 833 kWh. The highest yield was recorded in May 2024 and amounted to 1724 kWh (17% of total electricity production in 2024). The lowest energy production occurred in December 2022: 92 kWh (0.9% of total production in 2022). Between April and September, the installation produced 75% of the average annual electricity production.
In the case of the PV2 installation, the highest electricity production occurred in 2024 and amounted to 11,502 kWh, with an average monthly production of 958 kWh. The highest yield occurred in May 2024 and amounted to 1884 kWh (16% of electricity production in 2024). The lowest energy production occurred in December 2023—124 kWh (1.1% of total annual production in 2023). Between April and September, the installation produced 76% of the average annual electricity production.
The PV3 installation reached its maximum electricity production in 2022, amounting to 9543 kWh, with an average monthly production of 795 kWh. The highest yield was recorded in June 2022 and amounted to 1598 kWh (17% of electricity production in 2022). The lowest energy production was recorded in December 2022: 74 kWh (0.8% of total annual production in 2022). Between April and September, the installation produced 78% of the average annual energy production.
The PV4 installation reached its maximum electricity production in 2020. It amounted to 11,001 kWh, with an average monthly production of 917 kWh. The highest yield was recorded in May 2024 and amounted to 1804 kWh (19% of total electricity production in 2024). The lowest energy production was recorded in January 2021: 49 kWh (0.5% of total annual production in 2021). Between April and September, the installation produced 82% of the average annual electricity production.
Due to the different total power of PV modules in individual installations, the electricity production was recalculated per 1 kWp of installed PV modules in the installation (Table 5). This will allow the efficiency of the photovoltaic system to be assessed.

Table 5.
Average monthly final yield of photovoltaic installation.
The PV1 and PV2 installations achieved very similar annual yields per 1 kWp of installed PV modules. Both installations are mounted on the ground, at the same angle (25°) and facing the same direction (S). The PV3 installation achieved a slightly lower yield compared to PV1 and PV2. This is due to the installation of some of the panels facing east, which results in less sunlight exposure. The PV4 installation achieved the lowest electricity production per 1 kWp of installed modules because the modules are mounted at a lower angle of inclination (12°) than generally recommended. In addition, there are elements in their vicinity that cause shading of the installation.
3.2. Comparison of Simulation Results with Real Data
For each PV installation analyzed, electricity production simulations were performed using three programs available free of charge on the Internet. The results are presented in Table 6 and Figure 8, Figure 9, Figure 10 and Figure 11. The graphs on the left show the monthly electricity production of individual installations, while the graphs on the right show the electricity production per 1 kWp of installed PV modules. In the case of the PV4 installation, it was not possible to use the ENERAD software because the power of the simulated installations was limited to 10.7 kW.

Table 6.
Real and simulated values of electricity production by PV installations.

Figure 8.
The measured and simulated values of the monthly electricity production (a) and final yield (b) of the PV1 system.

Figure 9.
The measured and simulated values of the monthly electricity production (a) and final yield (b) of the PV2 system.

Figure 10.
The measured and simulated values of the monthly electricity production (a) and final yield (b) of the PV3 system.

Figure 11.
The measured and simulated values of the monthly electricity production (a) and final yield (b) of the PV4 system.
When analyzing the data, we can see that real electricity production in May was higher than those simulated. This was caused by high solar radiation levels in 2023 and 2024.
In addition, a statistical analysis was performed for each installation to assess the consistency of the measurement results and the forecasts obtained. The results are presented in Table 7.

Table 7.
Values of forecasting errors for the analyzed and simulated installations.
The assessment of the correlation of simulated and real values showed the best match of results for simulations performed by using PVGIS 5.3 for installations PV1, PV3, and PV4, and by using PVGIS 24 for installation PV2. In the case of the forecast made by the ENERAD software, the program significantly underestimated energy production in comparison to real values for all PV installations.
The lowest MPE and RMSE were obtained for simulations by using PVGIS 24 software for the PV2 installation (slope 25°, orientation S). The highest MPE and RMSE were obtained for the same installation when simulating the installation with ENERAD software.
4. Conclusions
- The simulations conducted indicate the greatest consistency between the simulation results and real data obtained by using the PVGIS 5.3 software. For installations PV1. PV3. and PV4. the lowest MPEs were obtained. indicating the smallest deviation of simulated values from real data.
- The ENERAD software significantly underestimated the electricity production for the analyzed PV installations. The differences between the predicted and real values range between 35% and 41%. This may be due to the fact that the program uses the outdated SARAH2 meteorological database or because of the calculation algorithm used. It is questionable whether the values obtained in this program can be used for preliminary analysis of the profitability of installing the systems.
- Based on the results obtained, it can be concluded that the PVGIS 5.3 software best reflects the real conditions of the analyzed PV installations and can be used as a tool for forecasting the annual electricity production of photovoltaic systems. The simulations obtained can be helpful in designing PV installations and in assessing the profitability of their installation.
- The advantage of PVGIS24 software is its versatility. It allows us to conduct simulations for more complex installations whose PV modules face different directions.
Author Contributions
Conceptualization, E.H., A.Ż., and G.D.; methodology, A.Ż., G.D.; simulation, E.H.; validation, E.H., A.Ż., and G.D.; formal analysis, E.H., A.Ż., and G.D.; writing—original draft preparation, E.H.; writing—review and editing, A.Ż.; visualization, G.D.; supervision, A.Ż.; project administration, E.H.; funding acquisition, E.H., and A.Ż. All authors have read and agreed to the published version of the manuscript.
Funding
This research received no external funding.
Data Availability Statement
The original contributions presented in this study are included in the article. Further inquiries can be directed to the corresponding author.
Conflicts of Interest
The authors declare no conflicts of interest.
References
- Owusu, P.A.; Asumadu-Sarkodie, S. A Review of Renewable Energy Sources. Sustainability Issues and Climate Change Mitigation. Cogent Eng. 2016, 3, 1167990. [Google Scholar]
- Kim, H.; Park, S.; Lee, J. Is renewable energy acceptable with power grid expansion? A quantitative study of South Korea’s renewable energy acceptance. Renew. Sustain. Energy Rev. 2021, 139, 110584. [Google Scholar] [CrossRef]
- Keramitsoglou, K.M.; Mellon, R.C.; Tsagkaraki, M.I.; Tsagarakis, K.P. Designing a logo for renewable energy sources with public participation: Empirical evidence from Greece. Renew. Energy 2020, 153, 1205–1218. [Google Scholar] [CrossRef]
- Karasmanaki, E.; Tsantopoulos, G. Exploring future scientists’ awareness about and attitudes towards renewable energy sources. Energy Policy 2019, 131, 111–119. [Google Scholar] [CrossRef]
- Karytsas, S.; Theodoropoulou, H. Socioeconomic and demographic factors that influence publics’ awareness on the different forms of renewable energy sources. Renew. Energy 2014, 71, 480–485. [Google Scholar] [CrossRef]
- Roddis, P.; Ziv, G.; Dallimer, M.; Carver, S.; Norman, P.D. The role of community acceptance in planning outcomes for onshore wind and solar farms: An energy justice analysis. Appl. Energy 2018, 226, 353–364. [Google Scholar] [CrossRef]
- European Commission, Directorate-General for Research and Innovation. Proposed Mission: 100 Climate-Neutral Cities by 2030—By and for the Citizens. Report of the Mission Board for Climate-Neutral and Smart Cities; European Union: Luxembourg, 2020; Available online: https://ec.europa.eu/info/publications/100-climate-neutral-cities-2030-and-citizens_en (accessed on 14 June 2025).
- Statistic Poland. Energy from Renewable Sources in 2023. Statistical Analyses; Statistic Poland: Warsaw, Rzeszow, 2024. Available online: https://stat.gov.pl/en/topics/environment-energy/energy/energy-from-renewable-sources-in-2023.9.3.html (accessed on 14 June 2025).
- Gnatowska, R.; Moryń-Kucharczyk, E. The Place of Photovoltaics in Poland’s Energy Mix. Energies 2021, 14, 1471. [Google Scholar] [CrossRef]
- Act of 7 July 1994—Building Law (Dz. U. 2025 r. item 418). Available online: https://isap.sejm.gov.pl/isap.nsf/download.xsp/WDU20250000418/U/D20250418Lj.pdf (accessed on 10 July 2025). (In Polish)
- Ministry of Development and Technology. Regulation of the Minister of Infrastructure of 12 April 2002 on Technical Conditions to be Met by Buildings and Their Location (Dz.U. 2022 Item 1225 as Amended); Ministry of Development and Technology: Warsaw, Poland, 2024. (In Polish) [Google Scholar]
- European Union. Directive (EU) 2024/1275 of the European Parliament and of the Council of 24 April 2024 on the energy performance of buildings. Off. J. Eur. Union 2024. Available online: https://eur-lex.europa.eu/eli/dir/2024/1275/oj/eng (accessed on 10 July 2025).
- Energy Regulatory Office. Report 2025 Electricity Generated from Renewable Energy Sources in Micro-Installations (Including by Prosumers) and Introduced into the Distribution Network in 2024 (Article 6a of the Renewable Energy Sources Act) Electricity Generation in Micro-Installations in 2024. Available online: https://www.ure.gov.pl (accessed on 14 June 2025). (In Polish)
- Niechaj, M. Effective use of photovoltaic systems i polish conditions. J. Ecol. Eng. 2016, 17, 147–154. [Google Scholar] [CrossRef][Green Version]
- Ceran, B.; Szczerbowski, R. Techno-economic analysis of a photovoltaic installation. Bull. Miner. Energy Econ. Res. Inst. Pol. Acad. Sci. 2017, 98, 15–26. [Google Scholar][Green Version]
- Janke, J.R. Multicriteria GIS modeling of wind and solar farms in Colorado. Renew. Energy 2010, 35, 2228–2234. [Google Scholar] [CrossRef]
- Leonarczyk, J. Results of the seasonal study on energetic output of photovoltaic installation with 668Wpeak power. Probl. Agric. Eng. 2013, 1, 151–160. [Google Scholar]
- Eleftheriadis, I.; Anagnostopoulou, E. Identifying barriers in the diffusion of renewable energy sources. Energy Policy 2015, 80, 153–164. [Google Scholar] [CrossRef]
- Zhu, J.; Cui, Y. Photovoltaics: More solar cells for less. Nat. Mater. 2010, 9, 183–184. [Google Scholar] [CrossRef]
- Yao, W.; Zhang, C.; Wang, X.; Zhang, Z.; Li, X.; Di, H. A new correlation between global solar radiation and the quality of sunshine duration in China. Energy Convers. Manag. 2018, 164, 579–587. [Google Scholar] [CrossRef]
- Matuszczyk, P.; Popławski, T.; Flasza, J. The influence of solar radiation and temperature module on selected parameters and the power rating of photovoltaic panels. Przegląd Elektrotech. 2015, 91, 159–162. [Google Scholar]
- Canales, F.A.; Jadwiszczak, P.; Jurasz, J.; Wdowikowski, M.; Ciapała, B.; Kazmierczak, B. The impact of long-term changes in air temperature on renewable energy in Poland. Sci. Total Environ. 2020, 729, 138965. [Google Scholar] [CrossRef] [PubMed]
- Korsavi, S.S.; Zomorodian, Z.S.; Tahsildoost, M. Energy and economic performance of rooftop PV panels in the hot and dry climate of Iran. J. Clean. Prod. 2018, 174, 1204–1214. [Google Scholar] [CrossRef]
- Głuchy, D.; Kurz, D.; Trzmiel, G. The impact of wind and snow on photovoltaic installations in Poland. Pozn. Univ. Technol. Acad. J. Electr. Eng. 2013, 74, 253–260. [Google Scholar]
- Heidari, N.; Gwamuri, J.; Townsend, T.; Pearce, J.M. Impact of Snow and Ground Interference on Photovoltaic Electric System Performance. IEEE J. Photovolt. 2015, 5, 1680–1685. [Google Scholar] [CrossRef]
- Baranes, E.; Jacqmin, J.; Poudou, J.C. Non-renewable and intermittent renewable energy sources: Friends and foes? Energy Policy 2017, 111, 58–67. [Google Scholar] [CrossRef]
- Szczerbowski, R. Photovoltaic systems—Technical and economic aspects. Przegląd Elektrotech. 2014, 90, 31–36. [Google Scholar]
- Knutel, B.; Pierzyńska, A.; Dębowski, M.; Bukowski, P.; Dyjakon, A. Assessment of Energy Storage from Photovoltaic Installations in Poland Using Batteries or Hydrogen. Energies 2020, 13, 4023. [Google Scholar] [CrossRef]
- Akpolat, A.N.; Dursun, E.; Kuzucuoglu, A.E.; Yang, Y.; Blaabjerg, F.; Baba, A.F. Performance analysis of a Grid-connected rooftop solar photovoltaic system. Electronics 2019, 8, 905. [Google Scholar] [CrossRef]
- Szymański, B. Instalacje Fotowoltaiczne, 4th ed.; GLOBEnergia: Krakow, Poland, 2017; ISBN 978-83-64339-00-4. (In Polish) [Google Scholar]
- Ilba, M. Energia Słoneczna. Nasłonecznienie i Praktyczna Efektywność Mikroinstalacji Fotowoltaicznych na Terenie Polski; CeDeWu: Warszawa, Poland, 2022; ISBN 978-83-8102-765-6. (In Polish) [Google Scholar]
- Kymakis, E.; Kalykakis, S.; Papazoglou, T.M. Performance Analysis of a Grid Connected Photovoltaic Park on the Island of Crete. Energy Convers. Manag. 2009, 50, 433–438. [Google Scholar] [CrossRef]
- Instytut Meteorologii i Gospodarki Wodnej—Państwowy Instytut Badawczy. Available online: https://www.imgw.pl/ (accessed on 20 July 2025).
- WeatherOnline—Meteorological Services. Available online: https://www.weatheronline.pl (accessed on 20 July 2025).
- The Official Portal for European Data. Available online: https://data.europa.eu (accessed on 20 July 2025).
- European Commission. JRC Photovoltaic Geographical Information System (PVGIS 5.3). Available online: https://re.jrc.ec.europa.eu/pvg_tools/en/ (accessed on 25 July 2025).
- Enerad. Photovoltaic Calculator. Available online: https://enerad.pl/kalkulator-fotowoltaiki/ (accessed on 25 July 2025).
- PVGIS. Solar Panel Calculator. PVGIS 24. Available online: https://pvgis.com (accessed on 25 July 2025).
Disclaimer/Publisher’s Note: The statements, opinions and data contained in all publications are solely those of the individual author(s) and contributor(s) and not of MDPI and/or the editor(s). MDPI and/or the editor(s) disclaim responsibility for any injury to people or property resulting from any ideas, methods, instructions or products referred to in the content. |
© 2025 by the authors. Licensee MDPI, Basel, Switzerland. This article is an open access article distributed under the terms and conditions of the Creative Commons Attribution (CC BY) license (https://creativecommons.org/licenses/by/4.0/).