1. Introduction
The planet’s population growth implies an increase in energy consumption; however, as it increases, natural resources become depleted. Humanity has been developing technologies that allow the use of renewable resources; the sun promises to be an inexhaustible source that must be harnessed; currently, there are photovoltaic and solar thermal technologies that allow the use of this resource [
1,
2,
3,
4,
5]. These technologies present some challenges, the main one being that they must be oriented so that the rays fall perpendicularly on a flat surface to achieve maximum performance.
The theory of solar radiation holds that the position of the sun changes continuously due to the rotation of the Earth on its axis and its orbit around the sun [
6]. These movements generate daily and seasonal variations in the solar path, influencing the angle of incidence and the amount of solar radiation that a collector can receive.
For example, during the summer solstice, the sun reaches its highest point in the sky in the corresponding hemisphere, providing the maximum amount of direct radiation. In contrast, during the winter solstice, the sun is at its lowest point, reducing the amount of direct radiation and increasing the proportion of diffuse radiation. These seasonal changes are especially relevant in intertropical regions, where the position of the sun can vary significantly throughout the year, affecting the efficiency of solar collectors if they are not properly adjusted to follow the solar path.
The geometry of planet Earth plays a fundamental role in capturing solar energy. The inclination of the Earth’s axis and the spherical shape of the Earth influence the amount and angle of incidence of solar radiation that reaches different parts of the planet. The theory of solar geometry postulates that the amount of solar energy received by a surface depends directly on the angle of incidence of the sun’s rays [
7]. This angle, in turn, varies with latitude and time of year due to the Earth’s axial tilt.
Therefore, at higher latitudes, the sun’s rays strike the surface more obliquely, which reduces the intensity of the solar radiation received. In contrast, in regions close to the equator, solar radiation strikes almost perpendicularly during most of the year, which makes the collection of solar energy more efficient [
8]. This inverse relationship between latitude and angle of incidence underlines the importance of adapting the orientation and inclination of solar collectors according to geographical location to optimize their efficiency.
Relevant studies have shown that if one of the surfaces of a collector is located in the Northern Hemisphere of the planet, it must be oriented towards the south, and if the collector surface is located in the Southern Hemisphere, it must be oriented towards the North [
9,
10]. Tonatiuh, SolTrace, TracePro, and CRS4-2 are some of the optical simulation tools used to analyze the relationship between the collector inclination angle and the latitude [
11,
12]; the results have allowed us to estimate the energy efficiency based on the inclination angles without the need to use physical devices or installations. Among the most used tools is SolTrace; some authors have conducted research using this tool to determine the exact position of the receiver, a specific case in the design of a heliostat park [
13]. In addition, some authors have studied the incorporation of tracking elements obtaining increases in efficiency up to 37% [
14].
However, the research analyzes lightning behavior in areas far from the equator, so it is not entirely relevant for areas located in the heart of the tropics. In these areas, the way lightning strikes varies according to latitude; if the latitude is close to the equator, the collectors do not need to be permanently located, as indicated by the manufacturers. Several literature searches were conducted to determine the optimal orientation of solar collectors installed from the Northern to the Southern Hemisphere. A search of the Scopus database using the search equations (“solar collect” OR “solar heater”) AND (“efficiency” OR “performance” OR “effectiveness”) AND (“intertropical zone” OR “low latitude” OR “tropical region” OR “between 23.5 degrees north and south”) yielded 34 articles. Most of these studies were conducted outside the tropics.
A Review of Previous Studies on Solar Panel Orientation in Intertropical Zones
A review of previous studies on solar panel orientation in intertropical zones was conducted. The search, performed using the Scopus database, focused on identifying solutions to optimize solar energy resources in regions near the equator. The following keywords were used: (“orientation solar”) AND (“solar panel”) AND (“Ecuador” OR “Peru” OR “Brazil” OR “Equatorial Guinea”). The studies analyzed revealed that in countries like Ecuador, Peru, and Brazil [
15,
16], the use of solar trackers can increase energy production by up to 37% compared to static systems. However, it was also found that the efficiency of these systems can be reduced by up to 14% due to environmental factors such as cloud cover, rain, and altitude [
14]. Regarding panel tilt, studies suggest that in low latitudes near the equator, the optimal angle for self-cleaning ranges from 10° to 19° relative to the horizontal [
17,
18]. A significant knowledge gap remains, as these studies do not address biannual changes in solar panel orientation.
Although research exists on flat-plane collectors and the relationship between latitude and efficiency, unfortunately, there is very limited research investigating their behavior across the latitude range between 23.5 degrees South and 23.5 degrees North. The objective of this research is to address this gap by comparing the energy potential of solar collectors with fixed and moving flat surfaces located from latitudes 23° South to 23° North, passing through the equator, during the 365 days of the year. Monte Carlo simulation (MCS) was implemented to include each latitude one degree at a time in terms of efficiency for each of the following scenarios: (i) a fixed, immobile flat surface; (ii) a flat surface that changes position at different times of the year; and (iii) a flat surface that rotates in zenith and azimuthal angles, simulating the apparent tracking of the sun.
2. Methods
The efficiency of solar collectors is a crucial aspect for the utilization of solar energy, especially in the context of the growing demand for renewable energy sources. Efficiency is defined as the collector’s ability to convert received solar radiation into usable energy. This process depends on various factors, among which are the orientation, inclination, and geographical location of the collector stand out. Understanding these factors and their interrelationships is essential to optimize the performance of solar systems, especially in intertropical regions where solar variability is significant throughout the year.
Finally, the location of solar collectors, both in terms of altitude and orientation, is crucial to maximize their efficiency. Solar geometry theory and solar radiation theory converge in the recommendation to adjust the tilt and orientation of solar collectors to align with the solar path and the specific latitude of the installation site. In the Northern Hemisphere, for example, collectors must be oriented towards the south to capture the greatest amount of solar radiation. In the Southern Hemisphere, the optimal orientation is north.
In addition to orientation, the altitude of the installation site also affects the efficiency of solar collectors [
19]. At higher altitudes, the atmosphere is thinner, allowing greater transmission of solar radiation and reducing the scattering of solar rays. This implies that in mountainous or high-altitude regions, solar collectors can be more efficient due to the greater intensity of solar radiation received. For the present research, the simulation was performed assuming an altitude of 0 at sea level.
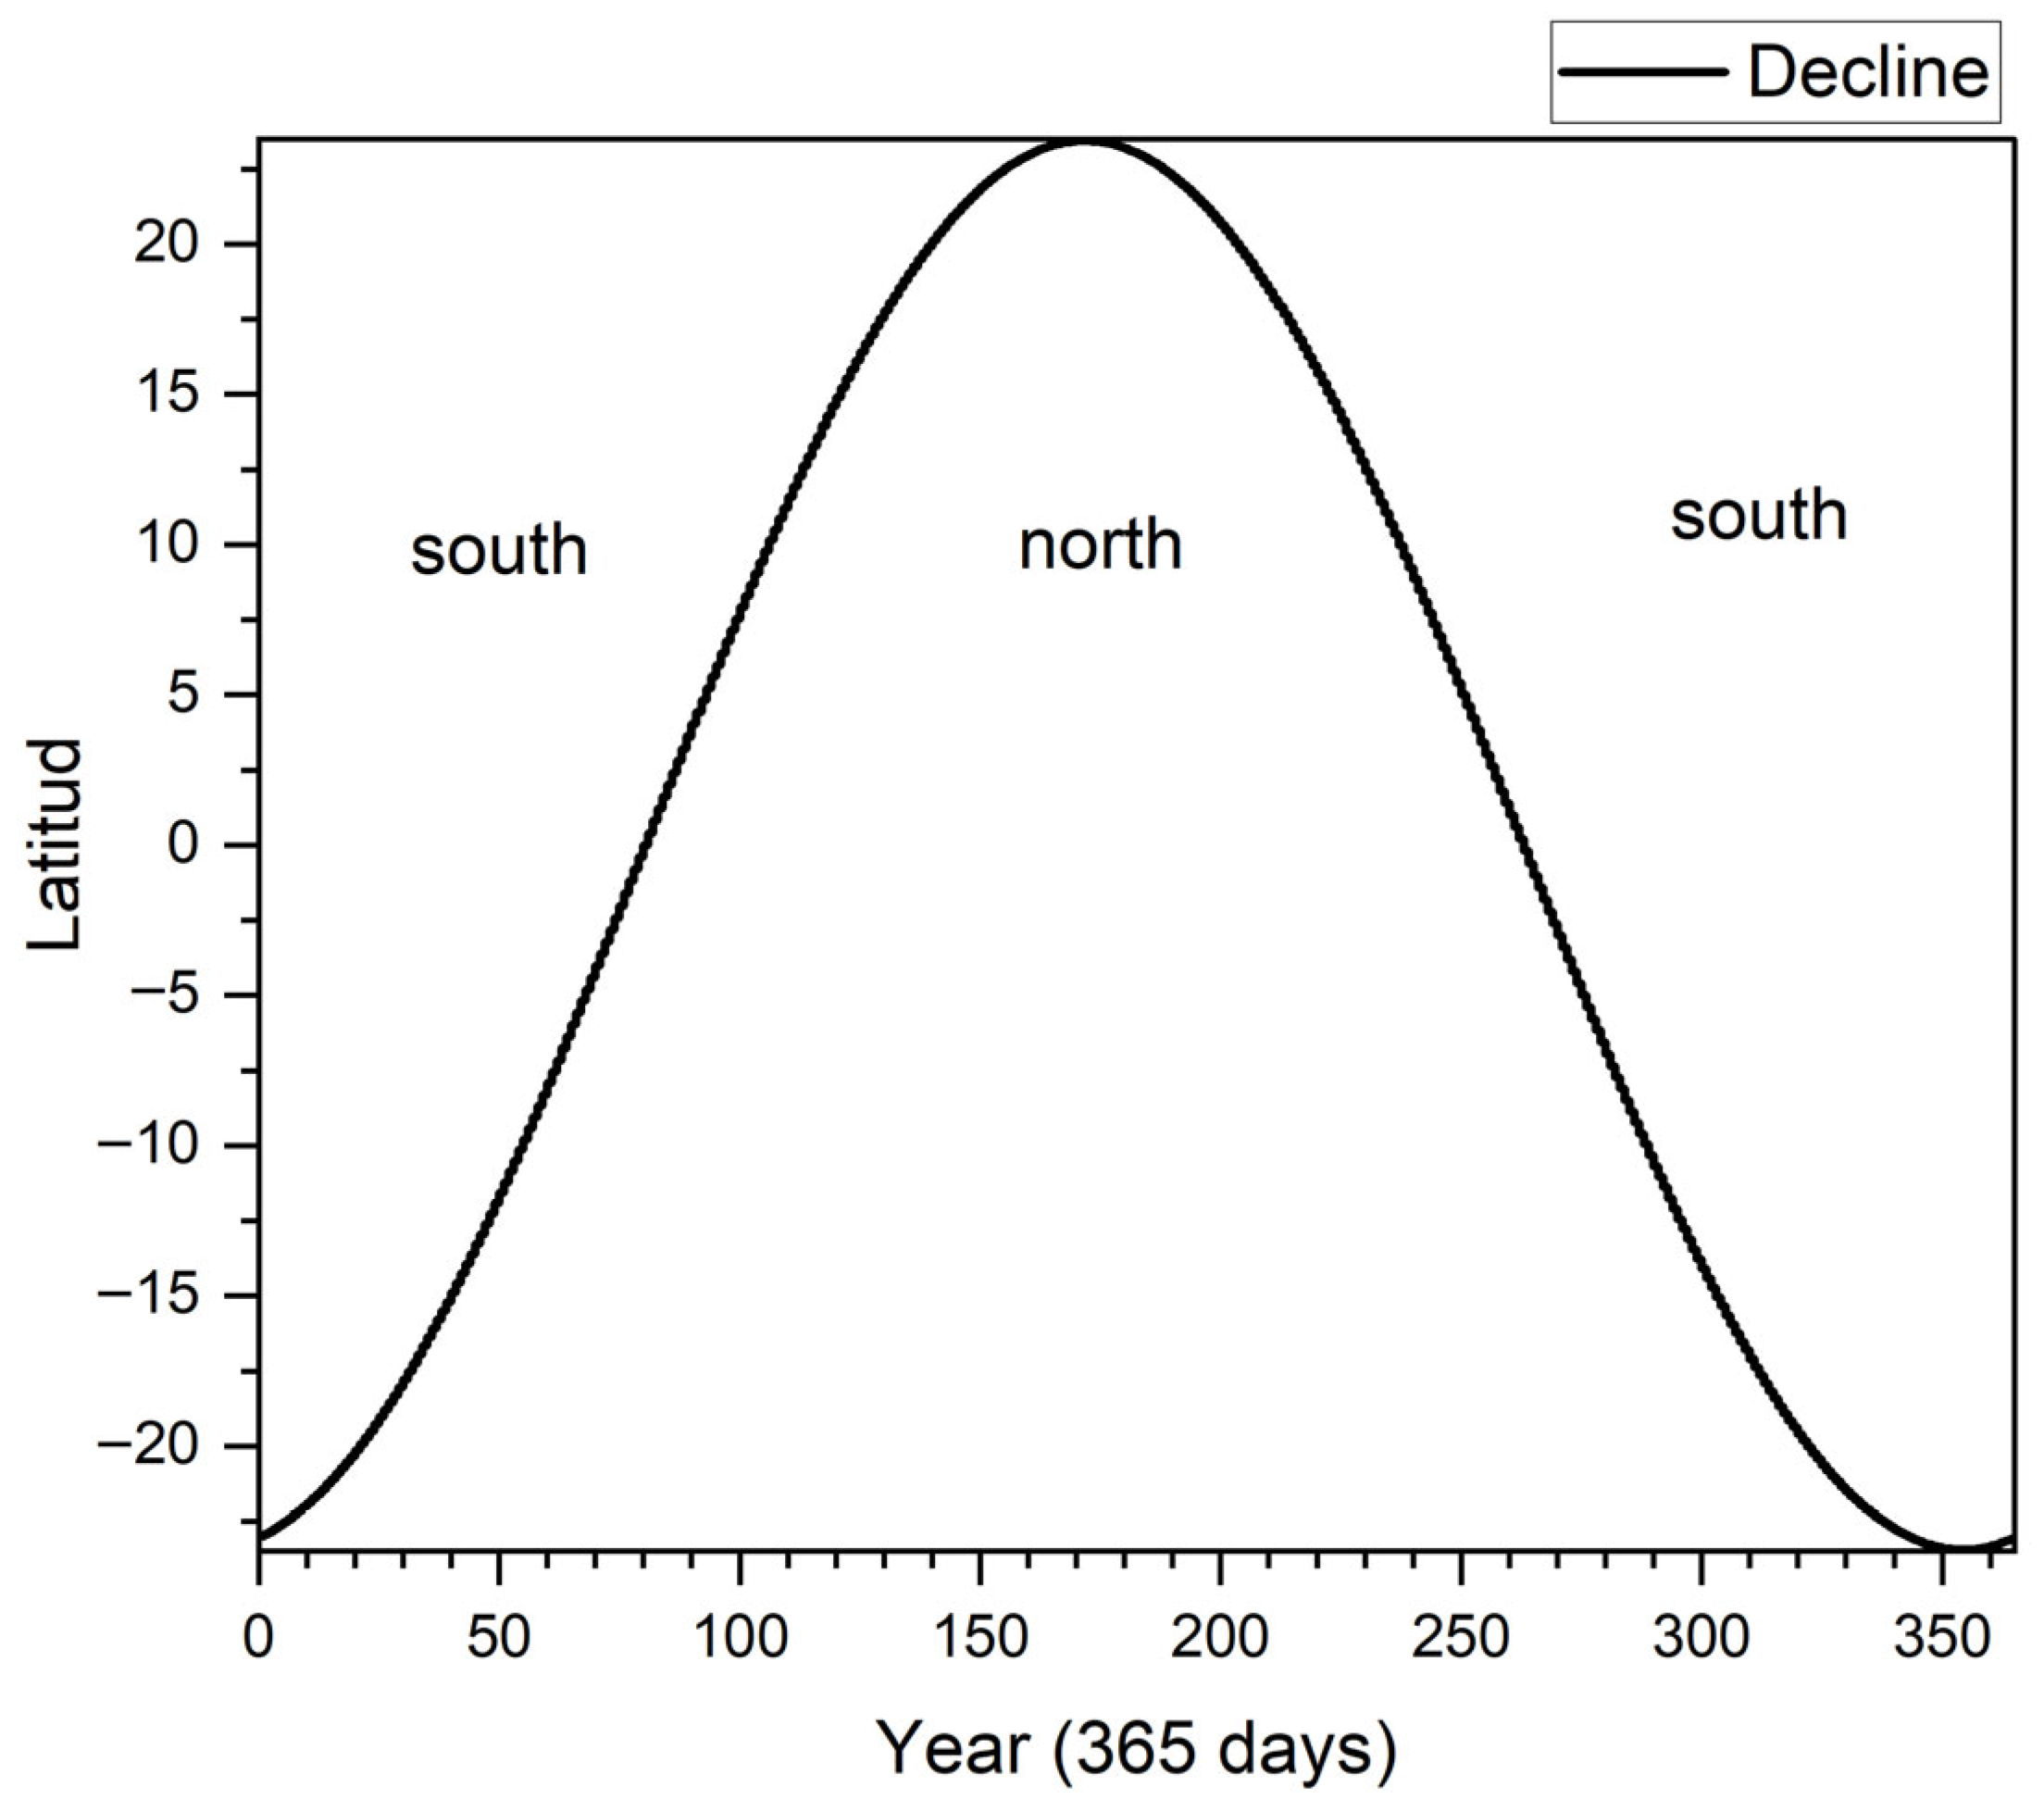
To determine the range of latitudes where the solar path transitions from north to south and vice versa over the course of the 365 days of the year, we will calculate the sur-face azimuthal angle (γ). This angle serves as a parameter: if it measures 0 degrees, the direction points north; otherwise, if it measures 180 degrees, the direction points south, as depicted in Equation (1) [
20].
Similarly, Equation (2) will be used to determine the position of the azimuthal angle on the surface [
7].
Knowing that () is the azimuthal angle, (ω) is the hour angle, () is the zenith angle, () is the latitude, and () represents the declination.
To carry out the research, the SolTrace 3.4.0 [
21] software will be used; SolTrace is a software tool developed at the National Renewable Energy Laboratory (NREL, Golden, CO, USA,) to model concentrating solar power (CSP) systems and analyze their optical performance, an optical design system that works through solar geometry and is based on the ray tracing methodology, reaching different concentration ratios in response to each latitude studied.
The SolTrace software required configuring several input parameters, including the sun’s shape and position, geometry, and tracing options. To evaluate the efficiency loss of a flat-plate collector, specific reference points were established. For this study, latitudes from 23° North to 23° South were used as a reference. A Global Horizontal Irradiance (GHI) of 800 kWh/m2 was assumed. Nonetheless, the simulation and experimental results herein reported can be taken as independent of the radiation, i.e., let us say FPG orientation improves efficiency by 10%, a certain percentage of this will remain constant, regardless of whether the radiation indices are higher or lower.
In this study, this value is used to simulate the maximum theoretical performance of the collector under ideal conditions. This allows us to establish a robust and consistent basis for comparison across the different orientation and solar tracking scenarios. While real conditions in the tropics may not always reach this value, simulating with STC (Standard Test Condition) is a common method for determining the maximum potential of the technology.
As an initial approximation, these papers discussed the effects on orientation for FPC alone; this is done for simplicity. If we consider a heliostat, or a (Compound Parabolic Concentrators) CPC; the amount of calculation and possible scenario would considerably expand, e.g., focus positioning along daytime and other variables need to be considered when dealing with heliostat and CPC. However, this article can be taken as an initial approximation for understanding the impact of solar orientation on collector efficiency in intertropical zones. Similarly, the conclusions herein derived are also extrapolable to solar panels, since both systems depend on the capture of direct and diffuse solar radiation for their performance.
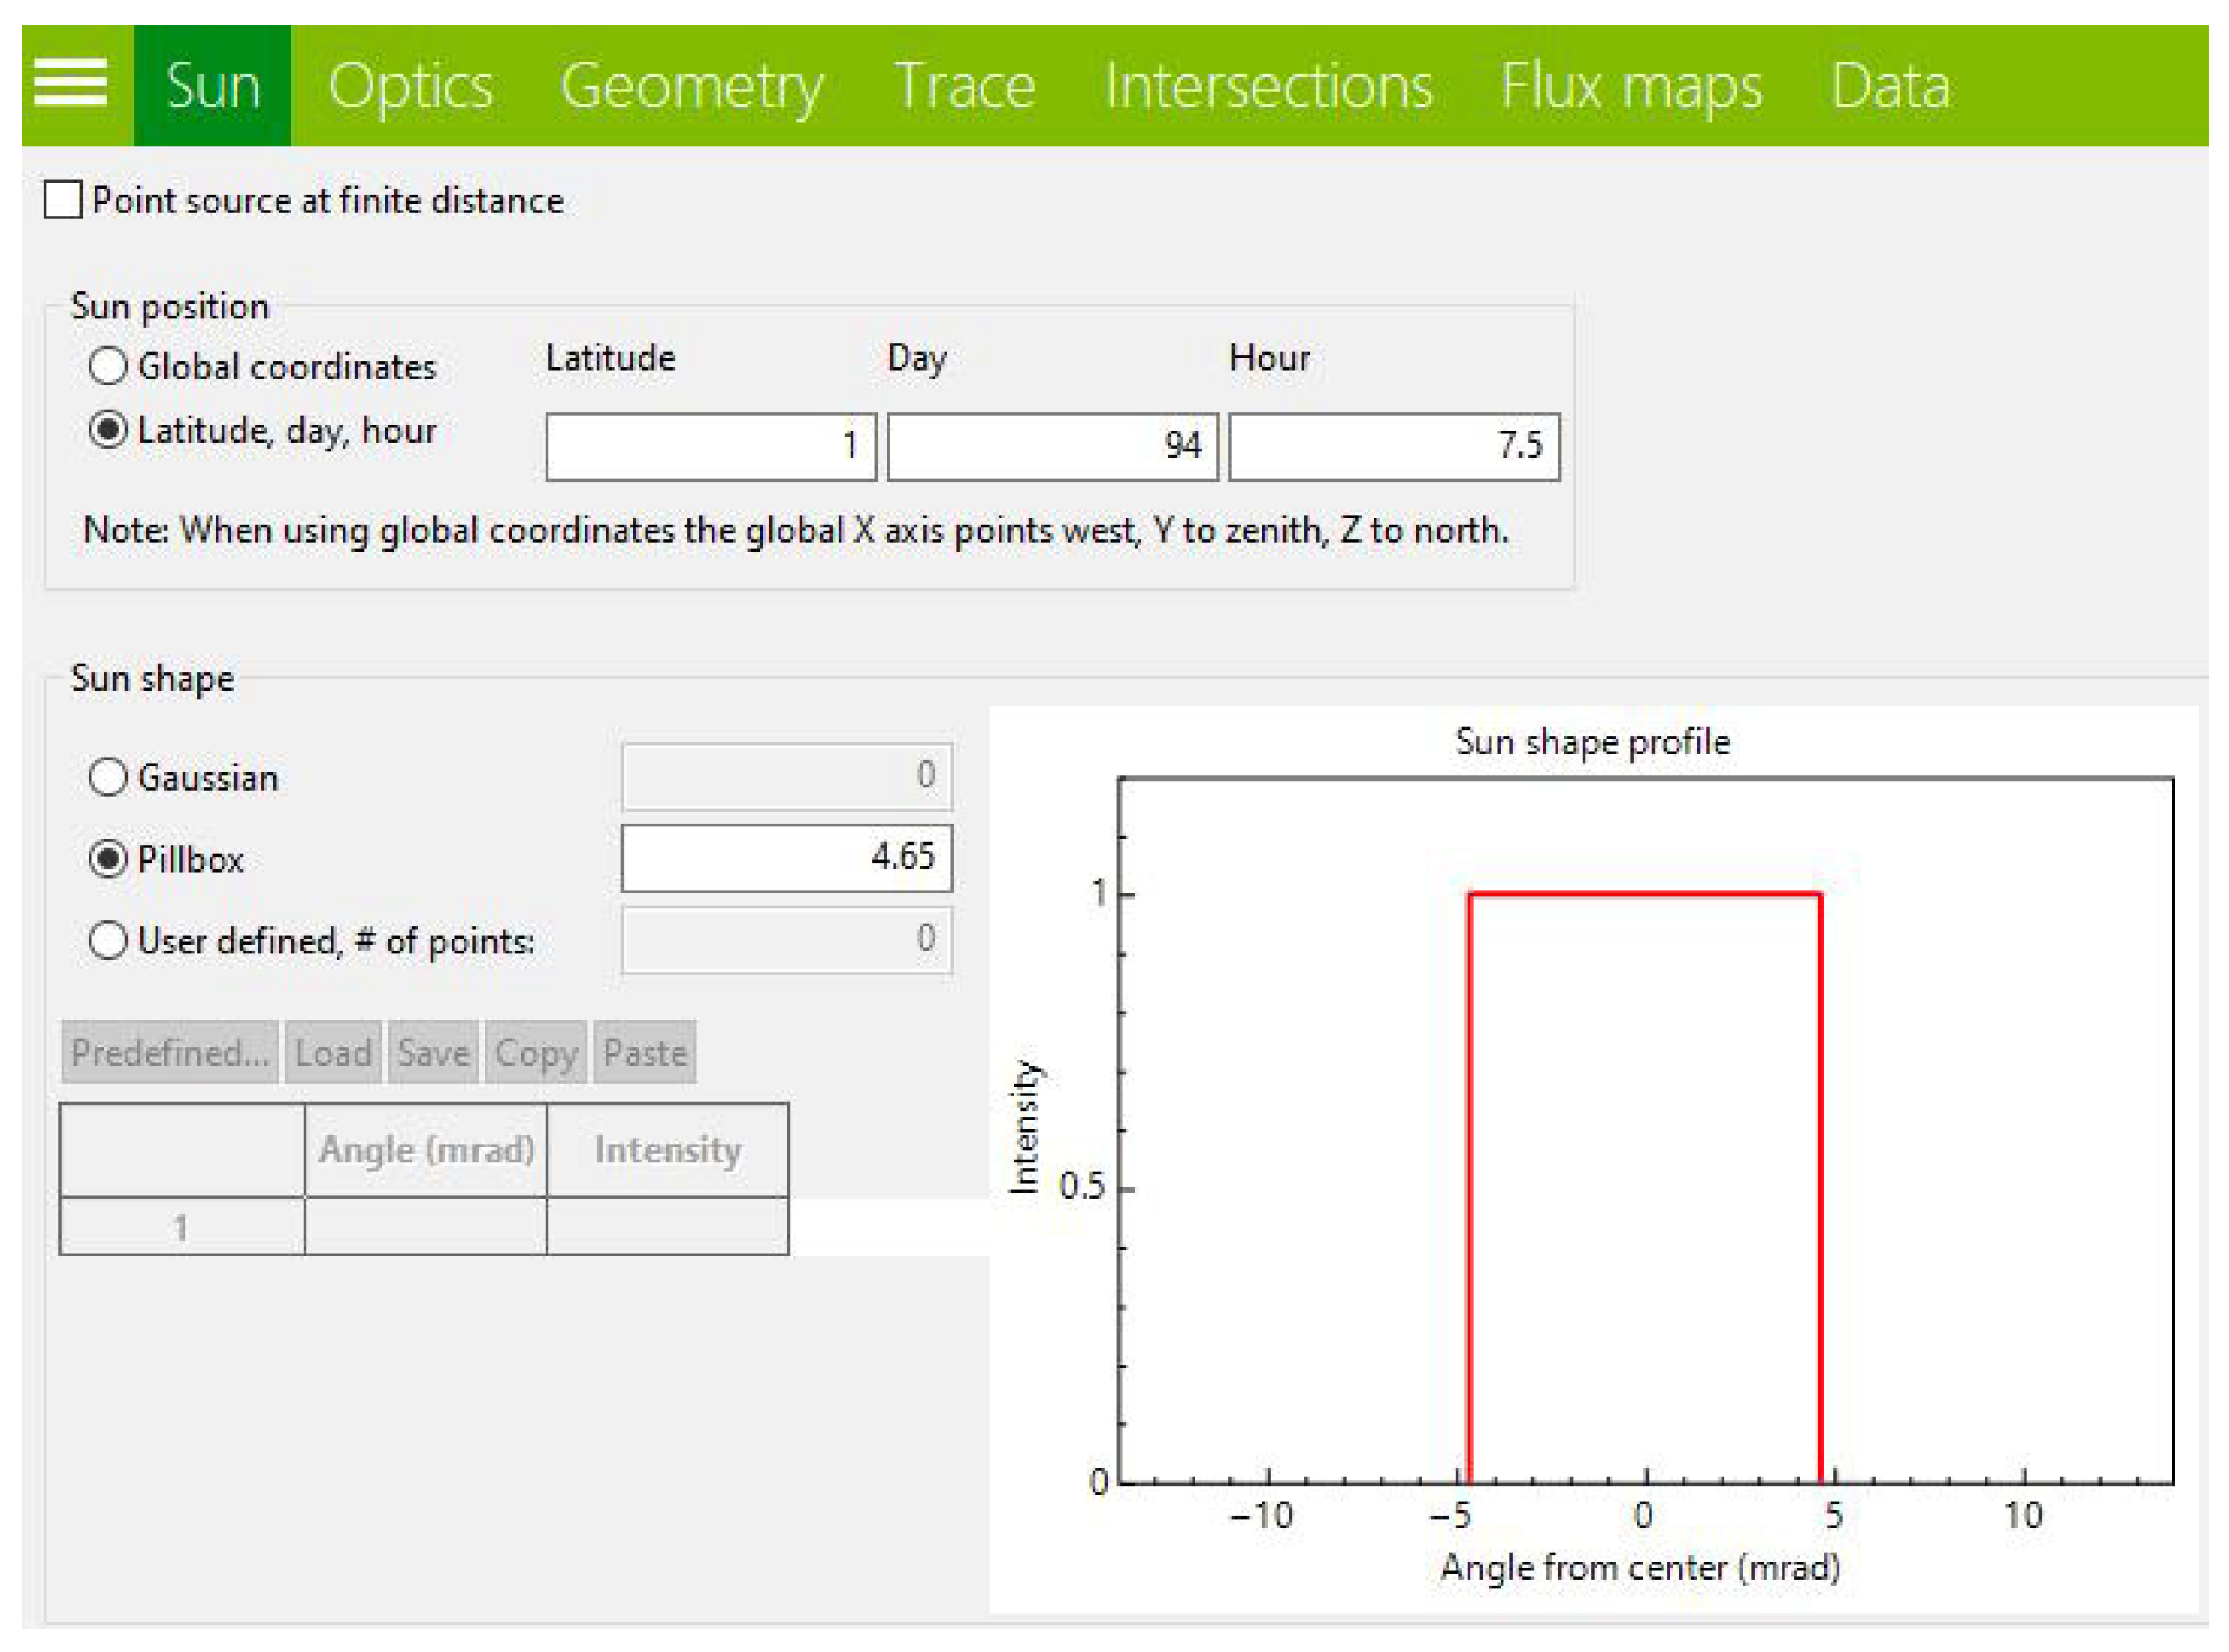
First, the sun’s shape and position parameters will be considered, taking as an option the Pillbox type angular distribution, which is when the sun is taken as a perfect sphere of uniform radiation and an angular radius of 4.65 × 10
−3 rad [
22]. Subsequently, the surface geometry will be determined by selecting the virtual stage as an option, which can determine locations, directions, and incident power or ray flux at various positions along the optical path without physically affecting the ray direction on a flat surface [
23]. Finally, for the tracing stage, a direct normal irradiance (DNI) of 1000 W/m
2 is considered, as recommended by the International Electrotechnical Commission (IEC) for standard tests [
24], and values between 1,000,000 and 100,000,000 generated rays are intercepted on the surface. The SolTrace software is based on the Monte Carlo model for ray tracing, making it an excellent tool for optical simulations.
Based on the previously mentioned Equations (1)–(3), the range of latitudes in which the solar path changes from north to south in 365 days of the year is calculated. Then, according to the calculated ranges in which there is variation, the exact days and solar hours for the study are determined. Finally, based on solar irradiation statistics for the selected location, average irradiation is determined.
Using SolTrace software, each of the variables that feed the system is configured and the number of rays that hit the surface is simulated, taking as a reference each of the scenarios proposed in this research:
- (i)
Static configuration: The collector’s surface remains fixed.
- (ii)
Seasonal adjustment configuration: The surface changes its position from south to north or vice versa, simulating a seasonal adjustment.
- (iii)
Solar tracking configuration: The surface rotates its zenith and azimuthal angles to simulate the behavior of a solar tracker.
To simulate the number of rays incident on the surface, it is assumed that the surface has a slope equal to the angle of latitude [
22]. A series of parameters must be captured. The inputs that define the configuration are displayed in
Figure 1.
Starting with the configuration of the sun’s position, the latitude, day, and time are then established. The location of the parameters can be seen in
Figure 2.
In the next step, the geometry of the scenario is determined. In this research, a virtual scenario was proposed, a useful aspect to determine the locations, directions, and incident power or flow of the rays in various positions along the path without inferring the path of the rays [
25,
26].
The target point was set as X = 0, which determines that the object is not pointing east or west. The Y value is predisposed to the latitude of study, and finally, the value acquires magnitudes of 1 or −1 if it points south or north, respectively.
The orthogonal coordinates were calculated with Equation (4).
An example of the configuration is shown in
Figure 3The next step is to configure ray tracing by choosing the maximum allowed by the software of 100,000,000 rays generated, as shown in
Figure 4.
- 3.
Finally, a script is generated that allows evaluating the conditions at different latitudes 365 days a year at the established time.
3. Results
The behavior of the sun’s trajectory was calculated at latitudes from 0° to 90° and from 0° to −90°. In
Table 1, the results in column 1 are shown to range from 0° to 23° in which the sun changes its trajectory with respect to the latitude; it is worth noting that in the range from 24° to 90°, the sun does not change its trajectory. A similar behavior is observed for latitudes from 0° to −90°; in column 2, the day of the year in which the change in trajectory occurs is established, similar to the result shown in row 3 in which the sun again changes to the initial trajectory. In column 4, the number of days that the sun remains continuous in a different trajectory than the initial one is reflected, it can be observed that as the latitude moves away from the equator, this period of days is reduced. Note that the midpoint of any of these intervals coincides with the summer solstice or the longest day in the Northern Hemisphere, as indicated by the results in the last column of the table.
According to the results reflected in
Figure 5, changes in the solar trajectory only occur in the range from 0 degrees to ±23 degrees North and South latitude; therefore, from these observed data and for each degree in the range from 7:00 a.m. to 6:00 p.m., an optical analysis is carried out using the software for this purpose, using the average irradiance available in databases.
Based on the simulation results and comparing the data obtained on the amount of unused energy, it is intended to make a comparison between the energy wasted by not using a tracker or turning the collector from south to north.
A comparison of the results is shown in
Figure 6, which estimates the amount of energy captured per unit area in the study range from 0° to 23° North and South during the whole year from 7:00 a.m. to 6:00 p.m.
It is known that with the increase in area there is greater energy capture; however, in
Figure 7, a comparison is estimated of the energy that is not captured in mega Watt [MW] in a period of 365 days with each increase in latitude if the surface of the collector does not change position.
Figure 8 shows how the efficiency of the solar collector increases when including changes in direction or a solar tracker; however, it is striking that the increases in efficiency at latitudes close to zero are not so significant, being less than 10% for latitudes below 10°.
Some authors have made experimental findings that have demonstrated increases in collector efficiency when using tracking systems [
27,
28]; however, they do not indicate any relationship with latitude variation.
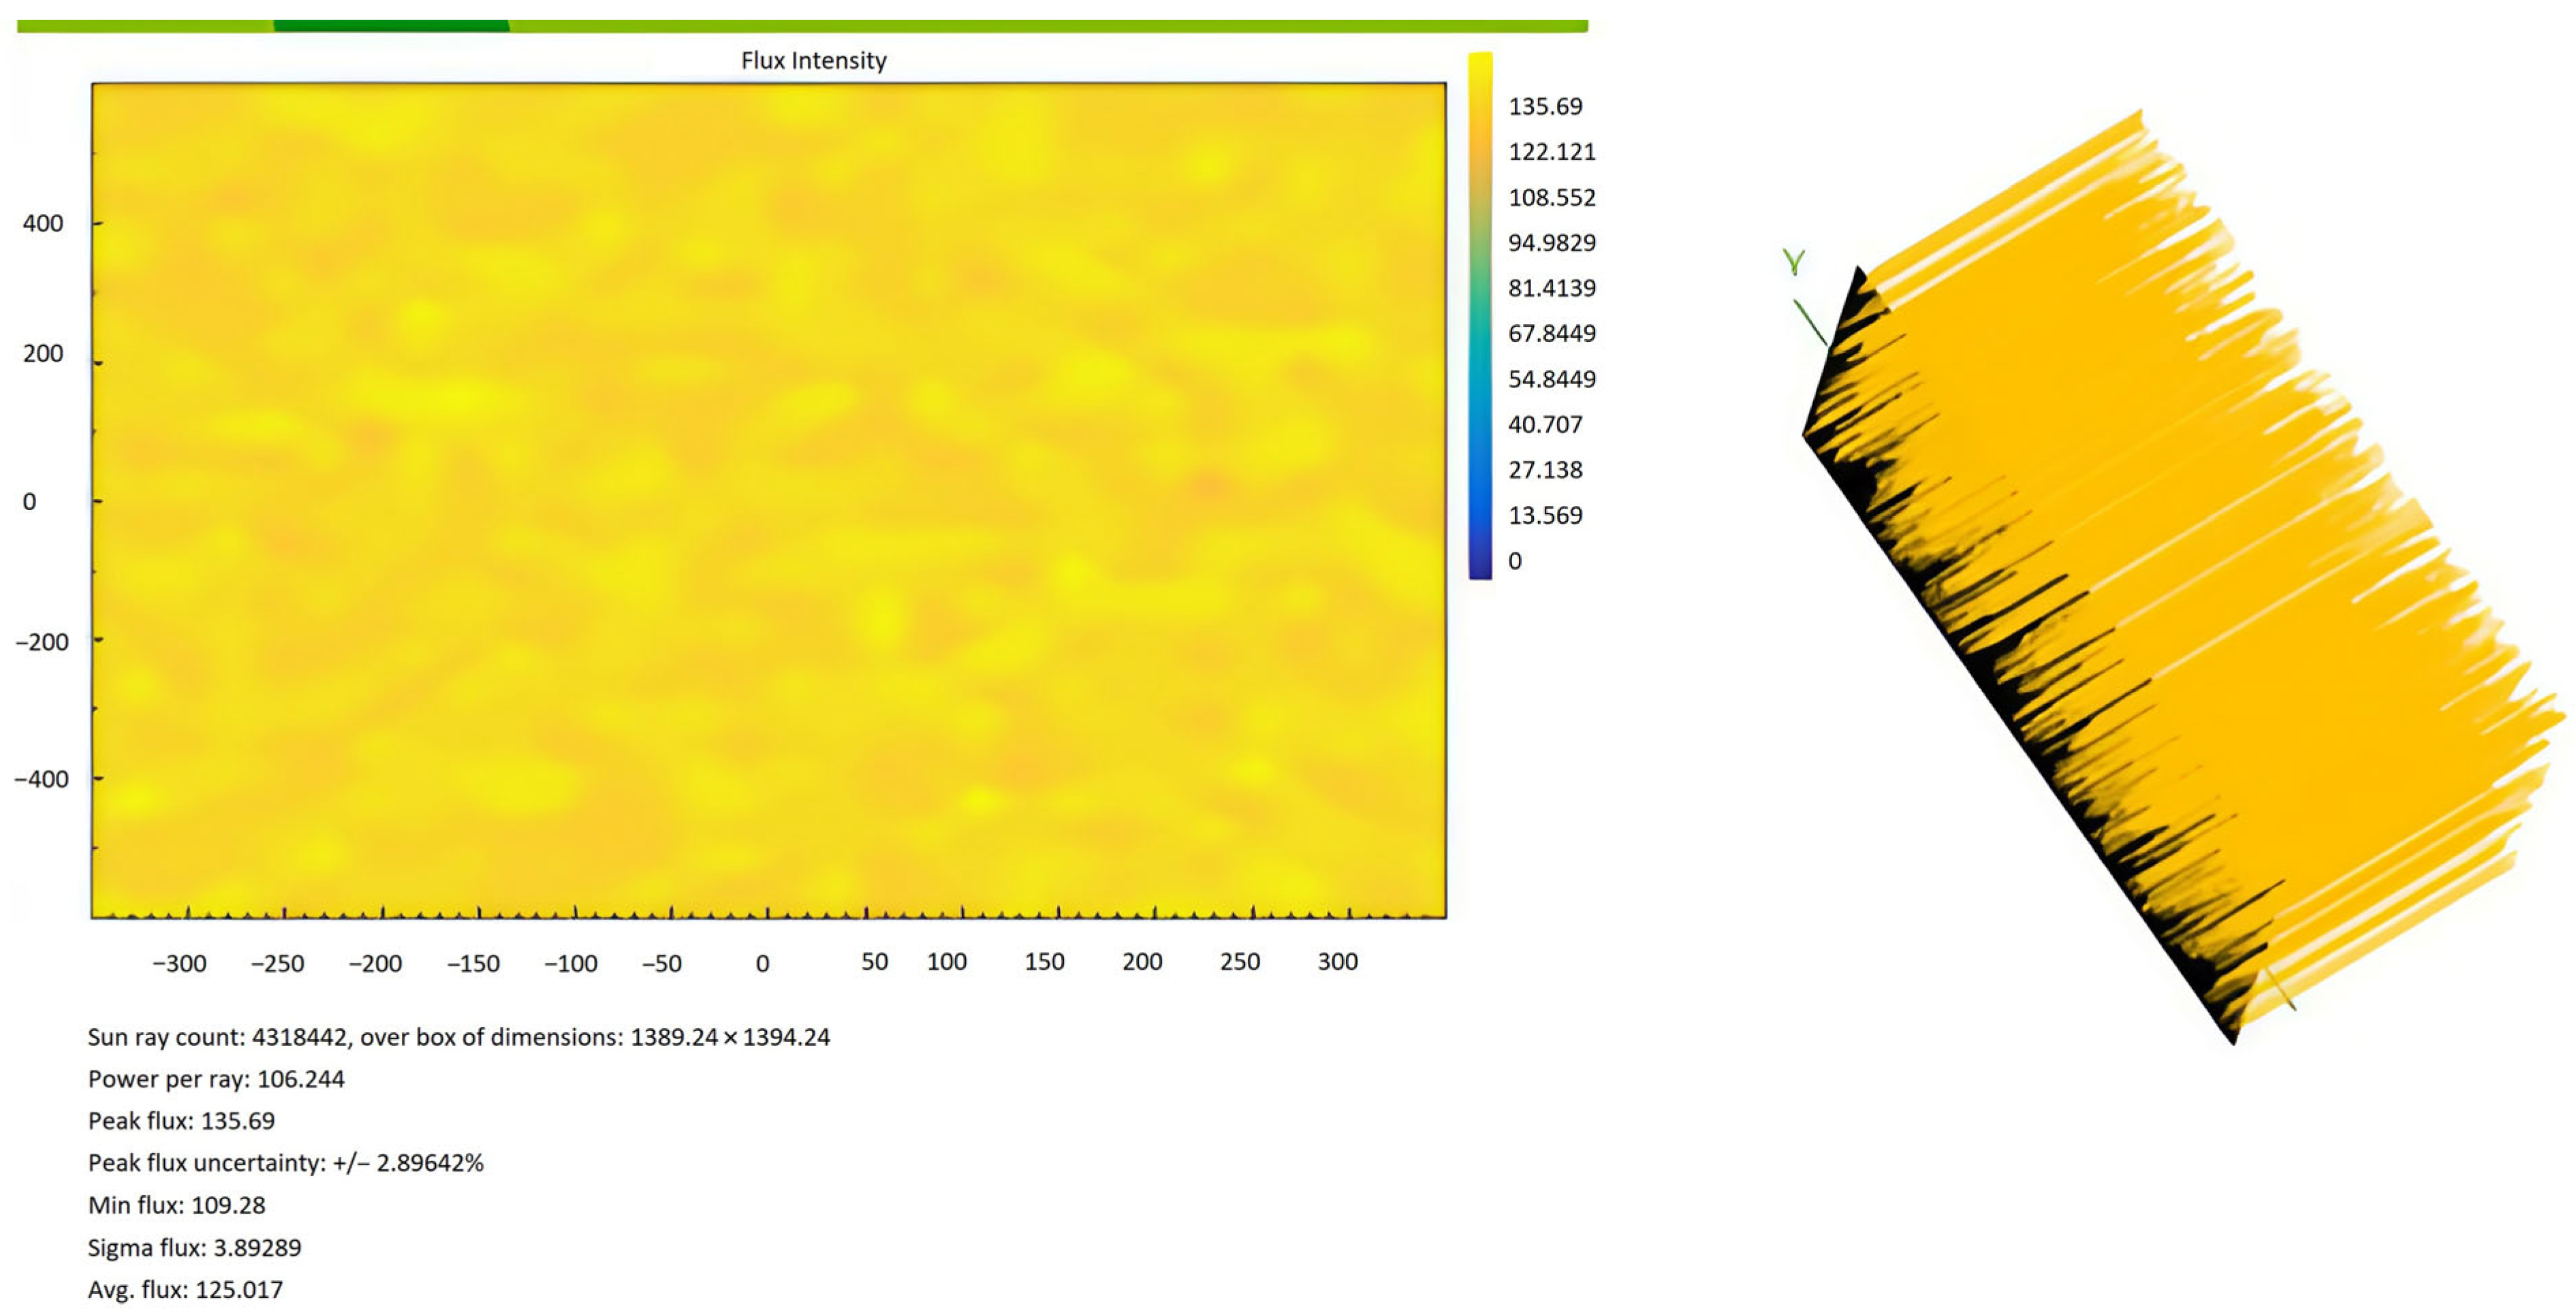
Below is a comparison of the graphic results provided by the SolTrace software for a latitude of 1°, on day 164 at 7:30; the images represent the simulation of the number of rays per area that can impact on a surface facing south (
Figure 9), and under the same conditions a surface pointing north (
Figure 10).
In the simulation results returned by SolTrace, the right side of
Figure 9 and
Figure 10 can be seen as an example of how the number of rays that impact the surface increases when changing the position of the flat collector with respect to the north or south.
Validation from Third Party Software
In order to validate the theoretical calculations from Equations (1)–(3) and
Figure 4, we have embraced real data from the third-party webpage SunEarthTools [
29], developed by SolarCalc. SolarEarthTools collects real-time data on the solar position and compares it with information from NASA’s Horizons System. Therefore, we can use SolarEarthTools as a reliable data source for analysis, design, and validation. The SolarEarthTools interface allowed us to identify the orientation of the incident solar rays at a given point, at a given time.
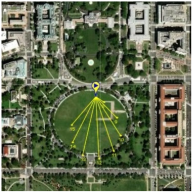
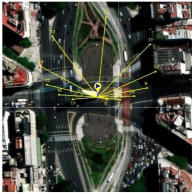
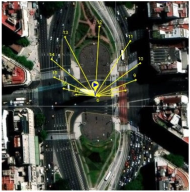
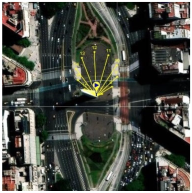
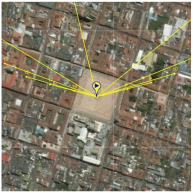
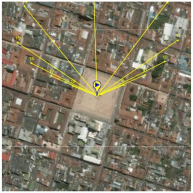
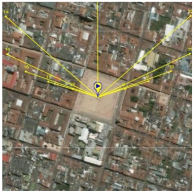
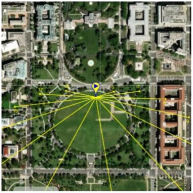
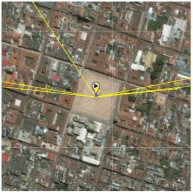
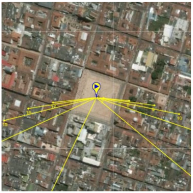
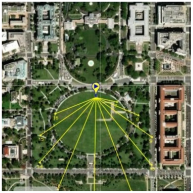
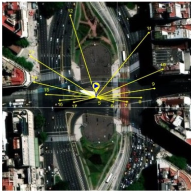
The incident solar rays are displayed in the SolarEarthTools interface as yellow lines superimposed on the desired spot. For comparison purposes, we have chosen three different locations, two of which correspond to outertropical cities, Washington DC (USA) and Buenos Aires (Argentina). The other city is Bogota (Colombia), located within the intertropical zone. The incident solar rays are shown on a monthly basis on
Table 2. Similarly, exact latitudes are specified in the table for each city, as follows:
4. Discussion
Numerical estimates obtained month by month over the course of a year using Solar Earth Tools let us validate the theoretical model previously described in Section
Validation from Third Party Software. That is, in
Table 2, the solar rays in Buenos Aires (Argentina), located at latitude 34° 35′59″ South, point northward throughout the year, as reported in the literature. In Washington, D.C. (USA), at a latitude of 38° 53′42″ North, the sun’s rays originate in the north and point south all year round. However, in Bogotá (Colombia), located at latitude 4°36′35″ N near the equator line, it was observed that there is a change in the orientation positioning of the sun, and consequently, this condition influences the efficiency of a flat-panel solar collector. This can also be applied to improve the performance of other technologies, such as evacuated tube collectors and photovoltaic systems; this observation holds for intertropical zones as theoretically predicted by the model from Section
Validation from Third Party Software.
Figure 5 presents the results of calculating the angles of the sun’s apparent position relative to regions between latitudes −23 and +23 degrees, finding two solar paths: one for the Northern Hemisphere and one for the Southern Hemisphere. This implies that surfaces with a fixed inclination do not capture all the available solar energy if they are not oriented in the correct hemisphere according to the solar path.
It is interesting to note in
Figure 5 how the greatest energy captured for each latitude is obtained at latitudes below 10 degrees.
As mentioned in the introduction, this is one of the few investigations focused on determining the energy captured over a period for each latitude between −23° and 23° by modifying the surface position and using the solar tracker.
Figure 5 shows a direct compensation between the energy captured and the latitude; that is, the latitudes closest to the equator have the greatest amount of energy captured using motion.
Based on the data in
Figure 8, using a solar tracker and manually repositioning the surface twice a year yield very similar efficiency results for latitudes below 10°. These findings suggest that for these latitudes, a repositioning strategy could be a more viable and cost-effective alternative to implementing a solar tracker.
These results and analyses suggest that, when solar surfaces are fixed and located at latitudes between −23 and +23 degrees, it is necessary to analyze the energy costs in terms of efficiency of maintaining a fixed position as suggested by the manufacturers or varying the position just twice a year during the solar change. One possible solution is to build a structure that allows the direction of the fixed surface to be changed when the sun’s path changes throughout the year, rather than installing permanent solar trackers.
Figure 9 and
Figure 10 show an example of the simulation generated by the SolTrace software. These figures compare the results for latitude 1, day 164, at 7:30 a.m., pointing south and north, respectively. Graphically, the number of lightning strikes on the surface can be seen, with a noticeable increase in the number of strikes when pointing north.
4.1. The Effect of Environmental and Altitude Factors on Flat-Plate Collector Efficiency
As mentioned in the literature review, previous studies have shown that environmental factors like cloud cover and ozone can decrease the efficiency of solar collectors by around 14%. This is a particularly important consideration in intertropical regions, which experience greater cloudiness than other parts of the world. However, it is worth noting that this reduction in efficiency occurs independently of the collector’s orientation. In other words, collectors with or without solar tracking systems, whether seasonal or permanent (solar trackers), are affected equally by the aforementioned environmental conditions.
A similar argument can be made for changes in the altitude where the solar collector is installed. The biannual reorientation of the solar collector proposed in this article is independent of the installation’s altitude. Naturally, a solar collector installed at a higher altitude will receive more energy due to the thinner air, which results in a greater intensity of solar radiation.
4.2. Practical Considerations for Biannual Solar Collector Alignment
Mechanical solar trackers offer a comprehensive solution to the problem of efficiency losses caused by the sun’s apparent movement. However, this technology is very costly and complex, and its implementation is typically only justified in large-scale solar farms.
On the other hand, static structures represent a simple and economical solution. With these, the solar collector can be fixed in a single orientation using bolts and pins. The biannual alignment method proposed in this article leverages these common and pre-existing static structures, meaning a biannual adjustment can provide a significant increase in efficiency with minimal economic impact.

