Abstract
One of the key challenges for city authorities is to ensure an adequate quality of life for residents while promoting sustainable urban development. Achieving this balance is closely related to transport management which strongly affects urban quality of life, energy consumption, and resource savings. The aim of this article is to propose a new approach of assessing urban transport management quality, with a view to implement urban energy and resource-saving policies. The assessment procedure is based on the Six Sigma methodology and is illustrated using the example of the city of Szczecin for three selected routes. Travel data were obtained based on actual vehicle traffic using crowdsourcing methods. The capacity processes were assessed based on the potential capacity index and the actual capacity index, which characterise deviations in urban traffic from the best way to save energy and resources. Customer specification limits were set based on surveys assessing residents’ expectations regarding car travel times on the analysed routes. The results show that the methodology proposed in the article can be successfully used to assess urban transport management and to identify areas in need of improvement for sustainable transport panning.
1. Introduction
Modern cities aspiring to be recognised as smart cities face an increasing volume of private passenger freight transport. Managing transport processes in cities at both the operational and strategic levels is becoming increasingly complex. The resulting road congestion and associated slowdowns in urban traffic, as well as frequent acceleration and braking, lead to increased energy and fuel consumption [1]. To align with the principles of sustainable development, particularly implementing municipal policy on energy and resource conservation, reliable and appropriate data are essential to enable effective analysis of the dynamically changing transport situation. Current data on road congestion in cities can be obtained from widely available tools and technical solutions that collect data directly from road users. This method of data processing is called crowdsourcing. It includes data originating from mobile devices such as smartphones, smartwatches, satellite navigation systems, and, finally, information from intelligent systems embedded into roads and vehicles.
A significant problem is the lack of a unified and universal applicable methodology capable of supporting effective management of urban transport processes with such diverse data. Currently used tools and research methods are often fragmented, incompatible, and difficult to compare across different cities. This results in an inability to perform consistent comparative analyses and implementation of universally applicable solutions. Urban transport systems supported by extensive sensor infrastructure generate an enormous amount of data. However, despite this large availability of data, they are preliminary used for operational management, that is, for ad hoc real-time actions. There is a lack of integrated approach that would enable transforming these data into useful information to support strategic planning, scenario modelling, and long-term decision-making. The problem lies in limited integration of data from various sources and the absence of analytical tools that support advanced interpretation.
Data exists, but it is not interpreted in the appropriate context, often remaining uncategorised, unprocessed, or fragmented across different systems [2,3,4,5]. Cities need methods for analysing and integrating information that will enable them to fully utilise the resources generated by intelligent transport systems. This gap is widening due to the complexity of the transport systems themselves and the diversity of local conditions. The purpose of this paper is to develop a novel approach to the evaluation the quality of urban transport management based on crowdsourced data for the implementation of municipal energy and resource conservation policies. To achieve this goal, it was necessary to answer the following two research questions:
RQ1. To what extent is it possible to use the Six Sigma methodology to manage urban transport processes?
RQ2. How can data obtained through crowdsourcing be used in statistical quality management methods for urban transport processes in accordance with municipal energy and resource conservation policies?
To answer the above questions, the research was conducted in four stages. Stage one involved a literature review, covering smart cities, intelligent transport systems, road transport, transport management, transport modelling, applications of cloud computing, and image analysis in transport, aimed to assess the degree of utilisation of modern tools supporting the management of urban transport processes. In stage two, an algorithm was developed for the automatic collection of information from mobile devices regarding the current road situation in cities. Stage three applied statistical quality tools to assess the capability of urban transport processes based on the results obtained in stage two. In stage four, customer expectations were analysed through surveys conducted for a selected city (case study), focusing on municipal energy and resource conservation policies. As a result, conclusions were drawn in the form of recommendations for future research development.
This paper is structured as follows. Section 2 reviews previous studies on smart city concepts, quality management methods such as Six Sigma, and real-time data applications in urban transport to highlight their role in optimising processes, reducing traffic-related issues, and supporting sustainable city development. Section 3 details the materials and methods utilised in the study. Section 4 presents an analysis of transport processes, highlighting key performance characteristics and challenges. Section 5 presents the discussion and conclusion of research findings and future research issues.
2. Literature Review
With the ongoing development and growing importance of cities, along with transformations in social and economic structures, there is an increasing need for innovative approaches to mobility challenges. Cities face challenges in managing urban transport, particularly in the context of striving for greater efficiency and fluidity of transport, as well as maintaining sustainable development. Excessive traffic volume, congestion, increased fuel/energy consumption, emissions, and noise lead to numerous negative effects and a reduction in residents’ quality of life [6,7,8,9,10]. Traffic density and frequent stop-and-go have a particularly negative impact on the energy and fuel consumption of vehicles [1]. The complexity of modern urban systems requires tools that not only allow for the observation of current phenomena but also enable planning actions in response to changing conditions. Such tools facilitate not only the collection of information from multiple sources but also its integration and real-time processing [11,12,13,14,15,16]. This enables better planning, optimisation of existing resources, and improvement of the quality of transport services offered to residents. In this context, the concept of smart cities gains particular importance, where technology and data analysis support effective urban space management. Chocholáč, Chmet, and Kaiser conducted a systematic literature review and classified materials from the past several decades to present a comprehensive and coherent overview of trends and research challenges related to smart cities and urban logistics [17,18,19]. A smart city is not only a vision of the city of the future, but also a real development direction for modern metropolitan areas striving for a more sustainable, functional, and environmentally friendly living environment. A key element of this idea is the integration of modern information systems with urban infrastructure, enabling more efficient monitoring and management of various areas of city from transportation and energy to security and crisis management [14,20,21,22,23,24,25,26,27,28,29,30,31,32]. In the smart city concept, management methods play a key role, as they enable the effective use of available data to improve the functioning of the city and the implementation of municipal energy and resource conservation policies.
The reasons behind the difficulties in managing urban resources lie in the lack of reliable data on actual vehicle traffic. This is caused by a number of factors, including the reluctance of logistics companies to share information on freight traffic. Regulations protecting the privacy of individuals and transport companies create gaps in the actual traffic situation in city centres. In order to improve the effectiveness of assessing the quality of transport management in cities, data from multiple sources, including road users themselves, is needed. Another problem that affects the effectiveness of decisions made by city authorities is the lack of uniform tools and methods for assessing different cities. Carefully selected and applied management methods optimise transport processes and adapt them to the real needs of residents, while simultaneously reducing negative effects of road traffic, such as congestion, excessive energy and fuel consumption, emissions, and noise. It is recommended to utilise proven quality management methods for this purpose, e.g., Six Sigma [33,34,35]. This methodology, based on precise process analysis, improvement, and variability reduction was developed by Bob Galvin and Bill Smith, who implemented it at Motorola in the 1980s [36]. Initially applied in manufacturing [37], Six Sigma is now successfully used in other areas such as hospitality [38], services [39], and finance [40]. The literature reviews presented in works by [41] or [42] highlight the possibility of applying Six Sigma in logistics processes. Chopra et al. propose monitoring the performance of supply chain management processes [43], while Kunvetli and Firuzan [34] explore its use in public transport management. The literature describes the DMAIC (Define–Measure–Analyse–Improve–Control) cycle and Shewhart charts as the key elements within the Six Sigma methodology, which may be used as a tool for reducing the number of transport accidents.
Their primary function is to monitor whether a process is statistically stable and under control, by visualising process variability over time. Shewhart charts help to identify unwanted deviations, known as special causes, which may point to potential sources of defects or problems. Six Sigma provides a solid foundation for modern urban transport management, especially in the context of the dynamic and complex challenges faced by contemporary metropolitan areas. Incorporating management methods based on quality management tools and statistical data analysis, such as Six Sigma, into smart city strategies allows not only the optimisation of operational activities but also the development of flexible, resilient, and sustainable urban systems.
Therefore, authors suggest implementing this solution combined with categories illustrated in Figure 1, marked with a red frame as a support tool for existing urban transport process management methods.
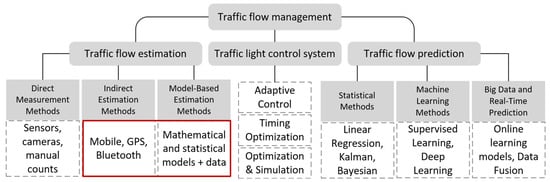
Figure 1.
Traffic flow management tools. Own study.
Six sigma, as a data-driven approach based on numbers and root case analysis of process problems, supports the creation of stable, efficient and adaptive solutions that align with the smart city concept. In studies conducted with Six Sigma tools, continuous process monitoring based on up-to-date data is of particular importance. In the case of urban transport management, data sources can include mobile devices which, unlike traditional methods (such as cameras or sensors), enable large-scale, real-time monitoring of traffic, including areas beyond main roads. Data originating from private devices (smartphones and navigation systems) allow for detailed analysis of trajectories, speed, stops, and delays without the need to install expensive measurement equipment.
Proper interpretation of such data using, advanced mathematical models, and statistical algorithms, translates into more accurate forecasts and informed decisions in transport planning. Additionally, in such an approach, residents become active participants in co-creating the city, and access to data and digital services increases their engagement and influence in shaping public spaces. This type of approach promotes operational efficiency, supports sustainable development, and opens new opportunities for flexible, resilient, and modern urban environments. In this context, solutions enabling flexible, precise, and rapid real-time data collection gain importance. Traditional traffic monitoring methods such as fixed cameras and road-embedded sensors, while effective, have significant limitations—they are static, costly to maintain, and have limited spatial coverage. This proves that data generated by smartphones, car navigation systems, and other mobile devices may be essential. Such data provide insight about vehicle trajectories, tracking, and average speed on specific road segments, and many more supplementing city surveillance from cameras, lidars, and radars, road-embedded sensors, IoT, or automatic number plate recognition (ANPR) technologies. The Internet of Things (IoT) enables the collection of data from various interconnected physical devices (e.g., vehicles, highway gates, or parking spaces). All these data can serve as a repository for the Digital Twin concept, which merges real-world data with their digital counterparts to replicate traffic behaviour, predict future, optimise processes, enhance the performance of logistics systems, and support well-informed decision-making. The use of real-time digital models opens new opportunities for intelligent infrastructure management, particularly in the context of smart city development and the implementation of municipal energy and resource conservation policies [44,45,46,47,48]. Existing ITS solutions focus on data collection, and less frequently on methods of data processing and analysis. There is a need for continuous improvement of methods for the effective management of large data resources from heterogeneous sources. The literature of the subject lacks a standardised approach to the use of vehicle traffic data from non-uniform sources.
In the context of real-time data, mobile and web applications, such as Google Travel Time (GTT) or Floating Car Data (FCD) mechanisms play a crucial role [21,49,50]. Such mechanisms provide information about travel time and distance between locations directly or indirectly from road users. Data based on actual traffic enables the analysis of traffic intensity both in real time and historically. It uses an algorithm that analyses patterns to understand traffic flows and arrival times at different days of week and traffic data, road characteristics, and speed limits are continuously updated. Such a data acquisition method is referred to as crowdsourcing—acquiring services, content, or solutions by engaging a broad group of individuals with varying levels of expertise or even unspecified earlier participants (the crowd) [51,52,53,54].
In summary, existing ITS systems that collect and analyse traffic flows in cities focus on quantitative information based on incomplete data, regardless of the type of data sources. Unlike traditional data, which is generated based on measurements taken at selected locations, mobile data collected from users covers a larger area and can be collected over a longer period of time, providing a more flexible approach. Its cost is also lower, as it is generated incidentally, while anonymous users are using mobile services. Up-to-date information, for example, on traffic congestion in cities, can be obtained from widely available applications and systems that analyse data generated by road users on a global scale, using GNSS signals and speed data from mobile devices and sensors built into vehicles. Mobile applications also offer the possibility to report traffic incidents such as accidents or disruptions, which is a valuable addition to automatically collected GPS data. This requires the use of filtering techniques, credibility checks, and data integration into a coherent whole. At the same time, privacy must be protected, as location information can reveal users’ daily behaviour. Therefore, systems must include anonymisation mechanisms and appropriate data security measures. This model of cooperation enables faster and more comprehensive information gathering, which translates into better adaptation of transport services to user needs and more efficient management of urban infrastructure for the implementation of urban energy and resource-saving policies.
All above research are dominated by descriptive approaches, and standardised methodologies for assessing process stability and transport system capabilities are lacking. Most studies focus on traffic intensity metrics without embedding statistical frameworks that allow systematic comparisons between cities and ensure repeatable quality control. Integration of crowdsourced data with conventional sensors improves the coverage and reliability of monitoring, enabling city and regional level implementations that support real-time response. Most descriptive approaches, such as travel time analysis, congestion mapping, or heatmap visualisations, allows diagnostics and enhanced visibility of issues but rarely formal frameworks for evaluating transportation system quality.
Despite these achievements, a clear methodological gap remains. Existing studies rarely introduce standard methods for assessing the stability and capability of urban traffic processes. Most research focuses on describing congestion patterns without evaluating whether the system is statistically stable and capable of meeting specific quality requirements. The underutilisation of statistical quality control tools such as control charts, Cp and Cpk indices, stability tests, or uncertainty analyses limits the ability to make evidence-based decisions. Additionally, the diversity of time windows, metrics, and thresholds used across studies hinders the comparability of results and benchmarking between cities. These issues are further aggravated by the lack of systematic quality control of crowdsourced data, including the evaluation of completeness, representativeness, and bias. Consequently, repeatable procedures that could be implemented in different urban contexts are missing, and studies remain largely descriptive, providing little formal support for operational decision-making.
This paper presents an approach that addresses this gap by integrating Six Sigma methodology with crowdsourced data, creating a repeatable framework for urban traffic quality management (Table 1).

Table 1.
Comparison of previous studies and the article studies.
This approach allows a transition from problem description to systematic control and improvement. Defining key quality indicators, such as median travel time or the proportion of trips exceeding an acceptable threshold, specifying upper and lower specification limits, enables the formalisation of system expectations. Systematic extraction, cleaning, and calibration of crowdsourced data, along with the assessment of its quality in terms of completeness, bias, and delays, enhance the reliability of results. Statistical analysis based on control charts, with process capability indices (Cp and Cpk), allows for the distinguishing of natural variability from special causes, enabling evidence-based decision-making. Compared to previous studies, the one presented utilised diverse data sources, descriptive methods, and a standardised, repeatable, and statistically grounded methodology. Standardisation enables comparison of results between cities and benchmarking of best practices. Consequently, this paper shifts the focus from descriptive diagnostics toward quality management. The integration of Six Sigma with crowdsourced data establishes a framework that enables not only monitoring and assessment but also sustainable improvement of transportation processes, enhancing efficiency, repeatability, and transparency in urban mobility operations.
3. Materials and Methods
To address the research problem and the questions posed in the article, three types of routes were selected, measuring 6, 12, and 16 km in length. The selection aimed to capture variations in travel conditions and vehicle behaviour over distances. Data were collected from a study area including 10 European cities, each with diverse urban structures and population sizes. These cities were chosen to provide a diverse sample for comparative analysis. Key parameters of each city, such as total area, population, population density, and the number of registered vehicles, were recorded to contextualise the study. Table 2 presents a summary of these cities and their respective characteristics. The data collection involved traffic flows, travel times, and stop frequencies along each rout. It ensured that the findings could reflect real-world transport conditions accurately. By comparing routes of different lengths across multiple urban contexts, the study aims to identify patterns in traffic efficiency and areas requiring optimisation. It supports decision-making for urban transport management and sustainable mobility planning.
Table 2.
Key parameters of the surveyed cities.
For the selected cities, 3 types of routes were defined, sharing common characters related to
- Short-distance travel within the city centre, covering approximately 6 km, which captures the dynamics of dense traffic, frequent intersections, and high pedestrian activity;
- Medium-distance travel, including access to the city centre (12 km distance);
- Long-distance travel, defined in all cases as the rout from the airport to the city centre (16 km distance).
This approach considered the needs of individuals moving within urban conditions in city centres (e.g., residents, private transportation, couriers engaged in last-mile logistics, etc.), as well as those commuting by private cars from residential areas to city centres and people travelling from, e.g., airports to the city. Such categories make it possible to assess the performance of urban transport systems across varied contexts such as travel time, congestion, and energy consumption. To support this analysis, real travel time data were collected over a one-year period using the GTT tool which is a part of the Google API [55]. A sampling interval of every 10 min was selected, starting at 6:00 AM and ending at 7:00 PM, for 365 days of the year. Collected results included information on the estimated time for each rout, as well as the average speed of movement.
The travel time was estimated based on factors such as the distance between locations and the speed limits applicable on individual sections of the route. In addition to real-time traffic data, historical data were also analysed. Thanks to anonymous information sent from mobile devices and other sources, the API supported the detection of traffic jams and accidents. This made it possible to analyse traffic flows, but also actual time of arrival (ATA) (dynamically updated in real time). The Six Sigma methodology was then applied to analyse such data and the quality of transport process management in cities. However, due to the availability of data, previous research experience, and the willingness of local authorities to cooperate, authors chose Szczecin as a case study city. It should be noted that Szczecin is a particularly interesting road traffic study area for several reasons. Firstly, it is one of the largest cities in Poland in terms of area, covering over 300 km2, and has a population of nearly 400,000 inhabitants. Such extensive spatial structure combined with a sizable population generates significant transport needs, both within the city itself and in relation to its surroundings. Secondly, Szczecin functions as a metropolitan area, attracting residents from nearby towns and villages for work, schools, and higher education. This is further reinforced by the proximity of the airport, which increases regional mobility and intensifies transport flows. Thirdly, the city centre has a multifunctional character, combining residential, commercial, service, and administrative functions. This urban structure fosters diverse and intensive traffic patterns, the proper monitoring and improvement of which are essential for residents’ quality of life, safety, and economic development. All these conditions make Szczecin a valuable and relevant case study for examining and optimising road traffic, and also a potential benchmark for other large, spatially dispersed cities facing similar mobility challenges. The study itself involved the following steps:
- Assessment of process stability,
- Assessment of customer expectations of the transport process,
- Assessment of process capability.
In the first step, Shewhart charts (visualisation of the average value of the measurements) were developed and analysed for travel times on three selected Szczecin routes measuring 6 km, 12 km, and 16 km in length. Each route had to pass through the city centre. Actual travel times for the selected routes from February to December 2024 were obtained from Google Travel Time. To create Shewhart charts, 10 random trips were selected each day between 3 PM and 6 PM, and control charts were developed using the Statistica software. In the next phase, study surveys were conducted to investigate road user expectations regarding traveling the same routes. The surveys were carried out online using a Google Forms. In the final step, for the actual travel times obtained from the GTT and the customer tolerance limits based on the surveys, a summary histogram was created. Simultaneously, indicators of actual and potential process capability were analysed. To illustrate the stability of the process in a better way, a Shewhart control chart (Figure 2) was used. This chart is a graph where successive points represent the values of the monitored process characteristics (e.g., travel time) over specific time intervals.
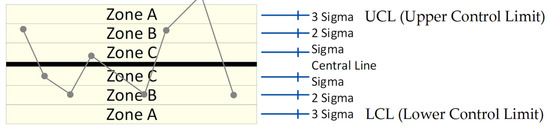
Figure 2.
Zones in Shewhart control cards. Source: [56].
The ± sigma control limits are determined using formulas specific to each type of control charts. All observations (chart points) located within these limits are interpreted as the results of the natural variability of the process, known as total variance (expected value). Values that fall outside the control chart (±3 sigma) represent specific variance. Such values indicate moments when unexpected random events occur. These charts serve not only to monitor and manage the processes but also to signal when improvement actions are necessary. A process that is out of control requires corrective actions. There are seven recognised signs indicating this type of event [57]:
- 9 consecutive points are on the same side (below or above) of the centre line;
- 6 consecutive points show growing or decreasing trend;
- 14 consecutive points are arranged alternately (growing and decreasing);
- 2 of 3 consecutive points are between 2 sigma and 3 sigma (zone A);
- 4 of 5 consecutive points are between sigma and 2 sigma (in zone B);
- 15 consecutive points are between central line and sigma (zone C);
- 8 consecutive points are not in zone C (all are in A or B).
Process stability analysis using Shewhart control charts can reveal existing issues within it. One of the key indicators used to evaluate a process in the Six Sigma methodology is its capability. In such context, the co-called sigma level of the process is analysed and discussed. The procedure for determining and assessing process capability varies depending on the characteristics of the data being analysed. In the case of continuous data, such as travel time or fuel consumption, a frequency chart can be performed. Assuming the process follows a normal distribution, this means that over 90% of the measured values of the examined metric will fall within a range of plus or minus three standard deviation from the mean (Figure 3).
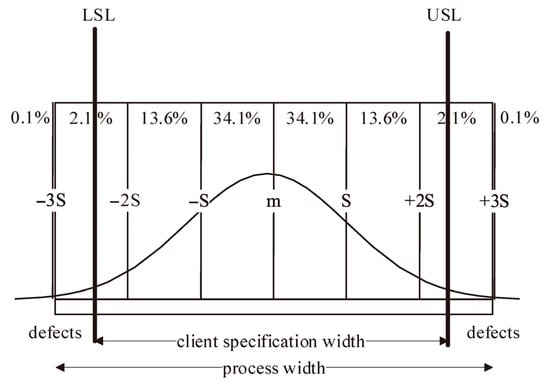
Figure 3.
Six Sigma chart [58].
Process capability can be assessed by overlaying the costumers’ expected parameter values onto the normal distribution chart. The lowest expected value is called the Lower Specification Limit (LSL), while the highest is called the Upper Specification Limit (USL).
The range between the LSL and USL represents the costumer specification, also referred to as customer tolerance. All process values in that segment are considered as acceptable to the customer, while outside values are classified as defects. From the perspective of energy and resource conservation, a process of urban traffic is considered acceptable when the width of its distribution fits within the consumers’ specification limits and the mean of the process aligns with the target (mean) of the specification. Such a process is said to operate at a 3-sigma level. A 6-sigma process, on the other hand, means that the distribution width fits twice within the customer specification limits. This indicates lowest variation, which is more noticeable and valued by customers. It is generally considered more difficult to reduce the spread of a process than to shift its mean. Visual analysis of the distributed chart is a very useful and commonly used tool, as it allows for a relatively quick assessment of the process in terms of its validity and consistency.
Nevertheless, the analysis of the process chart should be supported by calculations of potential capability index (Cp) (Equation (1)) and actual capability index (Cpk) (Equation (2)) [59].
where
- USL—Upper Specification Limit,
- LSL—Low Specification Limit,
- σ—standard deviation,
- µ—mean value.
The process sigma level is read from the process capability table using the Process Capability Index (Cpk). A process reaches the 6th sigma level when the equation expressed in Equation (3) is true.
Such a process is not only consistent (spreads narrowly), but its mean also aligns with the midpoint of the customer specification range.
Equations (1) and (2) apply to a normally distributed process. If the process is not normally distributed, the data can be adopted by Jonson or Box–Cox transformation, or the process width can be calculated based on percentile [60]. These indices were used to assess the quality of urban transport management based on an analysis of the deviation of urban traffic from the ideal mode of energy and resource conservation.
4. Results
The analysis covered key logistics parameters and data was collected in real-world conditions, which enables an accurate comparison of different time options and further optimisation activities. The results of the study of the transport process on the 16 km route were visualised as Figure 4.
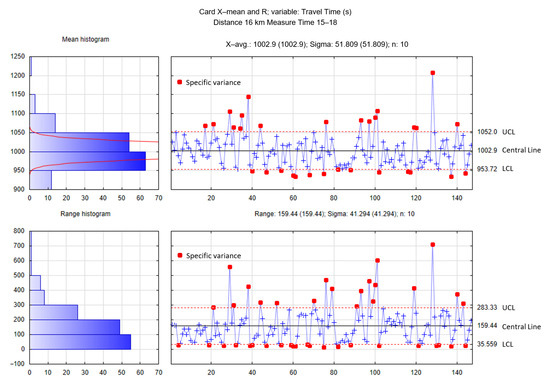
Figure 4.
Shewhart chart for 16 km.
With the current infrastructure and implemented transport management processes, travel times on the 16 km route should range from 953.72 s (15.9 min) to 1052.0 s (17.53 min). The process is characterised by high instability. Red points indicate the special variance in which the unwanted events occurred. In as many as 31 days, the travel times exceeded the lower or upper control limit of the card (21% of the tested samples), and out of those, 11% days with travel times longer than 17.53 min. The transport process on the 12 km route in Szczecin is visualised in Figure 5.
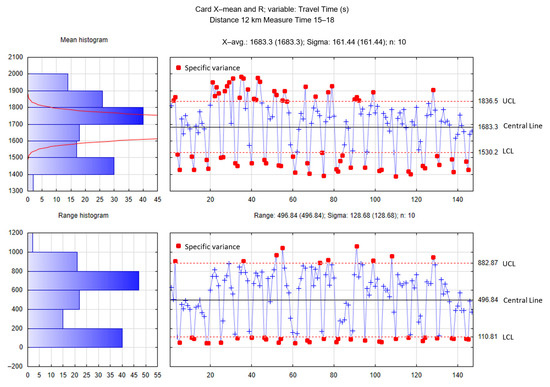
Figure 5.
Shewhart chart for 12 km.
A total of 2932 trips were recorded on the 12 km route between 3:00 PM and 6:00 PM. The vehicles were moving at an average speed of 26.5 km/h. With the current infrastructure and implemented transport management processes, travel times in the range of 1530.2 s (25.50 min) to 1836.5 s (30.61 min) should be expected. The process is characterised by high instability. Red points indicate the special variance in which the odd events occurred. In as many as 72 days, the travel times exceeded the lower or upper control limit of the card, which is 48.98% of the tested samples (almost 22% days with times longer than 30.61 min).
The transport process on the 6 km route (Figure 6) is also characterised by high instability.
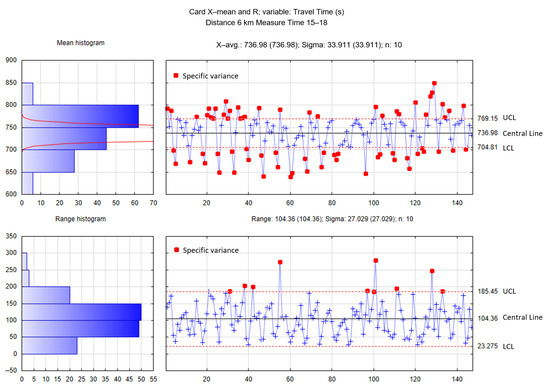
Figure 6.
Shewhart chart for 6 km.
Between 3:00 PM and 6:00 PM, 2930 vehicles were recorded. With the current infrastructure and transport management processes in place, travel times in the range of 704.91 s (11.75 min) to 769.15 s (12.82 min) should be expected. In as many as 70 days, the travel times exceeded the lower or upper control limit of the card, which is over 47% of the samples tested (22% days with times longer than 12.82 min).
In summary, the 12 km route has the most points outside the control limits and therefore demonstrates the greatest instability. Thus, transport management processes on these routes are characterised by high instability and significant deviations of urban traffic from optimal modes that ensure energy and resource conservation.
The evaluation of the transport management process is completed by the assessment of its capabilities. To this end, in the first place, the expectations of Szczecin road users were diagnosed (computer-assisted web surveys). A total of 68 respondents took part in the survey, including 29 from Szczecin, who were asked (among other things) about their satisfactory travel times on routes passing through the city centre (Table 3).
Table 3.
Expected travel times of Szczecin road users.
At this point, it should be noted that there is a significant percentage of blank responses for individual routes. To assess the capacity of the transport process on Szczecin routes (based on surveys), the following customer specification ranges were adopted. For 6 km route—1 to 10 min; for 12 km route—10 to 20 min, and for 16 km route—20 to 30 min. The respondents could choose pre-specified time periods. To obtain more reliable intervals, it was advisable to calculate customer specification limits based on confidence intervals. Knowing the expectations of people moving along Szczecin routes, it was possible to determine the capacity of the transport management process. For the 16 km route, a large spread of travel times was recorded (Figure 7a).
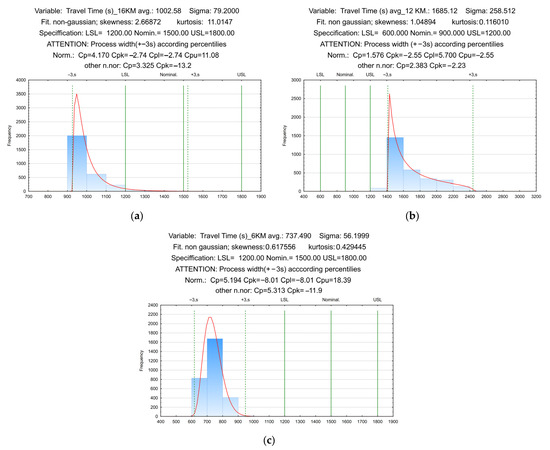
Figure 7.
Transportation management process capability, (a) 16 km distance; (b) 12 km distance; (c) 6 km distance.
Performed in Statistica, the Kolomogorov–Smirnov fit test showed that the best fit for all routes would be a non-normal distribution with sigma limits determined based on percentiles. The process capability analysis was performed on the basis of the Cp and Cpk indices calculated for a process with a non-normal distribution. Road users expect to travel the 16 km route within a time range of 20 to 30 min. The actual capacity of the process is at the −13.2 level (Cpk). A negative value of the indicator shows that the average for the chart is outside the client’s specifications. In this case, the average actual travel time is shorter than expected by road users. Traveling the 16 km route is also characterised by low variability. The width of the graph is more than three times smaller than the customer’s specification range.
The Cpk actual capacity index for the 12 km route journey process is at the −2.23 level (Figure 7b). A negative value indicates that the average travel time is outside the customer’s specification. This is a very worrying phenomenon. However, it should be noted that the process has potential (potential capacity indicator Cp = 2.383). Actions to improve the process in this case should aim to reduce the average travel time. Paradoxically, despite the high instability, the process of driving on the 6 km route also has potential. Its width is more than four times smaller than the width of the customer’s specification. The potential capacity index Cp in this case is at the 4.781 level (Figure 7c). To obtain more reliable results, it is advisable to clarify customer expectations in this area and verify the limits of their specifications. With such selected limits of customer specifications, the actual travel time is a crucial problem. Almost 100% of travel times are longer than expected. A noticeable tendency is that the longer the section of the route, the more the average ride moves to the right. On this basis, it can be concluded that the bottleneck in the organisation of traffic flows is the city centre.
Fuel consumption in the city depends largely on the urban infrastructure [1,61] and on travel time. In Szczecin, the speed limit is 50 km/h, on individual routes, 60 km/h and 70 km/h. In the start-and-go mode on routes in the city centre, fuel consumption increases and must comply with the technical characteristics of the vehicle for the urban cycle. The current travel time for each route (6 km, 12 km, and 16 km) and the energy and fuel consumption were determined based on 1470 trips, of which 58.62% used cars with a petrol engine, 31.03% with a diesel engine, and 10.77% with an e-motor. Based on this percentage distribution of vehicles, we obtain 862 petrol, 456 diesel, and 152 e-motor cars. Table 4, Table 5, Table 6 and Table 7 present the average values of energy and fuel consumption for the analysed routes.
Table 4.
Fuel consumption in 6 km route.
Table 5.
Fuel consumption in 12 km route.
Table 6.
Fuel consumption in 16 km route.
Table 7.
One car energy consumption *.
Similarly to cars with petrol or diesel engines, the most critical route for electric vehicles (EV) was the 12 km route.
5. Discussion and Conclusions
This study explores the potential of applying the Six Sigma methodology to manage urban transport processes within the framework of municipal energy and resource conservation policies. It aims to answer two main questions: RQ1—To what extent is it possible to use the Six Sigma methodology to manage urban transport processes? RQ2—How can data obtained through crowdsourcing be used in statistical quality management methods for urban transport processes in accordance with municipal energy and resource conservation policies? The case of Szczecin was used to provide answers to those questions.
Travel times were analysed for routes passing through the city centre, and the users’ expectations and the energy and fuel consumption of vehicles were identified with a survey questionnaire. A statistical quality check of the transport management process was performed with Shewhart cards. The research revealed a high degree of process instability for each of the analysed routes, but with the least cases of special variance for the 16 km route. In the second step, for the same routes, process capability, energy, and fuel consumption were examined. Again, for the 16 km route, the results were better than the respondents’ expectations; however, overall vehicle movement was not optimal due to the frequent stop-and-go patterns, which led to time loss and increased energy and fuel consumption. For the other two routes, the actual times were longer than expected. At the same time, travel times for the 6 km route showed the smallest variation, and the decrease in stop-and-go mode compared to other routes. All the above showed that the city centre and its congestions are clearly a problem in Szczecin.
At the strategic level of urban transportation management, the Six Sigma and crowdsourcing data collection methods, as the elements of intelligent transport systems (ITS), allows us to identify bottlenecks on routes based on statistical data processing over a long period of time (for example, a week, month, quarter, or year). Analysis of urban traffic based on the Six Sigma methodology and crowdsourcing data enables municipal authorities to make decisions on the priority of investments in the reconstruction and infrastructure transformation of problematic road sections (Table 8).
Table 8.
Priority for investment in infrastructure.
The 12 km route is the most problematic, and has the most instability and the least potential capacity. According to the Six Sigma management methodology, the next steps should be to find the root cause of the problem, then plan and implement the problem solution. In the case of the observed problem of travel time on a 6 km route which affects fuel and energy consumption, solutions may be installation of smart traffic lights, road displays (variable message signs) for variable speed limit (VSL), and detour directions, providing the driver with timely online information about changes in routes and speed through ITS.
At the operational level of city transport management, Six Sigma and crowdsourced data collection enable the ITS to assess traffic conditions in small samples in real time to optimise traffic light cycles, speed adjustments, and traffic direction. The application of the Six Sigma methodology to urban transport management at the strategic level is associated with a number of limitations, which are determined by uncertainty and traffic dynamics (repairs, accidents, mass events, and human, political, and social factors, etc.), and a long cycle of decision-making (Define–Measure–Analyse–Improve–Control). Another limitation of the Six Sigma method is the possibility of using the Cp and Cpk (Equations (1) and (2)) indexes only to evaluate normally distributed processes [62]. It is important to remember to collect an appropriate number of surveys so that the established customer tolerance limits are reliable.
The results showed high traffic instability on all selected routes, and congestion on the city centre roads, which led to increased travel times and higher energy and fuel consumption due to the prevalence of stop-and-go traffic. Such a negative situation on the selected routes requires management of urban transport both at the strategic and operational levels in real time.
At the strategic level, within the framework of the municipal energy and resource conservation policies defined by the Road and Public Transport Authority (RPTA) in Szczecin, several generally accepted recommendations for improving urban traffic can be proposed, which include
- -
- Development of urban transport infrastructure by the building and reconstruction of roads for all types of public and private transport and pedestrians, and Park & Ride, the improvement of the public transport structure (trams, e-buses, and e-vehicles for car sharing, e-bicycles, e-scooters, etc.) and allocation of priority lanes for them on key routes, and the modernisation of ITS, the implementation of cutting-edge technologies for monitoring and managing urban traffic.
- -
- Formation of flexible work schedules for the city’s population, stimulation of remote employment, and use of public transport, including carsharing, carpooling, and crowdshipping [63], shifting freight and service traffic to off-peak hours (night/early unloading) [64], restricting the flow of private cars into the city centre and providing parking outside of it at preferential rates with online payment, information about the availability of free parking spaces, and coordination with the public transport schedule.
At the operational level, within the framework of the municipal energy and resource conservation policies defined by the RPTA in Szczecin, specific numbers of recommendations for improving urban traffic can be proposed considering the literature review and results of this study:
- -
- Smart sustainable urban transportation management based on the integration of crowdsourcing data with data from all information sources, including data from urban cameras and detectors, data from the RPTA in Szczecin (ZDiTM Szczecin), data from navigation providers (TomTom/Google/HERE), etc., on the digital platform of Urban Traffic Control (UTC) and platform service supply chain, and Six Sigma analyses of traffic in real time [61,65]. This integration of databases on digital platforms, along with the proposed approach to analysing urban traffic processes, makes it possible to comprehensively cover emerging congestion wave sites and respond to them in a timely manner using artificial intelligence [15].
- -
- Smart urban transportation management includes adaptive traffic light management in real time to create quasi-continuous traffic flows and corridors with a high proportion of public transport to reduce waiting times and downtime at traffic lights, prevent congestion, and reduce energy and fuel consumption. The capacity of urban roads increases not only by accelerating the flow, but primarily by smoothing out the unevenness of traffic and redistributing it [1]. In practice, this is achieved by the integrated adaptive urban traffic management by ITS due to smart regulation of the flow rate and intelligent traffic lights, dynamically adjusting phases, taking into account the actual traffic situation, restrictions on entry into congested areas, and the redistribution of flows to less congested sections of the road, timely informing all stakeholders about the current situation on the roads, changing transport thinking and human behaviour [17,21].
- -
- Sustainable urban transport management is related to economic, social, and environmental aspects of smart city development. The main issues of sustainable urban traffic management include municipal energy and resource conservation policies, and reduction in gas and noise emissions [14,18]. The implementation of the municipal energy and resource conservation policies within the framework of urban traffic in practice is associated with the zonal regulation of the transport flow speed. Dynamic speed harmonisation within the established limits on various sections of urban roads makes it possible to adjust the recommended (maximum) speed of traffic flow in front of bottleneck section of road to prevent congestion and stop-and-go traffic. Stop-and-go motion of vehicles contributes to a significant increase in energy and fuel consumption (in some cases 2–3 times) [1]. Within the framework of Szczecin, it is possible to apply the VSL with the following set of restrictions: VSL ≤ 50 km/h, VSL ≤ 60 km/h, and VSL ≤ 70 km/h. Reducing the speed of the traffic flow helps to stabilise its average speed, which has a positive effect on the energy and fuel consumption of vehicles [1]. Another important aspect of the municipal energy and resource conservation policies is the synchronisation of charging strategies for e-vehicles, which reduces peak load on the power grid and optimises energy costs [66].
The next step to transport management using the Six Sigma methodology should be to diagnose problems based not only on basic data such as distance, travel time, and energy and fuel consumption of vehicles, but also random events such as traffic accidents, mass events, construction work, or changes in traffic. Acquisition of such data may be supported by modern technological solutions, including unmanned aerial vehicles equipped with video cameras, Lidar sensors, or thermal imaging devices. Their use enables the creation of dynamic traffic maps, detection of disruptions, and analysis of transport intensity without the need to install ground-based equipment and regardless of topographical conditions or infrastructure availability.
Another area that requires special consideration in the context of Six Sigma-based management is the identification of customers’ expectations, especially those of urban transportation system users. In the article, feedback was collected via an online survey—a method proven to be effective for engaging a larger number of respondents, e.g., through crowdsourcing initiatives. Other approach examples include public consultations, participatory budgeting, or mobile applications that allow users to report problems or suggestions in real time. However, it is important not to overlook the issue of digital exclusion, which limits some residents’ access to online tools. Therefore, the opinion-gathering process should also include traditional data acquisition channels. For instance, appropriately designed questionnaires distributed during vehicle registration, application for city cards, or the purchase of parking permits. In addition, face to face interviews conducted in high-traffic areas, such as transport hubs or districts offices, may prove valuable. It is also worth considering the use of passive data sources, such as the analysis of complaints and inquiries submitted to municipalities, monitoring of social media discussions, or data from call-centre systems. This approach helps to capture the needs of residents who inactively participate in formal consultation processes, yet can provide valuable insights into the actual performance of the urban transportation system.
All of the presented study addresses an existing gap by proposing an innovative approach that integrates Six Sigma methodology with crowdsourced traffic data. By applying the mentioned tools, this paper moves beyond descriptive monitoring to provide systematic evaluation of process stability, identification of disruptive factors, and implementation of quality improvements. In doing so, the article contributes original, statistically grounded, and repeatable quality management frameworks for urban transport systems.
Author Contributions
Conceptualization, J.L., A.K. and T.D. (Tomasz Dudek); methodology, J.L., A.K. and T.D. (Tomasz Dudek); software, J.L., A.K. and T.D. (Tomasz Dudek); validation, A.K., T.D. (Tomasz Dudek) and T.D. (Tygran Dzhuguryan); formal analysis, A.K., T.D. (Tomasz Dudek) and T.D. (Tygran Dzhuguryan); investigation, A.K., T.D. (Tomasz Dudek), T.D. (Tygran Dzhuguryan) and J.L.; resources, A.K. and T.D.; data curation, J.L. and A.K.; writing—original draft preparation, J.L., A.K., T.D. (Tomasz Dudek) and T.D. (Tygran Dzhuguryan); writing—review and editing, A.K. and T.D. (Tomasz Dudek); visualization, J.L. and A.K.; supervision, T.D. (Tomasz Dudek) and T.D. (Tygran Dzhuguryan); project administration, T.D. (Tomasz Dudek) and A.K. All authors have read and agreed to the published version of the manuscript.
Funding
This research received no external funding.
Institutional Review Board Statement
Not applicable.
Informed Consent Statement
Not applicable.
Data Availability Statement
Data is unavailable due to privacy.
Conflicts of Interest
The authors declare no conflicts of interest. The funders had no role in the design of the study; in the collection, analyses, or interpretation of data; in the writing of the manuscript; or in the decision to publish the results.
References
- Jereb, B.; Stopka, O.; Skrúcaný, T. Methodology for Estimating the Effect of Traffic Flow Management on Fuel Consumption and Co2production: A Case Study of Celje, Slovenia. Energies 2021, 14, 1673. [Google Scholar] [CrossRef]
- Acharya, S.; Garikapati, V.M.; Allen, M.; Lyu, M.; Hoehne, C.; Sharda, S.; Fitzgerald, R. Enriching OpenStreetMap Network Data for Transportation Applications: Insights into the Impact of Urban Congestion on Accessibility. J. Transp. Geogr. 2025, 123, 104096. [Google Scholar] [CrossRef]
- Alanazi, F.; Alenezi, M. A Framework for Integrating Intelligent Transportation Systems with Smart City Infrastructure. J. Infrastruct. Policy Dev. 2024, 8, 3558. [Google Scholar] [CrossRef]
- Urbano, V.M.; Arena, M.; Azzone, G. Big Data for Decision-Making in Public Transport Management: A Comparison of Different Data Sources. Res. Transp. Bus. Manag. 2025, 59, 101298. [Google Scholar] [CrossRef]
- Yang, B.; Tian, Y.; Wang, J.; Hu, X.; An, S. How to Improve Urban Transportation Planning in Big Data Era? A Practice in the Study of Traffic Analysis Zone Delineation. Transp. Policy 2022, 127, 1–14. [Google Scholar] [CrossRef]
- Hystad, P.; Willis, M.; Hill, E.; Schrank, D.; Molitor, J.; Larkin, A.; Ritz, B. Impacts of Vehicle Emission Regulations and Local Congestion Policies on Birth Outcomes Associated with Traffic Air Pollution. Res. Rep. Health Eff. Inst. 2025, 2025, 223. [Google Scholar]
- Obando, F.A.R. Understanding the Effects of Traffic Congestion on Emissions from Urban Buses. An Integrated Approach Incorporating Real-World Emissions, Naturalistic Driving Profiles, and City Traffic Sensor Data. Ph.D Thesis, Technical University, Madrid, Spain, 2021. [Google Scholar]
- Khomenko, S.; Cirach, M.; Barrera-Gómez, J.; Pereira-Barboza, E.; Iungman, T.; Mueller, N.; Foraster, M.; Tonne, C.; Thondoo, M.; Jephcote, C.; et al. Impact of Road Traffic Noise on Annoyance and Preventable Mortality in European Cities: A Health Impact Assessment. Environ. Int. 2022, 162, 107160. [Google Scholar] [CrossRef]
- Wang, P.; Zhang, R.; Sun, S.; Gao, M.; Zheng, B.; Zhang, D.; Zhang, Y.; Carmichael, G.R.; Zhang, H. Aggravated Air Pollution and Health Burden Due to Traffic Congestion in Urban China. Atmos. Chem. Phys. 2023, 23, 2983–2996. [Google Scholar] [CrossRef]
- Willis, M.D.; Hill, E.L.; Ncube, C.N.; Campbell, E.J.; Harris, L.; Harleman, M.; Ritz, B.; Hystad, P. Changes in Socioeconomic Disparities for Traffic-Related Air Pollution Exposure during Pregnancy over a 20-Year Period in Texas. JAMA Netw. Open 2023, 6, e2328012. [Google Scholar] [CrossRef]
- Cuñat Negueroles, S.; Reinosa Simón, R.; Julián, M.; Belsa, A.; Lacalle, I.; S-Julián, R.; Palau, C.E. A Blockchain-Based Digital Twin for IoT Deployments in Logistics and Transportation. Future Gener. Comput. Syst. 2024, 158, 73–88. [Google Scholar] [CrossRef]
- Dudek, T.; Kujawski, A. The Concept of Big Data Management with Various Transportation Systems Sources as a Key Role in Smart Cities Development. Energies 2022, 15, 73–88. [Google Scholar] [CrossRef]
- Iwan, S.; Małecki, K.; Korczak, J. Impact of Telematics on Efficiency of Urban Freight Transport. In Communications in Computer and Information Science; Springer: Berlin/Heidelberg, Germany, 2013; Volume 395, pp. 50–57. [Google Scholar]
- Małecki, K.; Iwan, S.; Kijewska, K. Influence of Intelligent Transportation Systems on Reduction of the Environmental Negative Impact of Urban Freight Transport Based on Szczecin Example. Procedia Soc. Behav. Sci. 2014, 151, 215–229. [Google Scholar] [CrossRef]
- Manandhar, B.; Dunkel Vance, K.; Rawat, D.B.; Yilmaz, N. Leveraging Digital Twin Technology for Sustainable and Efficient Public Transportation. Appl. Sci. 2025, 15, 2942. [Google Scholar] [CrossRef]
- Zhang, X.; Han, D.; Zhang, X.; Fang, L. Design and Application of Intelligent Transportation Multi-Source Data Collaboration Framework Based on Digital Twins. Appl. Sci. 2023, 13, 1923. [Google Scholar] [CrossRef]
- Chmet, F.; Brescia, V.; Degregori, G.; Biancone, P. Supply Chain and Logistics in Smart Cities: A Systematic Literature Review. J. Infrastruct. Policy Dev. 2024, 8, 5525. [Google Scholar] [CrossRef]
- Chocholáč, J.; Kučera, T.; Sommerauerová, D.; Hruška, R.; Machalík, S.; Křupka, J.; Hyršlová, J. Smart city and urban logistics—Research trends and challenges: Systematic literature review. Commun.-Sci. Lett. Univ. Žilina 2023, 25, A175–A192. [Google Scholar] [CrossRef]
- Kaiser, Z.A.; Deb, A. Sustainable Smart City and Sustainable Development Goals (SDGs): A Review. Reg. Sustain. 2025, 6, 100193. [Google Scholar] [CrossRef]
- Ajayi, O.; Bagula, A.B. Smart Cities and Villages: Concept Review and Implementation Perspectives in Developing Cities. arXiv 2024, arXiv:2402.09284. [Google Scholar] [CrossRef]
- Goumiri, S.; Yahiaoui, S.; Djahel, S. Smart Mobility in Smart Cities: Emerging Challenges, Recent Advances and Future Directions. J. Intell. Transp. Syst. Technol. Plan. Oper. 2025, 29, 81–117. [Google Scholar] [CrossRef]
- Kirsanov, S.; Prigoda, L.; Radovanovic, D. Smart cities and city logistics. MEST J. 2023, 11, 104. [Google Scholar] [CrossRef]
- Tachizawa, E.M.; Alvarez-Gil, M.J.; Montes-Sancho, M.J. How “Smart Cities” Will Change Supply Chain Management. Supply Chain Manag. 2015, 20, 237–248. [Google Scholar] [CrossRef]
- Taniguchi, E.; Thompson, R.G.; Qureshi, A.G. Modelling City Logistics Using Recent Innovative Technologies. In Transportation Research Procedia; Elsevier B.V.: Amsterdam, The Netherlands, 2020; Volume 46, pp. 3–12. [Google Scholar]
- Ang, K.L.M.; Seng, J.K.P.; Ngharamike, E.; Ijemaru, G.K. Emerging Technologies for Smart Cities’ Transportation: Geo-Information, Data Analytics and Machine Learning Approaches. ISPRS Int. J. Geoinf. 2022, 11, 85. [Google Scholar] [CrossRef]
- Korczak, J.; Kijewska, K. Smart Logistics in the Development of Smart Cities. Transp. Res. Procedia 2019, 39, 201–211. [Google Scholar] [CrossRef]
- Palaniappan, R.; John, T.J.; Nagaraj, V. IoT Solutions for Smart Cities. IOP Conf. Ser. Mater. Sci. Eng. 2020, 955, 012004. [Google Scholar] [CrossRef]
- Brahimi, M.; Karatzas, S.; Theuriot, J.; Christoforou, Z. Drones for Traffic Flow Analysis of Urban Roundabouts. Int. J. Traffic Transp. Eng. 2020, 9, 62–71. [Google Scholar] [CrossRef]
- Pandey, A.; Sharma, M.; Biswas, S. Concept of Heterogeneity Index for Urban Mixed Traffic. Int. J. Transp. Sci. Technol. 2022, 12, 354–372. [Google Scholar] [CrossRef]
- Iwan, S.; Kijewska, K.; Małecki, K. Data Flows in Urban Freight Transport Management System. In Proceedings of the International Conference on Transport Systems Telematics, Wrocław, Poland, 15–17 April 2015; pp. 1–10. [Google Scholar]
- Kiba-Janiak, M. Risk Management in the Field of Urban Freight Transport. In Proceedings of the Transportation Research Procedia, Warsaw, Poland, 18–21 April 2016. [Google Scholar]
- Rześny-Cieplińska, J.; Tomaszewski, T.; Piecyk-Ouellet, M.; Kiba-Janiak, M. Emerging Trends for Urban Freight Transport–The Potential for Sustainable Micromobility. PLoS ONE 2023, 18, e0289915. [Google Scholar] [CrossRef]
- Boghian, R.; Bugheanu, A.-M.; Dinulescu, R. Improving the Romanian Public Transport Services by Using Lean Six Sigma Methodology. In Proceedings of the 12th International Management Conference “Management Perspectives in the Digital Era”, Bucharest, Romania, 1 November 2018. [Google Scholar]
- Kuvvetli, Ü.; Firuzan, A.R. Applying Six Sigma in Urban Public Transportation to Reduce Traffic Accidents Involving Municipality Buses. Total Qual. Manag. Bus. Excell. 2019, 30, 82–107. [Google Scholar] [CrossRef]
- Lemke, J.; Kijewska, K.; Iwan, S.; Dudek, T. Six Sigma in Urban Logistics Management—A Case Study. Sustainability 2021, 13, 4302. [Google Scholar] [CrossRef]
- Vivekananthamoorthy, N.; Sankar, S. Lean Six Sigma. In Six Sigma; Coskun, A., Ed.; IntechOpen: Rijeka, Croatia, 2011. [Google Scholar][Green Version]
- Prabu, K.; Makesh, J.; Raj, K.N.; Devadasan, S.R.; Murugesh, R. Six Sigma Implementation through DMAIC: A Case Study. Int. J. Process. Manag. Benchmarking 2013, 3, 386. [Google Scholar] [CrossRef]
- Dhamija, S.K.; Singh, D.; Kumar, S.; Professor, A.; Scholar, R. Implementing 8d Model of Problem Solving in Employee Turnover: A Study of Selected Hotels in Delhi and Rajasthan. J. Kashmir Tour. Cater. Technol. 2015, 2, 1–10. [Google Scholar]
- Chakraborty, A.; Chuan Tan, K. Case Study Analysis of Six Sigma Implementation in Service Organisations. Bus. Process Manag. J. 2012, 18, 992–1019. [Google Scholar] [CrossRef]
- Ansari, A.; Lockwood, D.L. Application of Six-Sigma in Finance: A Case Study. J. Case Res. Bus. Econ. 2010, 3, 1. [Google Scholar]
- Tjahjono, B.; Ball, P.; Vitanov, V.I.; Scorzafave, C.; Nogueira, J.; Calleja, J.; Minguet, M.; Narasimha, L.; Rivas, A.; Srivastava, A.; et al. Six Sigma: A Literature Review. Int. J. Lean Six Sigma 2010, 1, 216–233. [Google Scholar] [CrossRef]
- Resende de Carvalho, E.; Elaje Azevedo Simões da Mota, A.; Maués de Souza Martins, G.; Dos Santos Lourenço Bastos, L.; Cristiano Silva Melo, A. The Current Context of Lean and Six Sigma Logistics Applications in Literature: A Systematic Review. Braz. J. Oper. Prod. Manag. 2017, 14, 586–602. [Google Scholar] [CrossRef][Green Version]
- Chopra, A.; Dileep, D.; Chopra, A.R. Application of lean six sigma in the transport sector of the supply chain of a leading FMCG in the UAE. J. Southwest Jiaotong Univ. 2022, 57, 464–474. [Google Scholar] [CrossRef]
- Caprari, G.; Castelli, G.; Montuori, M.; Camardelli, M.; Malvezzi, R. Digital Twin for Urban Planning in the Green Deal Era: A State of the Art and Future Perspectives. Sustainability 2022, 14, 6263. [Google Scholar] [CrossRef]
- Deren, L.; Wenbo, Y.; Zhenfeng, S. Smart City Based on Digital Twins. Comput. Urban Sci. 2021, 1, 4. [Google Scholar] [CrossRef]
- El-Agamy, R.F.; Sayed, H.A.; AL Akhatatneh, A.M.; Aljohani, M.; Elhosseini, M. Comprehensive Analysis of Digital Twins in Smart Cities: A 4200-Paper Bibliometric Study. Artif. Intell. Rev. 2024, 57, 154. [Google Scholar] [CrossRef]
- Goodchild, M.F.; Connor, D.; Fotheringham, A.S.; Frazier, A.; Kedron, P.; Li, W.; Tong, D. Digital Twins in Urban Informatics. Urban Inform. 2024, 3, 16. [Google Scholar] [CrossRef]
- Moroni, S. Insurmountable Limitations of City-Scale Digital Twins? On Urban Knowledge and Planning. Comput. Urban Sci. 2025, 5, 17. [Google Scholar] [CrossRef]
- Altintasi, O.; Tuydes-Yaman, H.; Tuncay, K. Detection of Urban Traffic Patterns from Floating Car Data (FCD). In Transportation Research Procedia; Elsevier B.V.: Amsterdam, The Netherlands, 2017; Volume 22, pp. 382–391. [Google Scholar]
- Kong, X.; Xia, F.; Ning, Z.; Rahim, A.; Cai, Y.; Gao, Z.; Ma, J. Mobility Dataset Generation for Vehicular Social Networks Based on Floating Car Data. IEEE Trans. Veh. Technol. 2018, 67, 3874–3886. [Google Scholar] [CrossRef]
- Alamri, S. The Geospatial Crowd: Emerging Trends and Challenges in Crowdsourced Spatial Analytics. ISPRS Int. J. Geoinf. 2024, 13, 168. [Google Scholar] [CrossRef]
- Huang, X.; Wang, S.; Yang, D.; Hu, T.; Chen, M.; Zhang, M.; Zhang, G.; Biljecki, F.; Lu, T.; Zou, L.; et al. Crowdsourcing Geospatial Data for Earth and Human Observations: A Review. J. Remote Sens. 2024, 4, 0105. [Google Scholar] [CrossRef]
- Lucic, M.C.; Wan, X.; Ghazzai, H.; Massoud, Y. Leveraging Intelligent Transportation Systems and Smart Vehicles Using Crowdsourcing: An Overview. Smart Cities 2020, 3, 341–360. [Google Scholar] [CrossRef]
- Tao, T.; Lindsey, G.; Stern, R.; Levin, M. The Use of Crowdsourced Mobile Data in Estimating Pedestrian and Bicycle Traffic: A Systematic Review. J. Transp. Land Use 2024, 17, 41–65. [Google Scholar] [CrossRef]
- Kumarage, S. Use of Crowdsourced Travel Time Data in Traffic Engineering Applications. Master’s Thesis, University of Moratuwa Sri Lanka, Moratuwa, Sri Lanka, 2018. [Google Scholar]
- Vazquez, L.; Valdez, A.; Cortes, G.; Rosales, M. Development of a Graphic Information System Applied to Quality Statistic Control in Production Processes. Int. J. Adv. Comput. Sci. Appl. 2020, 11, 552–558. [Google Scholar] [CrossRef]
- Lloyd, R. Quality Health Care: A Guide to Developing and Using Indicators, 2nd ed.; Jones & Bartlett Learning: New York, NY, USA, 2019. [Google Scholar]
- Hussain, A.; Kumar Paharia, A. Application of Six Sigma Approach for Delay Analysis in Construction Project. Int. J. Res. Manag. 2018, 2, 1–22. [Google Scholar] [CrossRef]
- Czarski, A.; Matusiewicz, P. Influence of Measurement System Quality on the Evaluation of Process Capability Indices Andrzej Czarski, Piotr Matusiewicz. Metall. Foundry Eng. 2012, 38, 25. [Google Scholar] [CrossRef]
- Alatefi, M.; Ahmad, S.; Alkahtani, M. Performance Evaluation Using Multivariate Non-Normal Process Capability. Processes 2019, 7, 833. [Google Scholar] [CrossRef]
- Lemke, J.; Strulak-Wójcikiewicz, R. Using Six Sigma in the Management of City Logistics Processes: A Case Study on the Impact Assessment of Transport Infrastructure on Fuel Consumption in Szczecin. Eur. Res. Stud. J. 2021, 24, 1152–1177. [Google Scholar] [CrossRef]
- Aldowaisan, T.; Nourelfath, M.; Hassan, J. Six Sigma Performance for Non-Normal Processes. Eur. J. Oper. Res. 2015, 247, 968–977. [Google Scholar] [CrossRef]
- Deja, A.; Ślączka, W.; Kaup, M.; Szołtysek, J.; Dzhuguryan, L.; Dzhuguryan, T. Supply Chain Management in Smart City Manufacturing Clusters: An Alternative Approach to Urban Freight Mobility with Electric Vehicles. Energies 2024, 17, 5284. [Google Scholar] [CrossRef]
- Wiśnicki, B.; Dzhuguryan, T.; Mielniczuk, S.; Petrov, I.; Davydenko, L. A Decision Support Model for Lean Supply Chain Management in City Multifloor Manufacturing Clusters. Sustainability 2024, 16, 8801. [Google Scholar] [CrossRef]
- Lin, Y.; Chen, A.; Yin, Y.; Li, Q.; Zhu, Q.; Luo, J. A Framework for Sustainable Management of the Platform Service Supply Chain: An Empirical Study of the Logistics Sector in China. Int. J. Prod. Econ. 2021, 235, 108112. [Google Scholar] [CrossRef]
- Davydenko, L.; Davydenko, N.; Bosak, A.; Bosak, A.; Deja, A.; Dzhuguryan, T. Smart Sustainable Freight Transport for a City Multi-Floor Manufacturing Cluster: A Framework of the Energy Efficiency Monitoring of Electric Vehicle Fleet Charging. Energies 2022, 15, 3780. [Google Scholar] [CrossRef]
Disclaimer/Publisher’s Note: The statements, opinions and data contained in all publications are solely those of the individual author(s) and contributor(s) and not of MDPI and/or the editor(s). MDPI and/or the editor(s) disclaim responsibility for any injury to people or property resulting from any ideas, methods, instructions or products referred to in the content. |
© 2025 by the authors. Licensee MDPI, Basel, Switzerland. This article is an open access article distributed under the terms and conditions of the Creative Commons Attribution (CC BY) license (https://creativecommons.org/licenses/by/4.0/).