Article

Investigation of the Optimum Solar Insolation for PV Systems Considering the Effect of Tilt Angle and Ambient Temperature

1
Engineering Department, University of Fujairah (UOF), Fujairah P.O. Box 2202, United Arab Emirates
2
Engineering Department, Fujairah University (FU), Fujairah P.O. Box 2202, United Arab Emirates
3
Faculty of Engineering, Electrical Engineering Department, Fayoum University, Fayoum 63514, Egypt
*
Author to whom correspondence should be addressed.
Energies 2025, 18(19), 5257; https://doi.org/10.3390/en18195257
Submission received: 10 August 2025 / Revised: 20 September 2025 / Accepted: 24 September 2025 / Published: 3 October 2025
(This article belongs to the Collection Featured Papers in Solar Energy and Photovoltaic Systems Section)

Abstract

As interest in PV installation has spiked in recent years, the need for optimizing several factors of PV performance has become crucial. These are tilt angle and solar cell temperature (taking into account ambient temperature) and their effect on solar insolation for solar photovoltaic (PV) systems. The objective of this study is to achieve the optimal tilt angle and cell temperature accordingly by developing a MATLAB program to reach the target of maximizing the received solar insolation. To achieve this, additional solar angles such as the azimuth, hour, latitude angle, declination angle, hour angle, and azimuth angle need to be calculated. By computing the solar insolation for specific regions of interest, specifically the Gulf Cooperation Council (GCC) countries, the desired results can be obtained. Additionally, the study aims to assess the influence of PV cell temperature on the I–V curves of commercially available PV modules, which will provide insights into the impact of temperature on the performance characteristics of PV cells. By employing a developed model, the study examined the combined collective influences of solar received radiation, tilt angle, and ambient temperature on the output power of PV systems in five different cities. The annual optimal tilt angles were found to be as follows: Mecca (21.4° N)—21.48°, Fujairah (25.13° N)—25.21°, Kuwait (29.3° N)—29.38°, Baghdad (33.3° N)—33.38°, and Mostaganem (35.9° N)—2535.98°. Notably, the estimated yearly optimal tilt angles closely corresponded to the latitudes of the respective cities. Additionally, the study explored the impact of ambient temperature on PV module performance. It was observed that an increase in ambient temperature resulted in a corresponding rise in the temperature of the PV cells, indicating the significant influence of environmental temperature on PV module efficiency. Overall, the findings demonstrate that adjusting the tilt angle of PV modules on a monthly basis led to higher solar power output compared to yearly adjustments. These results underscore the importance of considering both solar radiation and ambient temperature when optimizing PV power generation.

1. Introduction

The Middle East, including the Gulf Cooperation Council (GCC) countries, has traditionally been known for its vast reserves of oil and gas [1,2,3]. However, in recent years, there has been a notable shift towards renewable energy sources, particularly solar energy [4]. The countries in the Middle East, like the UAE, have recognized the potential of solar power and have set ambitious goals to diversify their energy mix [5,6,7]. Solar energy has emerged as a clean and sustainable alternative in the Middle East, given the region’s abundant sunlight throughout the year [8,9]. The Middle East’s geographical location provides it with a significant advantage for solar power generation. The intense and consistent solar radiation in the region makes it an ideal location for the deployment of solar PV panels, which convert sunlight into electricity [10]. The performance of solar PV panels is influenced by various factors, with two key parameters being the tilt angle (which in some textbooks is referred to as the incident angle and which is defined as the angle between the plane of the PV module and the horizontal ground surface) [11,12] and the ambient air temperature (the temperature of the environment surrounding the PV) [13]. The tilt angle of the solar panels determines the optimal angle at which they should be positioned to maximize solar energy capture. Adjusting the tilt angle based on the geographical location helps optimize the efficiency and output of the solar panels, ensuring they receive the maximum amount of sunlight. Additionally, the ambient air temperature in the Middle East plays a critical role in the performance of solar PV panels. As temperatures rise, the operating temperature of the panels also increases, affecting their efficiency and overall performance [14]. Managing the temperature of the solar panels is crucial to ensure their optimal functioning and to mitigate any adverse effects caused by excessive heat [15,16]. By considering and optimizing the tilt angle and ambient air temperature, the Middle East can maximize the efficiency and output of solar PV panels, thereby harnessing the full potential of solar energy. This transition towards renewable energy sources not only helps reduce reliance on fossil fuels but also contributes to mitigating climate change and promoting sustainable development in the region. The tilt angle θ refers to the angle at which the solar panels are installed relative to the ground [17].
The ambient temperature also affects the performance of solar panels. As the temperature increases, the efficiency of the solar panels decreases, as shown in Figure 1. Numerous studies have been conducted on the effects of tilt angle and temperature on the performance of solar PV panels. In [18], a novel method is proposed for finding the parameters of the two-diode model specially designed for Copper Indium Diselenide (CIS) thin film PV modules. The authors introduce a hybrid approach that combines traditional analytical methods with the Differential Evolution (DE) soft computing technique. The proposed method computes all the parameters simultaneously based on available datasheet information and has been validated against experimental data from CIS thin film modules. The results show great accuracy, particularly under low irradiance and high temperature conditions. Furthermore, the study [19] focused on optimizing the solar PV tilt angle for maximum power output in Saudi Arabia. By using different models, they found that the anisotropic model provided 5% more energy. They obtained data of the monthly and yearly tilt angles using the same model, and the device they used to conduct their case study was a mono-crystalline silicon PV array [19]. Based on the same concept of finding the tilt angle in the Middle East region, a study using a mathematical model as in [20,21] focused on exploring the optimization of solar panel tilt angles in the Gulf Cooperation Council (GCC) countries and in a specific city location (Fujairah) to enhance solar energy production. The study created a mathematical model to determine the ideal tilt angle based on location and compared the results with those obtained from the PVWatts calculator. The study [22] focused on estimating the optimum tilt angle of PV panels in various cities in Saudi Arabia. The researchers confirmed the influence of tilt angle on solar radiation received by the PVs, taking into account factors such as sun position, latitude, and local geographical characteristics. They obtained horizontal solar radiation data from NASA for the studied city and utilized MATLAB software to find the optimal tilt angle by maximizing solar radiation. Experimental validation was performed, showing the necessity of negative tilt angles during summer. The results indicated that adjusting the tilt angle six times per year allowed for harvesting 99.5% of the attainable solar radiation compared to daily adjustment of PV panels. Moving forward, recent work continues to refine optimal tilt estimation beyond simple latitude rules. Another recent study has been conducted in Libya; ref. [12] derived monthly empirical models having good statistical agreement, confirming higher winter tilts and near-zero summer tilts, and providing site-ready formulae for practitioners.
In this study, our aim is to investigate the impact of tilt angle and temperature on PV systems, with a focus on Al-Fujairah city as a case study and other cities in the Middle East region having varying latitudes. In Section 2 and Section 3, the paper provides a concise mathematical model for optimizing the tilt angle and a model for estimating the cell temperature under solar radiation and the solar insolation of the PV panels. In Section 4, the methodology of the proposed approach is discussed, followed by the presentation of results and discussions related to the case study in Section 5. The study emphasizes the outcomes and highlights the relevance of the research for local PV designers. By improving the efficiency and cost effectiveness of solar energy systems, this study has the potential to contribute to the advancement of renewable energy in five Middle Eastern cities.

2. Analysis of Solar Angles and Insolation

2.1. Solar Angles

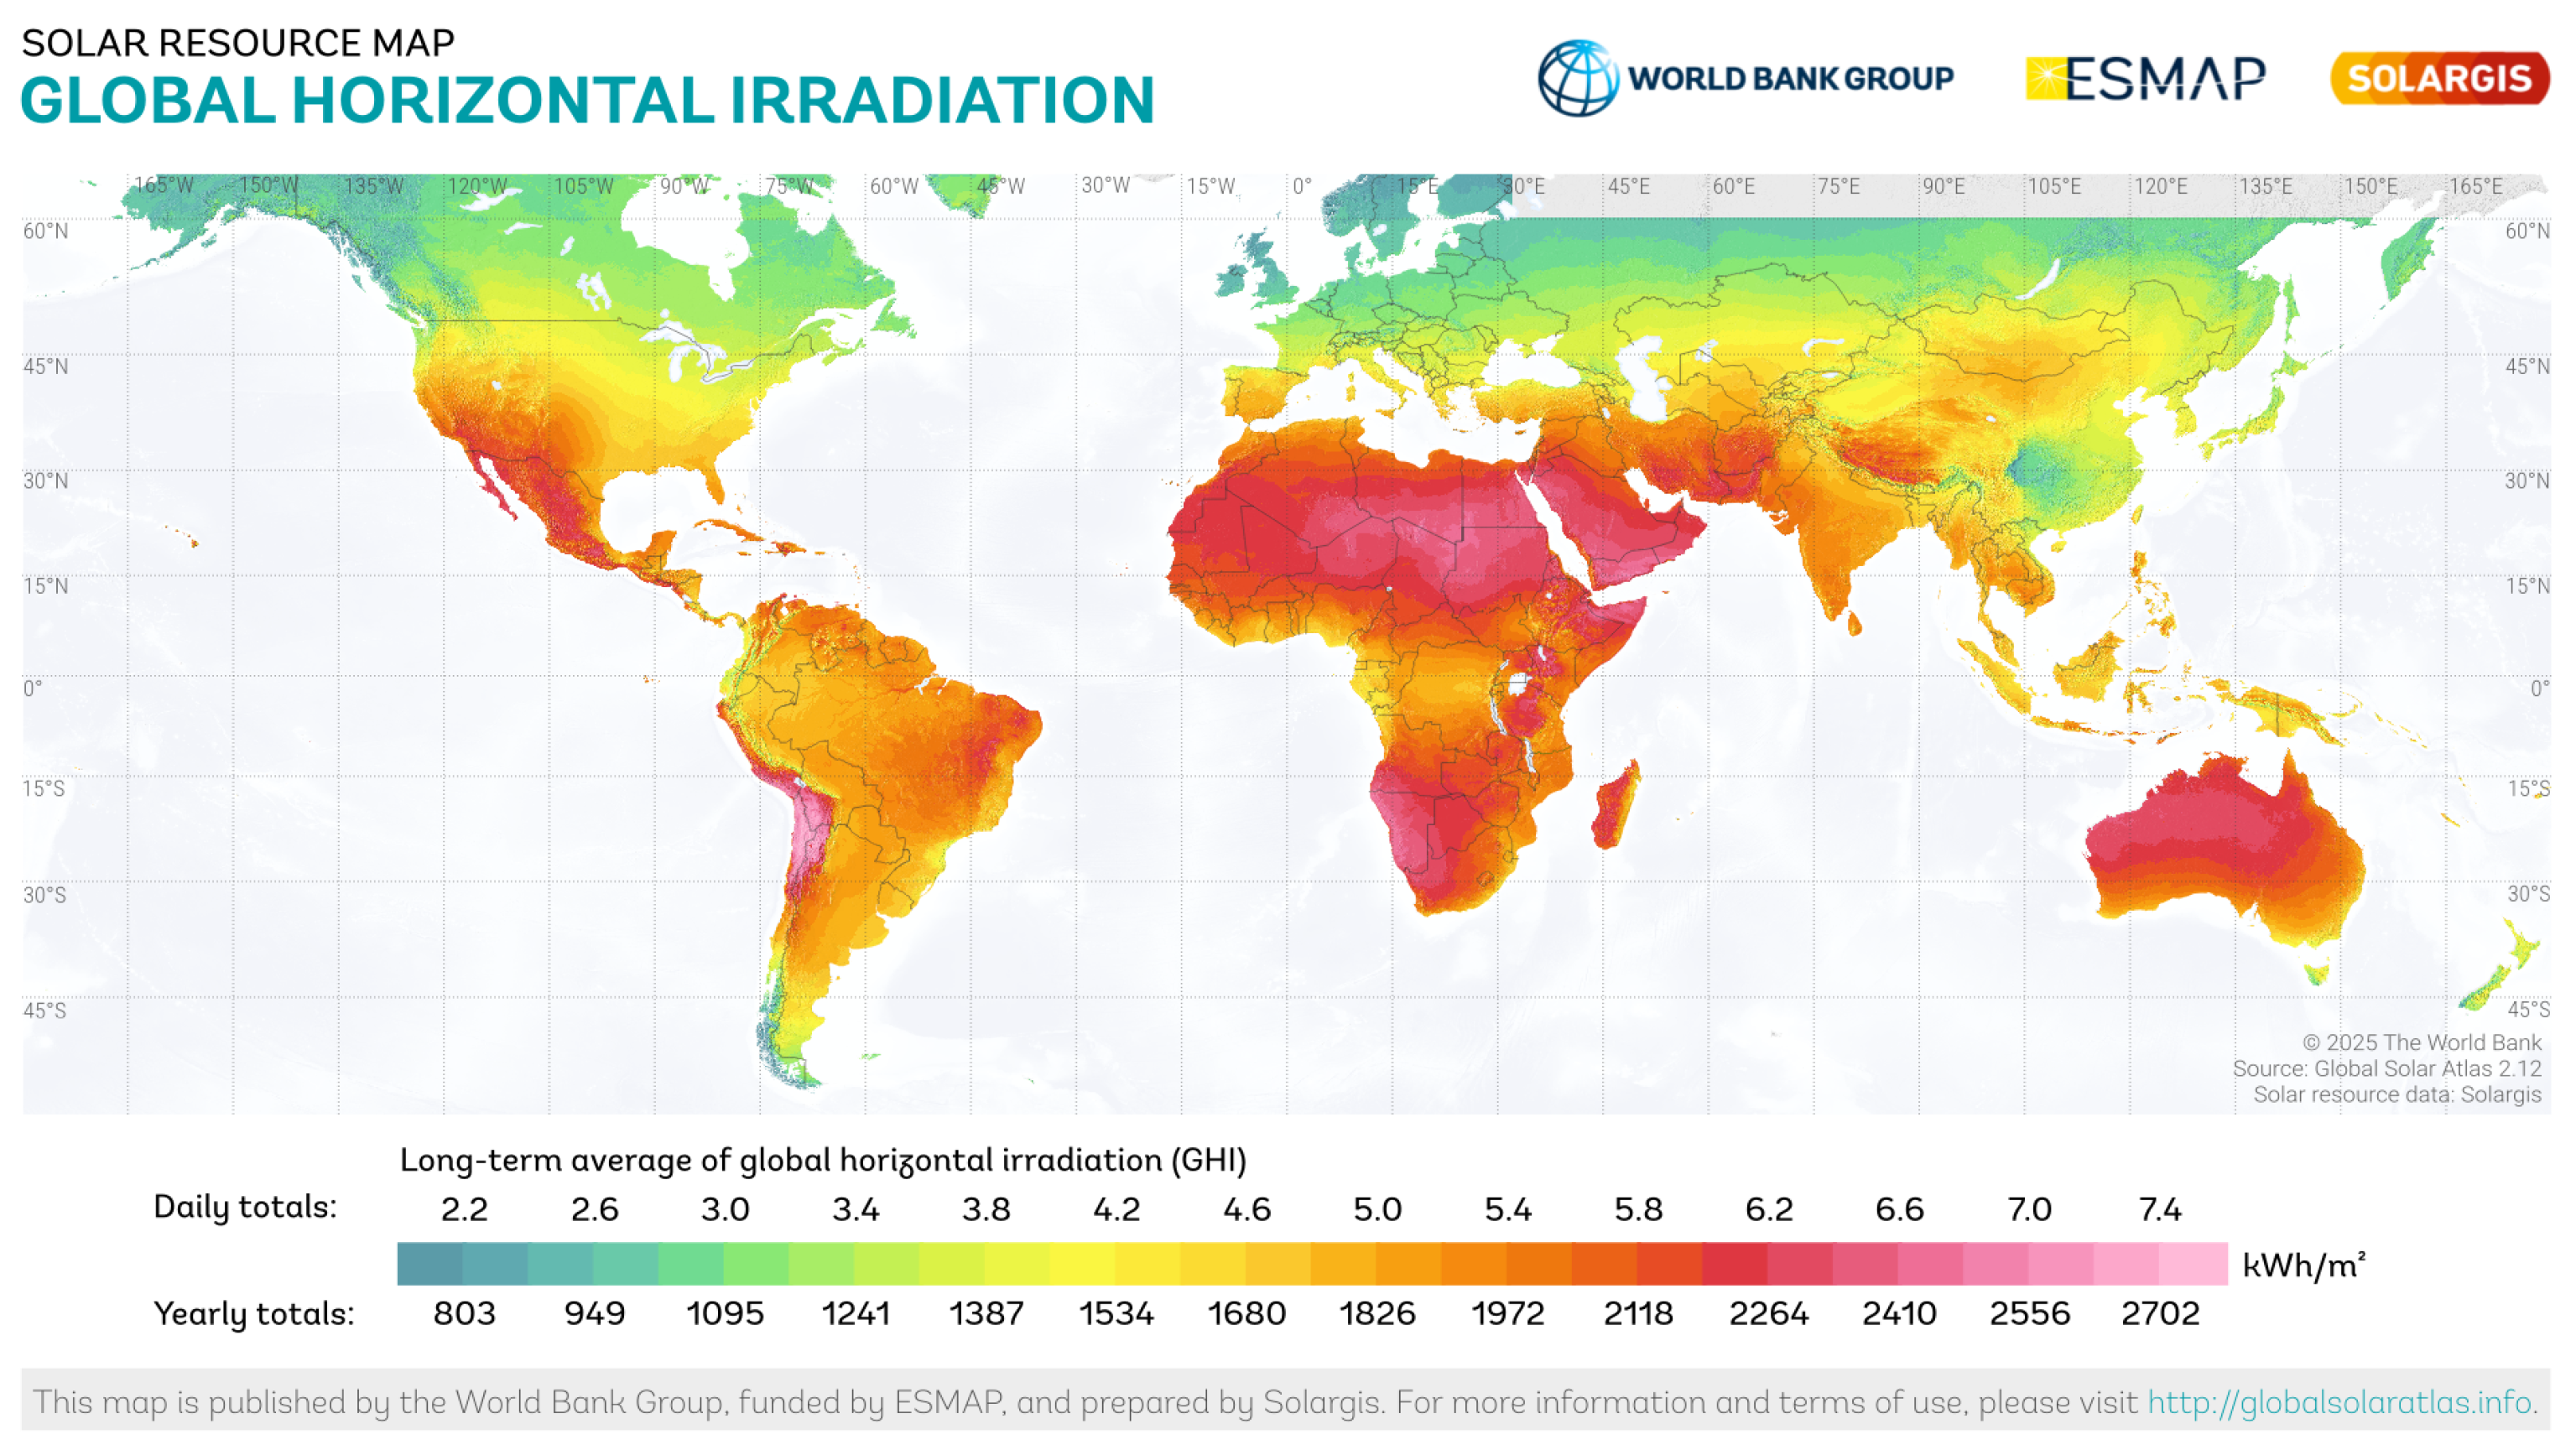
Solar angles and solar insolation are important factors in maximizing the utilization of solar energy [23,24]. Solar angles affect the efficiency of solar panels and the amount of energy they can generate. The performance of solar panels is optimized when they are positioned at an optimal angle towards the sun, receiving the maximum amount of solar radiation. These angles include the latitude, declination angle, tilt angle, azimuth angle, and hour angle. In the current work, we explore each of these angles and their significance in solar applications. Latitude is the angular distance of a location on the Earth’s surface north or south of the equator, measured in ° [17]. It plays a crucial role in determining the solar energy availability in a specific location. The radiation received by a surface is directly proportional to the latitude of the location. For instance, locations closer to the equator receive more solar radiation throughout the year than those at higher latitudes, as shown in the global horizontal solar radiation map in Figure 2 [25].
Latitude is also significant in determining the length of daylight hours. The declination angle is the angle between the direction of the sun’s rays and the plane of the Earth’s equator [17]. It can be calculated using Equation (1).
δ = 23.45 · sin 360 365 · ( 284 + n )
Note that n is the number of days during the year; as an example, 31 January is 31 and 1 February is 32. The hour angle is the angular distance between the sun’s rays and the local meridian. It is measured in ° or time, and it is used to calculate solar time, which is different from the standard time used for clock synchronization. The hour angle affects the solar radiation intensity and the length of daylight hours using Equation (2) [17].
H = 15 · ( T 12 )
where T is the Atlantic Standard Time (AST), where a positive value corresponds to afternoon hours and a negative value corresponds to morning hours. Also, the length of the day depends on hour angles and can be calculated by Equation (3) [17]:
h = cos 1 ( tan ( L ) tan ( δ ) )
where L is the latitude angle and δ is the declination angle.
The azimuth angle is the angular distance between the direction of the sun and the orientation of the surface. It is measured in ° from north, east, south, or west [17]. The azimuth angle affects the amount of solar radiation received by a surface, and it is important for solar tracking systems that follow the sun’s movement throughout the day. In the northern hemisphere, the optimal azimuth angle for solar panels is towards the south, while in the southern hemisphere, it is towards the north. Equation (4) shows the relation of the azimuth angle
tan ( ω ) = cos ( δ ) · sin ( H ) cos ( ϕ ) · sin ( δ ) sin ( ϕ ) · cos ( δ ) · cos ( H )
where ω is the azimuth angle, δ is the declination angle, ϕ is the latitude of the location, and H is the hour angle. The incident angle ( θ ) refers to the angle between the sun’s rays and the perpendicular line to the surface where the rays make contact [22]. Equation (5) is utilized to estimate the incident angle specifically for a horizontal surface. For the northern hemisphere, when facing south, it is written as Equation (6):
cos ( θ ) = sin ( ϕ ) sin ( δ ) + cos ( ϕ ) cos ( δ ) cos ( H )
cos ( θ ) = sin ( ϕ Θ ) sin ( δ ) + cos ( ϕ Θ ) cos ( δ ) cos ( H )
where ϕ is the latitude of the location, H is the hour angle, δ is declination angle, and θ is the tilt angle.
The tilt angle, also known as the solar altitude angle, is the angle between a surface and the horizontal plane. It affects the amount of solar radiation received by the surface, and it is the most critical factor in determining the performance of solar panels. The optimal tilt angle varies depending on the latitude of the location and the time of the year, as shown in [17]. For instance, solar panels in the northern hemisphere should be tilted towards the south at an angle equal to the latitude plus 15° during winter and the latitude minus 15° during summer.
Θ = ϕ tan 1 H sin ( H ) · tan ( δ )
where H is the hour angle, and δ is the declination.

2.2. Solar Insolation

Solar insolation, also known as solar irradiance, is the amount of solar energy that reaches a given surface area over a certain period (Natalia O., 2022) [26]. For solar power systems, solar insolation is a critical factor to consider as it directly affects the amount of power that can be generated by the system. The more solar insolation the solar panel receives, the more power it can produce. The units of solar insolation are typically expressed in watts per square meter (W/m2) or kilowatt-hours per square meter per day (kWh/m2/day). The amount of solar insolation that a given location receives depends on several factors, including latitude, time of day, time of year, weather conditions, and the presence of obstructions such as buildings or trees. The type of solar insolation is expressed as one of three main types (direct normal irradiance, diffuse horizontal irradiance, and reflected solar irradiance).
  • Direct Normal Irradiance (DNI)
DNI is the amount of solar radiation that comes directly from the sun and strikes a surface that is perpendicular to the sun’s rays. It is the amount of radiation that would be received by a tracking solar panel that follows the sun’s movement across the sky. DNI is typically expressed in units of watts per square meter (W/m2). It is calculated it by Equation (8) [27]:
I b c = I b · cos ( θ )
where I b is the direct beam insolation normal to the sun’s rays and θ is the incident angle calculated by Equation (6).
  • Diffuse Horizintal irradiance (DHI)
DHI is the amount of solar radiation that reaches the surface from the sky (including from the sun, but also from scattered radiation in the atmosphere). It is the amount of radiation that would be received by a fixed solar panel that is oriented horizontally. DHI is typically expressed in units of watts per square meter (W/m2).
I d h = I b · C
where I b is the direct beam insolation normal to the sun’s rays and C is the diffuse radiation that is reflected by the sky and the surroundings (such as trees, buildings, and other objects).
C is calculated by Equation (10) [28]:
C = 0.095 + 0.04 sin 360 365 ( n 100 )
If the surface of the collector has a specific tilt angle, this will be calculated by Equation (11):
I d c = I d h · ( 1 + cos ( θ ) ) 2
  • Reflected Solar Irradiance
The final component of solar radiation that reaches a collector is composed of both direct and diffuse radiation, but it can also include radiation that is reflected by surfaces in front of the panel [29]. This reflected radiation can significantly enhance the performance of the collector on a bright day, especially if there is snow or water in front of it. However, the amount of reflected radiation can vary greatly depending on the surface reflectance and geometry, and modeling it accurately requires several assumptions and approximations. The simplest model for estimating the reflected radiation assumes a large, horizontal surface in front of the collector having a diffuse reflectance ( ρ ), which reflects the radiation equally in all directions. This model is very rough, and the resulting estimates may not be accurate, especially for smooth and bright surfaces. Therefore, it is important to consider more advanced models and simulations that account for the surface properties, geometry, and surrounding environment to accurately estimate the reflected radiation and its impact on collector performance. Is calculated by Equation (12):
I r c = I b · ρ · ( C + sin ( β ) ) · ( 1 cos ( θ ) ) 2
where β is the altitude angle, and θ is the tilt angle.
The reflected radiation assumes a large, horizontal surface in front of the collector having a diffuse reflectance ( ρ ) [30], which is varied with respect to the surface. The total irradiance could be calculated after summing the contributions of direct, diffuse, and reflected irradiance to introduce the total global irradiance.
  • Global Horizontal Irradiance (GHI)
GHI is the total amount of solar radiation that reaches the PV surface at a particular location, including direct, reflected, and diffuse radiation. It is the amount of radiation that would be received by a fixed solar panel that is oriented by the specific tilt angle. GI is typically expressed in units of watts per square meter (W/m2) and is calculated by Equation (13).
I t = I b c + I d c + I r c
  • Extraterrestrial Irradiance
Extraterrestrial irradiance refers to the amount of solar radiation that would reach the Earth’s surface if there were no atmosphere or other interfering factors. It is a theoretical value that serves as a reference for comparing the actual solar radiation measured at the Earth’s surface. Extraterrestrial irradiance depends on the distance between the Earth and the sun, which varies throughout the year due to the Earth’s elliptical orbit. The extraterrestrial irradiance at the top of the Earth’s atmosphere is about 1367 (W/m2) [31] on average, and it varies by less than 3.5% throughout the year due to the Earth’s axial tilt and orbital eccentricity. To estimate the extraterrestrial irradiance at a specific location and time, several empirical models have been developed based on astronomical and physical parameters, such as the Julian day, the Earth–Sun distance, the solar declination, and the solar zenith angle. These models can be used to calculate the extraterrestrial irradiance with high accuracy for most practical purposes, as expressed by Equation (14):
I o = S 1 + 0.033 · cos 2 π n 365
where S equals 1367, (W/m2). the irradiance constant for the whole Earth and the value expressed by Figure 3.

3. PV Power Generation

3.1. PV Cell Temperature

The efficiency of solar modules can be significantly impacted by changes in ambient temperature, particularly when exposed to high levels of solar radiation. This can result in a loss of power due to increased module temperature, as well as issues such as PV cell delamination and rapid degradation. The highest temperature increase typically occurs at midday, while module temperature in the evening tends to match the ambient temperature. To address these concerns, this study focuses on estimating PV cell temperature through various factors, including ambient temperature, heat loss to the environment, electrical conversion efficiency, and irradiance variation. The energy balance equation is applied to a unit area of the module, which is cooled by losses to the environment to obtain this estimate. Equation (15) relates the operating temperature of a PV module to its efficiency ( η ), solar transmittance ( τ ), solar absorption ( α ), and coefficient of heat transfer to the environment ( U L ), which can be challenging to measure and control in practice. The equation expresses the presence of an equilibrium between the solar energy absorbed by the PV array and the combined electrical output and heat transfer to the surroundings. By solving the equation, we can determine the temperature of the cell in Equation (16):
τ α I T = η I t + U L ( T c T a )
T c = T a + I T τ α U L 1 η τ α
while τ α U L can be calculated by Equation (17):
τ α U L = ( T c _ N O C T T a _ N O C T ) I t _ N O C T
where T c _ N O C T is the nominal operating cell temperature in °C, defined as 45 °C, T a _ N O C T is the ambient temperature at which the N O C T is defined as 20 °C, and I t _ N O C T is the solar radiation at which the N O C T is defined, which is 0.7 kW/m2.
Therefore the T c should be calculated by Equation (18):
T c = T a + I T ( T c _ N O C T T a _ N O C T ) I t _ N O C T 1 η τ α
HOMER [25] assumes that τ α equals 0.9, and the efficiency η equals the maximum efficiency of the power point of the PV.
Equation (19) defines η :
η = η S T C 1 + α p ( T c T c _ S T C )
where η S T C is the maximum power point efficiency under standard test conditions, α p is the temperature coefficient of power by %/°C, which is normally negative, and T c _ S T C is the cell temperature under standard test conditions at 25 °C.

3.2. PV Module Power Output for a Double-Diode Model

The characteristics of a PV cell can be represented using a double-diode model. A double-diode PV model is a mathematical model that is commonly used to describe the behavior of a solar cell [32,33]. The model uses two diodes to represent the solar cell’s behavior under different operating conditions [34].
The first diode is used to model the behavior of the solar cell when it is generating power under normal operating conditions, while the second diode is used to model the behavior of the solar cell when it is generating very low levels of power, such as when it is partially shaded or operating under low-light conditions. In a two-diode model, two diodes are used to represent the current–voltage (I–V) characteristics of a PV cell. This model is more complex than the single-diode model but can provide more accurate results, especially when the PV cell operates at high levels of irradiance. The two-diode model considers the recombination of electrons and holes in the base region of the PV cell, which is neglected in the single-diode model. The additional diode represents the recombination process and allows for a more precise description of the I–V characteristics. The circuit simulated as shown in Figure 4. In the two-diode model, the mathematical model is described using Equation (20). Equation (21) describes in detail the value for each branch. Describing the I–V characteristics of the PV cell includes two diode equations.
I = I p v I d 1 I d 2 I r s h
I = I p h I 01 exp V + I · R s n 1 · k · T q 1 I 02 exp V + I · R s n 2 · k · T q 1
The model includes parameters such as the saturation current and ideality factor, which characterize the behavior of the diodes in the PV cell. The parameters of I p h , R s , and R s h are determined by the data sheet of the PV used [34]. The I p h is generated current and is found by Equation (22):
I p h = I s h G s c G
where
  • I: Current through the PV cell.
  • I p h : Photo-generated current, or the current generated by the absorption of light in the PV cell.
  • I 01 : Reverse saturation current of the first diode in the model.
  • q: Elementary charge (1.602 × 10⁻¹⁹ Coulombs).
  • V: Voltage across the PV cell.
  • R s : Series resistance of the PV cell.
  • n 1 : Ideality factor of the first diode.
  • k: Boltzmann constant (1.381 × 10⁻²³ J/K).
  • T: Temperature in Kelvin.
  • I 02 : Reverse saturation current of the second diode in the model.
  • n 2 : Ideality factor of the second diode.
  • R s h : Shunt resistance of the PV cell.
  • I is the output current from the solar panel.
  • I s c is the short-circuit current, which is the current produced by the solar panel under standard test conditions (STC).
  • G is the actual irradiance level incident on the solar panel (in watts per square meter, W/m2).
  • G s c is the irradiance under standard test conditions, usually defined as 1000 W/m2.
The power output of the PV cell is defined as the multiplication of the current and the voltage across the cell. Mathematically, this is expressed in Equation (23) and as the current funded by Equations (20) and (21):
P p v = I p v × V p v
Therefore, temperature is one of the critical factors that can significantly affect the current–voltage (I–V) characteristics of a PV cell. The following explains how temperature influences the I–V curve and the key parameters associated with it:
  • Open-Circuit Voltage (Voc):
The open-circuit voltage of a PV cell decreases with an increase in temperature. This is primarily due to the temperature dependence of the band-gap energy of the semiconductor material used in the cell. As temperature rises, the band gap decreases, resulting in a lower voltage output at open-circuit conditions.
2.
Short-Circuit Current ( I sc ):
The short-circuit current of a PV cell typically increases with an increase in temperature. This is because the mobility of charge carriers (electrons and holes) within the cell improves at higher temperatures, allowing for more efficient generation and collection of photocurrent.
3.
Maximum Power Point (MPP):
The temperature affects the position of the maximum power point (MPP) on the I–V curve. As temperature changes, the MPP voltage and current values shift accordingly. It is important to consider the temperature during system design and optimization to ensure the PV system operates at the MPP under varying temperature conditions.

4. Methodology

To determine the maximum power generated by a tilted solar PV array at any location, we conducted simulations using MATLAB. The process involved several key steps, as outlined in a flow chart, Figure 5. The first step was to gather information about the location, including latitude ( ϕ ), ambient air temperature ( T a ), monthly average daily solar radiation ( I t ), and day of the year (n). Using this information, we estimated the declination angle ( δ ), incident angle ( θ ), and hour angle (H) using Equations (1)–(13). Next, we calculated extraterrestrial radiation ( I o ) for all 365 days of the year. It is worth noting that the temperature coefficient of various parameters, such as Voc, I s c , and power, varies depending on the specific PV cell technology and materials used. For the module studied, the datasheet values adopted in the simulation are as follows: short-circuit current at STC I s c , ref = 3.87 A ; current temperature coefficient K 1 = 2.9 × 10 4 A / C (equivalently α I s c = K 1 / I s c , ref 7.5 × 10 5 ° C 1 + 0.0075 % / ° C ); and NOCT = 45 °C. The electrical model is parameterized with R s = 0.47 Ω , R s h = 1365 Ω , n 1 = 1.5 , n 2 = 2.0 , and an effective saturation current I 0 = 1.0 × 10 8 A .
These coefficients, which vary according to the specific technology and materials of the PV cells, are typically provided in the datasheet, and the I–V curve has provided the information [31].

5. Results and Discussion

5.1. Fujairah City

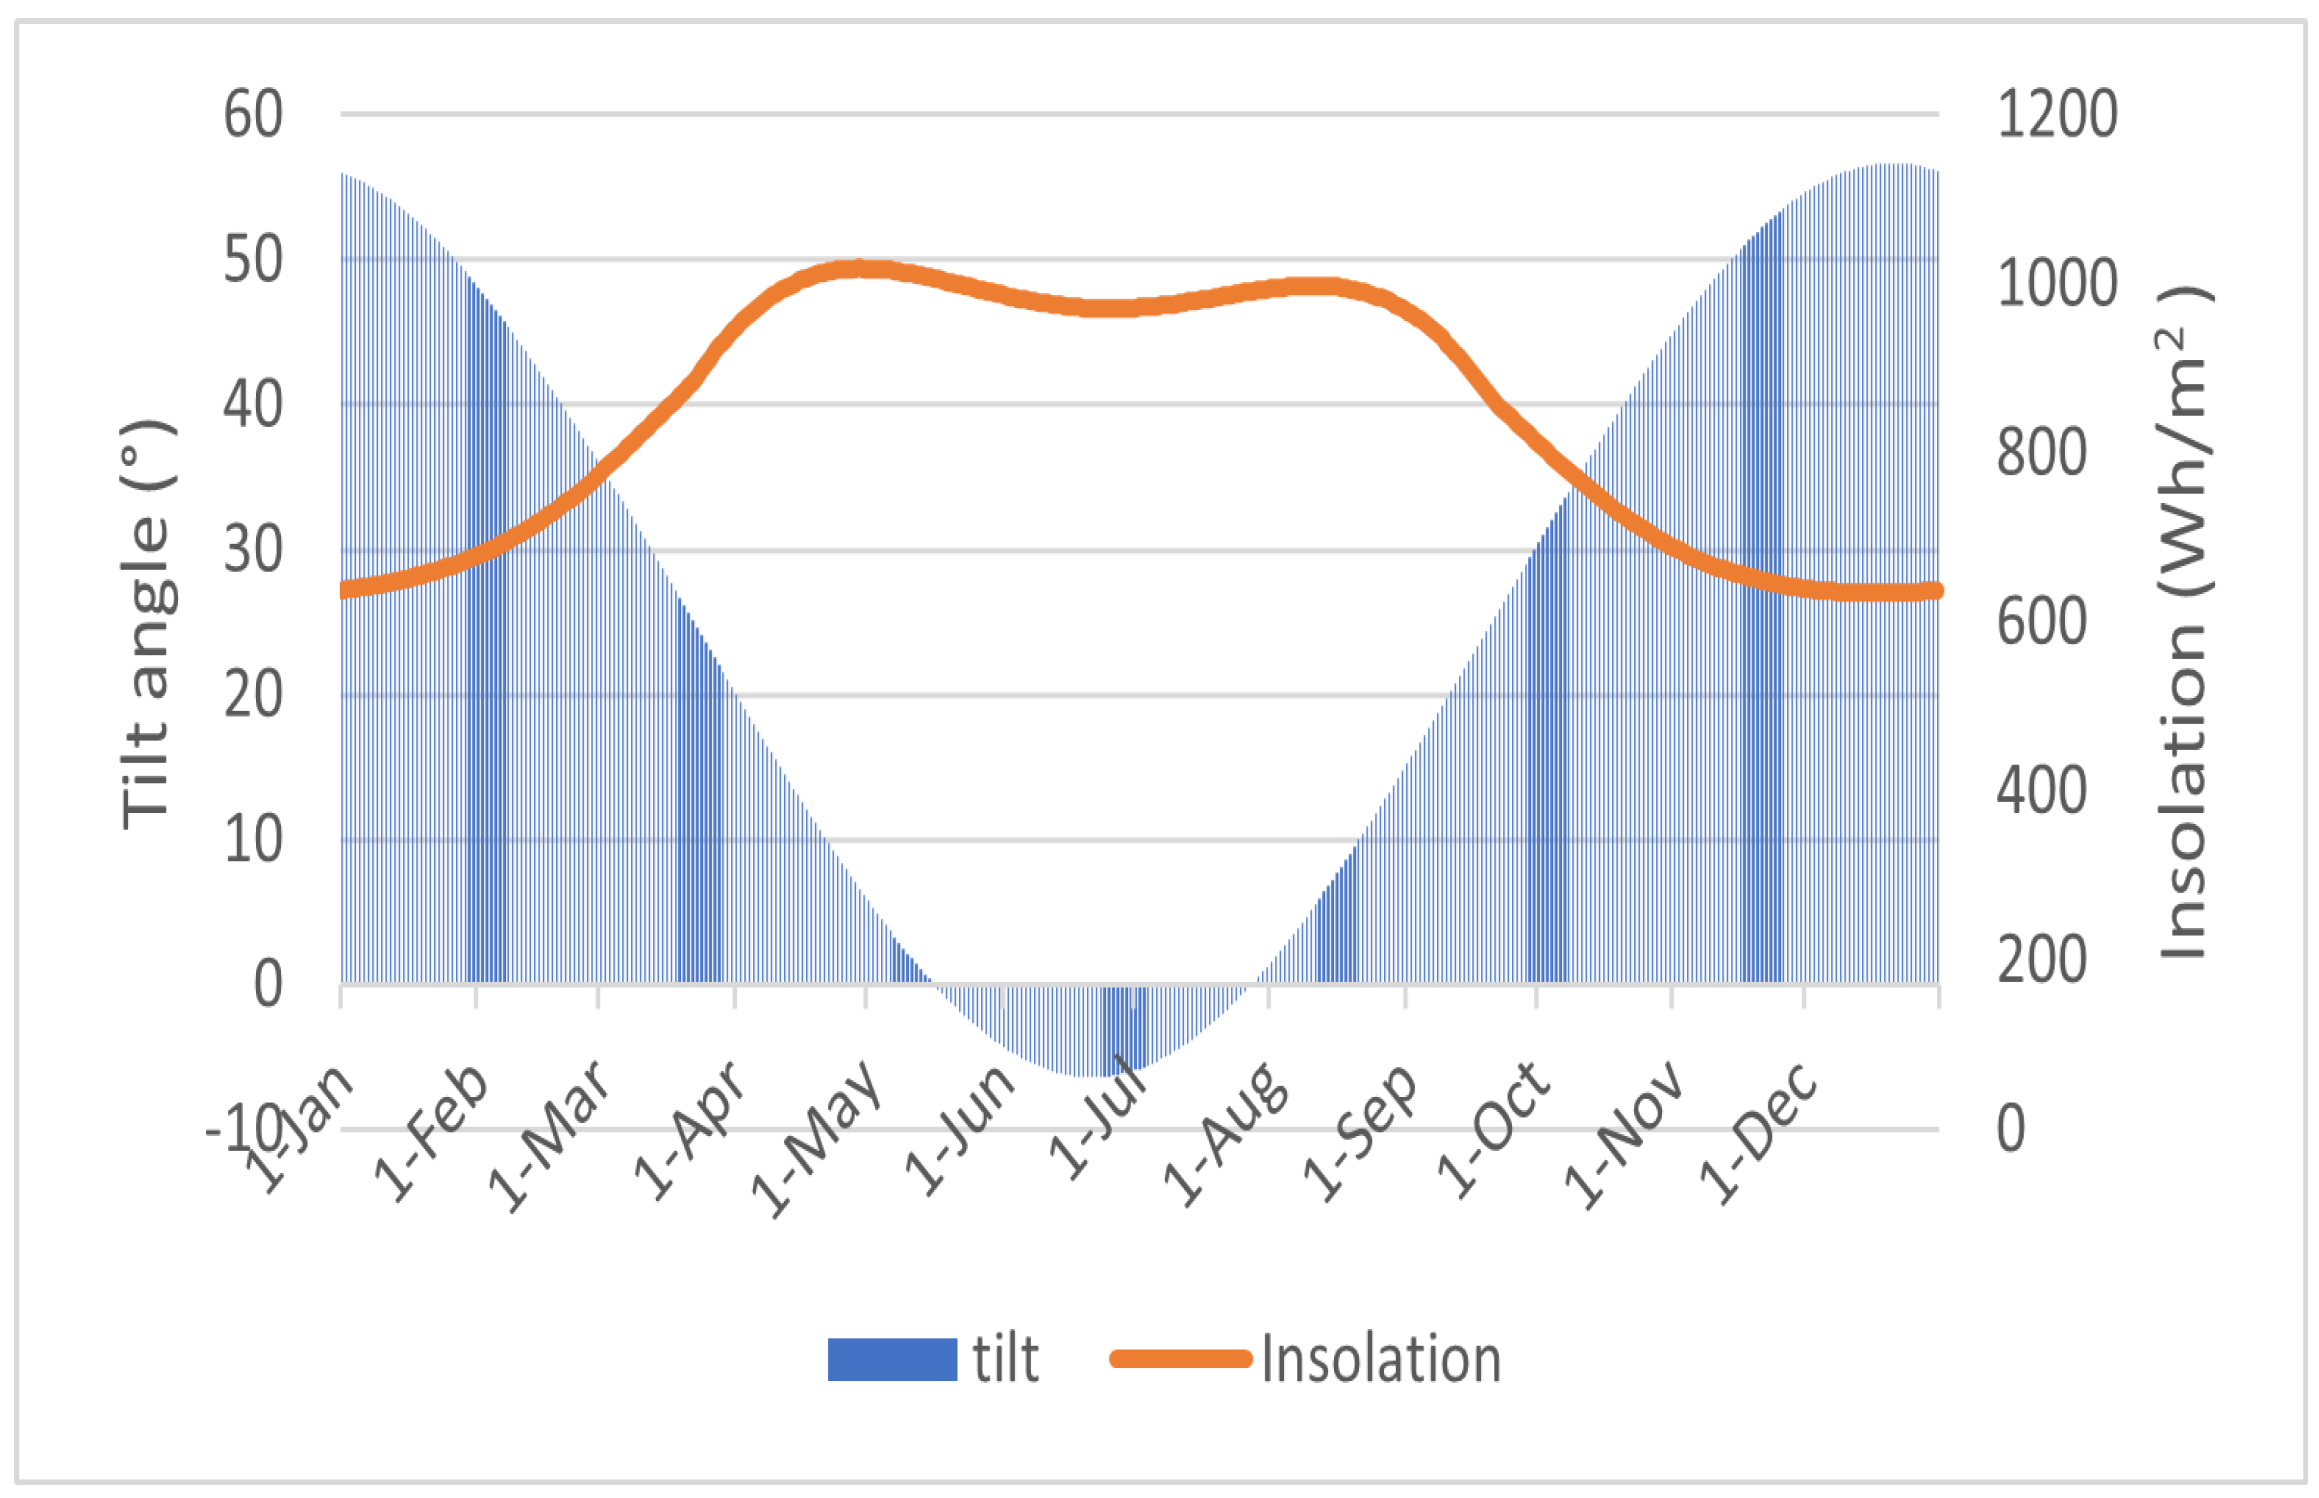
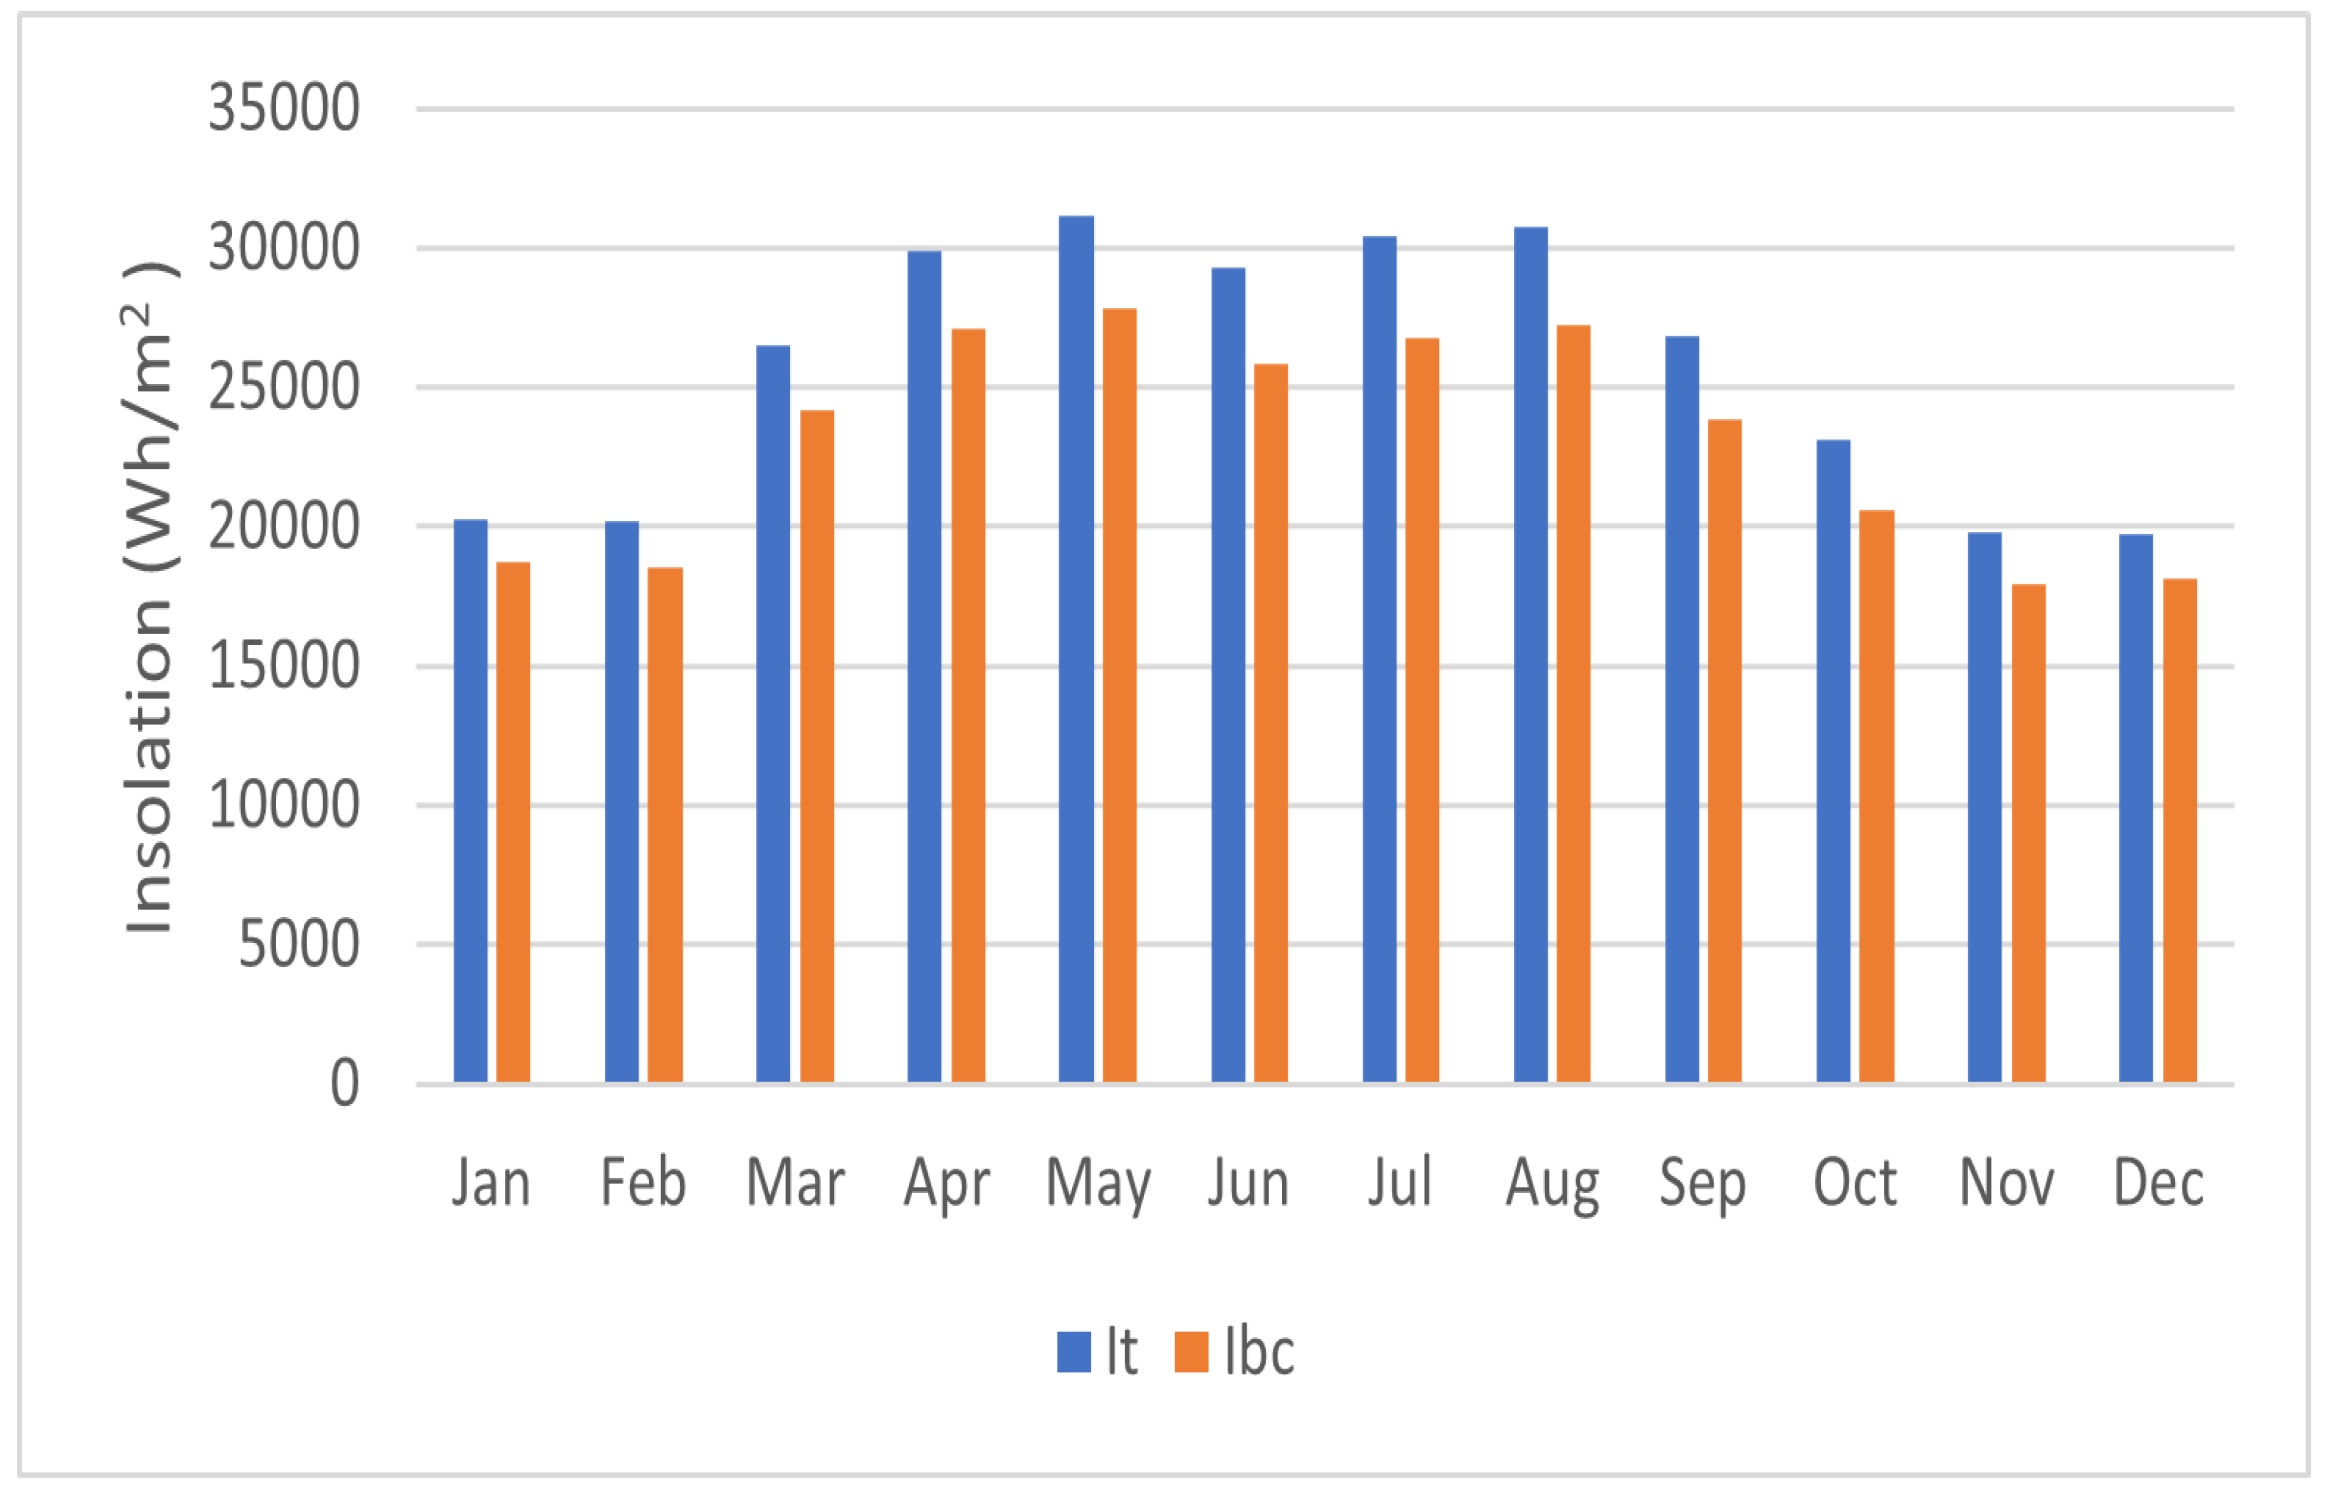
In this part of the study, we analyze a case from Fujairah, located on the eastern coast of the UAE (25.13° N, 56.34° E), to estimate the maximum power generation potential of a PV array. Meteorological records from a central weather station were used to characterize the site. The monthly average daily solar irradiation ( I t ) and the corresponding optimum tilt angles are illustrated in Figure 6. Across the year, the solar energy varies between 19.7 and 31.16 kWh/m2/month, with May receiving the highest levels. Ambient temperatures reach a maximum of 34.27 °C in June and drop to a minimum of 21.37 °C in January, with an annual mean of about 29.14 °C. Table 1 summarizes the monthly global horizontal irradiation, the ambient temperature, the calculated monthly optimum tilt angle for the location, and the corresponding PV cell temperature. As shown in Figure 7, the radiation captured by modules tilted at the optimal angle consistently exceeds the energy incident on a horizontal surface, confirming the advantage of tilt optimization for this region.

5.2. Other Locations

In the Middle East region, the utilization of solar systems for power generation is not just advantageous but necessary. The abundant availability of sunlight throughout the year makes solar energy an ideal solution for meeting the region’s increasing energy demands while reducing reliance on fossil fuels. To further explore the viability of solar energy in different cities across the region, we can consider some specific examples. Mecca, situated in Saudi Arabia at a latitude of 21.4° N, experiences an exceptionally high amount of solar radiation. This geographical advantage positions Mecca as an ideal location for solar power installations, offering immense potential for harnessing the sun’s energy. Moving further north, Kuwait City, at a latitude of 29.3° N, also benefits from abundant sunshine; in Iraq, Baghdad city, located at a latitude of 33.3° N, enjoys a considerable amount of solar irradiation too; and lastly, there is Mostaganem city in Algeria, positioned at a latitude of 35.9° N. This city is situated in the North African region. By considering these diverse cities at varying latitudes, it becomes evident that solar energy holds great promise across the Middle East region. The abundant sunlight, coupled with advancements in solar technology, has the potential to drive sustainable development, reduce carbon emissions, and enhance energy security in these cities and beyond.
A.
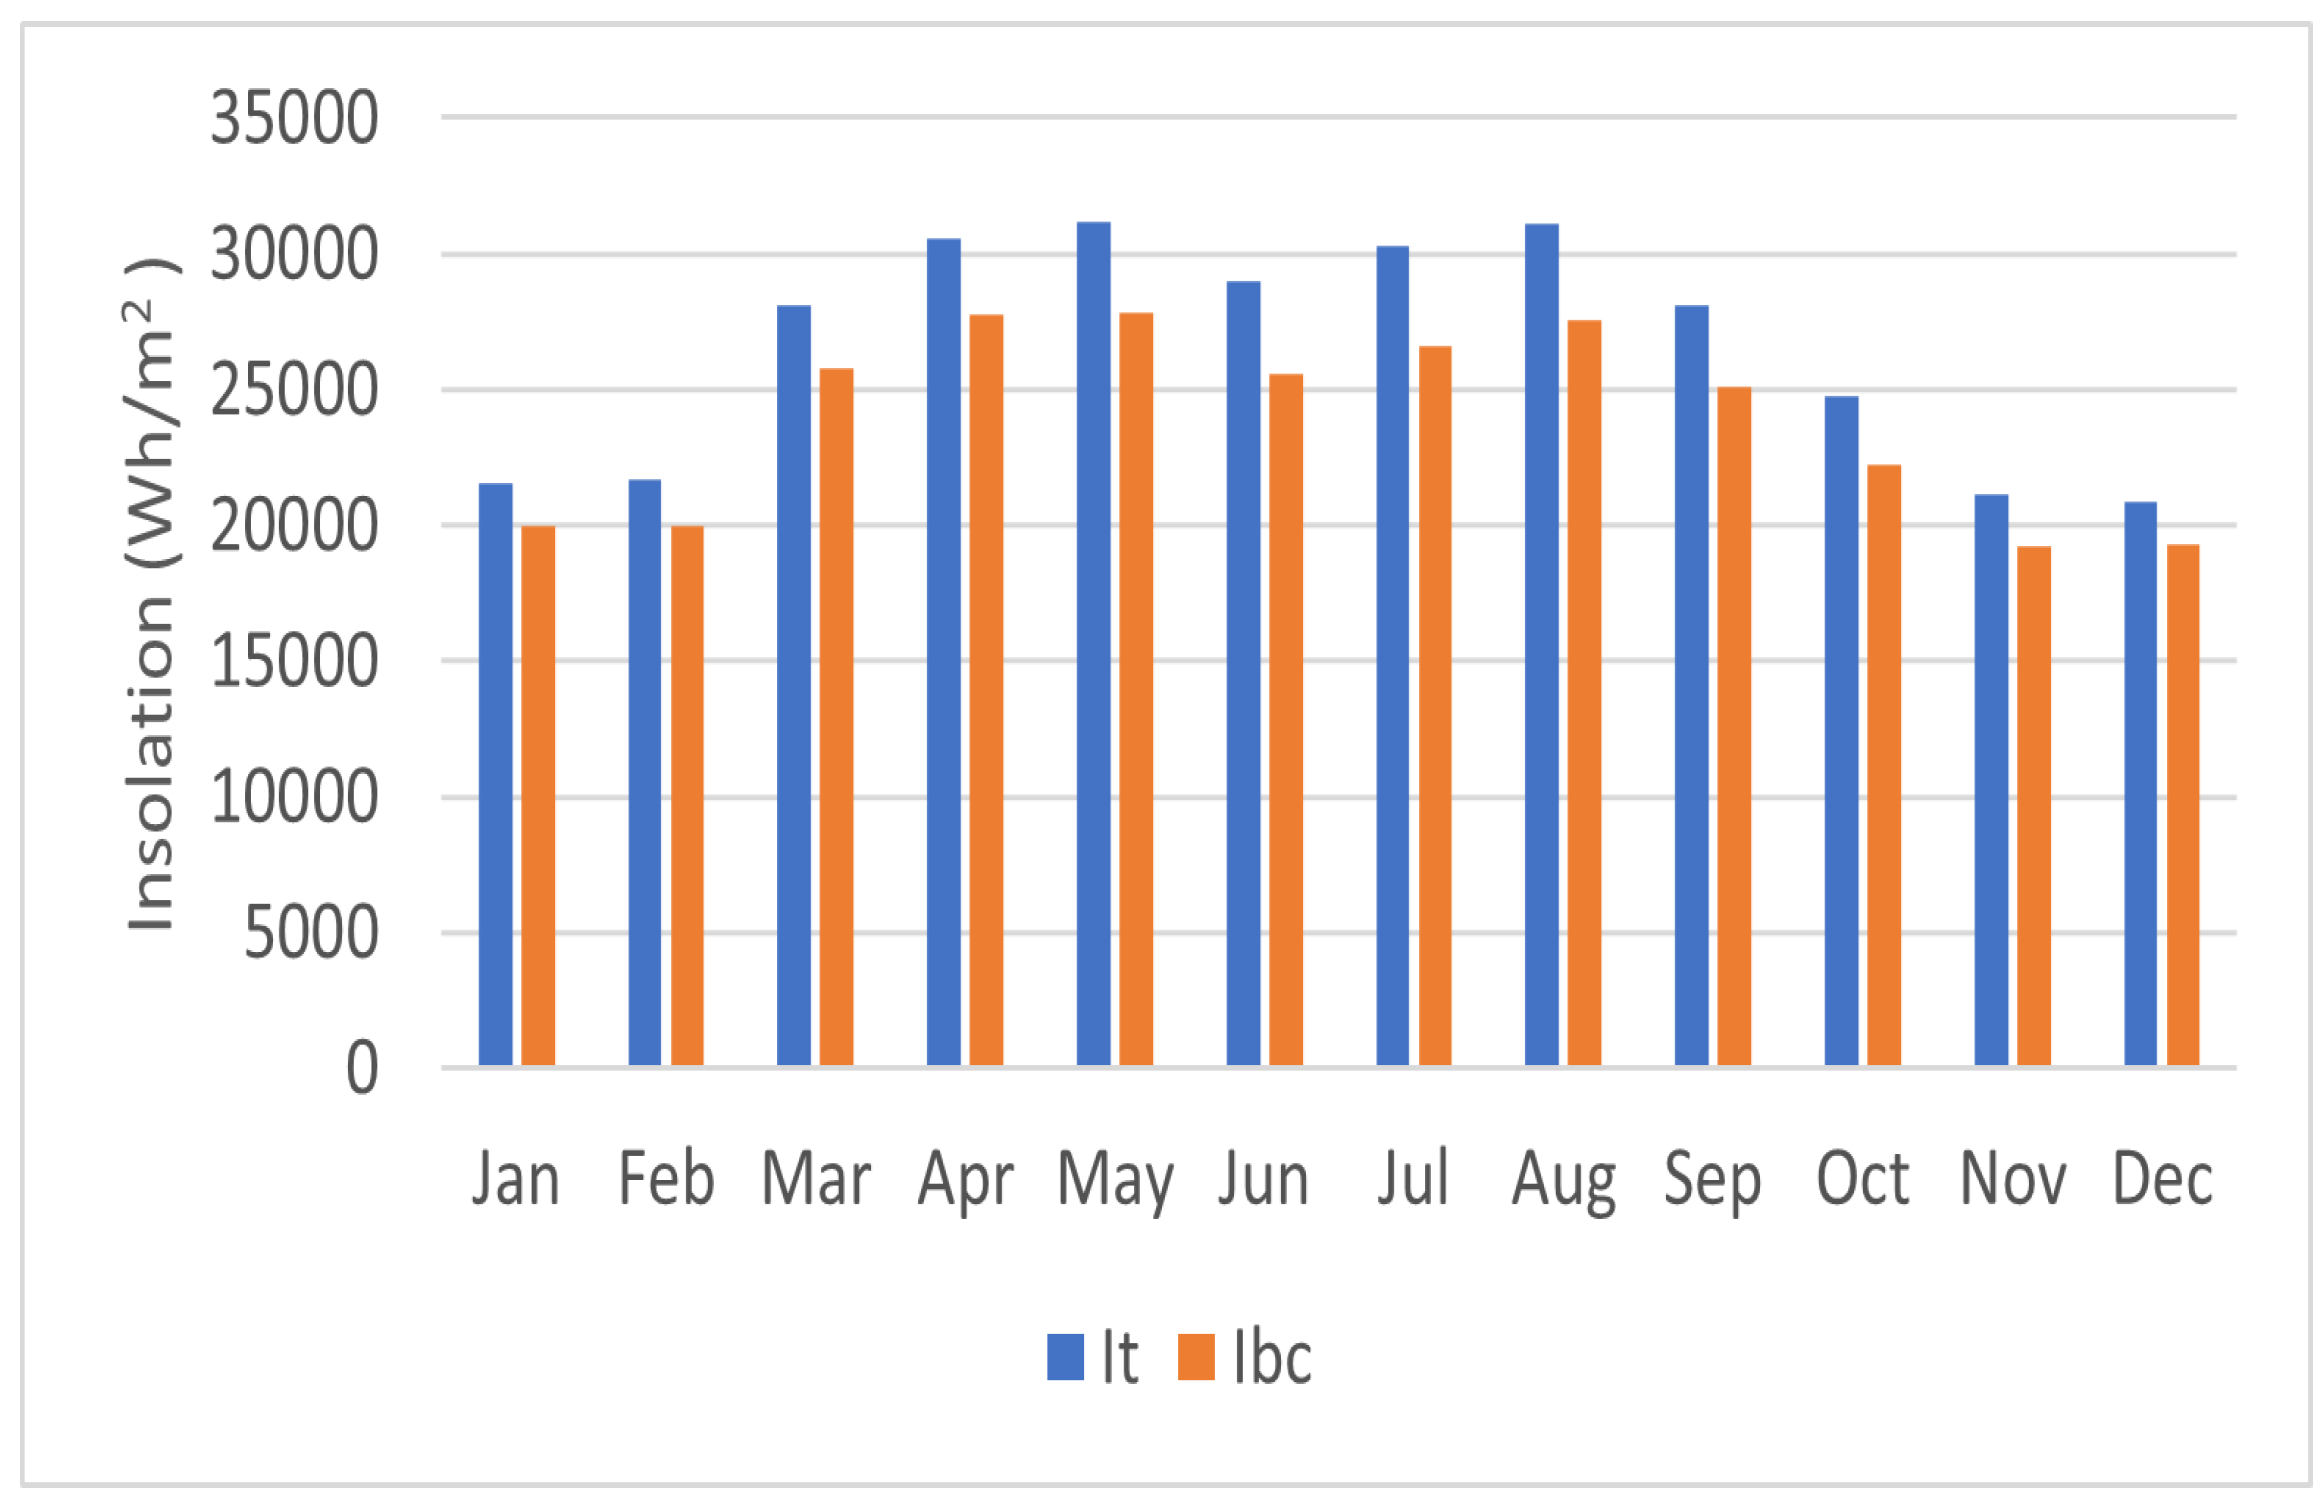
Mecca City: In this section, we present a case study focusing on estimating the maximum power generation of a PV array in Mecca, a city situated in the eastern region of Saudi Arabia. The weather station used for data collection was positioned at the city center, precisely at 21.4° N and 39.8579° E. Figure 8 showcases the monthly average daily solar radiation ( I t ) for Mecca, along with the corresponding tilt angle. Throughout the year, Mecca experiences a range of solar radiation levels, with an insolation varying from 21.5 to 31.14 kWh/m2/month. Notably, the month of May registers the highest recorded radiation. Furthermore, the maximum ambient temperature is observed in June, reaching 33.43 °C, while the minimum temperature occurs in January, measuring 20.79 °C. On average, the annual ambient temperature in Mecca is approximately 28.19 °C. Table 2 provides valuable information regarding the monthly average daily global horizontal radiation, ambient temperature, and monthly optimum tilt angle for Mecca. Additionally, the table includes the temperature cell data for the PV system. In general, the models used to calculate the total solar radiation on tilted surfaces represent an improvement over the solar radiation received on horizontal surfaces. Figure 9 visually demonstrates this enhancement, highlighting the increased solar radiation captured by the tilted surface compared to the horizontal surface.
B.
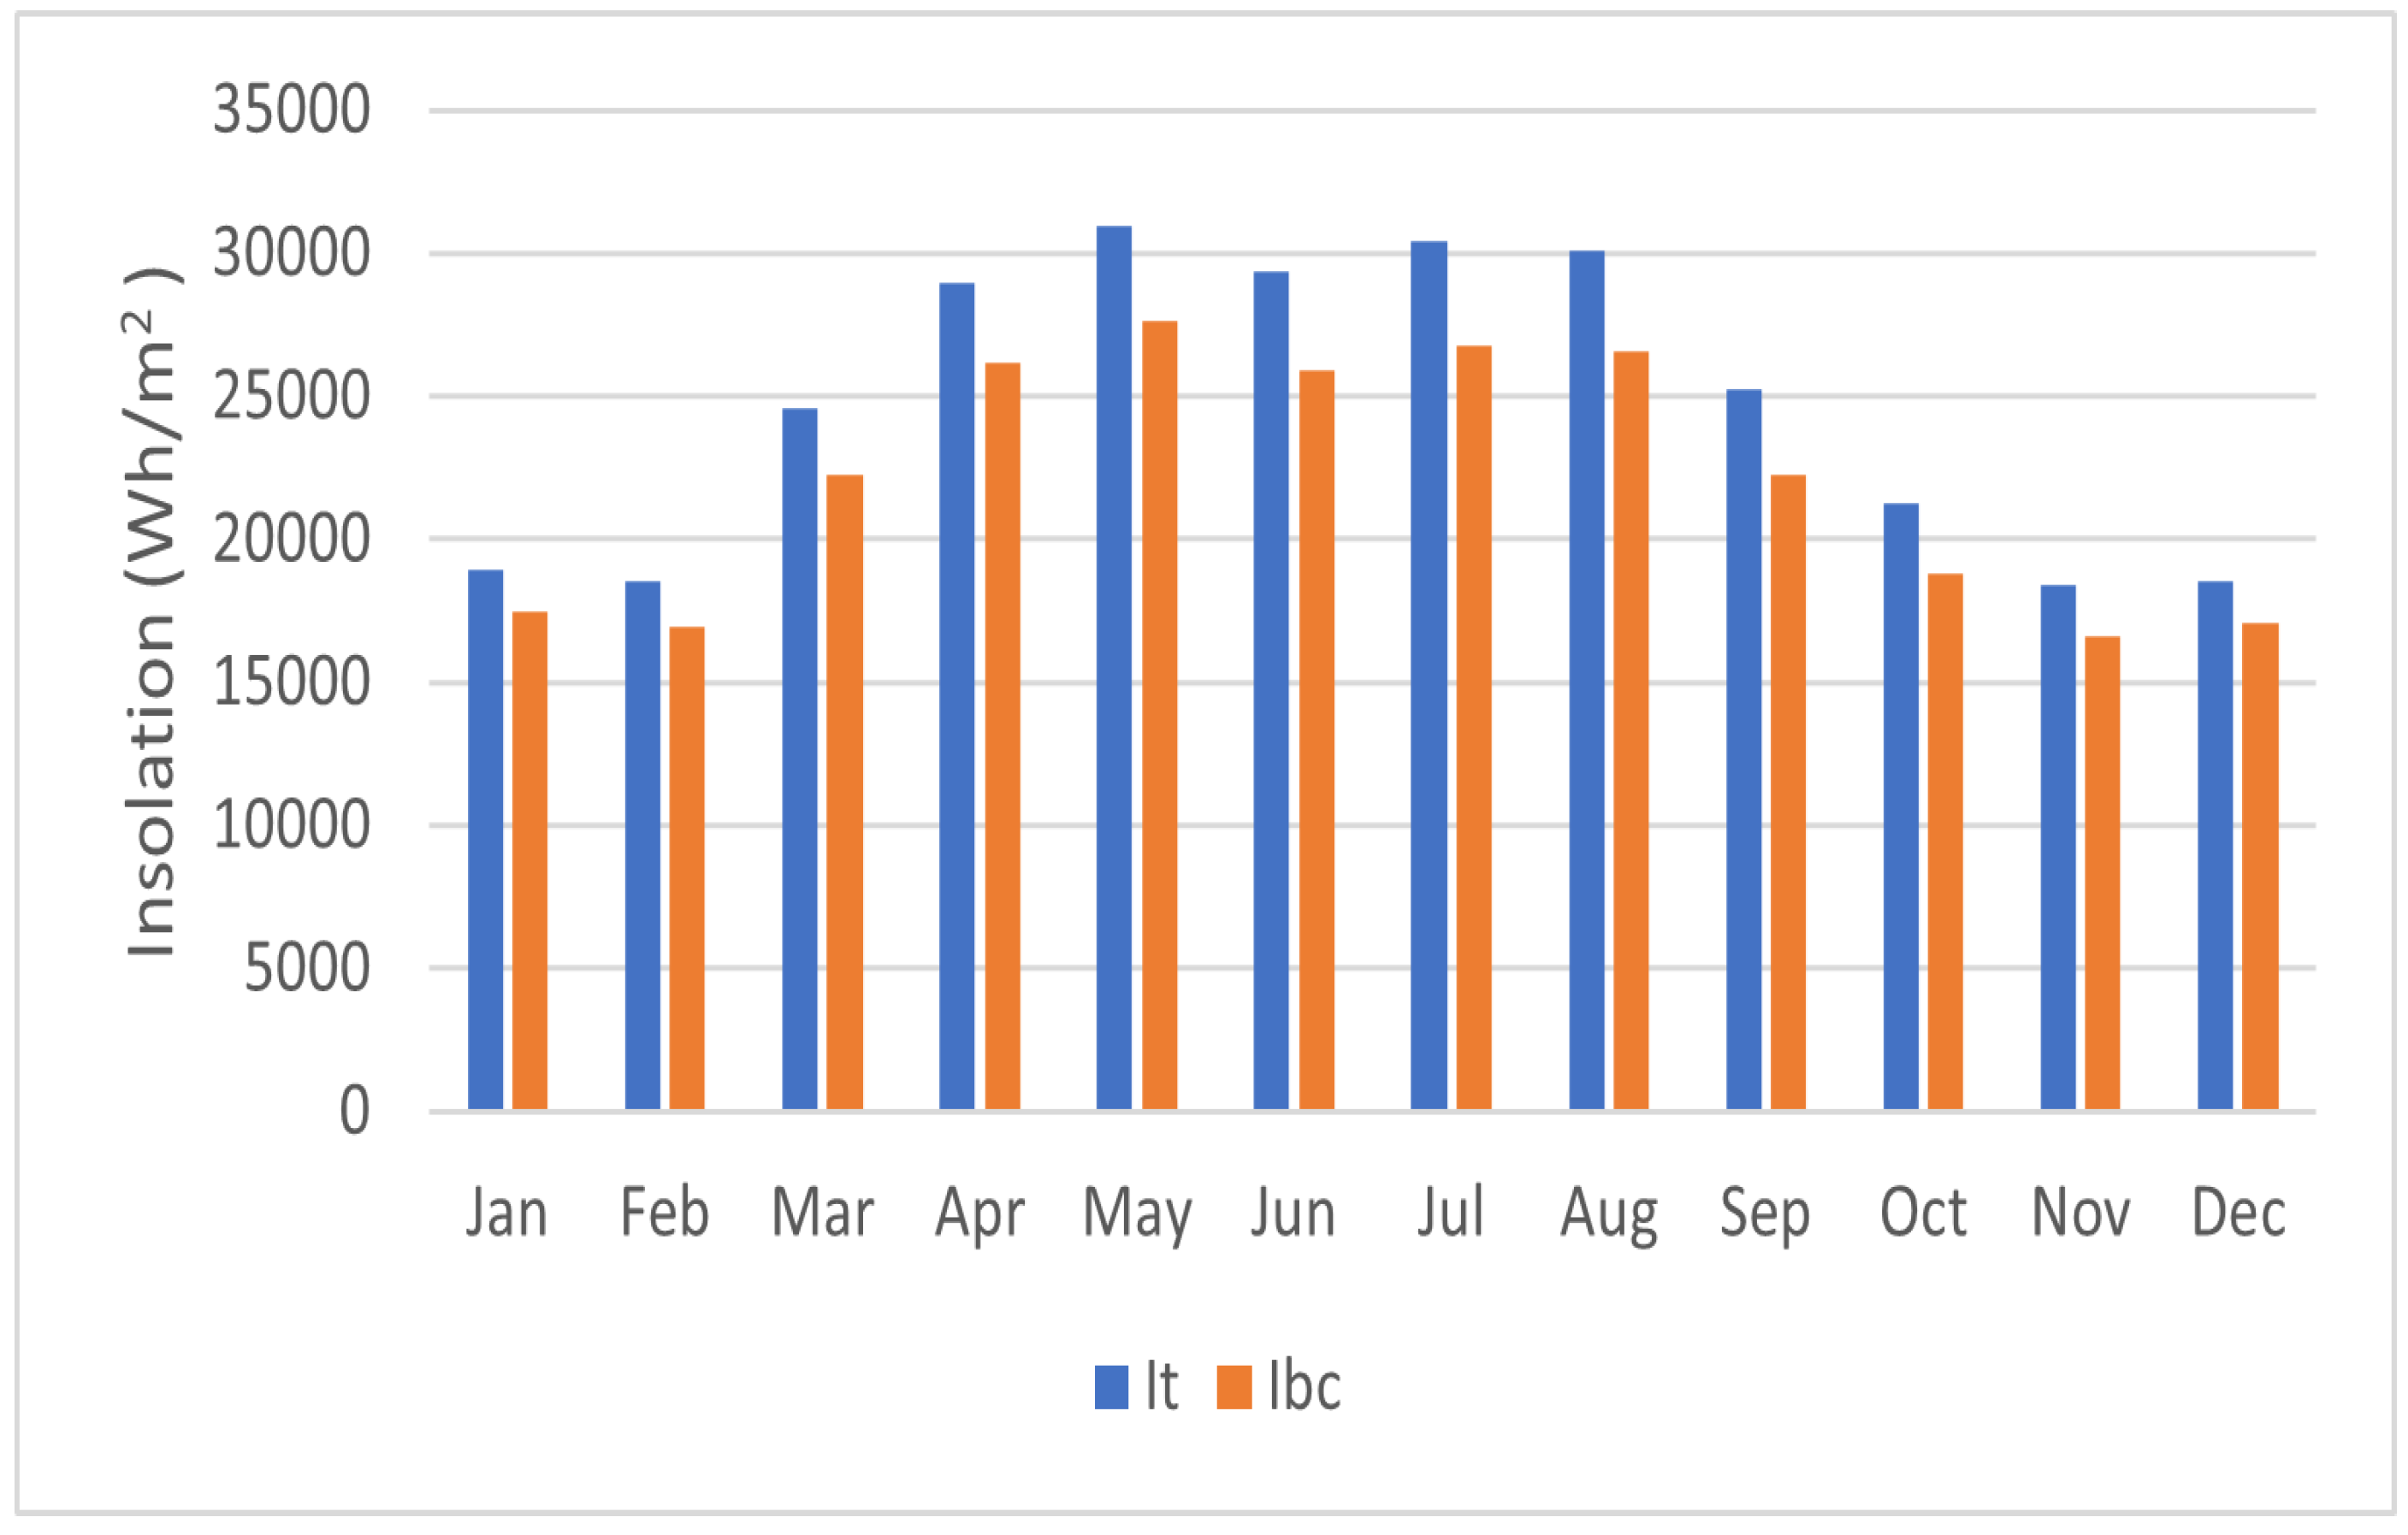
Kuwait City: Located at approximately 29.31° N and 47.48° E, Kuwait experiences over 300 sunny days annually, with an average of 10 h of sunshine per day. This highlights Kuwait’s significant potential for solar energy generation. To optimize PV system performance, the tilt angle of the panels should be designed according to the site’s latitude. For Kuwait (29.31° N), tilting PV modules with the optimal solar angles maximizes irradiance capture and enhances power output. Table 3 summarizes the tilt angle, insolation, and associated ambient and cell temperatures, while Figure 10 and Figure 11 illustrate the monthly change of insolation and beam irradiance at different tilt angles.
C.
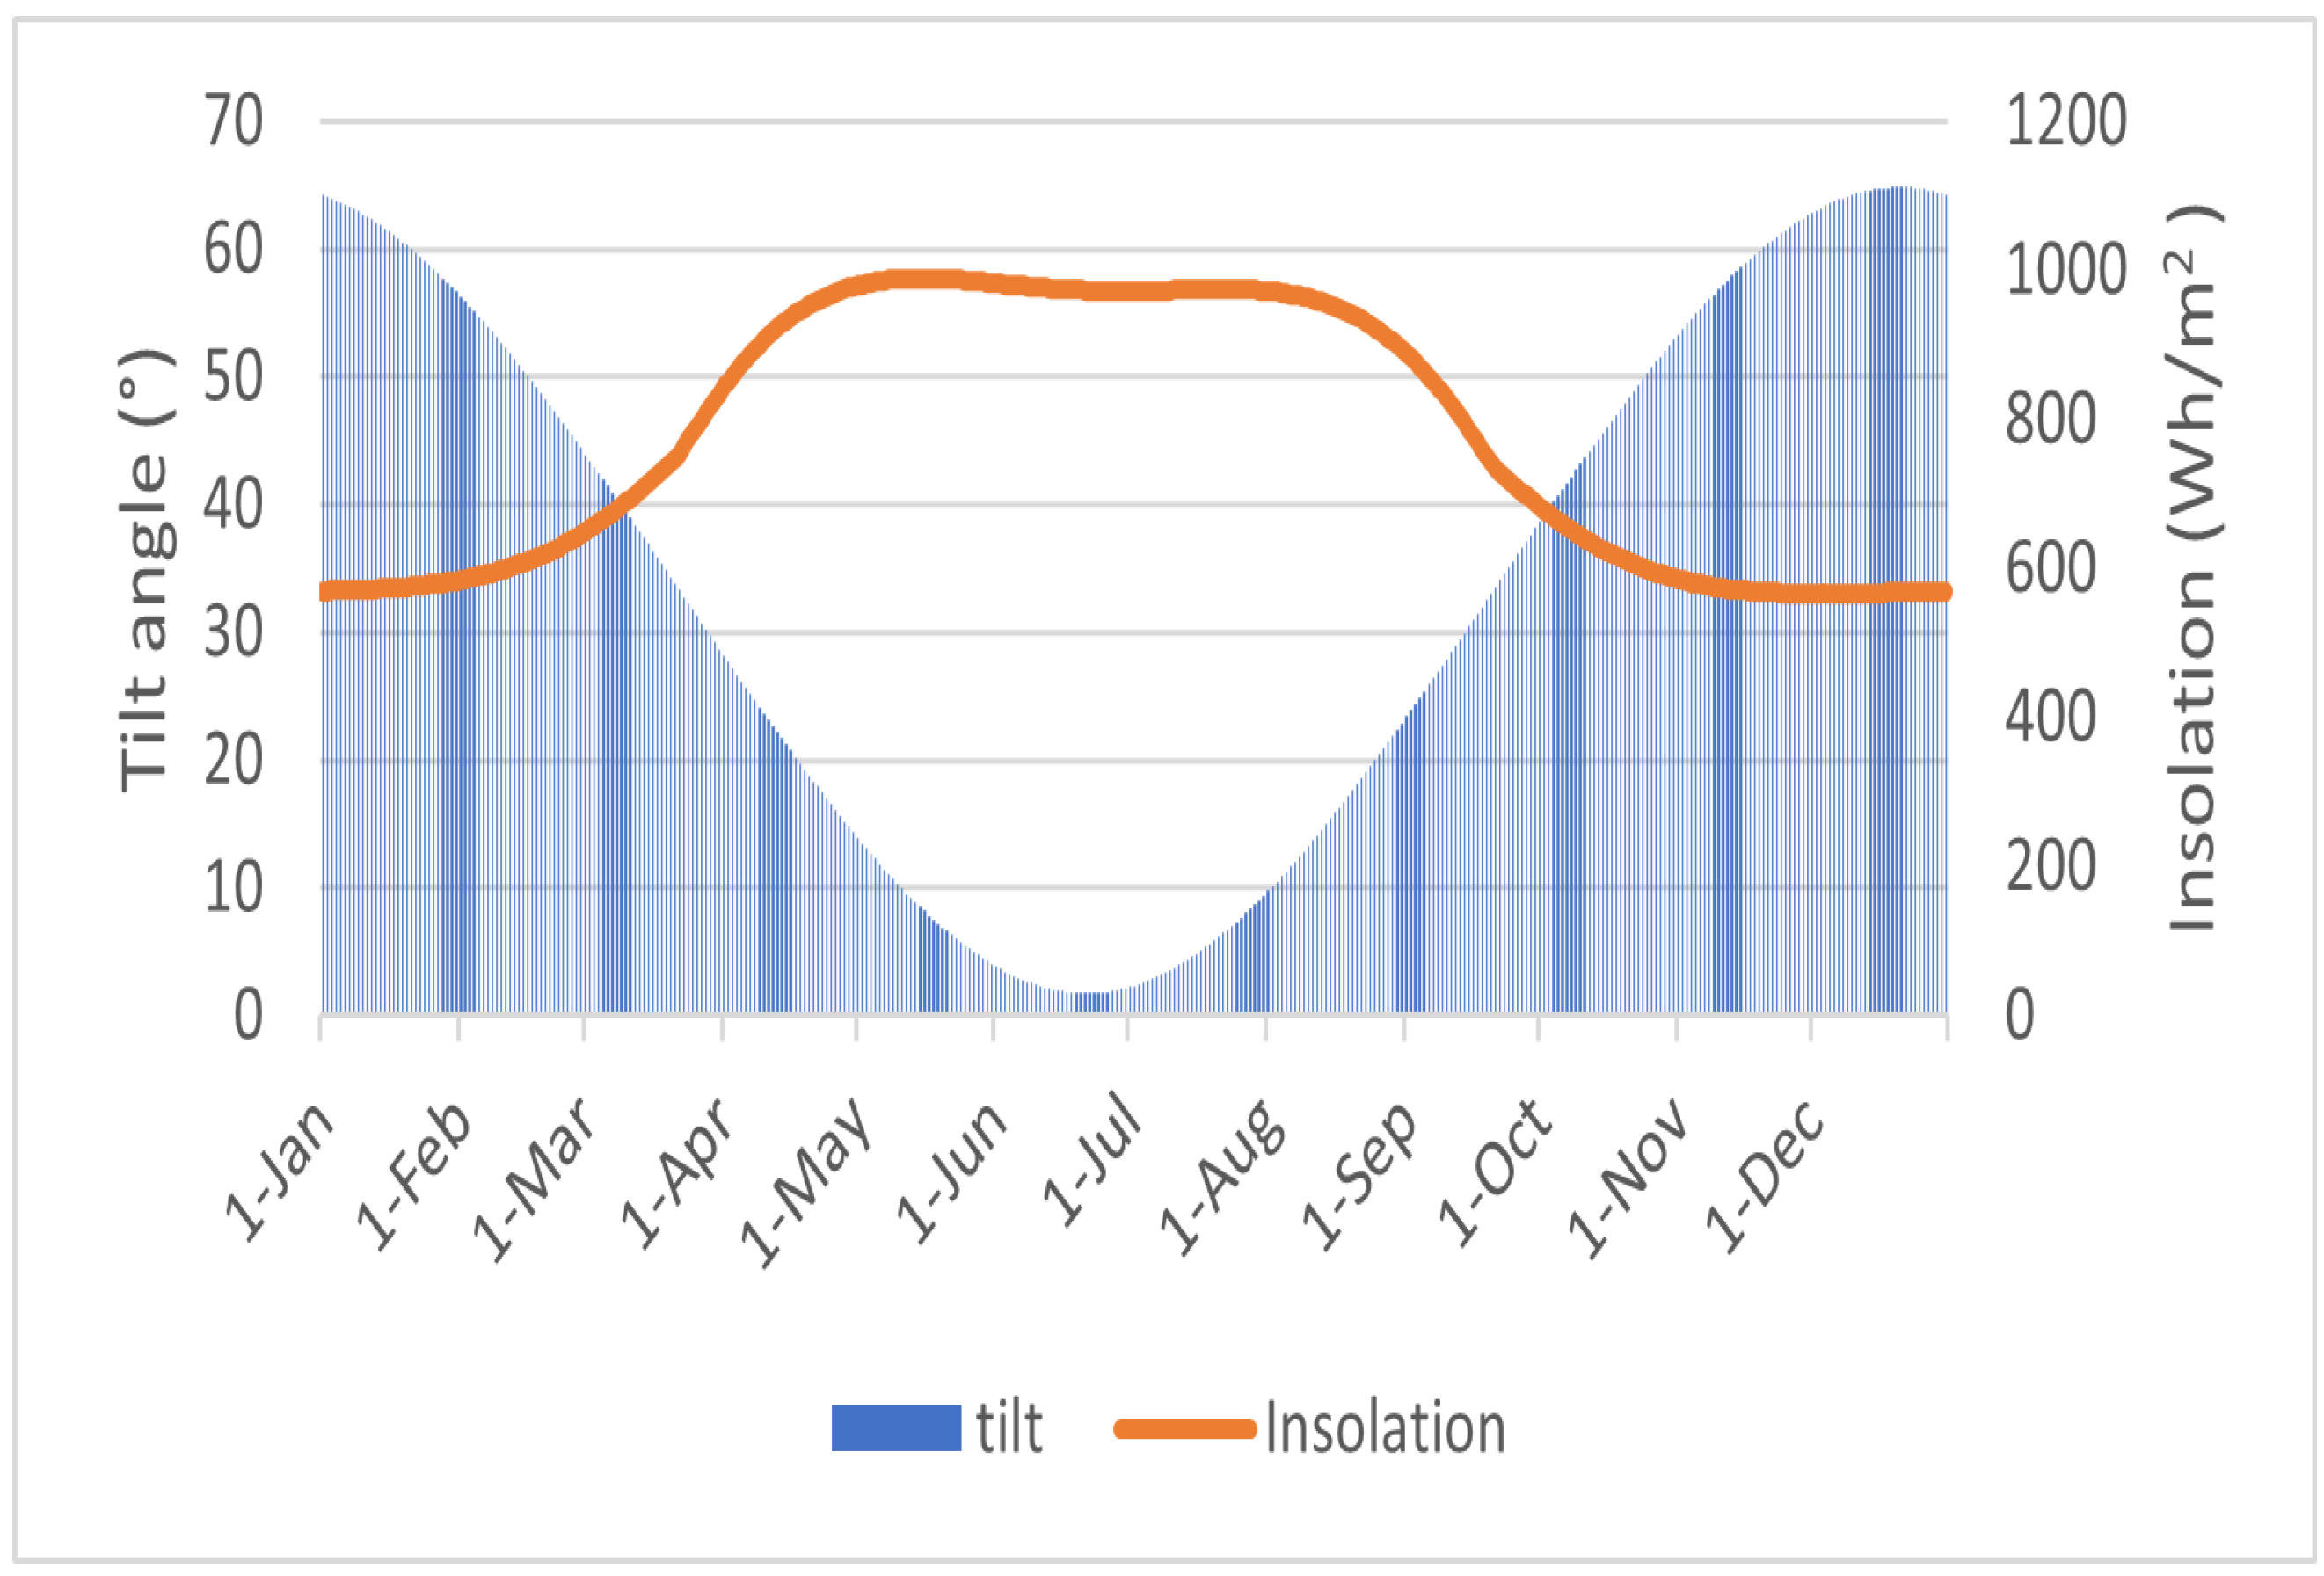
Baghdad City: Baghdad, the capital of Iraq, is located in the Middle East region of Asia. Situated at a latitude of approximately 33.3°, the city experiences a diverse range of ambient temperatures throughout the year. In January, the minimum recorded temperature drops to 9.98°, while the maximum temperature peaks at 37.28° in August. Similarly, the cell temperature, which refers to the temperature of PV cells, reaches its minimum of 30.7° in January and its maximum of 58.11° in August. The tilt angle, which determines the angle at which the solar panels are positioned, exhibits its lowest value of 2.32° in June and its highest value of 64.31° in December. Further information regarding these findings can be found in Table 4. Additionally, the table indicates that insolation values vary throughout the year. The highest insolation value of 30.1 kWh/m2/month is recorded in July, while the lowest value of 17.6 kWh/m2/month is observed in November. For a visual representation, Figure 12 displays the daily tilt angle in conjunction with the irradiance for Baghdad. Furthermore, Figure 13 illustrates the monthly radiation values and the horizontal position of PVs without any tilt.
D.
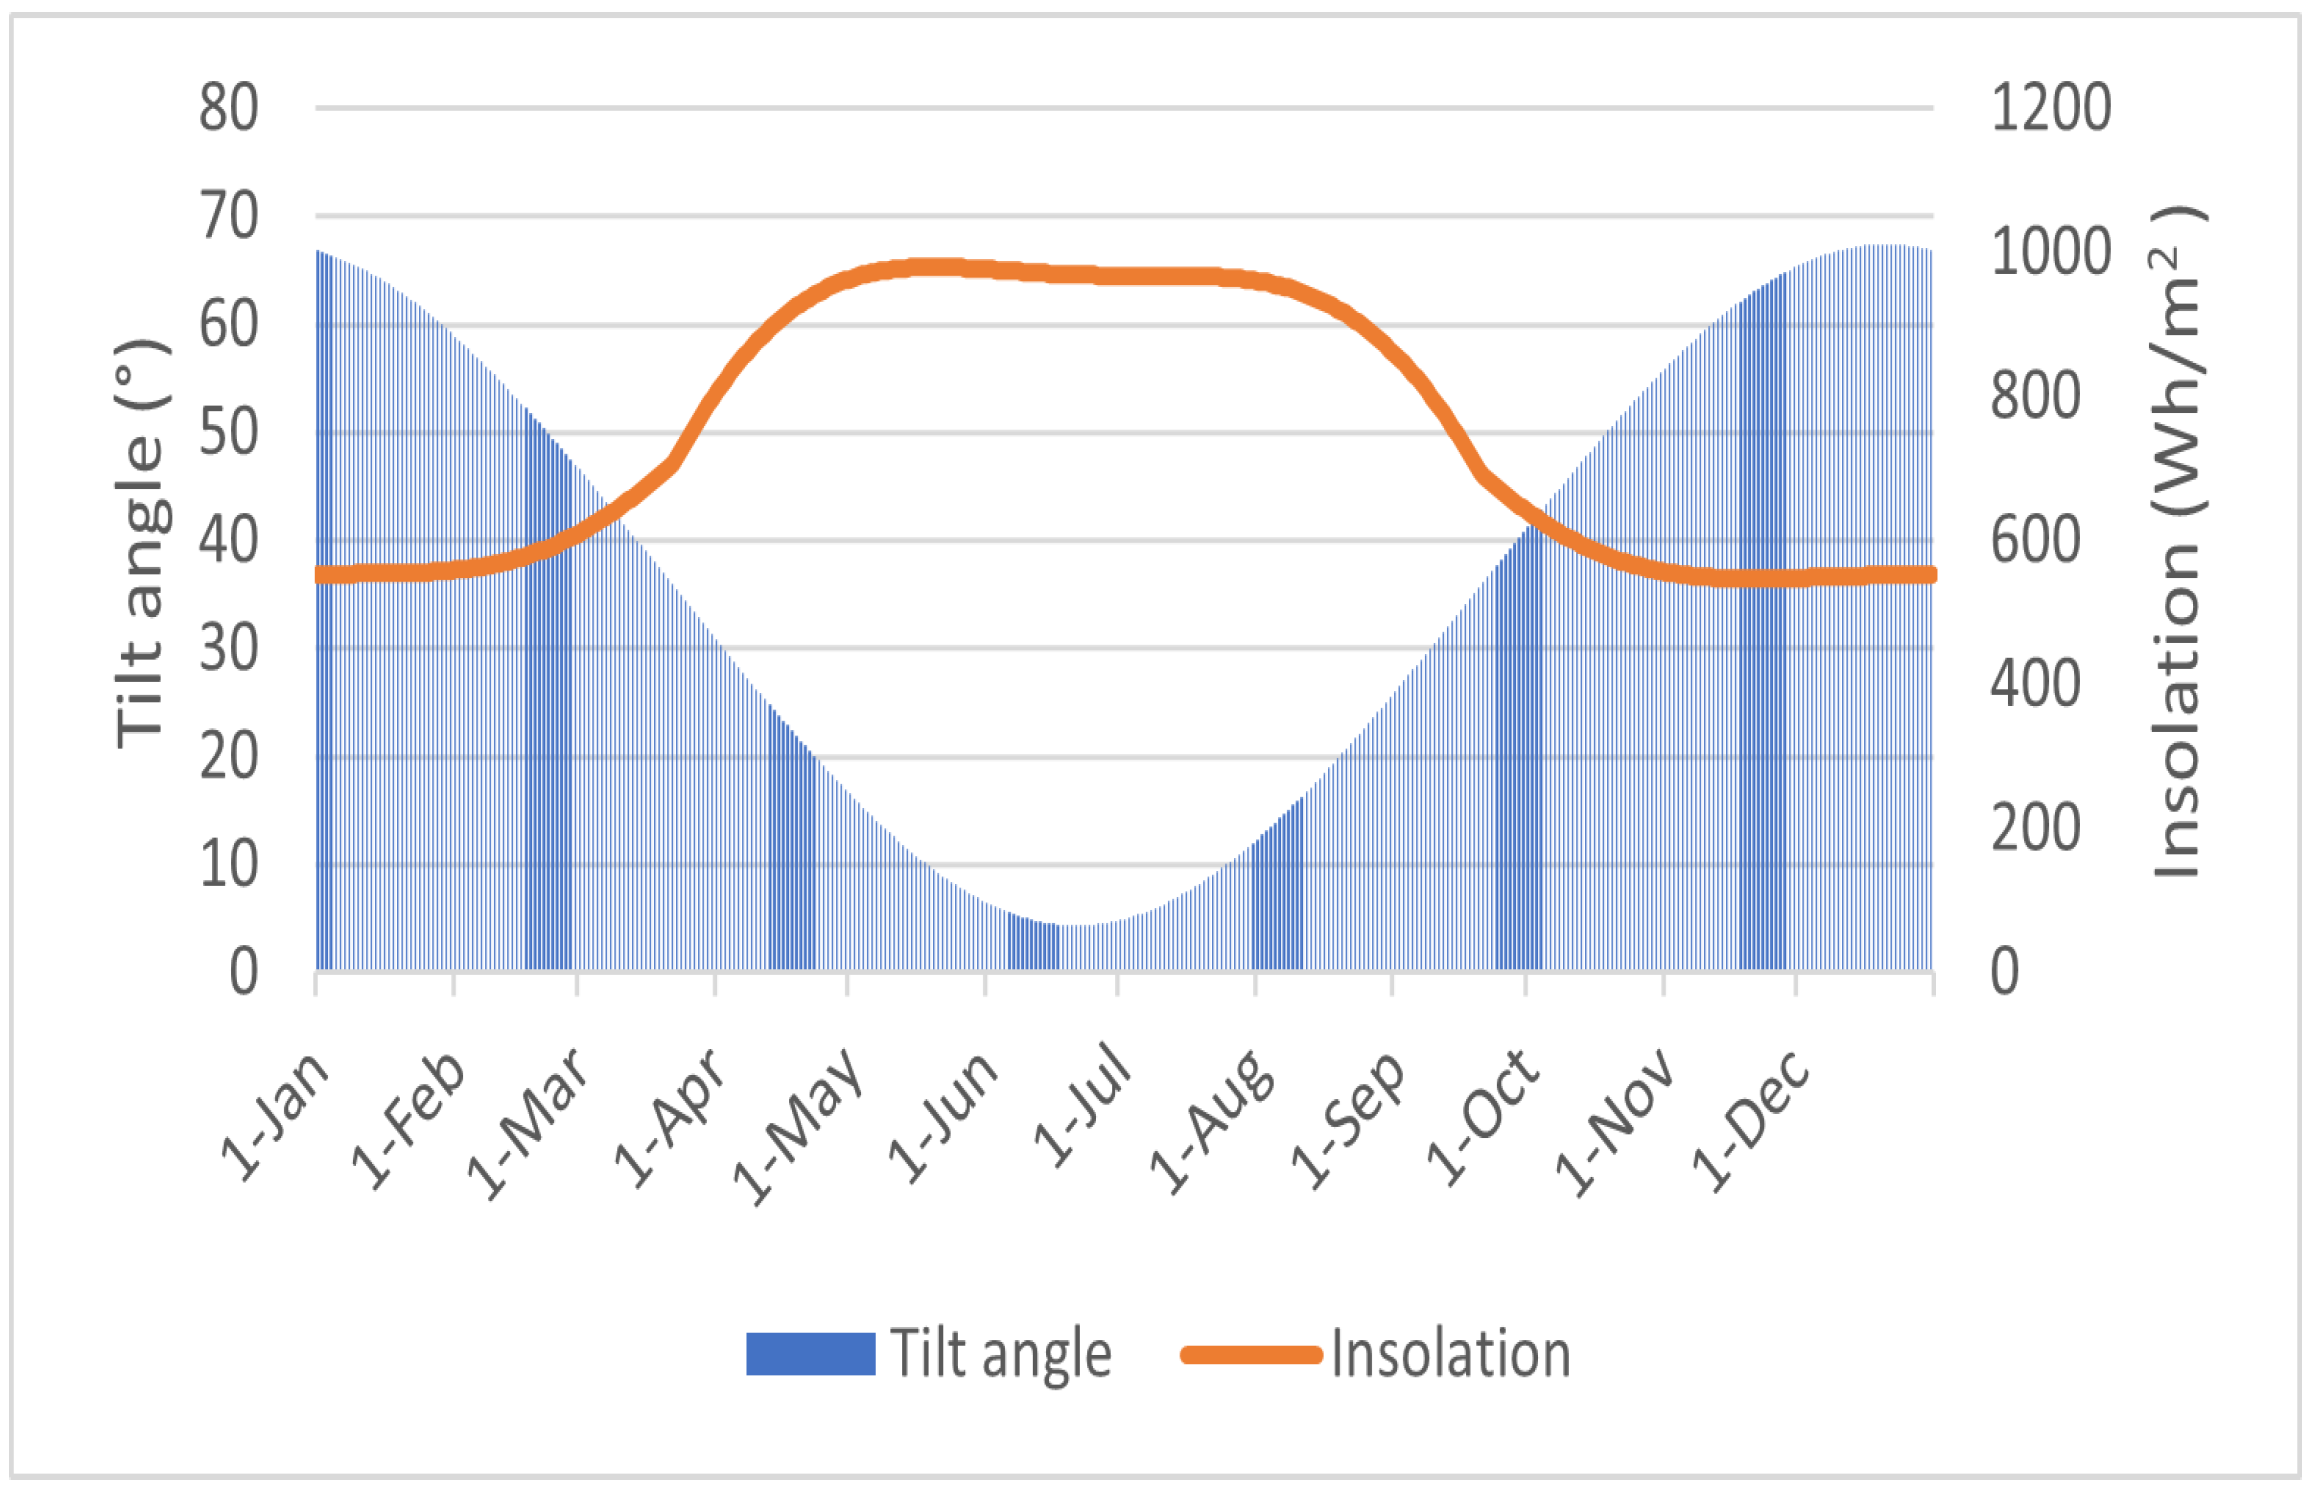
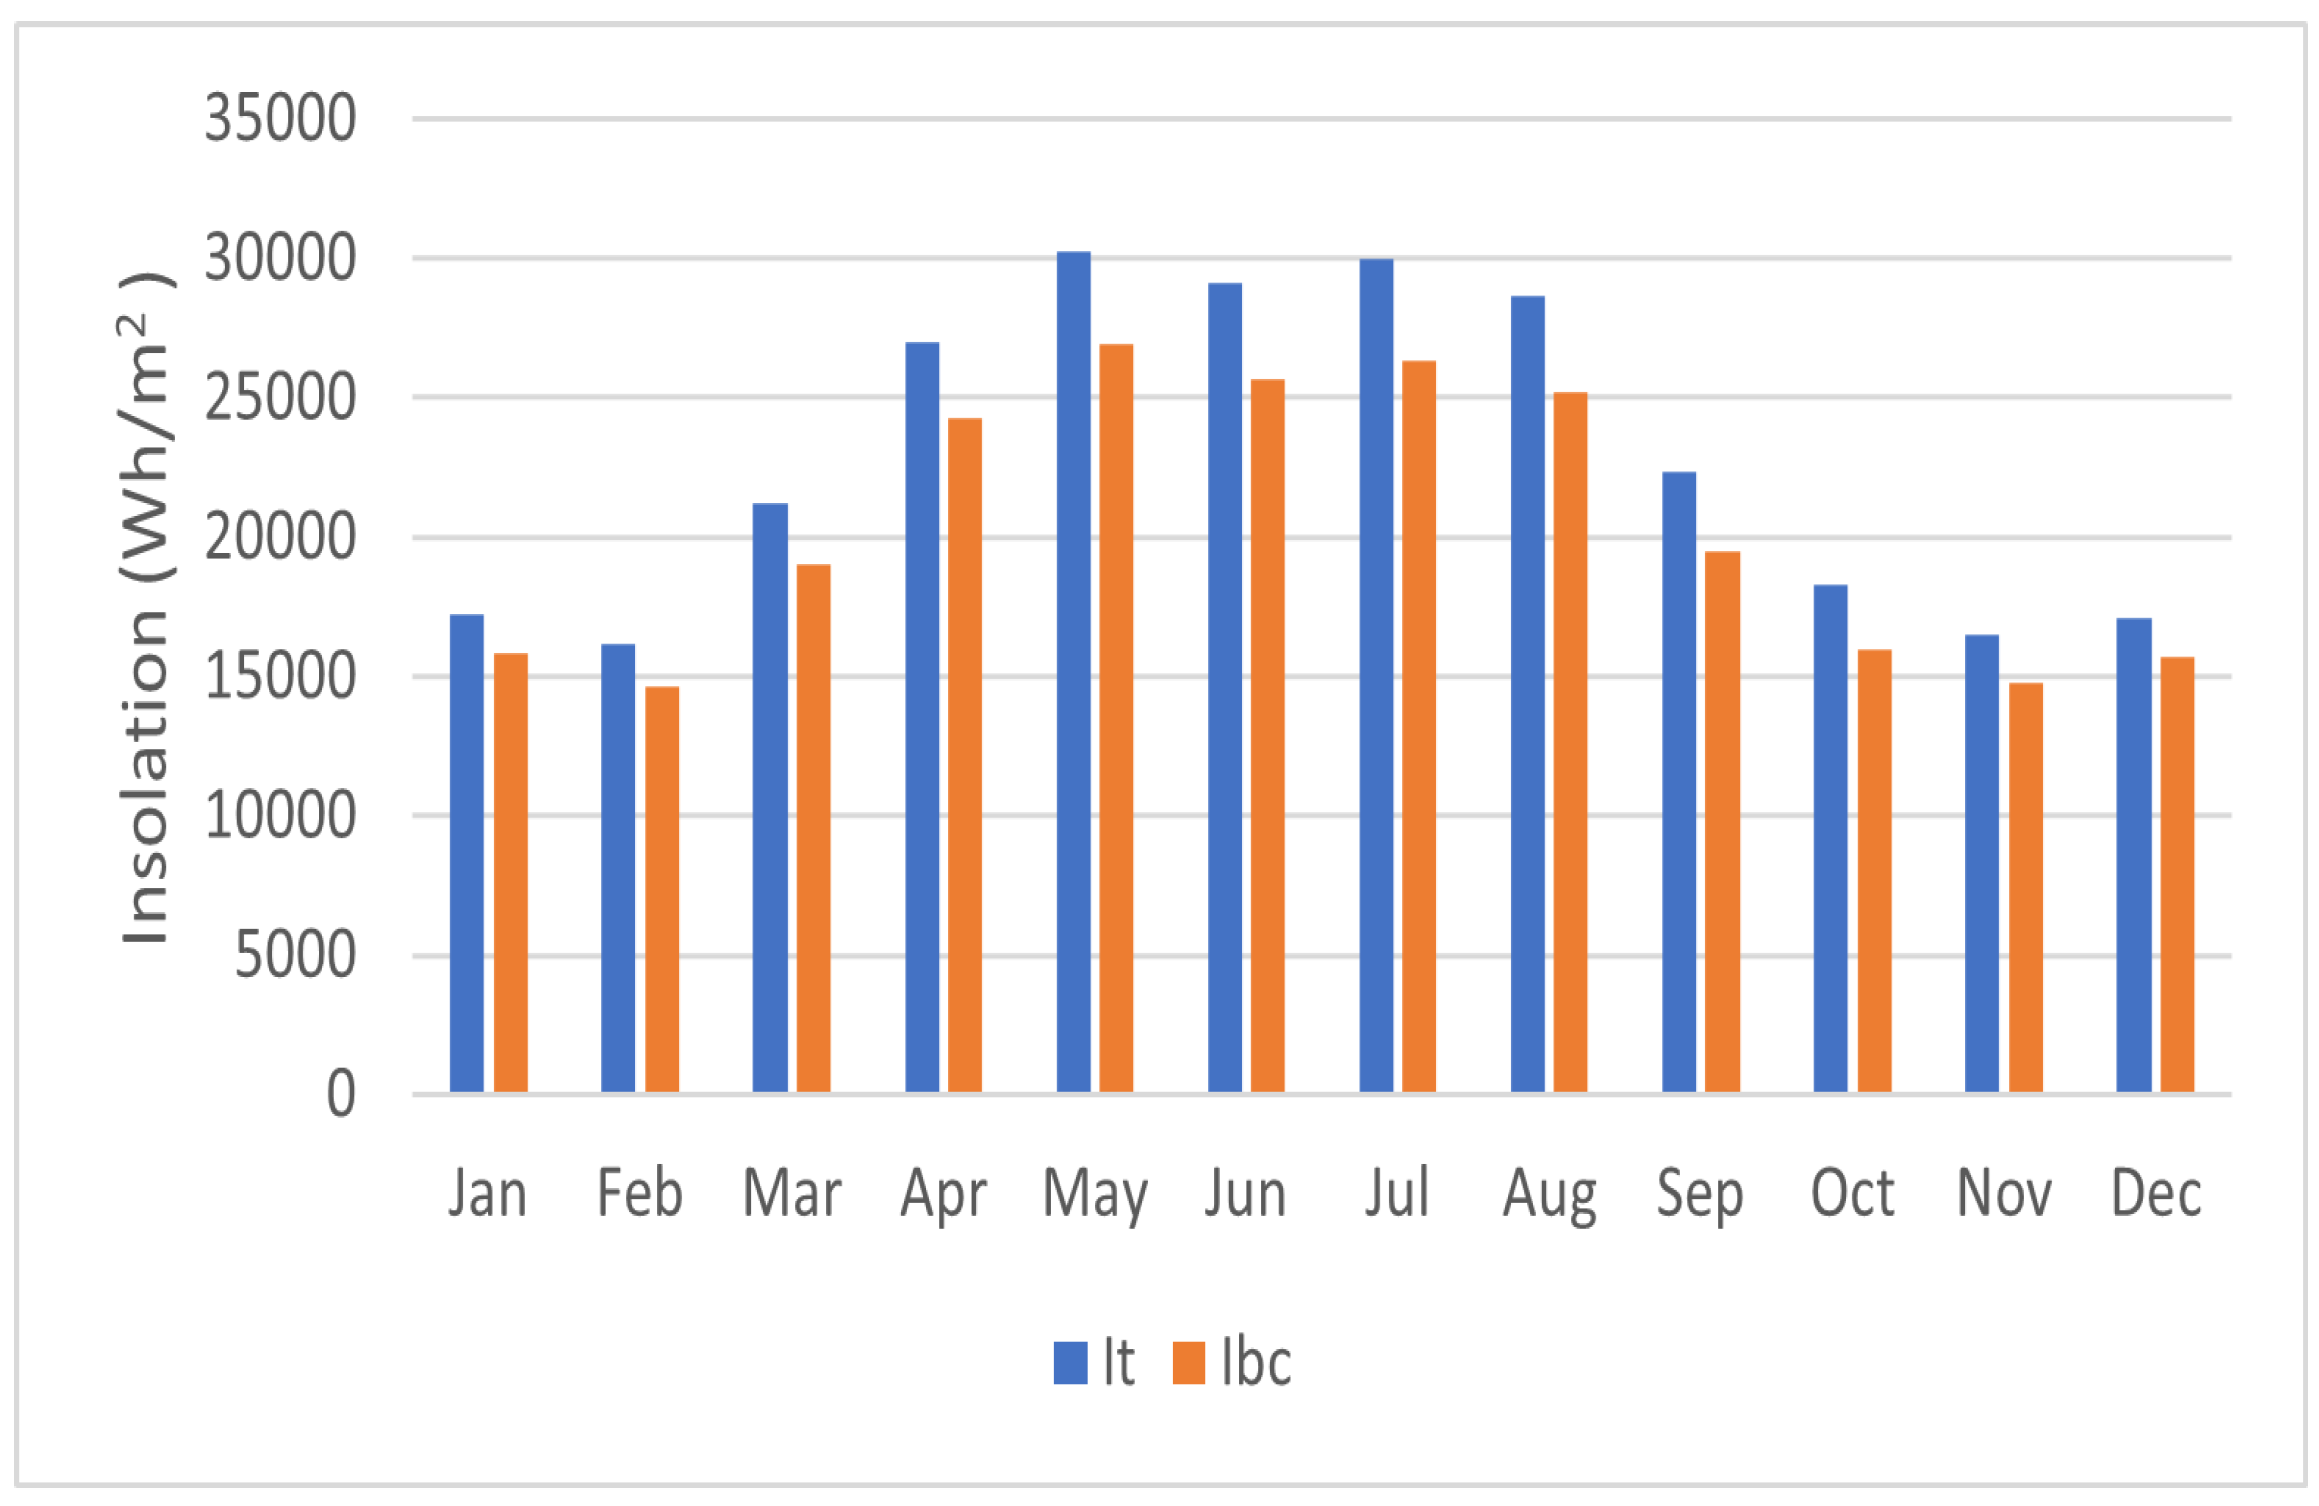
Mostaganem city–Algeria: Mostaganem is a city located in Algeria, situated in the North African region. As the city is positioned at a latitude of approximately 35.93°, it experiences distinct ambient temperature variations throughout the year. In January, the minimum recorded temperature in Mostaganem is 10.18°, while the maximum temperature peaks at 28.2° in August. In terms of cell temperature, the lowest value of 31.02° occurs in January, whereas the highest value of 49.03° is recorded in August. The tilt angle, which determines the inclination of the solar panels, shows a minimum value of 4.92° in June and a maximum value of 66.91° in December. Table 5 provides further details on these outcomes. Moreover, insolation values vary over the course of the year in Mostaganem. The highest insolation value of 30.25 kWh/m2/month is observed in May, while the lowest value of 16.4 kWh/m2/month occurs in November. For visual representations, Figure 14 illustrates the daily tilt angle alongside the irradiance for Mostaganem. Furthermore, Figure 15 illustrates the monthly radiation values and the horizontal position of PVs without any tilt.
Figure 16 illustrates the daily tilt angle across the five cities. It can be inferred that as the latitude increases, the tilt angle also increases. In the case of Fujairah, the tilt angle initially measures 52.2° before it decreases to a negative tilt angle of −6°. It is important to note that a negative tilt angle indicates that the PV surface is oriented towards the opposite direction, meaning a north-facing orientation instead of the typical south-facing position. This negative sign is observable mid-year exclusively for the two cities with the lower latitudes, namely Mecca and Fujairah.
As the monthly tilt angle results show, the highest tilt angle in Mecca is 52.41° in December, and the lowest is in June at −9.58°; for Fujairah, the highest is in December too at 56.14° and the lowest in June at −5.85°. Kuwait city has one month with a negative sign, which is in June, which is its lowest angle (−1.68), as shown in Figure 17.
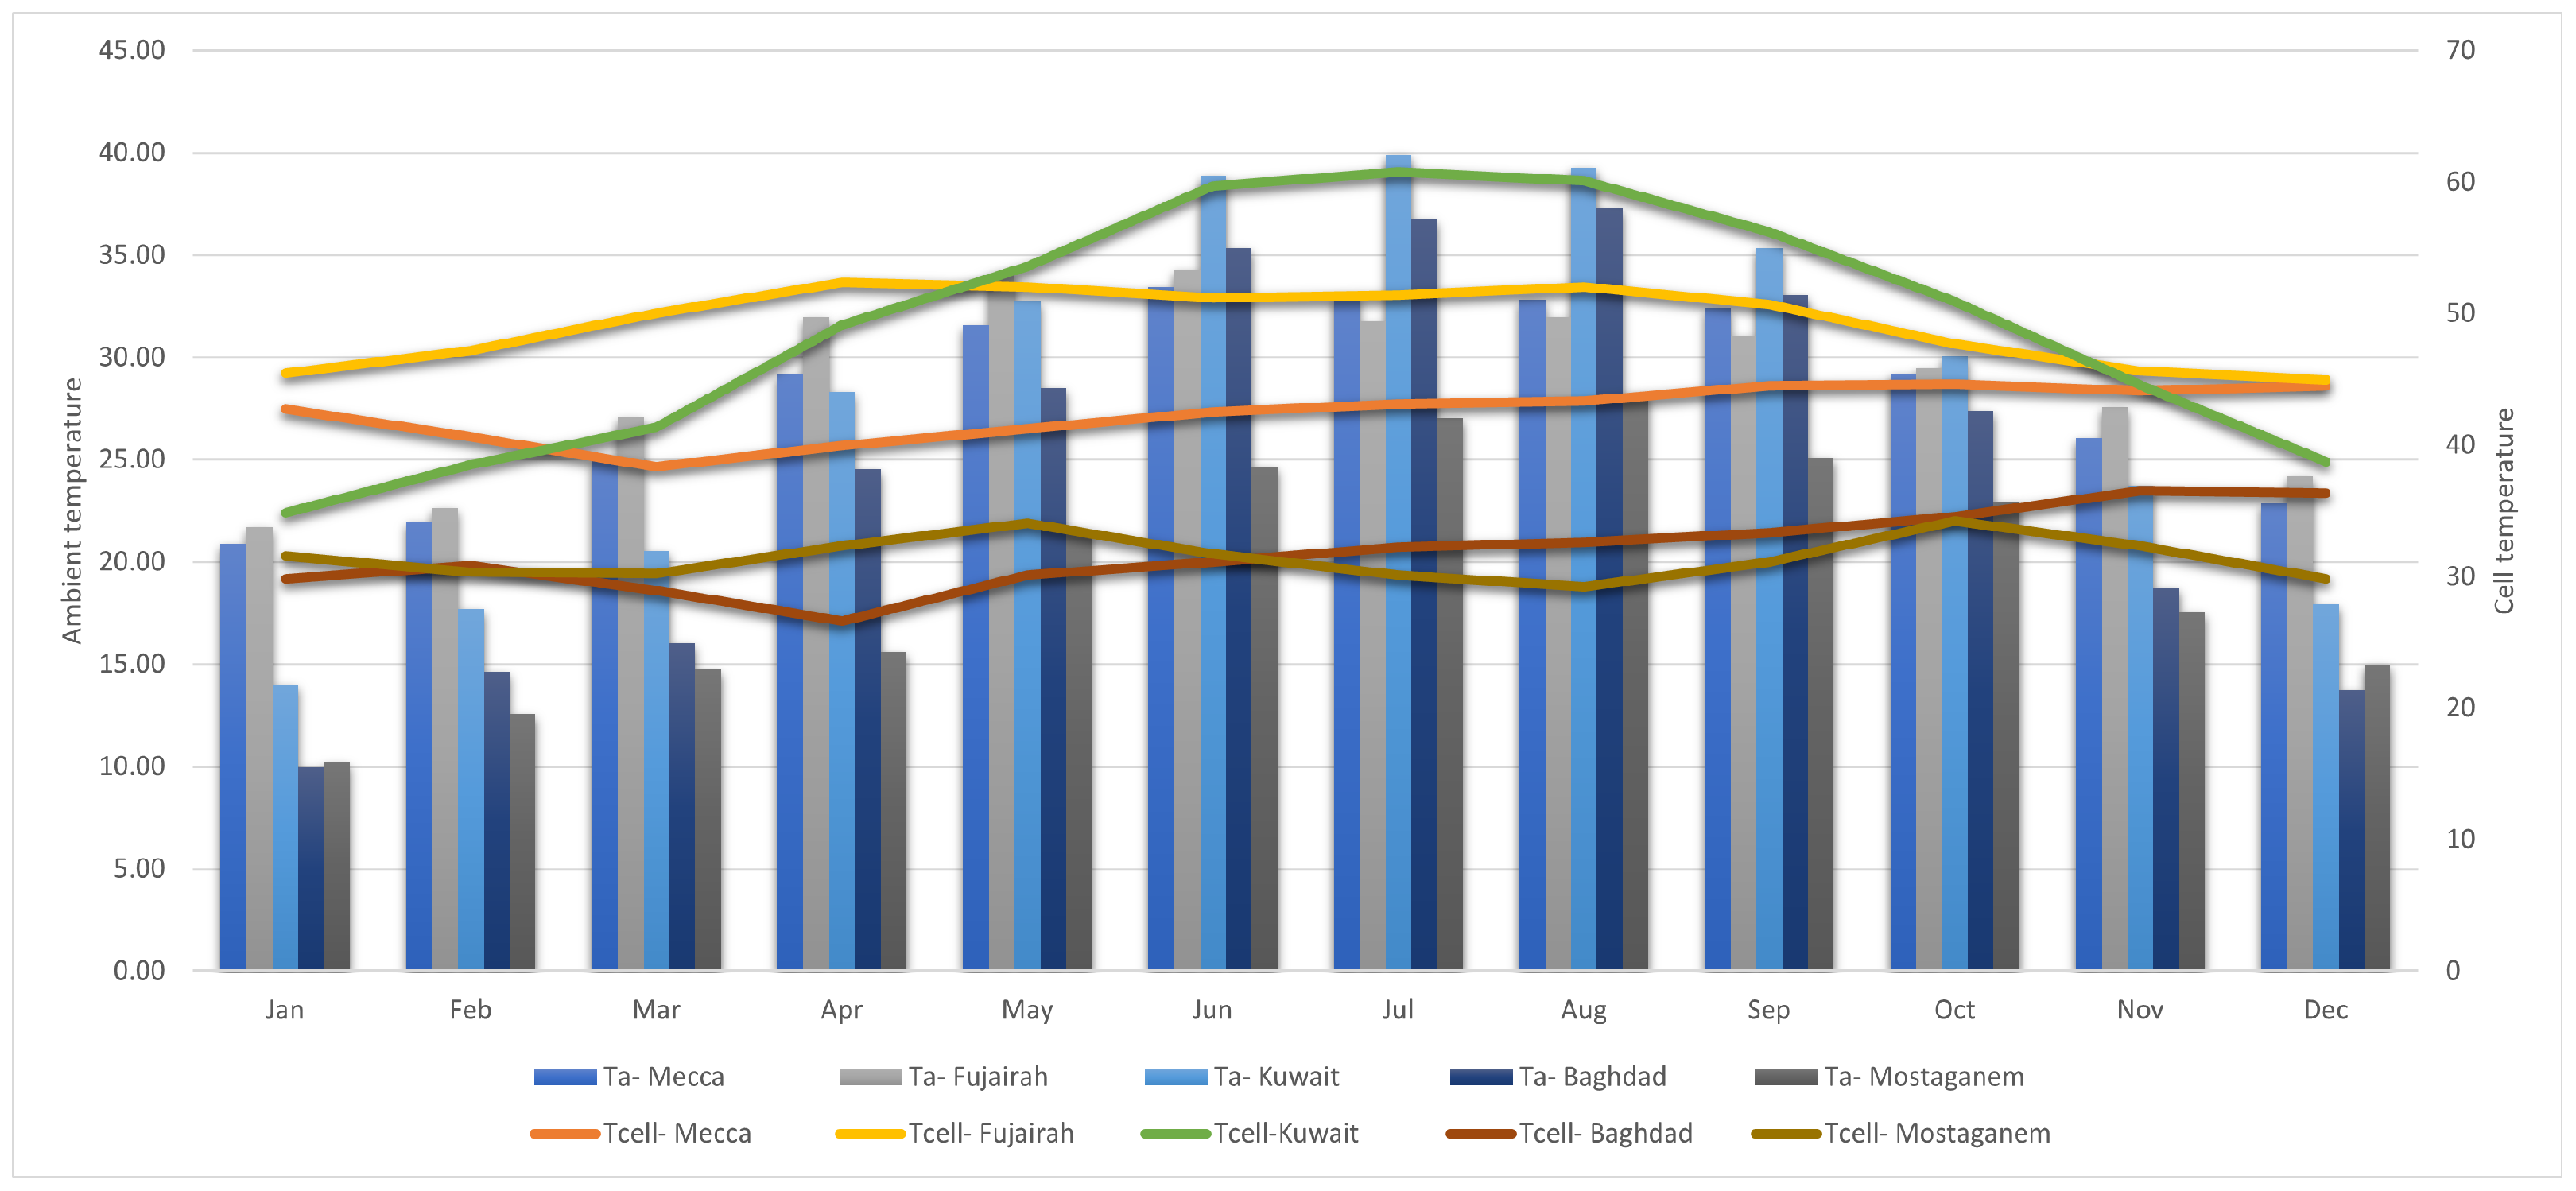
Considering the ambient temperature and cell temperature of each city, it becomes apparent that there is a direct correlation between the two factors. In Figure 18, the ambient temperature and cell temperature are shown together. It is evident that an increase in the surrounding environmental temperature leads to a corresponding rise in the cell temperature of the PV system.
This observation is notable due to the influence of cell temperature on the overall performance of the PV device. An increase in cell temperature adversely impacts the efficiency and output of the PV system. Figure 19 effectively demonstrates this correlation, underscoring the PV cells’ sensitivity to temperature fluctuations.
When the ambient temperature increases, it directly affects the temperature of the PV system itself, as mentioned earlier. Furthermore, an increase in latitude and tilt angle can also impact the performance of the PV system. This phenomenon is evident in the case of Fujairah, where the temperature can reach as high as 49.83 °C, resulting in a noticeable decrease in PV performance, particularly at the open-circuit point. In Kuwait, the impact of temperature on PV performance is even more pronounced. Under normal conditions, the open-circuit temperature is around 30 °C. However, when the temperatures rises to 49.7 °C, the performance of the PV system is significantly affected, with a notable decline in efficiency. This sensitivity to temperature change occurs earlier in Kuwait compared to other cities, highlighting the importance of thermal management strategies for PV installations in this region. On the other hand, in Mostaganem, the effect of temperature on PV performance is relatively less pronounced compared to Kuwait. While temperature still plays a role in influencing PV performance, the impact is not as significant as in higher-temperature regions. This suggests that Mostaganem may experience a more favorable operating environment for PV systems, with less adverse effects on performance even under elevated temperatures. Understanding these variations in PV performance in different cities and under different temperature conditions is crucial for effectively designing, operating, and maintaining PV systems. By considering temperature effects and implementing appropriate cooling and thermal management techniques, the performance and overall efficiency of PV installations can be optimized, ensuring maximum energy generation in diverse environmental conditions. The efficiency of the PV system under standard conditions is 13%. Changing the efficiency leads to values of 11.7%, 11.75%, 11.79%, 11.97%, and 12.22% for Mecca, Fujairah, Kuwait, Baghdad, and Mostaganem, respectively.

5.3. PVWatt Tilt Angle

The PVWatts calculator, developed by the U.S. Department of Energy’s National Renewable Energy Laboratory (NREL), serves as a vital resource for individuals and businesses planning to deploy PV solar systems. This online tool empowers users to anticipate both the power output and optimal tilt angle of their prospective solar installations. In this paper, we leverage the PVWatts tool to determine the recommended tilt angle for solar panels, subsequently comparing this result to the findings of our study. By doing so, we aim to evaluate the accuracy of the PVWatts calculator and identify any discrepancies between its estimates and our research data. The online tool will find the optimum tilt angle manually, so all the actual outputs of the PVWatts calculator consist of degrees of tilt angle. This angle will vary between 0 and 90, and the tool does not take account of negative signs for the tilt angle. A zero tilt angle corresponds to a horizontal PV cell, and 90 corresponds to a vertical PV cell.
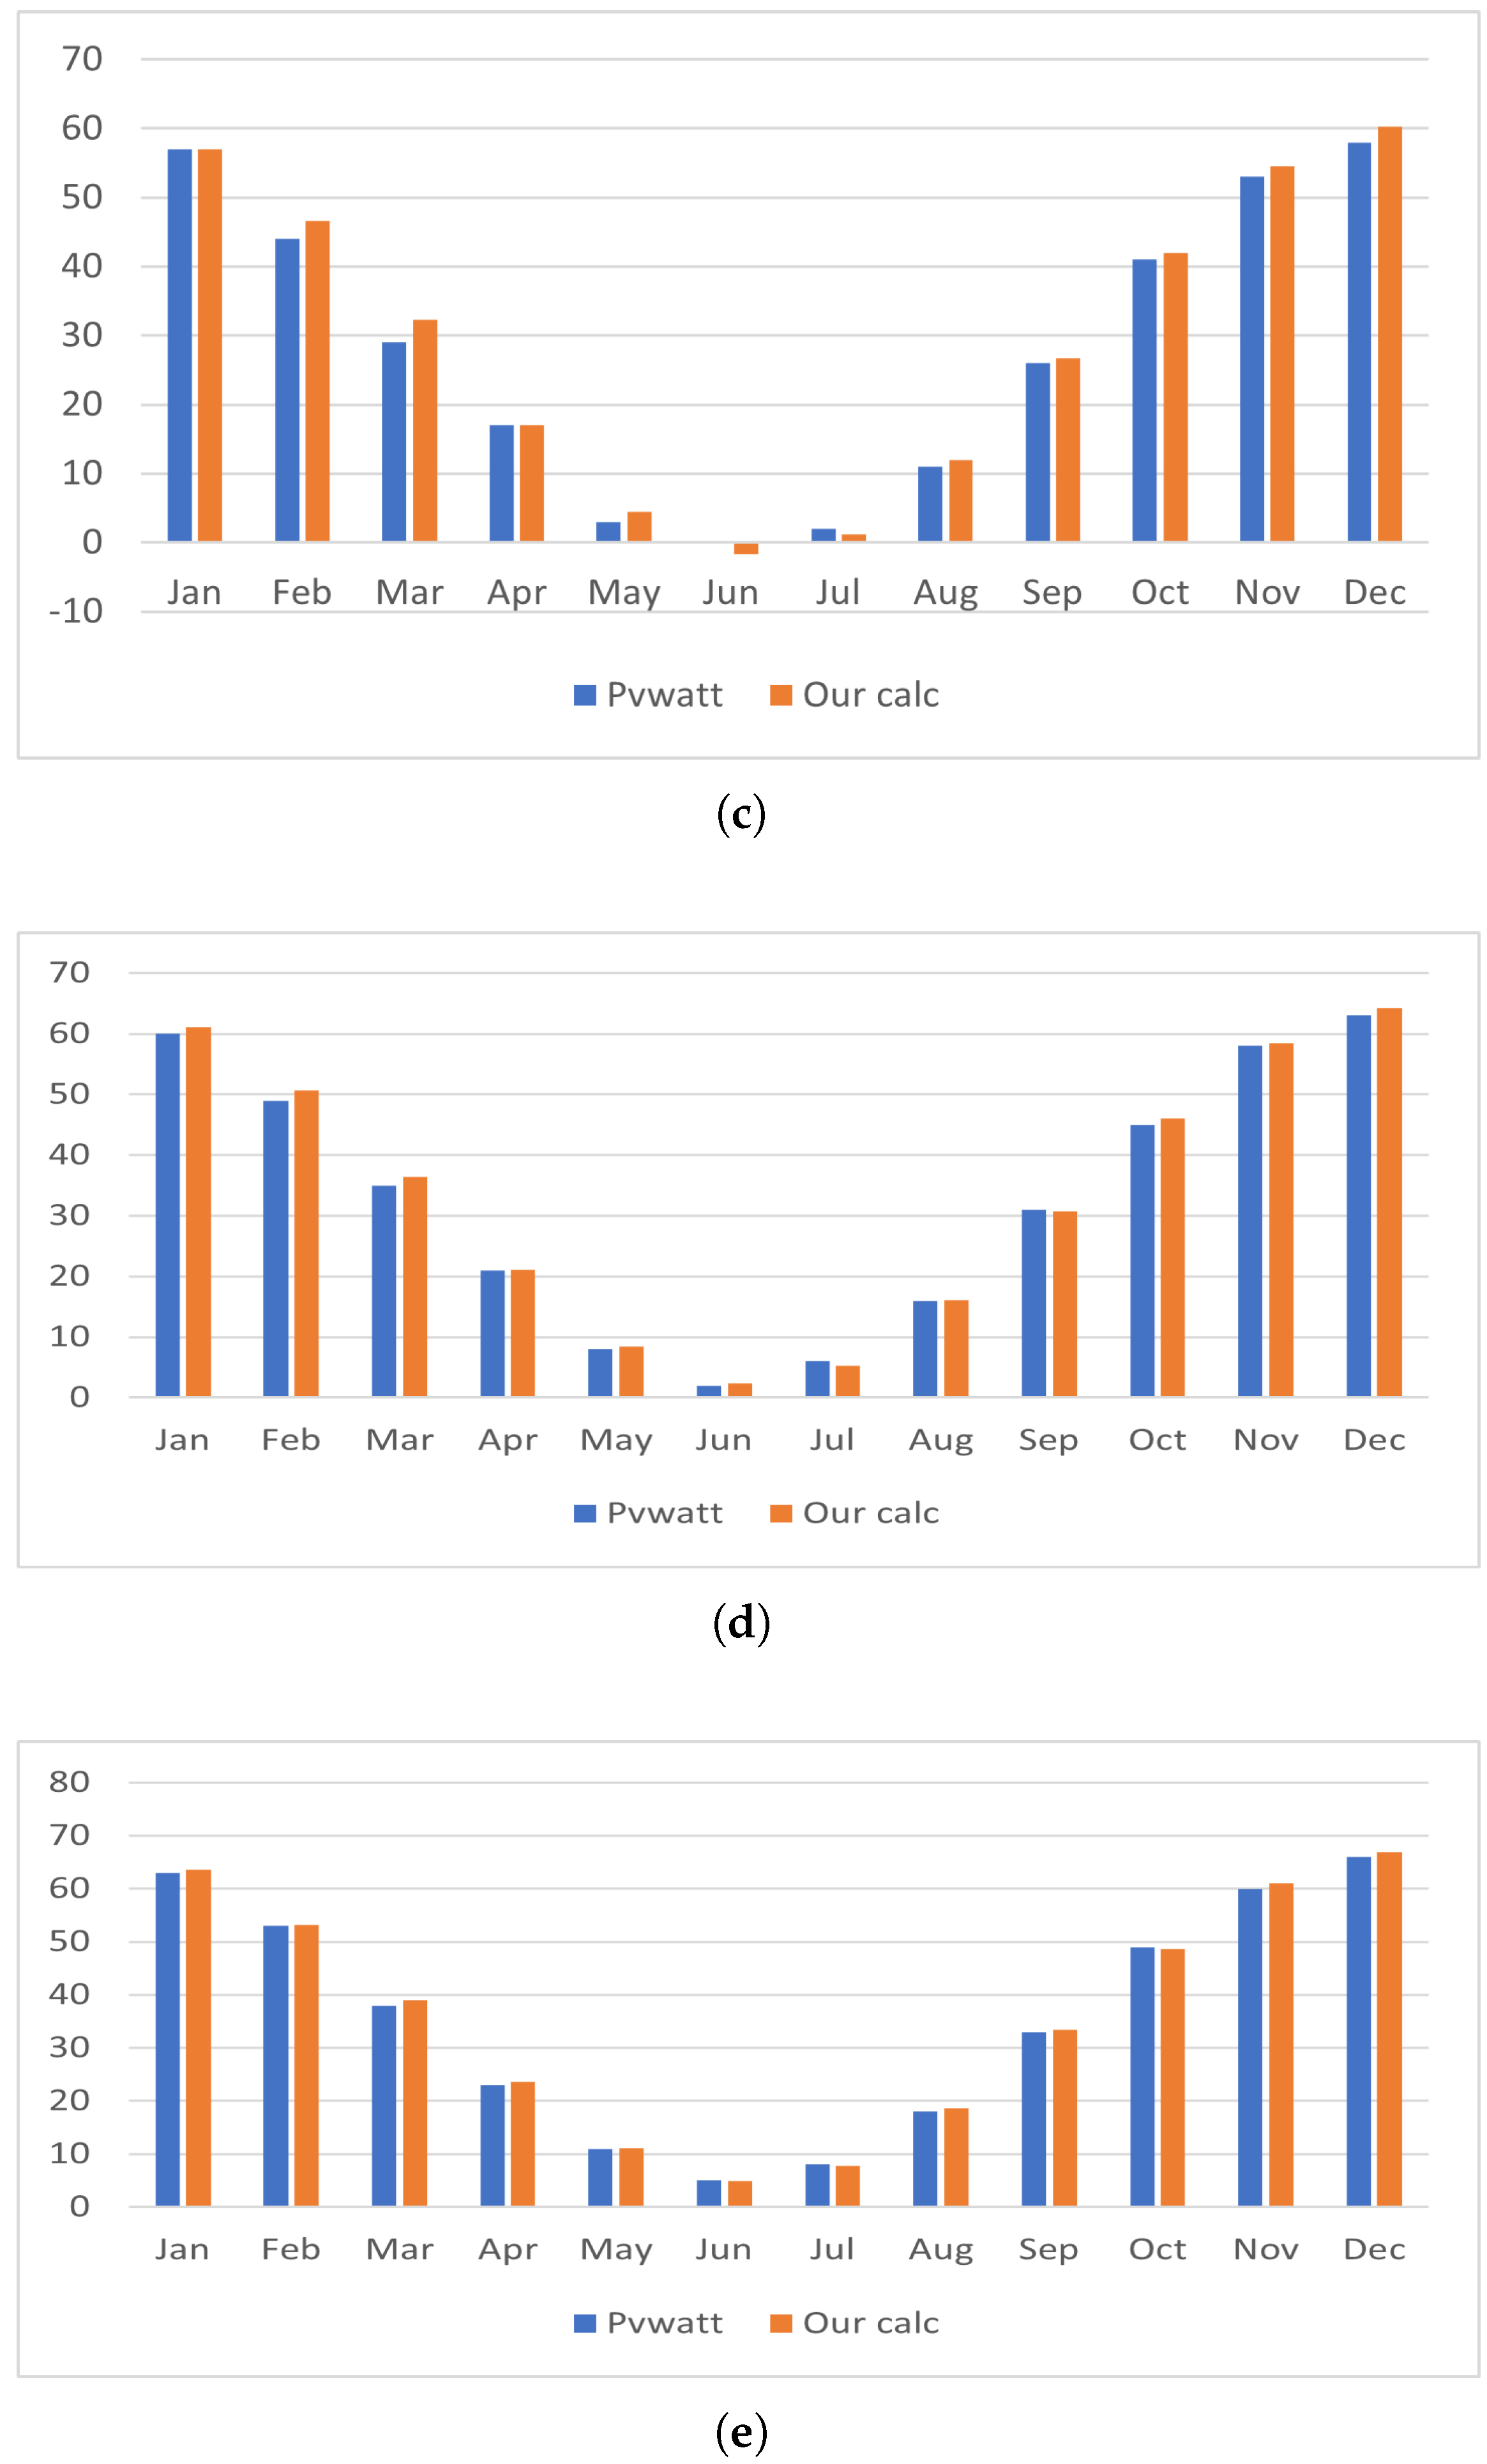
The results of the tilt angle calculations are shown in Figure 20. The average errors of the tilt angle for Fujairah city, Mecca city, Kuwait city, Baghdad city, and Mostaganem city are 4.3%, 3.8%, 11.1%, 4%, and 1.4%, respectively.

5.4. Power Output of the PV Solar System

The subsequent critical phase of this research involves the accurate determination of the power output that the end-user would employ through the implementation of a PV system. The annual energy output for these systems will be calculated based on the predetermined annual tilt angles, as derived from an in-depth analysis utilizing the PVWatts calculator. It is noteworthy that the power output figures obtained from the calculator are based on the PVWatts energy estimate, which relies on an hourly performance simulation utilizing a typical-year weather file. This file represents a multi-year historical dataset for the specified location and is configured for a fixed (open rack) PV system. The study produced the following results for the power output from the various tilt angles in different cities. To facilitate a comprehensive comparison, the study also examined the disparity in power output and energy consumption of PV cells tilted at these angles and those organized in a horizontal arrangement, all of which are tabulated in Table 6.
In Fujairah, the energy output for a solar panel having a tilt angle of 25.21° is 7057 kWh, compared to 6565 kWh on a horizontal surface. This results in a difference of 492 kWh, favoring the tilted configuration. In Mecca, with a tilt angle of 21.48°, the solar panel generates 7071 kWh, while a horizontal setup produces 6608 kWh, yielding a difference of 463 kWh in favor of the tilted configuration. Kuwait’s solar panels, positioned at an annual tilt angle of 29.38°, achieve an energy output of 6210 kWh. In contrast, on a horizontal surface, they produce 5879 kWh, resulting in a difference of 331 kWh in favor of the tilted configuration. In Baghdad, with a tilt angle of 33.38°, the energy output is 5818 kWh, compared to 5167 kWh on a horizontal surface. This leads to a difference of 651 kWh, favoring the tilted configuration. Mostaganem, with an annual tilt angle of 35.98°, generates 5800 kWh, while a horizontal surface produces 5223 kWh. This results in a difference of 577 kWh in favor of the tilted configuration.
These differences in energy generation demonstrate the impact of tilt angles on the efficiency of PV systems in these cities. Tilted configurations consistently result in higher energy generation compared to horizontal surfaces.
The percentage increases in energy production for each location are as follows: Fujairah at 7.51%, Mecca at 6.99%, Kuwait at 5.62%, Baghdad at 12.56%, and Mostaganem at 11.04%.
In the final analysis of the impact of tilt angle and ambient temperature, the yearly sensitivity results are as follows: for Kuwait, a tilt change of 5 and + 5 alters the annual index by 1.208 % and + 0.572 % , respectively, while a temperature change of −5 °C and +5 °C yields 1.540 % and + 1.541 % , respectively. For Mostaganem, tilt shifts result in 1.278 % and + 0.627 % , and temperature shifts in 1.582 % and + 1.583 % , respectively. For Mecca, tilt adjustments give 1.107 % and + 0.484 % , while temperature variations lead to 1.539 % and + 1.540 % , respectively. For Fujairah, tilt changes are 1.178 % and + 0.549 % , and temperature effects are 1.536 % and + 1.537 % , respectively. Finally, for Baghdad, tilt variations produce 1.241 % and + 0.597 % , while temperature shifts give 1.557 % and + 1.558 % , respectively. These results agree with the literature: small changes in the PV tilt angle only slightly affect yearly power output, but because PV systems already produce limited power, even these small percentages are still important.

6. Conclusions

This study determined monthly and yearly optimal tilt angles while accounting for ambient temperature across five Middle Eastern cities. Using the developed model, we analyzed the combined effects of solar radiation, tilt angle, and ambient temperature on PV power output. The yearly optimal tilt angles were as follows: Mecca (21.4° N)—21.48°, Fujairah (25.13° N)—25.21°, Kuwait (29.3° N)—29.38°, Baghdad (33.3° N)—33.38°, and Mostaganem (35.9° N)—35.98°, i.e., approximately equal to latitude.
Quantitatively, monthly tilting increased annual energy relative to a single yearly setting by 7.51% (Fujairah; 7057 vs. 6565 kWh, +492 kWh), 6.99% (Mecca; 7071 vs. 6608 kWh, +463 kWh), 5.62% (Kuwait; 6210 vs. 5879 kWh, +331 kWh), 12.56% (Baghdad; 5818 vs. 5167 kWh, +651 kWh), and 11.04% (Mostaganem; 5800 vs. 5223 kWh, +577 kWh). Thermal effects were also explicit: the average PV cell temperature exceeded ambient by about 20.25 °C in Fujairah (49.22 vs. 28.97 °C), 20.84 °C in Mecca (49.03 vs. 28.19 °C), 10.44 °C in Kuwait (38.63 vs. 28.19 °C), 20.83 °C in Baghdad (45.49 vs. 24.66 °C), and 20.83 °C in Mostaganem (40.42 vs. 19.59 °C). Consistent with these parameters, the modeled efficiency decreased from a 13% STC reference to site values of ≈11.70% (Mecca), 11.75% (Fujairah), 11.79% (Kuwait), 11.97% (Baghdad), and 12.22% (Mostaganem). These results show that (i) the yearly optimal tilt closely matches latitude and (ii) monthly tilt adjustments provide a measurable yield gain with clear thermal context. Future work should extend the model to include dust, soiling, and shading, which are site specific and often require long-term data, and transition from city-specific codes to a programmable model driven by geographic inputs and PV manufacturer datasheets.

Author Contributions

Conceptualization, Y.S.; methodology, R.M.; software, R.M.; visualization, R.M.; formal analysis, R.M.; validation, R.M. and Y.S.; writing—original draft preparation, R.M., Y.S. and F.M.A.M.; writing—review and editing, R.M., F.M.A.M. and Y.S.; supervision, Y.S. and A.A.-E. All authors have read and agreed to the published version of the manuscript.

Funding

This research received no external funding.

Institutional Review Board Statement

Not applicable.

Informed Consent Statement

Not applicable.

Data Availability Statement

The data presented in this study are available on request from Raghed Melhem.

Conflicts of Interest

The authors declare no conflicts of interest.

References

  1. Tagliapietra, S. The impact of the global energy transition on MENA oil and gas producers. Energy Strategy Rev. 2019, 26, 100397. [Google Scholar] [CrossRef]
  2. Tazikeh, S.; Mohammadzadeh, O.; Zendehboudi, S.; Saady, N.M.C.; Albayati, T.M.; Chatzis, I. Energy development and management in the Middle East: A holistic analysis. Energy Convers. Manag. 2025, 323, 119124. [Google Scholar] [CrossRef]
  3. Islam, M.T.; Ali, A. Sustainable green energy transition in Saudi Arabia: Characterizing policy framework, interrelations and future research directions. Next Energy 2024, 5, 100161. [Google Scholar] [CrossRef]
  4. Gielen, D.; Boshell, F.; Saygin, D.; Bazilian, M.D.; Wagner, N.; Gorini, R. The role of renewable energy in the global energy transformation. Energy Strategy Rev. 2019, 24, 38–50. [Google Scholar] [CrossRef]
  5. Alnaqbi, S.; Alami, A. Sustainability and Renewable Energy in the UAE: A Case Study of Sharjah. Energies 2023, 16, 7034. [Google Scholar] [CrossRef]
  6. Tamimi. Greening the Energy Mix: Saudi Arabia, the United Arab Emirates, and Qatar. 2023. Available online: https://www.tamimi.com/law-update-articles/greening-the-energy-mix-saudi-arabia-the-united-arab-emirates-and-qatar/ (accessed on 20 September 2025).
  7. Tok, E. The Gulf Cooperation Council states: Crystallization of the regional cooperation and alliances amid dwindling resources. Dig. Middle East Stud. 2021, 30, 53–69. [Google Scholar] [CrossRef]
  8. Saif, A.G.H.; Alquaity, A.B.; Mokheimer, E.M. Techno-economic analysis of green hydrogen production in Saudi Arabia: A comparative study of solar PV and CSP technologies. Int. J. Hydrogen Energy 2025, 105, 1361–1374. [Google Scholar] [CrossRef]
  9. Alnaser, W.; Alnaser, N. The impact of the rise of using solar energy in GCC countries. In Renewable Energy and Sustainable Buildings: Selected Papers from the World Renewable Energy Congress WREC 2018; Springer: Berlin/Heidelberg, Germany, 2019; pp. 167–183. [Google Scholar]
  10. deve Venkatachalam, S.; Al Nadabi, A.; Al Shukaili, A.A.; Al Hinai, A.S.; Al Shuaili, A.S.; said Al Shukaili, I. Performance and suitability analysis of rooftop solar PV in Oman: A case study of university branches. Heliyon 2025, 11, e42578. [Google Scholar] [CrossRef]
  11. Mamun, M.; Islam, M.; Hasanuzzaman, M.; Selvaraj, J. Effect of tilt angle on the performance and electrical parameters of a PV module: Comparative indoor and outdoor experimental investigation. Energy Built Environ. 2022, 3, 278–290. [Google Scholar] [CrossRef]
  12. Teyabeen, A.A.; Mohamed, F. Estimation of the Optimum Tilt Angle of Solar PV Panels to Maximize Incident Solar Radiation in Libya. Energies 2024, 17, 5891. [Google Scholar] [CrossRef]
  13. Shaik, F.; Lingala, S.S.; Veeraboina, P. Effect of various parameters on the performance of solar PV power plant: A review and the experimental study. Sustain. Energy Res. 2023, 10, 6. [Google Scholar] [CrossRef]
  14. Dubey, S.; Sarvaiya, J.N.; Seshadri, B. Temperature dependent photovoltaic (PV) efficiency and its effect on PV production in the world—A review. Energy Procedia 2013, 33, 311–321. [Google Scholar] [CrossRef]
  15. Dhanalakshmi, S.; Chakravartula, V.; Narayanamoorthi, R.; Kumar, R.; Dooly, G.; Duraibabu, D.B.; Senthil, R. Thermal management of solar photovoltaic panels using a fibre Bragg grating sensor-based temperature monitoring. Case Stud. Therm. Eng. 2022, 31, 101834. [Google Scholar] [CrossRef]
  16. Shaker, L.M.; Al-Amiery, A.A.; Hanoon, M.M.; Al-Azzawi, W.K.; Kadhum, A.A.H. Examining the influence of thermal effects on solar cells: A comprehensive review. Sustain. Energy Res. 2024, 11, 6. [Google Scholar] [CrossRef]
  17. Duffie, J.A.; Beckman, W.A. Solar Engineering of Thermal Processes, 4th ed.; John Wiley & Sons: Hoboken, NJ, USA, 2013. [Google Scholar]
  18. Chin, V.J.; Salam, Z.; Ishaque, K. An accurate two diode model computation for CIS thin film PV module using the hybrid approach. In Proceedings of the 2015 4th International Conference on Electric Power and Energy Conversion Systems (EPECS), Sharjah, United Arab Emirates, 24–26 November 2015; IEEE: Piscataway, NJ, USA, 2015; pp. 1–6. [Google Scholar]
  19. Mansour, R.B.; Khan, M.A.M.; Alsulaiman, F.A.; Mansour, R.B. Optimizing the solar PV tilt angle to maximize the power output: A case study for Saudi Arabia. IEEE Access 2021, 9, 15914–15928. [Google Scholar] [CrossRef]
  20. Melhem, R.; Shaker, Y. Estimating the Optimum Tilt Angle of Solar Panels in Fujairah. In Proceedings of the 2023 Advances in Science and Engineering Technology International Conferences (ASET), Dubai, United Arab Emirates, 20–23 February 2023; pp. 1–5. [Google Scholar]
  21. Melhem, R.; Shaker, Y. Optimum tilt angle and solar radiation of photovoltaic modules for gulf collaboration council countries. Int. J. Energy Res. 2023, 2023, 8381696. [Google Scholar] [CrossRef]
  22. Kaddoura, T.O.; Ramli, M.A.; Al-Turki, Y.A. On the estimation of the optimum tilt angle of PV panel in Saudi Arabia. Renew. Sustain. Energy Rev. 2016, 65, 626–634. [Google Scholar] [CrossRef]
  23. Liu, H.; Xu, X.; Meng, Y.; Yu, D.; Shi, K. A research for the influence of tilt angles of the solar panel on photovoltaic power generation. In Proceedings of the 2018 International Conference on Smart Grid and Clean Energy Technologies (ICSGCE), Kajang, Malaysia, 29 May–1 June 2018; IEEE: Piscataway, NJ, USA, 2018; pp. 95–100. [Google Scholar]
  24. Selvi, S.; Mohanraj, M.; Duraipandy, P.; Kaliappan, S.; Natrayan, L.; Vinayagam, N. Optimization of solar panel orientation for maximum energy efficiency. In Proceedings of the 2023 4th International Conference on Smart Electronics and Communication (ICOSEC), Trichy, India, 20–22 September 2023; IEEE: Piscataway, NJ, USA, 2023; pp. 159–162. [Google Scholar]
  25. Solargis. Global Solar Atlas 2.0, Solar Resource Data. 2021. Available online: https://solargis.com (accessed on 20 September 2025).
  26. Khan, M.S.; Ramli, M.A.; Sindi, H.F.; Hidayat, T.; Bouchekara, H.R. Estimation of solar radiation on a PV panel surface with an optimal tilt angle using electric charged particles optimization. Electronics 2022, 11, 2056. [Google Scholar] [CrossRef]
  27. Abdallah, R.; Juaidi, A.; Abdel-Fattah, S.; Manzano-Agugliaro, F. Estimating the optimum tilt angles for south-facing surfaces in Palestine. Energies 2020, 13, 623. [Google Scholar] [CrossRef]
  28. Wang, H.; Sun, Y.; Dong, F. Bismuth metal and semiconductor-based photocatalysts: structure tuning, activity enhancement, and reaction mechanism. In Interface Science and Technology; Elsevier: Amsterdam, The Netherlands, 2020; Volume 31, pp. 349–377. [Google Scholar]
  29. Oliveira, M.; Silva Lopes, H.; Mendonça, P.; Tenpierik, M.; Silva, L.T. Solar radiation measurement tools and their impact on in situ testing—A Portuguese case study. Buildings 2024, 14, 2117. [Google Scholar] [CrossRef]
  30. Li, H.; Lian, Y.; Wang, X.; Ma, W.; Zhao, L. Solar constant values for estimating solar radiation. Energy 2011, 36, 1785–1789. [Google Scholar] [CrossRef]
  31. Jatskevich, J.; Spagnuolo, G.; Xiao, W.; Edwin, F.F. Efficient Approaches for Modeling and Simulating Photovoltaic Power Systems. IEEE J. Photovoltaics 2013, 3, 500–508. [Google Scholar]
  32. Yahya-Khotbehsara, A.; Shahhoseini, A. A fast modeling of the double-diode model for PV modules using combined analytical and numerical approach. Sol. Energy 2018, 162, 403–409. [Google Scholar] [CrossRef]
  33. Sarniak, M.T.; Wernik, J.; Wołosz, K.J. Application of the double diode model of photovoltaic cells for simulation studies on the impact of partial shading of silicon photovoltaic modules on the waveforms of their current-voltage characteristic. Energies 2019, 12, 2421. [Google Scholar] [CrossRef]
  34. Markvart, T.; Castañer, L. Principles of solar cell operation. In McEvoy’s Handbook of Photovoltaics; Elsevier: Amsterdam, The Netherlands, 2018; pp. 3–28. [Google Scholar]
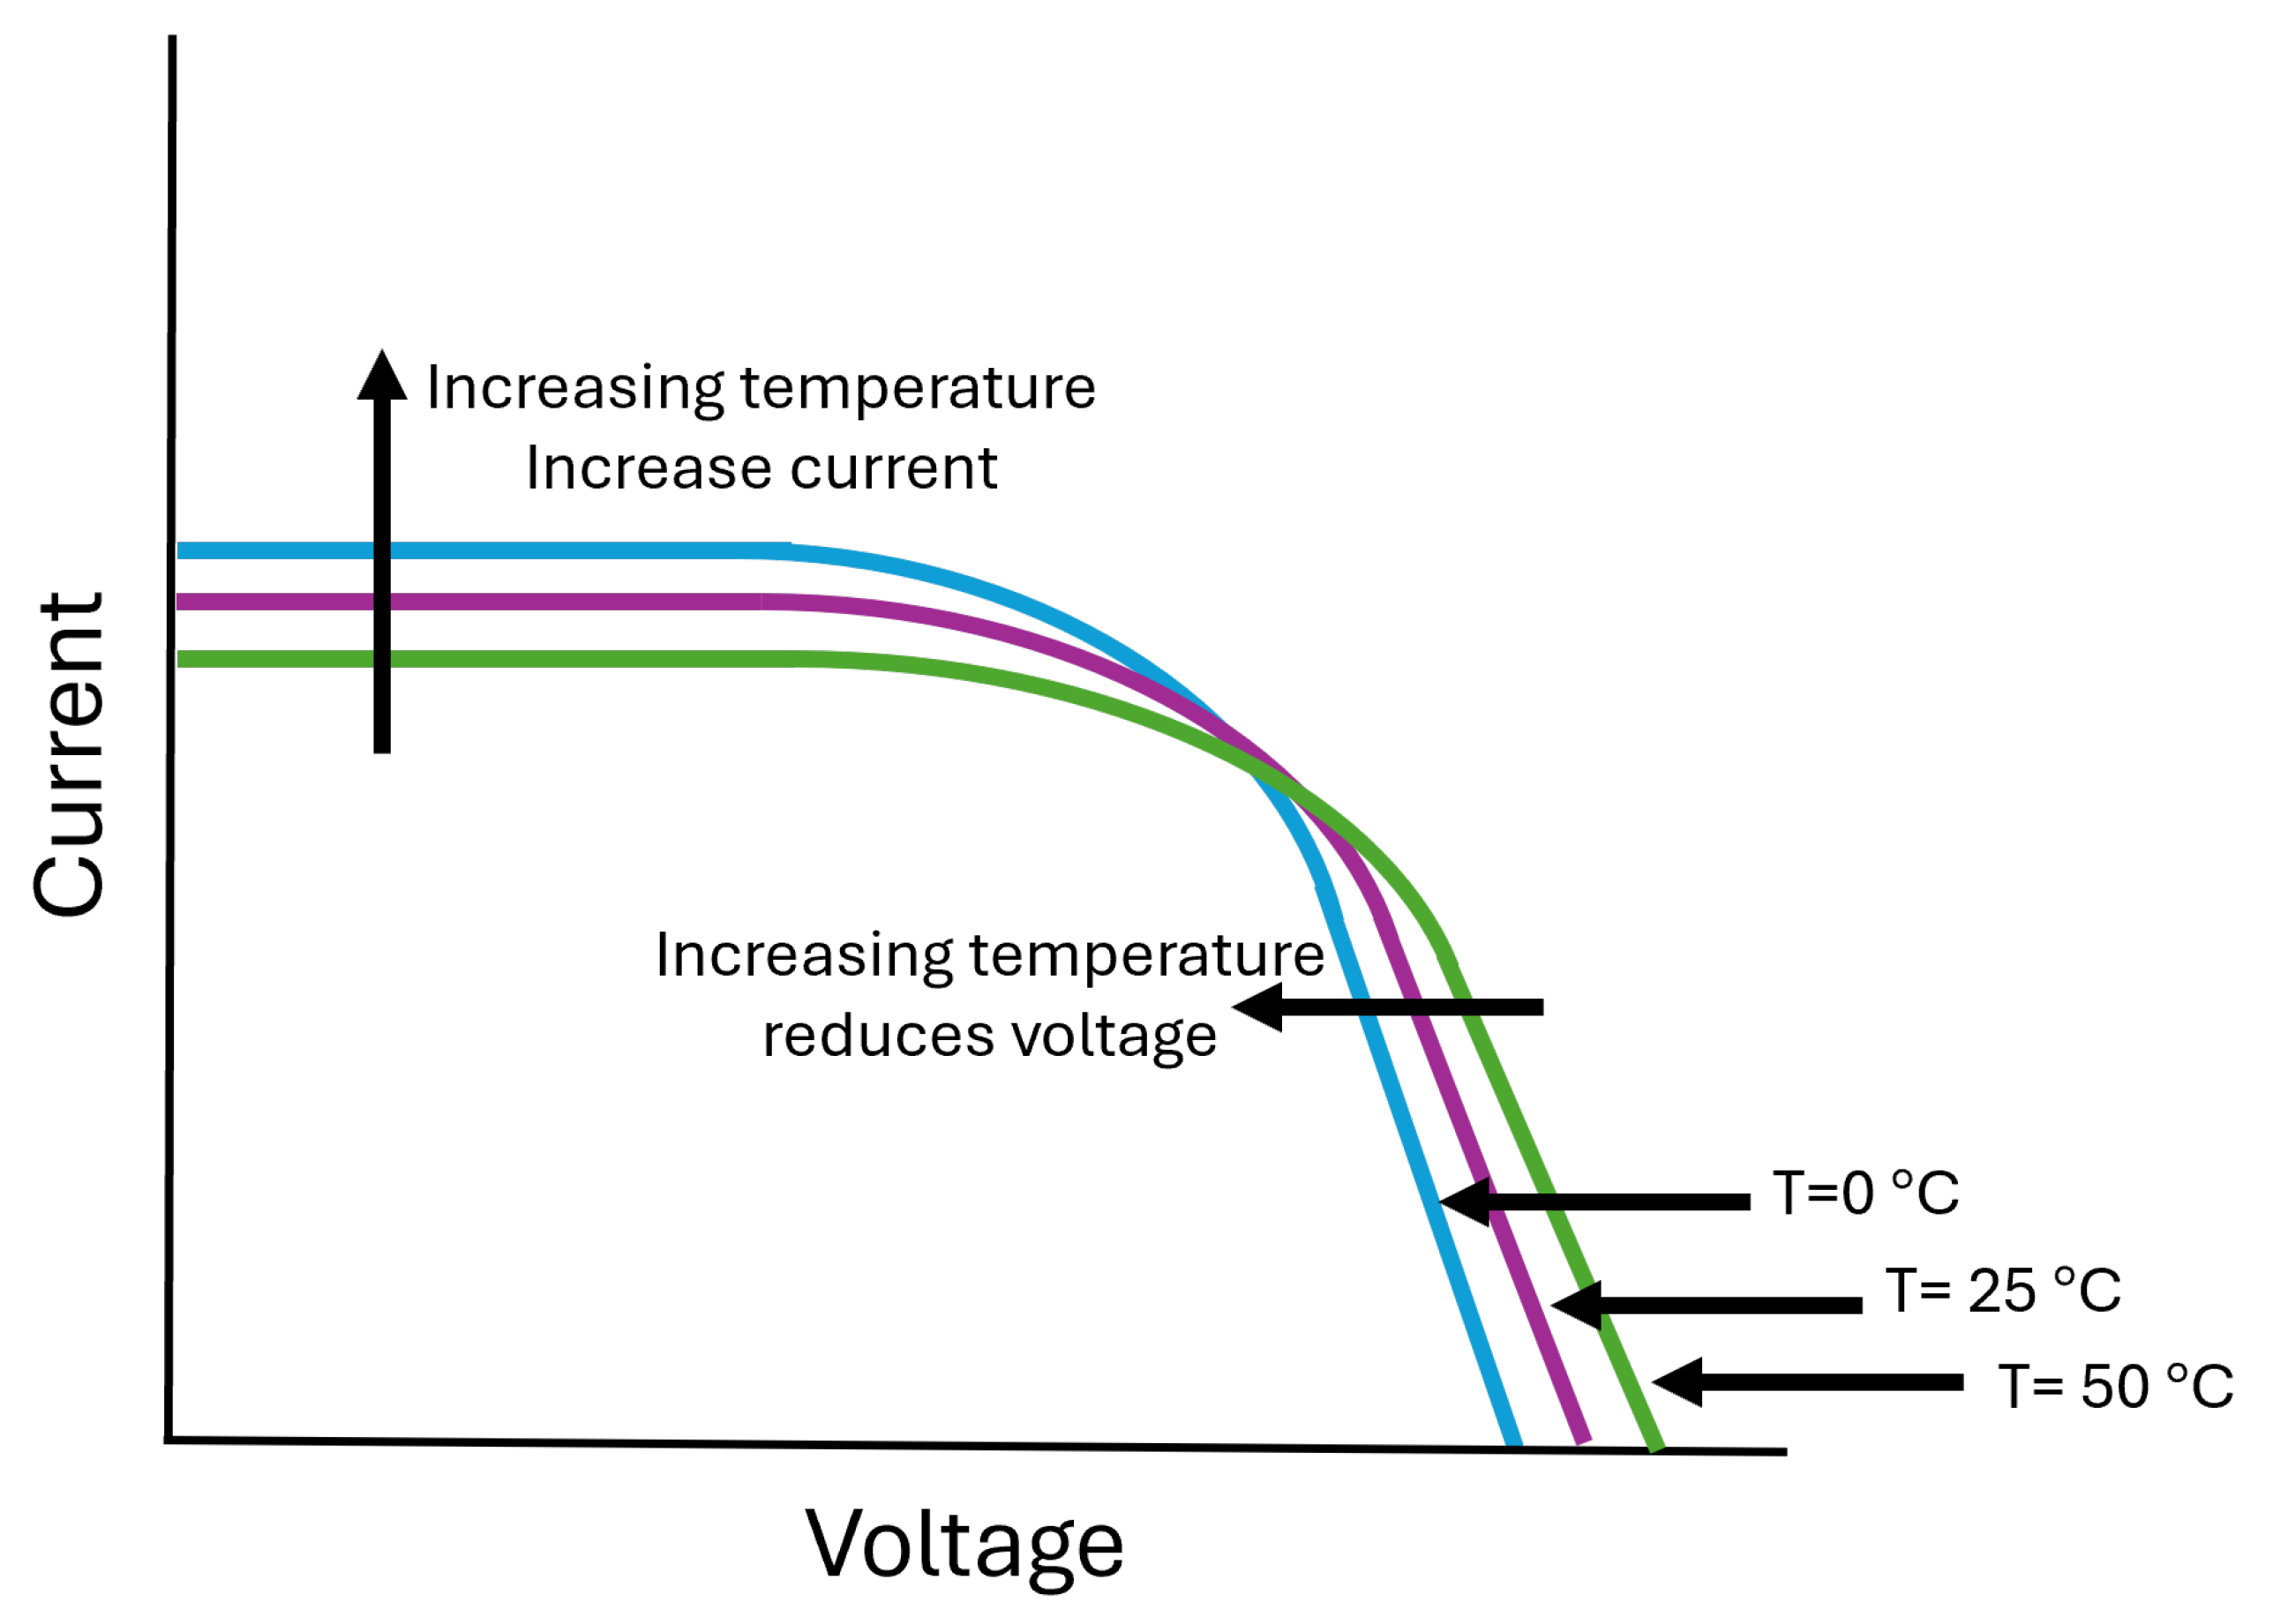
Figure 1. The impact of temperature on the I–V curve.
Energies 18 05257 g001
Figure 2. Global horizontal solar radiation map. Copyright: solar resource map © 2021 Solargis [25].
Energies 18 05257 g002
Figure 3. Extraterrestrial irradiance for the whole Earth.
Energies 18 05257 g003
Figure 4. PV cell double-diode model.
Energies 18 05257 g004
Figure 5. Flow chart showing the PV output with calculating PV temperature and insolation.
Energies 18 05257 g005
Figure 6. The tilt angle and solar insolation in Fujairah city.
Energies 18 05257 g006
Figure 7. Total solar irradiation on the tilted plane (blue) and compared with the horizontal plane (orange) for Fujairah city in units (Wh/m2/month).
Energies 18 05257 g007
Figure 8. The tilt angle and daily solar insolation in Mecca city.
Energies 18 05257 g008
Figure 9. Total solar irradiation on the tilted plane (blue) and compared with the horizontal plane (orange) for Mecca city in units (Wh/m2/month).
Energies 18 05257 g009
Figure 10. The tilt angle and solar insolation in Kuwait city.
Energies 18 05257 g010
Figure 11. Total solar insolation on the tilted plane (blue) and compared with the horizontal plane (orange) for Kuwait city in units (Wh/m2/month).
Energies 18 05257 g011
Figure 12. The tilt angle and solar insolation in Baghdad city.
Energies 18 05257 g012
Figure 13. Total solar irradiation on the tilted plane (blue) and compared with the horizontal plane (orange) for Baghdad city in units (Wh/m2/month).
Energies 18 05257 g013
Figure 14. The tilt angle and solar insolation in Mostaganem city.
Energies 18 05257 g014
Figure 15. Total solar irradiation on the tilted plane (blue) and compared with the horizontal plane (orange) for Mostaganem city in units (Wh/m2/month).
Energies 18 05257 g015
Figure 16. Values of daily tilt angle across five different cities.
Energies 18 05257 g016
Figure 17. Values of monthly tilt angle across five different cities.
Energies 18 05257 g017
Figure 18. Comparison of ambient air temperature and corresponding PV cell temperature for five selected cities.
Energies 18 05257 g018
Figure 19. The I–V curve and P–V curve of the PV for different cell temperatures. (a) I–V curve, (b) P–V curve.
Energies 18 05257 g019
Figure 20. Comparison of monthly optimum tilt angles obtained from our MATLAB-based model with those provided by the PVWatts calculator for (a) Fujairah, (b) Mecca, (c) Kuwait, (d) Baghdad, and (e) Mostaganem. The close agreement across all five cities validates our calculation approach.
Energies 18 05257 g020aEnergies 18 05257 g020b
Table 1. Monthly calculated cell temperature, ambient temperature, tilt angle, and insolation for Fujairah.
Cell Temperature (°C)Ambient Temperature (°C)Tilt Angle (°)Insolation (kWh/m2/month)
Jan45.4521.7052.8620.26
Feb47.1622.6342.4320.17
Mar50.0327.0628.1826.50
Apr52.3731.9812.9029.91
May52.0234.090.3031.16
Jun51.2134.27−5.8529.27
Jul51.4331.75−2.9730.43
Aug52.0131.957.8630.73
Sep50.6731.0622.5826.85
Oct47.7129.4637.8323.11
Nov45.6427.5550.3019.78
Dec44.9624.2056.1419.71
Average49.2228.9725.2130.79
Table 2. Monthly calculated cell temperature and monthly tilt angle for Mecca city, KSA.
Cell Temperature (°C)Ambient Temperature (°C)Tilt Angle (°)Insolation (kWh/m2/month)
Jan41.7220.7949.1321.56
Feb42.8221.9938.7021.64
Mar45.7724.9324.4528.11
Apr50.0029.179.1730.58
May52.4231.59−3.4331.14
Jun54.2633.43−9.5829.00
Jul53.8533.01−6.7030.27
Aug53.6532.824.1331.10
Sep53.2132.3818.8528.13
Oct50.0529.2234.1024.76
Nov46.8826.0546.5721.12
Dec43.7022.8752.4120.89
Average49.0328.1921.4826.53
Table 3. Monthly cell temperature, ambient temperature, tilt angle, and insolation for Kuwait City, Kuwait.
Cell Temperature (°C)Ambient Temperature (°C)Tilt Angle (°)Insolation (kWh/m2/month)
Jan35.4314.0157.0318.93
Feb34.9317.6946.6018.55
Mar34.9320.5332.3524.54
Apr33.1328.3117.0728.93
May32.6332.774.4730.97
Jun33.7338.85−1.6829.37
Jul34.1339.911.2030.41
Aug33.9339.2412.0330.09
Sep34.7335.3426.7525.23
Oct36.2330.0642.0021.22
Nov38.5323.7154.4718.38
Dec37.8317.9060.3118.55
Average38.6328.1929.3824.60
Table 4. Monthly cell temperature, ambient temperature, tilt angle, and insolation for Baghdad City, Iraq.
Cell Temperature (°C)Ambient Temperature (°C)Tilt Angle (°)Insolation (kWh/m2/month)
Jan30.719.9861.0317.82
Feb35.4514.6150.6017.07
Mar36.8416.0036.3522.55
Apr45.3724.5421.0727.80
May49.3128.488.4730.59
Jun56.1735.342.3229.28
Jul57.5936.765.2030.19
Aug58.1137.2816.0329.28
Sep53.8733.0430.7523.52
Oct48.2227.3846.0019.43
Nov39.5818.7558.4717.17
Dec34.5613.7364.3117.60
Average45.4924.6633.3823.53
Table 5. Monthly cell temperature, ambient temperature, tilt angle, and insolatiMostaganem City, Algeria.
Cell Temperature (°C)Ambient Temperature (°C)Tilt Angle (°)Insolation (kWh/m2/month)
Jan31.0210.1863.6317.19
Feb33.3812.5553.2016.16
Mar35.5814.7538.9521.21
Apr36.4315.6023.6726.97
May42.3421.5111.0730.25
Jun45.5124.684.9229.13
Jul47.8827.057.8029.96
Aug49.0328.2018.6328.66
Sep45.9325.1033.3522.34
Oct43.7622.9248.6018.29
Nov38.3817.5561.0716.47
Dec35.8314.9966.9117.07
Average40.4219.5935.9822.81
Table 6. The power output of the PV solar system.
CityAnnual Tilt Angle (°) ( θ a )Energy (kWh) at θ a Energy (kWh) at Horizon Surface
Fujairah25.2170576565
Mecca21.4870716608
Kuwait29.3862105879
Baghdad33.3858185167
Mostaganem35.9858005223
Disclaimer/Publisher’s Note: The statements, opinions and data contained in all publications are solely those of the individual author(s) and contributor(s) and not of MDPI and/or the editor(s). MDPI and/or the editor(s) disclaim responsibility for any injury to people or property resulting from any ideas, methods, instructions or products referred to in the content.