Article

Modeling of Roughness Effects on Generic Gas Turbine Swirler via a Detached Eddy Simulation Low-y+ Approach

School of Engineering, College of Physical Sciences and Engineering, Cardiff University, Cardiff CF24 3AA, UK
*
Author to whom correspondence should be addressed.
Energies 2025, 18(19), 5240; https://doi.org/10.3390/en18195240
Submission received: 8 September 2025 / Revised: 26 September 2025 / Accepted: 30 September 2025 / Published: 2 October 2025
(This article belongs to the Special Issue Science and Technology of Combustion for Clean Energy)

Abstract

The use of additive manufacturing (AM) has seen increased utilization over the last decade, thanks to well-documented advantages such as lower startup costs, reduced wastage, and the ability to rapidly prototype. The poor surface finish of unprocessed AM components is one of the major drawbacks of this technology, with the research literature suggesting a measurable impact on flow characteristics and burner operability. For instance, surface roughness has been shown to potentially increase resistance to boundary layer flashback—an area of high concern, particularly when utilizing fuels with high hydrogen content. A more detailed understanding of the underlying thermophysical mechanisms is, therefore, required. Computational fluid dynamics can help elucidate the impact of these roughness effects by enabling detailed data interrogation in locations not easily accessible experimentally. In this study, roughness effects on a generic gas turbine swirler were numerically modeled using a low-y+ detached eddy simulation (DES) approach. Three DES models were investigated utilizing a smooth reference case and two rough cases, the latter employing a literature-based and novel equivalent sand-grain roughness (ks) correlation developed for this work. Existing experimental isothermal and CH4 data were used to validate the numerical simulations. Detailed investigations into the effects of roughness on flow characteristics, such as swirl number and recirculation zone position, were subsequently performed. The results show that literature-based ks correlations are unsuitable for the current application. The novel correlation yields more promising outcomes, though its effectiveness depends on the chosen turbulence model. Moreover, it was demonstrated that, for identical ks values, while trends remained consistent, the extent to which they manifested differed under reacting and isothermal conditions.

1. Introduction

The use of additive manufacturing (AM) is gaining more widespread adoption in energy conversion technologies due to its well-documented advantages, including weight and part count reduction, increased design freedom, and accelerated development cycles [1,2,3]. AM has been investigated by many gas turbine manufacturers and, as a result, is being used both to manufacture critical components [4,5] and to extend the life of those in service [6].
The poor surface quality of AM components is one of the primary limitations of this technology. Careful consideration must be given to parameters such as machine settings [7], powder size [8], and build orientation [9] to minimize surface roughness. Even with appropriate parameter selection, additional post-processing steps, such as grit blasting, large-area electron beam irradiation [10], or chemical polishing [11], may still be required, each adding time and expense.
Gas turbine burner swirlers are well suited for production via AM, offering enhanced design freedom for improved performance. However, studies [12,13] show that the rough AM surface finish impacts pressure drop, axial velocities, heat release, NOx emissions, and operability. Careful consideration of surface roughness must, therefore, be taken, starting with the design stage through to post-processing.
Understanding the effects of roughness on boundary layer flashback (BLF) is of prime interest. The need for lean-premixed burners able to accommodate high-hydrogen-content fuels has meant operating at conditions with significantly increased flashback risk [14]. Both numerical simulations (two-dimensional) [15] and experimental studies [16] have shown surface roughness and micro-surfaces to have the potential to enhance BLF resistance. Computational fluid dynamics (CFD) can provide deeper insights into these roughness effects by enabling detailed data analysis in areas that are challenging to access through experimental methods.
When it comes to adding roughness effects to a CFD model, three main approaches exist, listed below in order of increasing computational cost [17]:
  • Modeling roughness via empirical correlations, converting measured roughness (e.g., Ra, Rq, and Rz) into an “equivalent sand-grain” roughness (ks) [18,19];
  • Utilizing a “discrete element model” (DEM) to account for roughness blockage, heat transfer, and obstruction drag [20,21];
  • Fully resolving the roughness features [22,23].
Method (1) is available in the majority of CFD solvers and is relatively straightforward to implement, though the reliance on ks is a major limiting factor [17,24]. Approaches (2) and (3) have the advantage of not relying on a ks correlation, though the much higher computational costs make implementation in intricate turbomachinery geometries impractical.

Research Scope

The current study aims to model roughness effects via a ks correlation (method 1) in conjunction with a high-physical-resolution low-y+ approach. This roughness modeling approach cannot be readily applied in Large Eddy Simulations (LES). Given that LES is increasingly employed in turbomachinery studies, this represents a notable limitation. DES, however, provides a closer approximation to LES than RANS while retaining the ability to incorporate modeled roughness effects, thereby motivating its investigation in this context.
Conventionally, high-y+ meshes are needed to attain physically meaningful roughness effects, as the roughness height must be smaller than the height of the wall-adjacent cell ( k s + < y+) [19,25]. However, the necessity of employing a modeled boundary layer (with relatively large near-wall cells) compromises boundary layer resolution. Both the elliptic blending (EB) and K-Omega turbulence models, however, use specific modifications to their formulation that enable roughness effects to still be captured even when k s + > y+ [25], thereby theoretically permitting roughness effects to be modeled within a resolved boundary layer.
Rough and smooth EB and K-Omega detached eddy simulations (DESs) of flows inside the well-documented second-generation high-pressure generic swirl burner (HPGSB-2) [26,27] will be performed and validated against experimental data [13].
The results of this study aim to provide a guide to setting up low-y+ simulations with roughness sensitivity, including the choice of an appropriate ks correlation for swirling flows. Analysis of the CFD simulations will enable a better understanding of the roughness-induced effects on the boundary layer and other flow characteristics, including changes in the swirl number and recirculation zone, allowing the industry to understand the roughness-induced effects of AM components on gas turbine performance and operability limits, as well as avoiding costly empirical test campaigns.

2. Materials and Methods

Previous experimental work performed by Runyon et al. [13] was used to validate the CFD simulations conducted in the current study, in particular, a fully premixed methane–air case at φ = 0.55 and an equivalent total mass flow isothermal air case. The experiments were performed using the HPGSB-2, shown in Figure 1, in conjunction with a high-pressure optical chamber (HPOC) [26,27]. STAR CCM+ 2302 was used as the CFD solver.

2.1. Reference Experimental Data

The experimental data was previously collected by Runyon et al. [13] for three swirlers with a geometric swirl number (Sg) of 0.8. One was conventionally manufactured (“8M”), while the other two were produced via SLM. Of the latter two, one received no post-processing (“8R”), and the other was grit-blasted (“8G”) [13]. The 8R swirler presented the highest roughness and the biggest changes in the flow field when compared with the smooth reference 8M. Data collected for these latter two swirlers, shown in Figure 2, was used to validate the current study. Average measured surface roughness values for the 8R swirler are collected in Table 1.
The numerically adjusted experimental axial velocities for the isothermal air flow conditions at an equivalent total mass flow of φ = 0.55 are shown in Figure 3. These Laser Doppler Anemometry (LDA) measurements were taken 5 mm downstream of the burner exit nozzle, starting from the centerline (r = 0) and ending just outside the burner nozzle. All the isothermal flow measurements were conducted with the quartz confinement tube removed from the HPGSB-2 [13]. The peak negative velocities are located at r = 0, thus suggesting the flow field is symmetric, as shown in several publications [28,29,30].
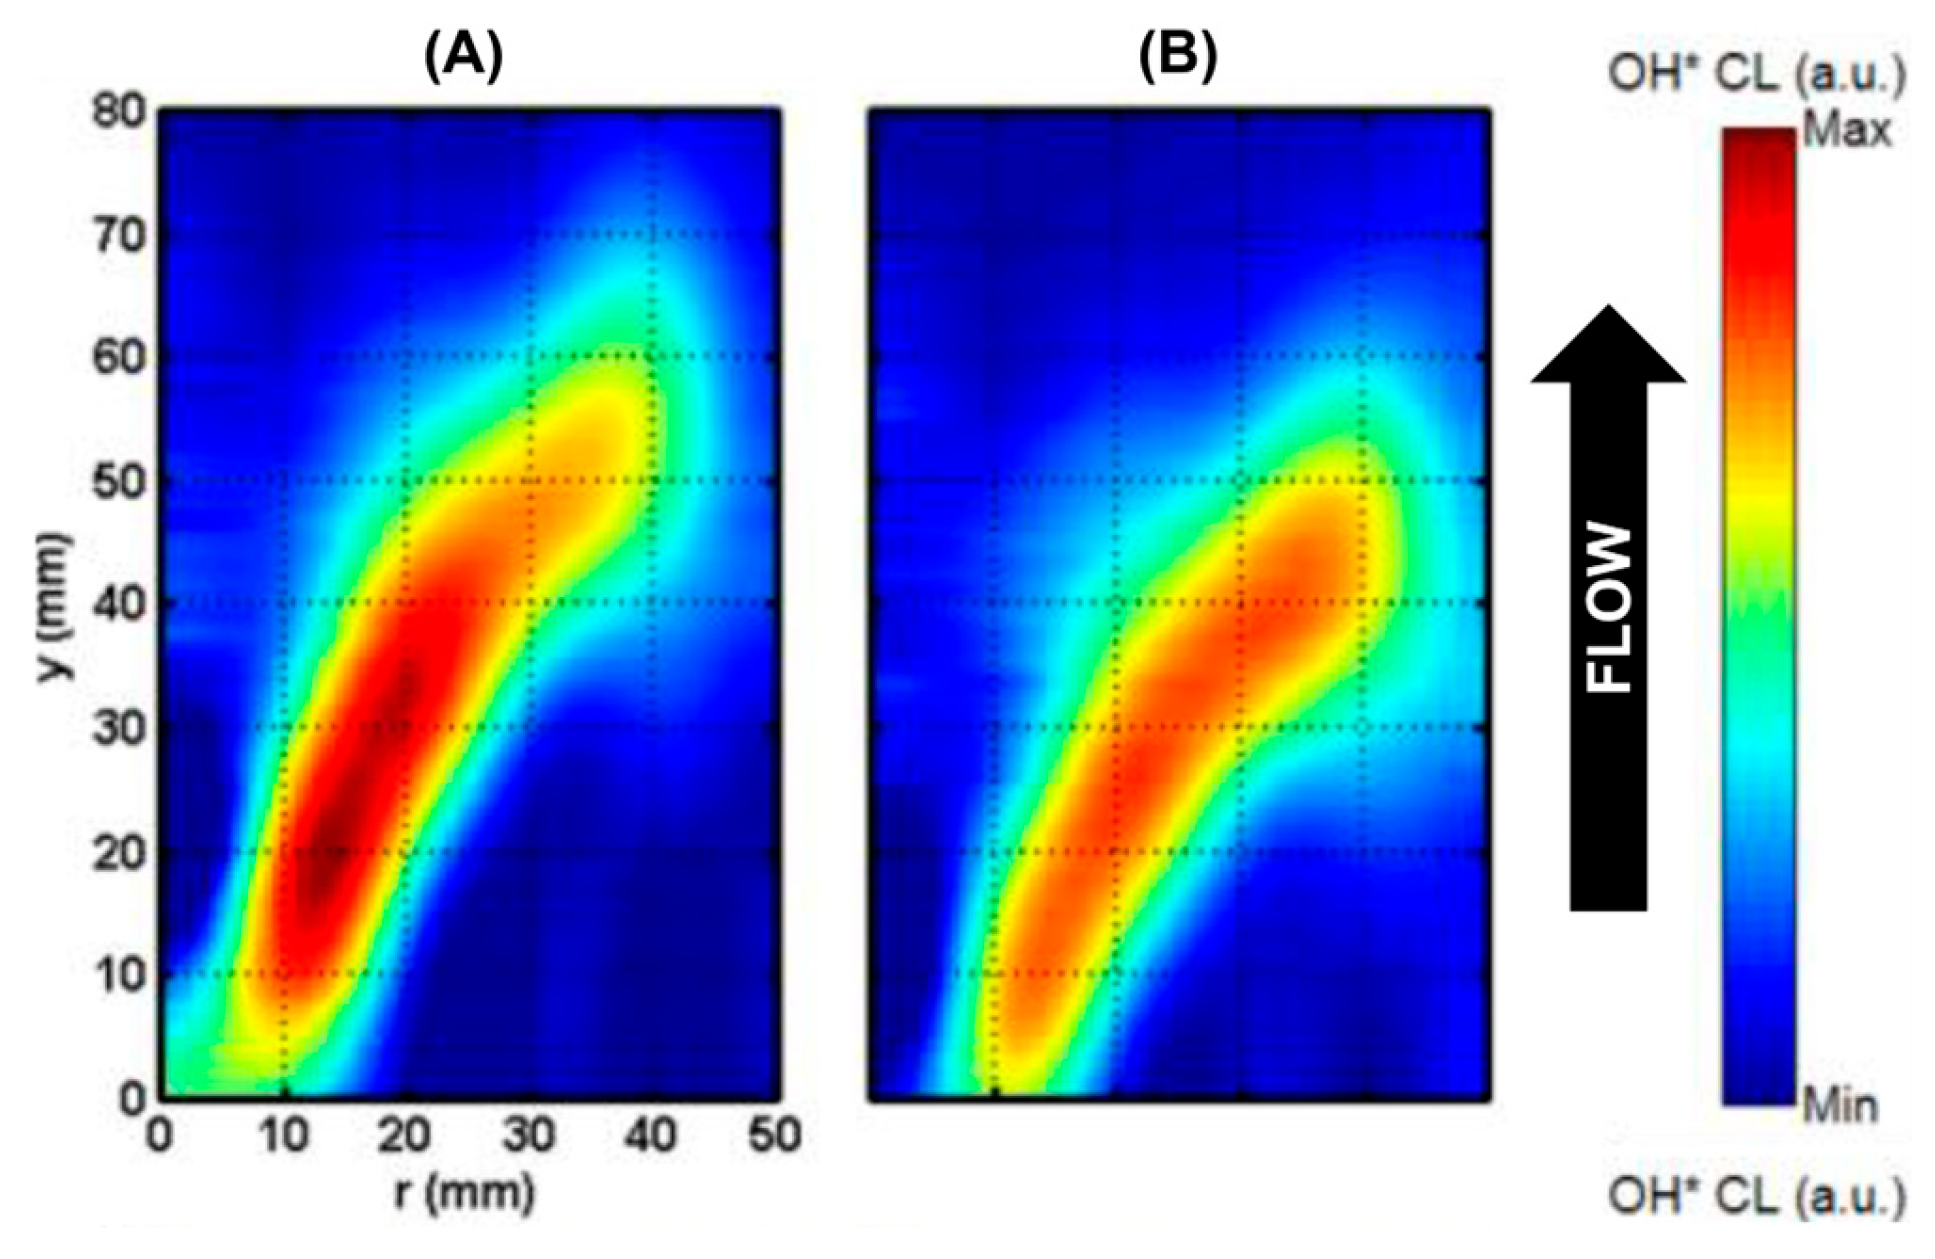
Abel-transformed OH* chemiluminescence images for 8R and 8M are shown in Figure 4. More information on the capture system can be found in Runyon et al. [13].

2.2. Roughness Parameter Selection

The function responsible for modeling roughness effects takes on different forms depending on the value of the roughness parameter, or so-called “Roughness Reynolds number”, k s + , defined in Equation (1) [31].
k s + = k s ρ u μ ,
The flow is considered smooth for k s + < 2.25, fully rough for k s + ≥ 90, and transitional for 2.25 ≤ k s + < 90 [32]. Given that density, velocity, and viscosity values will not change drastically between a smooth and rough simulation, ks is the main factor influencing the rough flow regime.
Many correlations for calculating ks can be found in the literature, often being defined for specific surface types and conditions. Furthermore, these correlations can be found to vary by over an order of magnitude for the same measured roughness values, as demonstrated in Figure 5. This graph was achieved by applying the measured “nozzle inner” roughness values of the 8R swirler (Table 1) to the correlations compiled by Bons [17] and proposed by Adams et al. [33]. Selecting an appropriate ks correlation is, therefore, mostly a matter of trial and error.
To optimize the chance of capturing roughness effects, it was decided to utilize the correlation that yielded the largest ks value. Equation (2), presented by Bons [17] and seemingly taken as an average of the values proposed by Barlow and Kim [34], was chosen. These ks values, utilized in the R1 simulations, should lead to transitional rough flow conditions.
k s 16 R a ,
Simulations with a ks value theoretically high enough to reach the fully rough regime ( k s + ≥ 90) were also performed (R2). To achieve this, a novel ks was derived following the procedure reported below. To find the appropriate roughness height for this condition, the equation defining k s + (Equation (1)) was rearranged to solve for ks, with k s + subsequently set to 90, as demonstrated in Equation (3).
k s = k s + μ ρ u k s 90 = 90 μ ρ u ,
Equation (3) was then applied to preliminary RANS simulations, performed utilizing the realizable K-Epsilon two-layer model (R2L), and surface averages of the various swirler faces were taken. To maintain the relative differences in roughness, a multiplication factor was found by dividing the estimated k s 90 by the respective measured roughness. The largest multiplication factor was applied to all measured roughness values, ensuring all surfaces satisfy k s + ≥ 90. The resulting correlation is
k s = 156 R a ,
It is crucial to emphasize that the above correlation was developed specifically using the geometry and flow conditions outlined in this study. As a result, Equation (4) may not yield satisfactory results when applied to different domains, flowrates, or fuel types. Instead, the methodology employed to derive this novel correlation, particularly the approach in Equation (3), may offer greater potential for broader applicability.
It is important to note that, when Equation (4) is applied to the measured roughness values of the 8M swirler [13], the ks values increased on average by only ~3.5% when compared with R2. If this user-defined correlation, therefore, accurately captures roughness effects, it can be said that the R1 simulations are representative of the 8M experimental conditions.
These ks values—obtained by applying Equation (4) to the 8M measured roughness (R2-8M), together with those utilized in the transitionally rough (R1) and fully rough (R2) simulations—are collected in Table 2.

2.3. CFD Domains

Separate domains were created for the reacting and isothermal cases. The quartz tube was removed for the isothermal measurements; thus, an expansion of approximately 8× would have been experienced going from the nozzle outlet (40 mm ⌀) to the HPOC walls (315 mm). The combustion chamber was, therefore, given a diameter of 200 mm, and all of its walls were set as pressure outlets. For the reacting cases, the quartz tube was not removed; thus, a combustion chamber with a 100 mm diameter was utilized. Downstream features were implemented to aid convergence, consistent with other works [35]. For both domains, the length of the plenum (0.245 m) was set to allow the flow to develop before reaching the swirler vanes. To reduce computing time, the plenum was shortened by 75% for all isothermal DES cases.
To ensure the creation of properly refined DES meshes, the integral length scale (L0), shown in Equation (5), was applied to the preliminary RANS R2L simulations [36].
L 0 = k 3 / 2 / ε ,
Suitable cell sizes were found via Equation (6), while Equation (7) was used to highlight areas that needed further refinement.
A p r o x   c e l l   s i z e = L 0 / 5 ,
Q = L 0 / c e l l   v o l u m e 1 / 3 ,
If Q < 5, the mesh should be refined further.
Prism layers were applied to surfaces of interest, with the first cell height being varied across the different faces to achieve an average y+ ≈ 1. The total height and number of prism layers were adjusted to ensure a smooth transition to the core mesh. The final DES meshes comprised ~12.4 million elements for the isothermal case and ~11 million elements for the reacting case. Both meshes are shown in Figure 6.

2.4. DES Setup

The following DES variants are available within STAR CCM+: DDES and IDDES. DDES combines RANS in the boundary layer with Scale-Resolving Simulation (SRS) in core flow regions. IDDES is a slightly modified version of DDES introduced to provide some WMLES (Wall-modeled LES) capabilities [37,38]. EB can only be run with DDES, while SST K-Omega can be run with both. Three different DES setups were, therefore, investigated: EB DDES, SST K-Omega DDES, and SST K-Omega IDDES. Smooth and rough simulations were performed for each setup, providing a total of nine isothermal and nine reacting simulations.
To find a suitable estimate for the timestep (∆t), the Courant Number condition (Co) was utilized.
C o = U t x t = x C o U ,
As a Co value close to unity is needed in the domain of interest, Equation (8), therefore, becomes a ratio of cell size over velocity:
t = x U c e l l   v o l u m e 1 / 3 U ,
The flow-through time (ftt) was estimated via the preliminary RANS simulations by performing a surface average of Ux in the XY plane and dividing it by the total geometry length. The shortened plenum enabled a flow-through time reduction of ∼10% for the isothermal cases. The final time steps and ftts utilized are collected in Table 3.
To achieve efficient convergence, 10 inner iterations were performed for each ∆t. Furthermore, the SIMPLEC implicit scheme was utilized as part of the segregated flow solver [25]. All DES simulations utilized data from the preliminary RANS simulations to initialize the flow field. To eliminate the effects of the initial conditions, a minimum of 3 ftts were run before time-averaging. Time-averaging was performed for a minimum of 5 ftts.

2.5. Physics Setup

The isothermal cases were initiated as follows. The segregated flow isothermal model was utilized, and the temperature was set to 573 K. The reference pressure was set to atmospheric (0.101 MPa), and the default STAR CCM+ material properties for air were left unchanged. For the preliminary RANS case, a mass flow inlet set to 16.1 g/s was used, while for the DES cases, this mass flow inlet was replaced with a velocity inlet, reading data from the reference RANS simulation. The reference inlet conditions for the CH4 cases are collected in Table 4.
The GRI-Mech 3.0 [39] reaction mechanism was utilized with the addition of OH* [40,41], similar to other works in the literature [42]. Segregated flow enthalpy was selected in conjunction with the thickened flame model. The latter was chosen as a less computationally intense yet reliable alternative to complex chemistry [35,43].

3. Results and Discussion

3.1. Velocity Profiles

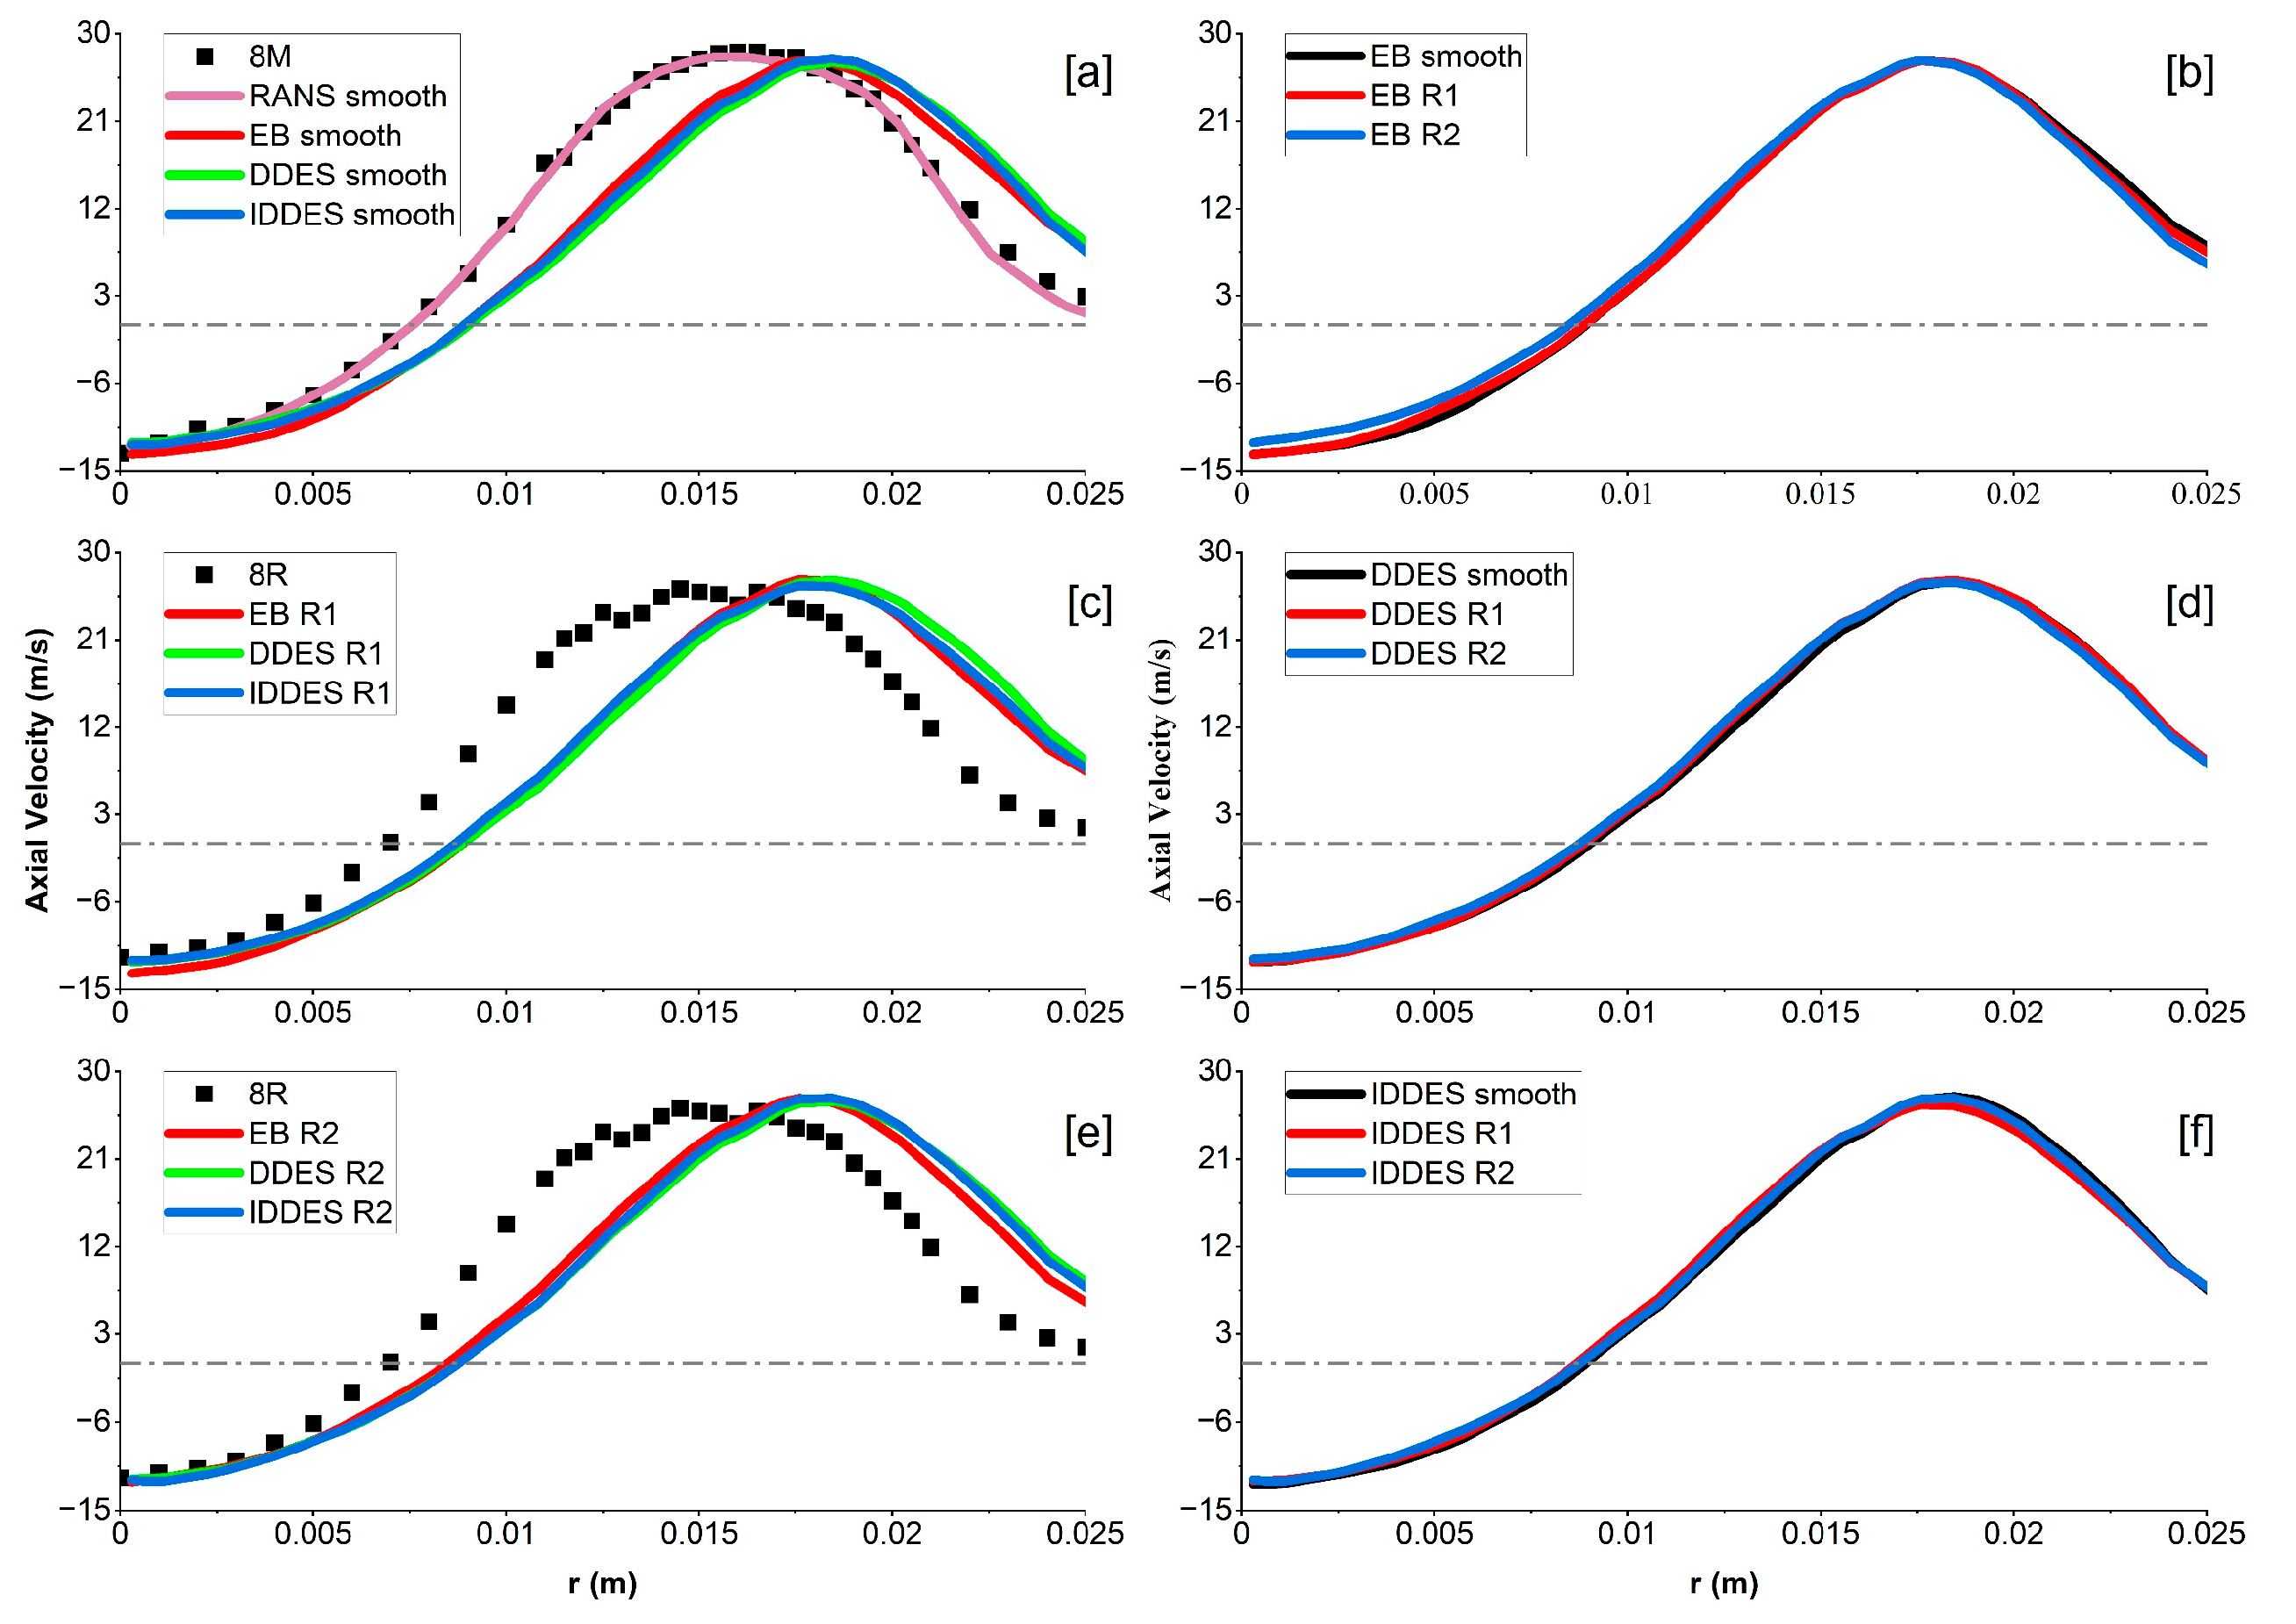
Given that the swirler assembly is made up of nine blades, a certain degree of asymmetry is imparted on the flow. For the sake of consistency, velocity and OH* data were taken from the same side across all simulations. Analysis of the various simulation results was started by investigating changes in the velocity flow fields. Axial velocity profiles for all simulations were taken 5 mm downstream of the burner nozzle exit, consistent with the experimental data. Figure 7 presents the roughness-induced velocity profile changes for each turbulence model, together with a comparison of all smooth, R1, and R2 simulated velocity profiles compared with the corresponding 8M and 8R experimental data.
The smooth reference RANS simulation (Figure 7a) performed with the R2L model presents a high degree of agreement, with the numerical data deviating by ~1% in the core flow (10 mm ≤ r ≤ 20 mm) compared with the 8M experimental data. All smooth DES cases present similar velocity profiles, with their overall shape deviating by an average of ~8% compared to the reference 8M data. This indicates the choice of turbulence model has a minor influence on the isothermal flow field. Experimentally, axial velocity profiles were found to shift radially inward, with peak velocities decreasing with increasing roughness [13]. For the R1 simulations (Figure 7c), no such trend was found. Rather, all R1 velocity profiles presented little to no deviation from their smooth counterparts. Minimal changes were also found when comparing EB simulations (Figure 7e). However, the EB R2 case appeared to be shifted more radially inward than the other two R2 cases, though no significant reduction in maximum velocity was detected. Overall, it can, therefore, be said that, while none of the isothermal rough simulations adequately captured the changes in axial velocity, the EB R2 case presented the greatest numerical shift.
Regardless of the DES model utilized, all simulations are shifted radially outward compared to the reference experimental data. Given that the roughness-induced shifts were not captured numerically, direct comparisons of the R1 and R2 cases cannot be undertaken. For the smooth cases, however, this outward radial shift appears to be roughly 2 mm. Observations made by Pereira et al. [44,45] help explain this unexpected shift. Their investigation of flows around cylinders found that simulation methods with higher physical resolutions, such as DES, produce larger and often overestimated recirculation regions [44,45].
When comparing the isothermal RANS R2L axial velocity flow field with that generated by the DES cases, as shown in Figure 8, similar conclusions can be drawn.
The DDES flow field shown in Figure 8 presents a much wider recirculation zone than that generated by the RANS simulation. Consequently, the flow exiting the nozzle is pushed outward, leading to a shift in the velocity profiles, as observed in Figure 7a. Having extracted the central recirculation zones from the respective zero-velocity iso-surfaces, all smooth DES simulations were found to have a ~29% wider and ~12% larger recirculation zone compared to the reference RANS simulation.
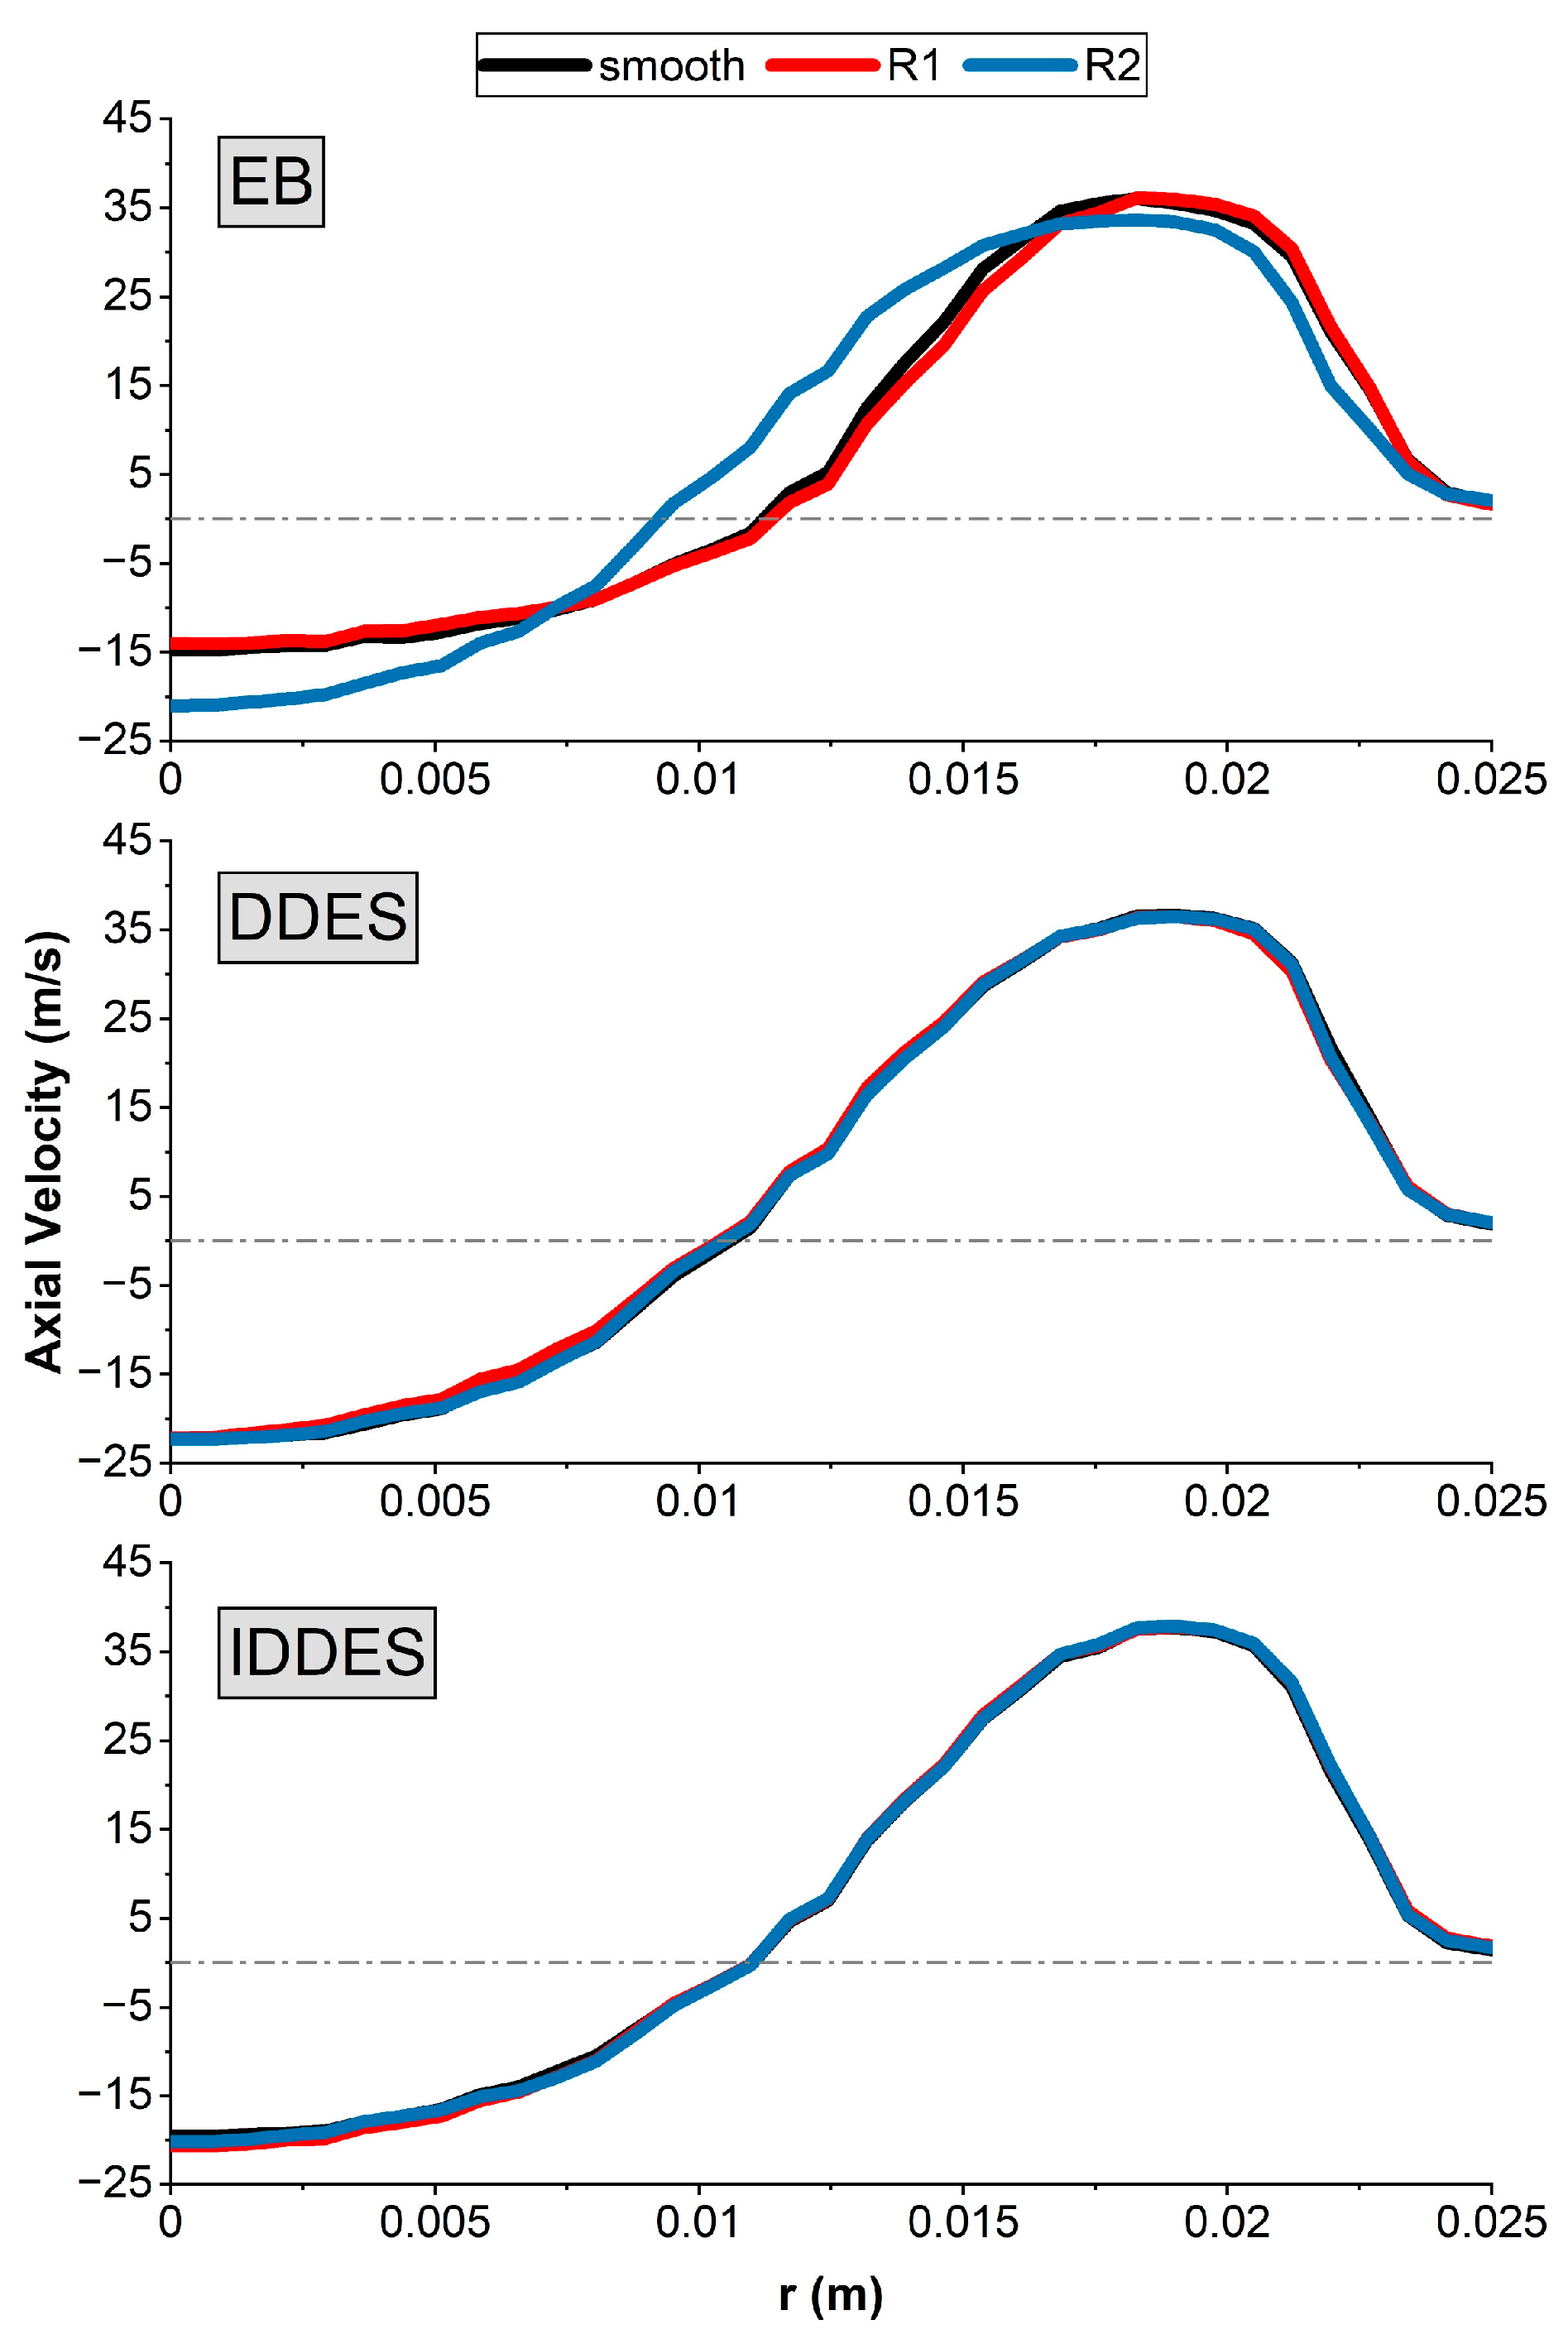
While experimental LDA data was not available for the fully premixed methane–air cases, axial velocity profiles were still collected for all simulations and plotted in Figure 9. Consistent with the results for the isothermal cases, minimal roughness effects were captured in all R1 cases. Furthermore, all velocity profiles captured with the IDDES and DDES models presented negligible radial shifts or reductions in maximum velocity with increasing roughness. Roughness effects were, however, captured in the EB R2 simulation. In this case, similar to what was observed in the reference experimental data [13], the maximum velocity was reduced by ~6.6% and shifted radially inward by 0.73 mm. It can also be seen that, for this latter case, a shift in magnitude and location not only occurred for the maximum positive velocity, but also for the maximum negative velocity, indicating significant changes in the strength of the recirculation zone and, thus, swirl number. This, therefore, suggests that the switch to reacting physics and, hence, the introduction of temperature gradients, density variations, and chemical interactions can have measurable effects on roughness sensitivity.

3.2. Swirl Numbers and Recirculation Zones

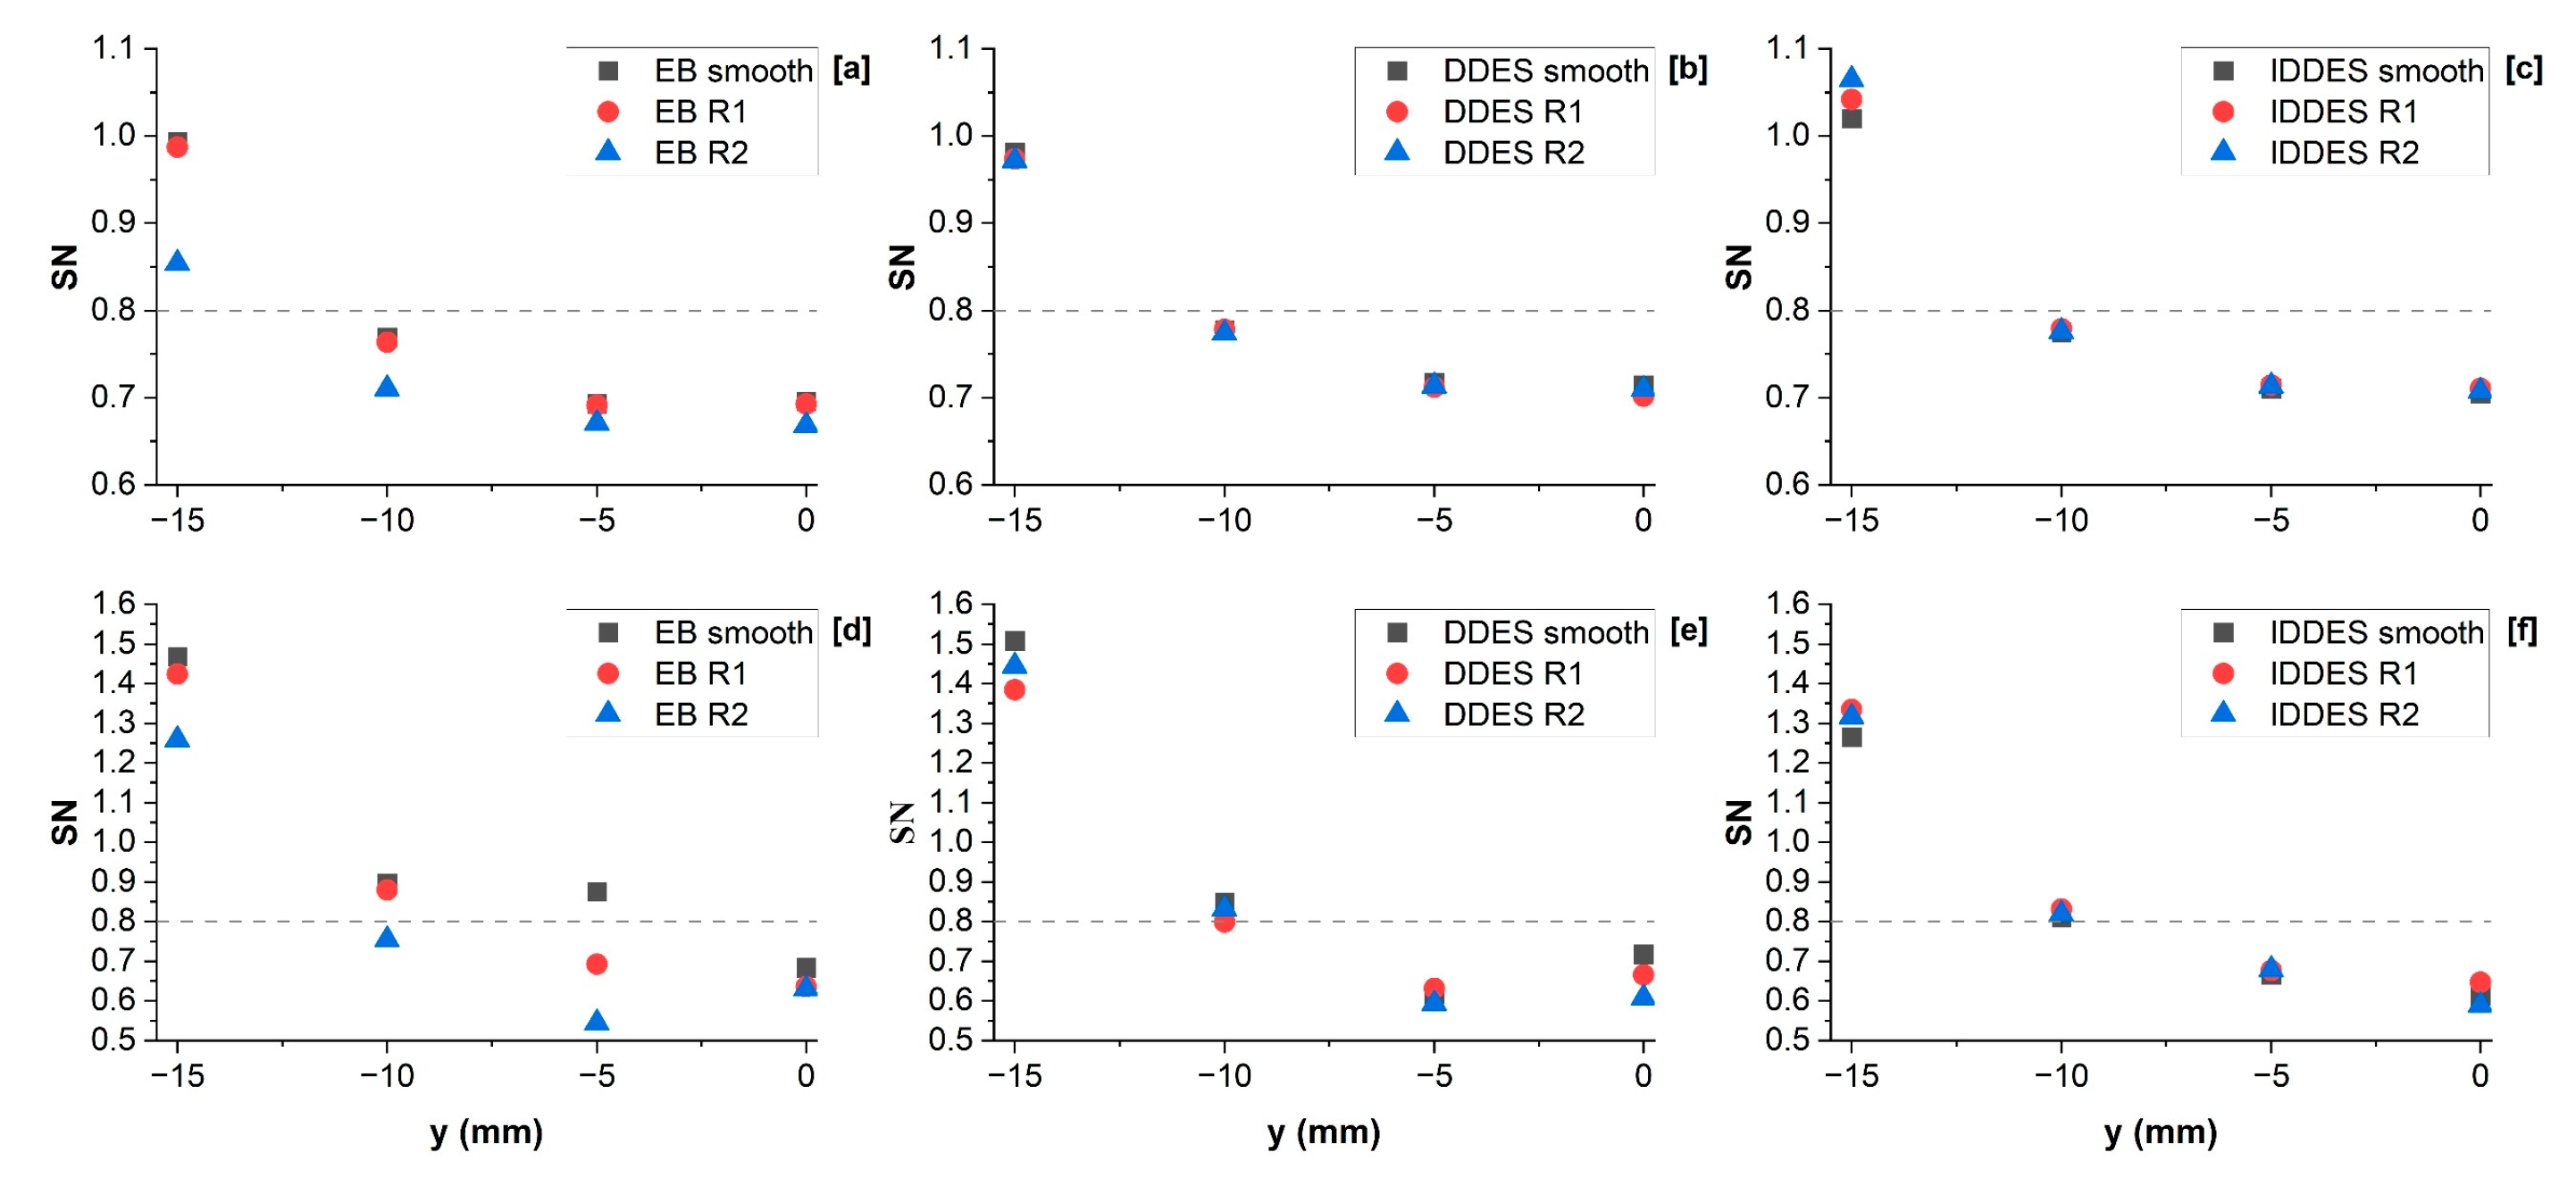
Investigations into the effect of the roughness on swirl number (SN) were then performed. To calculate swirl numbers in the numerical flow fields, Equation (10) was used [46]. Because the formulation for Sconv differs from that used to calculate swirl numbers geometrically, values obtained via Equation (10) are expected to deviate slightly. Vignat et al. [46], for instance, found that Sconv underpredicted Sg by ~20%.
S c o n v = 0 R l i m ρ U θ ¯ U ¯ x r 2 d r R n o z z l e 0 R l i m ρ U ¯ x 2 r   d r ,
Increased roughness on the nozzle walls has the potential to dampen tangential momentum; therefore, when looking at axial changes in SN within the burner nozzle, values for rough cases are expected to be lower than their smooth counterparts. To assess these changes in SN, line probes spaced 5 mm apart were placed across the burner nozzle, as shown in Figure 10.
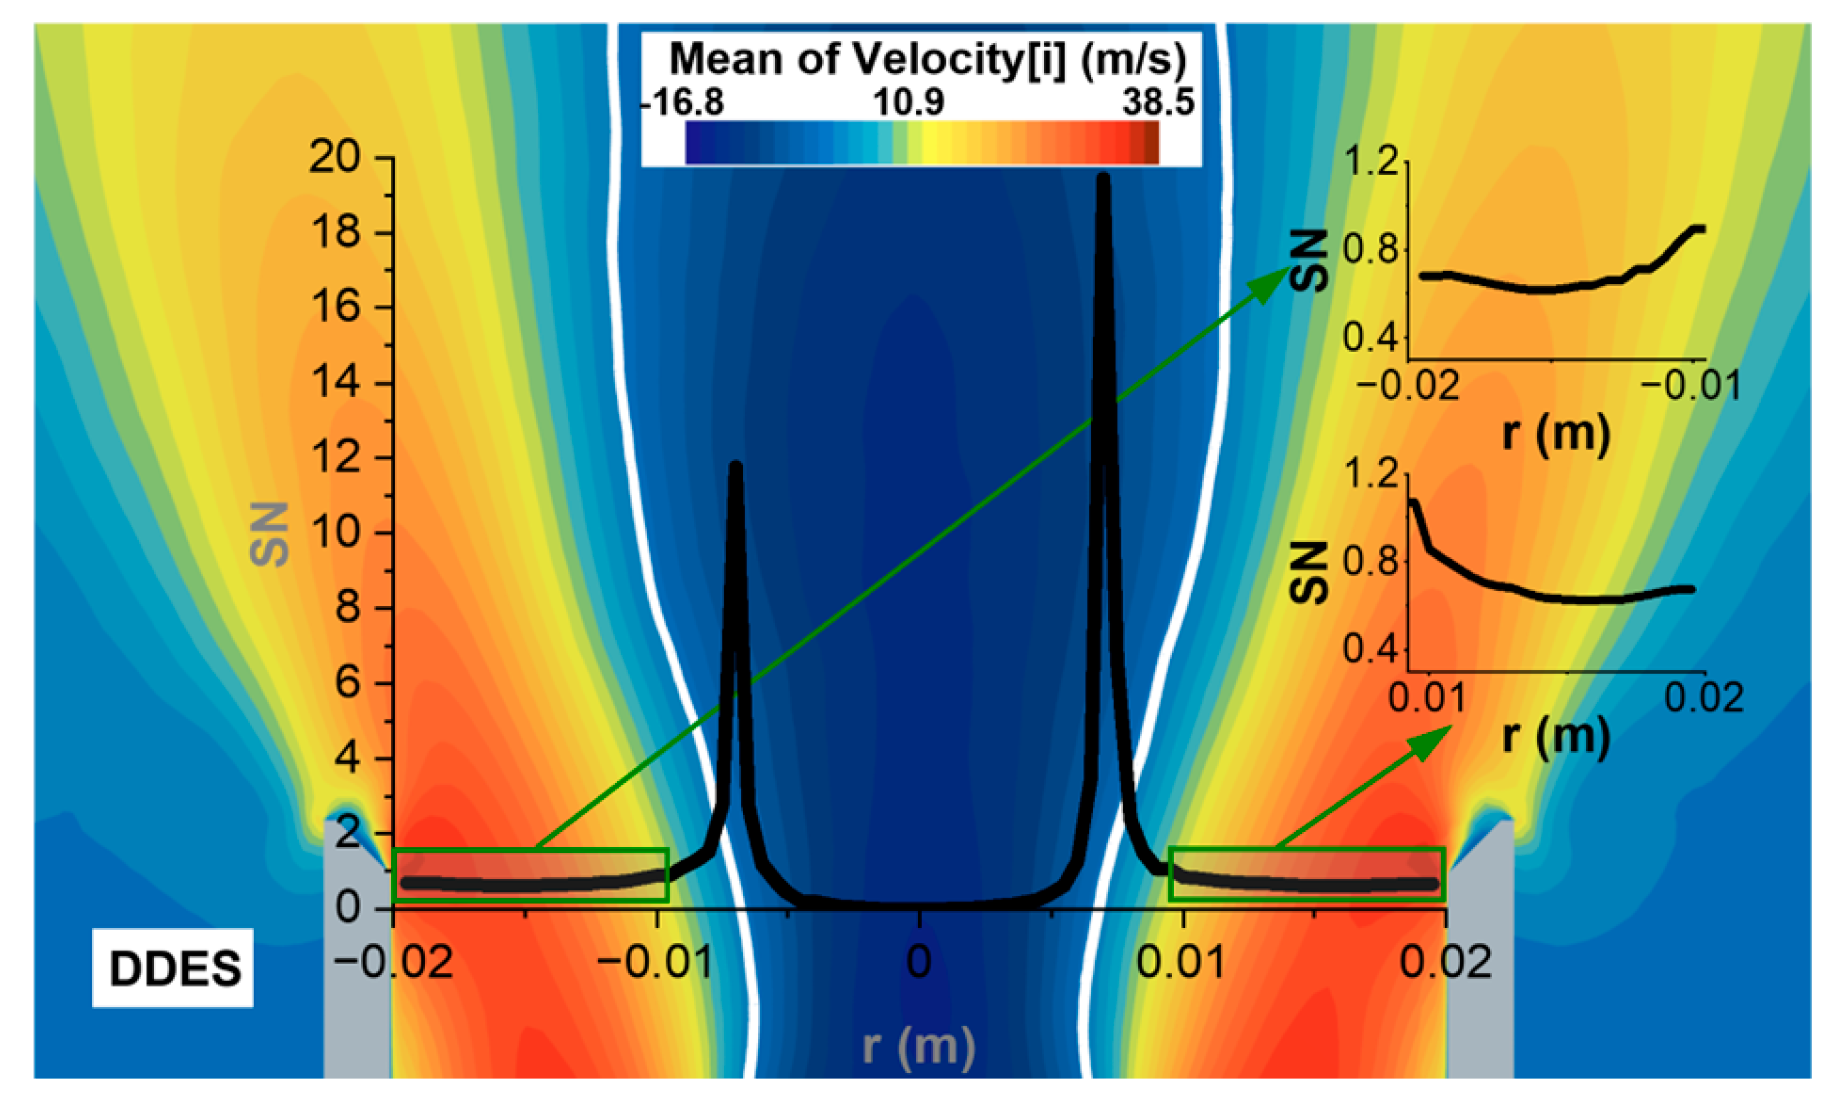
For the line probes spanning the entire width of the burner nozzle (L0–L10), SN values were found to change substantially depending on the radial coordinates, as shown in Figure 11.
As can be seen from Figure 11, stable swirl numbers are achieved in the outer quarters of the burner nozzle corresponding to the flow exit. Values rapidly increase in the shear layer, reaching a peak at the zero-velocity iso-surface, delimiting the inner recirculation zone due to rapidly decelerated axial momentum. Within the inner recirculation zone, SN values drop to near zero. Taking these factors into consideration, axial changes in SN were measured by averaging values for each line probe between ±0.009 ≤ r (m) ≤ ±0.02. Results for all isothermal and reacting simulations are collected in Figure 12.
Regardless of the model and roughness used, SN values can be seen to decrease as they reach the nozzle exit. SN values for the smooth cases were found to be consistent across the isothermal and reacting conditions, averaging a value of 0.688 at the nozzle exit. Similar to the isothermal velocity profiles, noticeable changes in SN are only observable for the EB R2 case, being 4% lower at the nozzle exit than the smooth counterpart. In the reacting simulations, negligible differences were found for the IDDES cases, while for both the EB and DDES cases, SN values can be seen to decrease with increasing roughness. This roughness-induced reduction in SN at the nozzle exit aligns with trends observed in previous isothermal simulations by Al-Ajmi et al. [47].
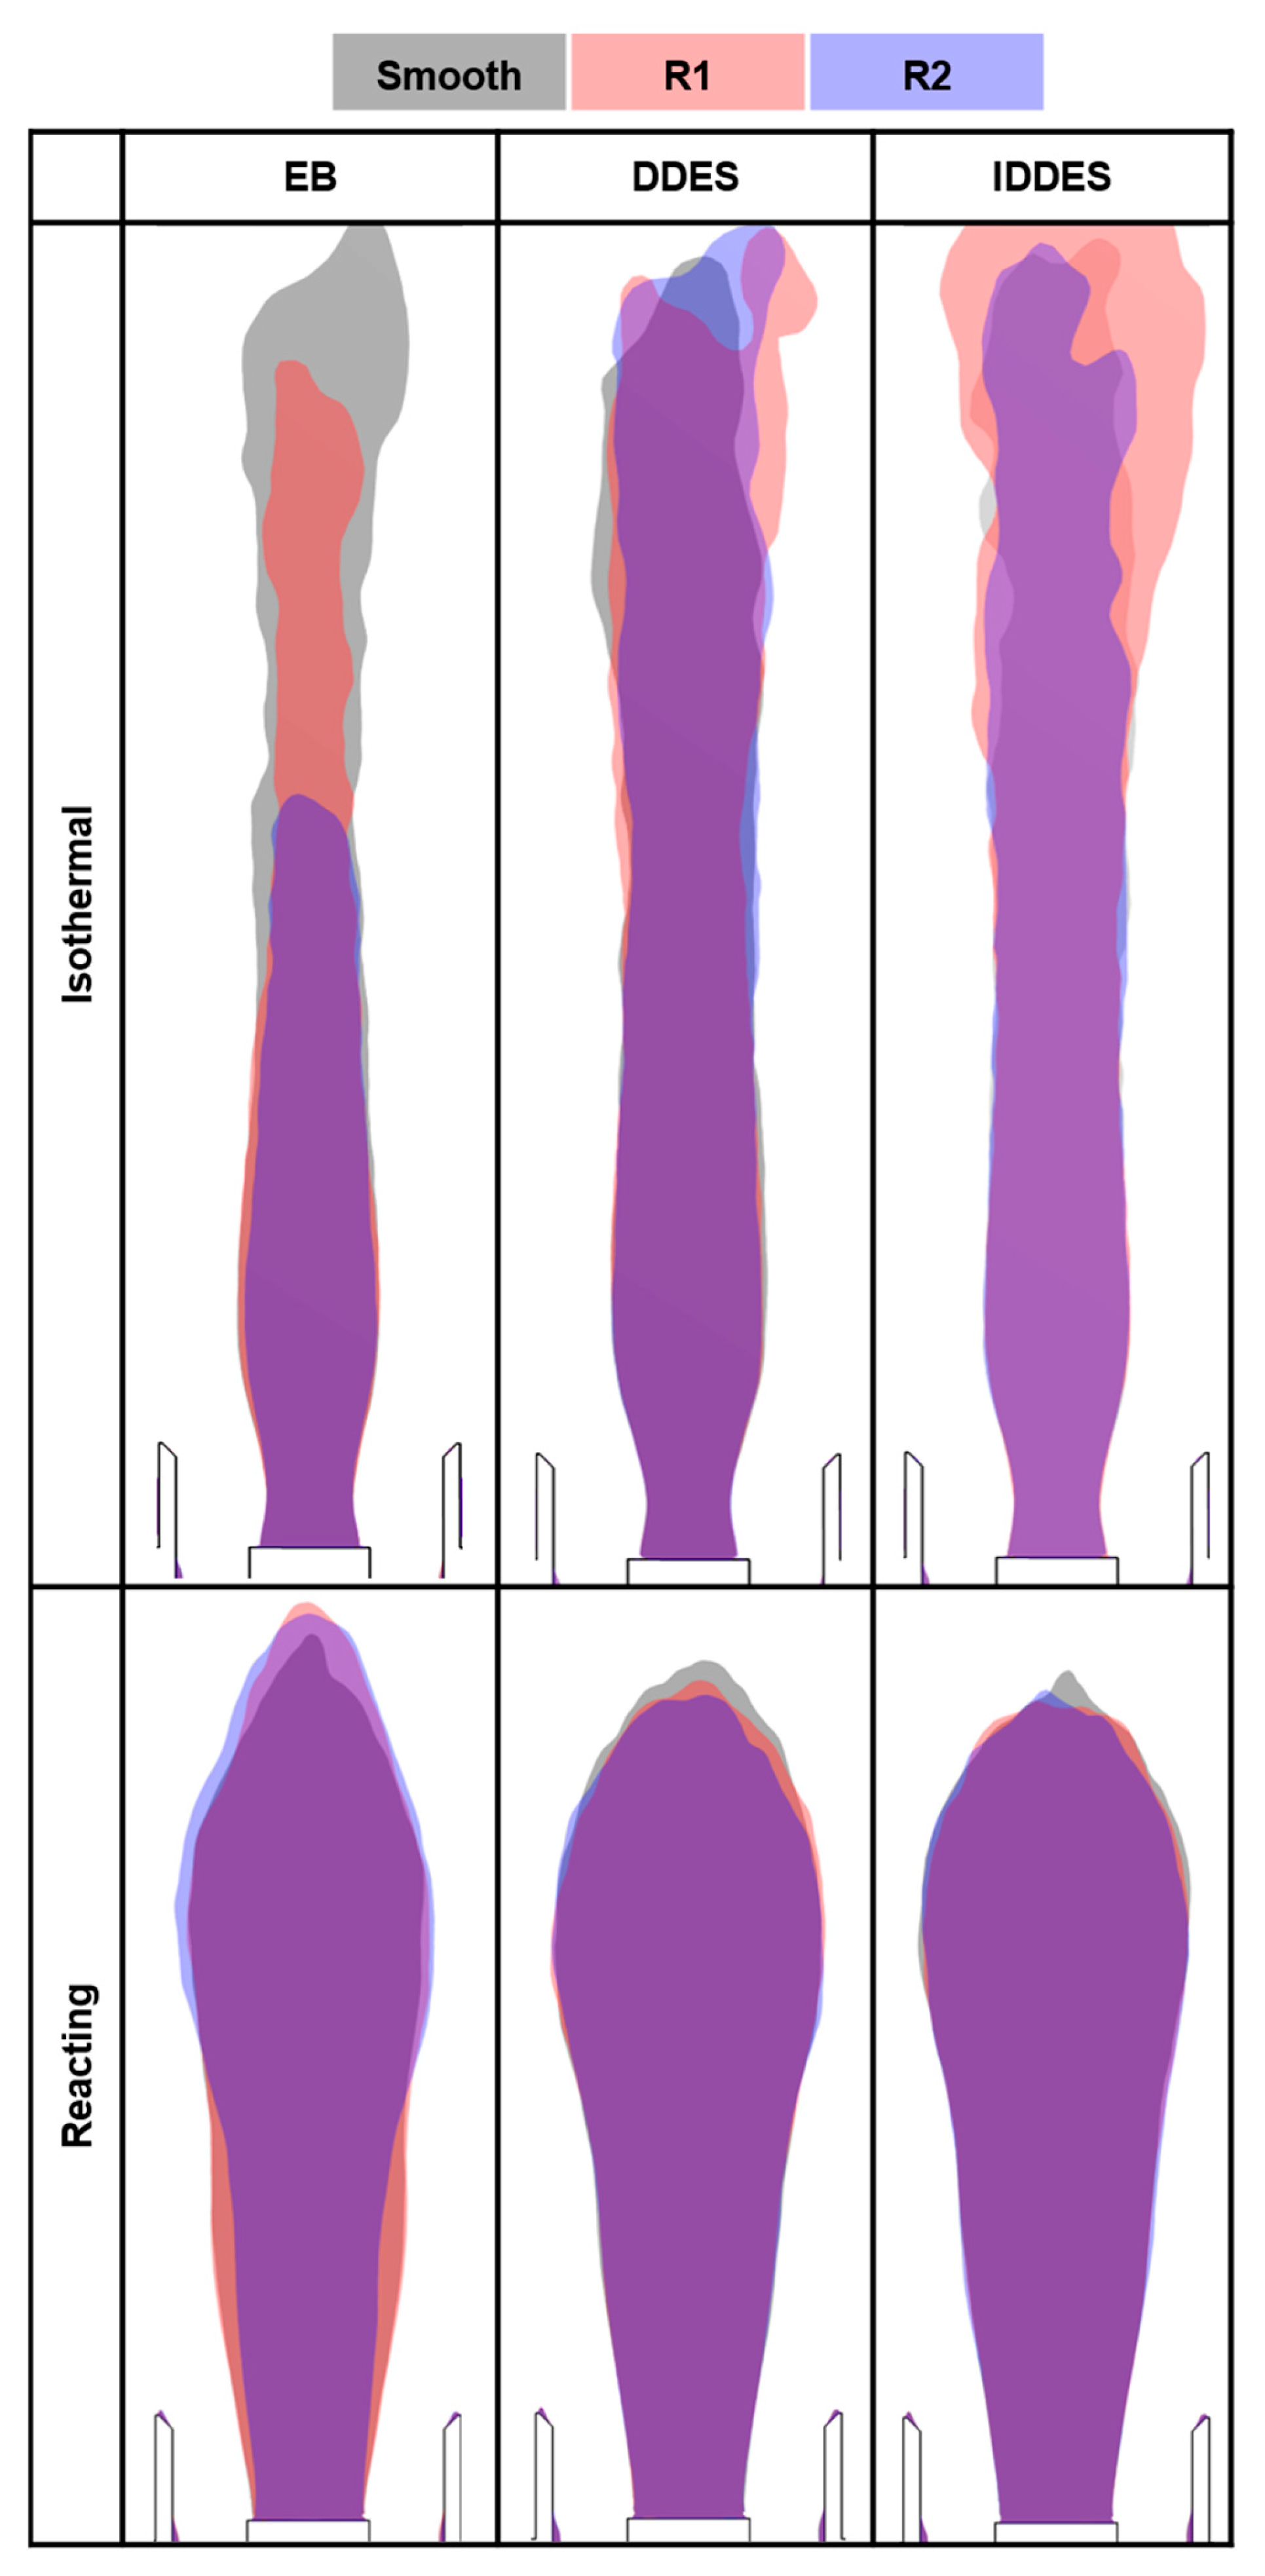
Changes in the inner recirculation zone were assessed via zero-velocity iso-surfaces. A visual representation of roughness-induced differences was achieved by overlaying recirculation zones attained with the same turbulence model, as shown in Figure 13.
The central recirculation zone can be seen to significantly reduce with increasing roughness for the isothermal EB cases. When comparing both the isothermal DDES and IDDES cases, on the other hand, no axial shifts are present, with differences only observable far away from the nozzle exit. For the reacting cases (Figure 13, bottom), two different behaviors are noted. The recirculation zone of the EB cases narrows radially with increasing roughness but does not shorten axially. For the DDES and IDDES cases, radial narrowing does not occur, but the recirculation zone can be seen to shrink axially with increasing roughness.

3.3. Effective k s + and Wall Shear Stress

Effective k s + and wall shear stress (τ) values were collected for the relevant swirler faces of each simulation. Faces were grouped based on the ks value utilized and surface averages performed. The k s + and τ results are presented in Figure 14 and Figure 15, respectively.
From Figure 14, k s + values can be seen to increase linearly with increasing ks. The choice of turbulence model was found to have negligible effects on the k s + values of the R1 simulations, with deviations being limited to a maximum of 7%. The average k s + value of the R1 simulations was found to be 12.66, meaning all R1 simulations were on the lower end of the rough transitional regime. Conversely, turbulence models had a measured effect on the R2 cases, with both the DDES and IDDES simulations presenting average k s + values, respectively, 24% and 28% lower than the EB ones. This being said, all R2 simulations were found to be in the fully rough regime, presenting a minimum average k s + > 100.
Values of τ can be seen to increase with increasing roughness, though the rate at which this occurs is strongly dependent on the turbulence model used, as shown in Figure 15. For the EB cases, the R1 simulations presented very marginal increases in τ, with significant increases only seen for the R2 simulations. All IDDES cases presented marginal increases in τ with increasing roughness, with R1 and R2 cases increasing on average by 4% and 8%, respectively. The DDES cases presented double the percentage increase of the respective IDDES cases, though these changes are still marginal.

3.4. Flame Location and Characteristics

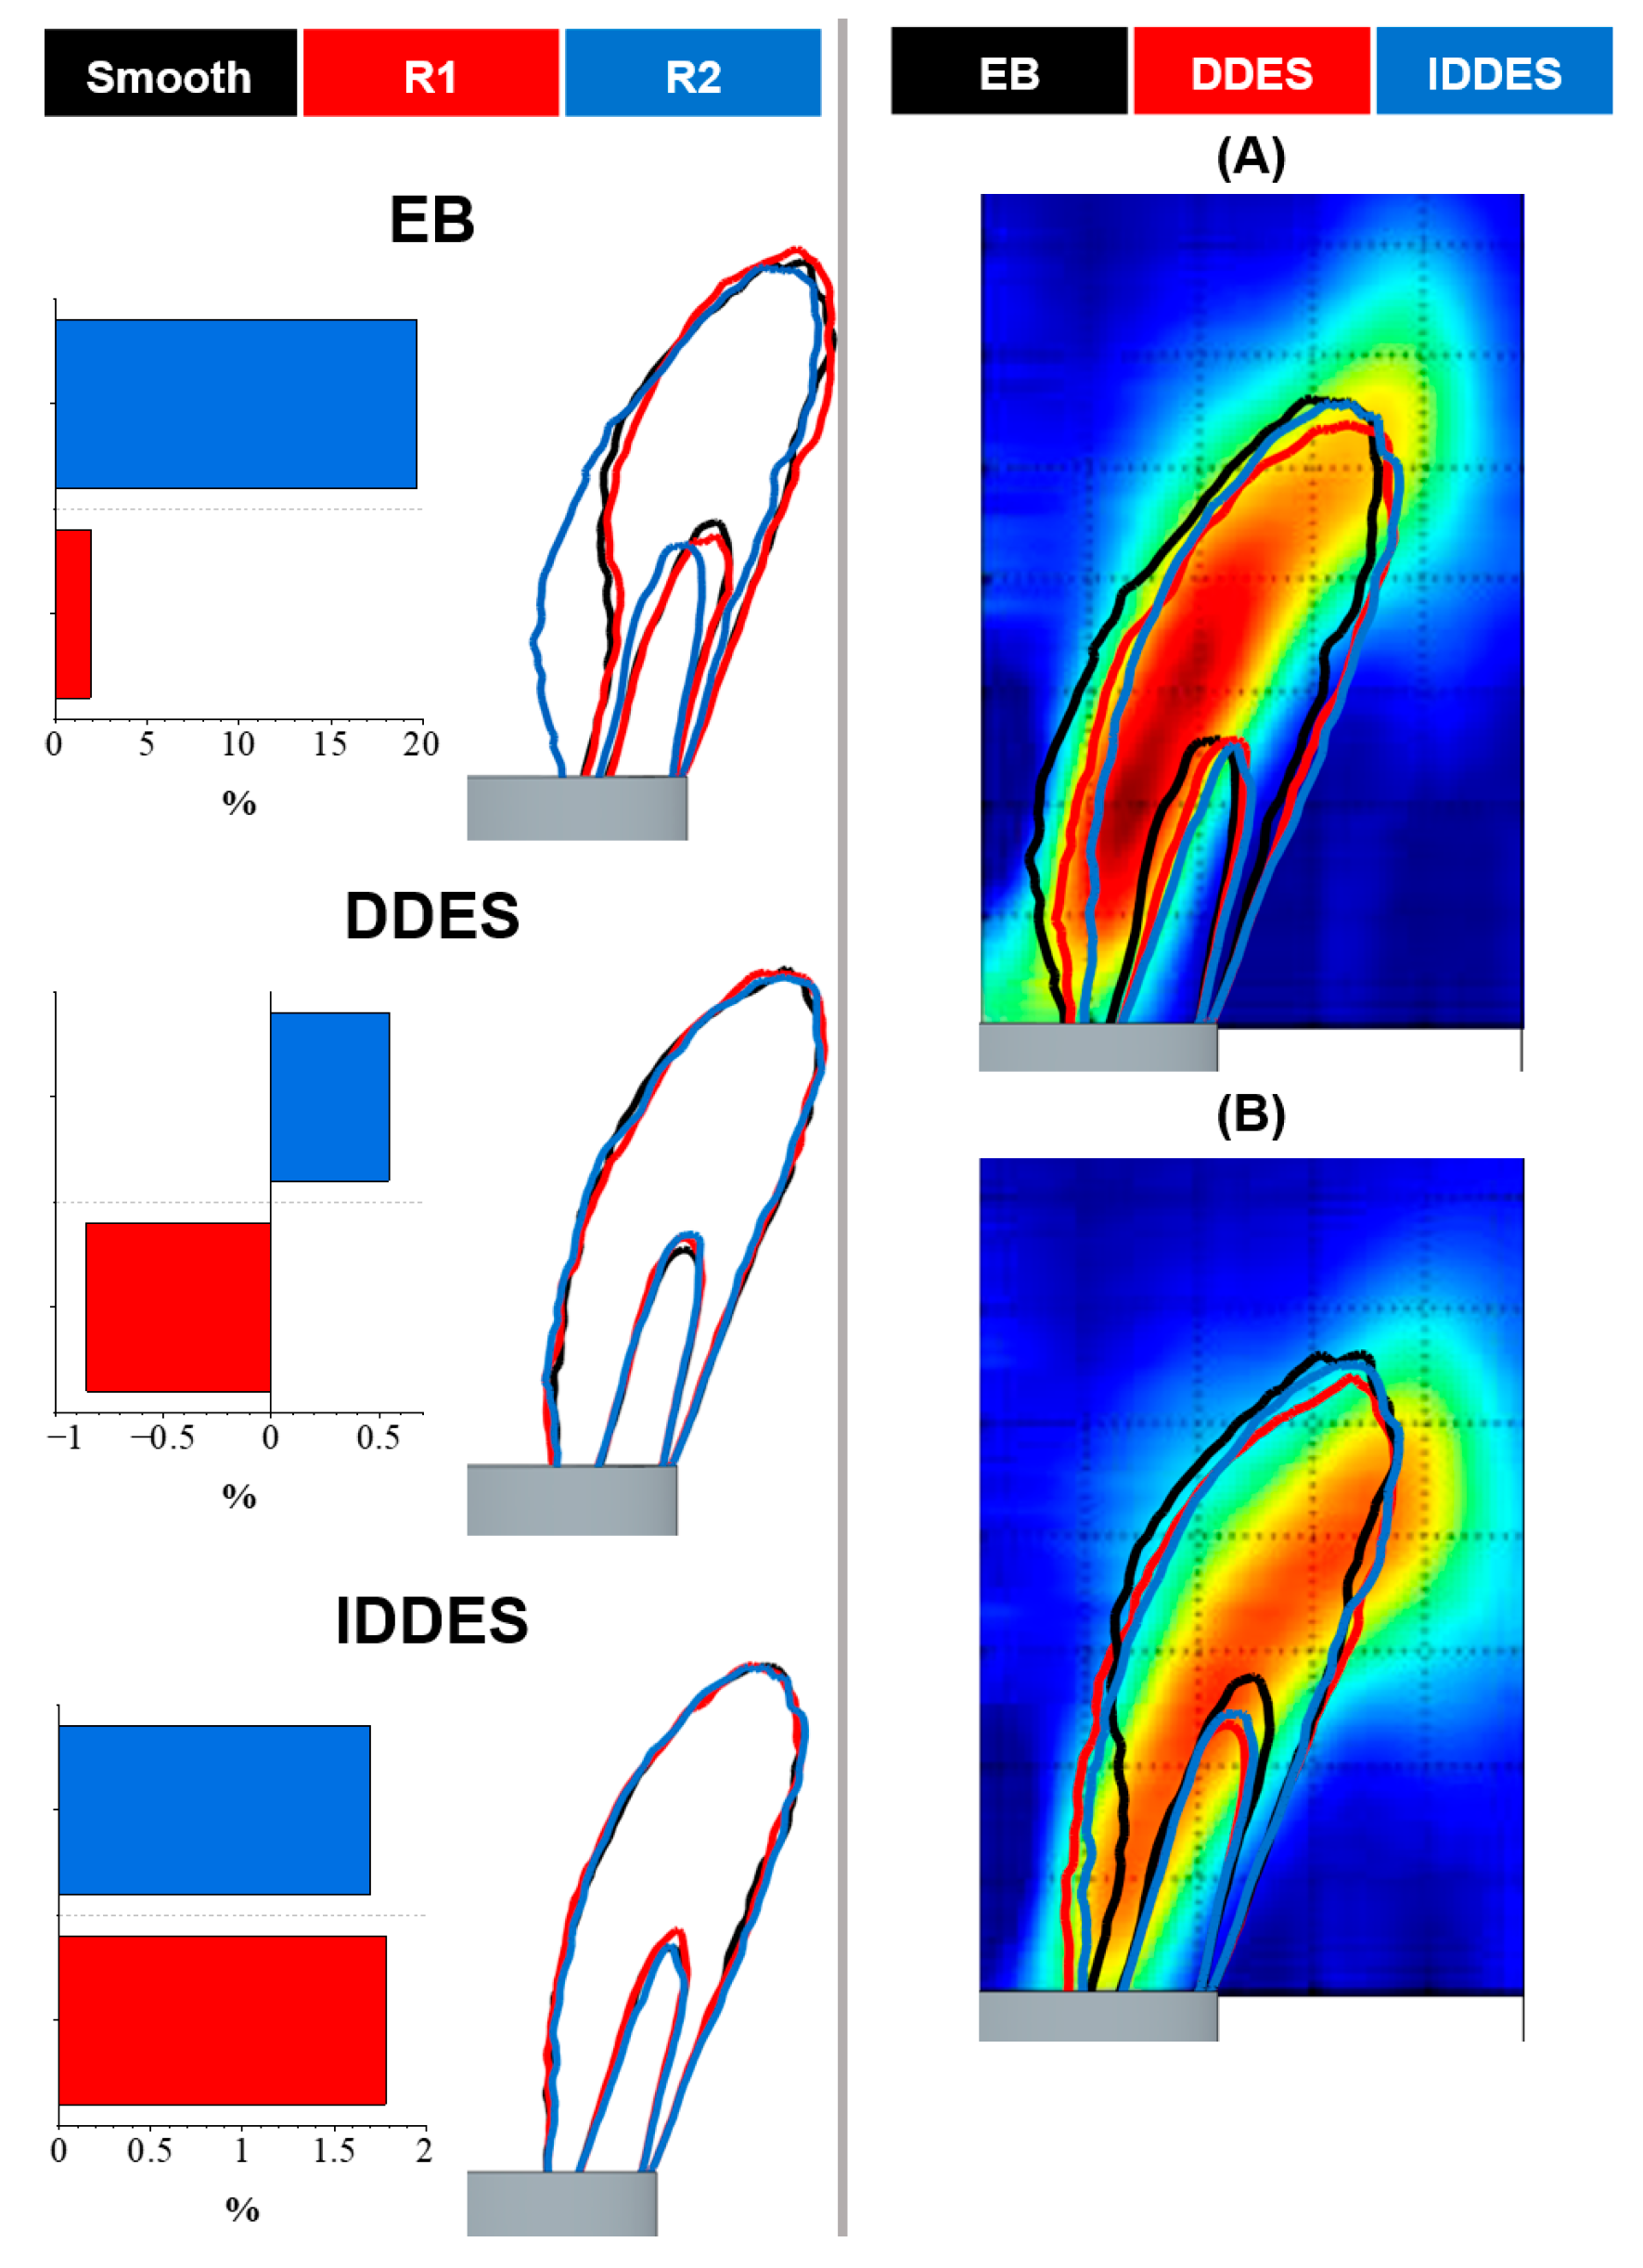
Previous experimental work has indicated that surface roughness could have a measurable effect on flame position, heat release, and emissions [13]. Assessments of changes in flame shape and position were undertaken using a single iso-surface of the OH* mass fraction, time-averaged over 0.44 s and applied to the XZ plane of each reacting simulation. The resulting iso-surfaces were both superimposed based on the turbulence model utilized and overlayed onto the respective experimental OH* Abel transform chemiluminescence images averaged over 0.5 s. Areas covered by the rough OH* iso-surfaces were normalized against their smooth counterparts to highlight percentile changes (Figure 16).
The results from Figure 16 show that all smooth simulations generated similar flame shapes with overall width, length, and positioning comparable to that of the experimental data. With regard to the rough cases, both DDES and IDDES simulations present minimal positioning and area deviations from the smooth references. Roughness effects were, however, captured with the EB turbulence model. The R2 flame presented a ~20% area increase and appeared to be wider and straighter than its smooth counterpart.
Centroids of each OH* iso-surface were calculated to visualize any radial and axial shifts in the flame position. Values calculated for the right side of the flame are collected in Figure 17.
The experimental centroid location was found to shift radially inward toward the nozzle ID (r = 20 mm) with increasing roughness, while its angle relative to the burner centerline was found to decrease with increasing surface roughness [13]. All smooth simulations present a good degree of similarity to the 8M centroid location. The IDDES smooth case matches the 8M reference best in the axial direction (deviation of ~1.5%) and the EB smooth case best in the radial direction (deviation of ~3%). Roughness effects were negligible for the IDDES cases, the roughly ± 0.02 mm radial shifts likely being due to unavoidable small variations between simulations. The rough DDES simulations also present minimal axial and radial shifts, but interestingly, the latter are ~10% of their respective EB values. The EB results (Figure 17) show the flame centroid shifts radially outward for the R1 case and radially inward for the R2 case. The radial position of the EB R2 centroid shows strong alignment with that of the 8R flame, with a deviation of approximately 1.5%. Furthermore, similar to what was found experimentally, the EB R2 case is ~1.5° closer to the burner centerline than the respective smooth case. While the outward shift was not expected, the radial location of the R1 case can be seen to deviate only by ~0.6% compared to the 8M flame, indicating a closer match than the smooth EB case. Given significant shifts were only seen in the EB R2 simulations and, as mentioned earlier in Section 2.2, the R1 ks values are in the same order of magnitude as the 8M-R2 ones, the small roughness effects captured by the R1 EB case are, therefore, representative of the 8M conditions (Figure 17).
The wider flame generated by the EB R2 (Figure 16) case suggests that, as was found in the previous experimental work, an increase in heat release with increasing roughness was captured numerically. To better verify this, the time-averaged OH* values of each simulation were normalized against the respective maximum OH* readings found in a constrained plane section covering the first 80 mm of the combustion chamber downstream of the burner exit nozzle. Results for all DES simulations are collected in Figure 18.
Once again, Figure 18 shows that negligible roughness effects are captured with the IDDES model, with significant effects only seen for the EB R2 case. The rough DDES cases present a marginally higher percentage of OH* in the flame body, with the R1 case showing higher values than the R2 case.
With regard to NOx emissions, while numerical simulations captured the observed reduction trends, it is difficult to make a statistically significant conclusion when the measured value falls within the uncertainty range of about 2 ppmV, considering the uncertainties related to analyzer linearization, span gas specifications, and the drift in the measurements.

4. Conclusions

The feasibility of modeling surface roughness effects using a high-fidelity, low-y+ approach on a generic swirl burner was evaluated under both isothermal and reacting conditions. Smooth reference cases were compared against rough simulations, where kₛ values were obtained from both literature-based and user-defined correlations. Three different DES variants were applied, and the results were validated against experimental data, with further analysis of roughness impacts on SN and central recirculation zone location performed. The choice of turbulence model and DES variant was found to influence sensitivity to roughness, with the EB–DDES combination producing the largest roughness-induced variations in k s + and τ. In the isothermal cases, numerical shifts in axial velocity profiles were consistently smaller than experimental measurements, regardless of correlation. In the reacting cases, however, roughness-induced shifts in velocity profiles and flame centroid location were observed, with the novel correlation (R2) demonstrating strong agreement with the experimental data. Both the central recirculation zone size and SN were found to decrease with increasing roughness.
The key findings of this work are as follows:
  • Of the three DES models investigated, EB exhibited the highest sensitivity to roughness in both isothermal and reacting conditions. This turbulence model should, therefore, be prioritized when employing a low-y+ mesh to capture roughness effects.
  • Literature-based ks correlations proved inadequate when coupled with a low-y+ approach. All reacting and isothermal simulations failed to capture meaningful roughness effects. Significant effects were captured only when applying the novel correlation developed in this work ( k s + > 90).
  • For identical kₛ values, roughness effects were more pronounced under reacting conditions, suggesting that correlations may need to be fluid and chemistry-specific.
Although the novel correlation demonstrated promising predictive capability, particularly under reacting conditions, its validity beyond the current test matrix remains uncertain. Application to alternative geometries, flow conditions, or fuels may not yield comparable accuracy. Nonetheless, the methodology used to derive this correlation offers potential for broader applicability.

Author Contributions

R.V.: Visualization, Writing—Original Draft, Writing—Review and Editing, Formal analysis, Methodology, Conceptualization, and Investigation. D.P.: Supervision, Writing—Review and Editing, and Conceptualization. B.G.: Writing—Review and Editing. P.J.B.: Funding Acquisition, Writing—Review and Editing. All authors have read and agreed to the published version of the manuscript.

Funding

This work was supported by the Engineering and Physical Sciences Research Council (EPSRC), Cardiff School of Engineering, and Siemens Energy through the Centre for Doctoral Training in Resilient Decarbonized Fuel Energy Systems [Grant Number EP/S022996/1]; the UKRI Industrial Decarbonizations Research and Innovation Centre (IDRIC); and the Supercomputing Wales project, which is partly funded by the European Regional Development Fund (ERDF) via the Welsh Government.

Data Availability Statement

The original contributions presented in this study are included in the article. Further inquiries can be directed to the corresponding author.

Conflicts of Interest

The authors declare no conflicts of interest.

Abbreviations

The following abbreviations are used in this manuscript:
εEnergy Dissipation Rate
tTime Step
xDistance Across a Cell
µDynamic Viscosity
8GGrit-Blasted ALM Swirler, Sg = 0.8
8MMachined Swirler, Sg = 0.8
8R“Raw” ALM Swirler, Sg = 0.8
AM Additive Manufacturing
BLFBoundary Layer Flashback
CFDComputational Fluid Dynamics
CoCourant Number
DDES Delayed Detached Eddy Simulation
DESDetached Eddy Simulation
EBElliptic Blending
ftt Flow-Through Time
HPGSB-2High-Pressure Generic Swirl Burner (Mk. II)
HPOCHigh-Pressure Optical Chamber
IDDESImproved Delayed Detached Eddy Simulation
kTurbulent Kinetic Energy
ksEquivalent Sand-Grain Roughness
L0Integral Length Scale
LDALaser Doppler Anemometry
Mass Flowrate
PBurner Ambient Pressure
QMesh Quality Indicator for DES
rRadial Coordinate
k s + Roughness Parameter
RaArithmetic Average Surface Roughness
RANSReynolds-Averaged Navier–Stokes Equations
RnozzleSwirler Nozzle Radius (20 mm)
RqRMS Surface Roughness
RzTen-Point Mean Surface Roughness
R1Transitionally Rough Simulations
R2Fully Rough Simulations
SconvConventional Swirl Number
SgGeometric Swirl Number
SLMSelective Laser Melting
SNSwirl Number
SRSScale Resolving Simulation
T1Inlet Temperature
ūMean Nozzle Exit Axial Velocity
UVelocity Magnitude
u*Velocity Scale
UxAxial Velocity
UθTangential Velocity
ρDensity
φEquivalence Ratio
y Axial Coordinate
τ Wall Shear Stress

References

  1. Dutta, B.; Babu, S.; Jared, B.H. Science, Technology and Applications of Metals in Additive Manufacturing; Elsevier: Amsterdam, The Netherlands, 2019. [Google Scholar]
  2. Srinivasan, D.; Ananth, K. Recent Advances in Alloy Development for Metal Additive Manufacturing in Gas Turbine/Aerospace Applications: A Review. J. Indian Inst. Sci. 2022, 102, 311–349. [Google Scholar] [CrossRef]
  3. Gebisa, A.W.; Lemu, H.G. Additive Manufacturing for the Manufacture of Gas Turbine Engine Components: Literature Review and Future Perspectives. In Volume 6: Ceramics; Controls, Diagnostics, and Instrumentation; Education; Manufacturing Materials and Metallurgy, Proceedings of the ASME Turbo Expo 2018: Turbomachinery Technical Conference and Exposition, Oslo, Norway, 11–15 June 2018; American Society of Mechanical Engineers: New York, NY, USA, 2018. [Google Scholar] [CrossRef]
  4. Navrotsky, V.; Graichen, A.; Brodin, H. Industrialisation of 3D printing (additive manufacturing) for gas turbine components repair and manufacturing. VGB PowerTech 2015, 12, 48–52. [Google Scholar]
  5. Durocher, A.; Fan, L.; Francolini, B.; Füri, M.; Bourque, G.; Sirois, J.; May, D.; Bergthorson, J.M.; Yun, S.; Vena, P. Characterization of a Novel Additive Manufacturing Micromix Nozzle Burning Methane to Hydrogen. J. Eng. Gas Turbines Power 2024, 146, 051009. [Google Scholar] [CrossRef]
  6. Andersson, O.; Graichen, A.; Brodin, H.; Navrotsky, V. Developing Additive Manufacturing Technology for Burner Repair. J. Eng. Gas Turbines Power 2017, 139, 031506. [Google Scholar] [CrossRef]
  7. Calignano, F.; Manfredi, D.; Ambrosio, E.P.; Iuliano, L.; Fino, P. Influence of process parameters on surface roughness of aluminum parts produced by DMLS. Int. J. Adv. Manuf. Technol. 2013, 67, 2743–2751. [Google Scholar] [CrossRef]
  8. Spierings, A.B.; Herres, N.; Levy, G. Influence of the particle size distribution on surface quality and mechanical properties in AM steel parts. Rapid Prototyp. J. 2011, 17, 195–202. [Google Scholar] [CrossRef]
  9. Bacchewar, P.B.; Singhal, S.K.; Pandey, P.M. Statistical modelling and optimization of surface roughness in the selective laser sintering process. Proc. Inst. Mech. Eng. Part B J. Eng. Manuf. 2007, 221, 35–52. [Google Scholar] [CrossRef]
  10. Shinonaga, T.; Kobayashi, H.; Okada, A.; Tsuji, T. Surface smoothing of additively manufactured Ti-6Al-4V alloy by combination of grit blasting and large-area electron beam irradiation. Int. J. Adv. Manuf. Technol. 2023, 127, 5127–5137. [Google Scholar] [CrossRef]
  11. Tyagi, P.; Goulet, T.; Riso, C.; Garcia-Moreno, F. Reducing surface roughness by chemical polishing of additively manufactured 3D printed 316 stainless steel components. Int. J. Adv. Manuf. Technol. 2019, 100, 2895–2900. [Google Scholar] [CrossRef]
  12. Giuliani, F.; Paulitsch, N.; Cozzi, D.; Görtler, M.; Andracher, L. An Assessment on the Benefits of Additive Manufacturing Regarding New Swirler Geometries for Gas Turbine Burners. In Volume 4A: Combustion, Fuels, and Emissions, Proceedings of the ASME Turbo Expo 2018: Turbomachinery Technical Conference and Exposition, Oslo, Norway, 11–15 June 2018; American Society of Mechanical Engineers: New York, NY, USA, 2018. [Google Scholar] [CrossRef]
  13. Runyon, J.; Giles, A.; Marsh, R.; Pugh, D.; Goktepe, B.; Bowen, P.; Morris, S. Characterization of Additive Layer Manufacturing Swirl Burner Surface Roughness and Its Effects on Flame Stability Using High-Speed Diagnostics. J. Eng. Gas Turbines Power 2020, 142, 041017. [Google Scholar] [CrossRef]
  14. Ebi, D.; Bombach, R.; Jansohn, P. Swirl flame boundary layer flashback at elevated pressure: Modes of propagation and effect of hydrogen addition. Proc. Combust. Inst. 2021, 38, 6345–6353. [Google Scholar] [CrossRef]
  15. Ding, S.; Huang, K.; Han, Y.; Valiev, D. Numerical study of the influence of wall roughness on laminar boundary layer flashback. Phys. Rev. Fluids 2021, 6, 023201. [Google Scholar] [CrossRef]
  16. Al-Fahham, M.; Hatem, F.A.; Alsaegh, A.S.; Valera Medina, A.; Bigot, S.; Marsh, R. Experimental Study to Enhance Resistance for Boundary Layer Flashback in Swirl Burners Using Microsurfaces. In Volume 4A: Combustion, Fuels and Emissions, Proceedings of the ASME Turbo Expo 2017: Turbomachinery Technical Conference and Exposition, Charlotte, NC, USA, 26–30 June 2017; American Society of Mechanical Engineers: New York, NY, USA, 2017. [Google Scholar] [CrossRef]
  17. Bons, J.P. A review of surface roughness effects in gas turbines. J. Turbomach. 2010, 132, 021004. [Google Scholar] [CrossRef]
  18. Lu, M.-H.; Liou, W.W. Assessment of Two Low-Reynolds-Number k-e Models in Turbulent Boundary Layers with Surface Roughness. J. Spacecr. Rocket. 2007, 44, 1307–1316. [Google Scholar] [CrossRef]
  19. Krasilnikov, V.; Skjefstad, V.S.; Koushan, K.; Rambech, H.J. A Calibration Study with CFD Methodology for Self-Propulsion Simulations at Ship Scale. J. Mar. Sci. Eng. 2023, 11, 1342. [Google Scholar] [CrossRef]
  20. McClain, S.T.; Hodge, B.K.; Bons, J.P. Predicting Skin Friction and Heat Transfer for Turbulent Flow Over Real Gas Turbine Surface Roughness Using the Discrete Element Method. J. Turbomach. 2004, 126, 259–267. [Google Scholar] [CrossRef]
  21. Aupoix, B. Revisiting the Discrete Element Method for Predictions of Flows Over Rough Surfaces. J. Fluids Eng. 2016, 138, 031205. [Google Scholar] [CrossRef]
  22. Bons, J.P.; McClain, S.T.; Wang, Z.J.; Chi, X.; Shih, T.I. A Comparison of Approximate Versus Exact Geometrical Representations of Roughness for CFD Calculations of cf and St. J. Turbomach. 2008, 130, 021024-1. [Google Scholar] [CrossRef]
  23. Kapsis, M.; He, L.; Li, Y.S.; Valero, O.; Wells, R.; Krishnababu, S.; Gupta, G.; Kapat, J.; Schaenzer, M. Multiscale Parallelized Computational Fluid Dynamics Modeling Toward Resolving Manufacturable Roughness. J. Eng. Gas Turbines Power 2020, 142, 021001. [Google Scholar] [CrossRef]
  24. Stripf, M.; Schulz, A.; Bauer, H.-J. Modeling of Rough-Wall Boundary Layer Transition and Heat Transfer on Turbine Airfoils. J. Turbomach. 2008, 130, 021003. [Google Scholar] [CrossRef]
  25. Siemens Digital Industries Software. Simcenter STAR-CCM+ User Guide, version 2021.1; Siemens Digital Industries Software: Plano, TX, USA, 2021. [Google Scholar]
  26. Runyon, J.; Marsh, R.; Bowen, P.; Pugh, D.; Giles, A.; Morris, S. Lean methane flame stability in a premixed generic swirl burner: Isothermal flow and atmospheric combustion characterization. Exp. Therm. Fluid Sci. 2018, 92, 125–140. [Google Scholar] [CrossRef]
  27. Pugh, D.; Bowen, P.; Valera-Medina, A.; Giles, A.; Runyon, J.; Marsh, R. Influence of steam addition and elevated ambient conditions on NOx reduction in a staged premixed swirling NH3/H2 flame. Proc. Combust. Inst. 2019, 37, 5401–5409. [Google Scholar] [CrossRef]
  28. Chigier, N.A.; Bee’r, J.M. Velocity and Static-Pressure Distributions in Swirling Air Jets Issuing From Annular and Divergent Nozzles. J. Basic Eng. 1964, 86, 788–796. [Google Scholar] [CrossRef]
  29. Roux, S.; Lartigue, G.; Poinsot, T.; Meier, U.; Bérat, C. Studies of mean and unsteady flow in a swirled combustor using experiments, acoustic analysis, and large eddy simulations. Combust. Flame 2005, 141, 40–54. [Google Scholar] [CrossRef]
  30. Wang, S.; Yang, V.; Hsiao, G.; Hsieh, S.-Y.; Mongia, H.C. Large-eddy simulations of gas-turbine swirl injector flow dynamics. J. Fluid Mech. 2007, 583, 99–122. [Google Scholar] [CrossRef]
  31. Cebeci, T.; Bradshaw, P. Momentum Transfer in Boundary Layers; Hemisphere Publishing Corp.: Washington, DC, USA, 1977. [Google Scholar]
  32. Blocken, B.; Stathopoulos, T.; Carmeliet, J. CFD simulation of the atmospheric boundary layer: Wall function problems. Atmos. Environ. 2007, 41, 238–252. [Google Scholar] [CrossRef]
  33. Adams, T.; Grant, C.; Watson, H. A Simple Algorithm to Relate Measured Surface Roughness to Equivalent Sand-grain Roughness. Int. J. Mech. Eng. Mechatron. 2012, 1, 66–71. [Google Scholar] [CrossRef]
  34. Barlow, D.N.; Kim, Y.W. Effect of Surface Roughness on Local Heat Transfer and Film Cooling Effectiveness; American Society of Mechanical Engineers: Houston, TX, USA, 1995. [Google Scholar]
  35. Castellani, S.; Nassini, P.C.; Andreini, A.; Meloni, R.; Pucci, E.; Valera-Medina, A.; Morris, S.; Goktepe, B.; Mashruk, S. Numerical Modeling of Swirl Stabilized Lean-Premixed H2–CH4 Flames with the Artificially Thickened Flame Model. J. Eng. Gas Turbines Power 2024, 146, 061019. [Google Scholar] [CrossRef]
  36. Basu, S.; DeMarco, A.W.; He, P. On the Dissipation Rate of Temperature Fluctuations in Stably Stratified Flows. Environ. Fluid Mech. 2021, 21, 63–82. [Google Scholar] [CrossRef]
  37. Shur, M.L.; Spalart, P.R.; Strelets, M.K.; Travin, A.K. A hybrid RANS-LES approach with delayed-DES and wall-modelled LES capabilities. Int. J. Heat Fluid Flow 2008, 29, 1638–1649. [Google Scholar] [CrossRef]
  38. Gritskevich, M.S.; Garbaruk, A.V.; Schütze, J.; Menter, F.R. Development of DDES and IDDES Formulations for the k-ω Shear Stress Transport Model. Flow Turbul. Combust. 2012, 88, 431–449. [Google Scholar] [CrossRef]
  39. Smith, G.P.; Golden, D.M.; Frenklach, M.; Moriarty, N.W.; Eiteneer, B.; Goldenberg, M.; Bowman, C.T.; Hanson, R.K.; Song, S.; Gardiner, W.C., Jr.; et al. The ‘GRIMech 3.0’ Chemical Kinetic Mechanism. 1999. Available online: http://combustion.berkeley.edu/gri-mech/version30/text30.html (accessed on 5 March 2024).
  40. Kathrotia, T. Reaction Kinetics Modeling of OH*, CH*, and C2* Chemiluminescence; German Aerospace Center (DLR): Cologne, Germany, 2011. [Google Scholar]
  41. Burcat, A. Prof. Burcat’s Thermodynamic Data. 2006. Available online: http://garfield.chem.elte.hu/Burcat/burcat.html (accessed on 28 May 2024).
  42. Panoutsos, C.; Hardalupas, Y.; Taylor, A. Numerical evaluation of equivalence ratio measurement using OH∗ and CH∗ chemiluminescence in premixed and non-premixed methane–air flames. Combust. Flame 2009, 156, 273–291. [Google Scholar] [CrossRef]
  43. Detomaso, N.; Hok, J.-J.; Dounia, O.; Laera, D.; Poinsot, T. A generalization of the Thickened Flame model for stretched flames. Combust. Flame 2023, 258, 113080. [Google Scholar] [CrossRef]
  44. Pereira, F.S.; Vaz, G.; Eça, L.; Girimaji, S.S. Simulation of the flow around a circular cylinder at Re = 3900 with Partially-Averaged Navier-Stokes equations. Int. J. Heat Fluid Flow 2018, 69, 234–246. [Google Scholar] [CrossRef]
  45. Pereira, F.S.; Vaz, G.; Eça, L. Evaluation of RANS and SRS methods for simulation of the flow around a circular cylinder in the sub-critical regime. Ocean Eng. 2019, 186, 106067. [Google Scholar] [CrossRef]
  46. Vignat, G.; Durox, D.; Candel, S. The suitability of different swirl number definitions for describing swirl flows: Accurate, common and (over-) simplified formulations. Prog. Energy Combust. Sci. 2022, 89, 100969. [Google Scholar] [CrossRef]
  47. Al-Ajmi, R.; Al-Shaghdari, M.; Goktepe, B.; Psomoglou, I.; Bowen, P. Critical Appraisal of Integrated Computational Fluid Dynamics/Surface Roughness Models for Additive Manufactured Swirl Burners. J. Eng. Gas Turbines Power 2025, 147, 091016. [Google Scholar] [CrossRef]
Figure 1. Section view of HPGSB-2 with Sg = 0.8 radial/tangential swirler and quartz tube installed (flow from left to right).
Energies 18 05240 g001
Figure 2. Swirler inserts: (A) 8R, (B) 8M, and (C) CAD model with critical dimensions.
Energies 18 05240 g002
Figure 3. Axial velocity profiles at equivalent air flow to φ = 0.55. Dotted horizontal line indicating 0 velocity.
Energies 18 05240 g003
Figure 4. φ = 0.55: Abel-transformed OH* chemiluminescence images for (A) 8R and (B) 8M.
Energies 18 05240 g004
Figure 5. Comparison of different ks correlations for the same measured roughness value [17,33].
Energies 18 05240 g005
Figure 6. Cross-section of CFD domain showing the mesh for the (A) isothermal and (B) reacting DES cases (flow from left to right).
Energies 18 05240 g006
Figure 7. Comparison of simulated isothermal axial velocity profiles against experimental data (a,c,e). Roughness effects on simulated isothermal axial velocity profiles for EB (b), DDES (d), and IDDES (f) cases. Dotted horizontal line indicating 0 velocity.
Energies 18 05240 g007
Figure 8. Isothermal velocity flow field comparison: time-averaged DDES (right) and RANS R2L (left).
Energies 18 05240 g008
Figure 9. Reacting axial velocity profiles for all DES turbulence models and roughness heights. Dotted horizontal line indicating 0 velocity.
Energies 18 05240 g009
Figure 10. XY-plane cross-section of nozzle showing line probe location for SN analysis.
Energies 18 05240 g010
Figure 11. Isothermal DDES axial velocity with overlay of Sconv taken at L0. White line defines the inner recirculation zone.
Energies 18 05240 g011
Figure 12. Changes in SN within burner nozzle. Isothermal (ac); reacting (df). Dotted horizontal line indicating SN = 0.8.
Energies 18 05240 g012
Figure 13. Overlayed isothermal [top] and reacting [bottom] inner recirculation zone boundaries for all DES cases.
Energies 18 05240 g013
Figure 14. Average k s + values of swirler surfaces for isothermal (a) and reacting (b) simulations.
Energies 18 05240 g014
Figure 15. Average τ values of swirler surfaces for isothermal (a) and reacting (b) simulations.
Energies 18 05240 g015
Figure 16. Comparison of OH* profiles for each DES modeling approach with % area change relative to the respective smooth profiles (left). Comparison of simulated R2 (A) and smooth (B) OH* profiles with experimental OH* Abel-transformed chemiluminescence data.
Energies 18 05240 g016
Figure 17. OH* centroid shift for all reacting cases with angles relative to burner centerline. Smooth (8M) and rough (8R) experimental values for reference.
Energies 18 05240 g017
Figure 18. Normalized mass fraction of OH* for all DES simulations.
Energies 18 05240 g018
Table 1. Average surface roughness measurements for the 8R swirler.
MeasurementRa (µm)Rq (µm)Rz (µm)
Nozzle Inner 8.8810.9753.61
Swirler Base11.0914.9278.11
Swirler Curve8.3110.2950.01
Swirler Flat Length8.5910.6454.06
Table 2. R2-8M ks values, together with ks values utilized in the R1 and R2 rough simulations, with the figure highlighting the swirler faces to which each roughness height was applied.
R1 (mm)R2 (mm)R2-8M (mm)Energies 18 05240 i001
Nozzle
inner
0.1431.380.217
Swirler base0.1771.730.274
Swirler curve0.1331.300.104
Swirler flat length0.1371.340.196
Table 3. Time steps and flow-through times for DES cases.
t (s)ftt (s)
Isothermal1 × 10−50.0834
Reacting1.25 × 10−50.069
Table 4. Summary of experimental conditions for φ = 0.55.
P (MPa)T1 (K)ṁ CH4 (g/s)ṁ Air (g/s)
0.115730.515.6
Disclaimer/Publisher’s Note: The statements, opinions and data contained in all publications are solely those of the individual author(s) and contributor(s) and not of MDPI and/or the editor(s). MDPI and/or the editor(s) disclaim responsibility for any injury to people or property resulting from any ideas, methods, instructions or products referred to in the content.