Article

PV Cell Temperature Prediction Under Various Atmospheric Conditions †

Department of Engineering Thermodynamics, Heat Engines, Thermal and Refrigeration Equipment, Faculty of Mechanical Engineering and Mechatronics, National University of Science & Technology POLITEHNICA Bucharest, Splaiul Independentei, 313, 060042 Bucharest, Romania
*
Authors to whom correspondence should be addressed.
This paper is an extended version of our paper published in the 16th International Conference on Thermal Engineering ICTEA, Bucharest, Romania, 18–20 June 2025.
Energies 2025, 18(19), 5239; https://doi.org/10.3390/en18195239
Submission received: 10 September 2025 / Revised: 26 September 2025 / Accepted: 30 September 2025 / Published: 2 October 2025

Abstract

The present study analyses various mathematical models from the technical literature for calculating photovoltaic cell temperature, emphasizing wind velocity as a key parameter. Since cell temperature significantly affects photovoltaic module efficiency, researchers are actively pursuing simple and cost-effective cooling methods for these systems. First, the study surveys existing mathematical models for computing cell temperature and evaluates how model parameters affect calculations. Second, it demonstrates computational outcomes using selected formulae—chosen based on criteria outlined in the paper—to predict PV cell temperatures under varying wind conditions using meteorological data from Bucharest, Romania. The analysis employs a transient mathematical model based on a single ordinary differential equation, validated against experimental data from previous studies. The results reveal circumstances where alternative mathematical approaches produce similar outcomes, alongside situations where substantial discrepancies emerge. The investigation concludes by contrasting computational forecasts against empirical observations, providing valuable guidance for future research in this domain.

1. Introduction

Photovoltaics are part of ongoing efforts to produce more clean energy. To assess how to better integrate them into the current configuration of electricity production/consumption systems, researchers are focusing, among other things, on improving the simulation tools available. An important part of these tools is photovoltaic (PV) module cell temperature prediction, because this temperature strongly influences the PV efficiency, meaning that as temperature increases, efficiency decreases. Because many mathematical models have been proposed, which include simple, complex, steady-state, and dynamic models, the question that arises now is which one is better and under what conditions?
In this context, 25 different empirical models to calculate PV cell temperature have been compared by means of machine learning models in [1]. They included both wind-dependent and wind-independent models, and were compared with results obtained by experimental measurements. Also, two new models were proposed by the authors. In another study [2], LabVIEW software was used to monitor, model, and simulate the behaviour of the PV module and obtained, among other things, the cell temperature. The equation proposed by Markvart [3] has been used to calculate the solar cell temperature. A mathematical model to predict the behaviour of a PV module, both from electrical and thermal means, has been presented in [4]. The model was validated with experimental data and was used to evaluate the temperature distribution in the module. In ref. [5], the authors compared experimental measurements for three different days with three mathematical models: Markvart’s independent of wind model, a wind-dependent one proposed by Sandia National Laboratories, and a model developed by the authors, based on three equations representing the thermal balance for the PV module layers. They concluded that, depending on the wind speed, different models perform better in some cases than others. In ref. [6], the authors investigated the accuracy of different models to predict the PV cell temperature in the climatic conditions of Errachidia city (31°55′55″ N, 4°25′28″ W) in southeast Morocco by comparing their results with experimentally obtained values for two different types of modules: amorphous (a-Si) and monocrystalline (m-Si). They revealed that for both types of modules, the models that include the wind are better at predicting temperature compared with those that are independent of wind. The authors of ref. [7] performed experiments on a multi-crystalline silicon PV module installed on the roof of the mechanical engineering building at the University of Mersin campus (36.8° N and 34.5° E) during a summer day and a winter day. They used the measurements to validate a mathematical model, including thermal and electrical analysis. The authors investigated the influence of weather components—solar radiation, ambient temperature, and wind speed—on cell temperature and acknowledged that the first two have a higher impact compared with wind speed. In ref. [8], a review is presented regarding existing mathematical models used to calculate PV cell temperature. The study included 33 correlations and showed that wind direction has an insignificant influence on the result. Also, they suggested appropriate measurement methods to ensure that the correct values are obtained. In [9], an energy balance model has been validated with experimental data. A heat transfer equation based on experimental data has also been proposed. An analysis of different models to calculate the PV cell temperature has also been presented in [10]. The authors conducted the study for building integrated photovoltaic panels (BIPV) and investigated the accuracy of the nominal operating cell temperature (NOCT) model and the Sandia National Laboratory temperature prediction model (SNL). The results showed that both models overestimate in every studied case. Existing PV cell temperature prediction models (developed for land-based systems) have also been tested in order to assess their applicability for floating (FPV) PV modules [11]. These models have been refined using specific FPV data obtained from large-scale projects. The results revealed a significant improvement in cell temperature prediction accuracy (reduced MAE and improved R2) through optimization of the parameters, with important adjustments of wind and convection effects. The refined models confirm that FPV systems have increased responsiveness to convective actions compared to land-based ones, probably due to evaporative cooling. A multiple linear regression model has been proposed in [12] that estimates PV module temperature by incorporating under-explored factors such as wind direction and precipitation alongside traditional variables. The model presents superior accuracy (R2 = 0.9674, RMSE = 1.35, MAE = 1.11) compared to existing literature models. Validation has been performed using data recorded over two years in a tropical semiarid climate, and the model is adaptable to different geographical areas. In [13], the authors developed a predictive approach for photovoltaic cell temperature using physics-informed neural networks (PINN) combined with an ordinary differential equation to model thermal exchange between modules and their surroundings. Testing conducted at a solar facility in Zhejiang province, China, shows excellent performance with R2 coefficients ranging from 0.96 to 0.99 for both temperature and power forecasting across seasonal variations. The research in [14] evaluates how weather parameters affect the forecasting precision of photovoltaic power output at the Dangjin coal yard PV power (DCPP) installation in Korea, located on coal storage facility rooftops. The authors compared different prediction approaches, including King et al. and Duffie models for module temperature, NREL formulas for PV generation, and simplified methods based solely on insolation and generation capacity. The analysis revealed how module temperature and wind velocity influence prediction accuracy, with results validated against measured data and analysed across varying weather conditions, insolation levels, ambient temperature, and wind speed.
From the above literature review, four distinct approaches can be observed regarding PV module temperature prediction models, as described next. First, there are wind-independent models, which are computationally simple but unable to capture real thermal dynamics. Second, wind-dependent correlations incorporate wind speed effects, but due to their steady-state approach, even though they show higher accuracy compared to wind-independent models in some cases, they still fail to capture thermal inertia effects. Third, machine learning techniques can achieve high accuracy but require extensive training data. Fourth, an advanced approach is represented by dynamic models using ordinary differential equations. These methods can capture transient thermal effects but are computationally intensive and require detailed material properties.
There is a significant gap in the literature regarding specific guidance on when simple models provide adequate accuracy versus when dynamic approaches are essential, depending on application requirements and meteorological conditions. The present study addresses this gap by developing a mathematical model based on a single ordinary differential equation to obtain temperature variation with time. This model combines computational efficiency with thermal inertia considerations, offering an optimal balance between accuracy and practical usability. We use this model to evaluate a simple wind-independent model [3] and a wind-dependent model [15] under the meteorological conditions of Bucharest, Romania (44.4268° N and 26.1025° E). The model has been validated with experimental data from [7] and provides a comprehensive annual assessment of model reliability for central/eastern European climate conditions.

2. Materials and Methods

2.1. Mathematical Model

A differential equation for PV cell temperature Tc was derived according to the energy balance on the module [16]:
d T c d t = α τ G η T c G U P V T c T a m P V c p ,
where
Tc represents the PV cell temperature [°C], Ta is ambient temperature [°C], G is solar irradiance [W/m2], ατ is the solar absorptance-transmittance product [-], η(Tc) is PV efficiency [-] dependent on cell temperature, UPV is the heat transfer coefficient from the module to the ambient [W/(m2·K)], mPV is PV module mass [kg], and cp is the module heat capacity [J/(kg·K)].
This approach accounts for the thermal capacity of the PV module, allowing the model to capture transient thermal effects that are neglected in steady-state models. The energy balance considers three main terms, described next. The first term ( α τ G ) represents the solar energy absorbed by the module. The second term, η T c G , accounts for the electrical power generated, which reduces the thermal energy available for heating. The third term, U P V T c T a , represents heat losses to the environment. The denominator, m P V c p , represents the thermal capacity of the module, which determines how quickly the temperature responds to energy balance changes. The differential equation has been implemented in Matlab and solved using the integrated ode45 procedure.
The terms in Formula (1) are explained next.
The linear wind-speed relationship for the heat transfer coefficient was adopted from Mattei et al. [9]:
U P V = 24.1 + 2.9 w ,
where w represents the wind speed, [m/s].
Equation (2) reflects the physics of convective heat transfer, where higher wind speeds increase the rate of heat removal from the module surface. For the specific heat capacity, no fixed value can be considered because PV modules comprise multiple layers, in this particular case [7]:
-
Tempered glass cover;
-
Ethylene-vinyl acetate (EVA);
-
Solar cells and bus-bars;
-
Tedlar film.
The temperature-dependent heat capacity relationship was determined through iterative calibration against experimental data:
c p = 1480 + 0.75 T c ,
The temperature-dependent heat capacity reflects the physical reality that material properties change with temperature. As PV modules heat up, thermal expansion and material property variations alter their ability to store thermal energy. The coefficients represent the baseline thermal capacity of the composite PV materials (1480 J/kg·K) and the temperature-dependent increase due to thermal expansion effects (0.75 J/kg·K2). These values were calibrated through repeated simulations until convergence with actual experimental temperature profiles. Other values have been reported in [17], where a sensitivity analysis was conducted for the photovoltaic module’s heat capacity.
Since the PV module efficiency depends on Tc, the following procedure has been followed: first, at steady state, the temperature derivative equals zero, so the energy balance equation becomes [16]:
α τ G η T c G U P V T c T a = 0 ,
At steady-state, the system reaches thermal equilibrium where energy input exactly balances energy output. This condition allows us to solve for the steady state temperature, which serves as the initial condition for the dynamic simulations. In practice, truly steady conditions rarely occur due to continuously changing weather, making the dynamic approach essential for accurate predictions.
PV cell voltage and current vary linearly with temperature, according to established relationships [18]:
U T c = U 0 , s t + μ U 0 T c T c , s t ,
I T c = G G s t I s c , s t + μ I s c T c T c , s t ,
where the subscript “st” denotes standard test conditions and, U(Tc) is the open-circuit voltage [V], U0,st is the open-circuit voltage at standard conditions (STC) [V], Tc,st is the STC cell temperature [°C], µU0 is the temperature coefficient of open-circuit voltage [V/K], I(Tc) is the light-generated current [A], G represents solar irradiance [W/m2], Gst = 800 represents STC irradiance [W/m2], Isc,st is the short-circuit current at STC [A], and µIsc is the temperature coefficient of short-circuit current [A/K].
The electrical power output is calculated as [16]:
P T c = F F U T c I T c ,
where P(Tc) is the maximum power [W], and FF is the fill factor [-].
The fill factor was considered constant based on module specifications [16]:
F F = P M , s t U 0 , s t I s c , s t = 270 38 9.2 = 0.7723 ,
where PM,st represents the maximum power at STC [W].
Through algebraic manipulation of Equations (5)–(8), the temperature-dependent efficiency becomes:
η T c = F F G s t A m o d u l e U 0 , s t I s c , s t + U 0 , s t μ I s c + I s c , s t μ U 0 Δ T + μ U 0 μ I s c Δ T 2 ,
where Δ T = T c T c , s t and Amodule is the module area [m2].
This leads to a quadratic equation for the temperature:
A T c 2 + B T c + C = 0 ,
where
A = F F μ U 0 μ I s c G s t A m o d u l e G ,
B = 2 F F μ U 0 μ I s c G s t A m o d u l e G T c , s t + F F U 0 , s t μ I s c + μ U 0 I s c , s t G s t A m o d u l e G + U P V ,
C = F F μ U 0 μ I s c G s t A m o d u l e G T c , s t 2 F F U 0 , s t μ I s c + μ U 0 I s c , s t G s t A m o d u l e G T c , s t + F F U 0 , s t I s c , s t G s t A m o d u l e G U P V T a α τ G ,
The quadratic function above has been solved with the Newton–Raphson method in order to obtain the initial condition for integrating the differential Equation (1).

2.2. Model Validation

The presented model has been validated using experimental measurements presented in [7]. The selected dataset represents conditions similar to central and eastern European climates and uses standard measurement equipment with documented accuracy specifications. The authors performed experiments on photovoltaic modules positioned on the rooftop of the mechanical engineering facility at the University of Mersin campus (coordinates: 36.8° N, 34.5° E). Full-day testing was performed under actual environmental conditions on two representative dates: 30 January 2019 (winter conditions) and 19 June 2019 (summer conditions). The experimental validation period (two days) is short; however, this limitation is acceptable for thermal model validation because the focus is on model accuracy rather than long-term assessment of the PV module. Moreover, high-frequency thermal dynamics can be captured in short-term measurements. Also, validation at a single Mediterranean location (Turkey) may limit generalizability to other climate zones, though the underlying thermal modelling approach relies on universally applicable heat transfer principles. A multi-crystalline silicon photovoltaic panel (model SE270-60P manufactured by Suneng, Turkey) with a rated capacity of 270 Wp and an effective area of 1.64 m2 was employed for the testing. The photovoltaic panel’s specifications used throughout the investigation can be found in Table 1 [7].
The module was positioned at a 22° inclination angle, while maintaining a southern orientation with an azimuth angle of 0°. The mathematical model has been implemented in Matlab. Moreover, the first-order differential Equation (1) has been solved using the ode45 built-in Matlab R2024b function that uses a variable step Ruge–Kutta method. Figure 1 shows measured solar irradiance and wind speed for the two days.
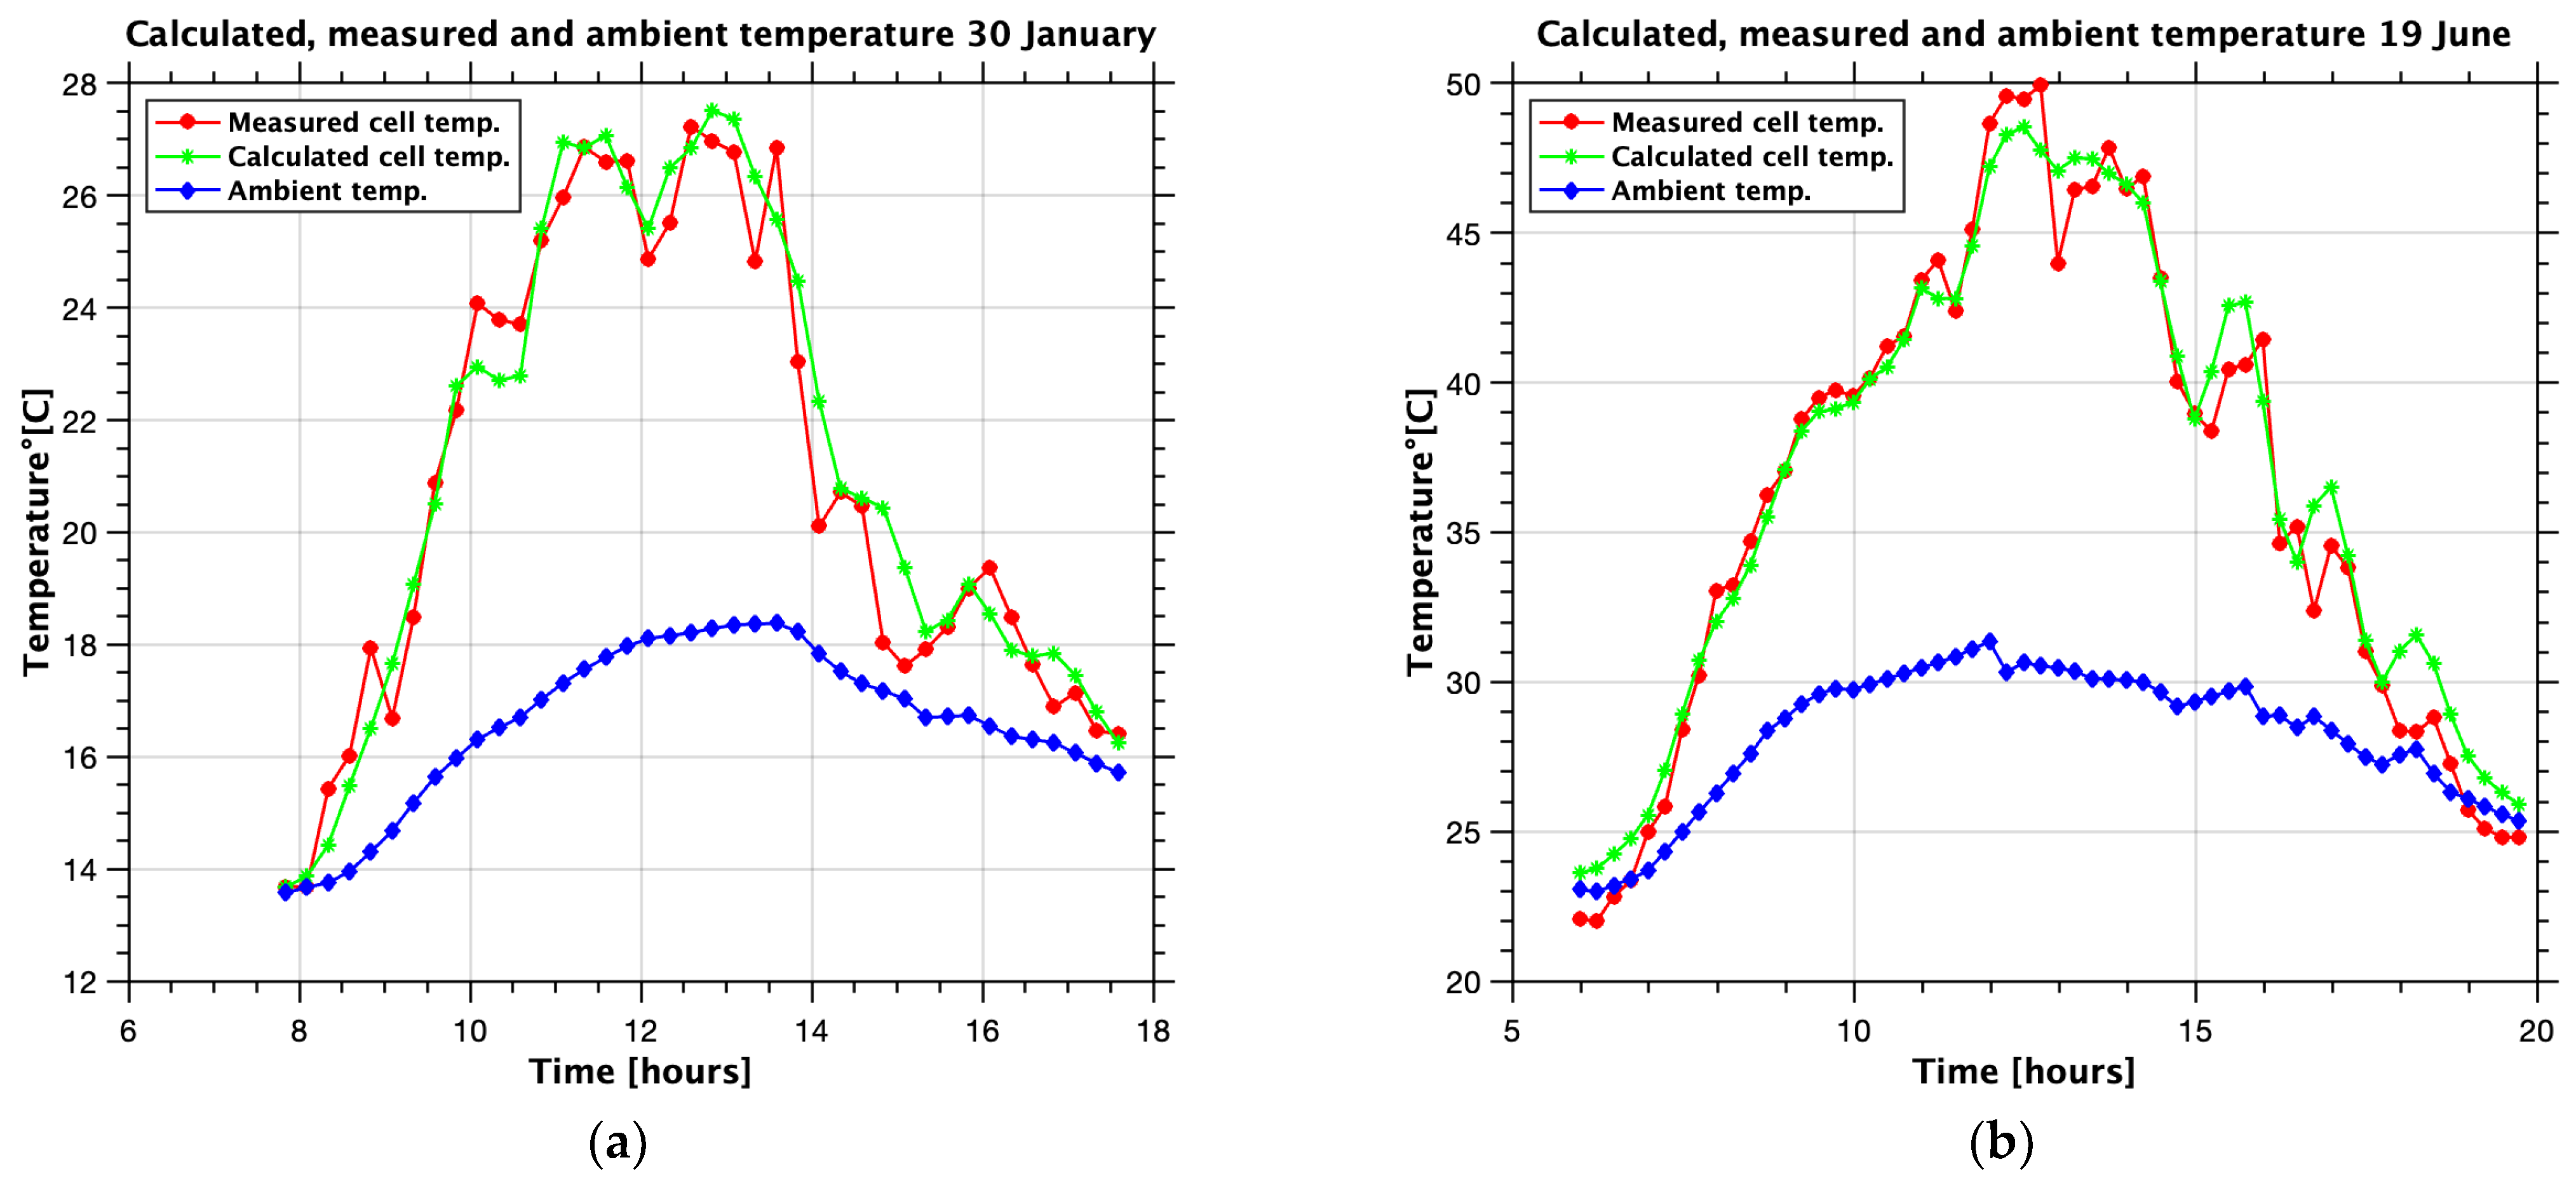
Figure 2 reveals the variation of the obtained cell temperature using the ode equation, the measured cell temperature, and the ambient temperature for the winter and summer days. As can be noticed, the agreement is very good between measured and calculated values. The model successfully captures both the magnitude and temporal dynamics of thermal response, including subtle effects such as thermal lag during rapid environmental changes.
Equations (14)–(19) have been used to calculate the accuracy indicators presented in Table 2. The multiple statistical metrics shown demonstrate the ODE model’s reliability when comparing the results (calculated) with the experimental data (measured). It can be seen that all the values indicate good accordance between the data. The coefficient of determination values (R2 = 0.95 − 0.97) indicate a high correlation that demonstrates the model’s ability to capture the thermal behaviour across different conditions.
Mathematical equations used:
Mean Bias Error (MBE)
M B E = 1 N i = 1 N C i M i ,
Relative Mean Bias Error (rMBE)
r M B E = M B E 100 M m e d ,
Mean of Measured Values (Mmed)
M m e d = 1 N i = 1 N M i ,
Root Mean Square Error (RMSE)
R M S E = M S E = 1 N i = 1 N C i M i 2 ,
Relative Root Mean Square Error (rRMSE)
r R M S E = R M S E 100 M m e d ,
Coefficient of determination (R2)
R 2 = 1 i = 1 N C i M i 2 i = 1 N M i M m e d 2 ,
where
MBE represents the mean bias error, rMBE is the relative mean bias error, Mmed denotes the mean measured values, RMSE is the root mean square error, rRMSE is the relative root mean square error, R2 is the coefficient of determination, N is the total number of values, C represents calculated values, and M denotes measured values.
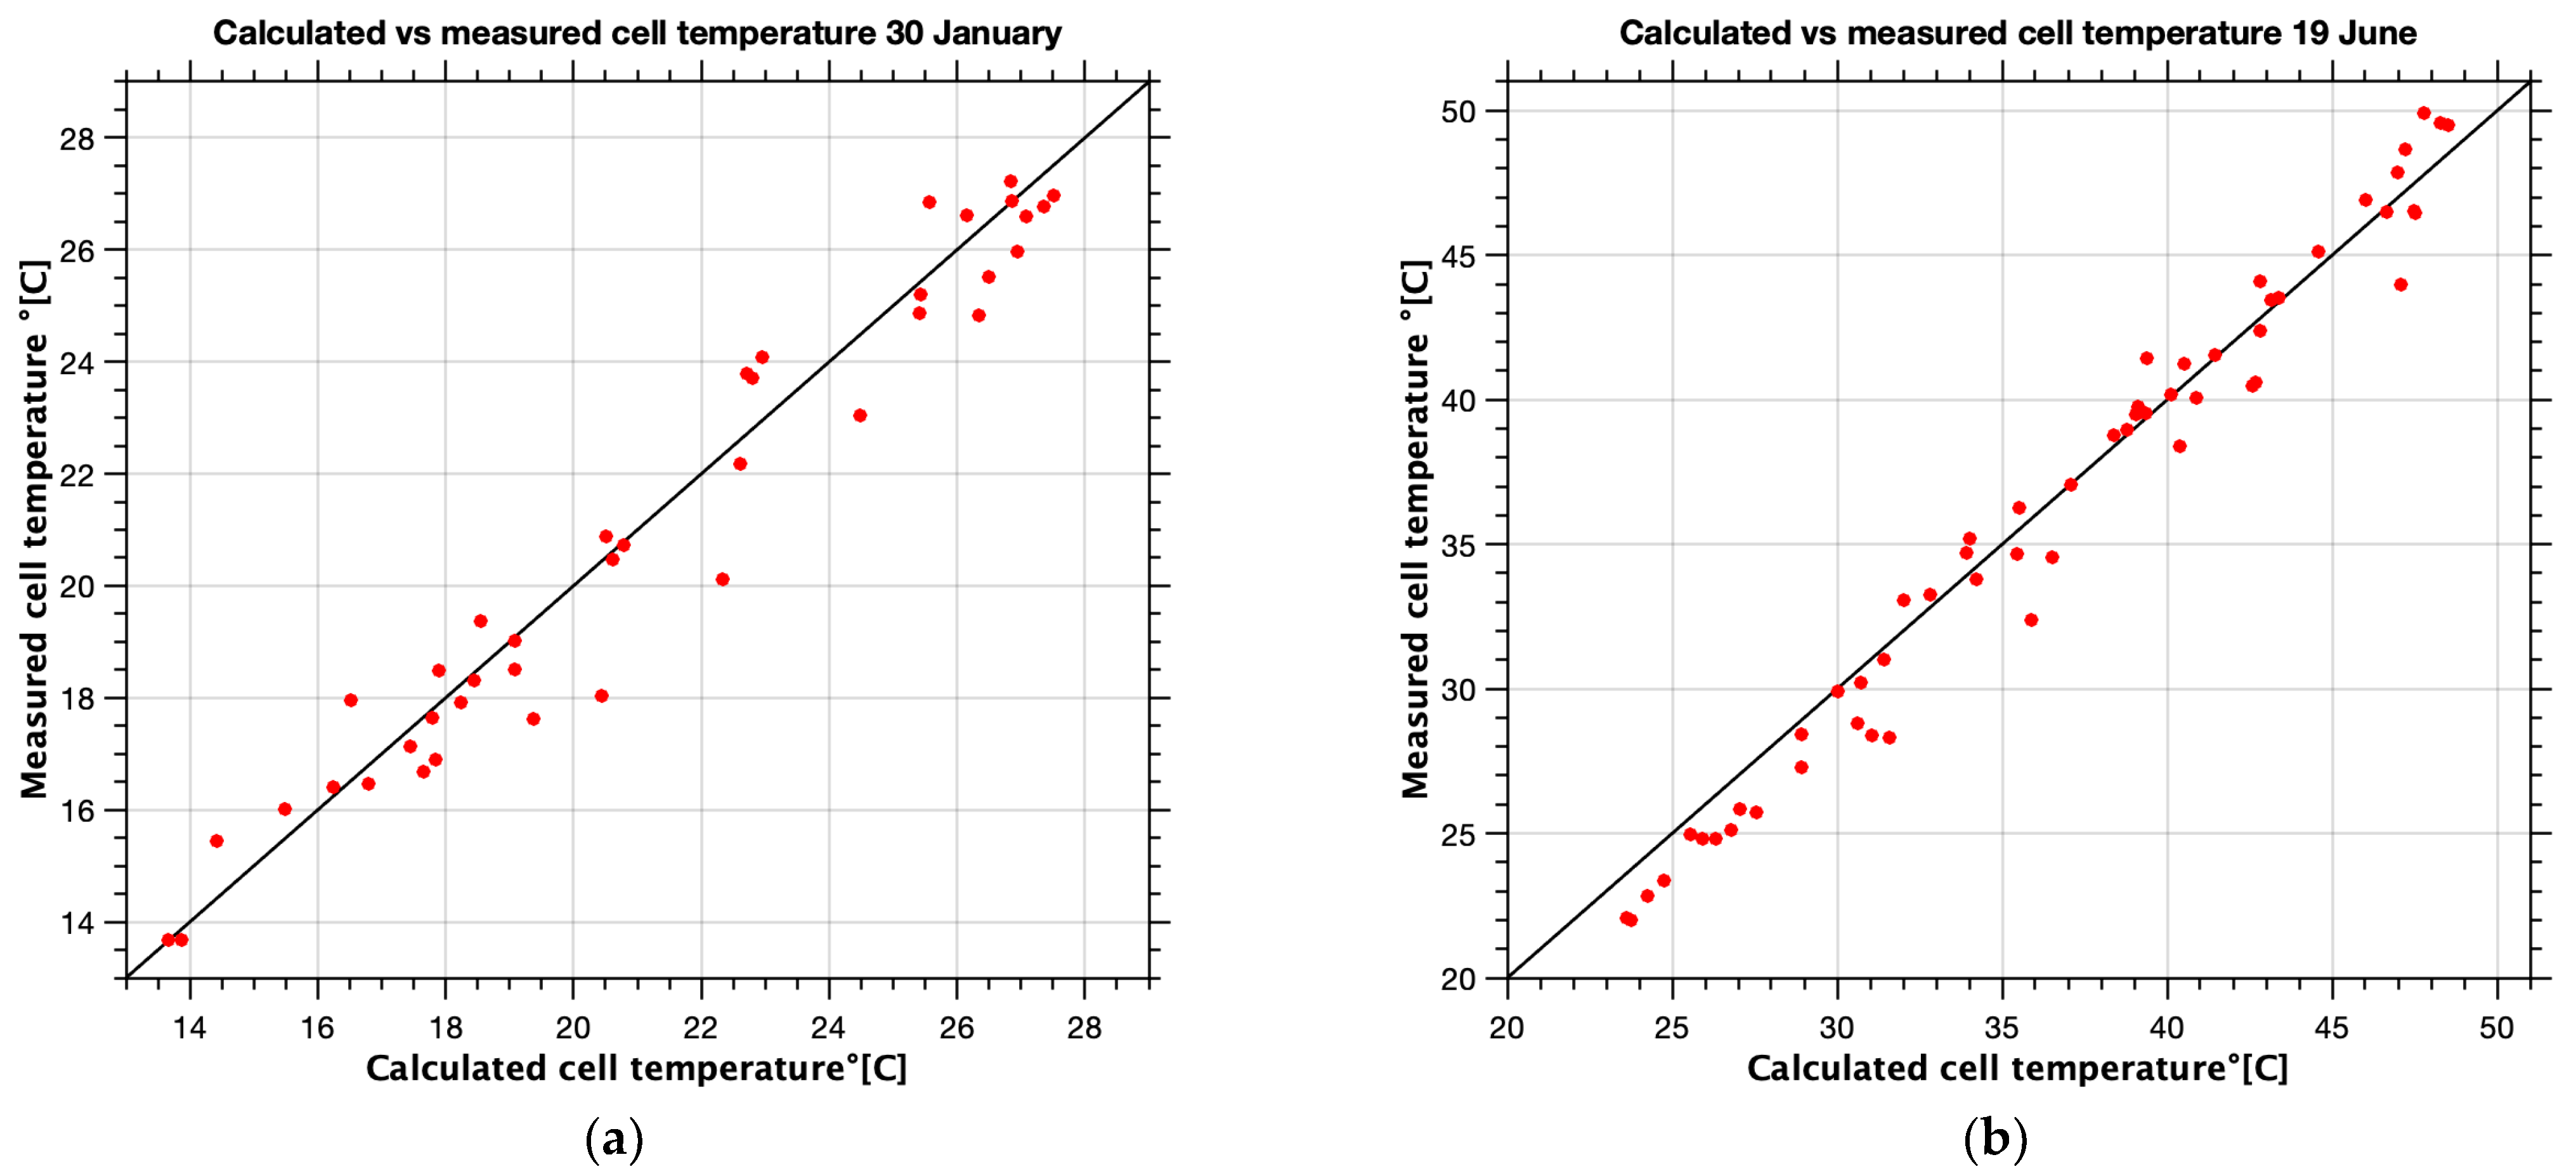
In Figure 3, a plot of measured versus calculated values is shown. Again, one can observe a very good accordance between the data. The minimal deviation from the diagonal line confirms that the ODE model captures the thermal behaviour well without consistent over- or under-prediction across the temperature range.

3. Results

Simulations were performed for the entire year of 2023 (365 days). Weather data, including total global irradiation on an inclined plane, ambient temperature, and wind speed, were downloaded from the PVGIS database [19]. For the simulations, a 38° inclination angle was chosen, as this has been demonstrated to be the optimum angle in Bucharest [20]. For each time step, two additional cell temperature values were calculated using the simple wind-independent model proposed by Markvart [3] and the wind-dependent one proposed by Skoplaki [15]. These two models were selected because they represent the most widely cited approaches in the literature. Moreover, Markvart represents the most established wind-independent approach, while Skoplaki represents wind-dependent modelling, allowing comprehensive evaluation of both methodological approaches. The equations for the two models are:
Markvart [3]:
T c = T a + G G N O C T T N O C T T a , N O C T ,
where G N O C T = 800 W m 2   and   T a , N O C T = 20   °C are the solar irradiation and ambient air under normal operating cell conditions, and T N O C T = 47 °C is the normal operating cell temperature.
Skoplaki [15]:
T c = T a + ω 0.32 G h w ,
where h w = 8.91 + 2.0 · w is the convection heat transfer coefficient [W/m2K] due to forced wind convection, w being the free stream wind speed [m/s] and ω representing the mounting coefficient: free standing ω = 1 ; flat roof ω = 1.2 ; sloped roof ω = 1.8 ; facade integrated ω = 2.4 . Here, a value of 1.8 was used for the tilted module.
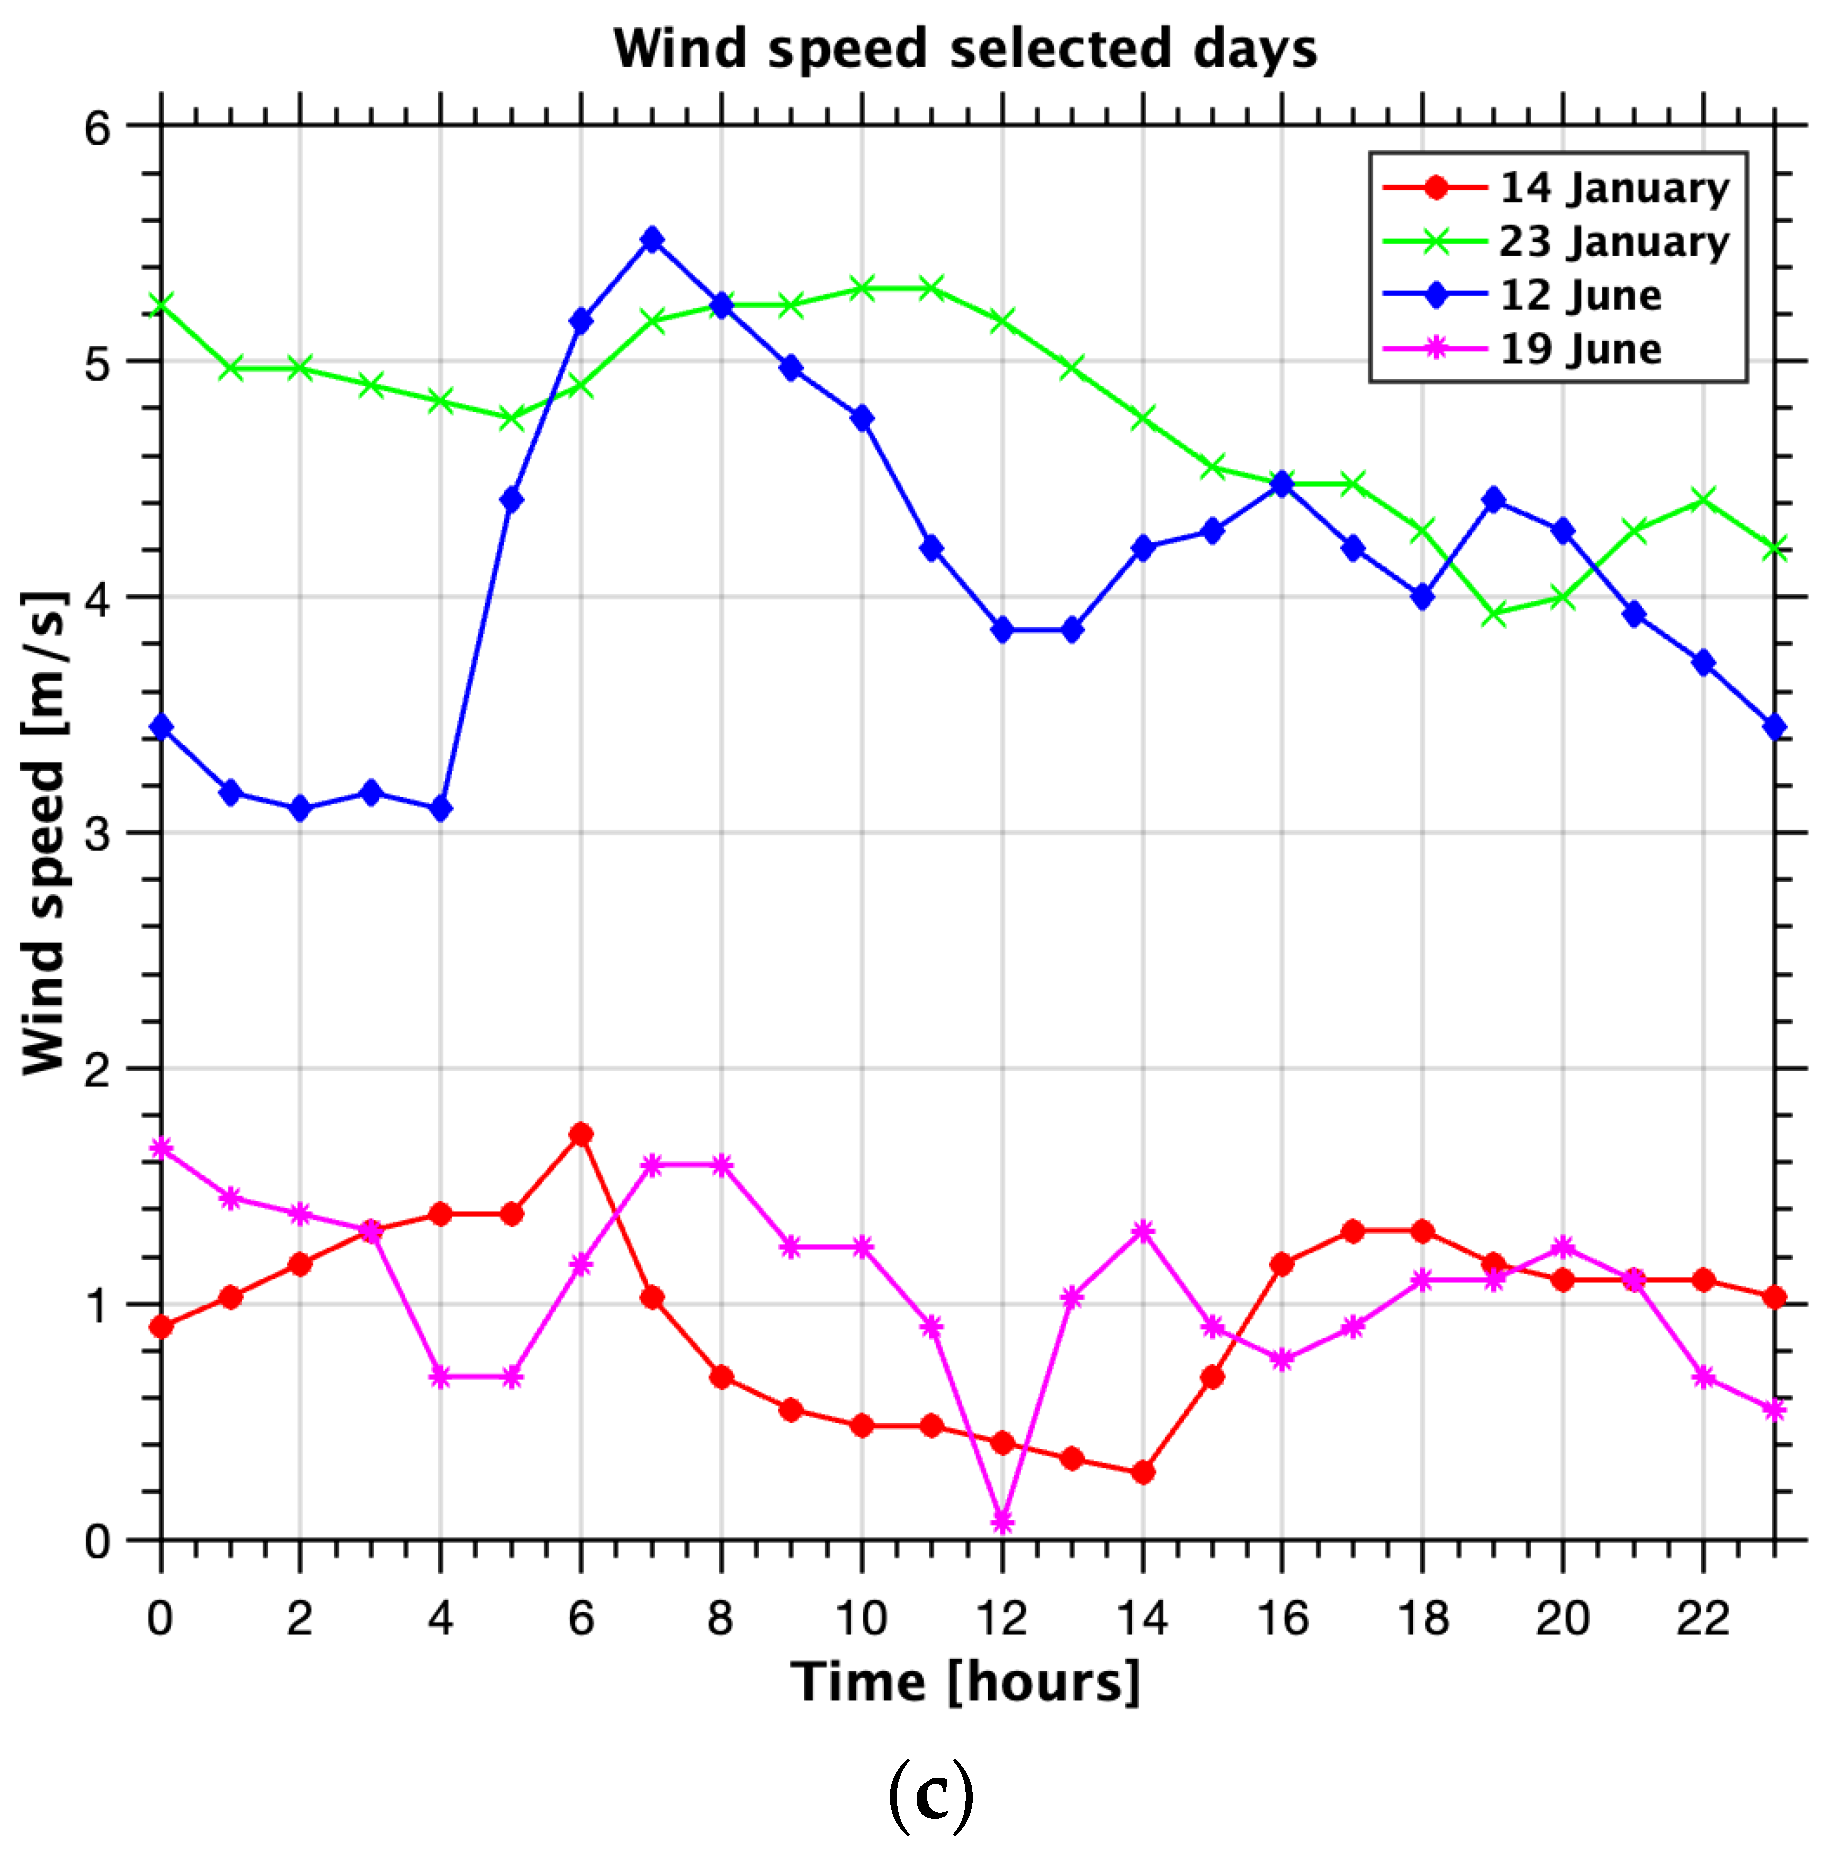
Accuracy indicators were calculated to compare the results obtained with the validated ODE model to the other two simpler models. In order to see how reliable the simpler models are, we analysed their behaviour on four different days: two summer days, 19 June and 12 June, respectively, chosen because one exhibits low wind speeds (19 June) and the other high wind (12 June), and two winter days, one having low wind (14 January) and the other high wind (23 January). These days have been especially chosen because the ambient temperature and solar irradiance are similar between the two summer days and between the two winter days, as can be seen from Figure 4. Ambient temperatures in summer range between 15 and 25 °C and in winter between 1 and 7 °C. Regarding the wind speed, it has been the main selection criterion, as we chose two days with high winds, around 4–5 m/s, and two days with low wind, around 1.5 m/s, which is also very close to the standard testing conditions (STC) for PV panels, 1 m/s.
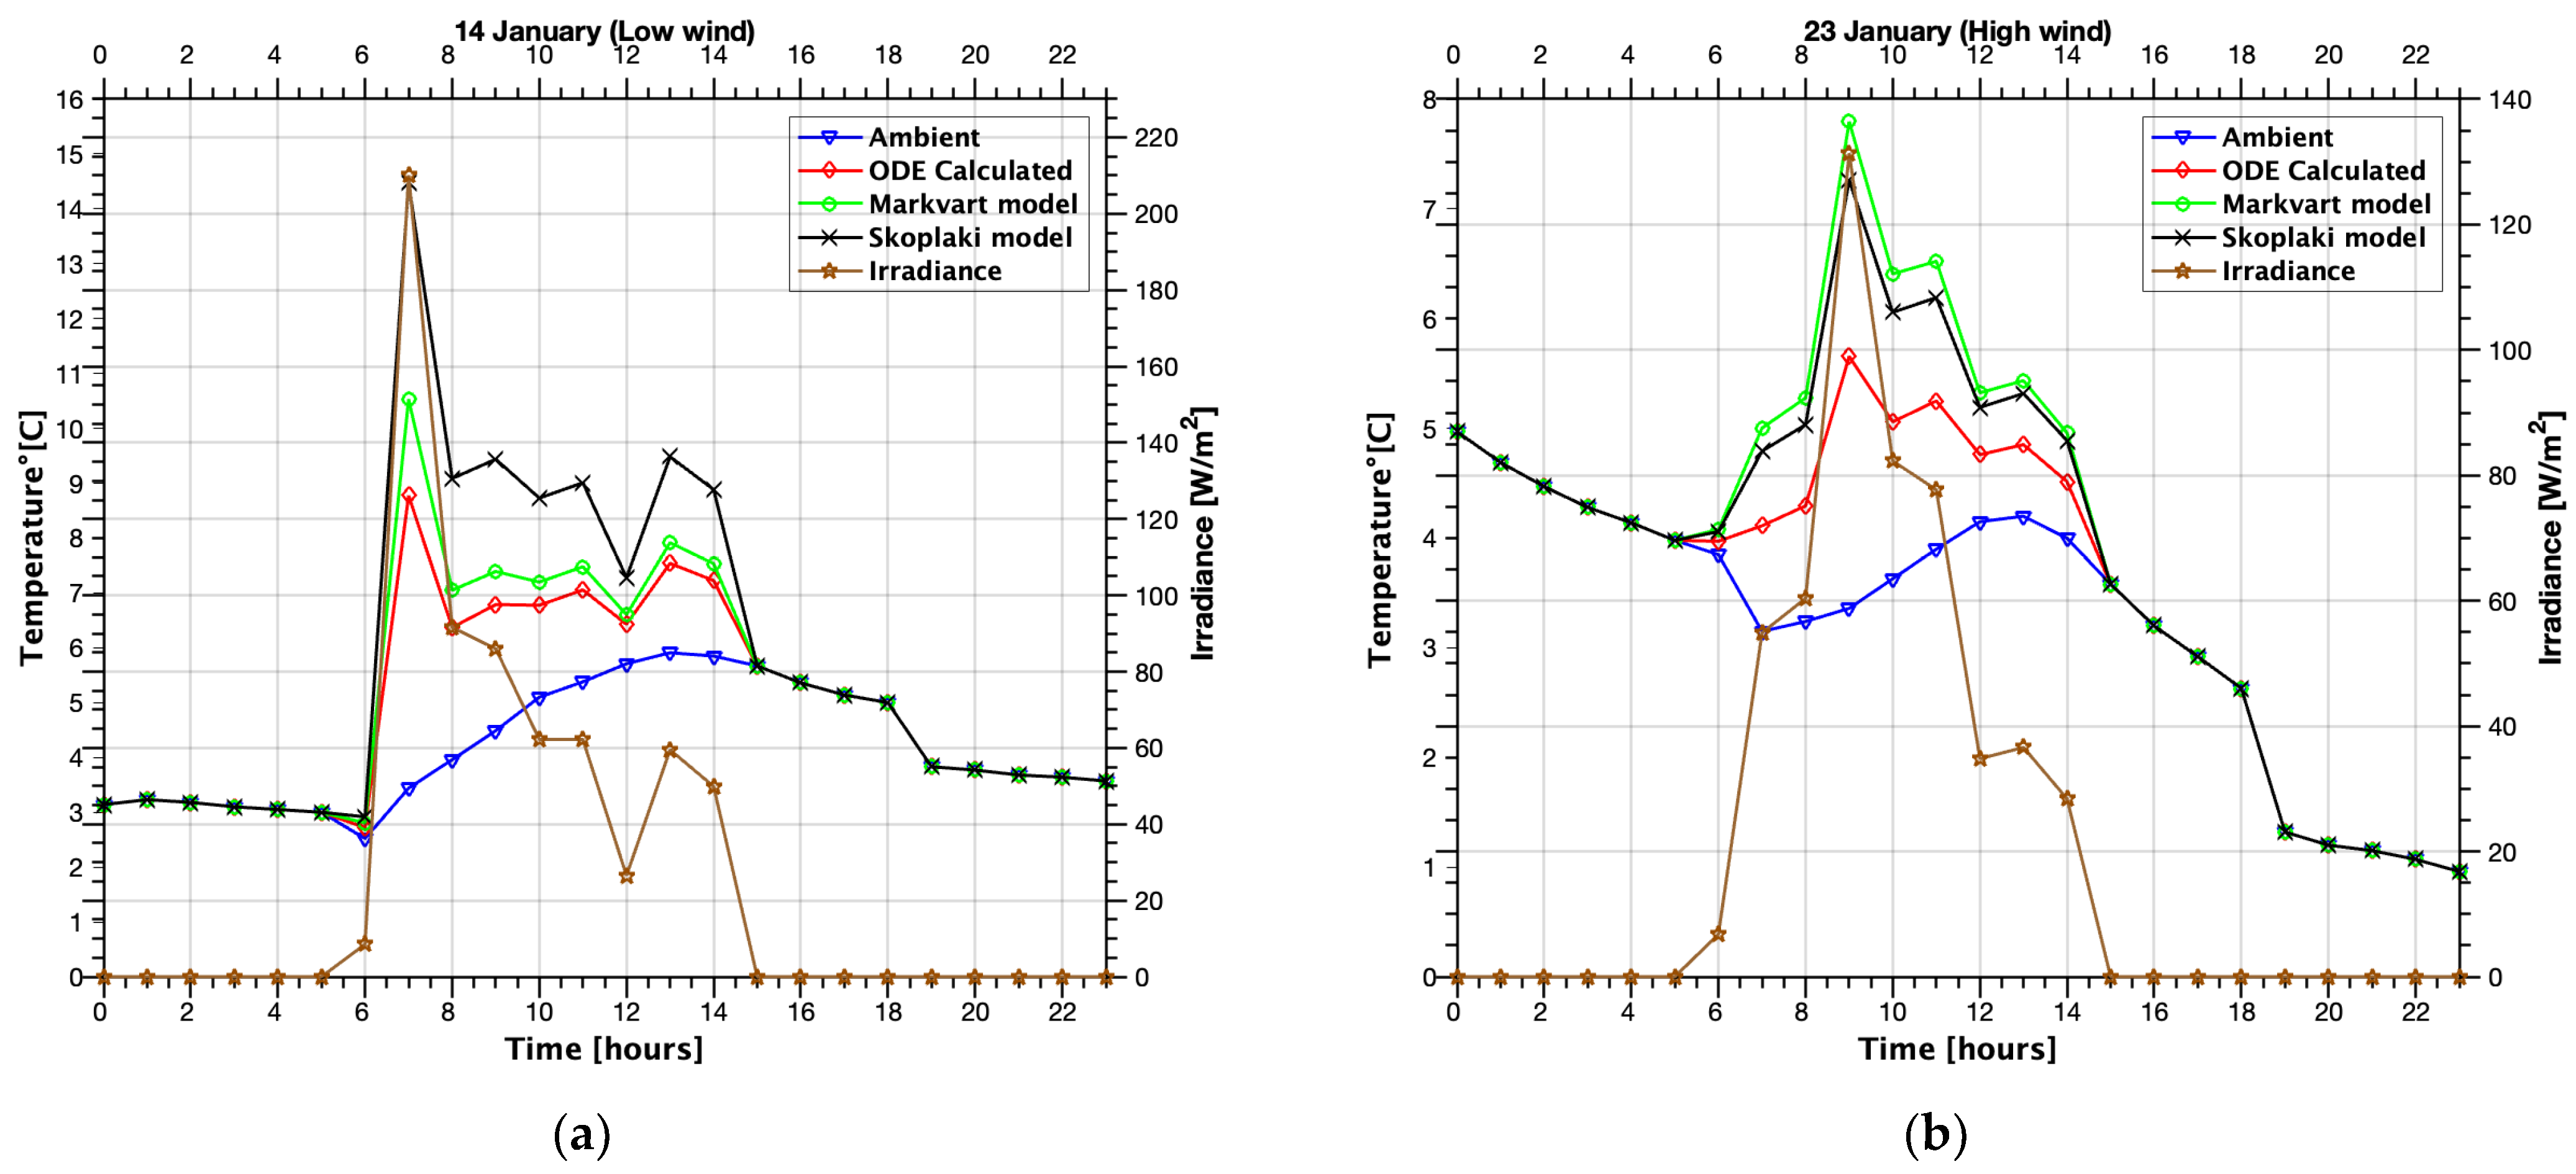
Looking at Figure 5, it can be seen that on the winter days, both simpler models overestimate the cell temperature values. The discrepancy from the ODE model results is bigger during high wind conditions, where both simple models give similar results. However, during low-wind conditions, the Markvart model is closer to the ODE model compared with Skoplaki. Here, the difference reaches a maximum at the solar radiation peak.
Similar results to Figure 5 can be observed in Figure 6 for the two selected summer days. The tendency is consistent with the results obtained for the winter days, meaning that during the high wind day, the two simpler models also overestimate and give very similar results. In the low-wind conditions, the same as in the winter case, both models overestimate, but the Markvart model is closer to the ODE model. Another observation needed to be made here is that on the summer days, even though the tendency is the same, the discrepancies are bigger compared with the winter days.
The difference between the ODE model and the other two simpler models is shown in Figure 7. The values are much higher for the summer days compared with the winter days. Also, during low-wind days, the Markvart model performs better compared with the Skoplaki model. Regarding high wind conditions, the opposite is true. However, the annual comparison results in Table 3 demonstrate that the Markvart model consistently outperforms the Skoplaki model when compared against the validated ODE model, with significantly better R2 correlation (0.9 vs. 0.71). The Markvat model shows an rRMSE of 22.7956% versus 39.1309% for Skoplaki, indicating significantly better overall accuracy throughout the year. The lower MBE values for Markvart (2.2487 °C) compared with Skoplaki (3.8408 °C) suggest that the wind-independent approach provides more stable temperature predictions over diverse meteorological conditions.
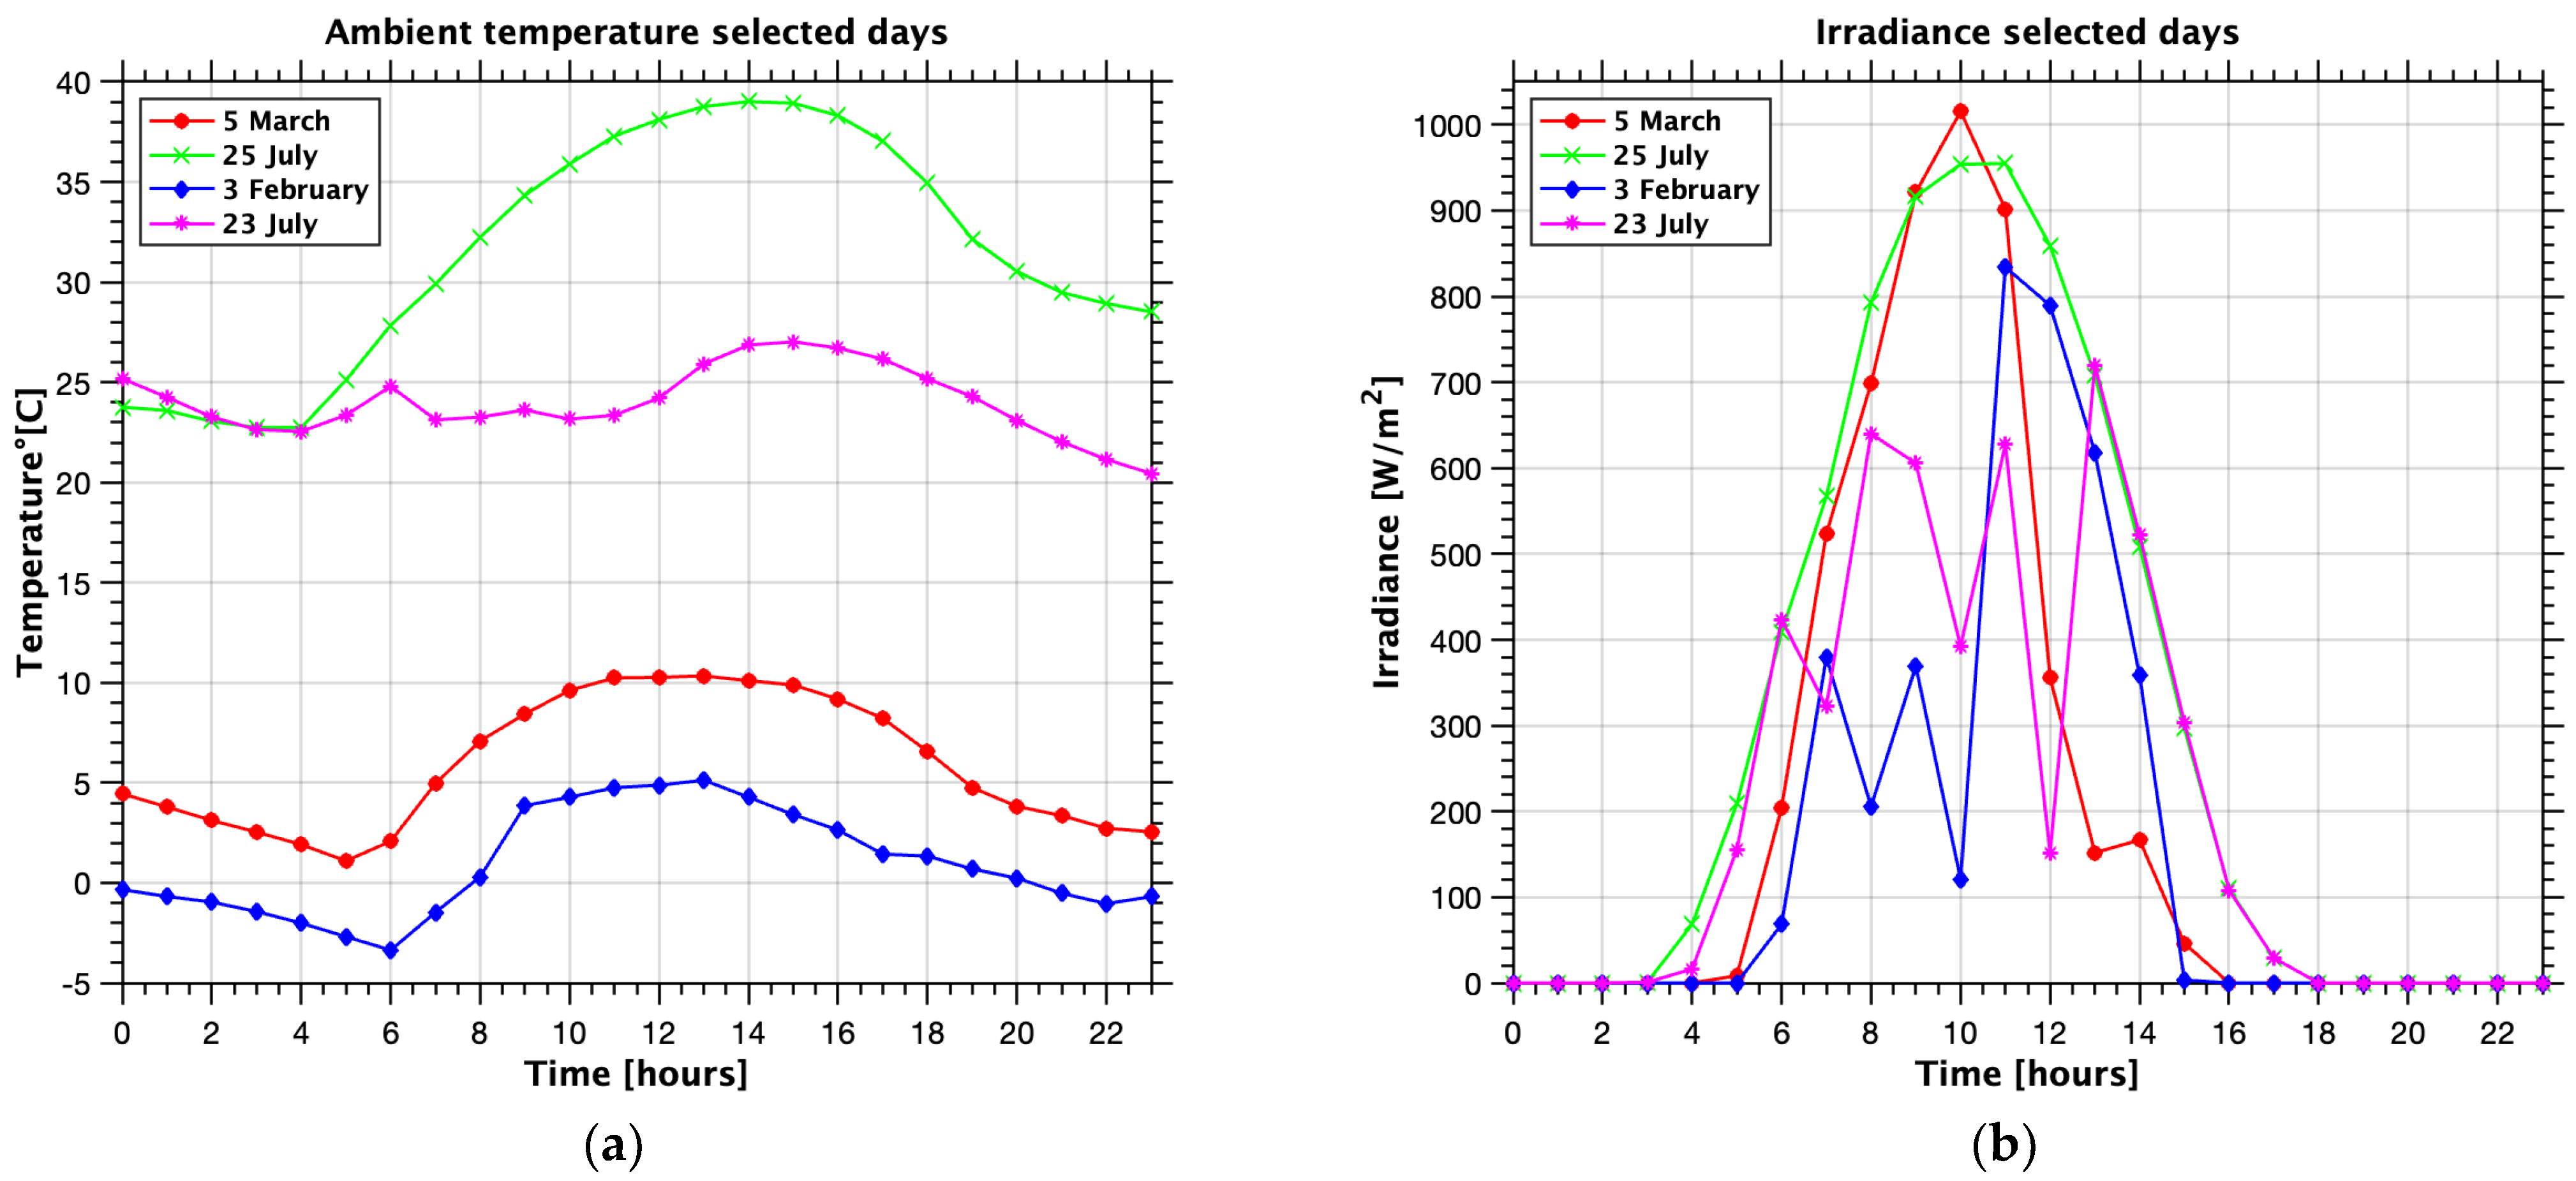
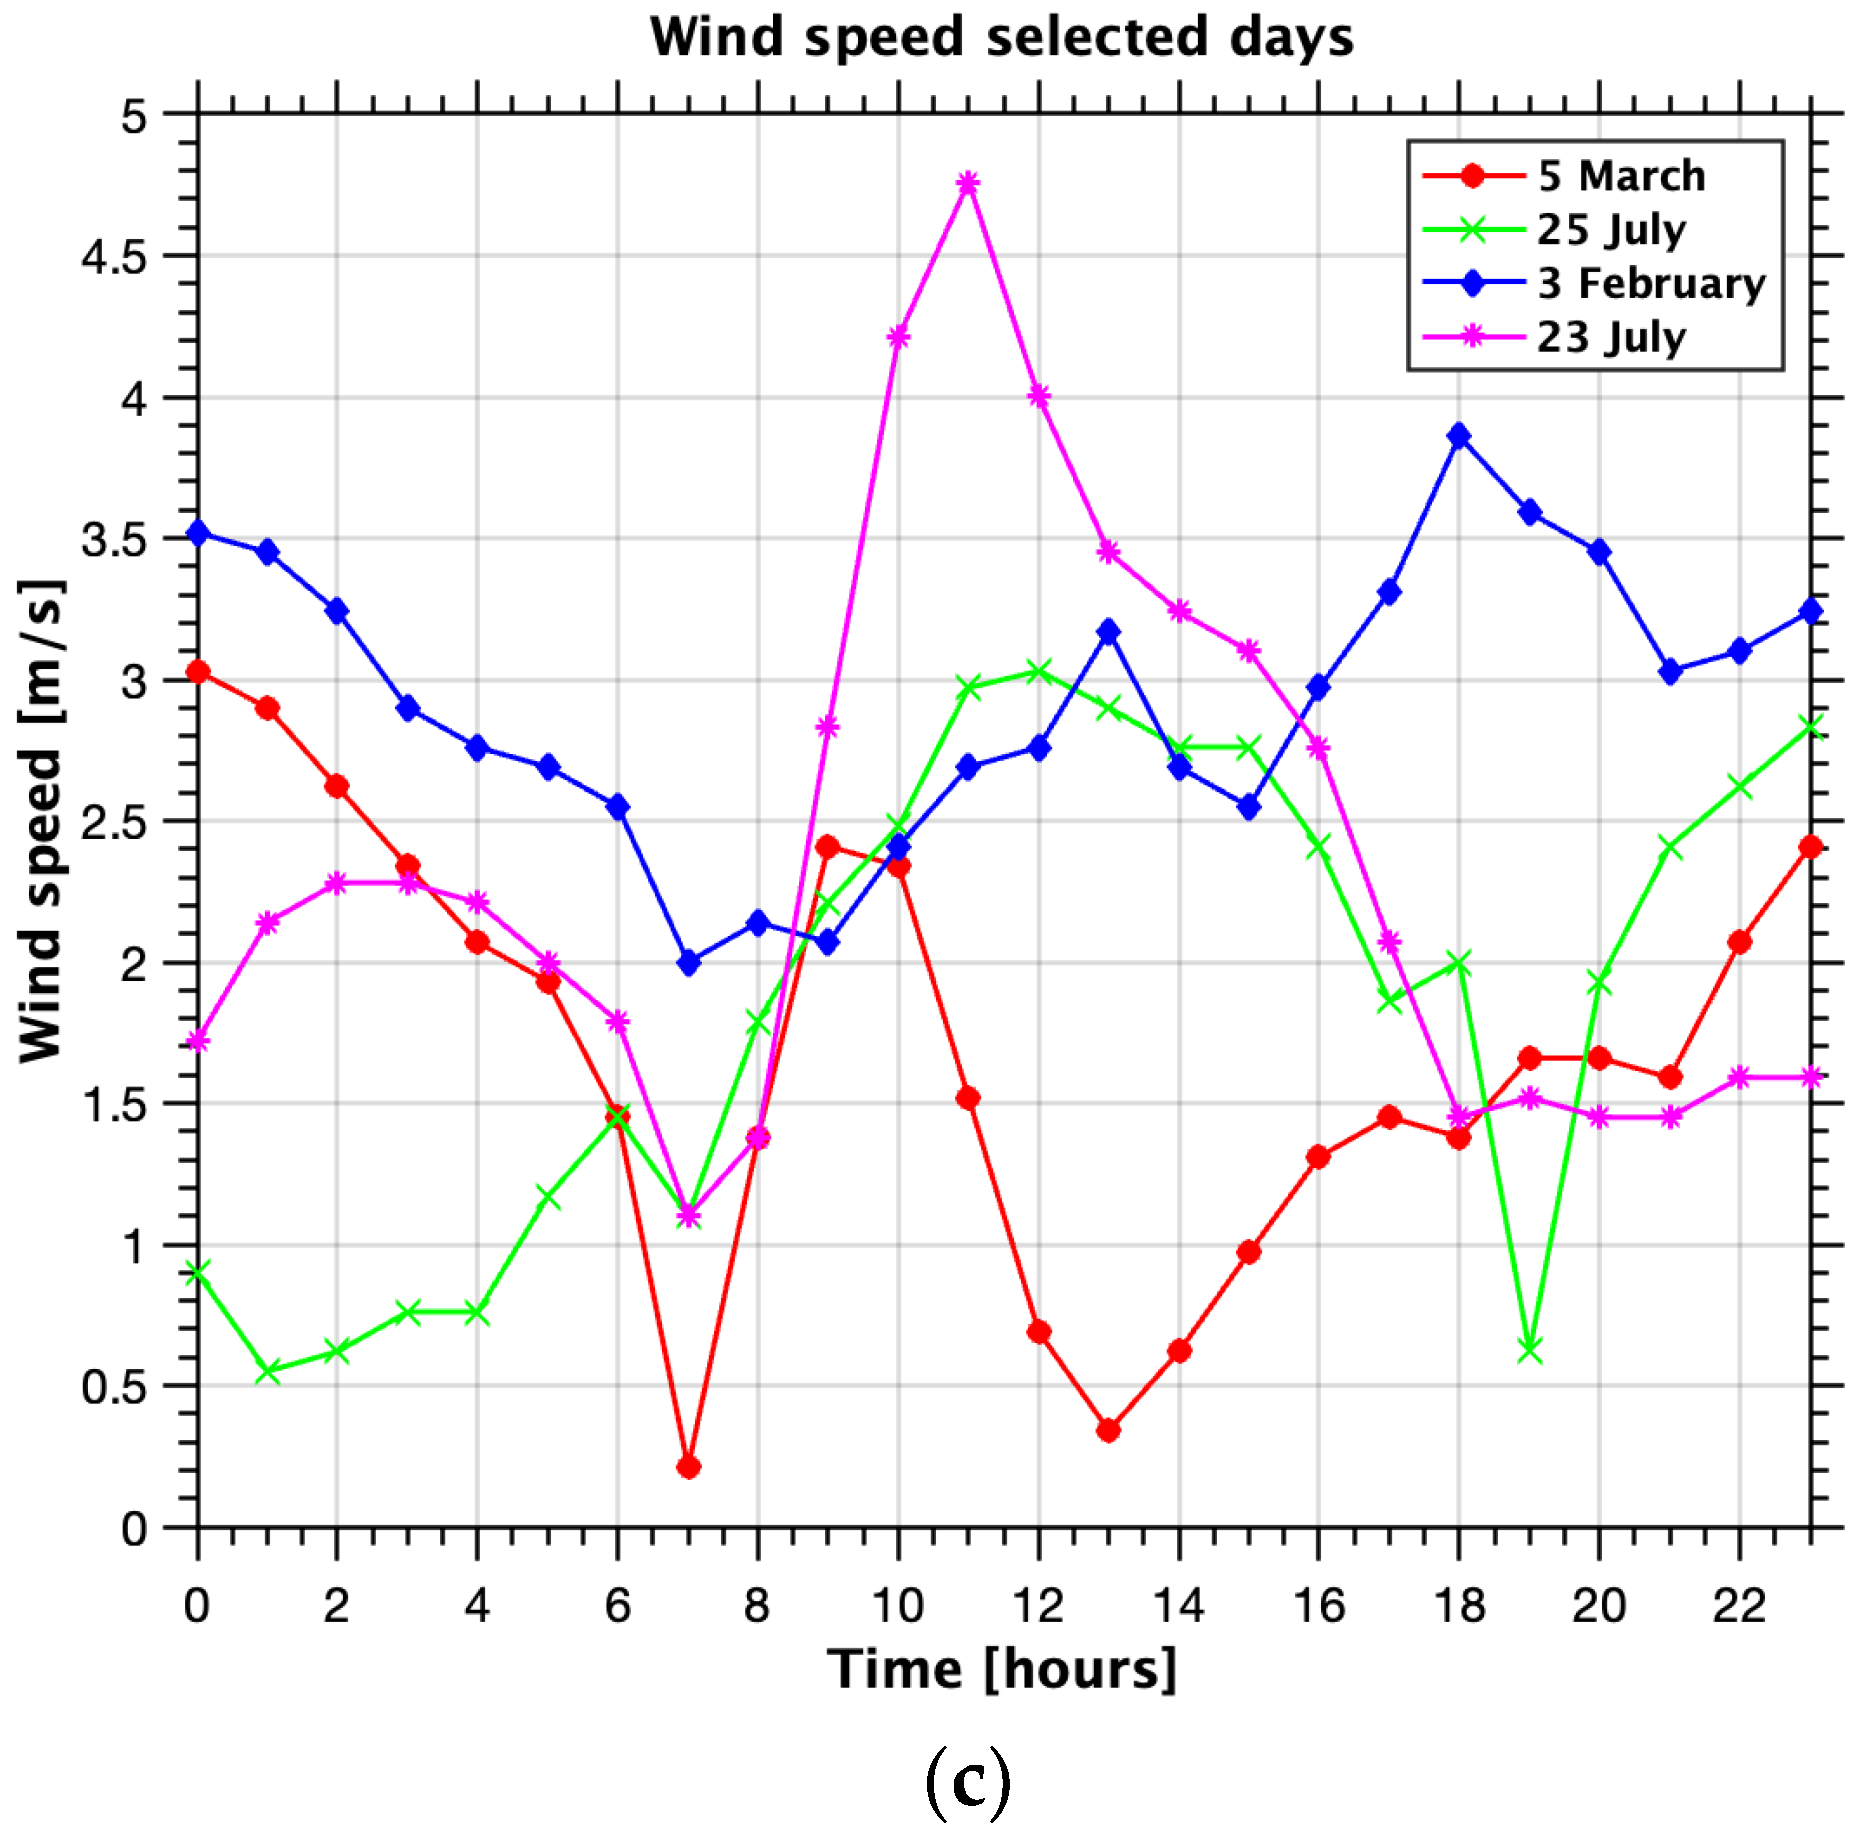
Additionally, in order to further evaluate the differences between the models and to have a clear picture of conditions in which they could or could not be used reliably, several other days have been chosen for comparison: 5 March, with very high irradiance but low ambient temperature (with maximum values of 1015 W/m2 and 10.3 °C); 25 July, also with very high irradiance and because it is the hottest day of the year (with maximum values of 955 W/m2 and 39 °C); 3 February, characterized by high variations in irradiance and low ambient temperature (with maximum values of 834 W/m2 and 5.1 °C); and 23 July, also characterized by high variations in irradiance but high ambient temperature (with maximum values of 719 W/m2 and 27 °C). Weather conditions for these selected days are presented below. Figure 8 presents the meteorological conditions for these four selected days, representing varying weather scenarios in Bucharest. Wind speed variations across these days range from calm conditions to moderate winds, enabling evaluation of wind-dependent model performance across the spectrum of typical meteorological conditions.
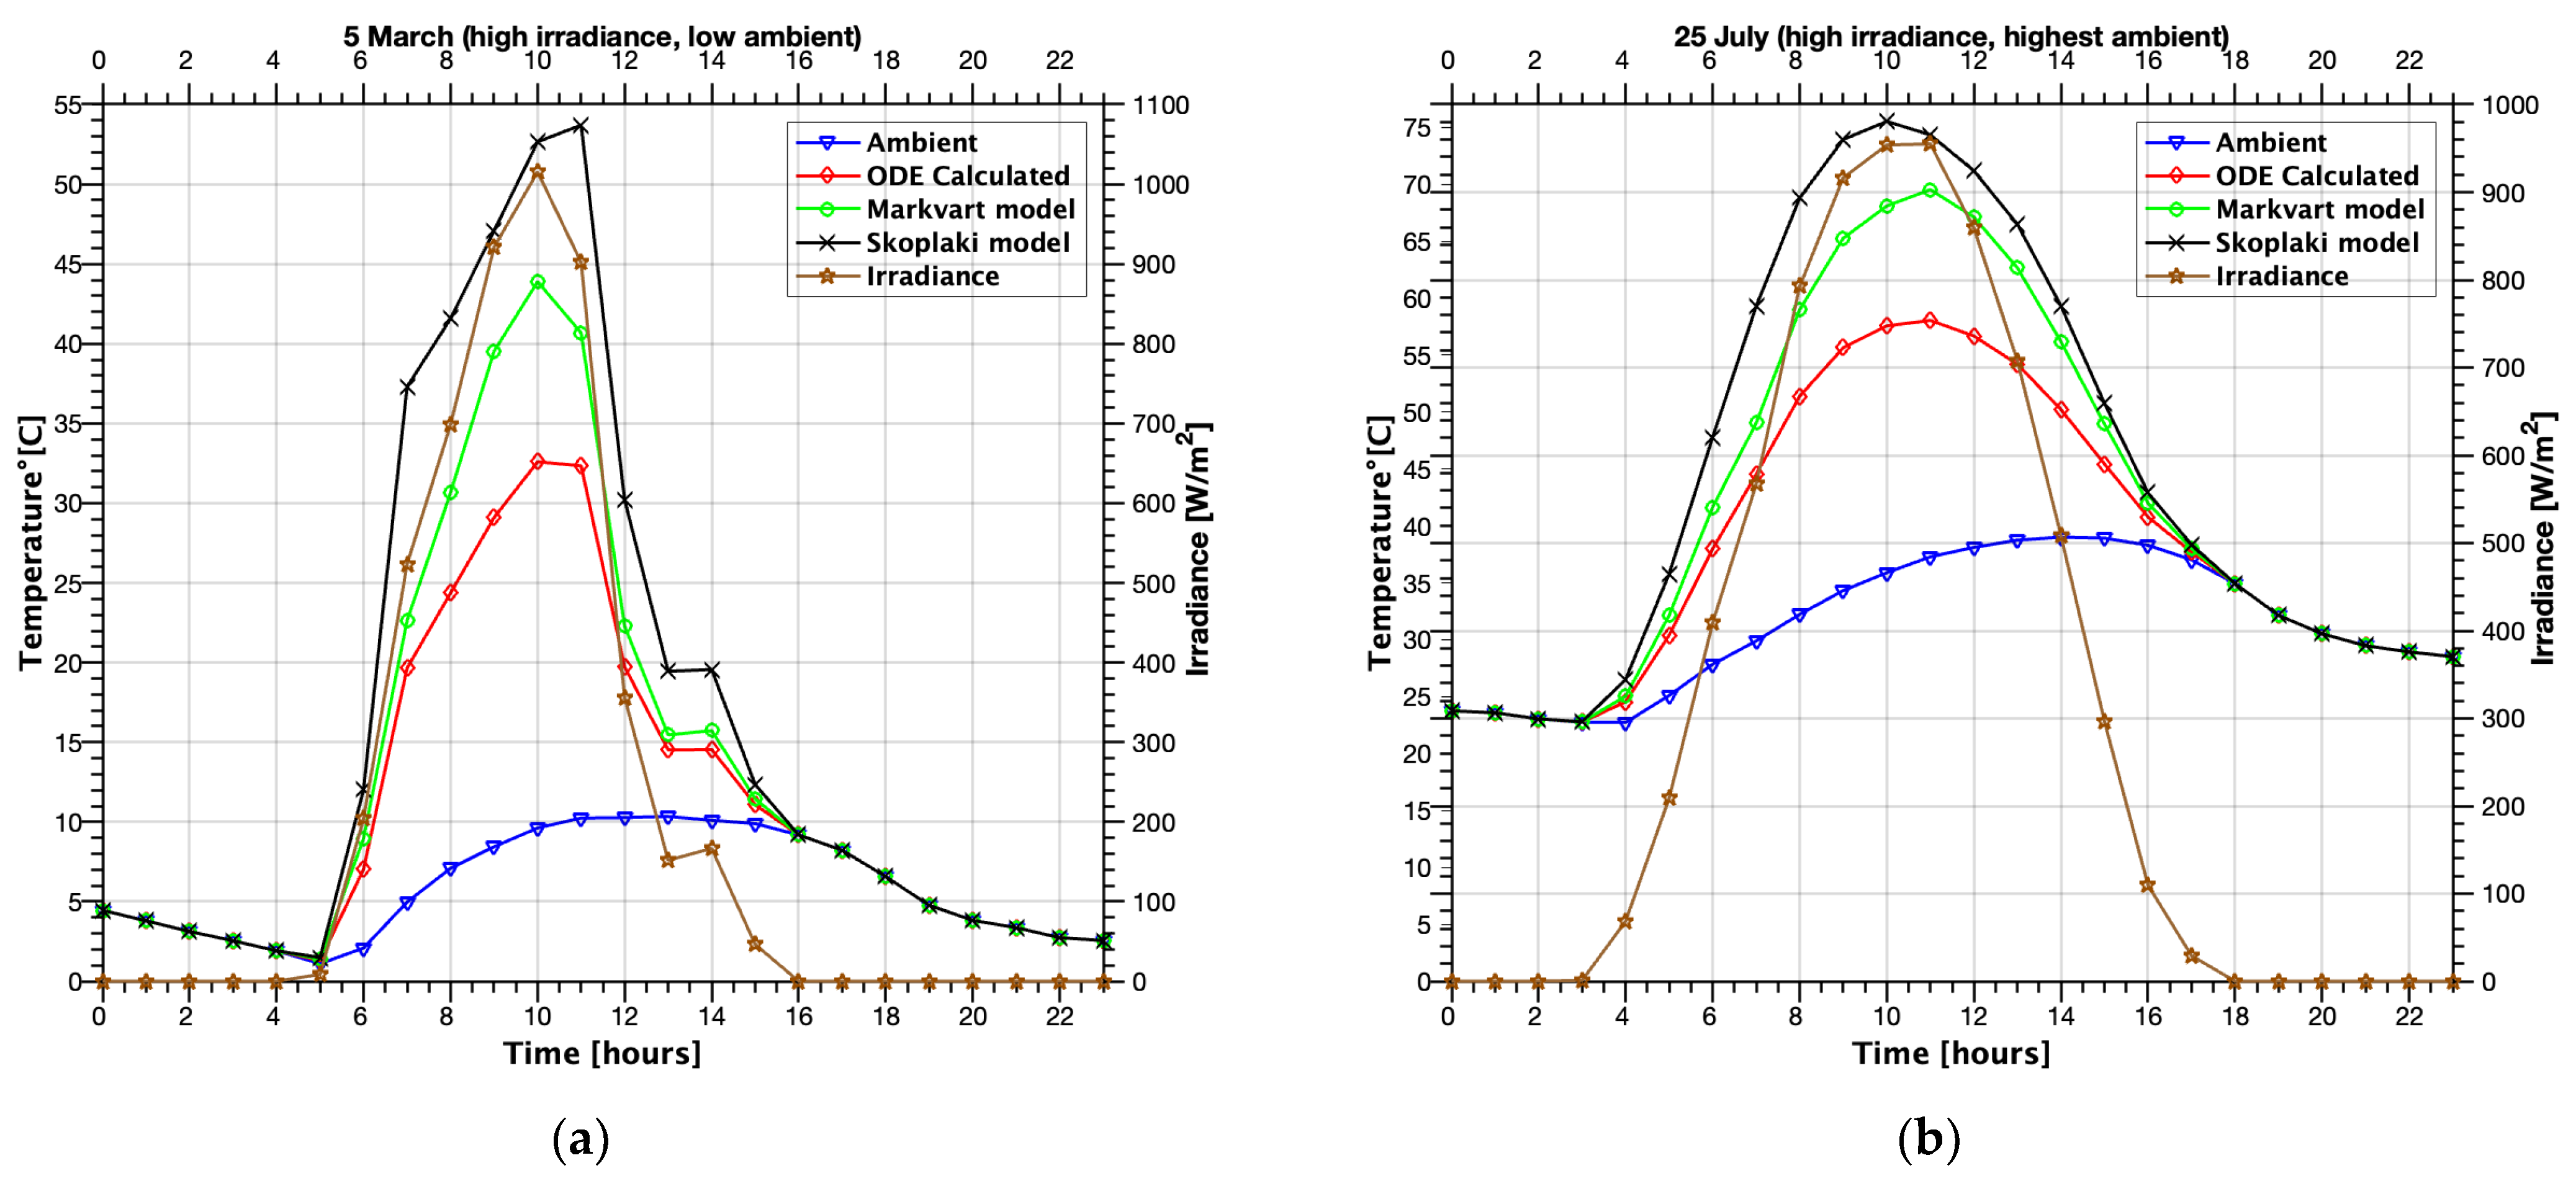
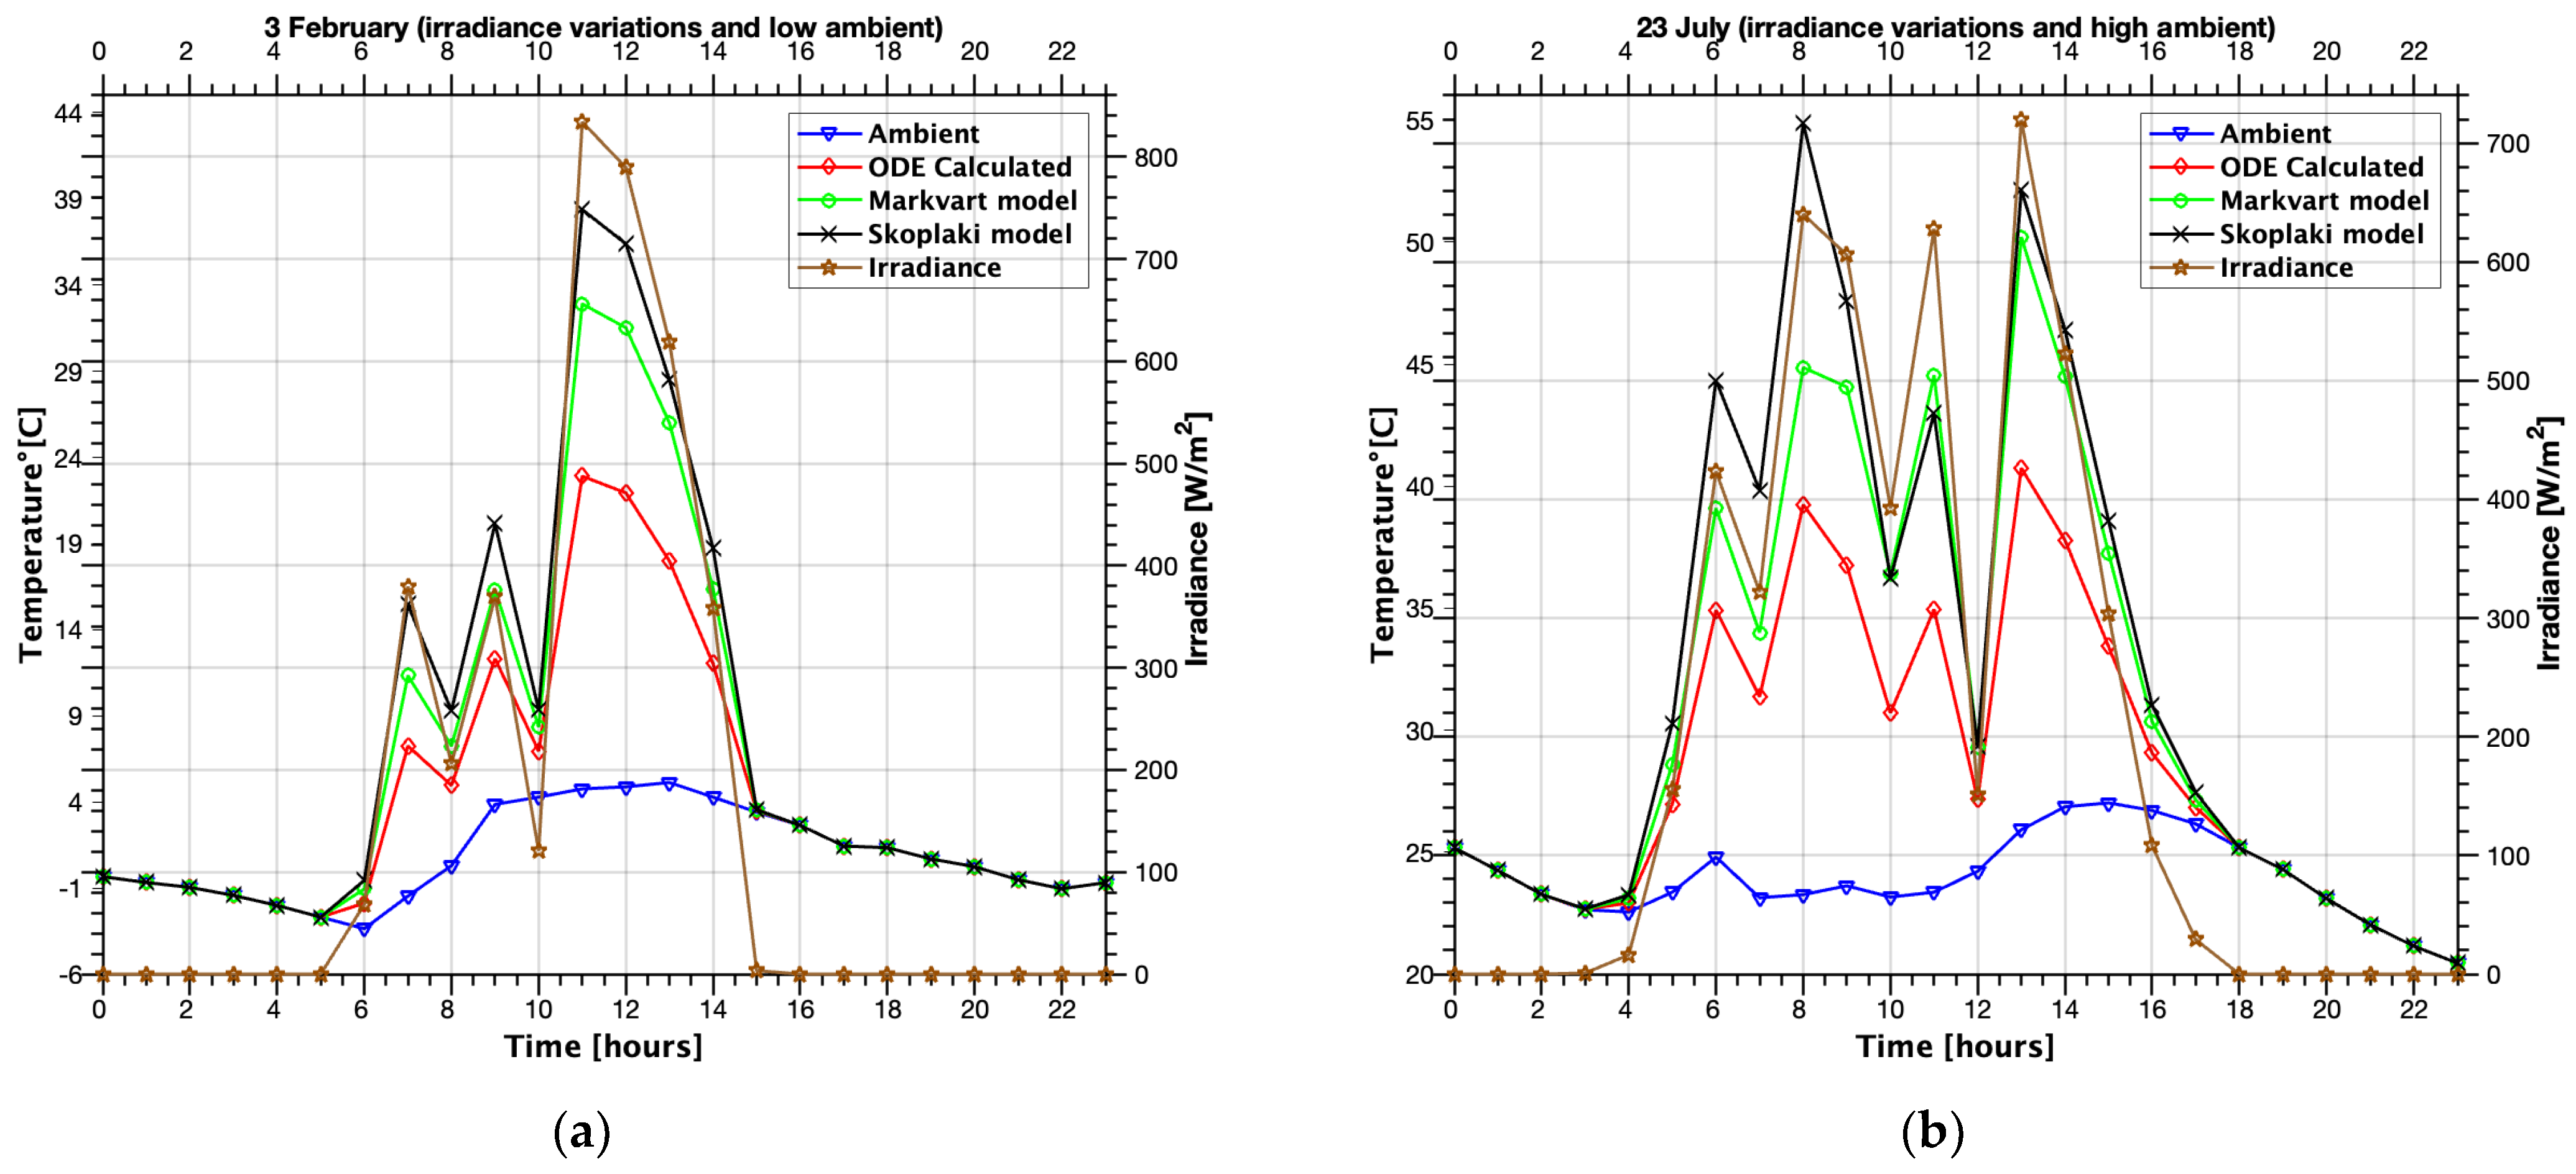
Figure 9 and Figure 10 demonstrate the performance of the wind-dependent and wind-independent models, compared with the ODE model under varying weather conditions. The most significant discrepancies occur during high irradiance, low ambient temperature conditions (5 March), where both simple models substantially overestimate cell temperature, with the Skoplaki model showing the largest deviation. The figures clearly illustrate the ODE model’s ability to capture thermal lag effects during rapid irradiance changes, while the simple models respond instantaneously to irradiance variations, leading to unrealistic temperature spikes and drops.
Table 4 reveals the viability of both simple models under varying seasonal conditions. The results demonstrate that the combined effect of higher ambient temperatures, greater solar irradiance, and the thermal inertia effects being more pronounced during summer conditions contributes to reduced model accuracy. Days with high irradiance variations (3 February and 23 July) show that the Markvart model maintains better stability, with consistently lower error metrics across all selected varying seasonal conditions.

4. Discussion

Generally, the simpler models overestimate temperature, which is in accordance with the literature [10]. On the other hand, the ODE model captures real behaviour, which accounts for the thermal inertia of the material.
Under typical operating conditions, the discrepancy between the simpler models and the ODE model is higher on summer days compared with winter days. One explanation accounting for the fact that the Markvart model performs better during low-wind conditions compared with the Skoplaki model could be that the wind-dependent correction factor in the Skoplaki model becomes less accurate at low wind speeds. In contrast, the Markvart model, being wind-independent, relies on established NOCT conditions that are more representative of low-wind scenarios, making it inherently better-suited for such conditions.
Simple models can be applied under moderate meteorological conditions, particularly during periods with stable ambient temperature and minimal irradiance fluctuations, for rapid engineering estimates. Simple models also prove adequate for initial system sizing applications, comparative studies between regions with similar climates, and conditions with constant moderate wind speeds (2–4 m/s), where differences between simple and complex models become significantly reduced. Conversely, rapid irradiance variations during intermittent cloud cover prevent simple models from capturing real thermal response, while applications requiring high precision cannot tolerate the errors. Additionally, systems with high thermal mass, such as building-integrated modules, very low-wind conditions below 1 m/s, and any transient behaviour analysis, render static models inadequate due to their inability to account for thermal inertia effects.
Regarding different geographical contexts, the model selection criteria developed here are directly applicable to central and eastern European locations with similar continental climates, regions with moderate wind speeds (1–5 m/s average), and areas with significant seasonal temperature variations. Adaptations to the current model may be necessary for different climate zones, including desert climates (where thermal inertia effects become more pronounced due to large temperature variations), tropical climates (accounting for different humidity effects), arctic conditions (requiring adjusted heat transfer coefficients for extreme temperature ranges), and coastal areas (requiring modified wind-dependent correlations).

5. Conclusions

This study presents a comprehensive annual evaluation of PV cell temperature prediction models for central/eastern European climate conditions, addressing a critical gap in the literature regarding model selection criteria. In this regard, a time-dependent model has been developed and validated with experimental measurements provided by other authors, which is composed of an ordinary differential equation describing cell temperature variation with time. Because there are many simple steady-state models proposed in the literature, we chose to evaluate one well-known wind-independent model (Markvart) and another well-known wind-dependent model (Skoplaki). The results revealed that in most cases, the simpler models overestimate temperature. This difference is higher on summer days compared with winter days. When comparing similar days with low and high wind, respectively, it was observed that the Markvart model is closer to reality during low-wind conditions. The difference is mainly caused by the fact that the time-dependent model also takes into account the PV module thermal inertia, which is disregarded in the simpler models.
For practical applications, the Markvart model can be confidently used for rapid estimates under moderate meteorological conditions. Applications requiring high accuracy should employ the dynamic ODE model or other complex models that consider thermal inertia, especially under rapid irradiance variations. Simple models serve effectively as preliminary validation tools for rapid verification of complex model results but should never be the sole calculation method. The seasonal dependency of model reliability, with winter performance being significantly better than summer, provides valuable guidance for planning measurement and validation. The study identified critical limitations of simple models, particularly their failure to capture transient thermal effects. These fundamental limitations must be carefully considered in engineering applications to prevent significant calculation errors that could compromise system design or performance assessments.
Simple models provide adequate accuracy for preliminary feasibility studies and site selection comparisons, educational and training applications where understanding basic thermal behaviour is prioritized over precision, small residential rooftop systems where investment in complex modelling is not economically justified, monthly or seasonal energy yield calculations where daily thermal variations average out, and comparative studies between different PV technologies under standardized conditions. Conversely, dynamic models become indispensable for performance warranty validation requiring high accuracy, building-integrated PV systems where thermal interaction with the building envelope is critical, concentrated PV systems where thermal management affects safety, real-time maximum power point tracking optimization in advanced inverters, thermal stress analysis for module reliability assessment, research and development of new PV technologies, and large-scale installations where small efficiency improvements justify the computational complexity.
Future research should focus on developing standardized model selection criteria that help practitioners choose appropriate temperature prediction approaches based on specific application requirements and local meteorological conditions. Moreover, the present model could be further developed to integrate energy yield prediction for improved system performance assessment. Another future direction that directly emerges from this work could be the extension of the ODE approach to photovoltaic–thermal (PV/T) systems, accounting for fluid cooling effects and thermal storage. Furthermore, hybrid models could be developed that combine the physical insights of the ODE approach with data-driven machine learning for enhanced accuracy across diverse conditions. The present model could also be integrated with thermal management systems for active cooling control and performance optimization in large-scale installations.

Supplementary Materials

The following supporting information can be downloaded at: https://www.mdpi.com/article/10.3390/en18195239/s1.

Author Contributions

Conceptualization, methodology, writing—review and editing, I.Ş., C.S., P.Ş. and I.G.; software, I.Ş. All authors have read and agreed to the published version of the manuscript.

Funding

This research received no external funding.

Data Availability Statement

Data is contained within the article or Supplementary Materials.

Conflicts of Interest

The authors declare no conflicts of interest.

Abbreviations

The following abbreviations are used in this manuscript:
PVPhotovoltaic module
BIPVBuilding-integrated photovoltaic panels
NOCTNormal operating cell temperature
SNLSandia National Laboratory

References

  1. Bayrak, F. Prediction of photovoltaic panel cell temperatures: Application of empirical and machine learning models. Energy 2025, 323, 135764. [Google Scholar] [CrossRef]
  2. Chouder, A.; Silvestre, S.; Taghezouit, B.; Karatepe, E. Monitoring, modelling and simulation of PV systems using LabVIEW. Sol. Energy 2013, 91, 337–349. [Google Scholar] [CrossRef]
  3. Markvart, T. Solar Electricity, 2nd ed.; John Wiley & Sons, Ltd.: Chichester, UK, 2000. [Google Scholar]
  4. Nicoletti, F.; Cucumo, M.A.; Ferraro, V.; Kaliakatsos, D.; Gigliotti, A. A Thermal Model to Estimate PV Electrical Power and Temperature Profile along Panel Thickness. Energies 2022, 15, 7577. [Google Scholar] [CrossRef]
  5. Boudjelthia, E.A.K.; Abbas, M.L.; Semaoui, S.; Kerkouche, K.; Zeraïa, H.; Yaïche, R. Role of the wind speed in the evolution of the temperature of the PV module: Comparison of prediction models. Rev. Energ. Renouvelables 2016, 19, 119–126. [Google Scholar] [CrossRef]
  6. Lamaamara, I.; Tiliouaa, A.; Zaida, Z.B.; Babaouia, A.; Ettaknib, M.; Alaoui, M.A.H. Evaluation of different models for validating of photovoltaic cell temperature under semi-arid conditions. Heliyon 2021, 7, e08534. [Google Scholar] [CrossRef] [PubMed]
  7. Yaman, K.; Arslan, G. A detailed mathematical model and experimental validation for coupled thermal and electrical performance of a photovoltaic (PV) module. Appl. Therm. Eng. 2021, 195, 117224. [Google Scholar] [CrossRef]
  8. Santos, L.O.; Carvalho, P.C.M.; Filho, C.O.C. Photovoltaic Cell Operating Temperature Models: A Review of Correlations and Parameters. IEEE J. Photovolt. 2022, 12, 179–190. [Google Scholar] [CrossRef]
  9. Mattei, M.; Notton, G.; Cristofari, C.; Muselli, M.; Poggi, P. Calculation of the polycrystalline PV module temperature using a simple method of energy balance. Renew. Energy 2006, 31, 553–567. [Google Scholar] [CrossRef]
  10. Trinuruk, P.; Sorapipatana, S.; Chenvidhya, D. Estimating operating cell temperature of BIPV modules in Thailand. Renew. Energy 2009, 34, 2515–2523. [Google Scholar] [CrossRef]
  11. Nicola, M.; Berwind, M. Improving Module Temperature Prediction Models for Floating Photovoltaic Systems: Analytical Insights from Operational Data. Energies 2024, 17, 4289. [Google Scholar] [CrossRef]
  12. Filho, J.F.B.D.F.; Neves, W.L.A.; Costa, F.B. Photovoltaic Module Temperature Prediction Model Incorporating Wind Direction and Precipitation Effects. IEEE J. Photovolt. 2025, 15, 701–711. [Google Scholar] [CrossRef]
  13. Wang, K.; Wang, L.; Meng, Q.; Yang, C.; Lin, Y.; Zhu, J.; Zhao, Z.; Zhou, C.; Zheng, C.; Gao, X. Accurate photovoltaic power prediction via temperature correction with physics-informed neural networks. Energy 2025, 328, 136546. [Google Scholar] [CrossRef]
  14. Kim, Y.M.; Lee, H.L.; Park, J.; Moon, S.J. Predicting module temperature and photovoltaic electricity generation using meteorological data. J. Mech. Sci. Technol. 2024, 38, 5123–5133. [Google Scholar] [CrossRef]
  15. Skoplaki, E.; Boudouvis, A.G.; Palyvos, J.A. A simple correlation for the operating temperature of photovoltaic modules of arbitrary mounting. Sol. Energy Mater. Sol. Cells 2008, 92, 1393–1402. [Google Scholar] [CrossRef]
  16. Kalogirou, S.A. Solar Energy Engineering Processes and Systems, 3rd ed.; Academic Press: London, UK; Elsevier: London, UK, 2024. [Google Scholar]
  17. Tuncel, B.; Ozden, T.; Balog, R.S.; Akinoglu, B.G. Dynamic thermal modelling of PV performance and effect of heat capacity on the module temperature. Case Stud. Therm. Eng. 2020, 22, 100754. [Google Scholar] [CrossRef]
  18. Bostan, I.; Dulgheru, V.; Sobor, I.; Bostan, V.; Sochirean, A. Sisteme de Conversie a Energiilor Regenerabile; Tehnica-Info: Chișinău, Moldova, 2007. [Google Scholar]
  19. Photovoltaic Geographical Information System (PVGIS). An Official Website of the European Union. Available online: http://re.jrc.ec.europa.eu/pvgis/apps4/pvest.php (accessed on 10 December 2024).
  20. Șișu, P.; Goga, E.I.; Stanciu, C.; Stanciu, D.; Constantin, A.; Șoriga, I. Optimum Tilt For Maximum Yearly Electric Energy Of a Photovoltaic Module Operating In Bucharest. In Proceedings of the 16th International Conference on Thermal Engineering ICTEA, Bucharest, Romania, 18–20 June 2025. [Google Scholar]
Figure 1. Ref. [7] measured solar irradiance and wind speed: (a) winter day of 30 January; (b) summer day of 19 June.
Energies 18 05239 g001
Figure 2. Measured and calculated cell temperature and measured ambient temperature: (a) winter day of 30 January; (b) summer day of 19 June.
Energies 18 05239 g002
Figure 3. Calculated versus measured cell temperatures: (a) winter day of 30 January; (b) summer day of 19 June.
Energies 18 05239 g003
Figure 4. Weather conditions for four selected days: (a) ambient temperature; (b) solar irradiance; (c) wind speed.
Energies 18 05239 g004aEnergies 18 05239 g004b
Figure 5. Cell temperature obtained with the ODE, Markvart, and Skoplaki models, ambient temperature and solar irradiance: (a) winter day of 14 January (low wind); (b) winter day of 23 January (high wind).
Energies 18 05239 g005
Figure 6. Cell temperature obtained with the ODE, Markvart, and Skoplaki models, ambient temperature and solar irradiance: (a) summer day of 19 June (low wind); (b) summer day of 12 June (high wind).
Energies 18 05239 g006
Figure 7. Accuracy indicator values: (a) RMSE; (b) rRMSE.
Energies 18 05239 g007
Figure 8. Weather conditions for additionally selected days: (a) ambient temperature; (b) solar irradiance; (c) wind speed.
Energies 18 05239 g008aEnergies 18 05239 g008b
Figure 9. Cell temperature obtained with the ODE, Markvart, and Skoplaki models, ambient temperature and solar irradiance: (a) 5 March (high irradiance, low ambient); (b) 25 July (high irradiance, highest ambient).
Energies 18 05239 g009
Figure 10. Cell temperature obtained with the ODE, Markvart, and Skoplaki models, ambient temperature and solar irradiance: (a) 3 February (irradiance variations and low ambient); (b) 23 July (irradiance variations and high ambient).
Energies 18 05239 g010
Table 1. PV electrical and physical characteristics [7].
ParameterSymbolValueUnit
Maximum Power P M , s t 270W
Open Circuit Voltage U 0 , s t 38V
Short Circuit CurrentIsc,st9.2A
Maximum Power Voltage U M 31V
Maximum Power Current I M 8.7A
Module Efficiency η s t 16.45%
Length L 1648mm
Width W 995mm
Active Area A m o d u l e 1.64m2
Voltage Temperature Coefficient μ U 0 −0.34%/°C
Current Temperature Coefficient μ I s c 0.06%/°C
Nominal Operating Cell Temperature t N O C T 47°C
Standard Test Conditions Temperature T c , s t 25°C
Solar Absorptance-Transmittance Product τ α 0.9[-]
Table 2. Errors obtained between calculated and measured values.
IndicatorUnitSummerWinter
rRMSE%3.8511809054.396517861
rMBE%1.2481913680.974324998
RMSE°C1.3986358190.921622656
Mmed°C36.317063620.96255912
MBE°C0.4533064530.204243454
R2-0.97080.9511
Table 3. Errors obtained between the simple models and the ODE model results for the whole year.
IndicatorUnitAnnual Markvart vs. ODEAnnual Skoplaki vs. ODE
rRMSE%22.795639.1309
rMBE%12.055220.59
RMSE°C4.25227.2993
MBE°C2.24873.8408
R2-0.90380.7166
Table 4. Errors obtained between the simple models and ODE model for selected days.
DayModelrRMSE [%]rMBE [%]RMSE [°C]MBE °CMmed °CR2 [-]
5 MarchMarkvart35.657817.63943.91121.934810.96870.8434
Skoplaki82.713546.01889.07265.04770.1574
25 JulyMarkvart13.63128.61425.24173.312538.45410.8161
Skoplaki24.026115.80249.2396.07670.4286
3 Febr.Markvart83.705842.89393.62571.85794.33140.7655
Skoplaki129.773968.57595.62112.97030.4365
23 JulyMarkvart14.1688.85024.04052.52428.51880.5587
Skoplaki21.060513.35526.00623.80870.025
Disclaimer/Publisher’s Note: The statements, opinions and data contained in all publications are solely those of the individual author(s) and contributor(s) and not of MDPI and/or the editor(s). MDPI and/or the editor(s) disclaim responsibility for any injury to people or property resulting from any ideas, methods, instructions or products referred to in the content.