Article

Research on Green Distribution Problems of Mixed Fleets Considering Multiple Charging Methods

Automobile Business School, Hubei University of Automotive Technology, Shiyan 442002, China
*
Author to whom correspondence should be addressed.
Energies 2025, 18(19), 5220; https://doi.org/10.3390/en18195220
Submission received: 21 August 2025 / Revised: 21 September 2025 / Accepted: 24 September 2025 / Published: 1 October 2025
(This article belongs to the Special Issue Advanced Low-Carbon Energy Technologies)

Abstract

Against the backdrop of global emissions reduction and transportation electrification, electric vehicles are gradually replacing traditional fuel vehicles for delivery. However, issues such as limited range and charging times often conflict with time window service requirements. To balance economic and environmental performance, mixed fleets and multi-method charging strategies have emerged as viable approaches. This study addresses the problem by developing a mixed-integer programming model that incorporates multiple charging methods and carbon emission accounting. An Improved Adaptive Large Neighborhood Search (IALNS) algorithm is proposed, featuring multiple Removal and Insertion operators tailored for customers and charging stations, along with two local optimization operators. The algorithm’s superiority and applicability are validated through simulation and comparative analysis on benchmark instances and real-world data from an urban courier network. Sensitivity analysis further demonstrates that the proposed algorithm effectively coordinates vehicle type and charging mode selection, reducing total costs and carbon emissions while ensuring service quality. This approach provides practical reference value for operational decision-making in mixed fleet delivery.

1. Introduction

Based on figures issued by the International Energy Agency, 2023 witnessed a 1.1% growth in global energy-associated CO2 emissions. The emissions rose by 410 million tonnes compared to prior levels, ultimately hitting a record-breaking 37.4 billion tonnes. The transportation sector exhibited the most significant growth, contributing nearly 240 million tonnes to this increase [1]. To achieve the ambitious goal of the Paris Agreement to limit global warming to 1.5 °C to 2 °C by the end of the century, and in response to the pronounced rise in transportation-related carbon emissions, many automakers, supported by government policies, have begun transitioning to greener vehicles by replacing traditional fuel vehicles (FVs) with new energy vehicles. These include fuel cell vehicles powered by hydrogen, methanol, or ethanol, as well as plug-in hybrid vehicles, with battery electric vehicles (EVs) being the most widely adopted. EVs offer advantages such as zero emissions [2], high efficiency, and low noise [3,4,5], promoting environmental sustainability [6,7,8]. However, EVs face challenges in practical transportation applications. The uneven distribution of charging infrastructure across cities impacts route planning [9,10], and the relatively long charging times, compared to the refueling times of traditional FV, can lead to delays in meeting specific service time windows for customers [11,12]. To address these challenges, various charging strategies have been proposed. Partial charging involves charging the battery to the required level at charging stations based on the assigned route, thereby reducing charging time. However, frequent partial charging in long-distance, multi-customer deliveries may adversely affect battery lifespan [13,14,15]. Battery swapping significantly reduces recharging time and can extend vehicle lifespan, but its adoption is limited by challenges in battery standardization, as different vehicle models and manufacturers use non-uniform battery specifications. Additionally, the construction of battery-swapping stations, battery standardization, and the establishment of supporting logistics systems require substantial upfront investment, making the approach less economically viable for small-scale fleets [16,17,18]. Another approach incorporates multiple charging modes into the Electric Vehicle Routing Problem (EVRP) model, allowing vehicles to select different charging methods and amounts at various station types to optimize overall travel time and costs [19,20,21]. Furthermore, some studies suggest using a mixed fleet of FVs and EVs, where FVs handle time-sensitive, long-distance, or infrastructure-scarce orders, while EVs are prioritized for short-distance, charging-accessible delivery tasks, thereby reducing time window penalties and operational costs [22,23].
The Mixed Fleet Green Vehicle Routing Problem with Time Windows and Charging Problems (MFGVRPTW-C) is a variant of the classical Vehicle Routing Problem (VRP), focusing on a mixed fleet of FVs and EVs, where EVs can select from three methods at charging stations: slow charging, fast charging, and battery swapping. This complexity makes the MFGVRPTW-C more challenging than traditional VRP variants. To our knowledge, most research has focused on improving charging strategies for pure EV fleets, with limited attention to mixed fleets due to carbon emission considerations, leaving the MFGVRPTW-C largely unresolved. This study comprehensively addresses charging and carbon emission issues in mixed fleets by developing a new mixed-integer programming model. We propose an IALNS algorithm tailored to the problem, validated through computational experiments using benchmark datasets and a real-world case study, demonstrating the effectiveness of IALNS in solving the MFGVRPTW-C.
The main contributions of this study are threefold:
  • We propose the MFGVRPTW-C model, which integrates mixed fleet route planning, time windows, multi-mode charging, and carbon cost accounting, achieving unified optimization under a single objective. 
  • We design an IALNS framework tailored to the problem, incorporating problem-specific construction methods, operators, and local improvement strategies, jointly addressing charging mode selection.
  • Through benchmark tests and a real-world case study, we provide managerial insights into how fleet composition and charging methods influence cost and emission outcomes.
The remainder of the paper is organized as follows: Section 2 summarizes the relevant literature; Section 3 describes the problem and the mathematical model; Section 4 details the proposed IALNS framework, including construction methods, operators, and adaptive control mechanisms; Section 5 presents the computational experiments, real-world case study, and sensitivity analysis; and Section 6 summarizes the paper and suggests directions for future research.

2. Literature Review

The Vehicle Routing Problem (VRP), first introduced by Dantzig and Ramser [24], is a classic combinatorial optimization problem. Over the years, with increasing research depth and growing emphasis on environmental protection, the Green Vehicle Routing Problem (GVRP) has emerged as a prominent research direction in this field. Early GVRP studies primarily focused on pollution routing problems for FV [25,26] In 2012, Erdogan and Miller-Hooks formally introduced the concept of GVRP  [27] with emission reduction as its core objective, shifting the research focus toward alternative fuel vehicles (AFVs), particularly electric vehicles.
Catay and Keskin [28] investigated the EVRPTW under the scenarios of single charging and quick charging, respectively, and proposed two corresponding mathematical models for these two cases. Experiments conducted on small-scale instances showed that the quick charging strategy is effective in reducing the fleet size. Felipe et al. [29] proposed a simulated annealing algorithm with local search for EVRPTW, incorporating multiple charging technologies (slow, medium, and fast) to address charging decisions and large-scale solution requirements. Keskin and Çatay [30] introduced partial recharging into EVRPTW, developing an Adaptive Large Neighborhood Search (ALNS) algorithm tested on the benchmark dataset of Schneider. Results showed that partial charging reduces vehicle dwell time at charging stations in narrow time window scenarios, though the study lacks consideration of charging station service capacity and queuing behavior. Zhao et al. [31] extended EVRPTW with multiple charging technologies, incorporating public charging station capacity and queuing behavior, and solved the problem using an α -cuts-based algorithm. Aljabri et al. [32] addressed long charging times and limited range in urban EV delivery, which struggle to meet time window constraints, and the lack of integration of mobile battery swapping resources. They proposed an EVRPTW with battery swapping and energy consumption, using battery swapping instead of traditional wired charging. A hybrid genetic algorithm was developed, with instances demonstrating that mobile battery swapping significantly optimizes delivery routes, particularly when swapping time and costs are low, leading to substantial total cost reductions. Kancharla et al. [33] addressed limitations in EVRP studies regarding non-linear charging and load-dependent discharging, proposing a three-index formulation for EVRP with non-linear charging and load-dependent discharging, solved using an ALNS algorithm. The study showed that incorporating piecewise linear relationships between charging time and state of charge enhances routing accuracy in non-linear charging scenarios.
Considering the fleet’s scale and composition, Ren et al. [34] proposed an improved Variable Neighborhood Search (VNS) algorithm with a selection mechanism for the mixed fleet delivery problem with time windows and charging stations. Ding et al. [35] introduced a two-stage delivery approach using a mixed fleet of electric and FV with intermediate depot scheduling to address EV range limitations. By employing Level 3 fast charging with partial charging, computational experiments demonstrated reduced charging infrastructure demands and significant improvements in routing efficiency. Dönmez et al. [36] studied a mixed fleet VRP with time windows, partial charging, and multiple charging piles, considering piecewise linear load-dependent energy consumption for EVs and three charging modes (slow, medium, and fast). An ALNS algorithm was designed, showing that multi-technology charging strategies effectively balance time and cost.
Ropke et al. [37] introduced the ALNS algorithm, inspired by Large Neighborhood Search (LNS), incorporating adaptive weight allocation and multi-operator collaboration, establishing ALNS as a significant method for solving VRP and its variants [38,39]. Amiri et al. [40] integrated simulated annealing and tabu search into ALNS, validating its effectiveness for mixed fleet delivery problems through instance-based experiments. Ma et al. [22] designed tailored removal and repair operators to address the characteristics of mixed fleet vehicle routing and proposed two customized acceptance criteria with complementary scoring mechanisms, effectively preventing the Adaptive Large Neighborhood Search (ALNS) algorithm from converging to local optima in a dynamic on-demand meal delivery system. Xue et al. [41] introduced a Time Slack Calculation Strategy into ALNS, enabling exploration of more feasible solutions and significantly improving the success rate of insertion operators. This approach efficiently addressed customized bus services with heterogeneous fleets and multiple candidate locations, providing theoretical and practical support for enhancing public transportation flexibility and profitability. Wang et al. [42] addressed the Mixed Fleet Vehicle Routing Problem (MFVRP) for transporting hazardous material goods, balancing transportation efficiency and sustainability. They developed a bi-objective MINLP model with fuzzy time windows and utilized intuitionistic fuzzy sets to optimize ALNS scoring mechanisms and operator selection. Numerical experiments demonstrated superior performance compared to standard ALNS and Ant Colony Optimization (ACO). Mo et al. [43] proposed a novel bi-level particle swarm-adaptive large neighborhood search (BL-PSO-ALNS) algorithm for the multi-period heterogeneous fleet vehicle routing problem with self-pickup point selection, achieving higher efficiency than standard ALNS and Particle Swarm Optimization (PSO).
A review of the literature reveals that, despite progress in related research, few studies have integrated mixed fleets, multi-mode charging (slow charging, fast charging, and battery swapping), time window constraints, and carbon emissions into a unified framework while providing scalable algorithms with electric vehicle (EV)-specific operators. To address this gap, this study develops an integrated model and proposes an IALNS algorithm tailored for charging mode selection to solve the model. The study of the mixed fleet green vehicle routing problem with multiple charging models is of significant importance to both transportation companies and academic researchers.

3. Problem Description and Mathematical Formulations

3.1. Problem Description

The Mixed Fleet Green Vehicle Routing Problem with Time Windows and Charging Problems studied in this paper is a variant of the Vehicle Routing Problem (VRP), which can be specifically described as follows:
In the distribution network G = ( N , E ) , there is one distribution center, n customers, and r charging stations, where N = D C R represents the set of all nodes, including the distribution center, customer service points, and charging stations. The edge set is defined as E = { ( i , j ) i , j N , i j } . The vehicle fleet at the distribution center is denoted by K d = K f K e , where K f represents the set of conventional FV and K e represents the set of electric vehicles. The distribution center employs both electric and FV to serve n customer nodes with known locations, time windows, service times, and demands, returning to the distribution center afterward. To account for environmental factors, carbon emissions are considered for both vehicle types during the delivery process.
Electric vehicles start from the distribution center with a full battery. During delivery, if the battery level is insufficient to reach the next customer node, the vehicle selects a nearby charging station r for recharging. At each charging station, three charging methods are available: slow charging (SC), fast charging (FC), and battery swapping (BS). Each charging method has a distinct unit charging cost C m and charging power g m . Although fast charging requires less time, its unit charging cost is higher. Throughout the delivery process, electric vehicles must not violate the minimum battery level formula, and each electric vehicle is limited to a single charging event. This is illustrated in Figure 1.
The relevant assumptions of the model are as follows:
(1)
Each customer is exclusively served once by one vehicle (either fuel-powered or electric), with customer demand non-splittable.
(2)
When a vehicle arrives at a customer node or charging station, its engine is turned off, resulting in no energy consumption or carbon emissions.
(3)
Each charging station has no capacity limit, allowing multiple vehicles to receive charging or battery-swapping services simultaneously. Only one charging method can be selected per vehicle, the charging amount is linearly proportional to the charging time, and each vehicle is limited to a single charging event.
(4)
The two types of delivery vehicles (fuel and electric) are homogeneous within their respective types and have the same travel speed.
(5)
During the delivery process, a sufficient number of EVs and FVs are available for selection; that is to say, there is no restriction on the number of fuel-powered vehicles and electric vehicles.

3.2. Mathematical Formulations

3.2.1. Objective Function

The objective function of the MFGVRPTW-C is to minimize the total cost, which includes the fixed costs, transportation costs, time window penalty costs, carbon emission costs, and charging costs.
Fixed Cost ( C 1 ): The fixed cost includes expenses such as vehicle acquisition and employee wages, which are allocated to each delivery vehicle. The fixed cost is calculated as follows:
C 1 = j C k K f h 1 x 0 j k + j C k K e h 2 x 0 j k
where h 1 and h 2 represent the unit fixed costs for fuel and electric vehicles, respectively.
Transportation Cost ( C 2 ):
C 2 = ( i , j ) E k K f h 3 d i j x i j k + ( i , j ) E k K e h 4 d i j x i j k
where h 3 and h 4 denote the unit transportation costs for FV and EV, respectively, and E is the set of arcs.
Time Window Penalty Cost ( C 3 ): Each customer node has a specific time window for receiving service. If a vehicle arrives outside this time window, a time window penalty cost is incurred. The time window penalty cost is calculated as follows:
C 3 = j C k K d h 5 max ( e j t j k 1 , 0 ) + h 6 max ( t j k 1 l j , 0 )
where h 5 and h 6 represent the penalty costs for early and late arrivals, respectively, and [ e j , l j ] is the time window for customer j.
Carbon Emission Cost ( C 4 ): Carbon emissions for fuel vehicles (FV) are measured using the Fuel Consumption Rate (FCR) model; i.e., the total vehicle weight is inversely proportional to the mileage per unit fuel, and this relationship is further translated into a positive correlation between the FCR and total vehicle weight [44], while carbon emissions for electric vehicles during operation are evaluated using a Life Cycle Assessment (LCA) approach. The FCR for FV with load Q 1 is given by the following:
ρ ( Q 1 ) = ρ 0 + ( ρ ρ 0 ) Q 1 Q f
where ρ 0 is the FCR at no load, ρ is the FCR at full load, and Q f is the maximum load capacity of FV. The carbon emission cost for FV is as follows:
i D 1 j D 2 k K f h 7 θ x i j k ρ ( q i j k ) d i j
where h 7 is the unit carbon emission cost for FV, and θ is the carbon dioxide conversion factor. For electric vehicles, the carbon emission cost is as follows:
i , j N k K e B a d i j x i j k α η
where α is the proportion of thermal power in the electricity mix, η is the carbon dioxide emission factor (in kg/kWh), and B a is the energy consumption rate. The total carbon emission cost is as follows:
C 4 = i D 1 j D 2 k K f h 7 θ x i j k ρ ( q i j k ) d i j + i , j N k K e B a d i j x i j k α η
Charging Cost ( C 5 ):
C 5 = k K e i R ( B e E i k 1 ) ( α i k C m 1 + β i k C m 2 ) + γ i k C m 3
where C m 1 and C m 2 are the unit costs for slow and fast charging, respectively, and C m 3 is the cost for battery swapping.

3.2.2. Model Formulation

The model of MFGVRPTW-C is proposed as follows:
min Z = C 1 + C 2 + C 3 + C 4 + C 5
s.t.
i D 1 k K f x i j k + i D 1 k K e x i j k = 1 j C
i D 1 x i j k = i D 1 x j i k j D 2 , k K d
j C x o j k i D x i ( n + 1 ) k = 0 k K d
i D 1 j D 2 q i x i j k Q e k K e
i D 1 j D 2 q i x i j k Q c k K f
i N j q i j k i N j q j i k + M 1 i N j x i j q i j C , k K d
E i k 2 = B e i R { 0 } , k K e
E i k 1 = E i k 2 i C , k K e
B e ( 1 x i j k ) + E i k 2 B a d i j x i j k E i k 1 i D 1 , j D 2 , k K e
E i k c = ( B e E i k 1 ) i R , k K e
E i k c = 0 i C , k K e
α i k + β i k + γ i k j D 2 x 0 j k i R , k K e
E i k 1 0 i D 2 , k K e
T i k 1 + W i k + S i + t i j · x i j k M ( 1 x i j k ) T j k 1 i C , j N j , k K d
t i j = d i j x i j k V i D 1 , j D 2 , k K d
t i k c = ( B e E i k 1 ) α i k g 1 + ( B e E i k 1 ) β i k g 2 + γ i k p i R , k K e
t i k 1 + t i k c + t i j · x i j k M ( 1 x i j k ) t j k 1 i R , j N i , k K e
t i k 2 = t i k 1 + W i k + S i i C , k K d
t i k 2 = t i k 1 + t i k c i R , k K e
x i j k { 0 , 1 } i , j N , k K d
α i k , β i k , γ i k { 0 , 1 } k K e , i R
Formula (10) guarantees each customer node is exclusively served once by one vehicle, while Formula (11) enforces flow balance by requiring the number of vehicles arriving at and departing from each node to be equal. Formula (12) mandates that all vehicles depart from and return to the depot after completing their routes. Load capacity Formulas (13) and (14) limit the total demand served by electric and fuel vehicles to their respective maximum capacities Q e and Q f , while Formula (15) ensures demand satisfaction and eliminates sub-tours through load conservation across routes.
For electric vehicles, Formulas (16)–(22) govern battery management and charging operations. Formula (16) specifies that electric vehicles depart from the depot or charging stations with full battery level B e , while (17) indicates no battery consumption during customer service. Battery level transitions between consecutive nodes are modeled by Formula (18), and the energy recharged at charging stations is calculated by Formula (19). Formula (20) prohibits recharging at customer nodes, while (21) restricts vehicles to selecting at most one charging mode per charging station visit. Battery level feasibility is maintained by Formula (22), ensuring non-negative battery levels throughout the route.
Time window and scheduling Formulas (23)–(28) manage temporal aspects of the routing problem. Formulas (23) and (26) define time progression for vehicles traveling from customer nodes and charging stations to subsequent nodes, respectively. Travel time calculations are specified by Formula (24), while charging time computations based on selected methods are given by Formula (25). Time relationships between arrival and departure are updated by Formulas (27) and (28) for customer nodes and charging stations, accounting for waiting, service, and charging times. Finally, Formulas (29) and (30) define the binary nature of routing and charging mode selection variables.

4. IALNS Algorithm

The Mixed Fleet Green Vehicle Routing Problem with Time Windows and Charging (MFGVRPTW-C) studied in this paper is an NP-hard problem. Building on the traditional Vehicle Routing Problem (VRP), it incorporates a mixed fleet of fuel and electric vehicles, vehicle charging, and the impact of charging mode selection on costs and time windows. These factors significantly increase the complexity of the problem, making it challenging for existing exact algorithms to obtain optimal solutions within a reasonable time frame for medium- and large-scale instances.
To address this, the paper adopts the Adaptive Large Neighborhood Search (ALNS) algorithm. Initially designed for the Vehicle Routing Problem with Backhauls (VRPB), ALNS includes multiple destruction and repair operators that are adaptively selected during iterations, making it an attractive choice for solving VRP and its variants [45]. In recent years, ALNS has been widely applied to solve distribution problems with mixed fleets [40] and green vehicle routing problems with time windows [46], achieving promising results.
Based on this, the paper proposes an IALNS algorithm, enhancing the original ALNS with the following improvements:
  • Employing the K-means clustering method to generate an initial feasible solution.
  • Designing distinct removal and repair operators for customer nodes and charging stations, tailored to the transportation process of a mixed fleet.
  • Developing two local optimization operators to accelerate convergence.

4.1. Encoding Scheme

The algorithm employs an integer encoding scheme to represent the elements of a mixed fleet vehicle routing problem with charging strategies. The depot is denoted by 0, customer nodes by 1 to n, and charging stations by n + 1 to n + r , where n is the number of customers and r is the number of charging stations. Charging methods are encoded as n + r + 1 for slow charging, n + r + 2 for fast charging, and n + r + 3 for battery swapping. FV are assigned numbers from n + r + 3 + 1 to n + r + 3   +   | K f | , and electric vehicles from n + r + 3   +   | K f |   +   1 to n + r + 3   +   | K f |   +   | K e | , where | K f | and | K e | represent the number of FVs and EVs, respectively. Each vehicle corresponds to a unique route in a set defined by the maximum number of vehicles. For instance, in a problem with 10 customers, 4 vehicles (2 fuel and 2 electric), and 2 charging stations, nodes 1 to 10 represent customers, 11 to 12 represent charging stations, 13 to 15 denote charging methods (slow charging, fast charging, and battery swapping), 16 to 17 represent FV, and 18 to 19 represent electric vehicles. An initial feasible solution is given as [[0,5,10,9,0], [0,2,6,0], [0,3,11,15,1,0], [0,10,8,7,12,13,0]], with the double comma in the last route assumed to be a typo and corrected. The decoded delivery plan is as follows: Route 1 (Fuel Vehicle 16)—Depot 0 → Customer 5 → Customer 10 → Customer 9 → Depot 0; Route 2 (Fuel Vehicle 17)—Depot 0 → Customer 2 → Customer 6 → Depot 0; Route 3 (Electric Vehicle 18)—Depot 0 → Customer 3 → Charging Station 11 (Battery Swapping) → Customer 1 → Depot 0; Route 4 (Electric Vehicle 19)—Depot 0 → Customer 10 → Customer 8 → Customer 7 → Charging Station 12 (Slow Charging) → Depot 0.

4.2. Construction of Initial Solutions

This study employs a K-means clustering method to generate an initial feasible solution for the vehicle routing problem. The customer nodes are first clustered using the following approach: the number of clusters K is determined by the formula K = i C d i / max ( Q e , Q f ) , where d i represents the demand of customer i, C is the set of customers, and Q e and Q f denote the load capacities of electric and fuel vehicles, respectively. K initial centroids are randomly sampled from the customer node set, and each customer node is allocated to the closest cluster by computing the Euclidean distance between the node and each centroid, in line with the nearest-neighbor principle. After cluster formation, customer nodes within each cluster are sorted according to the average value of their individual time windows. Once the clustering process is finalized, the initial feasible solution for the distribution routing problem is constructed following the steps detailed below:
Step 1: Prioritize dispatching an electric vehicle from the depot. If the EVs can serve all customers in a cluster without violating load and battery formulas and return to the depot, the route is retained. Otherwise, a fuel vehicle is used, and Step 1 is repeated.
Step 2: Starting from the vehicle’s current position, evaluate the travel time to each unserved customer and compare it with their respective time windows. Prioritize including customers that can be reached within their time windows. If no unserved customer can be reached within their time window, select the customer with the smallest time window violation for insertion into the route. For electric vehicles, battery formulas must also be satisfied. If the battery formula is violated, proceed to Step 3; otherwise, proceed to Step 4.
Step 3: Check if the number of charging events is less than one. If so, identify an available charging station and randomly select a charging mode to recharge, and then continue serving the next customer. Otherwise, proceed to Step 4.
Step 4: Return to the depot.
Step 5: Dispatch a new vehicle and iterate through the previous steps until all customers are served.

4.3. Removal Operators

4.3.1. Customer Node Removal

To optimize the vehicle routing solution, four customer removal strategies and three charging station removal methods are proposed:
Random Removal: This strategy randomly selects several customer nodes from the current solution for removal, introducing randomness to reduce the risk of the algorithm converging to a local optimum.
Worst Time Removal: To improve route feasibility, this method removes the customer with the most severe time window violations. All routes are traversed to compute the time window penalty cost for each customer, which is then sorted, and the customer with the highest penalty is removed.
Zone Removal: The coordinate range of all customer nodes is calculated to define the graph’s boundaries. The graph is partitioned into multiple subregions, and a randomly selected region has all its customer nodes removed from the routes.
Shaw Removal: This strategy computes the similarity S ( i , j ) between pairs of customer nodes i and j, sorts them, and removes nodes with lower similarity. The similarity metric is defined as follows:
S ( i , j ) = α · d i j + β · | t i t j |   +   γ · r i j + ω · | q i q j |
where α , β , γ , and ω are weights; d i j denotes the Euclidean distance between customers i and j; t i and t j stand for the time window lengths of customer i and customer j, respectively; r i j is a binary variable, where ( r i j = 1 ) if customer i and customer j are assigned to the same distribution route, and ( r i j = 1 ) otherwise; and q i and q j denote the demands of customers i and j, respectively. A smaller S ( i , j ) indicates lower similarity between customers i and j.

4.3.2. Charging Station Removal

Random Removal of Charging Stations: Charging stations in the current solution are randomly selected for removal, using a process analogous to the random removal of customer nodes, to introduce randomness and reduce the likelihood of the algorithm converging to a local optimum.
Worst Distance Removal: This strategy removes charging stations causing significant route detours. The number of charging stations in the current solution and the number to be removed are first determined. Then, the distance cost for each charging station i is calculated as follows:
S C ( i ) = d i 1 , i + d i , i + 1 d i 1 , i + 1
where d i 1 , i is the distance between charging station i and its predecessor i 1 , d i , i + 1 is the distance between charging station i and its successor i + 1 , and d i 1 , i + 1 is the direct distance between the predecessor and successor. Charging stations are sorted by their distance cost, and those with higher costs are prioritized for removal.
Shaw Removal: Similar to the shaw removal of customer nodes, this strategy computes the similarity between charging stations in the current routes and removes those with high similarity to others. The similarity is evaluated based on a composite measure of distance and time windows, prioritizing the removal of redundant charging stations with high overlap.

4.4. Insertion Operators

4.4.1. Customer Node Insertion

Greedy Insertion: This strategy employs a greedy approach to insert unassigned customers into existing routes or new routes, prioritizing the position with the lowest insertion cost. The cost increment of inserting customer c into position i of route k, denoted as Δ c , k , i , is calculated. If the insertion results in a feasible route, Δ c , k , i is recorded; otherwise, it is set to + . The insertion costs Δ c , k , i are sorted, and the customer is inserted into the position yielding the lowest cost. For electric vehicles, if direct insertion is infeasible, insertion before or after a charging station is attempted. If no feasible insertion is possible, a new route is created for the customer. This process continues until all customers in U are assigned.
Regret Insertion: This strategy determines the insertion priority by computing a regret value for each unassigned customer c U . The regret value quantifies the additional cost of delaying the insertion of a customer, prioritizing the customer with the highest regret value (i.e., the largest potential cost increase if delayed). This approach mitigates the limitation of greedy insertion, which focuses solely on the current optimal insertion position and may lead to significantly higher future insertion costs.

4.4.2. Charging Station Insertion

Optimal Insertion: When the first customer node with insufficient energy is identified in a route, all arcs from the starting point to this node are evaluated. Among all feasible insertion positions, the one with the smallest cost increment is selected.
Comparative Greedy Insertion: This operator enhances the greedy insertion strategy by incorporating a comparison of insertion positions. Upon detecting the first customer node c with insufficient energy (i.e., E i k 1 < 0 ), where n i denotes its index in the route, the algorithm compares the cost of inserting a charging station either between nodes ( n i 1 , n i ) or ( n i 2 , n i 1 ) . For each charging station s S , the distance increment is calculated as follows:
s 1 = arg min s S d ( n i 1 , s ) + d ( s , n i ) d ( n i 1 , n i )
s 2 = arg min s S d ( n i 2 , s ) + d ( s , n i 1 ) d ( n i 2 , n i 1 )
The feasibility of the resulting routes is verified, and the insertion scheme with the smallest distance increment is selected. If neither insertion is feasible, the algorithm reverts to the basic greedy insertion strategy.

4.5. Local Optimization Operators

To improve the quality of solutions within each iteration, two local optimization operators are introduced to refine solutions repaired by insertion operators:
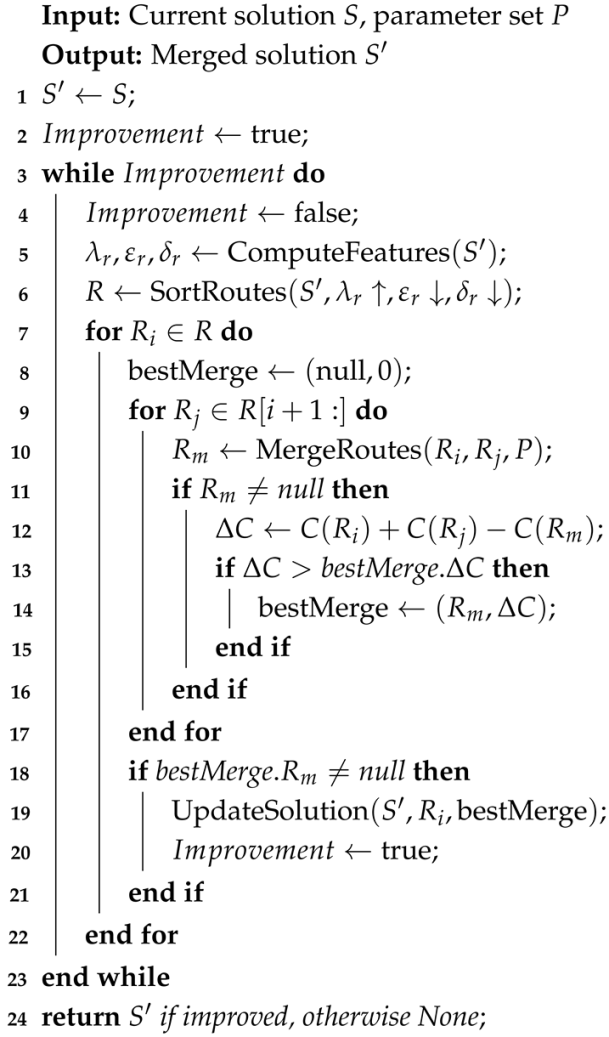
Route Merging Strategy: This strategy reduces vehicle usage and enhances resource efficiency by merging routes with low load, few customers, or low density. Routes are categorized by vehicle type into electric vehicle routes R e v and fuel vehicle routes R f v , with the complete set R = R e v R f v . For each route r R , three metrics are computed: the load ratio λ r = q r Q , where q r is the total demand served and Q is the vehicle capacity; the remaining energy ratio for electric vehicles ε r = B e E r c B e , where B e is the battery capacity and E r c is the energy consumed; and the route density δ r = n r d r + 1 , where n r is the number of customers and d r is the total distance. Routes are sorted prioritizing low λ r , high ε r , and low δ r (indicating sparse customer distribution) for same-type vehicles. For each route r a in the sorted list, a compatible route r b is selected, and the feasibility condition q r a + q r b Q is verified. If satisfied, customers from r b are inserted into r a using greedy insertion to compute the insertion cost. The merged route r m is checked for feasibility, and its cost C r m is compared to the sum C r a + C r b . If the cost reduction Δ C = ( C r a + C r b ) C r m < 0 , the merge is effective, Δ C is recorded, and r b is removed. This process repeats until no further cost reductions occur. The pseudocode is given in Algorithm 1.
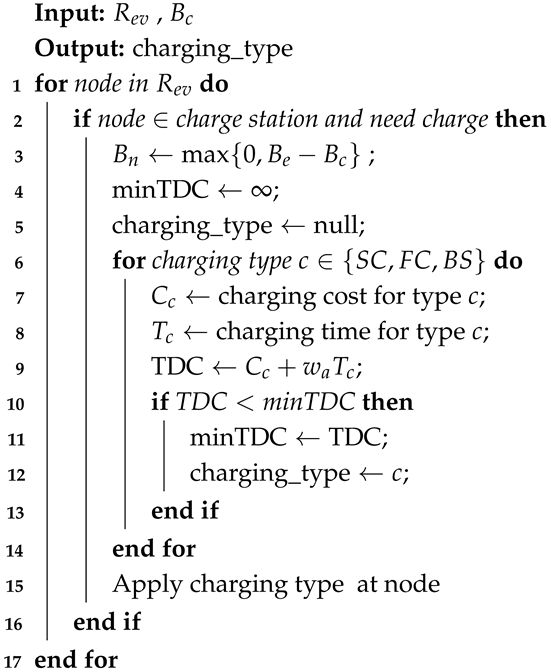
Charging Method Selection: For electric vehicle routes requiring en-route charging, three charging methods (slow charging, fast charging, and battery swapping) are available, each with distinct costs and times. To balance their impact on total cost, an opportunity cost is defined as T D C = C c + w a T c , where C c is the charging cost, T c is the charging time, and w a = 0.1 is the weight. The three methods are evaluated, and the mode with the minimum T D C is selected after sorting. The pseudocode is presented in Algorithm 2.
Algorithm 1: Route merging strategy.
Energies 18 05220 i001
Algorithm 2: Select charging methods.
Energies 18 05220 i002

4.6. Operator Selection Strategy and Adaptive Adjustment Mechanism

Operator Selection Strategy: Section 4.3 and Section 4.4 introduce various removal and insertion operators, which are alternately applied during the iterative process to obtain higher-quality solutions. Each operator is assigned a weight, and a roulette wheel selection mechanism is used to choose operators. The set of removal operators is defined as In Proceedings of the R = { r 1 , r 2 , , r m } , and the set of insertion operators as I = { i 1 , i 2 , , i n } . The weights for removal and insertion operators are denoted by w r i and w i i , respectively. The selection probabilities are given by the following:
p ( r i ) = w r i j = 1 m w r j p ( i i ) = w i i j = 1 n w i j
Adaptive Weight Adjustment Mechanism: At the start of the computation, each operator is assigned equal weights and scores. Scores are then assigned based on the quality of solutions generated by each operator in each iteration, with higher scores indicating better performance. The weights of the operators are updated according to the following rule:
w i + 1 = ( 1 ρ ) w i + ρ π i θ i
where w i + 1 and w i represent the weight of operator i for the next and current cycles, respectively; ρ [ 0 , 1 ] is the reaction factor; π i is the cumulative score of operator i in the current cycle; and θ i is the cumulative number of times operator i is used in the current cycle.
The cumulative score π i for operator i, belonging to the operator set σ = { σ 1 , σ 2 , σ 3 } , is determined by the following scoring mechanism:
  • When operator i generates a solution that improves the best-known solution, its score is increased by θ 1 .
  • When operator i generates a solution that improves the current solution, its score is increased by θ 2 .
  • When operator i generates a solution worse than the current solution but the solution is accepted, its score is increased by θ 3 .
The scoring parameters satisfy θ 1 > θ 2 > θ 3 , ensuring higher rewards for operators yielding better solutions.

4.7. Solution Acceptance Criterion and Algorithm Termination Conditions

The IALNS algorithm employs the Metropolis criterion of simulated annealing to update solutions. The Metropolis criterion mitigates the risk of the search becoming trapped in local optimal by accepting not only solutions superior to the current solution but also inferior solutions with a certain probability, thereby facilitating exploration of the global solution space [47]. Specifically, if the new solution S n e w yields a lower objective function value than the current solution S n o w (i.e., c n e w < c n o w ), it is accepted. If c n e w c n o w , the probability of accepting the new solution is as follows:
P = 1 if c n e w < c n o w e c n e w c n o w T S A if c n e w c n o w
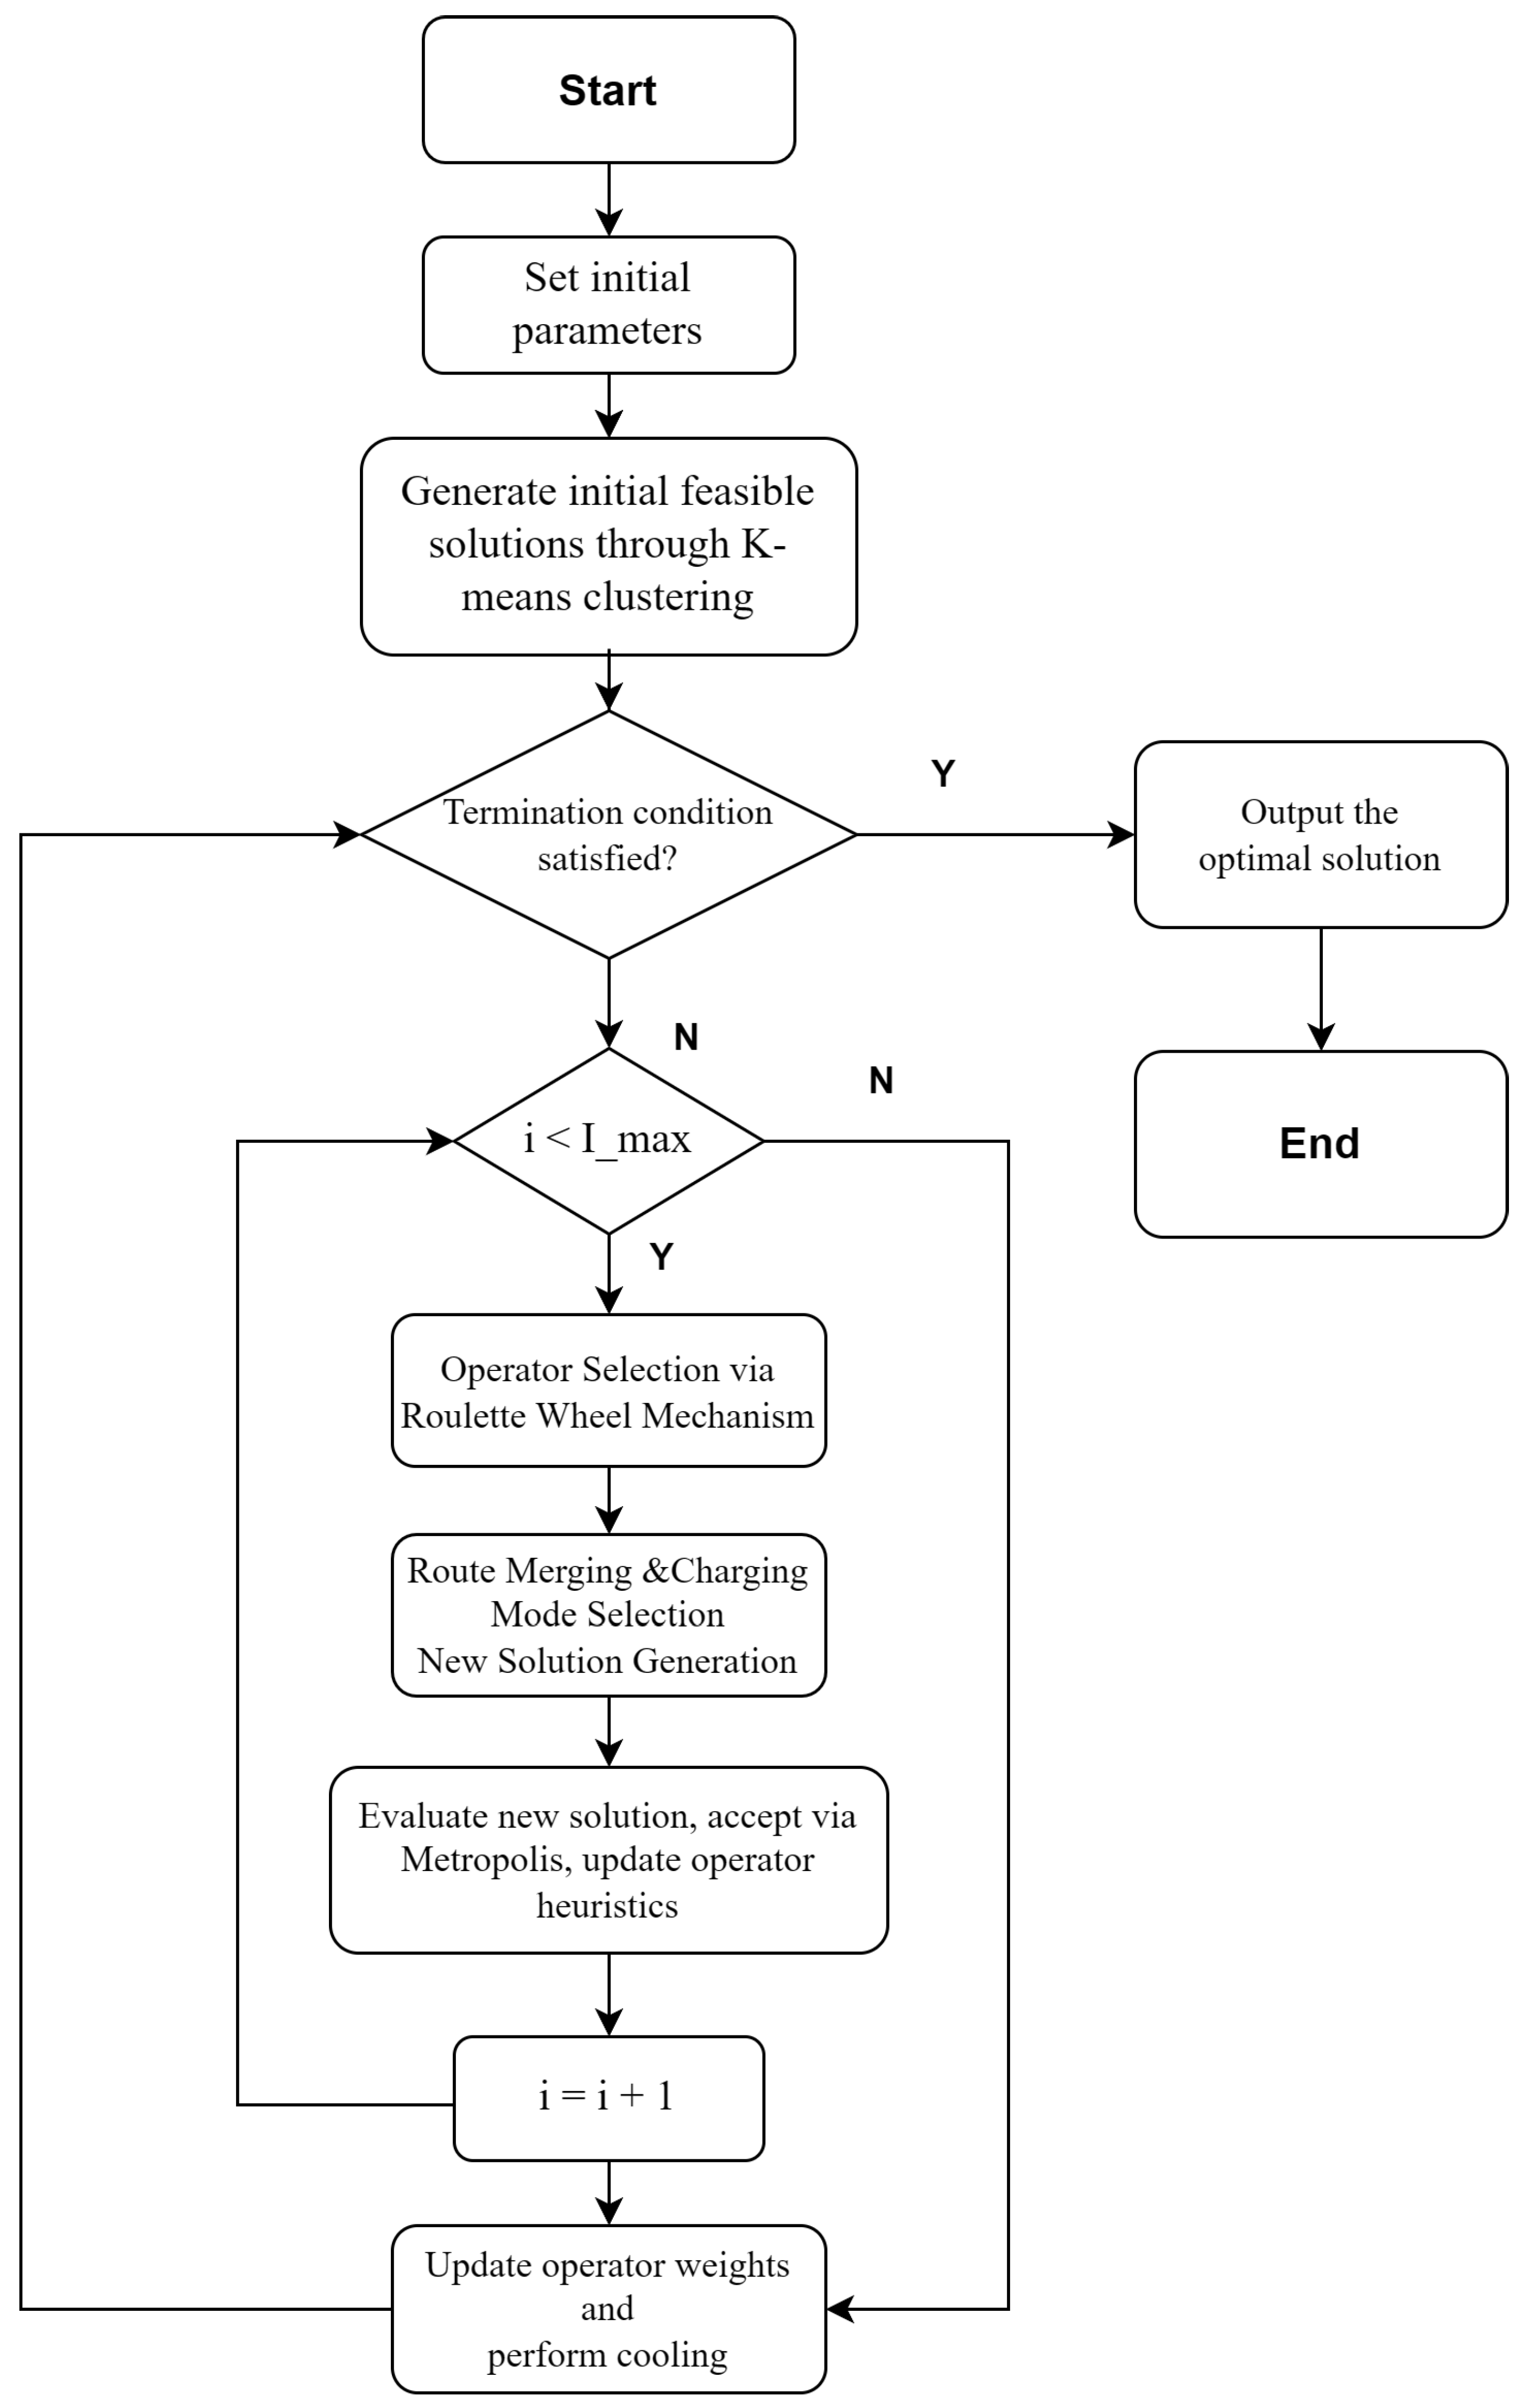
where c n e w and c n o w are the objective function values of solutions S n e w and S n o w , respectively, and T S A is the current temperature. The algorithm terminates when either the maximum number of iterations, M a x i t e r , is reached or no improvement is observed after a specified number of consecutive iterations, I M a x , at which point the current best solution is output. The temperature T S A is updated after each iteration using geometric cooling, defined as T S A = c · T S A , where c ( 0 , 1 ) is the simulated annealing coefficient. The flowchart of the IALNS algorithm is shown in Figure 2.

5. Computational Results

Section 5 is dedicated to analyzing the performance of the proposed IALNS algorithm, along with its advantages in carbon emission reduction and charging aspects. The proposed IALNS algorithm was implemented in Python 3.11, executed on the Windows 10 operating system, and tested under the hardware configuration of an Intel Core i5-13400F processor with 16 GB RAM. The solver employed was Gurobi 12.0.0.

5.1. Experiment Preparation

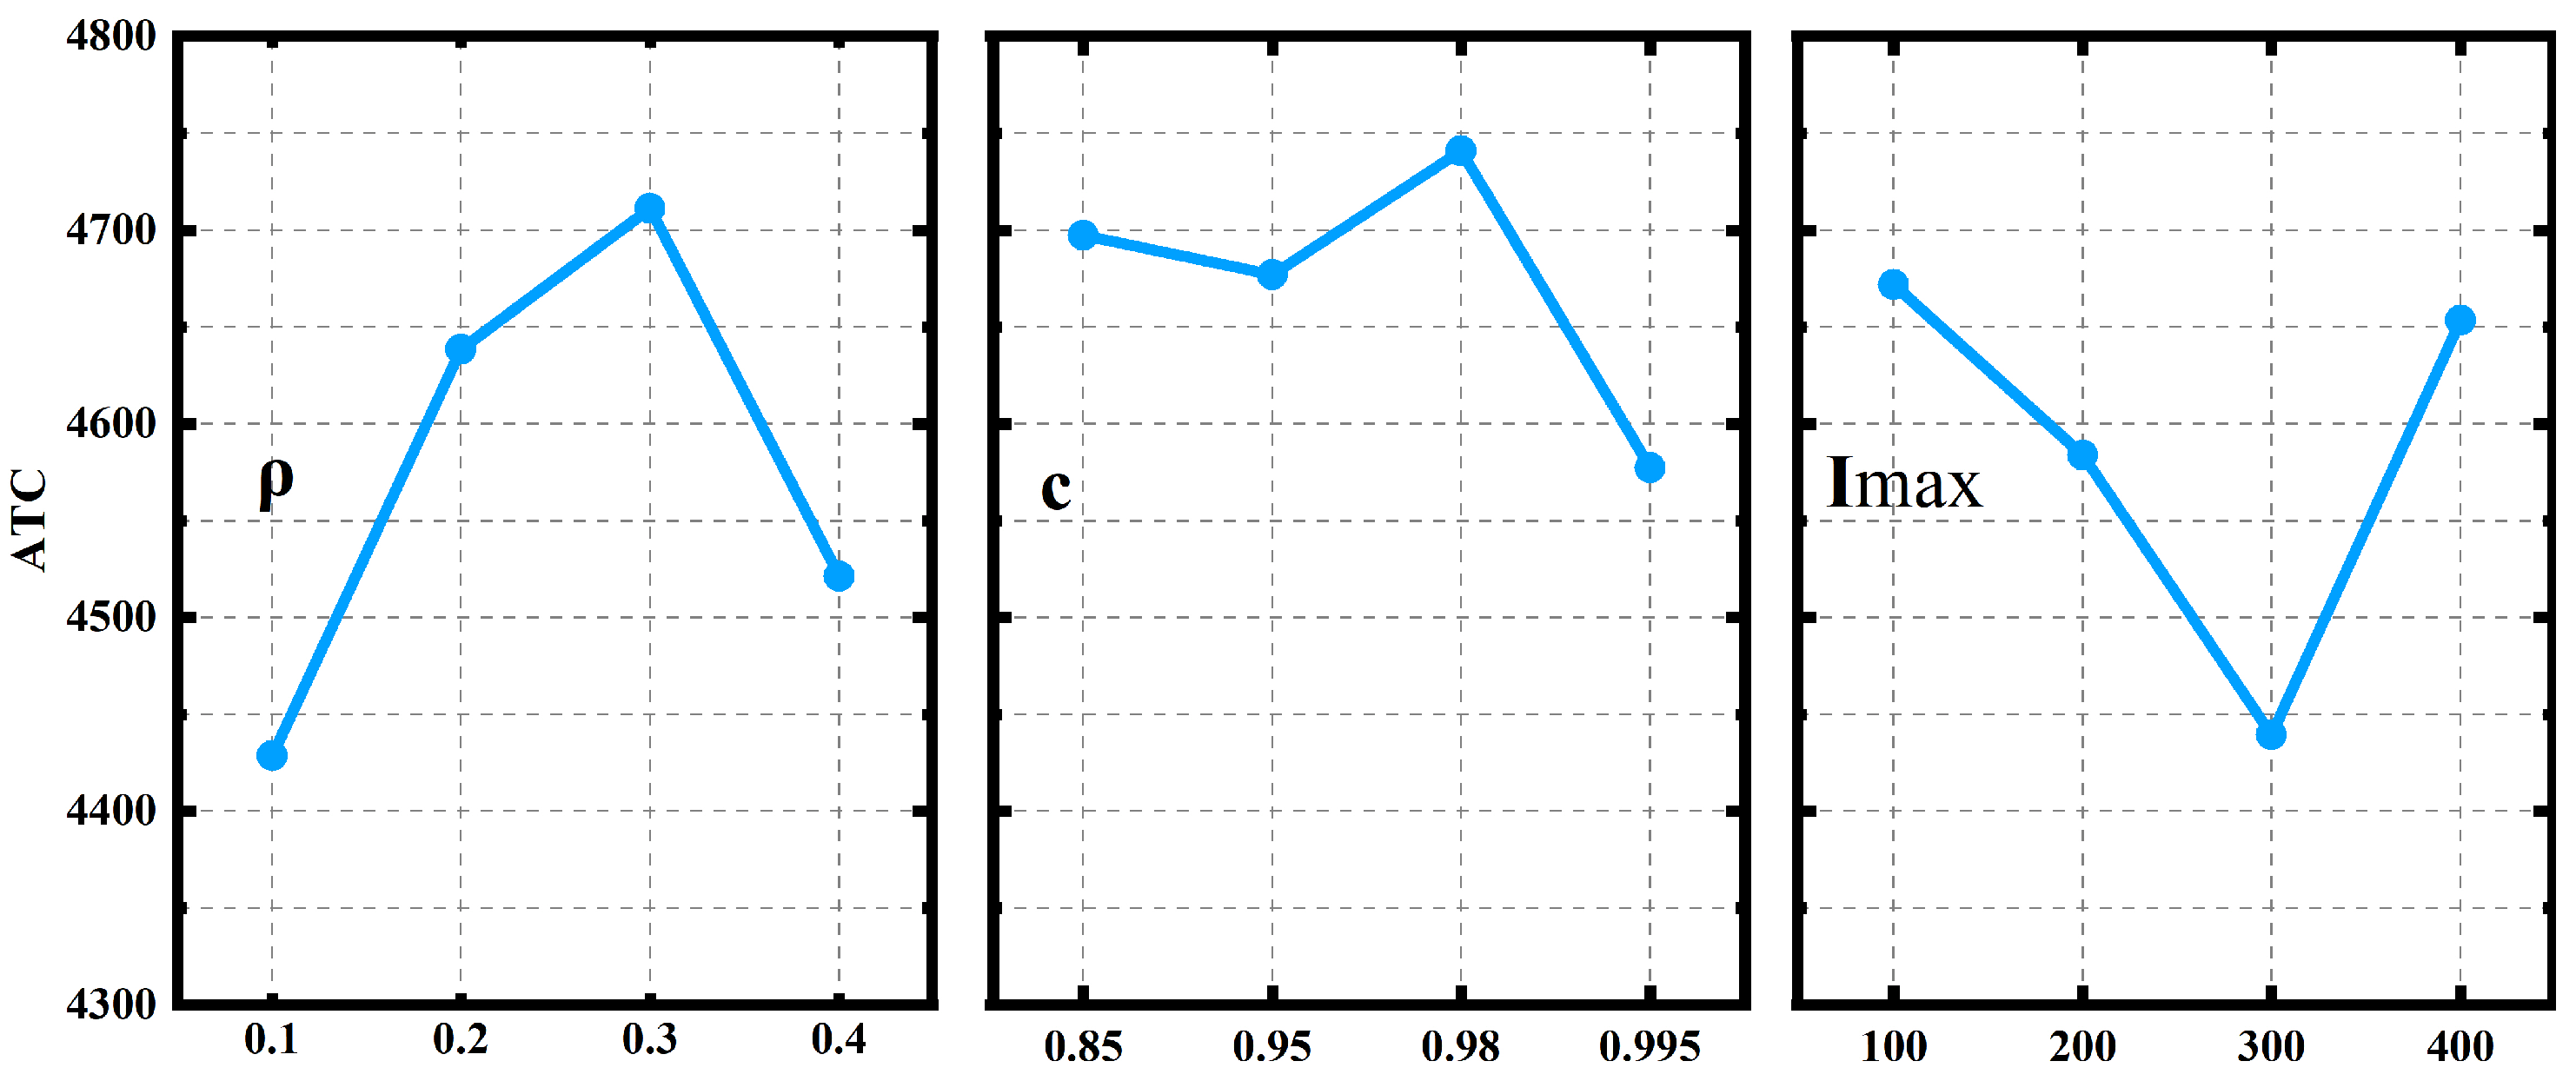
The test instances are developed based on the standard benchmark instances for E-VRPTW proposed by Schneider [48], extended with additional parameters required for MFGVRPTW-C. The parameter settings for the algorithm are defined as follows: in the relevance function, the parameters α , β , γ , and ω are set to 0.6, 0.3, 0.3, and 0.2, respectively; the scoring parameters θ 1 , θ 2 , and θ 3 are set to 30, 20, and 10, respectively; and the maximum number of iterations M a x i t e r is set to 500. To determine the optimal combination of parameters due to their significant impact on algorithm performance, a Taguchi experimental design is employed. The key parameters and their levels are as follows: the reaction factor ρ { 0.1 , 0.2 , 0.3 , 0.4 } , the simulated annealing cooling coefficient c { 0.85 , 0.95 , 0.98 , 0.995 } , and the maximum inner iterations I M a x { 100 , 200 , 300 , 400 } . Parameter experiments were carried out using the orthogonal array L 16 ( 4 5 ) . Each parameter setting was run ten times, and Figure 3 shows the main effect plot based on ATC (Average Total Cost). As shown in Figure 3, the results demonstrate that the optimal parameter combination is ρ = 0.1 , c = 0.995 , and I M a x = 300 .

5.2. Performance of the Algorithm

5.2.1. Small-Scale Numerical Example Experiment

To validate the effectiveness of the IALNS algorithm, 24 small-scale test instances are used. The naming convention for the instances is {distribution type}{time window type}{instance number}{number of customers}{number of charging stations}, where the distribution type includes random (r), clustered (c), and random-clustered (rc), and the time window type is either wide or narrow. For example, instance c101C10F5 denotes a clustered distribution with wide time windows, 10 customer nodes, and 5 charging stations. The proposed mixed-integer programming model is solved using the Gurobi solver called via Python. Gurobi is set to have a maximum solution time of 1800 s. To mitigate the randomness inherent in heuristic algorithms, both solution methods (IALNS and Gurobi) are executed ten times for each instance, and their average results are compared. As shown in Table 1, “TC” and “T” refer to total cost and computation time (in seconds). The Gurobi solver successfully obtained exact solutions for 11 out of 24 test instances within the predefined computation time, thereby validating the effectiveness of the proposed mixed-integer programming model. However, as the number of customer nodes increases, Gurobi struggles to obtain exact solutions within the specified time limit. The optimality gap analysis indicates that the results of the IALNS algorithm are closely aligned with those of Gurobi, with identical solutions achieved in 20 out of the 24 instances. Moreover, IALNS can generate high-quality solutions in a significantly shorter time.

5.2.2. Medium- and Large-Scale Numerical Example Analysis

To further validate the performance of the proposed algorithm, it was compared against the contrast algorithms, namely the genetic algorithm (GA) and the Adaptive Large Neighborhood Search (ALNS). The GA parameters are set as follows: an initial population size of 100, an elitist selection strategy, crossover probability of 0.7, mutation probability of 0.2, and a maximum number of iterations set to 500, consistent with the other algorithms. To ensure fairness, the initial feasible solutions for all three algorithms were generated using the K-means clustering method. The comparison results are presented in Table 2 and Figure 4. Analysis of Table 2 and Figure 4 reveals that, in terms of solution quality, the IALNS outperforms the contrast algorithms on average across the selected eight test instances, with a maximum optimality gap (GAP) of 13.72%. This indicates that IALNS possesses stronger optimization capabilities. Further analysis of Figure 4a shows that, in terms of computational time, the results of GA are closer to those of IALNS and even exceed IALNS in efficiency for two test instances; however, the solution quality of GA is noticeably inferior. This phenomenon arises because GA’s randomness and parallel search mechanism enable rapid optimization but compromise population diversity and the ability to explore new solution spaces, often leading to local optima. In contrast, the proposed IALNS algorithm achieves a balance between computational efficiency and enhanced exploration of the solution space, yielding higher-quality solutions.

5.2.3. Simulation Case Study Experiment

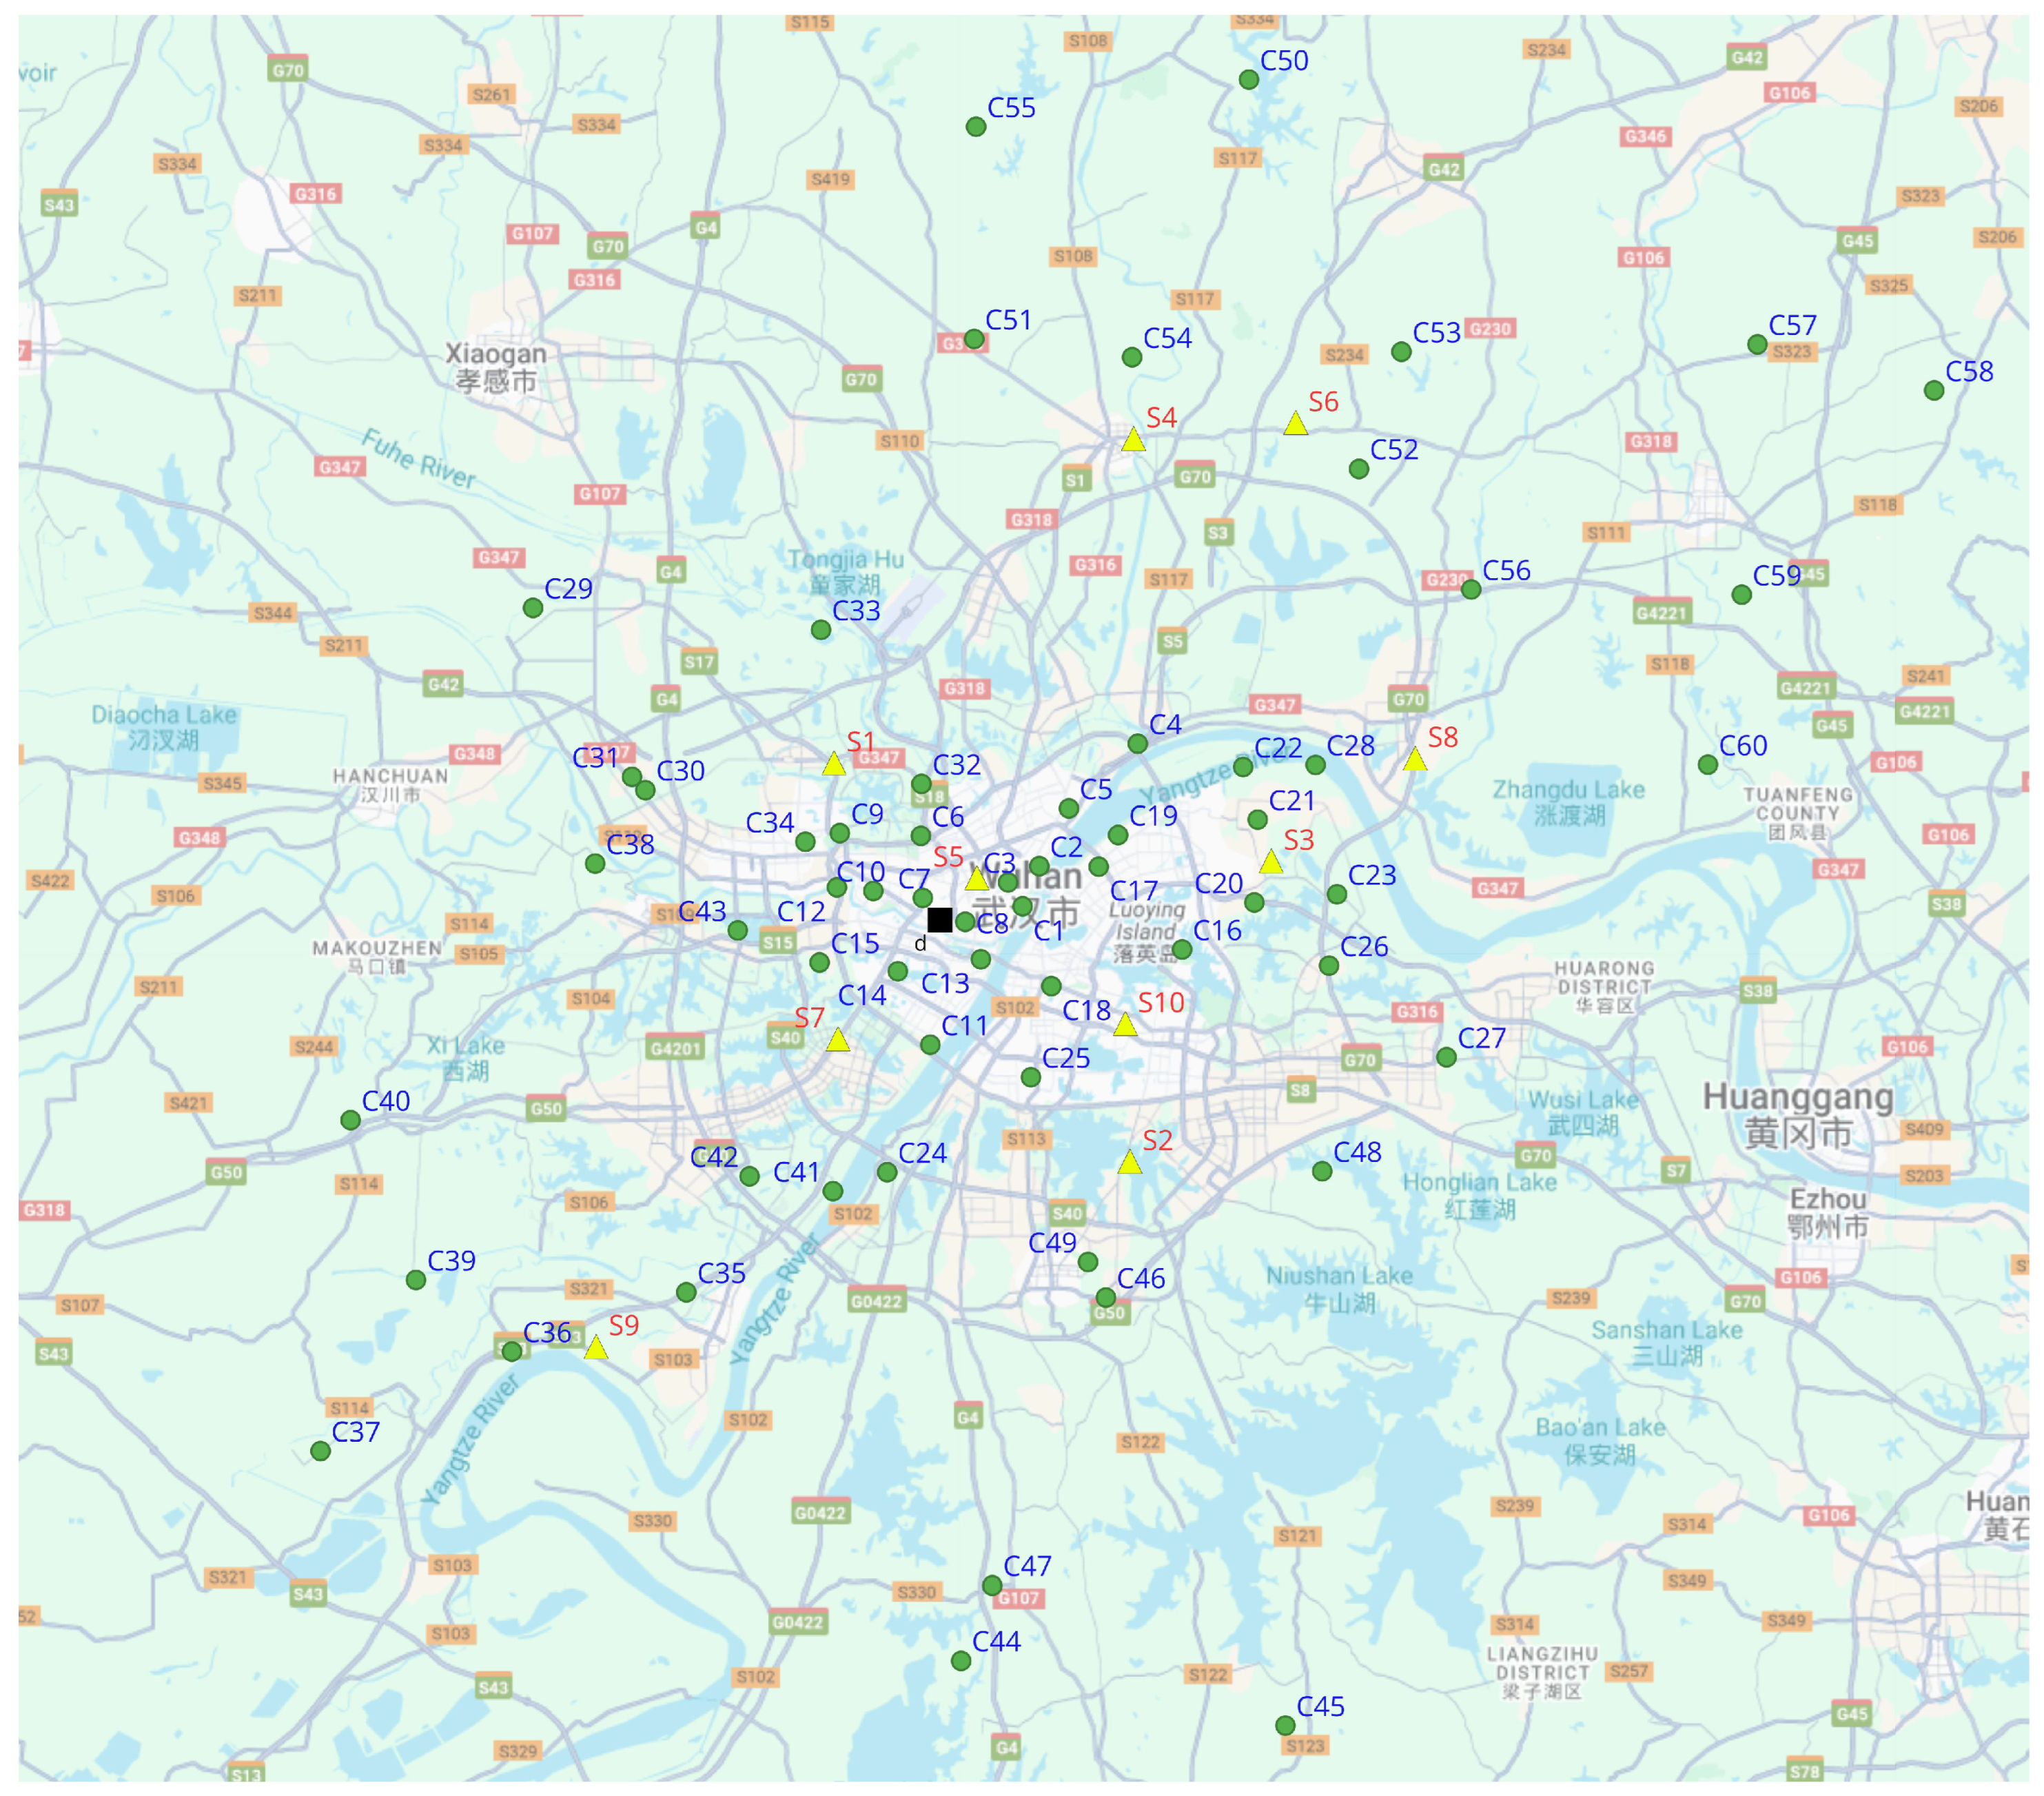
To demonstrate the practical applicability of the proposed algorithm, we tested its performance on a real-world case study, comparing the standard ALNS, genetic algorithm (GA), and IALNS in solving this proposed problem. Figure 5 illustrates the distribution network of a courier service hub in Wuhan, China, which comprises 1 depot (represented by a black square in Figure 5), 10 electric vehicle charging stations (represented by yellow triangles), and 60 customer nodes (represented by green circles). The parameter settings for the proposed model, determined based on references [49], are presented in Table 3.
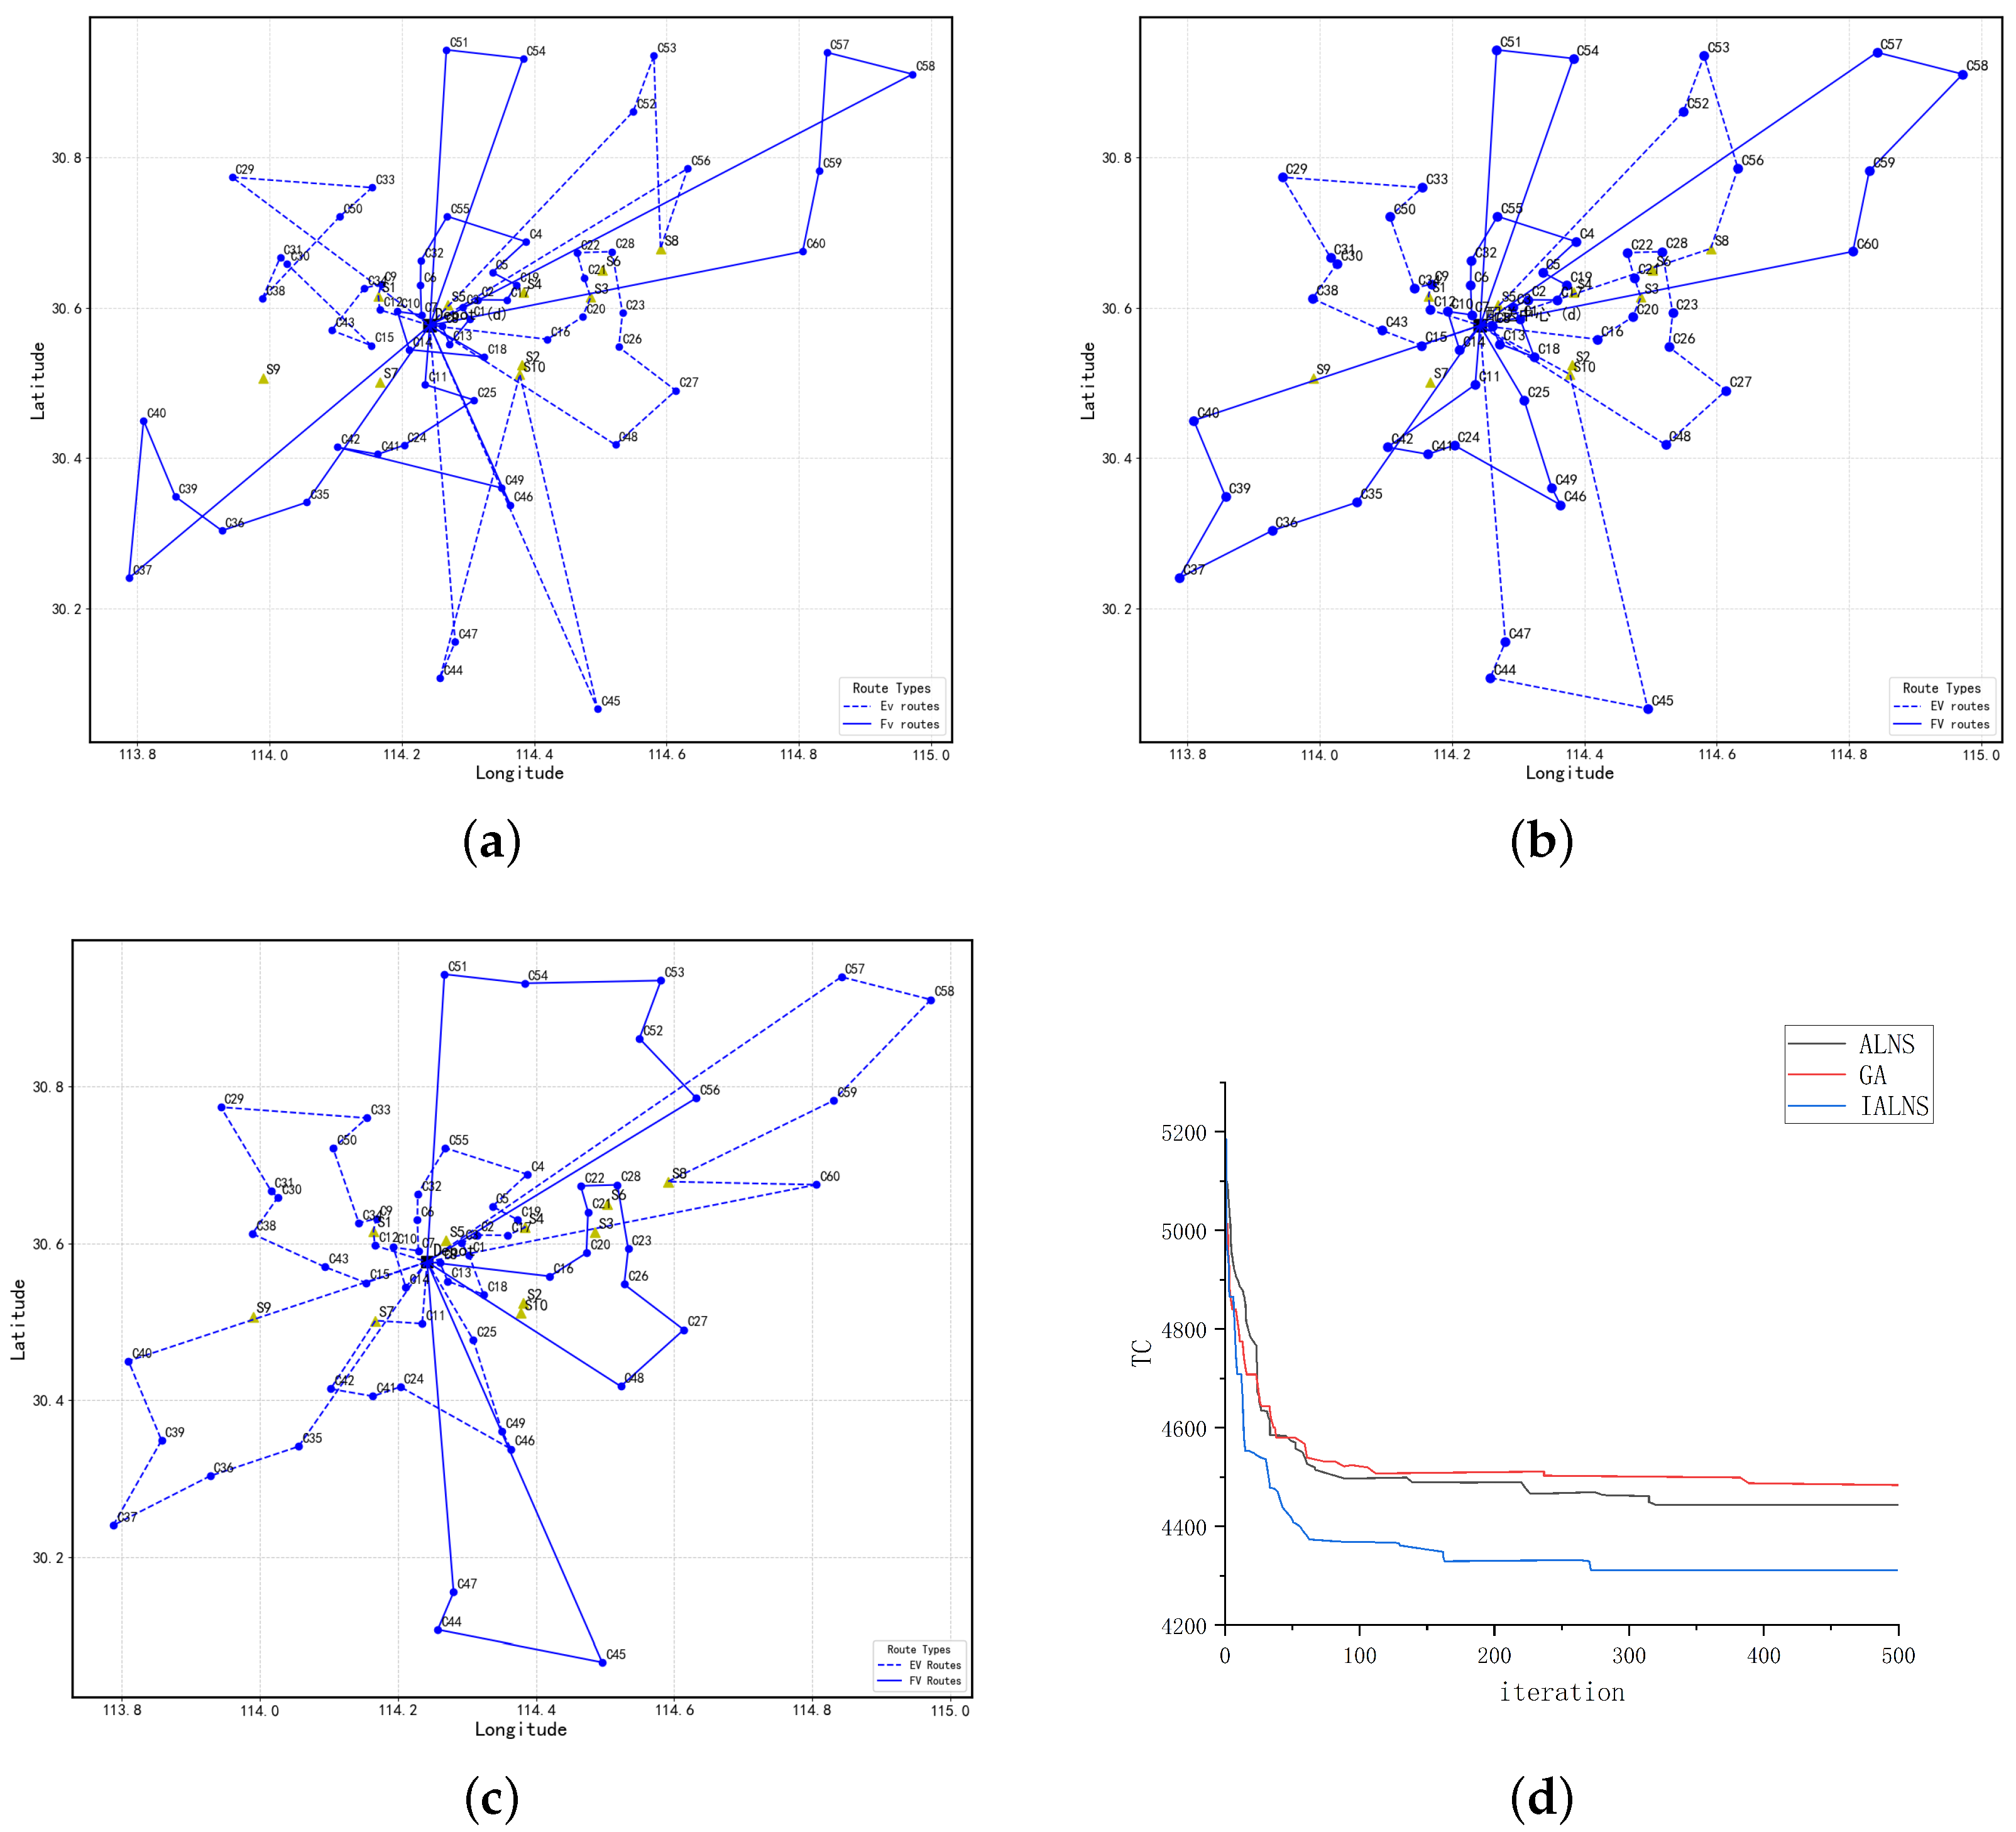
Three algorithms were employed to solve the test instance. To ensure fairness, the initial feasible solution for each algorithm was generated using the K-means clustering method. The performance of the three algorithms was evaluated by comparing their resulting data outcomes. The delivery routes generated by the three algorithms—standard ALNS, GA, and IALNS—are depicted in Figure 6a–c. For IALNS, the optimal solution yields a total cost of CNY 4365.02, comprising eight vehicle routes, with five electric vehicle routes, including four routes involving en-route charging. The optimization results of the three algorithms are presented in Table 4. As shown in Figure 6a–c and Table 4, compared to the baseline algorithms, IALNS achieves the delivery objectives with fewer routes, fewer dispatched vehicles, and lower charging costs through route consolidation and optimized charging strategies. Table 4 indicates that IALNS reduces the total delivery cost by 4.6% compared to GA and 2.9% compared to ALNS, reduces charging costs by 9.8% compared to GA and 5.3% compared to ALNS, and achieves the best performance in total distance traveled, with reductions of 15.5% compared to GA and 11.7% compared to ALNS. Figure 6d shows that GA and ALNS exhibit slower convergence, requiring multiple iterations to obtain satisfactory solutions. In contrast, the proposed IALNS algorithm demonstrates significant advantages across multiple iterations, with faster convergence and higher solution accuracy. These results validate the effectiveness of IALNS in solving the MFGVRPTW-C.

5.3. Sensitivity Analysis

5.3.1. Fleet Configuration

To validate the effectiveness of the mixed fleet delivery approach, three fleet configurations were compared: an all-fuel fleet, a mixed fleet, and an all-electric fleet. Table 5 presents a comparison of the total cost, carbon emission cost, transportation cost, time window penalty cost, and charging cost under these three delivery modes. As shown in Table 5, compared to the all-fuel fleet, the mixed fleet achieves a 48.21% reduction in carbon emission costs, primarily due to the significant carbon emissions generated by the all-fuel fleet. Compared to the all-electric fleet, the mixed fleet reduces transportation costs by 17.02% and time window penalty costs by 42.39%. These advantages stem from two factors: first, the reduced proportion of EVs in the mixed fleet directly decreases the frequency of charging; second, the reduced charging time effectively meets customer time window requirements, thereby improving vehicle utilization efficiency.
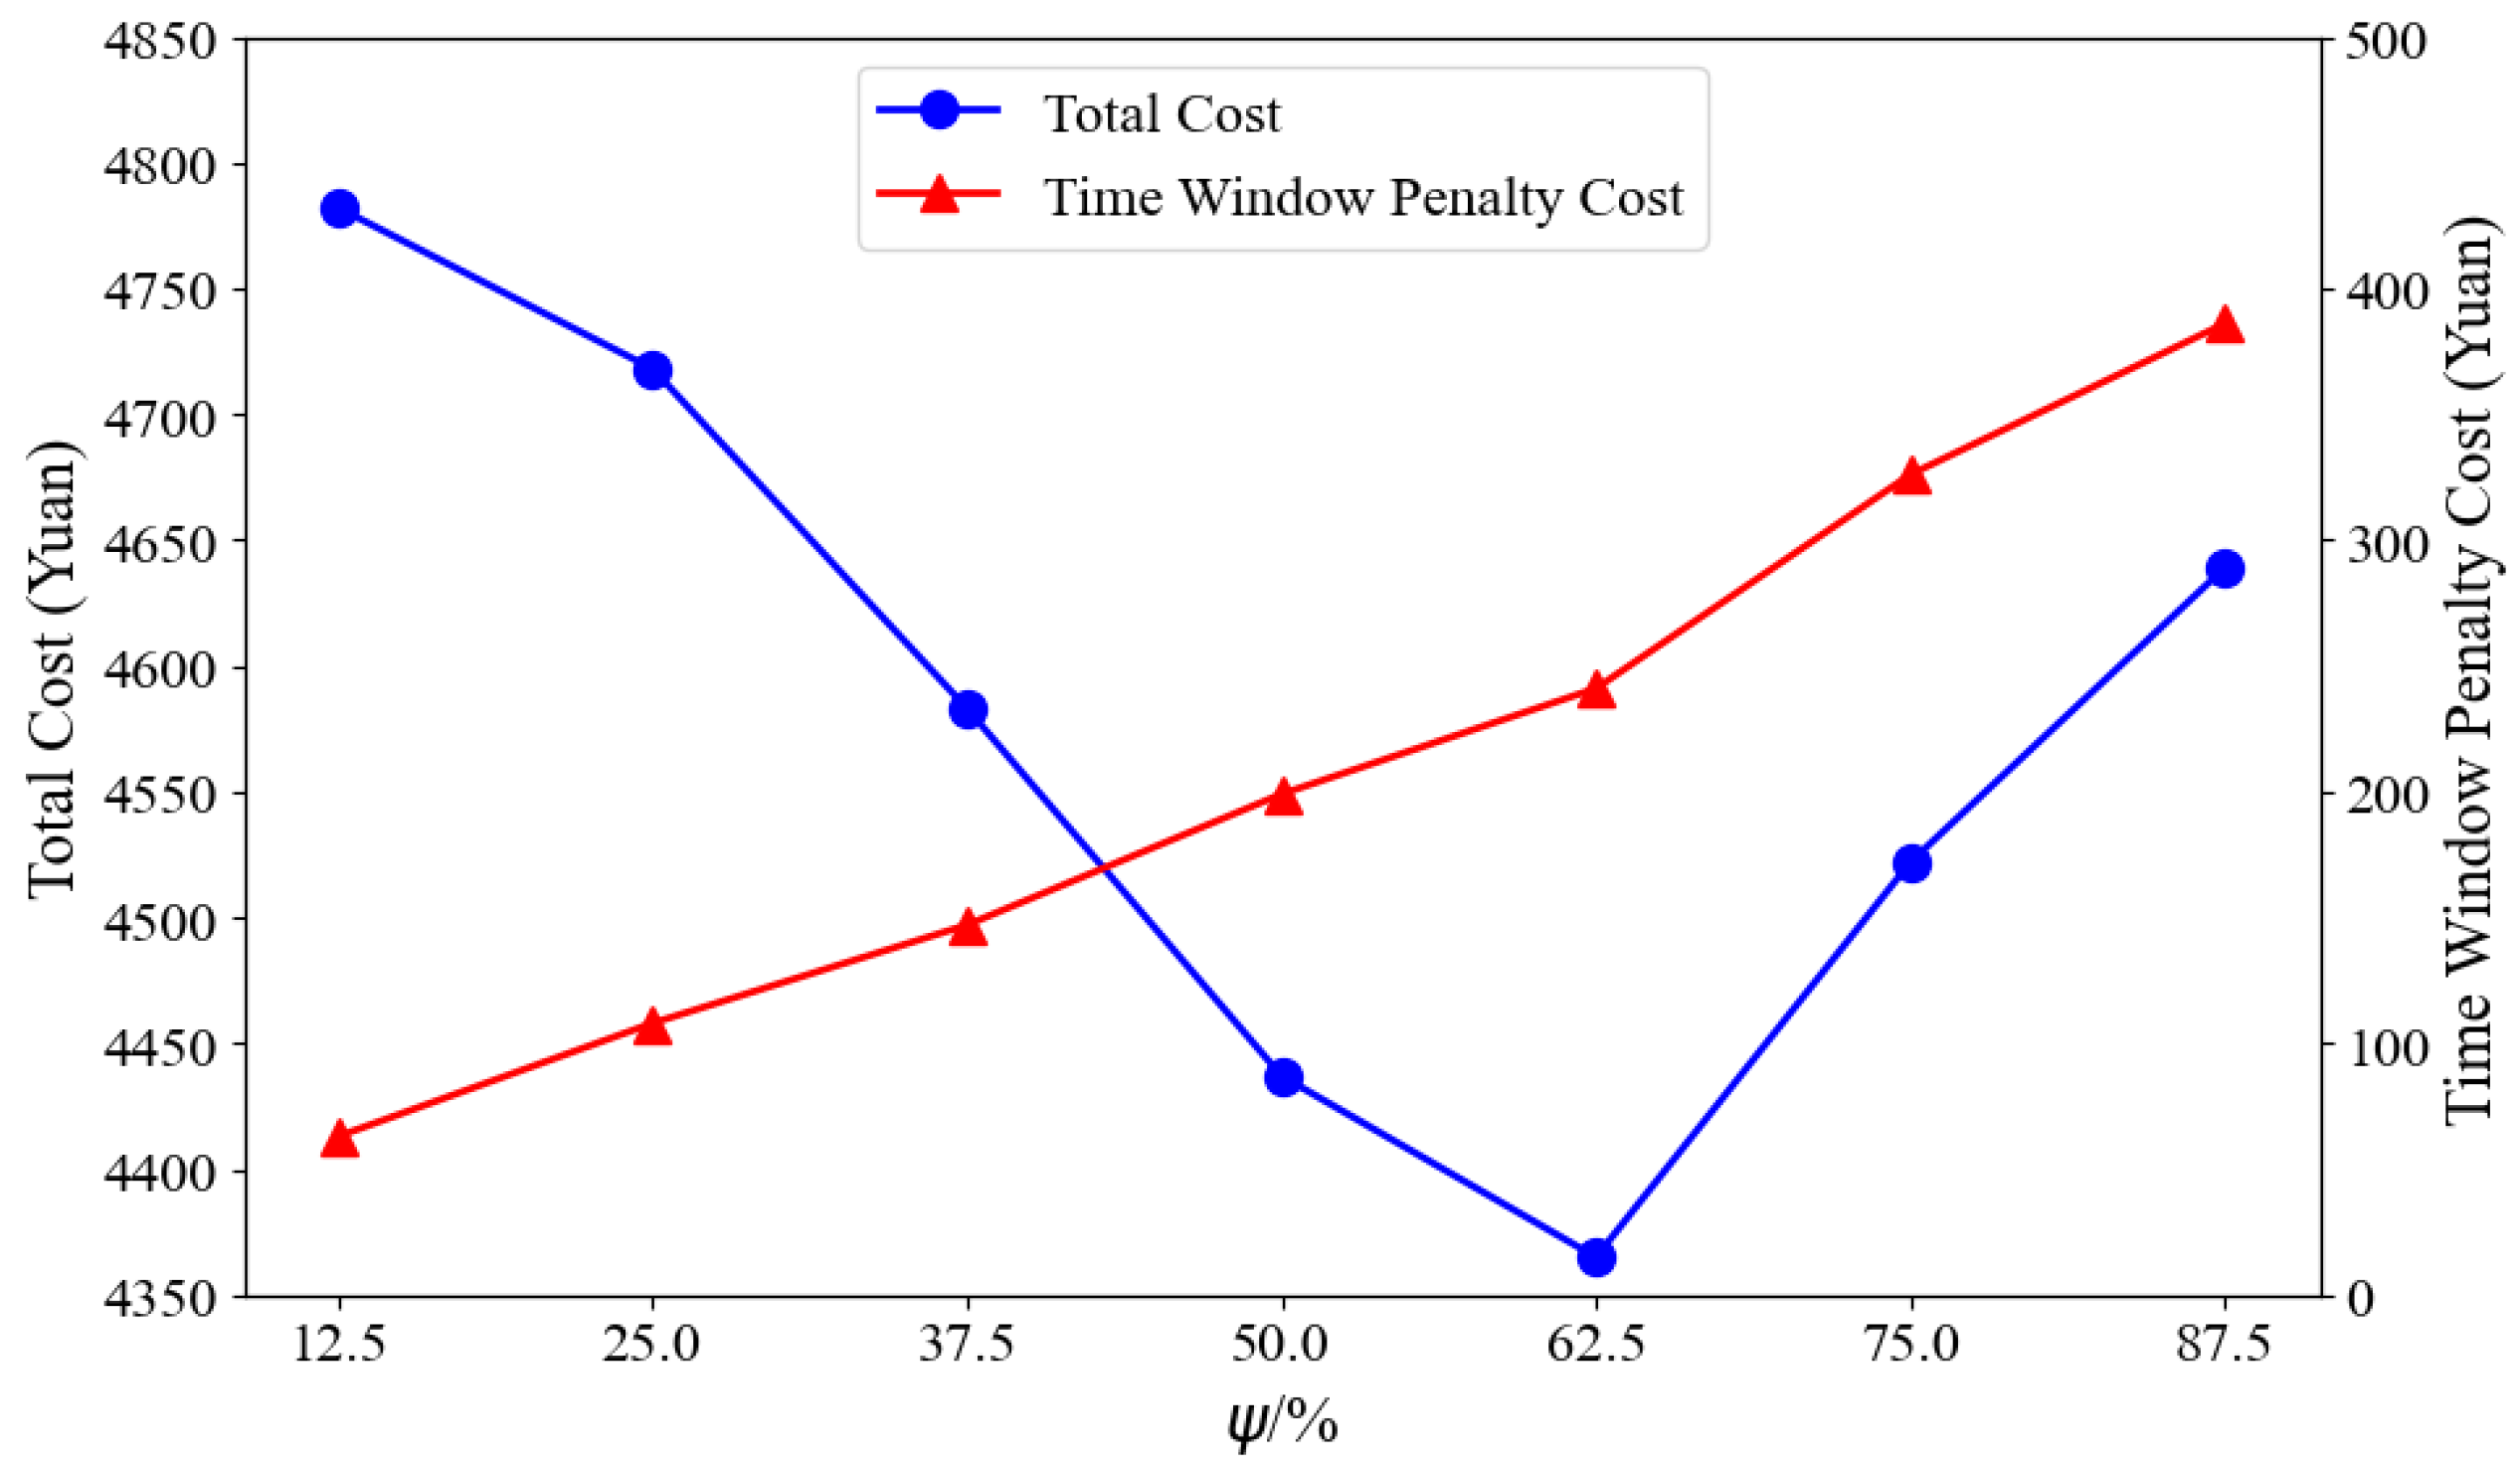
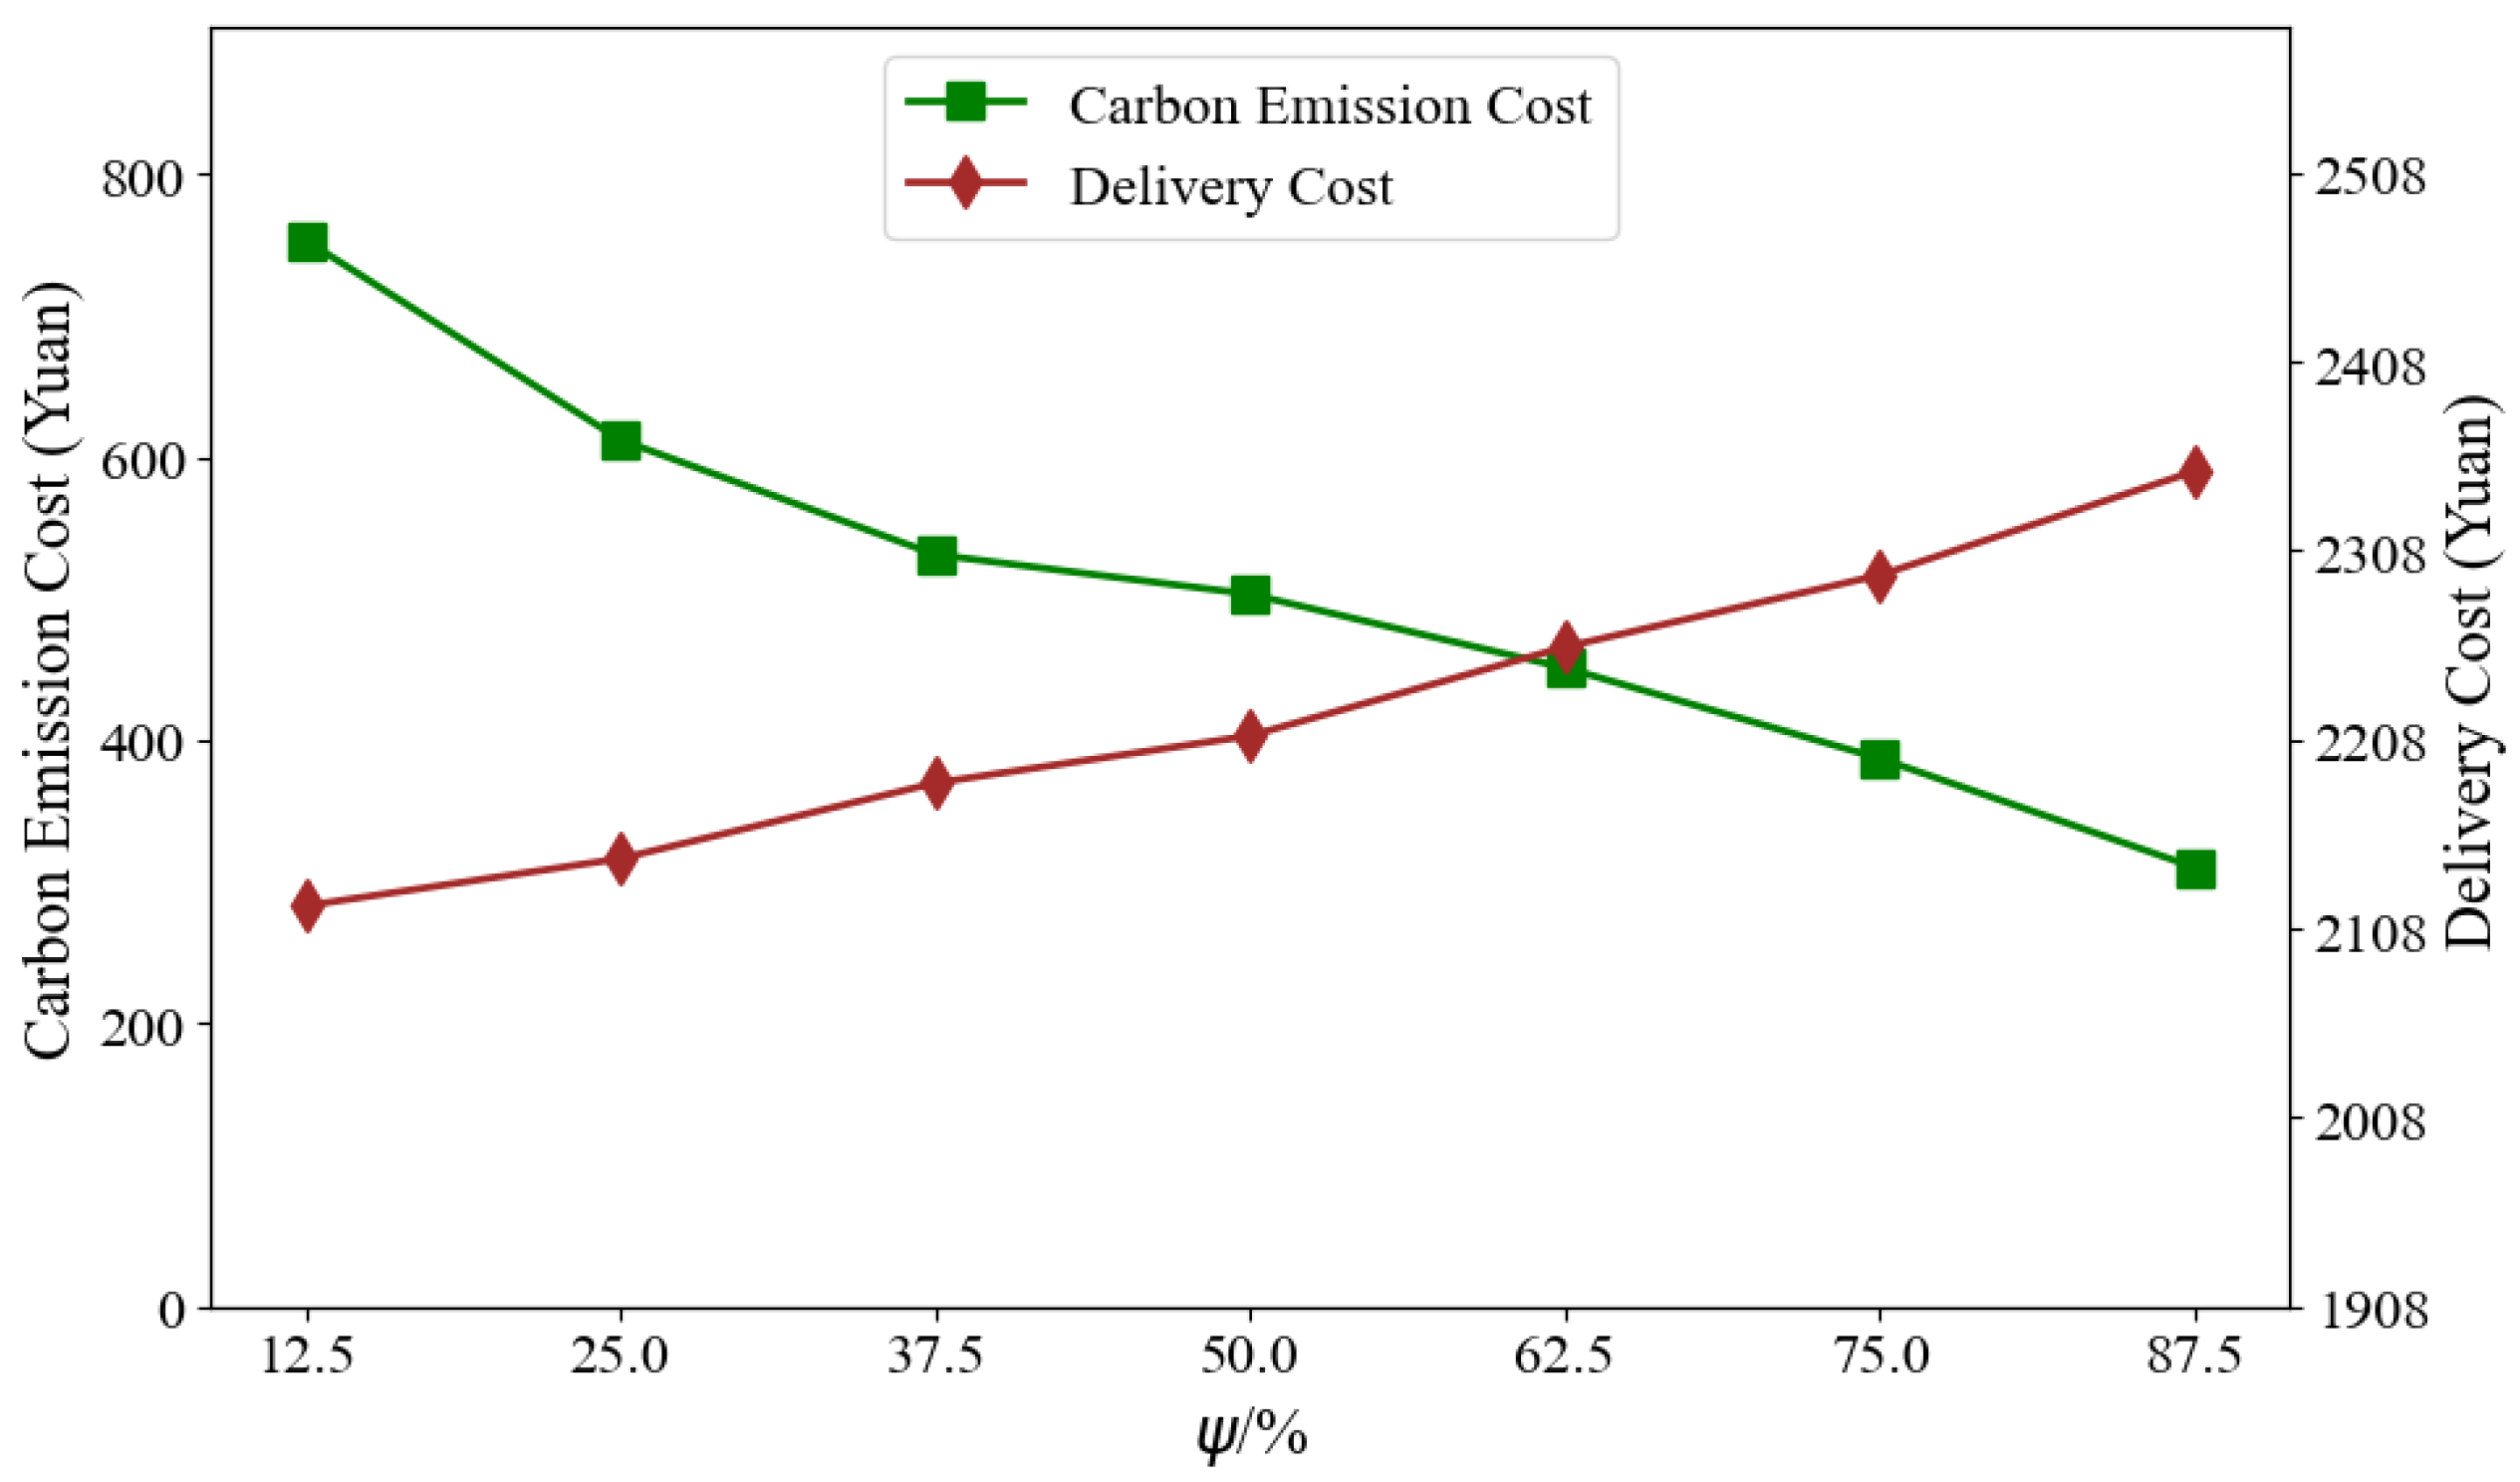
To further investigate the impact of fleet composition on delivery outcomes, the proportion of EVs in the mixed fleet was incrementally increased by 12.5% intervals, and the changes in total cost, transportation cost, carbon emission cost, and time window penalty cost were analyzed under different fleet configurations. The proportion of EVs in the mixed fleet is defined as ψ , with values assigned from 12.5% to 87.5% at 12.5% intervals. Multiple runs were conducted to observe the variations in each cost component, as illustrated in Figure 7 and Figure 8. The results, as shown in Figure 7 and Figure 8, indicate that adjusting the proportion of EVs and FVs in the delivery fleet affects the total cost to varying degrees. When the EV proportion ψ is below 62.5%, the total cost decreases as the number of EVs increases, driven by a reduction in carbon emission costs. However, when ψ exceeds 62.5%, the total cost gradually increases. This phenomenon is attributed to two factors: first, increased charging requirements lead to higher time window penalty costs; second, the higher unit fixed cost of EVs compared to FVs contributes to the rise in total cost. Therefore, when logistics companies employ a mixed fleet of EVs and FVs for delivery, a balanced allocation of vehicle types is essential. This approach not only reduces the total delivery cost but also balances environmental and customer interests. Over-reliance on EVs does not yield optimal delivery outcomes.

5.3.2. Different Charging Methods

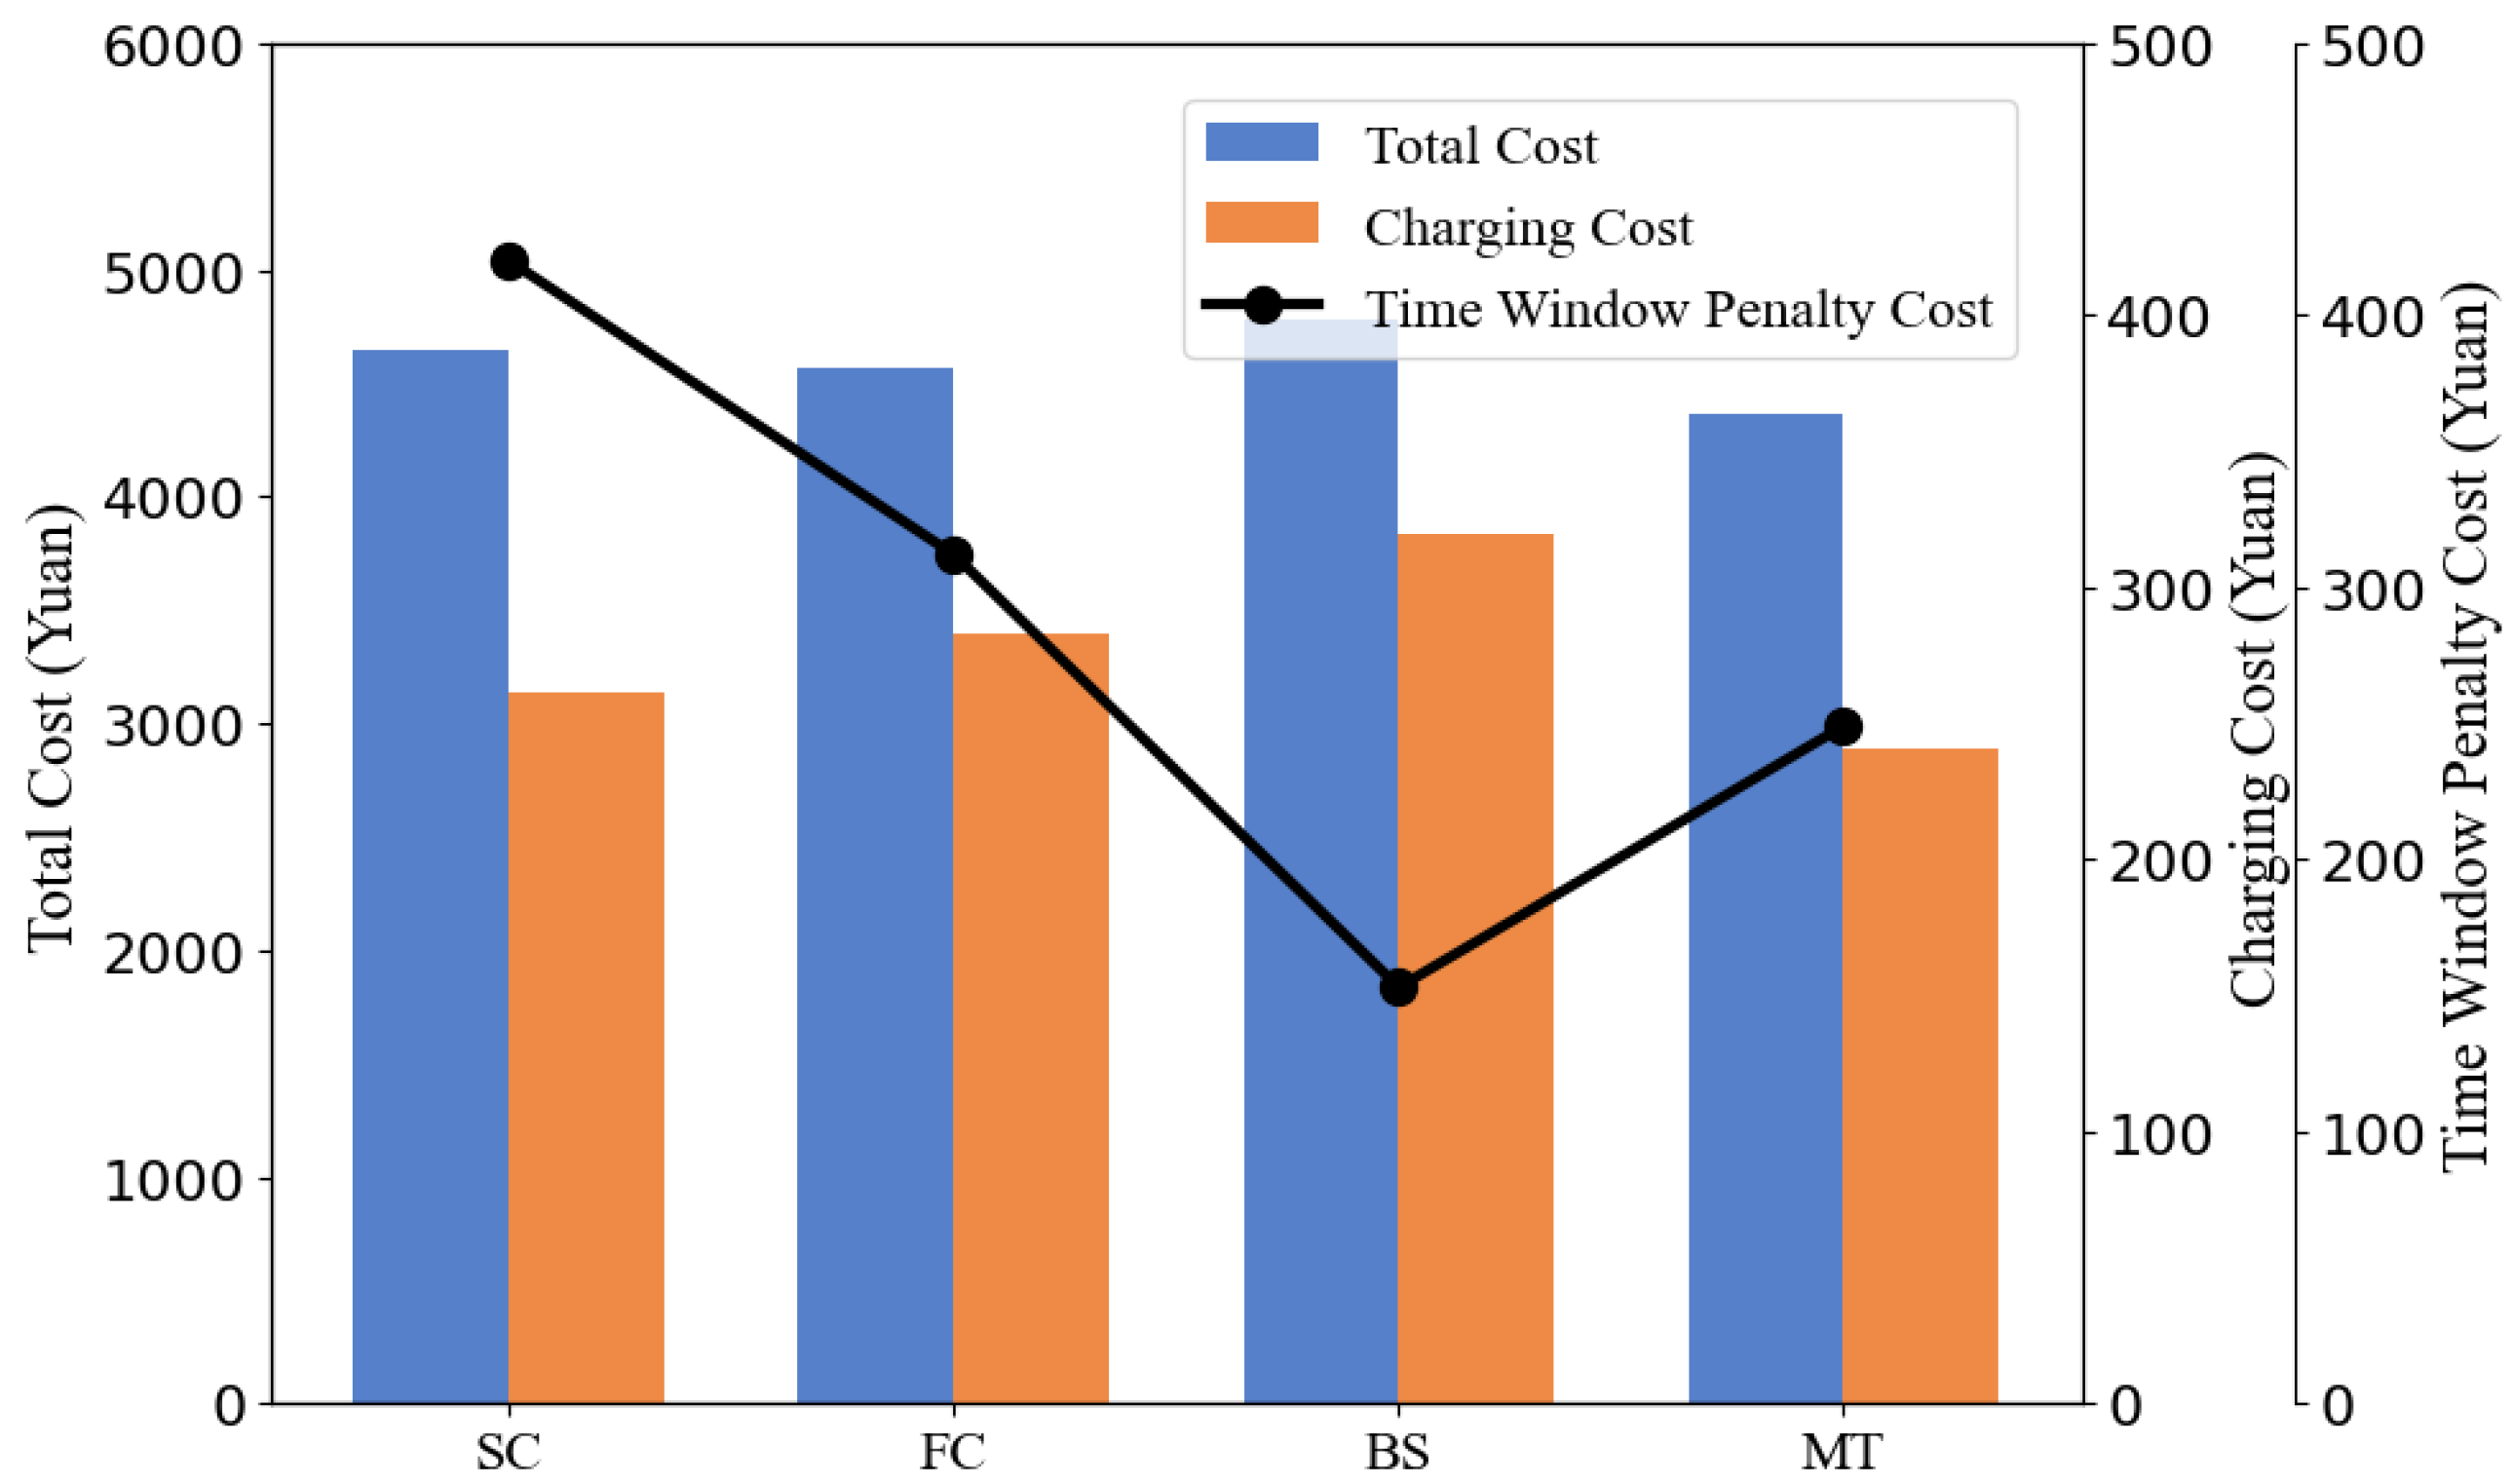
To investigate the impact of different charging methods on delivery costs, customer satisfaction, and charging costs in the delivery process, three single charging methods—slow charging (SC), fast charging (FC), and battery swapping (BS)—were compared with the proposed multi-mode charging (MT) strategy, which flexibly selects among multiple charging models. The results are presented in Figure 9. In terms of charging costs, the multi-mode charging strategy achieves the lowest cost, as the operator designed in this study for optimal charging mode selection comprehensively considers both charging time and cost to make informed decisions. Regarding total cost, the differences across charging methods are not significant, primarily because the charging cost constitutes a relatively small proportion of the total cost. However, in terms of time window penalty costs, battery swapping results in the lowest penalty costs, as it enables electric vehicles to quickly return to full charge and resume delivery tasks. Conversely, battery swapping incurs the highest charging costs. In contrast, the flexible selection of multiple charging methods not only reduces time window penalty costs to some extent but also lowers the total cost. This analysis demonstrates that, in the context of mixed fleet delivery, the flexible use of multiple charging methods can reduce charging costs, minimize charging time, and enhance customer satisfaction.

6. Conclusions

This study addresses the Mixed Fleet Green Vehicle Routing Problem with Time Windows and Charging Problems (MFGVRPTW-C), involving a mixed fleet of fuel vehicles and electric vehicles under time window and charging constraints. We develop a comprehensive model aimed at minimizing total cost, systematically capturing fixed costs, transportation costs, time window penalty costs, carbon emission costs across different vehicle technologies, and charging costs for multiple charging methods (slow charging, fast charging, and battery swapping). Additionally, explicit energy dynamics and station visit constraints are incorporated to model the operational rules and feasibility requirements for single-charge EV operations. To efficiently solve medium-to-large-scale instances, we propose an IALNS algorithm. This algorithm employs K-means clustering to construct high-quality initial solutions, designs complementary removal/insertion operators for customers and charging stations to explicitly address fleet configurations and charging mode selection, introduces two types of local optimizations (route consolidation and charging mode selection) to achieve better trade-offs between cost and time, and balances exploration and exploitation through adaptive operator weights and a simulated annealing acceptance criterion.
Numerical results on a modified Electric Vehicle Routing Problem with Time Windows (E-VRPTW) benchmark demonstrate that, for small-scale instances, IALNS achieves solutions consistent with or closely matching those of a commercial mixed-integer programming (MIP) solver (Gurobi) in significantly less computational time. For larger-scale instances, IALNS consistently produces high-quality solutions that satisfy both energy and time window constraints. A real-world urban courier case study further reveals that the proposed method quantitatively elucidates the trade-offs among cost, emissions, and service level under varying EV/FV proportions and charging strategies.
Several directions for future research remain: (1) The current model assumes single charging events and unlimited station service capacity; future work could incorporate multiple charging events, queuing, and congestion effects to enhance real-world applicability. (2) The current model does not account for time-varying traffic conditions or uncertain customer demands, leading to discrepancies between the model and real-world operational scenarios. Future research will focus on incorporating time-varying road networks and uncertain customer demands. Additionally, combining the proposed algorithm with other algorithms is proposed to achieve improved solution quality and computational efficiency.
Overall, the proposed comprehensive model and IALNS algorithm provide a practical decision-making tool for mixed fleet planning under time window and charging constraints. Empirical evidence demonstrates that carefully orchestrating fleet composition and charging methods can simultaneously reduce costs and carbon emissions while maintaining service quality, offering actionable insights for the transition to green urban logistics.

Author Contributions

Conceptualization, L.Y., R.Z. and D.J.; methodology, L.Y. and R.Z.; investigation, R.Z. and D.J.; resources, L.Y.; writing—original draft preparation, L.Y., R.Z. and D.J.; writing—review and editing, L.Y. and R.Z.; supervision, L.Y. All authors have read and agreed to the published version of the manuscript.

Funding

This This research was funded by the National Social Science Fund of China (funding number 17BGL238), sponsored by the National Office of Philosophy and Social Sciences (NOPSS); and the Major Project of Philosophy and Social Sciences Research in Higher Education Institutions of Hubei Province (funding number 23ZD241), sponsored by the Hubei Provincial Department of Education and Hubei Provincial Office of Philosophy and Social Sciences Development Planning.

Data Availability Statement

As for the data generated in this study, it is available upon request to the corresponding author. Due to privacy or ethical restrictions, the data is not made publicly available.

Conflicts of Interest

The authors declare that there are no conflicts of interest.

Nomenclature

0 , n + 1 The starting and ending depot nodes.
CSet of customer nodes.
RSet of charging station nodes.
D = C R Set of all customer and charging station nodes.
D 1 = { 0 } C R Set of origin nodes, including the depot, customers, and charging
stations.
D 2 = C R { n + 1 } Set of destination nodes, including customers, charging stations,
and the end depot.
K d Set of all vehicles available at the depot.
K e / K f Sets of electric and fuel vehicles, respectively.
q i Demand of customer node i C .
q i j k Load carried by vehicle k K d on arc ( i , j ) .
d i j Distance of arc ( i , j ) .
t i j Travel time from node i to node j.
t i k 1 Arrival time of vehicle k K d at node i.
t i k 2 Departure time of vehicle k K d from node i.
t i k c Charging time of vehicle k K e at node i R .
W i k Waiting time of vehicle k K d at node i.
S i Service time at node i C for vehicle k K d .
[ e i , l i ] Service time window for customer node i C .
Q e / Q f Maximum load capacity of electric and fuel vehicles, respectively.
B e Battery capacity of electric vehicles.
B a Energy consumption rate of electric vehicles (in kWh/km).
E i k 1 / E i k 2 Battery level of vehicle k K e upon arrival at/departure from node i.
E i k c Amount of energy recharged by vehicle k K e at node i R .
x i j k Binary variable, equal to 1 if vehicle k K d traverses arc ( i , j ) ,
and 0 otherwise.
α i k Binary variable, equal to 1 if vehicle k K e uses slow charging at node
i R , and 0 otherwise.
β i k Binary variable, equal to 1 if vehicle k K e uses fast charging at node
i R , and 0 otherwise.
γ i k Binary variable, equal to 1 if vehicle k K e uses battery swapping at
node i R , and 0 otherwise.
MA large positive constant used for constraint enforcement.

References

  1. CO2 Emissions in 2023–Analysis—IEA. 2025. Available online: https://www.iea.org/reports/co2-emissions-in-2023 (accessed on 1 August 2025).
  2. Pamidimukkala, A.; Kermanshachi, S.; Rosenberger, J.; Hladik, G. Barriers and Motivators to the Adoption of Electric Vehicles: A Global Review. Green Energy Intell. Transp. 2024, 3, 100153. [Google Scholar] [CrossRef]
  3. Alanazi, F. Electric Vehicles: Benefits, Challenges, and Potential Solutions for Widespread Adaptation. Appl. Sci. 2023, 13, 6016. [Google Scholar] [CrossRef]
  4. Bunkar, A.; Gupta, S.; Sharma, D. Electrifying the Future: The Rise of Electric Vehicles. Int. J. Sci. Res. Eng. Manag. 2024, 8, 1–5. [Google Scholar] [CrossRef]
  5. Barman, P.; Dutta, L.; Bordoloi, S.; Kalita, A.; Buragohain, P.; Bharali, S.; Azzopardi, B. Renewable energy integration with electric vehicle technology: A review of the existing smart charging approaches. Renew. Sustain. Energy Rev. 2023, 183, 113518. [Google Scholar] [CrossRef]
  6. Koniak, M.; Jaskowski, P.; Tomczuk, K. Review of Economic, Technical and Environmental Aspects of Electric Vehicles. Sustainability 2024, 16, 9849. [Google Scholar] [CrossRef]
  7. Li, D.; Lau, A.D.; Gong, Y. Electric Vehicles Empowering the Construction of Green Sustainable Transportation Networks in Chinese Cities: Dynamic Evolution, Frontier Trends, and Construction Pathways. Energies 2025, 18, 1943. [Google Scholar] [CrossRef]
  8. Mohammed, A.; Saif, O.; Abo-Adma, M.; Fahmy, A.; Elazab, R. Strategies and sustainability in fast charging station deployment for electric vehicles. Sci. Rep. 2024, 14, 283. [Google Scholar] [CrossRef]
  9. Kumar, M.; Panda, K.; Naayagi, R.T.; Thakur, R.; Panda, G. Comprehensive Review of Electric Vehicle Technology and Its Impacts: Detailed Investigation of Charging Infrastructure, Power Management, and Control Techniques. Appl. Sci. 2023, 13, 8919. [Google Scholar] [CrossRef]
  10. Adamashvili, N.; Thrassou, A. Towards Sustainable Decarbonization: Addressing Challenges in Electric Vehicle Adoption and Infrastructure Development. Energies 2024, 17, 5443. [Google Scholar] [CrossRef]
  11. Jeong, J.; Ghaddar, B.; Zufferey, N.; Nathwani, J. Adaptive robust electric vehicle routing under energy consumption uncertainty. Transp. Res. Part C Emerg. Technol. 2024, 160, 104529. [Google Scholar] [CrossRef]
  12. Apata, O.; Bokoro, P.; Sharma, G. The Risks and Challenges of Electric Vehicle Integration into Smart Cities. Energies 2023, 16, 5274. [Google Scholar] [CrossRef]
  13. Liu, B.; Ni, W.; Liu, R.; Guo, Y.J.; Zhu, H. Optimal Electric Vehicle Charging Strategies for Long-Distance Driving. IEEE Trans. Veh. Technol. 2024, 73, 4949–4960. [Google Scholar] [CrossRef]
  14. Bruj, O.; Calborean, A. Lifecycle Evaluation of Lithium-Ion Batteries Under Fast Charging and Discharging Conditions. Batteries 2025, 11, 65. [Google Scholar] [CrossRef]
  15. Jiang, Y.; Ke, Y.; Yang, F.; Ji, J.; Peng, W. State of Health Estimation for Second-Life Lithium-Ion Batteries in Energy Storage System with Partial Charging-Discharging Workloads. IEEE Trans. Ind. Electron. 2024, 71, 13178–13188. [Google Scholar] [CrossRef]
  16. Leijon, J.; Boström, C. Charging Electric Vehicles Today and in the Future. World Electr. Veh. J. 2022, 13, 139. [Google Scholar] [CrossRef]
  17. Li, Y.; Li, F.; Li, Q.; Zhang, P. Battery swapping station location routing problem: A Cooperative Business Model. Comput. Ind. Eng. 2024, 200, 110775. [Google Scholar] [CrossRef]
  18. Qi, W.; Zhang, Y.; Zhang, N. Scaling Up Electric-Vehicle Battery Swapping Services in Cities: A Joint Location and Repairable-Inventory Model. Manag. Sci. 2023, 69, 6855–6875. [Google Scholar] [CrossRef]
  19. Ferro, G.; Paolucci, M.; Robba, M. Optimal Charging and Routing of Electric Vehicles with Power Constraints and Time-of-Use Energy Prices. IEEE Trans. Veh. Technol. 2020, 69, 14436–14447. [Google Scholar] [CrossRef]
  20. Xie, D.-F.; Yu, Y.; Zhou, G.; Zhao, X.; Chen, Y. Collaborative optimization of electric bus line scheduling with multiple charging modes. Transp. Res. Part D Transp. Environ. 2023, 114, 103551. [Google Scholar] [CrossRef]
  21. Wang, W.; Adulyasak, Y.; Cordeau, J.F.; He, G. The Heterogeneous-Fleet Electric Vehicle Routing Problem with Nonlinear Charging Functions. Transp. Res. Part C Emerg. Technol. 2025, 170, 104932. [Google Scholar] [CrossRef]
  22. Ma, H.; Yang, R.; Li, X. Delivery routing for a mixed fleet of conventional and electric vehicles with road restrictions. Int. J. Prod. Res. 2024. [Google Scholar] [CrossRef]
  23. Li, Y.; Liao, W.; Huang, Y. Mixed fleet-based two-echelon vehicle routing optimization for cold chain logistics with diverse recharging strategies. PLoS ONE 2025, 20, e0318765. [Google Scholar] [CrossRef] [PubMed]
  24. Dantzig, G.; Ramser, J.H. The Truck Dispatching Problem. Manag. Sci. 1959, 6, 80–91. [Google Scholar] [CrossRef]
  25. Demir, E.; Bektaş, T.; Laporte, G. The bi-objective Pollution-Routing Problem. Eur. J. Oper. Res. 2014, 232, 464–478. [Google Scholar] [CrossRef]
  26. Liu, Z.; Chen, Y.; Qin, J. The pollution-routing problem with one general period of congestion. J. Model. Manag. 2022, 18, 1529–1560. [Google Scholar] [CrossRef]
  27. Erdoğan, S.; Miller-Hooks, E. A Green Vehicle Routing Problem. Transp. Res. Part E Logist. Transp. Rev. 2012, 48, 100–114. [Google Scholar] [CrossRef]
  28. Çatay, B.; Keskin, M. The impact of quick charging stations on the route planning of Electric Vehicles. In Proceedings of the 2017 IEEE Symposium on Computers and Communications (ISCC), Heraklion, Greece, 3–6 July 2017; pp. 152–157. [Google Scholar] [CrossRef]
  29. Felipe, Á.; Ortuño, M.T.; Righini, G.; Tirado, G. A heuristic approach for the green vehicle routing problem with multiple technologies and partial recharges. Transp. Res. Part E-Logist. Transp. Rev. 2014, 71, 111–128. [Google Scholar] [CrossRef]
  30. Keskin, M.; Çatay, B. Partial recharge strategies for the electric vehicle routing problem with time windows. Transp. Res. Part C-Emerg. Technol. 2016, 65, 111–127. [Google Scholar] [CrossRef]
  31. Zhao, Z.; Xu, M.; Lee, C. Capacity Planning for an Electric Vehicle Charging Station Considering Fuzzy Quality of Service and Multiple Charging Options. IEEE Trans. Veh. Technol. 2021, 70, 12529–12541. [Google Scholar] [CrossRef]
  32. Aljabri, B.S.; Fararah, E.S. Electric vehicle routing problem with time windows, battery swapping van, and energy consumption (EVRPTW-BSV-EC). World J. Adv. Res. Rev. 2024, 22, 1914–1926. [Google Scholar] [CrossRef]
  33. Kancharla, S.R.; Ramadurai, G. Electric vehicle routing problem with non-linear charging and load-dependent discharging. Expert Syst. Appl. 2020, 160, 113714. [Google Scholar] [CrossRef]
  34. Ren, X.; Huang, H.; Feng, S.; Liang, G. An improved variable neighborhood search for bi-objective mixed-energy fleet vehicle routing problem. J. Clean. Prod. 2020, 275, 124155. [Google Scholar] [CrossRef]
  35. Ding, N.; Li, M.; Hao, J. A Two-Phase Approach to Routing a Mixed Fleet with Intermediate Depots. Mathematics 2023, 11, 1924. [Google Scholar] [CrossRef]
  36. Dönmez, S.; Koç, Ç.; Altiparmak, F. The mixed fleet vehicle routing problem with partial recharging by multiple chargers. Transp. Res. Part E Logist. Transp. Rev. 2022, 167, 102917. [Google Scholar] [CrossRef]
  37. Røpke, S.; Pisinger, D. An Adaptive Large Neighborhood Search Heuristic for the Pickup and Delivery Problem with Time Windows. Transp. Sci. 2006, 40, 455–472. [Google Scholar] [CrossRef]
  38. Naccache, S.; Côté, J.F.; Coelho, L.C. The multi-pickup and delivery problem with time windows. Eur. J. Oper. Res. 2018, 269, 353–362. [Google Scholar] [CrossRef]
  39. Pereira, V.G.; Alves-Junior, O.C.; Baldo, F. An Approach to Solve the Heterogeneous Fixed Fleet Vehicle Routing Problem with Time Window Based on Adaptive Large Neighborhood Search Meta-Heuristic. IEEE Trans. Intell. Transp. Syst. 2024, 25, 8148–8157. [Google Scholar] [CrossRef]
  40. Amiri, A.; Zolfagharinia, H.; Amin, S.H. Routing a mixed fleet of conventional and electric vehicles for urban delivery problems: Considering different charging technologies and battery swapping. Int. J. Syst. Sci. Oper. Logist. 2023, 10, 2191804. [Google Scholar] [CrossRef]
  41. Xue, S.; Song, R.; He, S.; An, J.; Wang, Y. An Improved Adaptive Large Neighborhood Search Algorithm for the Heterogeneous Customized Bus Service with Multiple Pickup and Delivery Candidate Locations. J. Adv. Transp. 2022, 2022, 1679469. [Google Scholar] [CrossRef]
  42. Wang, R.; Zhang, F.; Ding, L.; Jiang, J.; Han, Z. A Novel Approach for Optimizing Mixed Hazardous Material Fleet Vehicle Routing Problem Method Through Intermediate Bulk Container Sharing with Adaptive Intuitionistic Fuzzy Large Neighborhood Search. Int. J. Fuzzy Syst. 2024, 27, 1827–1845. [Google Scholar] [CrossRef]
  43. Mo, Y.; Yang, K.; Han, S.; Gupta, S. Multi-period heterogeneous fleet vehicle routing problem with self-pickup point selection: A last-mile delivery scenario in urban and rural areas. Ann. Oper. Res. 2024. [Google Scholar] [CrossRef]
  44. Xiao, Y.; Zhao, Q.; Kaku, I.; Xu, Y. Development of a fuel consumption optimization model for the capacitated vehicle routing problem. Comput. Oper. Res. 2012, 39, 1419–1431. [Google Scholar] [CrossRef]
  45. Aydınalp, Z.; Özgen, D. Solving vehicle routing problem with time windows using metaheuristic approaches. Int. J. Intell. Comput. Cybern. 2022, 16, 121–138. [Google Scholar] [CrossRef]
  46. Liu, Y.; Roberto, B.; Zhou, J.; Yu, Y.; Sun, W. Efficient feasibility checks and an adaptive large neighborhood search algorithm for the time-dependent green vehicle routing problem with time windows. Eur. J. Oper. Res. 2023, 310, 133–155. [Google Scholar] [CrossRef]
  47. Meng, F.; Zhou, X.; Piao, X.; Chu, D. Variable neighbourhood search based on Metropolis criterion for crowdsourced delivery scheduling problem in dispatch model. Comput. Oper. Res. 2024, 167, 106662. [Google Scholar] [CrossRef]
  48. Schneider, M.; Stenger, A.; Goeke, D. The Electric Vehicle-Routing Problem with Time Windows and Recharging Stations. Transp. Sci. 2014, 48, 500–520. [Google Scholar] [CrossRef]
  49. Wang, Y.; Zhou, J.; Sun, Y.; Fan, J.; Wang, Z.; Wang, H. Collaborative multidepot electric vehicle routing problem with time windows and shared charging stations. Expert Syst. Appl. 2023, 219, 119654. [Google Scholar] [CrossRef]
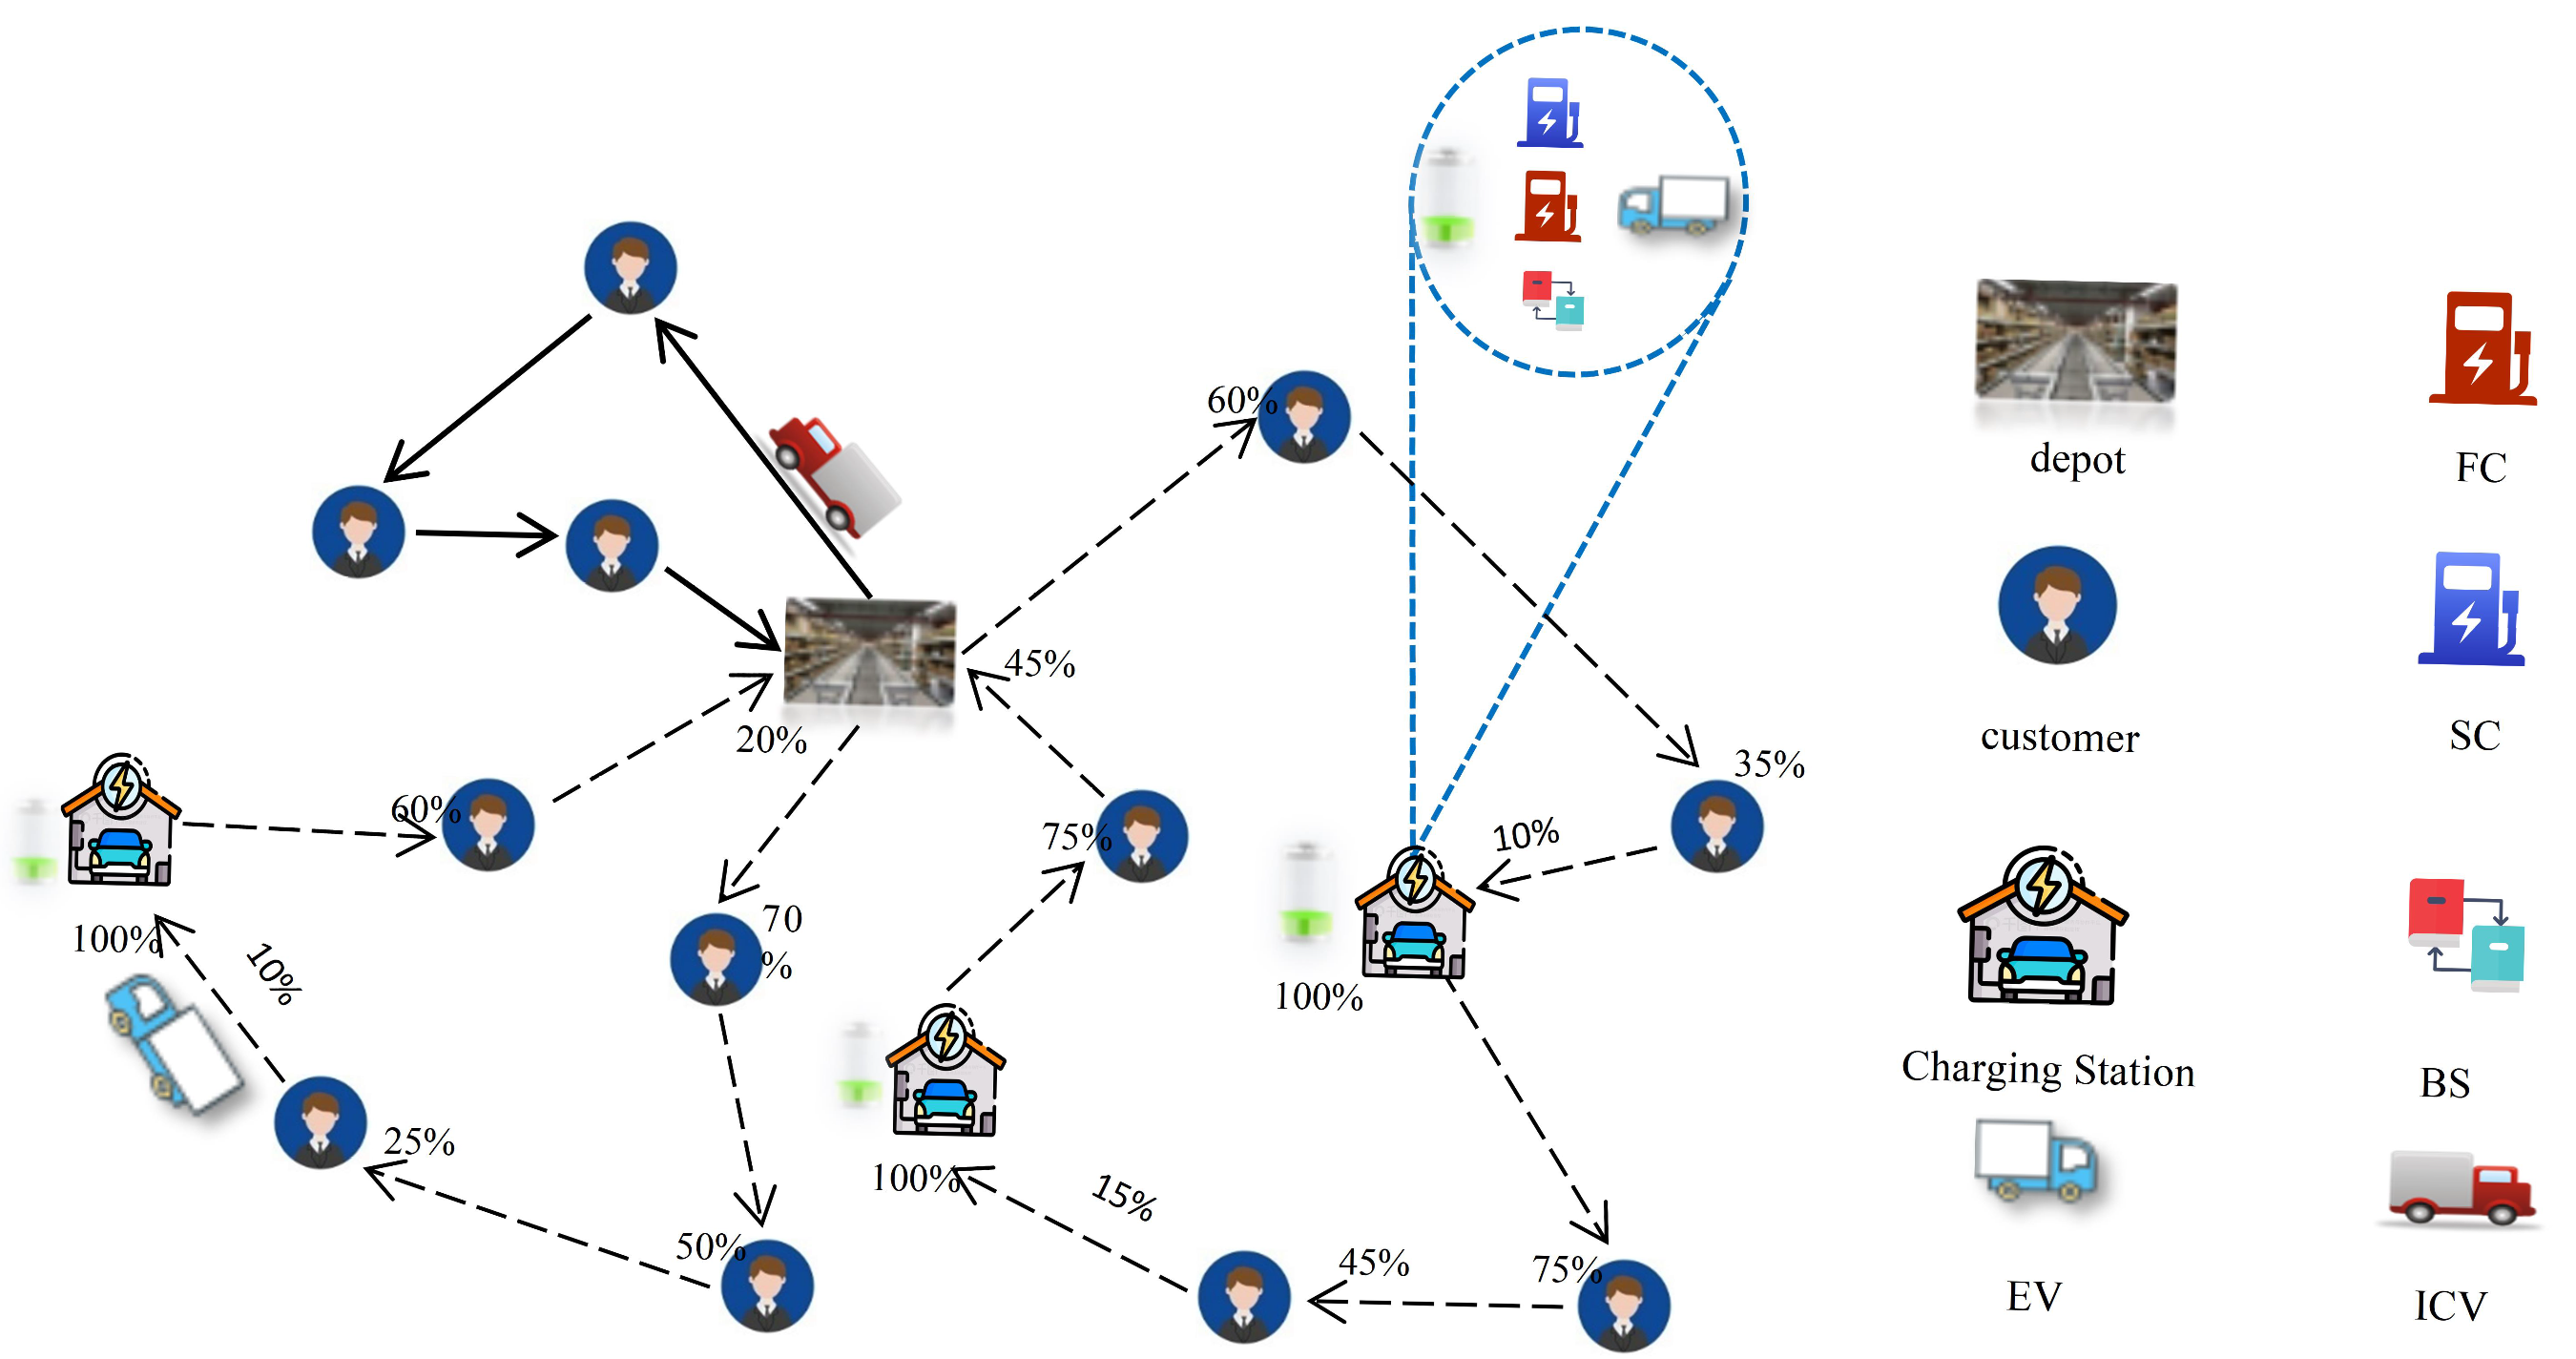
Figure 1. Schematic diagram of mixed fleet distribution.
Energies 18 05220 g001
Figure 2. Flow chart of the IALNS algorithm.
Energies 18 05220 g002
Figure 3. Main effect plot of key parameters.
Energies 18 05220 g003
Figure 4. Performance of different algorithms in solving medium- and large-scale instances.
Energies 18 05220 g004
Figure 5. Geographical distribution map of instance nodes.
Energies 18 05220 g005
Figure 6. Comparison of computational results. (a) GA results. (b) ALNS results. (c) IALNS results. (d) Iteration curves of the three algorithms.
Energies 18 05220 g006
Figure 7. Sensitivity analysis of the proportion of electric vehicles.
Energies 18 05220 g007
Figure 8. Analysis of carbon emissions and distribution costs for the proportion of electric vehicles.
Energies 18 05220 g008
Figure 9. Analysis of charging methods.
Energies 18 05220 g009
Table 1. Comparison of solution performance between Gurobi and IALNS on small-scale instances.
InstanceGurobiIALNS Algorithm%GAP
T TC T TC
c101C10F51013.243686.3431.343686.340.00%
c104C10F51800.001861.4720.571861.470.00%
c201C10F51054.281709.6148.121709.610.00%
c205C10F534.921592.2519.891592.250.00%
r102C10F516.251833.3721.451833.370.00%
r103C10F518001319.2616.731319.260.00%
r201C10F576.451631.3935.191631.390.00%
r203C10F518001087.2655.681087.260.00%
rc102C10F519.632670.2521.022638.86−1.18%
rc108C10F51247.901733.8822.911733.880.00%
rc201C10F5180.141797.8937.471797.890.00%
rc205C10F583.722175.7028.832175.700.00%
c103C15F518003644.4190.253644.410.00%
c106C15F523.192848.1954.962848.190.00%
c202C15F518002279.8899.142279.880.00%
c208C15F5430.611778.0276.601778.020.00%
r102C15F518003006.5959.393020.790.47%
r105C15F518002676.0251.712676.020.00%
r202C15F518001984.58135.051984.580.00%
r209C15F518001855.30138.281855.300.00%
rc103C15F518002764.3048.842741.91−0.82%
rc108C15F518002351.2361.672351.230.00%
rc202C15F518002921.81123.932867.18−1.86%
rc204C15F518001914.40256.501914.400.00%
GAP = (TC of IALNS − TC of Gurobi)/max{TC of IALNS, TC of Gurobi}.
Table 2. Comparison of results on medium- and large-scale instances.
InstanceGAIALNSALNS%GAP
TC T TC T TC T
c101C5OF215259.05 2083.72 4769.55 2117.965130.782127.357.57
c106C5OF214874.842796.98 4162.45 2712.98 4733.412881.8313.72
c206C50F214057.384253.67 3661.08 4208.18 3920.174436.937.08
r102C50F219938.522073.62 9738.76 1755.99 9743.652361.120.05
r103C50F218470.512613.79 8036.42 2007.97 8144.722504.21.35
rc206C50F214564.763121.76 4509.05 3078.52 4439.283152.242.79
rc108C75F216925.46 3836.63 5955.41 3968.496710.724409.6712.68
rc202C75F214841.494918.75 4278.13 4870.41 4636.315287.538.37
GAP = {(min (TC of GA, TC of ALNS) − TC of IALNS)/(TC of IALNS)}.
Table 3. Parameters.
ParametersValveParametersValve
h 1 , h 2 100, 150 yuan/per vehicle B e 90 kw · h
h 3 , h 4 1.5, 1.2 yuan/km B a 0.88 kw · h/km
h 5 , h 6 5, 10 yuan/h Q e , Q f 4.9, 4.5 t
h 7 0.5 yuan/kgV50 km/h
ρ , ρ 0 0.24, 0.08 L/km g 1 , g 2 30, 10 kw
θ 2.65 kg/L C m 1 , C m 2 0.68, 1.46 yuan/kwh
α 0.72 C m 3 80 yuan
η 0.94 kg/kw · hp8 min
Table 4. Comparison of results of the three optimization algorithms.
AlgorithmVehicle
EV_FV
Total Distance
(km)
Total Time
(min)
Charging Cost
(Yuan)
Total Cost
(Yuan)
GA4_51155.742119.40253.884578.32
ALNS4_51107.902087.54241.794497.39
IALNS5_3976.731873.92228.984365.02
IALNS vs. GA Reduction (%)11.1%15.5%13.1%9.8%4.6%
IALNS vs. ALNS Reduction (%)11.1%11.7%11.4%5.3%2.9%
Table 5. Cost-effectiveness of fleet configuration.
Configuration
Method
Total Cost
(Yuan)
Transportation Cost
(Yuan)
Carbon Cost
(Yuan)
Time Window Cost
(Yuan)
Charging Time
(min)
Pure Fuel4972.862234.18872.2500
Mixed Fleet4365.022257.51451.41241.59351.92
Pure Electric4738.522720.56264.91418.36634.63
Disclaimer/Publisher’s Note: The statements, opinions and data contained in all publications are solely those of the individual author(s) and contributor(s) and not of MDPI and/or the editor(s). MDPI and/or the editor(s) disclaim responsibility for any injury to people or property resulting from any ideas, methods, instructions or products referred to in the content.