Abstract
In cold regions, performance reduction in a Ground-Coupled Heat Pump (GSHP) system has been frequently reported. Many operational strategies have been adopted to mitigate such an undesirable phenomenon. However, these strategies have limited effects because the specific heat rate of Borehole Heat Exchangers (BHEs) is usually treated as constant. In this study, eight BHEs were installed in typical loess areas in Northwestern China to investigate how borehole depth affects its thermal performance. Thermal response tests (TRTs) showed that deeper boreholes led to a higher fluid outlet temperature. Compared to 150 m and 100 m boreholes, the energy coefficient factor (η) for a 200 m borehole increased by 18.02% and 45.0%, respectively. Numerical simulation also confirmed that deeper BHEs perform better. In addition, the initial ground temperature influences the thermal performance sensitively, but in the opposite way for heating and cooling modes. These findings offer valuable insights for installing GSHP systems to achieve sustainable and high thermal performance in cold regions.
1. Introduction
Ground Source Heat Pump (GSHP) systems are widely used for space heating or cooling by coupling Borehole Heat Exchangers (BHEs). The performance of BHEs is crucial to the overall success of a GSHP system and is sensitively affected by the initial ground temperature, thermal properties of the geological materials, and hydrogeological conditions. In cold climates, the imbalanced seasonal thermal load of buildings often causes continuous decreases in ground temperature during GSHP system operating [1]. Such thermal imbalance in the soil is a major impediment to the sustainable performance of GSHP systems [2]. As BHEs monotonously extract heat from the ground while injecting less heat into it, a severe cold buildup occurs. This leads to a drop in soil temperature, resulting in the most severe soil thermal imbalance and a reduction in the thermal performance of the GSHP [3,4].
Numerous studies have investigated thermal imbalance and the performance of BHEs [5]. For instance, the drop in soil temperature in Harbin, Changchun, and Shenyang led to system COP decreasing by 47%, 44%, and 39%, respectively, during operation. The most severe soil temperature reduction, approximately 10 °C over a 10-year operation, was observed in Harbin [6]. Such a decline, exceeding a COP drop of 2.0 over 10 years, indicated serious performance degradation [5]. Other numerical simulations corroborate this trend; a system in Beijing experienced a soil temperature decrease of 3.2 °C over 20 years [7], while another study reported a maximum reduction of about 12 °C at the borehole wall over 25 years [8]. Reference [9] simulated a GCHP system built in Beijing under different load ratios. After 10 years, the soil temperature reduced by about 3.0 °C with a heating load-to-cooling load ratio of 2.4, and by about 4.5 °C when the ratio was 3.65. When minor thermal imbalance occurs in a BHE, adjusting the borehole length can help to mitigate it. A ten-year simulation showed that increasing borehole depth from 80 m to 120 m reduced the ground temperature drop from 8.4 °C to 6.5 °C [10].
The studies mentioned above demonstrate a significant reduction in thermal performance of BHEs installed in cold regions. This phenomenon is primarily attributed to two factors: a heating load that exceeds the cooling load and a low initial ground temperature [6,8,9]. However, previous research has focused mainly on the operation strategies to mitigate thermal performance reduction, such as employing hybrid systems, e.g., solar-assisted heating, to compensate for the ground heat imbalance. Those measures have limitations, their effectiveness is often constrained on cloudy days or at night, and they can significantly increase capital costs. Therefore, increasing the initial ground temperature becomes a key alternative. In this study, to achieve higher initial ground temperature and more stable thermal performance of BHEs, we leverage the geothermal gradient effect by increasing the borehole depth. This approach inherently accesses higher initial ground temperatures, thereby enhancing system performance.
2. Geo-Environment and Study Methodology
2.1. Seasonal Thermal Load of Buildings
The study area is located in one of the four major climate types in China, of which Tianshui is in the temperate continental climate zone, while the other three TRT test sites in Lanzhou, Qingyang, and Xianyang are in the temperate monsoon climate zone. In Northwest China, loess is widely distributed, which covers approximately 6.6 percent of the total area of China [11], as shown in Figure 1. It is an area located in the Northwest of China, which is a typical temperate monsoon climate zone. Eight BHEs are built in two typical geological settings within this climate zone, including the Loess Plateau Region (Qingyang and Xianyang) and River Terrace Region (Lanzhou and Tianshui), as shown in Figure 1. Furthermore, all these boreholes are drilled in city urban areas to provide a reference for later development of GSHP technology. These BHEs have depths from 100 m to 200 m with configured single-U or double-U pipe. TRTs are implemented to examine the thermal performance of these BHEs. The borehole thermal parameters are later estimated and analyzed. The long-term performance of the BHEs is investigated via numerical modeling, and thermal sustainability is considered with varying borehole depths.
A “Degree Hours Method” determining the thermal load of buildings has been used in this study. Two factors, “Heating Degree Hours” (HDH) and “Cooling Degree Hours” (CDH), are shown as follows [12]:
where HHDH is the heating period (Hour·°C), HCDH is the cooling period (Hour·°C), Tc is the comfort indoor temperature range, and Ta is the hourly ambient temperature (°C).
According to the local design standard [13], the standard indoor temperature Tc is set at 26 °C in summer and 18 °C in winter.

Figure 1.
The study area located in Northwest China, displaying the loess distribution, modified from [14] (The red star: the capital city of China).
Figure 1.
The study area located in Northwest China, displaying the loess distribution, modified from [14] (The red star: the capital city of China).

The study areas have sufficient sunshine, with a maximum daily net solar radiation intensity of 25.05 MJ/m2, as shown in Figure 2. Although the summers are hot, the summer period is short. Winters are long and severe, with the lowest land surface temperature dropping to −21.1 °C and lasting about five months. Thus, the building’s heating load is significantly higher than its cooling load in this cold region.
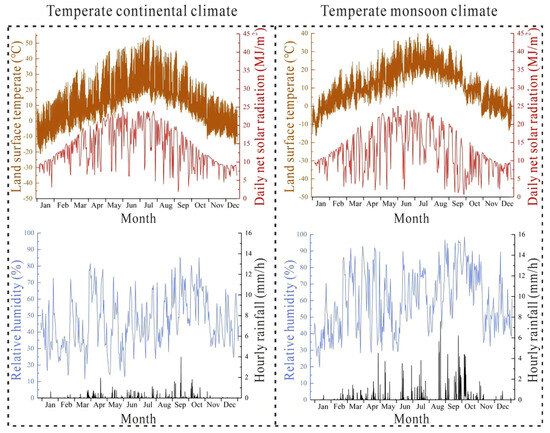
Figure 2.
The monitored climatic conditions in the study area in 2021.
2.2. Geological Setting
Figure 3 shows the typical geological profiles in the study area within 200 m depth. There are three types of typical loess strata in the Loess Plateau in China: Malan loess, Lishi loess, and Wucheng loess. Malan loess is generally thinner than Lishi loess and Wucheng loess, with a thickness ranging from 9.4 to 15 m. It is mostly pale yellow in color, lighter in color, loose in texture, developed with vertical joints, and has strong collapsibility. Lishi loess has a thickness of 60–151 m, which is composed of silty loam. It is relatively hard and high, and the groundwater level is often in this layer. Wucheng loess is composed of clay or loam, which is hard and dense. The color is darker than others.
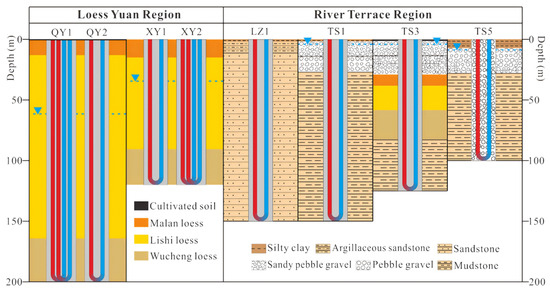
Figure 3.
Geological profiles for the geological setting at the testing point XY and QY in the Loess Plateau Region and LZ and TS in the River Terrace Region (Red line: hot fluid; Blue line: cold fluid; Blue dashed line: groundwater table).
In the terrace region, markedly different from the Loess Plateau Region, a gravel layer is about 21–40 m below the ground surface, which is considered an aquifer. Below such an aquifer, this area is mainly deposited by sandstone and mudstone which have a geological age of the Tertiary Period. Due to low permeability, it can be regarded as an aquiclude. Specifically, because the underlying bedrock outcrops directly at the surface, no aquifer was found at the testing site in Lanzhou.
To reveal the thermophysical properties of the geomaterials in the Loess Plateau Region, we collected the thermophysical parameters of the different strata in the region from the historical literature and also using our own measurements, as shown in Table 1.

Table 1.
Thermal physical parameters of rock and soil in typical strata in the study area collected from field experiment and Refs. [15,16].
2.3. Geometric Configuration of BHE
Figure 4 shows the eight boreholes which were installed in two typical regions: the Loess Plateau Region and the River Terrace Region. The boreholes have depths varying from 100 m to 200 m and a diameter of 150/195 mm. Double-U and single-U high-density polyethylene pipes (HDPEs) are used in these boreholes. The gaps between the loops and the ground are backfilled with sand–bentonite mortar and drilling cuttings.
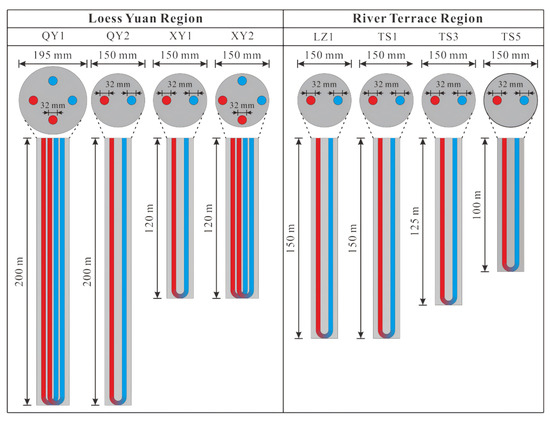
Figure 4.
Sketch of the two different types of prepared borehole heat exchangers (contains information of dimension of borehole and pipes; Red: hot fluid; Blue: cold fluid).
2.4. Thermal Response Test (TRT)
The borehole thermal parameters including ground temperature, soil thermal conductivity, λeff, and borehole thermal resistance, Rb, can be determined by a TRT [17,18]. Parameters including fluid inlet–outlet temperature, fluid flow rate, heating power, and ambient temperature were measured simultaneously, as shown in Figure 5a. The connections between the TRT device and the vertical BHEs were insulated to avoid heat loss [19].
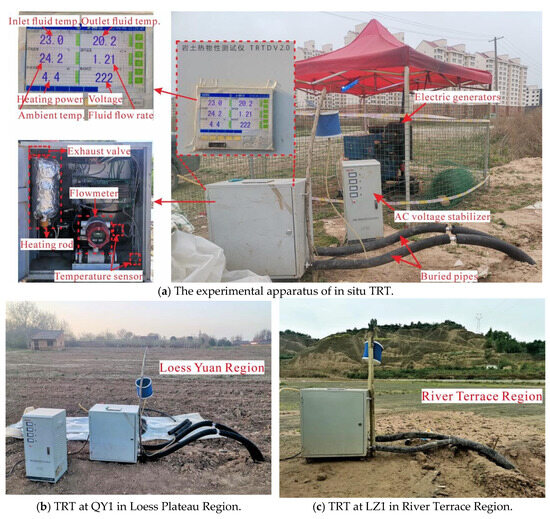
Figure 5.
Thermal response test (TRT) on site.
Figure 5b,c and Table 2 show the data obtained during thermal response tests and implementation of TRTs on site in the Loess Plateau Region and the River Terrace Region. The TRT device has a measuring accuracy of ±0.1 °C for temperature and ±0.1 L/s for fluid flow rate. A heater, a water circulating pump, a flowmeter, and all the sensors are assembled in a box, as shown in the left sub-figure in Figure 6.
Table 2.
Specifications and configurations of the borehole heat exchangers and data obtained during thermal response tests in the Loess Plateau Region and the River Terrace Region.
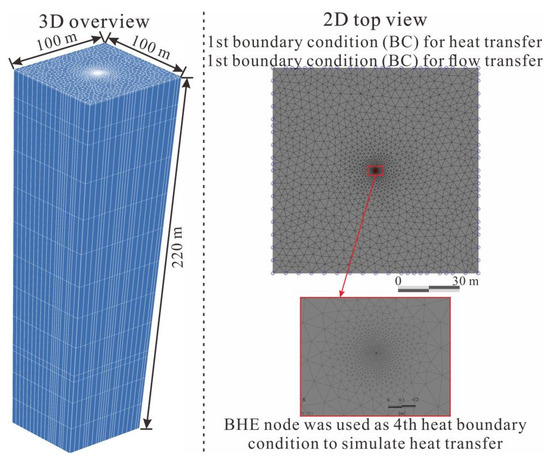
Figure 6.
(Left): The spatial discretization of the numerical model. (Right): Top view and boundary conditions (BCs) of the model.
A line-heat-source model proposed by Hellström was applied to interpret TRT measurements [20].
The energy efficiency coefficient characterizes the ability of a BHE and is a reflection of the heat capacity of the BHE, which is related to its geometric configuration parameters, ground thermal properties, and ground conditions. The expressions are simply formulated as follows [21]:
where η is the energy efficiency coefficient (-), Φ is the actual thermal extracted or injected in subsurface (kW), Φ’ is the Maximum theoretical heat that can be exchanged in subsurface (kW), Tin is fluid inlet temperature (°C), Tout is fluid outlet temperature (°C), and T0 is initial ground temperature (°C).
2.5. Numerical Modeling of Heat Transport
TRTs are used to determine fundamental, time-invariant thermal properties of the ground (such as effective thermal conductivity and borehole resistance). These validated parameters then serve as critical inputs for the numerical model, which is a recognized tool for simulating long-term system behavior based on these physical properties. To evaluate the long-term sustainable performance of the BHEs in the Loess Plateau Region and the River Terrace Region, two numerical models are developed using FEFLOW based on the geological background of Qingyang and Tianshui.
2.5.1. Model Setup
The BHE is treated as a 1D discrete element in a finite-element matrix system in FEFLOW [22,23,24].
In this study, the two models, vertically discretized with geological layers, have a size of 50 × 50 m (length × width, as shown in Figure 6), and the depth is set to match the BHEs on site. To achieve precise outputs, the meshes around the BHEs are refined 100 times [25].
Input properties for the numerical models are shown in Table 3. In this study, the continuous operation (24 h/day) of the heat pump is assumed throughout the simulation period, and another two intermittent operation conditions (8 h/day and 12 h/day) are considered. The system is assumed to be run in year-round continuous or intermittent operation, encompassing both space heating in winter and cooling in summer. The operational parameters for both modes have been defined in the numerical model. Domestic hot water preparation is not considered in this study.
Table 3.
The parameters deployed in the numerical modeling.
2.5.2. Model Validation
The numerical model needs to be validated with the field measurements before it is used for thermal performance prediction [26]. Figure 7 displays the numerical outputs and measurements for model validation. The acceptable error is about 2.0% of the measured fluid outlet temperature due to the impreciseness of the flowmeter, temperature sensor, and data noise. The uncertainty of the temperature sensors was estimated to be 0.20 °C. The RMSE values were 0.184 °C for the Qingyang case and 0.173 °C for the Tianshui case. It is proved that the numerical models are within the acceptable tolerance, suggesting the two FEFLOW models can reasonably predict long-term performance of BHEs.
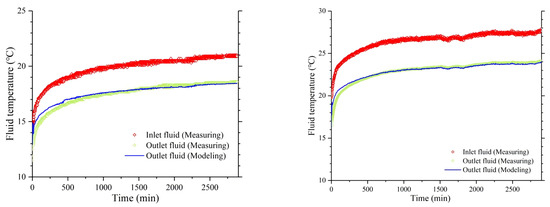
Figure 7.
The simulated outlet fluid temperature and the measurements by TRT LYR (Loess Terrace Region) and RTR (River Terrace Region). (Left) Numerical outputs of the ModelLYR versus the field measurements; (Right) numerical outputs of the ModelRTR versus the field measurements.
2.5.3. Simulation of the BHE with Varying Depth
To evaluate the influence of borehole length on the performance of BHEs in cold regions, simulations were conducted for four areas (QY1, LZ, XY1, and TS). The boreholes are configured with a double-U pipe of 32 mm in diameter, and the borehole diameter is 100 mm. Five depths (100 m, 120 m, 150 m, 180 m, and 200 m) with three different operation conditions (8 h, 12 h, and 24 h) are simulated to evaluate thermal performance of the BHE. The model input parameters, including soil thermal conductivity, fluid flow rate, and inlet ground temperature, are shown in Table 4.
Table 4.
The parameters applied in the numerical model for simulating different BHE depth and operation conditions.
3. Results
3.1. Temperature Evolution During TRT
Two sets of TRTs were carried out respectively on the River Terraces and the Loess Plateau in the study area. The records of eight TRTs are presented in Figure 8 and Figure 9. All TRTs are tested for a duration of 48 h with a fluid flow rate of 1.2–1.8 m3/h and heating power of around 4.0–5.0 kW.
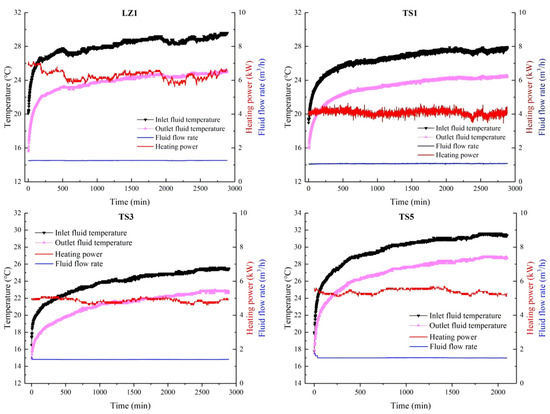
Figure 8.
The inlet–outlet fluid data and monitored heating power during the thermal response tests at LZ and TS in the River Terrace Region.
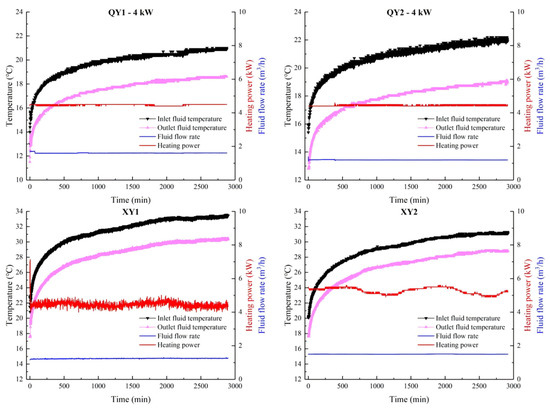
Figure 9.
The inlet–outlet fluid data and monitored heating power during the thermal response tests at QY and XY in the Loess Plateau Region.
3.2. Borehole Thermal Parameters
Table 5 shows the parameters interpreted by the field TRT. The initial ground temperature, determined by a power cycle of 90 min, varies between 12.91 and 17.61 °C, with a mean value of 15.42 °C.
Table 5.
The interpreted parameters of TRTs for the Loess Plateau Region and the River Terrace Region.
The effective thermal conductivity of the ground varies between 1.339 W/(m·K) and 2.389 W/(m·K) in the River Terrace Region. For the Loess Plateau Region, the effective thermal conductivity is 1.396 W/(m·K) and 1.605 W/(m·K). The mean effective thermal conductivity is 23.44% higher in the RTR compared to the LPR.
To further explain the difference in effective thermal conductivity between the two landform types, we statistically recorded the thermal conductivity data of the strata in the above areas in the historical literature and calculated the weighted average thermal conductivity values, λWA, within the depth range of the boreholes based on the actual thickness of the strata recorded in the field boreholes, as shown in Table 6. The λWA of the ground varies between 2.3 W/(m·K) and 2.622 W/(m·K) at the River Terrace Region. For the Loess Plateau Region, the λWA is determined to be 1.441 W/(m·K) and 1.468 W/(m·K). Compared to the Loess Plateau Region, the mean λWA of the River Terrace Region is higher by 67.94% than that in the Loess Plateau Region.
Table 6.
Weighted average results calculated by the thickness of typical strata in the study area and the thermal physical parameters collected from Refs. [15,16].
Comparing the field test values of TRT, it can be found that the weighted average results based on the thickness of the strata are in good agreement with the actual test values in the Loess Plateau Region. However, the difference between the λWA and the actual test value in the River Terrace Region is large, with an average difference of 0.55, as shown in Figure 10. This can be attributed to differences in groundwater saturation conditions. Thermal conductivity of loess is sensitively affected by moisture content [27,28]. In the River Terrace Region, the groundwater level and surface water level are closely related and usually fluctuate greatly by seasonal influence, which causes thermal conductivity variation in this area.
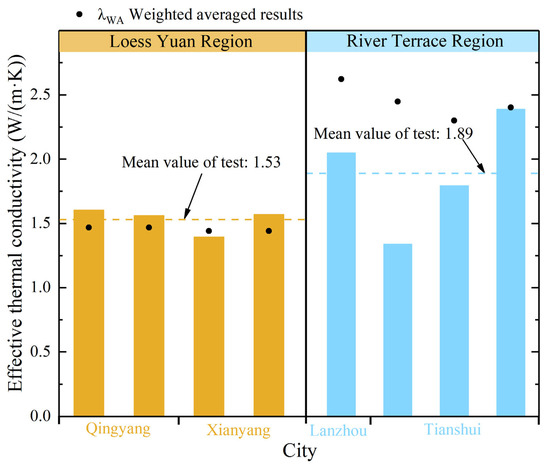
Figure 10.
Comparison of the tested effective thermal conductivity estimated by TRT and the weighted averaged results calculated in Table 5 in the Loess Plateau Region with the River Terrace Region.
Table 7 shows the extractable specific heat rate of BHE. The specific extractable heat of BHE in the Loess Plateau Region varies between 21.01 W/m and 37.51 W/m with a mean value of 29.25 W/m. For the four TRTs at the River Terrace Region, these values vary from 27.48 W/m to 48.43 W/m, with an average rate of 37.63 W/m. The specific rate of the BHEs in the River Terrace Region was 28.65% higher than that in the Loess Plateau Region due to the lower thermal conductivity of the geological materials [29,30]. As it is calculated in ground thermal conductivity analysis, in Figure 10, the effective conductivity of the ground at the Loess Plateau Region is lower than that in the River Terrace Region.
Table 7.
The borehole thermal resistance and heat injection rate of BHE determined by the thermal response tests.
In the Loess Plateau Region, the type of buried pipe (Single U/Double U) has a negligible effect on the magnitude of heat flux. In the River Terrace Region, where aquifers are developed, the smaller the depth of the buried pipe, the greater the heat flux. Previous studies have demonstrated that aquifers usually promote heat transfer in subsurface geotechnical soils and can serve as advantageous heat transfer strata. Moreover, the proportion of aquifer thickness to total heat transfer depth decreases with increasing borehole depth in the River Terrace Region. Thus, the aquifer thickness in the River Terrace Region can be adequately considered as a heat transfer control factor for buried pipes.
Figure 11 shows the parameters estimated by the 8 field TRT. It displays that the estimated borehole thermal resistance varies from 0.037 (m·K)/W to 0.108 (m·K)/W in the Loess Plateau Region and from 0.054 (m·K)/W to 0.114 (m·K)/W in the River Terrace Region. Firstly, under the same buried pipe structure, the thermal resistance of the boreholes in Qingyang is generally higher than that in Xianyang. In the River Terrace Region, on the other hand, under the same condition of borehole structure, the thermal resistance of the borehole in the Lanzhou area is lower than that in Tianshui. In addition, the smaller the depth of the buried pipe, the higher the value of thermal resistance of the borehole under similar geological background and borehole structure conditions.
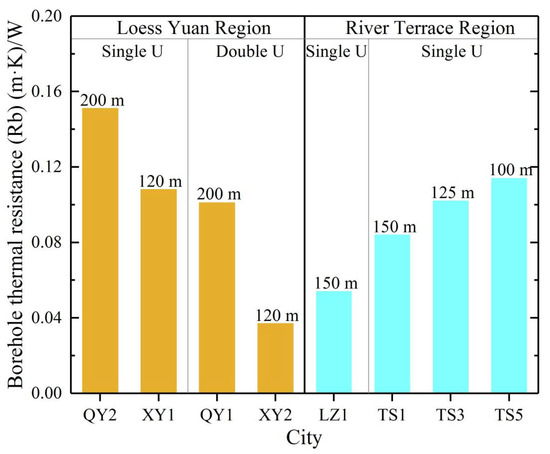
Figure 11.
Comparison of the estimated borehole thermal resistance for the two regions.
Figure 12 shows the energy efficiency coefficients of BHEs for various geometric configurations that were investigated to evaluate the heat transfer efficiency of the BHE in LPR and RTR. The energy efficiency coefficients may be shown to drop and stabilize progressively with operating time in all boreholes. In LPR, the deeper the underground pipe depth, the larger the energy efficiency coefficient. In Qingyang, the energy efficiency coefficient of 1U buried pipe is somewhat greater than that of 2U buried pipe, while in Xianyang, the two types of buried pipe have almost identical energy efficiency coefficients. In RTR, under the same depth condition (150 m) and buried pipe type (1U), the energy efficiency coefficient of BHE in Lanzhou is slightly higher than that in Tianshui. In Tianshui, which has comparable geological characteristics, the energy efficiency coefficient of BHE at 100 m deep is substantially lower than that at 125 m depth and 150 m depth, but there is not much difference at these two depths (125 m and 150 m). As a result, increasing the borehole depth could effectively increase the energy efficiency coefficient and thus improve the heat exchange effect of BHE.
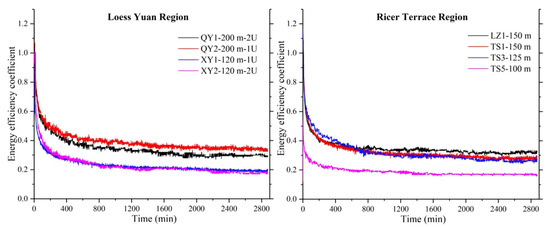
Figure 12.
The influence of the geometric configuration of BHE on the energy efficiency coefficient, η, under refrigeration condition.
3.3. Numerical Results of BHE Thermal Performance
Figure 13 shows the fluid outlet temperature development in two typical geologic settings based on the geological conditions of typical Loess Plateau in QY1. In a TRT, the lower outlet fluid temperature of the BHEs indicates a higher thermal efficiency. Hence, the deeper the buried pipe, the higher the thermal efficiency is. In the Loess Plateau Region, as the drilling depth grows from 100 m to 200 m, the temperature difference between the inlet and outlet increases from 1.0 °C to 1.9 °C. In the River Terrace Region, the fluid inlet and outlet temperature increased from 2.7 °C to 3.7 °C as the borehole depth increased from 100 m to 150 m. In general, the thermal efficiency of BHE in the River Terrace Region is less affected by the depth of the borehole than in the Loess Plateau Regions due to the high heat transfer efficiency of the aquifer.
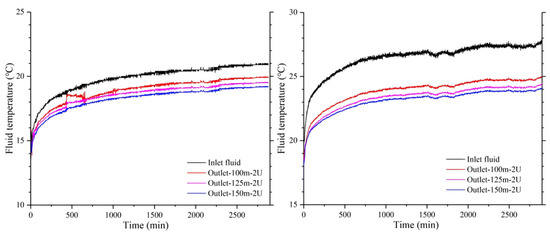
Figure 13.
The simulated fluid temperature of the borehole heat exchanger for the three depths to simulate the building’s cooling case.
Figure 14 depicts the recorded hourly simulated fluid temperature of the BHEs based on QY1 for the three different borehole depths over a 10-year operation. By comparison, a BHE with a depth of 200 m has an 18.02% and 45.10% higher specific heat rate than that of 150 m BHE and 100 m BHE in the cooling case, respectively. In the heating case, a BHE with a depth of 200 m has on average a 10.02% and 36.42% higher specific heat rate of BHEs than 150 m and 100 m, respectively.
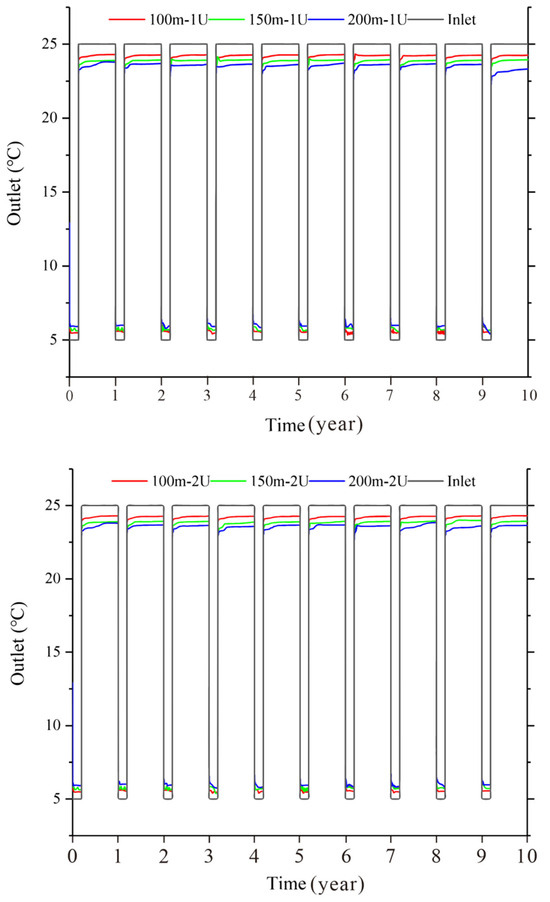
Figure 14.
Comparison of fluid inlet and outlet temperature for the three depths over a 10-year operation.
Figure 15 presents the determined specific heat exchange rate of BHEs with five burial depths (100 m, 120 m, 140 m, 180 m, and 200 m) under three operation conditions (24 h/day, 12 h/day, and 8 h/day) for four typical cities in Northwest cities in China. The results indicate that shorter operation durations result in higher thermal performance. This is because the operation of the BHE will cause heat and cold accumulation around the BHE, which in turn decreases heat transfer efficiency gradually. It is noticed that Qingyang city has the lowest thermal performance of BHE. It is mainly attributed to the lowest initial ground temperature, which is only 11.6–12.9 °C, as shown in Table 4. Thus, thermal performance can be sensitively affected by both the ground initial temperature and operation hours.
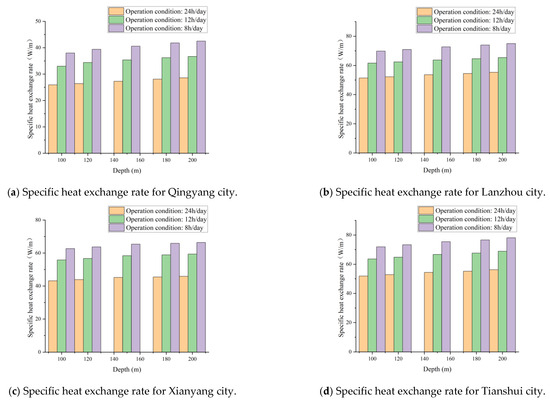
Figure 15.
The determined specific heat exchange rate of BHE with five carrying depths for four typical cities located in Northwest China.
Figure 16 displays the cumulative amount of heat energy extracted over a 25-year period. The results show an obvious trend that the amount of heat energy is larger when the borehole is deeper. Among all the cities, Qingyang city has the lowest performance due to it having the lowest initial ground temperature. These outcomes highlight the importance of borehole depth and geothermal conditions for optimizing long-term thermal performance of GSHP systems.
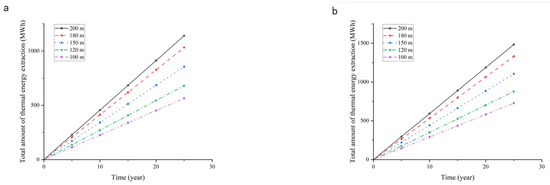
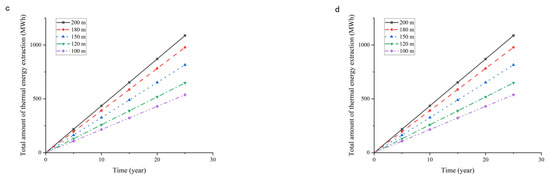
Figure 16.
The estimated total amount of heat energy extracted from the ground for the BHE with varying depths in four cities, taking an example for the BHE operation for 24 h/day. (a) Total amount of heat extraction for Qingyang city over a 25-year period; (b) total amount of heat extraction for Lanzhou city over a 25-year period; (c) total amount of heat extraction for Xianyang city over a 25-year period; (d) total amount of heat extraction for Tianshui city over a 25-year period.
4. Discussion
Both the experiments and numerical simulation indicate a consistent trend: increasing the borehole depth enhances the thermal performance of GSHP systems in cold regions, both in short-term and long-term performance. This enhancement can be attributed to two primary factors. First, the building’s heating load dominates, meaning that more heat is extracted in winter than what is injected in summer. This uneven thermal load leads to a gradual decrease in ground temperature, which reduces the performance of the BHE—a phenomenon that is more pronounced when the initial ground temperature is low. Secondly, the ground temperature increases with depth. A deeper BHE therefore accesses more heat and extracts it more efficiently. Moreover, due to the high ambient temperature at greater depths, the ground temperature tends to recover easily during the intermittent system operation.
Although both the field tests and numerical simulation show similar trends, this study has certain limitations. The numerical model incorporates several simplifications; for instance, the ground is treated as a homogenous medium and the system operation is assumed to be continuous. These simplifications may affect the accuracy of long-term thermal performance predictions for the BHEs, suggesting that the actual system performance should be monitored in future work. Furthermore, the impacts of potential anthropogenic subsurface heat sources/sinks, such as district heating, utilities, or nearby GSHP fields on the thermal performance of the BHE are not considered, due to a lack of field data. This should be a focus of future analyses, as urban infrastructure can significantly alter the shallow geothermal heat flux.
5. Conclusions
This study investigates the thermal sustainability of eight Borehole Heat Exchangers (BHEs) installed in two typical loess areas in Northwestern China. TRTs were conducted to determine the thermal properties of the ground. The short-term performance was analyzed with a focus on pipe configuration and borehole depth. Furthermore, the long-term performance of BHE was evaluated via numerical modeling, considering three borehole depths. The main findings are as follows:
Borehole thermal properties: The thermal response test (TRT) results indicate a clear relationship between depth and thermal performance. Specifically, borehole thermal resistance increases with shallower burial depths of the pipes. Conversely, within the 150-meter depth range, a greater borehole depth leads to a higher energy efficiency coefficient for the Borehole Heat Exchanger (BHE). The effective thermal conductivity of the ground was calculated to be in the range of 1.339–2.389 W/(m·K) at the RTR site and 1.396–1.605 W/(m·K) at the LPR site. The weighted average (λWA), calculated based on strata thickness, shows good agreement with the tested values at the LPR site. In contrast, a significant discrepancy is observed at the RTR site, which is likely attributable to differences in groundwater saturation conditions.
Short-term performance: The specific extractable heat of the Borehole Heat Exchangers (BHEs) ranges from 21.01 W/m to 37.51 W/m at the LPR site, and from 27.48 W/m to 48.43 W/m for the four thermal response tests (TRTs) at the RTR site. This indicates that the average heat transfer rate of the BHEs at the RTR is 28.65% higher than that at the LPR. Furthermore, under identical loess conditions, single-U pipes exhibit higher thermal resistance than double-U pipes. However, the energy efficiency coefficient of the single-U pipe configuration is slightly superior to that of the double-U configuration.
Thermal sustainability of BHEs: The numerical results demonstrate that thermal efficiency increases with borehole depth. Specifically, based on a 10-year simulation for site QY1, a 200 m BHE exhibits an average heat transfer rate that is 18.02% higher than a 150 m BHE and 45.10% higher than a 100 m BHE in cooling mode. In heating mode, the 200 m BHE shows improvements of 10.02% and 36.42% over the 150 m and 100 m BHEs, respectively. Further simulation confirms that increasing the borehole depth significantly enhances the thermal performance of the BHE. Additionally, operational duration and initial ground temperature are two other critical factors determining thermal performance in such cold regions.
This study is mainly based on the TRT data and using numerical modeling to predict the long-term performance of the BHEs. Future work should thus focus on validating these predictions by monitoring the performance of a practical operating system.
Author Contributions
Conceptualization, Z.Y.; methodology, Q.Z.; validation, M.Y.; formal analysis, Q.Z.; resources, J.L.; writing—original draft preparation, Z.Y., Q.Z., M.Y., P.Z. and J.L.; writing—review and editing, P.Z., J.L. and D.C.; visualization, M.Y., P.Z. and D.C.; supervision, D.C.; funding acquisition, Z.Y. All authors have read and agreed to the published version of the manuscript.
Funding
This work was financially supported by the Shanxi Science and Technology Department (No. 202303021211248) and Natural Science Foundation of HuBei Province, PR. China (Joint project) (No. 2023AED197).
Data Availability Statement
The original contributions presented in this study are included in the article. Further inquiries can be directed to the corresponding authors.
Acknowledgments
The authors thank two anonymous reviewers for their constructive comments and valuable suggestions, which greatly improved the quality of this manuscript.
Conflicts of Interest
Author Zezhou Yan was employed by the company Shanxi Geothermal Resources Exploration and Development Technology Co., Ltd. The remaining authors declare that the research was conducted in the absence of any commercial or financial relationships that could be construed as a potential conflict of interest.
References
- Bina, S.M.; Fujii, H.; Kosukegawa, H.; Inagaki, F. A predictive model of long-term performance assessment of ground source heat pump (GSHP) systems in Japanese regions. Geothermics 2024, 119, 102955. [Google Scholar] [CrossRef]
- Kerme, E.D.; Alzahrani, W.S.; Fung, A.S.; Leong, W.H. Experimental investigation of ground-source heat pump system coupled to vertical and horizontal ground loops: A case study. Renew. Energy 2024, 236, 121482. [Google Scholar] [CrossRef]
- Sazon, T.A.; Nikpey, H. Modeling and investigation of the performance of a solar-assisted ground-coupled CO2 heat pump for space and water heating. Appl. Therm. Eng. 2024, 236, 121546. [Google Scholar] [CrossRef]
- You, T.; Wu, W.; Shi, W.; Wang, B.; Li, X. An overview of the problems and solutions of soil thermal imbalance of ground-coupled heat pumps in cold regions. Appl. Energy 2016, 177, 515–536. [Google Scholar] [CrossRef]
- You, T.; Wang, B.; Wu, W.; Shi, W.; Li, X. Performance analysis of hybrid ground-coupled heat pump system with multi-functions. Energy Conv. Manag. 2015, 92, 47–59. [Google Scholar] [CrossRef]
- Qian, H.; Wang, Y. Modeling the interactions between the performance of ground source heat pumps and soil temperature variations. Energy Sustain. Dev. 2014, 23, 115–121. [Google Scholar] [CrossRef]
- Xi, C.; Lin, L.; Hong, X.Y. Long term operation of a solar assisted ground coupled heat pump system for space heating and domestic hot water. Energy Build. 2011, 43, 1835–1844. [Google Scholar] [CrossRef]
- Retkowski, W.; Ziefle, G.; Ming, J.T. Evaluation of different heat extraction strategies for shallow vertical ground-source heat pump systems. Appl. Energy 2015, 149, 259–271. [Google Scholar] [CrossRef]
- Yu, T.; Liu, Z.; Chu, G.; Qu, Y. Influence of Intermittent Operation on Soil Temperature and Energy Storage Duration of Ground-Source Heat Pump System for Residential Building; Springer: Berlin/Heidelberg, Germany, 2013; pp. 203–213. [Google Scholar] [CrossRef]
- Ji, W.J.; You, T.; Bai, S.W.; Yu, L.J.; Shi, W.X.; Wang, B.L. Effects of buried pipe design parameters on performance of ground-source heat pump systems in cold zone. HV AC 2015, 45, 113–118. (In Chinese). Available online: https://caod.oriprobe.com/articles/44095842/Effects_of_buried_pipe_design_parameters_on_performance_of_ground_sour.htm# (accessed on 13 April 2023).
- Liu, T.S. Loess and the Environment; Science Press: Beijing, China, 1985; (In Chinese). Available online: https://CNKI:SUN:DQHX.0.1985-03-006 (accessed on 2 February 2022).
- Durmayaz, A.; Lu, M.K.O.; En, Z. An application of the degree-hours method to estimate the residential heating energy requirement and fuel consumption in istanbul. Energy 2000, 25, 1245–1256. [Google Scholar] [CrossRef]
- JGJ 26-2018; Ministry of Housing and Urban-Rural Development of the People’s Republic of China (MOHURD). Design Standard for Energy Efficiency of Residential Buildings in Severe Cold and Cold Zones. Architecture & Building Press: Beijing, China, 2018.
- Li, Y.; Shi, W.; Aydin, A.; Beroya-Eitner, M.A.; Gao, G. Loess genesis and worldwide distribution. Earth-Sci. Rev. 2020, 201, 102947. [Google Scholar] [CrossRef]
- Fan, B.; Ding, H.W.; Zhang, L.X.; Zhang, L.P.; Zhang, Y.J. Occurrence conditions of shallow geothermal energy and suitability analysis of soil source heat pump system in Lanzhou New District. Arid Land Geogr. 2022, 45, 836–846. (In Chinese). Available online: http://alg.xjegi.com/EN/10.12118/j.issn.1000-6060.2021.355 (accessed on 1 January 2023).
- Zhou, Y.; Zhang, H.; Gui, Z.Q.; Wang, K.; Zhang, Y.G. Study on influencing factors of comprehensive thermal conductivity of rock and soil. Geol. Surv. China 2018, 5, 89–94. (In Chinese) [Google Scholar] [CrossRef]
- Luo, J.; Rohn, J.; Xiang, W.; Bertermann, D.; Blum, P. A review of ground investigations for ground source heat pump (gshp) systems. Energy Build. 2016, 117, 160–175. [Google Scholar] [CrossRef]
- Bina, S.M.; Fujii, H.; Ohira, E.; Kosukegawa, H.; Harada, R. Reliability and variability in thermal conductivity measurements: A comparison of CIT-TRT and conventional TRT in Japan. Geothermics 2025, 131, 103360. [Google Scholar] [CrossRef]
- Jia, J.; Lee, W.L.; Cheng, Y. Constant-temperature thermal response test (TRT) with both heat injection and extraction for ground source heat pump systems: Methodology and a case study. Energy Procedia 2019, 158, 797–802. [Google Scholar] [CrossRef]
- Li, P.; Dou, B.; Guan, P.; Zheng, J.; Tian, H.; Duan, X. Thermophysical and heat transfer characteristics based on thermal response and thermal recovery test of a u-pipe borehole heat exchanger. J. Eng. Thermophys. 2023, 32, 117–137. [Google Scholar] [CrossRef]
- Zhang, Y.; Tao, X.; Chen, M.; Xia, C.; Xie, H.; Chen, F. Study on the transfer performance of ground heat exchangers with different pipes considering layered stratum. J. Acta Energiae Solaris Sin. 2024, 45, 764–770. [Google Scholar] [CrossRef]
- Diersch, H.J.G.; Bauer, D.; Heidemann, W.; Rühaak, W.; Schätzl, P. Finite element formulation for borehole heat exchangers in modeling geothermal heating systems by FEFLOW. WASY Softw. FEFLOW White Pap. 2010, 5, 5–96. Available online: https://www.researchgate.net/publication/284229971_Finite_element_formulation_for_borehole_heat_exchangers_in_modeling_geothermal_heating_systems_by_FEFLOW (accessed on 5 February 2024).
- Brettschneider, A.L.; Perkovi, L. Theoretical analysis of using multiple borehole heat exchangers for production of heating and cooling energy in shallow geothermal reservoirs with underground water flow. Appl. Therm. Eng. 2024, 254, 123914. [Google Scholar] [CrossRef]
- Diersch, H.J.G.; Bauer, D.; Heidemann, W.; Rühaak, W.; Tzl, P.S. Finite element modeling of borehole heat exchanger systems. Comput. Geosci. 2011, 37, 1122–1135. [Google Scholar] [CrossRef]
- Diersch, H.J.G. Discrete feature modeling of flow, mass and heat transport processes by using FEFLOW. White Pap. 2002, 1, 147–190. [Google Scholar] [CrossRef]
- Wagner, V.; Bayer, P.; Kübert, M.; Blum, P. Numerical sensitivity study of thermal response tests. Renew. Energy 2012, 41, 245–253. [Google Scholar] [CrossRef]
- Ye, W.J.; Dong, X.H.; Yang, G.S.; Chen, Q.; Peng, R.; Liu, K. Effect of moisture content and dry density on thermal parameters of loess. Rock Soil Mech. 2017, 38, 656–662. [Google Scholar] [CrossRef]
- Jia, D.; Wen, J.; Zhang, T.; Xi, J. Responses of soil moisture and thermal conductivity to precipitation in the mesa of the loess plateau. Environ. Earth Sci. 2016, 75, 395. [Google Scholar] [CrossRef]
- Wagner, V.; Blum, P.; Kübert, M.; Bayer, P. Analytical approach to groundwater-influenced thermal response tests of grouted borehole heat exchangers. Geothermics 2013, 46, 22–31. [Google Scholar] [CrossRef]
- Zeng, S.; Yan, Z.; Yang, J. Estimation of soil and grout thermal properties for energy piles: A new parameter estimation method. Iop Conf. Ser. Earth Environ. Sci. 2021, 861, 72124. [Google Scholar] [CrossRef]


Disclaimer/Publisher’s Note: The statements, opinions and data contained in all publications are solely those of the individual author(s) and contributor(s) and not of MDPI and/or the editor(s). MDPI and/or the editor(s) disclaim responsibility for any injury to people or property resulting from any ideas, methods, instructions or products referred to in the content. |
© 2025 by the authors. Licensee MDPI, Basel, Switzerland. This article is an open access article distributed under the terms and conditions of the Creative Commons Attribution (CC BY) license (https://creativecommons.org/licenses/by/4.0/).