Article

User Comfort Evaluation in a Nearly Zero-Energy Housing Complex in Poland: Indoor and Outdoor Analysis

by
Małgorzata Fedorczak-Cisak
1,
Elżbieta Radziszewska-Zielina
1,*,
Mirosław Dechnik
1,*,
Aleksandra Buda-Chowaniec
2,
Beata Sadowska
3,
Michał Ciuła
1 and
Tomasz Kapecki
4
1
Faculty of Civil Engineering, Cracow University of Technology, Warszawska 24, 31-155 Cracow, Poland
2
Faculty of Civil Engineering, CUT Doctoral School, Cracow University of Technology, Warszawska 24, 31-155 Cracow, Poland
3
Faculty of Civil Engineering and Environmental Sciences, Bialystok University of Technology, Wiejska Street 45E, 15-351 Bialystok, Poland
4
Faculty of Architecture, Cracow University of Technology, Warszawska 24, 31-155 Cracow, Poland
*
Authors to whom correspondence should be addressed.
Energies 2025, 18(19), 5209; https://doi.org/10.3390/en18195209
Submission received: 21 August 2025 / Revised: 24 September 2025 / Accepted: 28 September 2025 / Published: 30 September 2025

Abstract

The building sector plays a key role in the transition toward climate neutrality, with national regulations across the EU requiring the construction of nearly zero-energy buildings (nZEBs). However, while energy performance has been extensively studied, less attention has been given to the problem of ensuring user comfort—both indoors and in the surrounding outdoor areas—under nZEB design constraints. This gap raises two key research objectives: (1) to evaluate whether a well-designed nZEB with extensive glazing maintains acceptable indoor thermal comfort and (2) to assess whether residents experience greater outdoor thermal comfort and satisfaction in small, sun-exposed private gardens or in larger, shaded communal green spaces. To address these objectives, a newly built residential estate near Kraków (Poland) was analyzed. The investigation included simulation-based assessments during the design phase and in situ measurements during building operation, complemented by a user survey on spatial preferences. Indoor comfort was evaluated for rooms with large glazed façades, as well as rooms with standard-sized windows, while outdoor comfort was assessed in both private gardens and a shared green courtyard. Results show that shading the southwest-oriented glazed façade with an overhanging terrace provided slightly lower temperatures in ground-floor rooms compared to rooms with standard unshaded windows. Outdoors, users experienced lower thermal comfort in small, unshaded gardens than in the larger, vegetated communal area (pocket park), which demonstrated greater capacity for temperature moderation and thermal stress reduction. Survey responses further indicate that potential future residents prefer the inclusion of a shared green–blue infrastructure area, even at the expense of building some housing units in semi-detached form, instead of maximizing the number of detached units with unshaded individual gardens. These findings emphasize the importance of addressing both indoor and outdoor comfort in residential nZEB design, showing that technological efficiency must be complemented by user-centered design strategies. This integrated approach can improve the well-being of residents while supporting climate change adaptation in the built environment.

1. Introduction

Since 2021, newly designed buildings in Poland must meet the standard of nearly zero-energy buildings (nZEBs) [1]. This involves the design and construction of buildings that are very well insulated and have very low energy consumption, most of which comes from renewable energy sources. However, there are a few standard requirements regarding the user comfort of such buildings, even though it directly affects the health and well-being of the occupants. Therefore, user comfort should be considered a design and construction criterion on the same level of importance as minimizing energy consumption and striving for the lowest possible carbon footprint of buildings [2]. User comfort should not be considered only in terms of staying inside the building. Equally important is the comfort in the building’s surroundings [3,4]. Especially with the changing climate, rising temperatures, and increased solar exposure, it is important that the building’s surroundings provide optimal conditions for people. Such conditions can be ensured through appropriately designed blue–green infrastructure around the building. In the case of individual buildings, greenery can be shaped freely; however, in the case of residential complexes offered by developers, the freedom to shape greenery may be limited. Recently, housing estate construction has clearly increased in Poland, although Statistics Poland (GUS) does not report their exact number. GUS does, however, report the number of dwellings: at the end of May 2025, around 853,000 were under construction. This corresponds to at least several thousand estates being developed simultaneously. A typical estate usually includes several hundred dwellings [5], although some may consist of only a few dozen. Thus, it can be assumed that several thousand residential complexes are currently under development in Poland, confirming a clear upward trend in recent years.
The proper functioning of a residential complex consisting of multi-family buildings depends on a balanced approach to many aspects of future living for the owners of individual units. Today, this includes good accessibility, sufficient parking, and the increasingly valued comfort of social life provided by well-designed public spaces within the residential complex [6,7]. The Polish term patodeweloperka (literally “patho-developing”) has become synonymous with the type of housing currently being built and offered on the Polish housing market, mainly in urban developments. It refers to substandard, profit-driven residential projects that prioritize maximum density and developer profit over user comfort, functionality, and quality of life. Public space and communal areas, increasingly expected by future residents, are still losing out to another indicator that determines the profitability of construction: the amount of Usable Floor Area (UFA), which represents the total area of all rooms in an apartment or building intended for residential use. This remains the simplest measure for estimating future profits [8,9]. The worst period of Polish multi-family housing, when only the UFA was prioritized, ended with the 2007 financial crisis. The construction boom of those years has gone down in history, and for sociologists, the only reminder of that era is a developer placing one or two benches along the path to the next building, intended to serve as the supposed seed of a future communal space.
Over the past several years, the awareness of people investing in new apartments has changed significantly. Expectations have emerged not only regarding functional and attractive architecture but also concerning the surroundings of these buildings—spaces that we increasingly want to use: green public areas that serve not only for social integration but also as safe spaces for the youngest residents. Such areas also provide protection against excessive heat, thanks to appropriately designed greenery [10,11]. Such requirements have become the norm for the rapidly developing suburban residential developments, where these spaces partly “compensate” for the social life available in urban housing. At the same time, they offer significantly more daylight in living spaces, better ventilation of the entire building complex, and consequently, better air quality—which, for the residents of Kraków (southern Poland), is an especially important consideration [12,13]. Sustainable development is the need of the moment, and the well-being of residents matters—not only the comfort of living ensured by heat transfer coefficients of walls, floors, and roofs but also the awareness of having green, publicly accessible surroundings; the use of rainwater through retention; electricity partially generated from photovoltaic panels; or heating sourced from the earth’s interior via heat pumps. This is why, today, numerous industry awards for this type of construction come as no surprise, as it clearly represents a meaningful contribution to environmental protection.
Figure 1 presents the basic design criteria for nearly zero-energy and climate-neutral housing estates in the context of analyses performed at the design stage and in situ measurements during the operational stage. This article focuses on criterion no. 3, which addresses user comfort. This criterion provides a reference point linking the other two: achieving the nZEB standard (criterion 1) and climate neutrality (criterion 2) must be pursued in a way that safeguards thermal comfort. Accordingly, two research questions were posed: (1) Can a well-designed nZEB with extensive glazing maintain acceptable indoor thermal comfort? (2) Do residents experience greater outdoor thermal comfort and satisfaction in small, sun-exposed private gardens or in larger, shaded communal green spaces? To answer these questions, indoor comfort was evaluated for rooms with large glazed façades, as well as rooms with standard-sized windows, while outdoor comfort was assessed in both private gardens and a shared green courtyard. To optimize user comfort, analyses should be performed already at the design stage, while at the post-construction stage, in situ studies are necessary. Following this approach, the adopted methodology for a newly built housing estate near Kraków included simulation-based assessments at the design stage and in situ measurements conducted over a 14-day period in late spring, evaluating comfort both indoors and in the surrounding outdoor areas. Specialized simulation tools and microclimate sensor kits were used accordingly. In addition, the in situ results were compared with survey data on spatial preferences collected from potential future residents of the estate.
In recent years, microclimatic simulations using the ENVI-met model have become a common tool for assessing the impact of urban layout and greenery on thermal comfort in urban spaces. Guergour et al. conducted research in Guelma (Algeria), indicating that modifications to building morphology can significantly improve thermal conditions in open spaces [14]. Similar conclusions were presented by Yılmaz et al., who demonstrated that appropriate landscape design scenarios, modeled in ENVI-met, can reduce the thermal stress experienced by pedestrians in densely built-up urban areas [15].
The study by Xiang et al. was conducted in the context of the relationship between urban form and microclimate, using a district of Seoul as a case study. The application of the ENVI-met model enabled the authors to identify specific urban forms that support the retention of coolness on hot days [16]. Similar observations were presented by Elshabshiri et al., who analyzed the impact of greenery on campus spaces in a hot and humid climate—the results confirmed the high effectiveness of tree cover in improving thermal comfort [17]. Furthermore, Tsoka et al. conducted a literature review assessing the accuracy of the ENVI-met model in urban simulations and highlighted its usefulness in analyzing the application of cool surfaces and urban greenery as tools for mitigating heat stress [18]. The comparison of thermal comfort across different types of residential spaces, such as private gardens and publicly accessible green areas, represents an important direction in contemporary microclimatic research. Analyses of this kind make it possible to better understand how spatial structure and the presence of greenery influence residents’ quality of life in the context of changing climatic conditions. All of the cited studies confirm the effectiveness of microclimate modeling—particularly through tools such as ENVI-met—as a valuable support in urban design focused on climate change adaptation and the improvement of thermal conditions for space users. The literature demonstrates that urban greenery—especially trees and extensive biologically active areas—plays a key role in mitigating heat stress in urbanized environments. Guergour et al. [14] indicated that changes in building structure and the introduction of greenery have a significant impact on reducing heat stress in densely built housing estates. Similarly, Xiang et al. [16] confirmed that open spaces—such as urban parks—exhibit more favorable microclimatic parameters compared to compact residential developments.
In the context of studies on local recreational spaces, Qin and Zhou [19] demonstrated that an appropriate selection of vegetation structure at the neighborhood scale allows for effective regulation of thermal conditions both in summer and in winter. Equally important are the studies by Yılmaz et al. [15], who analyzed the impact of different urban street design variants on pedestrian thermal comfort, demonstrating that even minor changes in vegetation type and the degree of shading have a significant effect on PET (physiological equivalent temperature) levels.
These studies highlight the relevance of conducting detailed comparative analyses for different forms of land use, such as private gardens and publicly accessible green spaces. The present study focuses precisely on this relationship, analyzing variations in thermal comfort based on ENVI-met model simulations.
In addition to outdoor comfort, recent studies have highlighted the importance of shading strategies in maintaining acceptable indoor thermal conditions in buildings with extensive glazing. Zukowski [20] showed that in a hybrid single-family building with large glazed areas, combining advanced glazing types with external shading devices significantly improved PMV (Predicted Mean Vote) and PPD (Predicted Percentage of Dissatisfied) values while reducing cooling demand. Chen et al. [21] conducted a theoretical analysis of solar gains in buildings with glass curtain walls. They found that intense solar exposure through large façades increased mean radiant temperature and shifted PMV toward “warm/hot” sensations, even in air-conditioned spaces. Their results also demonstrated that interior shading can reduce radiant heat gain, improving comfort and contributing to measurable energy savings. Long-term monitoring of a passive single-family house near Warsaw [22] further confirmed that indoor comfort in highly glazed spaces requires careful management of shading and ventilation throughout the year. Together, these findings emphasize that shading is a key design factor in nZEBs, both for thermal comfort optimization and for reducing energy use.
In summary, the designer should ensure not only the appropriate selection of technologies and finishes so that the building meets nZEB standards [23] and achieves the highest possible level of zero emissions [24] but also that the indoor user comfort is optimized [25]. Additionally, when designing building complexes, the designer must also ensure outdoor comfort, so that users spending time outside are not exposed to excessively high temperatures in summer. If, due to the built environment, it is not possible to provide adequate sun protection—for example, by planting trees in small private gardens—it is necessary to ensure the presence of a shared green area, such as a mini-park, where residents can also have the opportunity to socialize.

2. Materials and Methods

2.1. Case Study: The Residential Complex “Estate Amidst Greenery” near Kraków, Poland

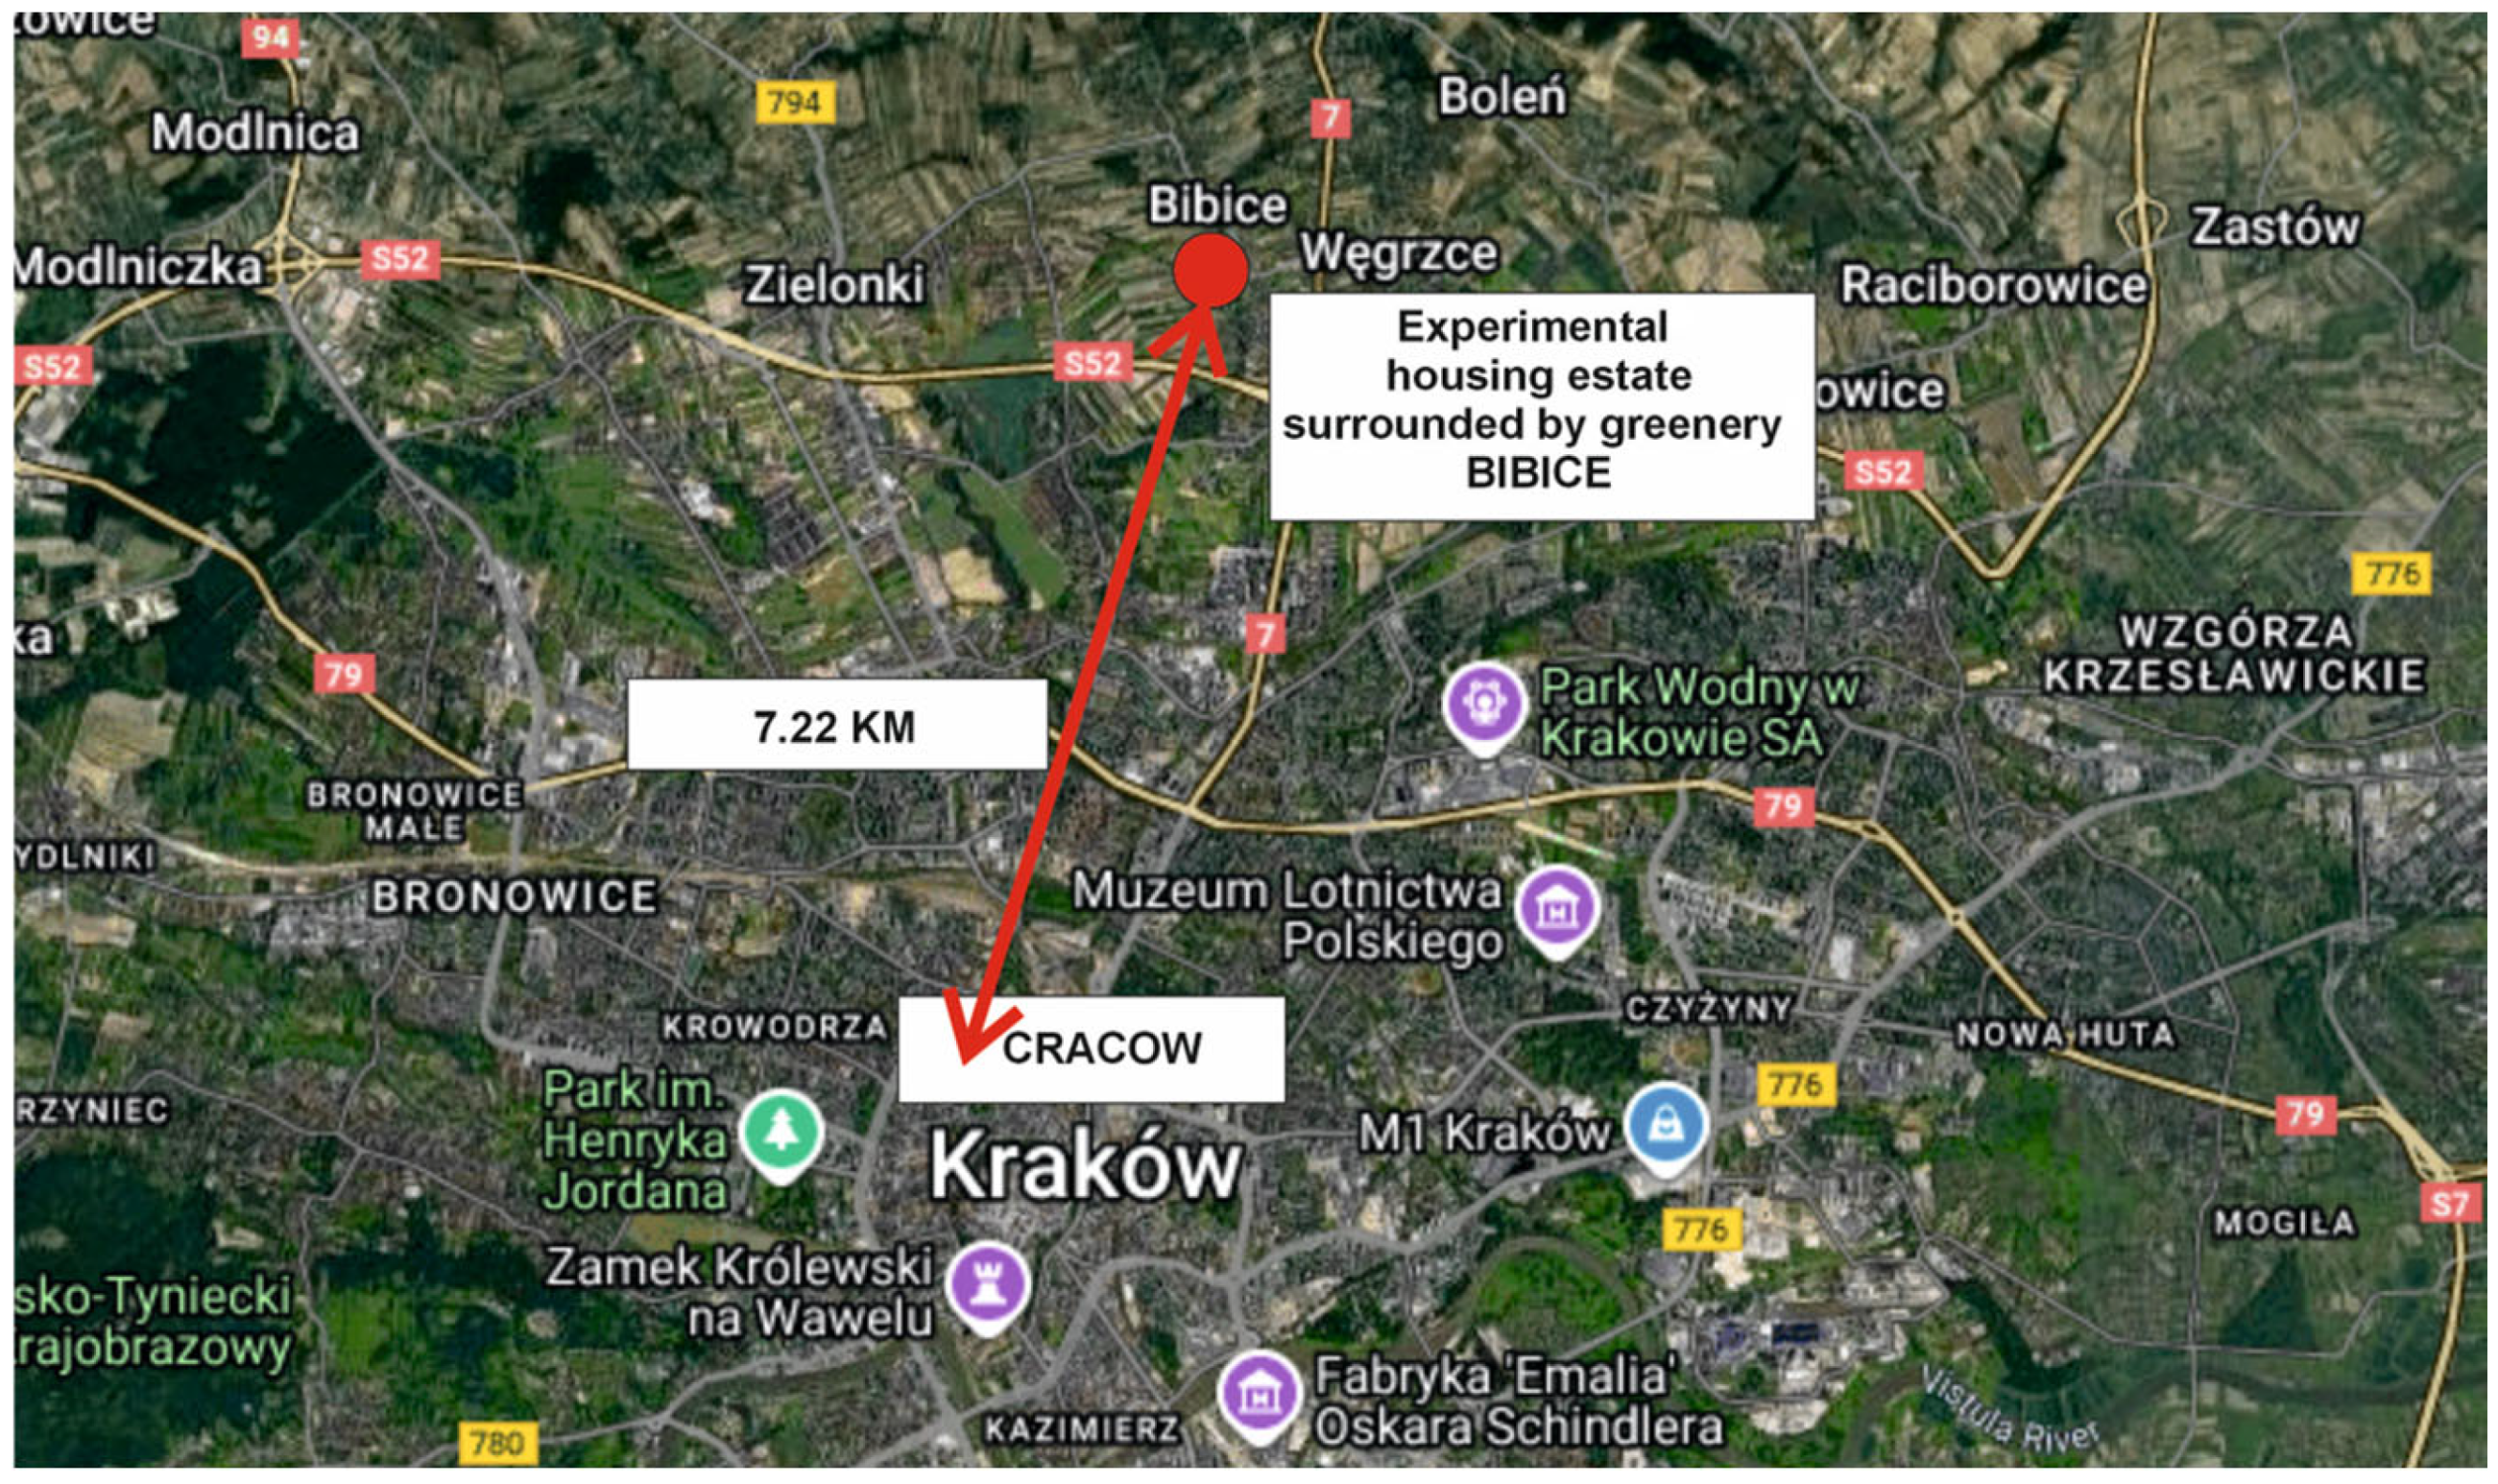
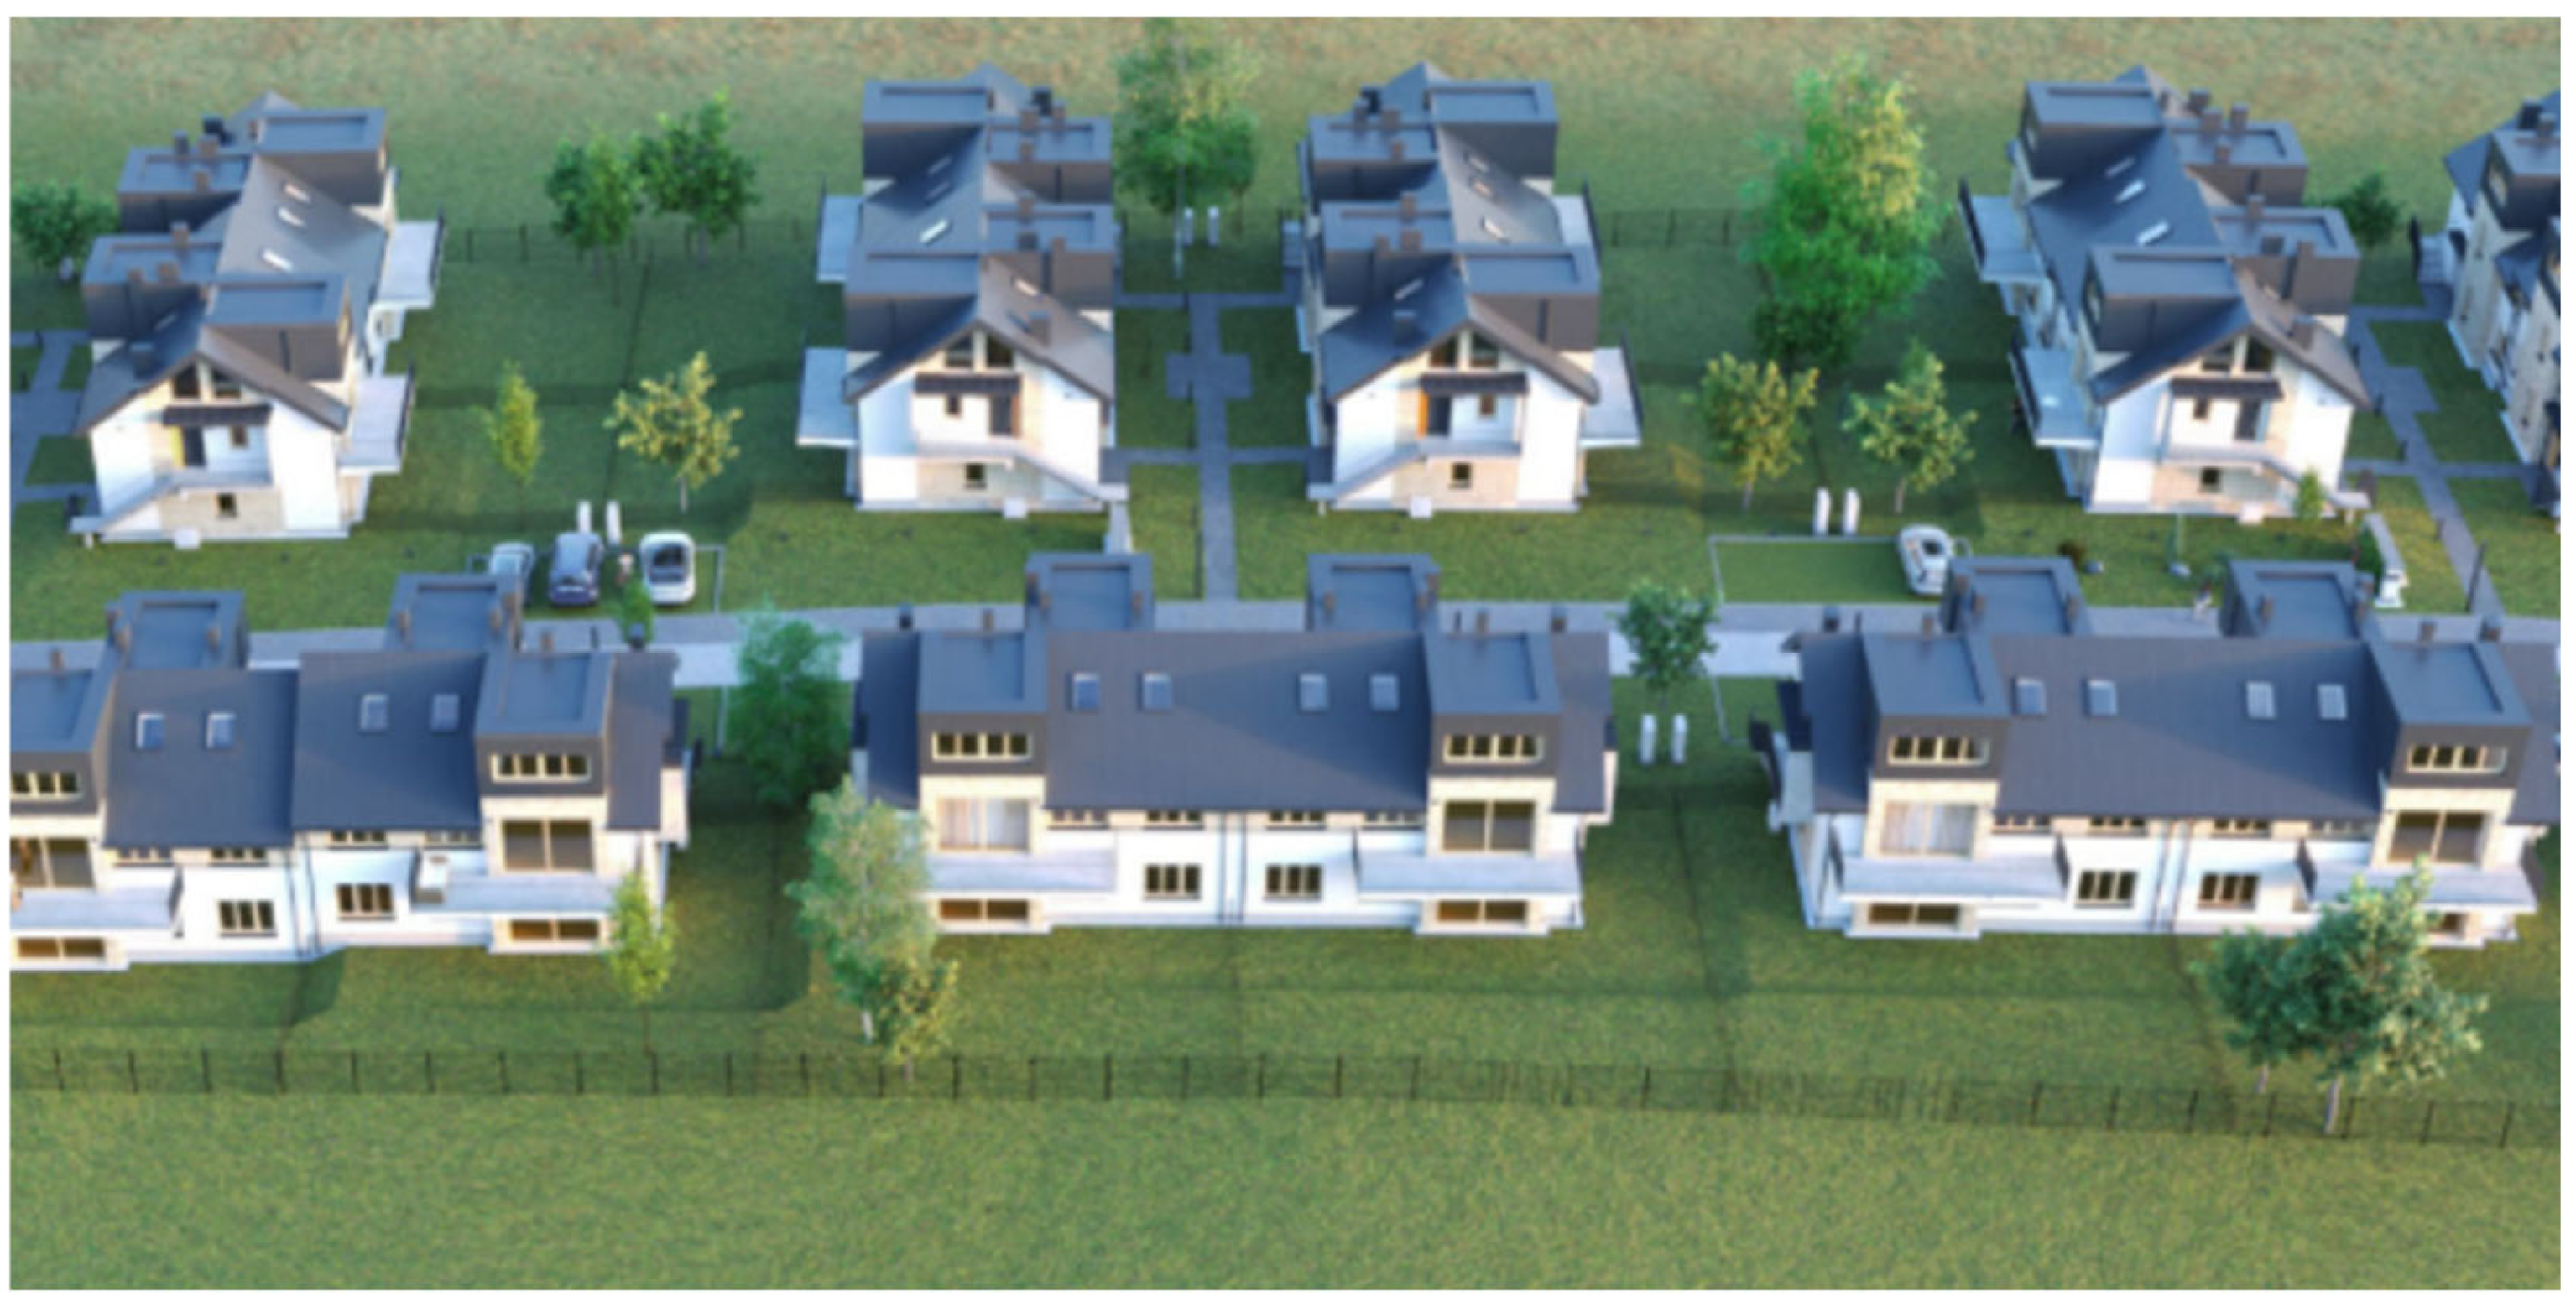
The subject of the analysis is a complex of single-family residential buildings located in Bibice (50°7′ N; 19°57′ E) near Kraków in southern Poland. The location of the estate is shown in Figure 2. The estate is planned to consist of 44 housing units. An illustrative visualization of the terraced housing is presented in Figure 3.
The basic building has a compact and simple form with a rectangular footprint of 11.99 m × 9.50 m. The roof allows for the installation of PV panels. The building height does not exceed 9 m. The buildings are designed as residential with two units: one comprising the ground floor rooms and the other comprising the first floor and attic rooms. The ground-floor apartment has an area of approx. 93 m2 with an adjacent garden ranging from approx. 118 m2 to 226 m2. The two-storey apartment on the upper floors has an area of approx. 137 m2 and an adjoining balcony of approx. 14 m2. Such a large balcony/terrace was added after consultations with a team of experts. Firstly, it enhanced the outdoor leisure space for the residents of the first-floor apartment, despite the absence of a garden. Secondly, the terrace serves as an excellent shading element for the room with large glass façades on the ground floor, thus preventing overheating in the summer and increasing user comfort. Figure 4 presents the ground floor plan of the analyzed building, with points A and B marking the locations of indoor thermal comfort measurements.
The buildings are designed in the nZEB standard. The energy performance parameters of the building, confirming compliance with the Polish nZEB standard, are presented in Table 1.
The buildings are equipped with internal installations: water and sewage, central heating and gas (for boilers), electrical, and mechanical ventilation with heat recovery. In addition, as a second and at the same time main heat source, an air-to-water heat pump was applied, together with a PV installation placed on the building’s roof. Table 2 presents the indicators of non-renewable primary energy (EP) for heating and ventilation (EPH+W), cooling (ΔEPC), and lighting (ΔEPL). The buildings are not equipped with a cooling system; therefore, ΔEPC = 0.00 [kWh/(m2·year)]. According to the Polish methodology for single-family residential buildings, the non-renewable primary energy addition for lighting is assumed as ΔEPL = 0.00 [kWh/(m2·year)]. The energy performance parameters of the analyzed buildings, as shown in Table 1 and Table 2, make it possible to classify the buildings as nearly zero-energy buildings (nZEBs) in accordance with Polish requirements.
As demonstrated in the introduction, in addition to the criteria of minimizing energy consumption and achieving climate neutrality, user comfort is equally important. For users, it is often the overriding concern. User comfort includes thermal, acoustic, and lighting comfort, as well as air quality [27]. In this article, the authors focused solely on thermal comfort, both at the building scale and in the outdoor area.

2.2. Survey Method

Survey studies are used in the literature on residential construction to demonstrate the preferences of stakeholders and, consequently, based on the obtained results, support decision-making in the design and implementation of residential estates, particularly in the context of user comfort. As mentioned in the introduction, an important aspect at the housing estate scale is ensuring outdoor comfort for users, so that while spending their free time outside, they are not exposed to thermal stress. A line chart showing changes in the annual average temperature in Poland between 2015 and 2024 is presented in Figure 5. A clear upward trend can be observed—the temperature increased by about 1.2 °C over this decade, indicating ongoing climate warming in our region [28,29].
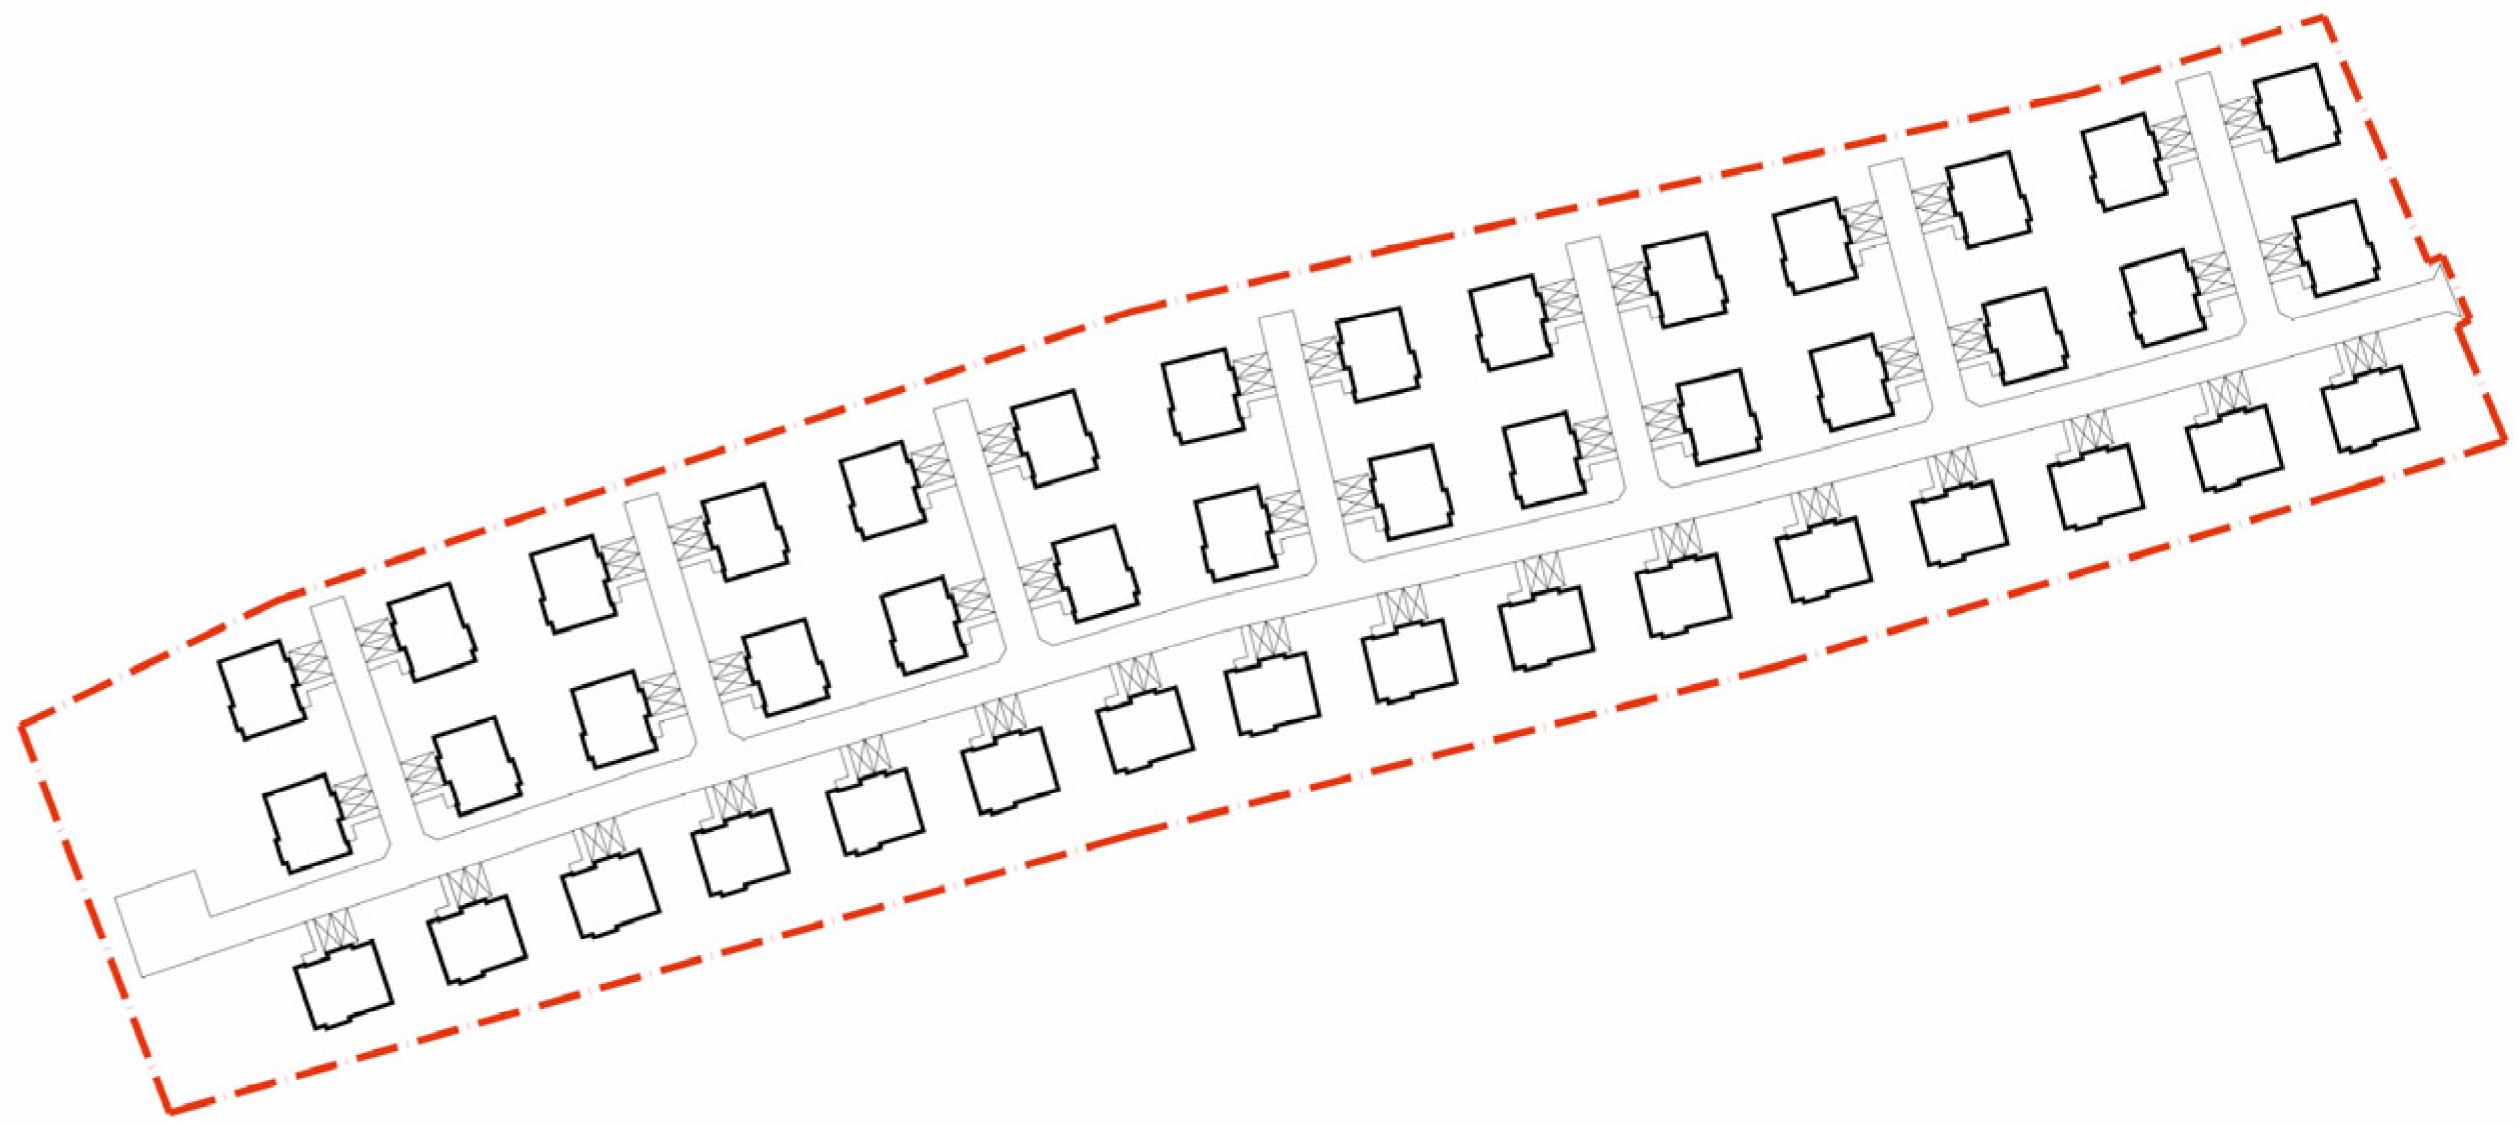
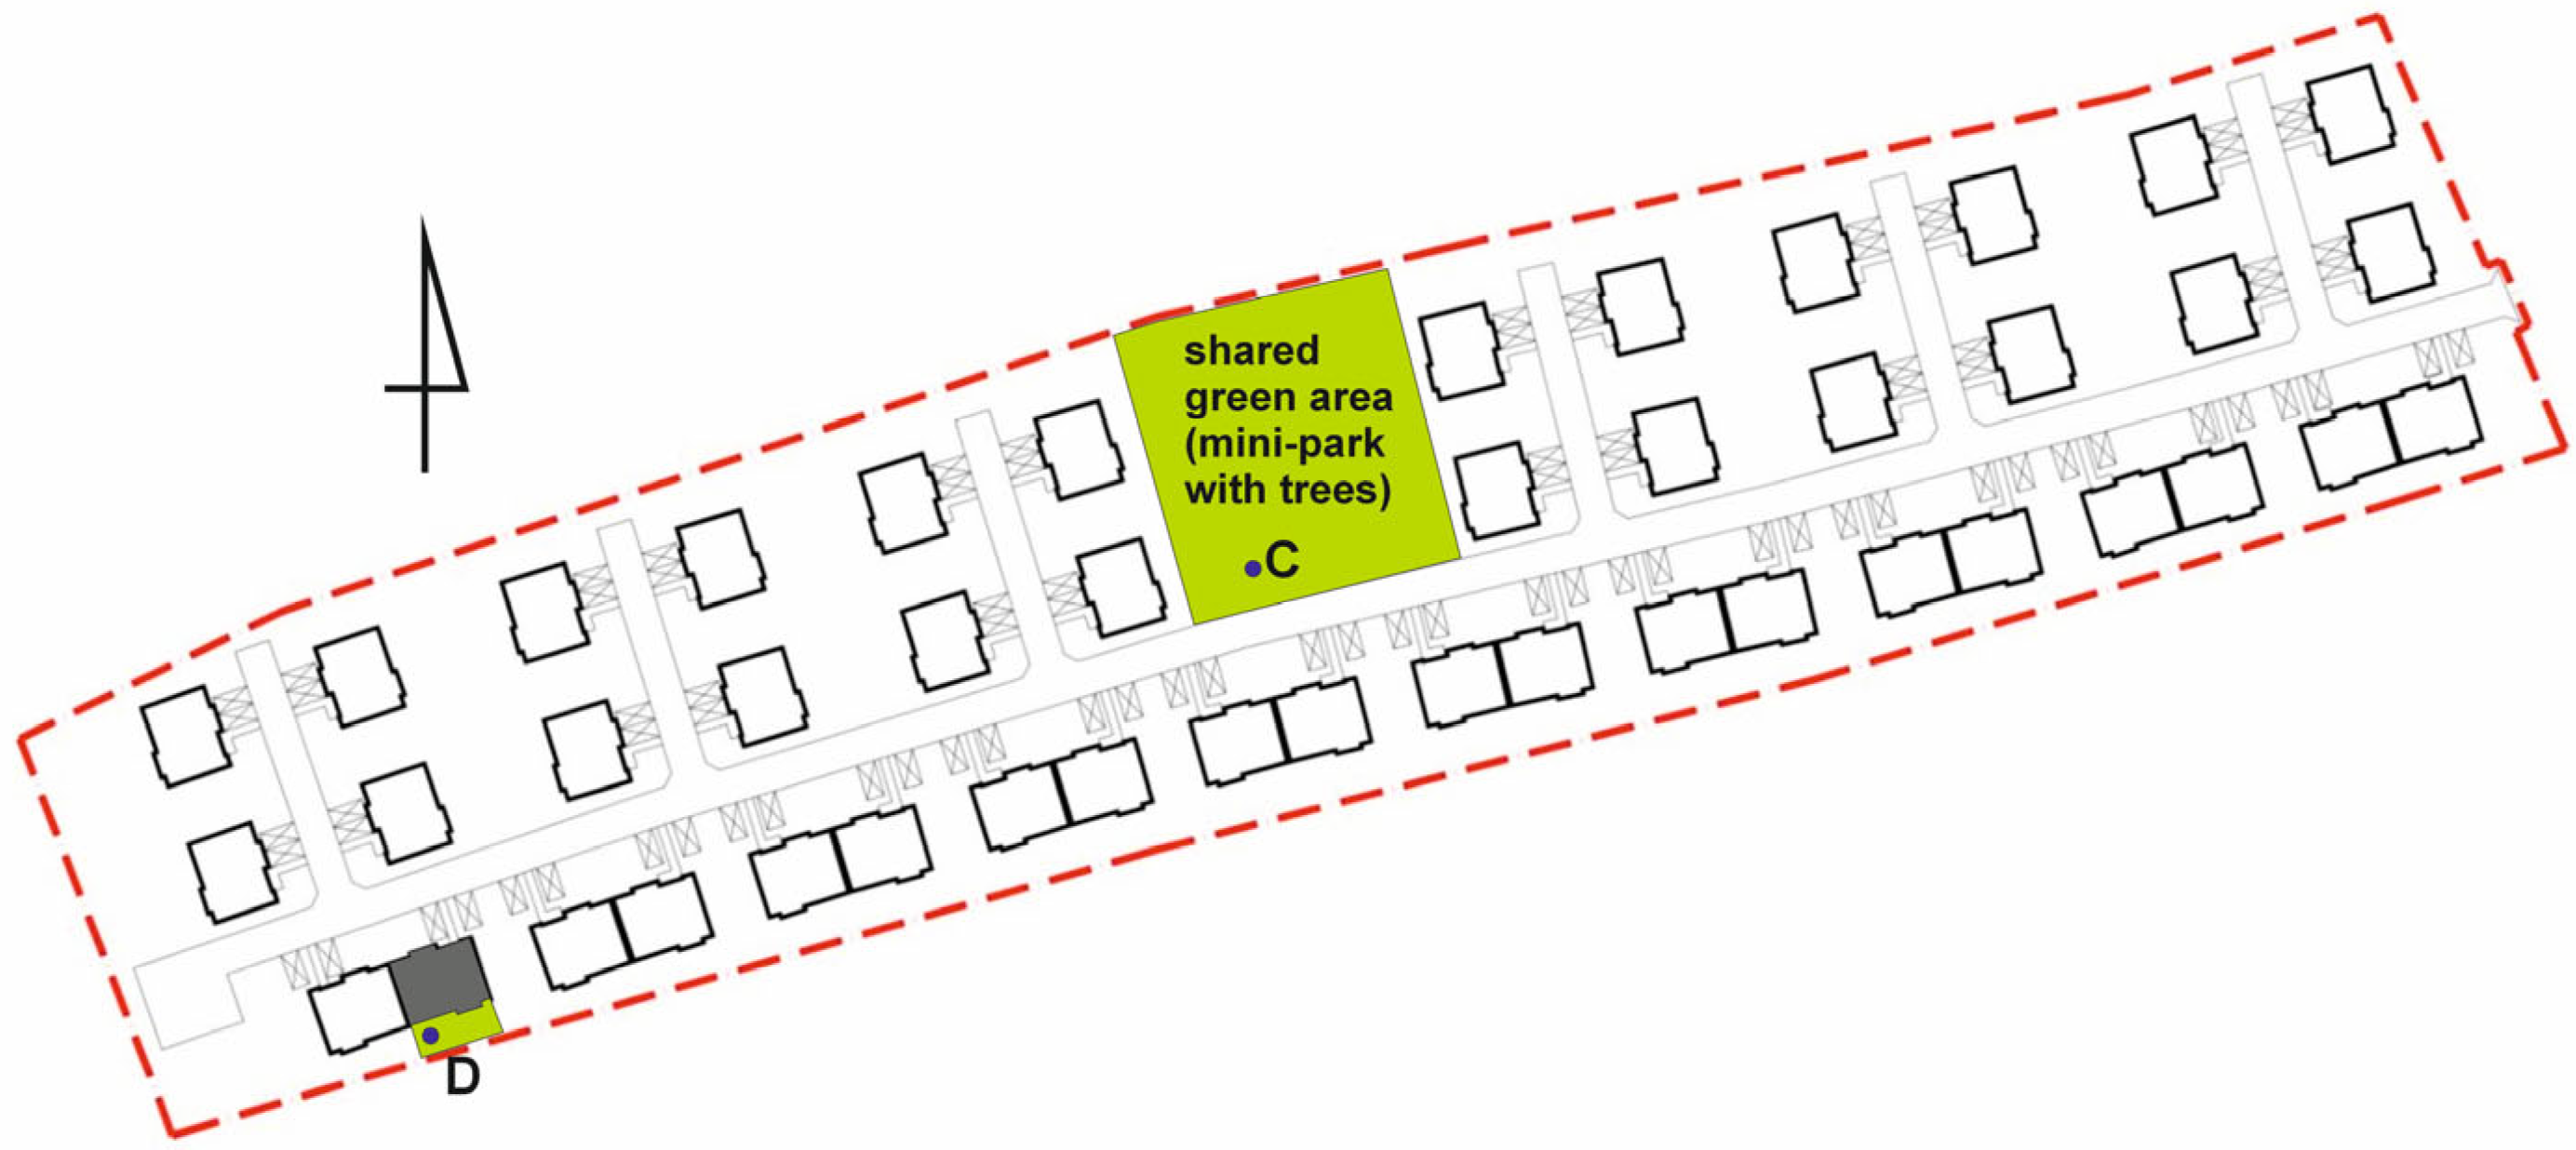
Designing residential estates is a complex process that combines architecture, urban planning, and infrastructure. Particularly important for residents’ comfort—especially in the building surroundings on hot sunny days—is appropriately designed blue–green infrastructure. The authors conducted a survey among 85 potential future residents of the housing estate (n = 85). The respondents were individuals residing in Kraków and its surroundings who had previously contacted the developer and expressed preliminary interest in purchasing an apartment in this estate. Participation was voluntary, with no payment or benefits provided. Respondents were informed about the study’s assumptions and gave their informed consent to take part. The first question asked whether they would prefer to spend their free time in a very small unshaded private garden or in a shared green area of the estate, designed, for example, as a mini-park with a playground, water feature, etc. The second question compared two development layouts. The first type lacked any shared green area, while the second had a slightly different layout, where, in order to provide space for a green communal zone, part of the buildings was designed as semi-detached housing. In layout A, each respondent would have the possibility of living in a separate building, but there would be no shared green space—residents could only rely on small unshaded private gardens (118–226 m2). Proposal B requires some respondents to live in semi-detached housing; however, this solution, in addition to small private gardens, offers a spacious shared green area. The proposals are shown in Figure 6 and Figure 7. The survey should be regarded as a pilot, exploratory study with an indicative character. It was conducted on a purposive (non-probabilistic) sample.

2.3. Indoor Thermal Comfort (Building Scale)

2.3.1. Design Stage (Building Scale)

For individual buildings, the analyses were carried out using the specialized simulation software DesignBuilder (version 7.0.2.006) over a 14-day period in late spring, from 30 May to 13 June 2025. Weather data with a 10-min time step obtained from the Kraków-Balice weather station (50°4′ N, 19°47′ E) were used for PMV/PPD calculations. This station, located approximately 15 km from the study area in Bibice, served as the closest source of reference meteorological data for the simulations. Such analyses make it possible, already at the design stage, to avoid design errors that negatively affect users’ thermal perception, such as overheating of rooms, which is harmful to the health and well-being of occupants.
The basic indicator of thermal comfort is PMV—the Predicted Mean Vote, a statistical index of thermal sensation. The PMV index predicts the average rating of a large group of people describing their thermal sensations on a seven-point scale, as shown in Table 3.
To determine PMV, the following are required: estimated human physical activity (metabolic heat production), thermal resistance of clothing, and the following environmental parameters: air temperature, mean radiant temperature, air velocity, and partial water vapor pressure. The PMV index is based on the thermal balance of the human body. It is recommended that the PMV value remain within the range: −0.5 < PMV < +0.5.
Alongside the PMV index, a more comprehensive indicator—Predicted Percentage of Dissatisfied (PPD)—is introduced, which represents the percentage of people who find the assessed thermal environment clearly unacceptable [30,31].
Main assumptions related to modeling the building and indoor environment in DesignBuilder software are as follows:
  • The occupancy/internal load schedules and activity adopted were those that occurred during the tests conducted during the operational stage (described below in Section 2.3.2);
  • The set air temperature during heating was 20 °C, while the cooling process started when the air temperature exceeded 26 °C; since these setpoints were not reached during the analyzed period, this setting effectively reflected the heating and cooling systems being switched off in the actual building;
  • Mechanical ventilation with heat recovery, with an efficiency of 0.7;
  • Ventilation rates were quantified as equal to 0.5 air change rates (ACH), and infiltration rate 0.6 ACH;
  • Glazing/shading control was not included to reflect the building’s operational stage.

2.3.2. Operational Stage (Building Scale)

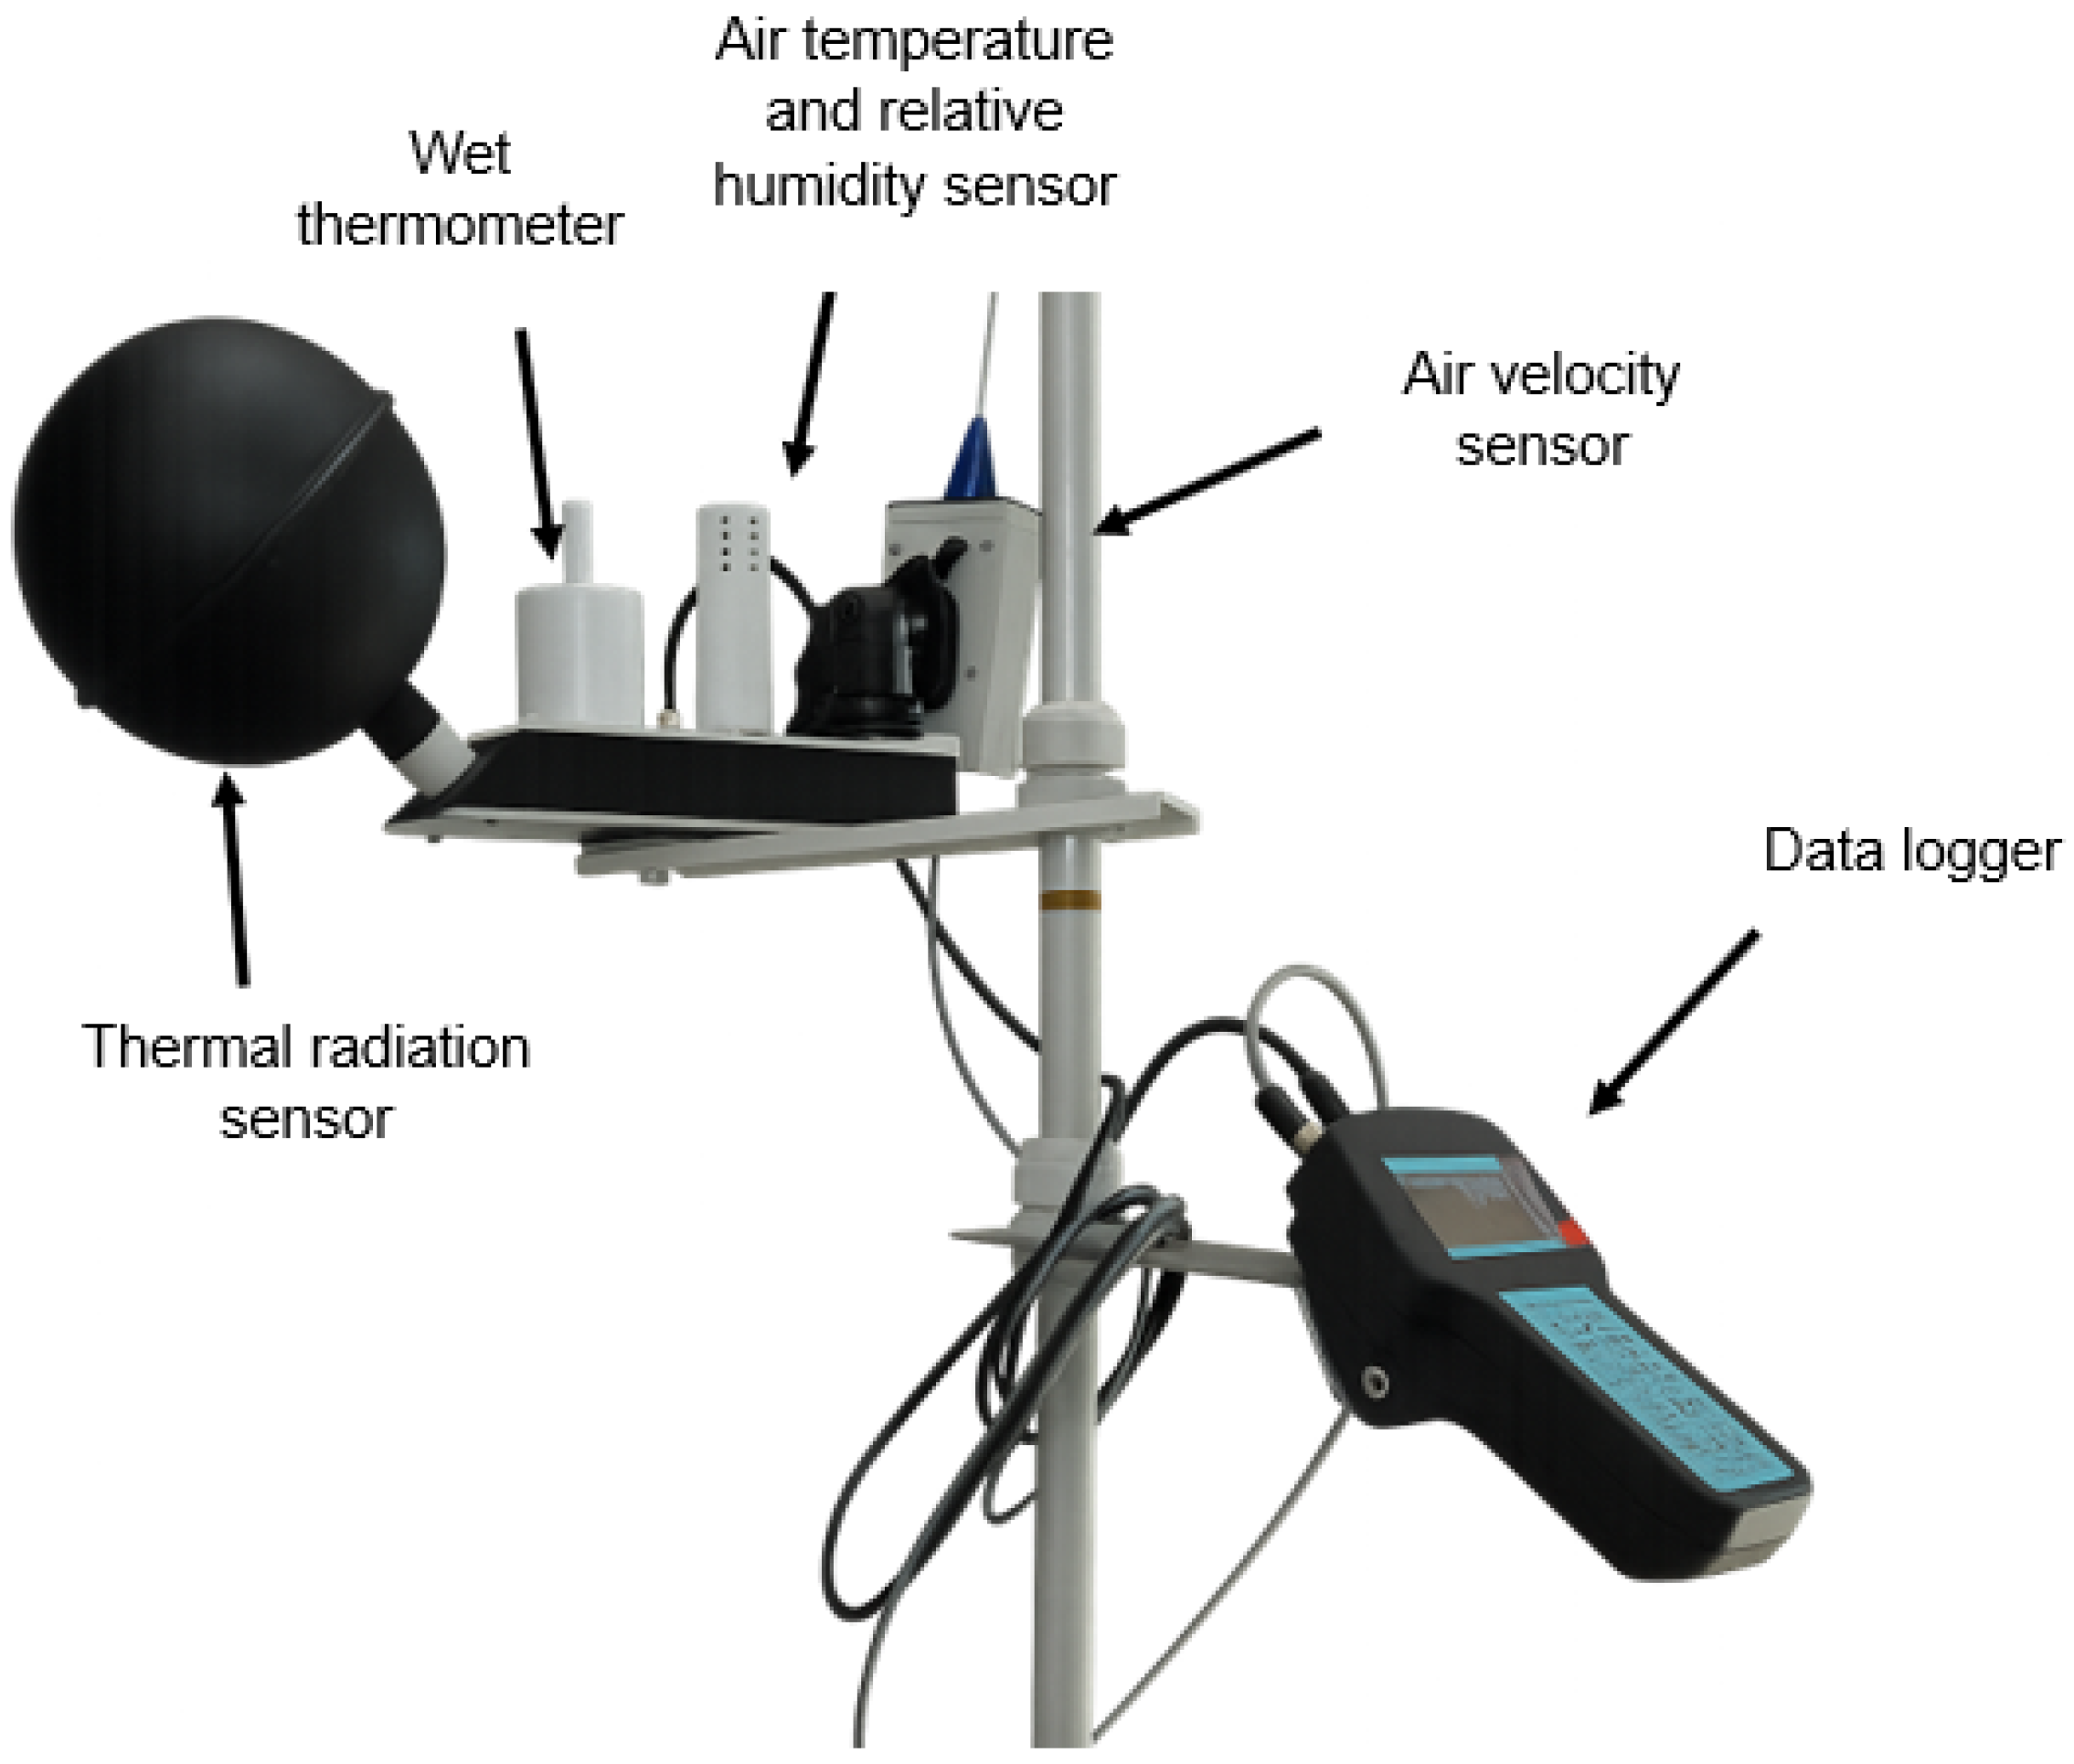
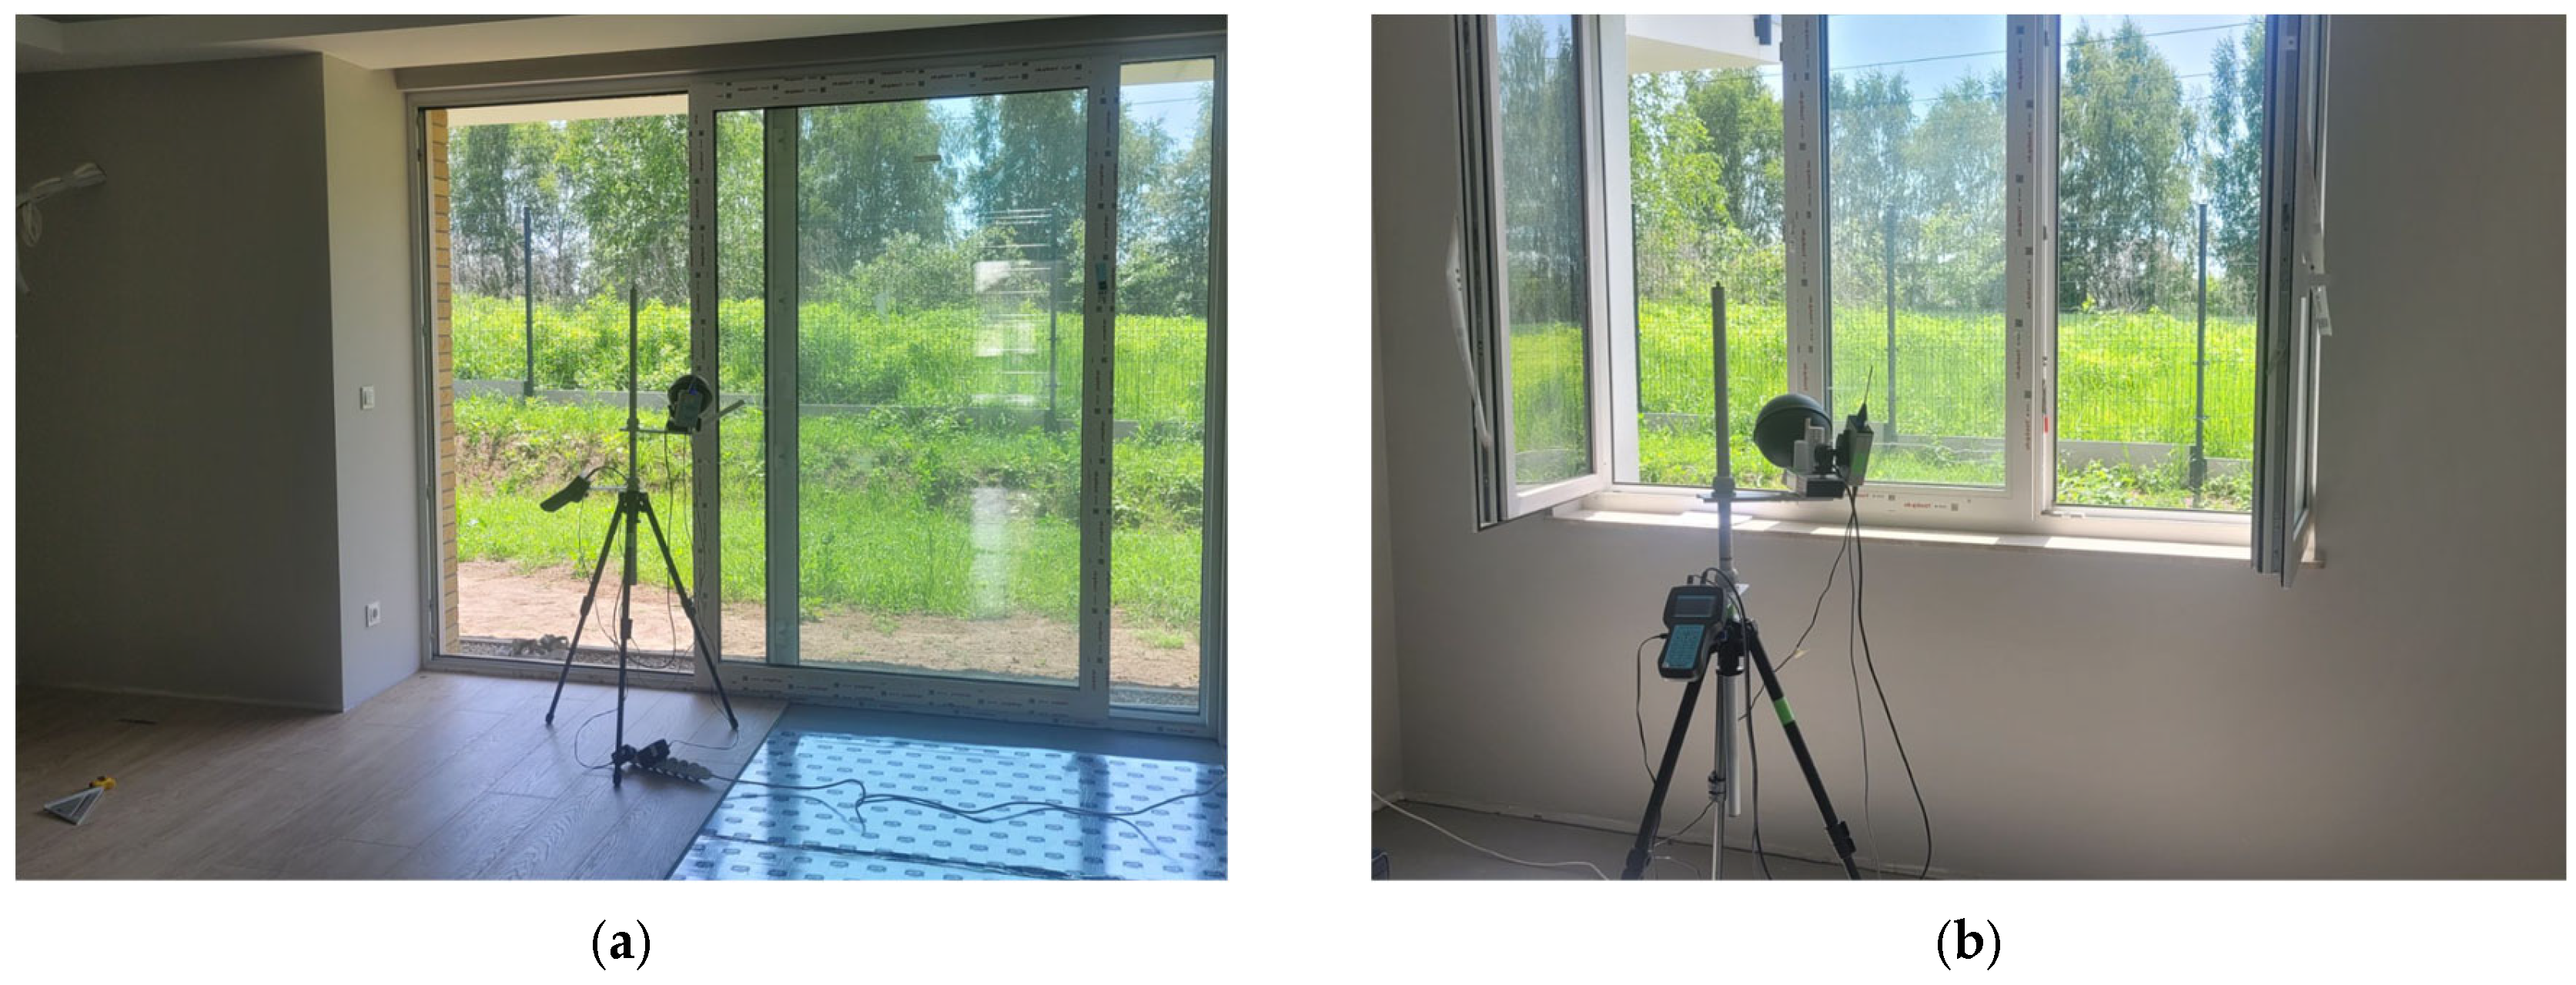
Based on in situ measurements, the microclimate of the rooms was evaluated. At this stage, a specialized microclimate meter, EHA MM101 (Ekohigiena Aparatura Ryszard Putyra Sp.J., Środa Śląska, Poland), was used to assess thermal comfort during the same period. The device is equipped with a set of sensors, including temperature, humidity, infrared radiation, and air velocity sensors (see Figure 8), with specifications provided in Table 4. In the analyzed building, thermal comfort tests were conducted in two southwest-facing ground-floor rooms. One of the rooms has a large glazed façade. Originally, there was only a small plinth above the glass façade between the ground and first floor. Following the recommendations of the expert team, a 14 m2 terrace was built above the façade on the first floor. Firstly, it provides an attractive solution for the residents of the upper floor, and secondly, from the perspective of thermal comfort, it was also expected to mitigate overheating in the ground-floor room by shading the glazed façade. Parallel measurements were conducted in the second room, which had a standard-sized triple-glazed window with low-emissivity coatings, characterized by a heat transfer coefficient U = 0.90 [W/(m2K)] and a solar heat gain coefficient g = 0.31 [-]. No additional shading devices were used in either room, and the windows remained closed. The measurement locations are shown in Figure 4 as A (room with a large glazed façade) and B (room with a window). Sensors were positioned at a height of 1.1 m—corresponding to the approximate head level of a seated person—and at a distance of 0.6 m from the façade/window wall. Data were recorded at 10-min intervals. For the PMV/PPD calculations (using the device’s built-in software), clothing insulation was set at 0.7 clo (indoor clothing, early summer), and activity was set at 1.2 met (seated work, such as in a dwelling, office, laboratory, or school) [30]. Figure 9 illustrates the preparation for in situ measurements of microclimatic parameters in both rooms.

2.4. Outdoor Thermal Comfort (Estate Scale)

2.4.1. Design Stage (Estate Scale)

Analyses are also carried out using the ENVI-met software (version 5.7.1) for simulating environmental conditions. These analyses make it possible to appropriately select blue–green infrastructure so that users feel most comfortable in the building’s surroundings. This program allows for the assessment of the impact of various urban strategies on microclimatic conditions, including surface types, greenery distribution, building geometry, and the use of materials with specific thermal properties [33]. For this reason, it is widely used in spatial planning, landscape architecture, and climate change adaptation analyses. Two measurement points in the analyzed housing estate were examined: point C—in the communal green space (mini-park); point D—a small private garden located on the southern side. The location of the measurement points is presented in Figure 7.
The model was fed with meteorological data from the EPW file for the Kraków-Balice station (WMO 125660) from 2005, containing a complete set of variables required for modelling, including air temperature, relative humidity, wind speed, and solar radiation parameters. To assess the representativeness of these data, a more recent TMYx file for the Kraków-Balice station, covering approximately the last decade, was also analyzed. The comparison revealed only slight differences in thermal conditions between the 2005 data and the more recent period, confirming the validity of using the 2005 dataset for microclimate modeling in the study area.

2.4.2. Operational Stage (Estate Scale)

In situ measurements were carried out in two locations within the estate, corresponding to the sites analyzed during the design stage. The first was situated in a private garden (point D), and the second in the communal green area for residents (point C). Figure 10 shows the Davis Vantage Pro2 weather station used for outdoor comfort measurements. The station was equipped with sensors for recording key outdoor microclimatic parameters, including air temperature, relative humidity, atmospheric pressure, wind speed and direction, and precipitation, as well as solar and UV radiation. Table 5 presents the technical specifications of the weather station.
Simulations were carried out for the day representing the highest thermal load on humans in order to demonstrate significant differences between the analyzed points. The figures show the distribution of the PET, which is a biometeorological indicator used to assess human thermal comfort in outdoor environments. It is based on the heat balance of the human body and is expressed in degrees Celsius (°C), which allows for intuitive interpretation in the context of everyday thermal experiences. PET takes into account both environmental parameters (air temperature, relative humidity, wind speed, mean radiant temperature) and human physiological characteristics (metabolism, clothing, activity). The computational model is based on MEMI (Munich Energy-balance Model for Individuals), which makes it possible to determine what air temperature under reference conditions (indoor environment, no wind, constant humidity) would cause the same thermal effect as the actual outdoor conditions. The PET index is widely used in urban microclimate analyses and public space design and in assessing the impact of climate change on the quality of life in outdoor environments [34,35].
The in situ measurement was conducted at 10:00 a.m. The sensors were placed at a height of 0.6 m above ground level. This height corresponds to the center of gravity of a human body in a seated position, in accordance with the adopted standard [32]. Physiological parameters were adopted in accordance with the guidelines [30]. The metabolic rate (met) was 1.0, and the clothing insulation (clo) −0.5, which corresponds to a person in light summer clothing, remained in a seated position. Table 6 presents the PET thermal stress perception scale.

3. Results

3.1. Survey Analysis Results

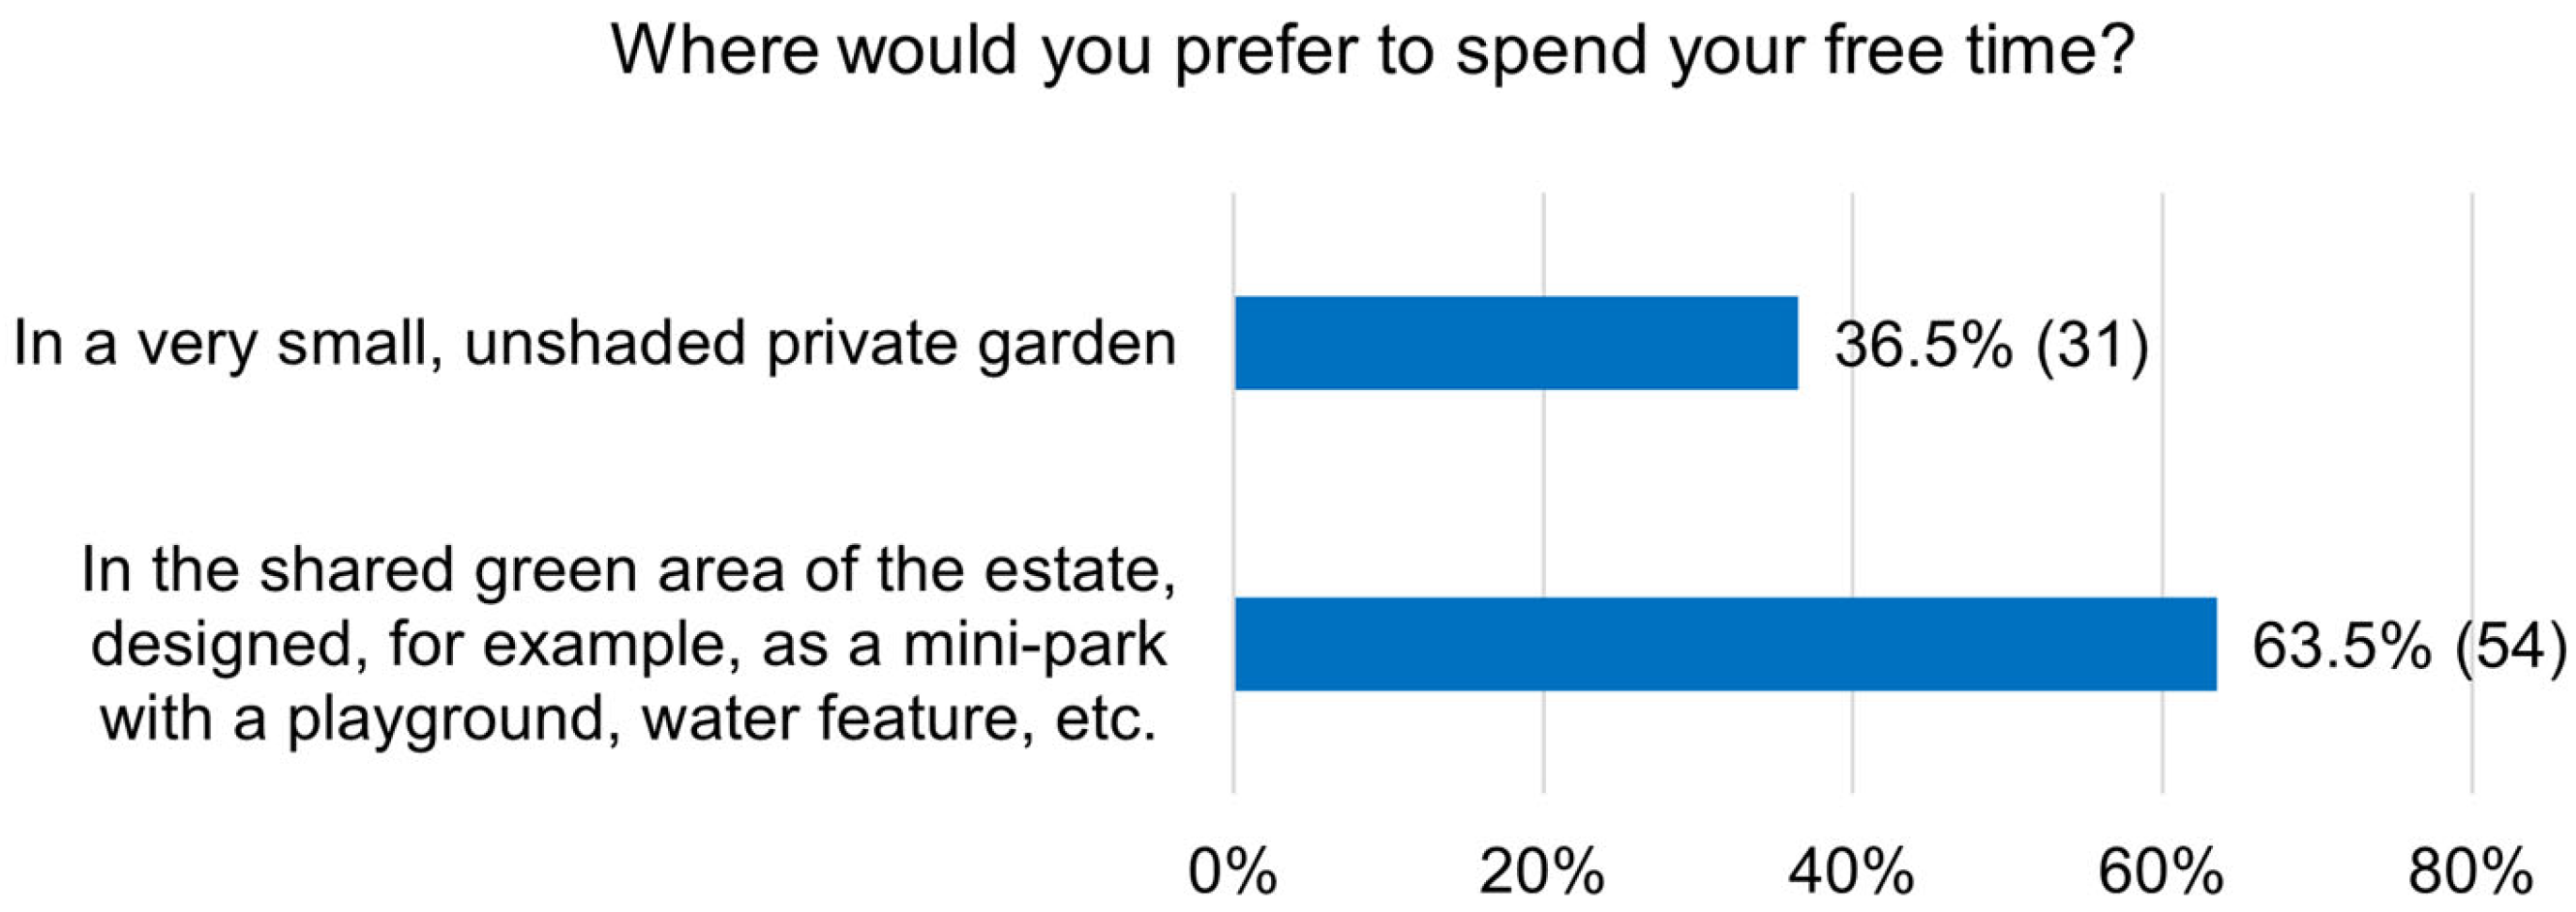
Respondents mostly indicated that they would prefer to spend their free time in the shared green area of the estate—designed, for example, as a mini-park with a playground, water feature, and similar amenities—rather than in a very small, unshaded private gar-den (see Figure 11). The second question addressed their preferences between two urban layouts: Layout A, consisting of individual buildings with small private gardens, and Layout B, where some of the buildings are designed as semi-detached houses to allow more space for a shared green zone. This communal area could serve as a park, flower garden with water features, playground, or community gathering space. Survey results clearly show that respondents favored Layout B, highlighting a strong preference for the inclusion of shared blue–green infrastructure intended for communal use (see Figure 12).

3.2. Thermal Comfort (Building Scale)

3.2.1. Analyses at the Design Stage

Figure 13 presents the results of the analysis of indoor temperature in the room with large glazing (point A) and in the room with a window (point B) during the period 30 May–13 June 2025. The climatic data for the simulation were obtained from the Kraków-Balice meteorological station, while the building where the study was conducted is located in Bibice. Due to the distance of approximately 15 km, the actual meteorological conditions at the considered location may have differed slightly.
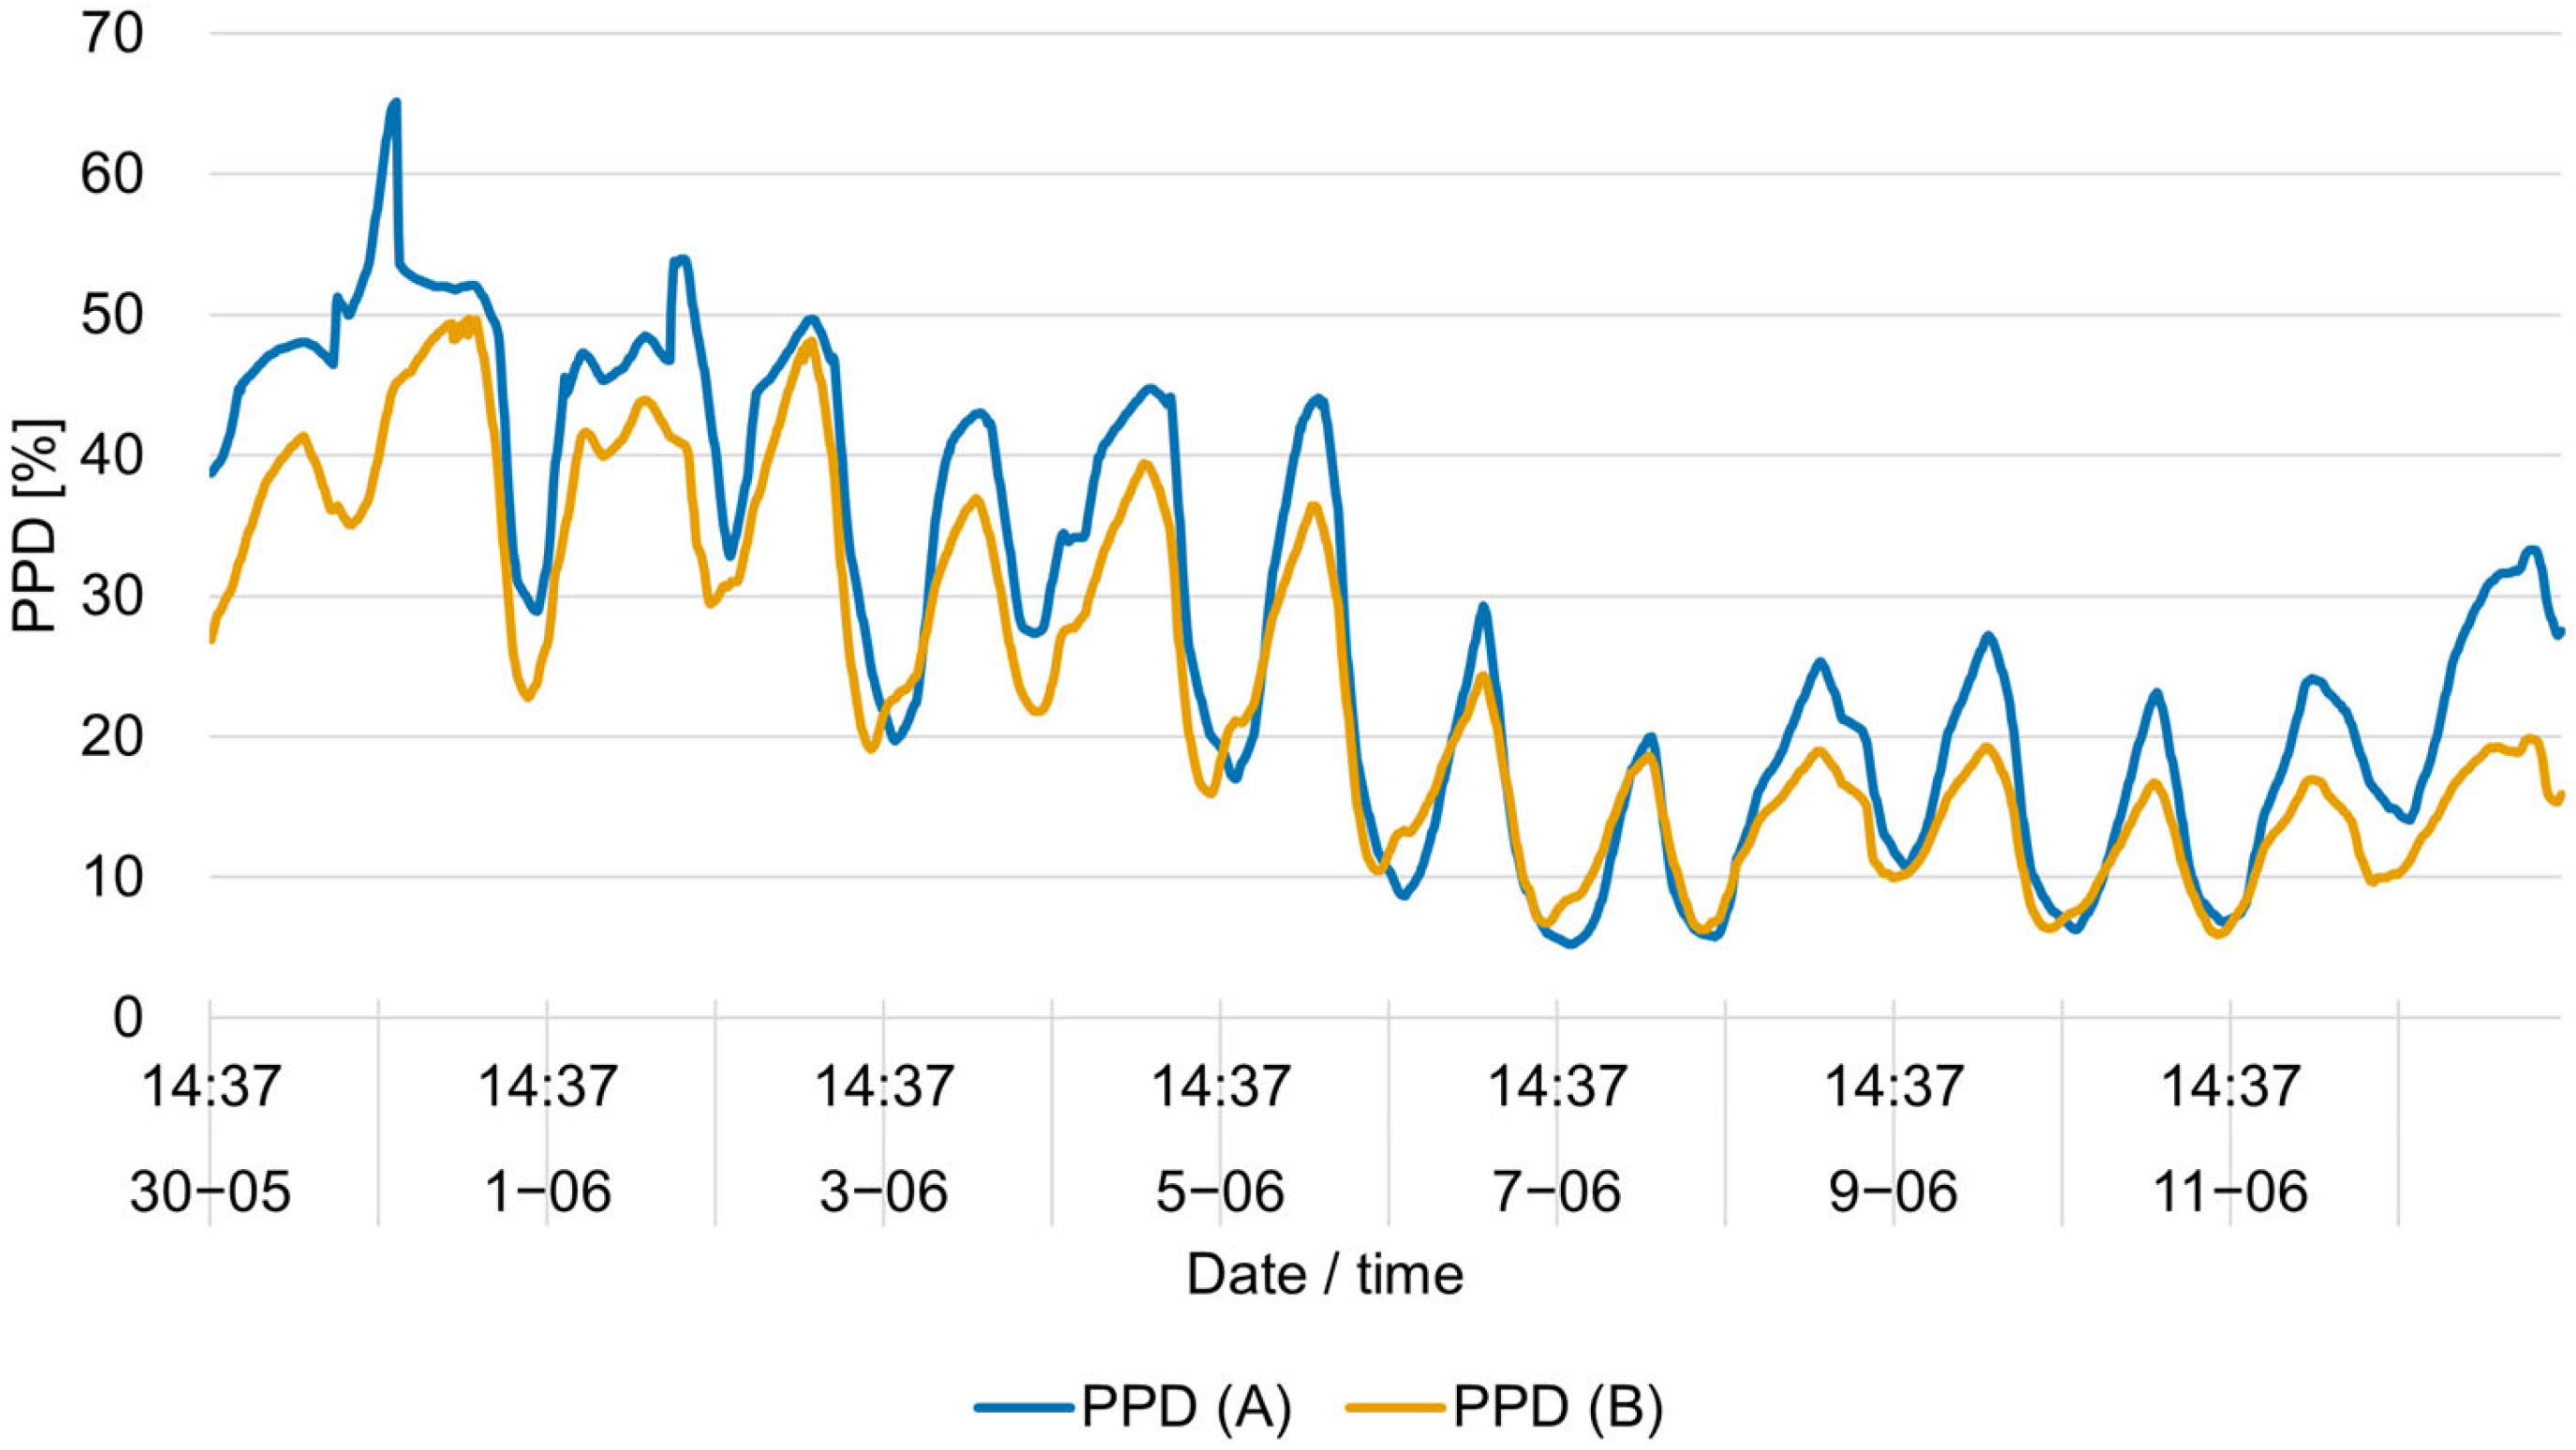
Figure 14 presents the results of the analysis of the PPD comfort index in the room with large glazing (point A) and in the room with a window (point B) for the period 30 May–13 June 2025.
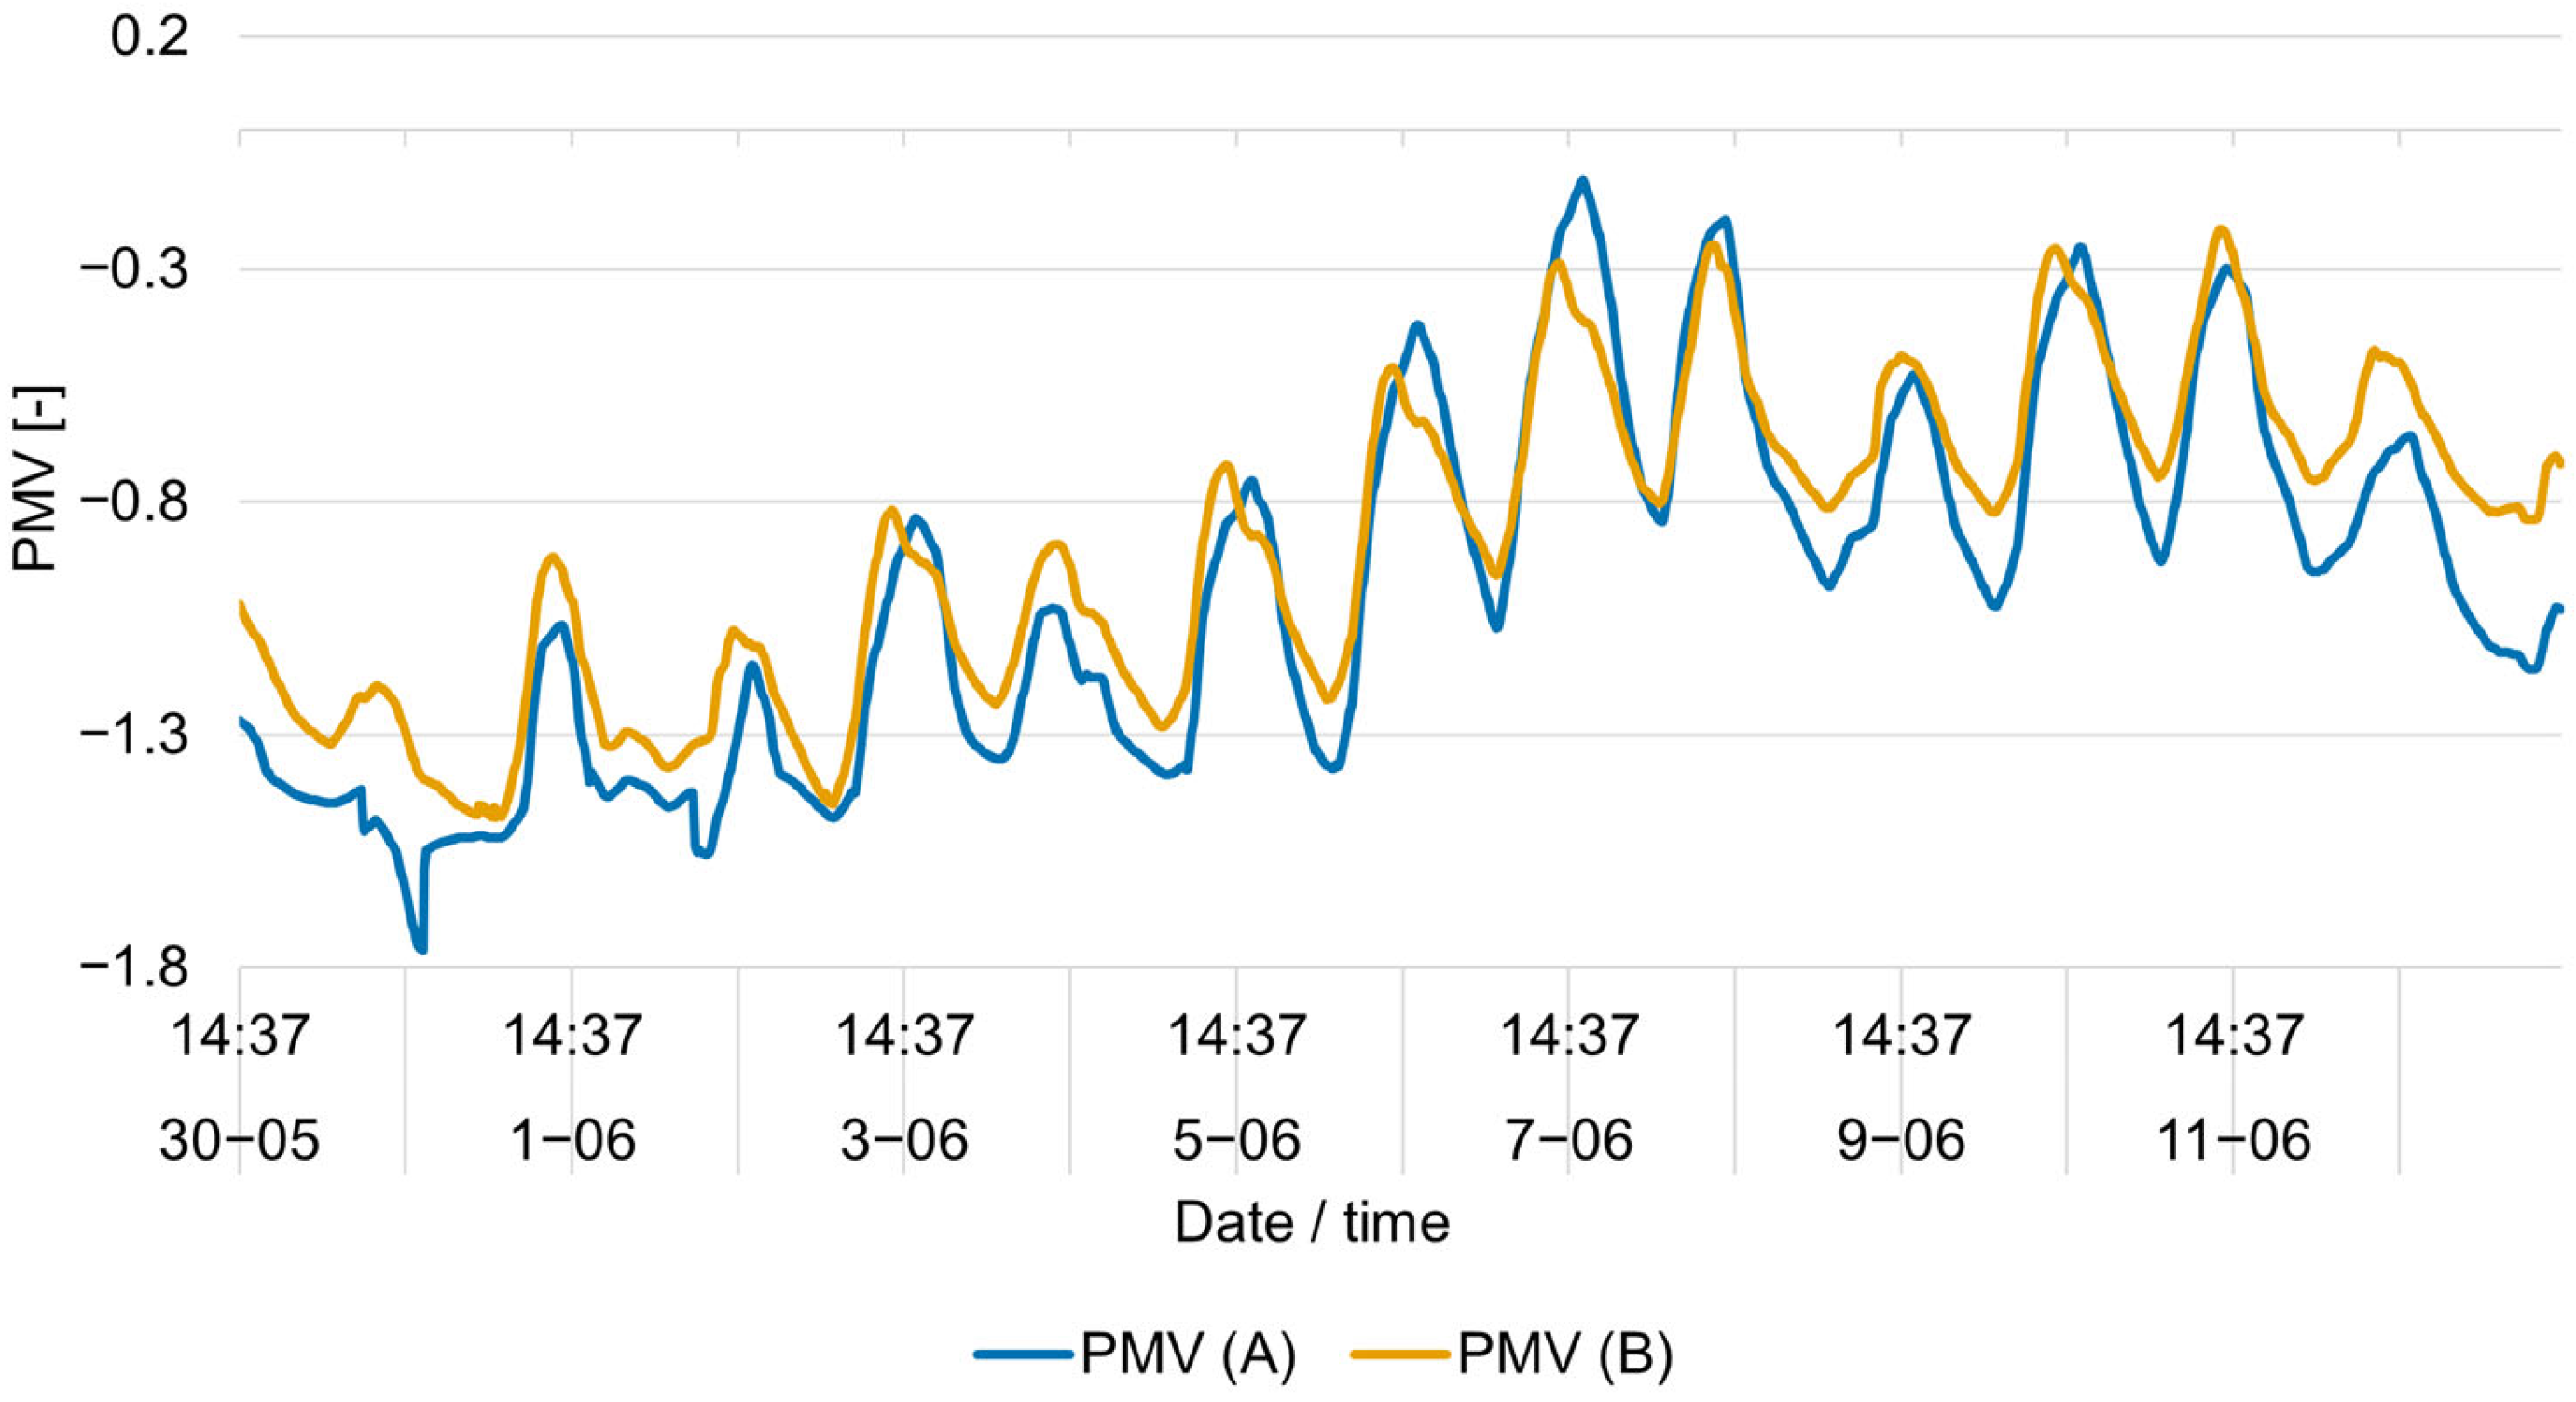
Figure 15 presents the results of the analysis of the PMV comfort index in the room with large glazing (point A) and in the room with a window (point B) during the period 30 May–13 June 2025.

3.2.2. Studies at the Operational Stage

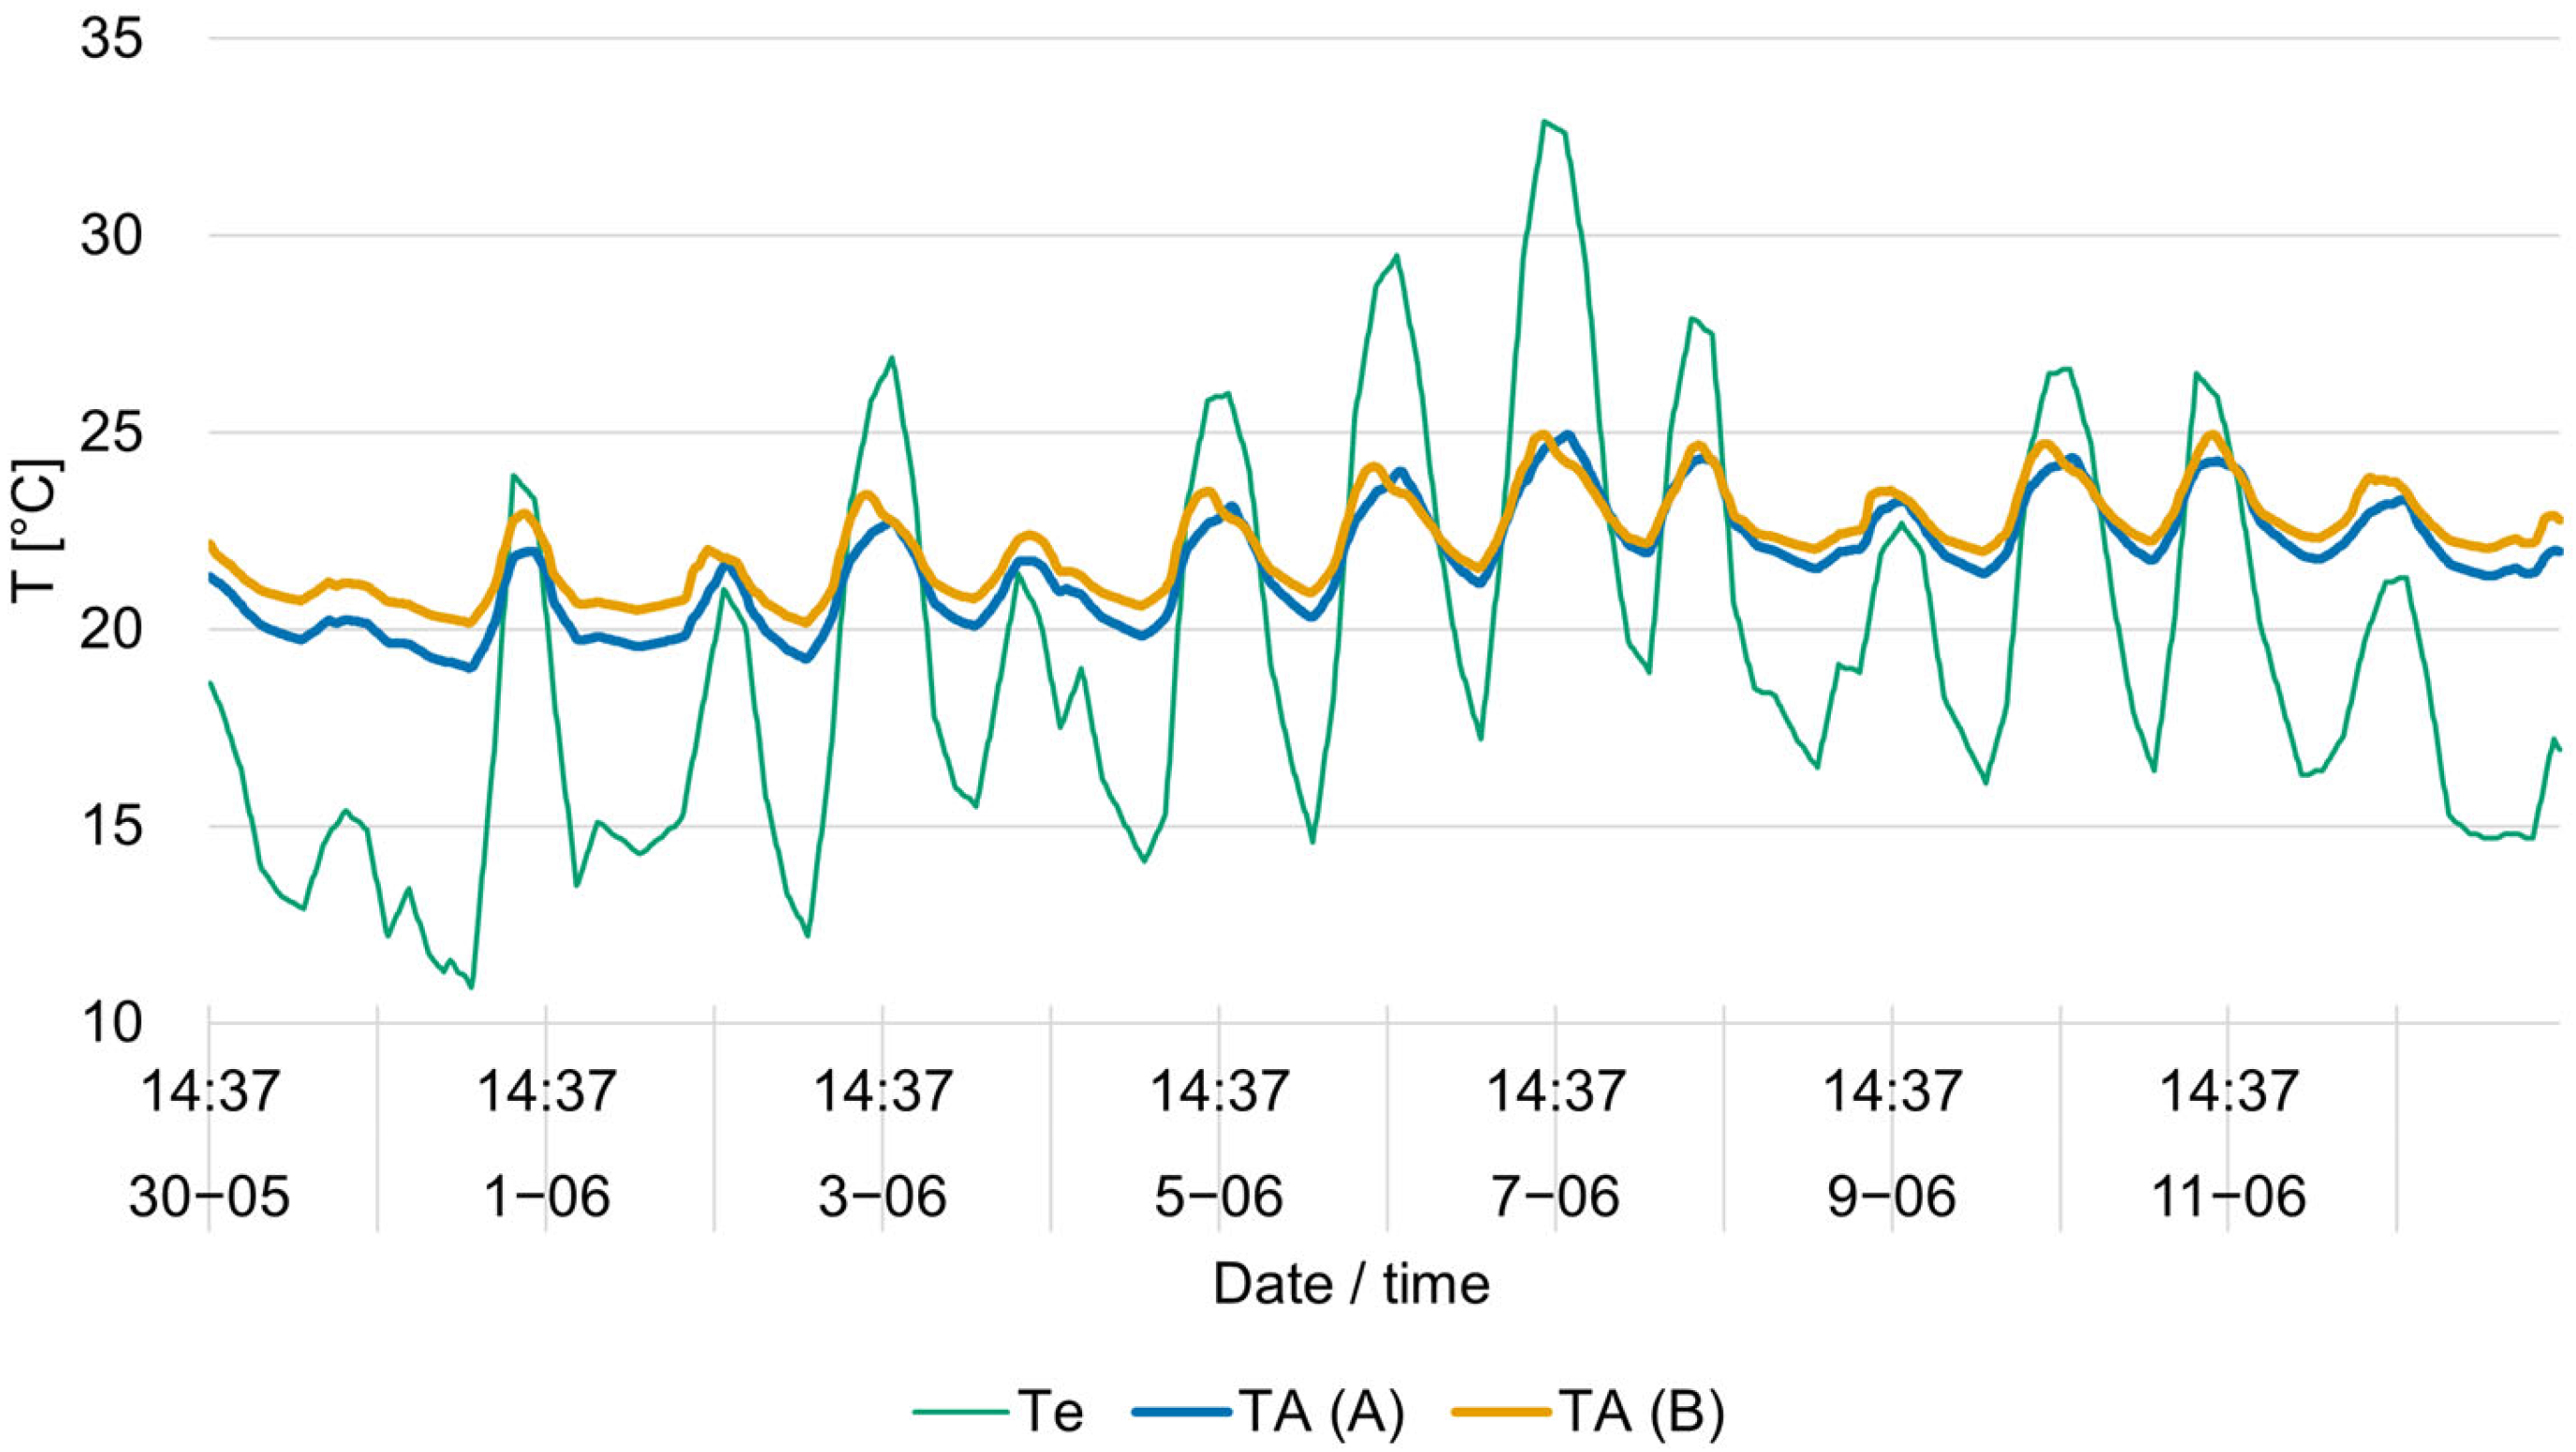
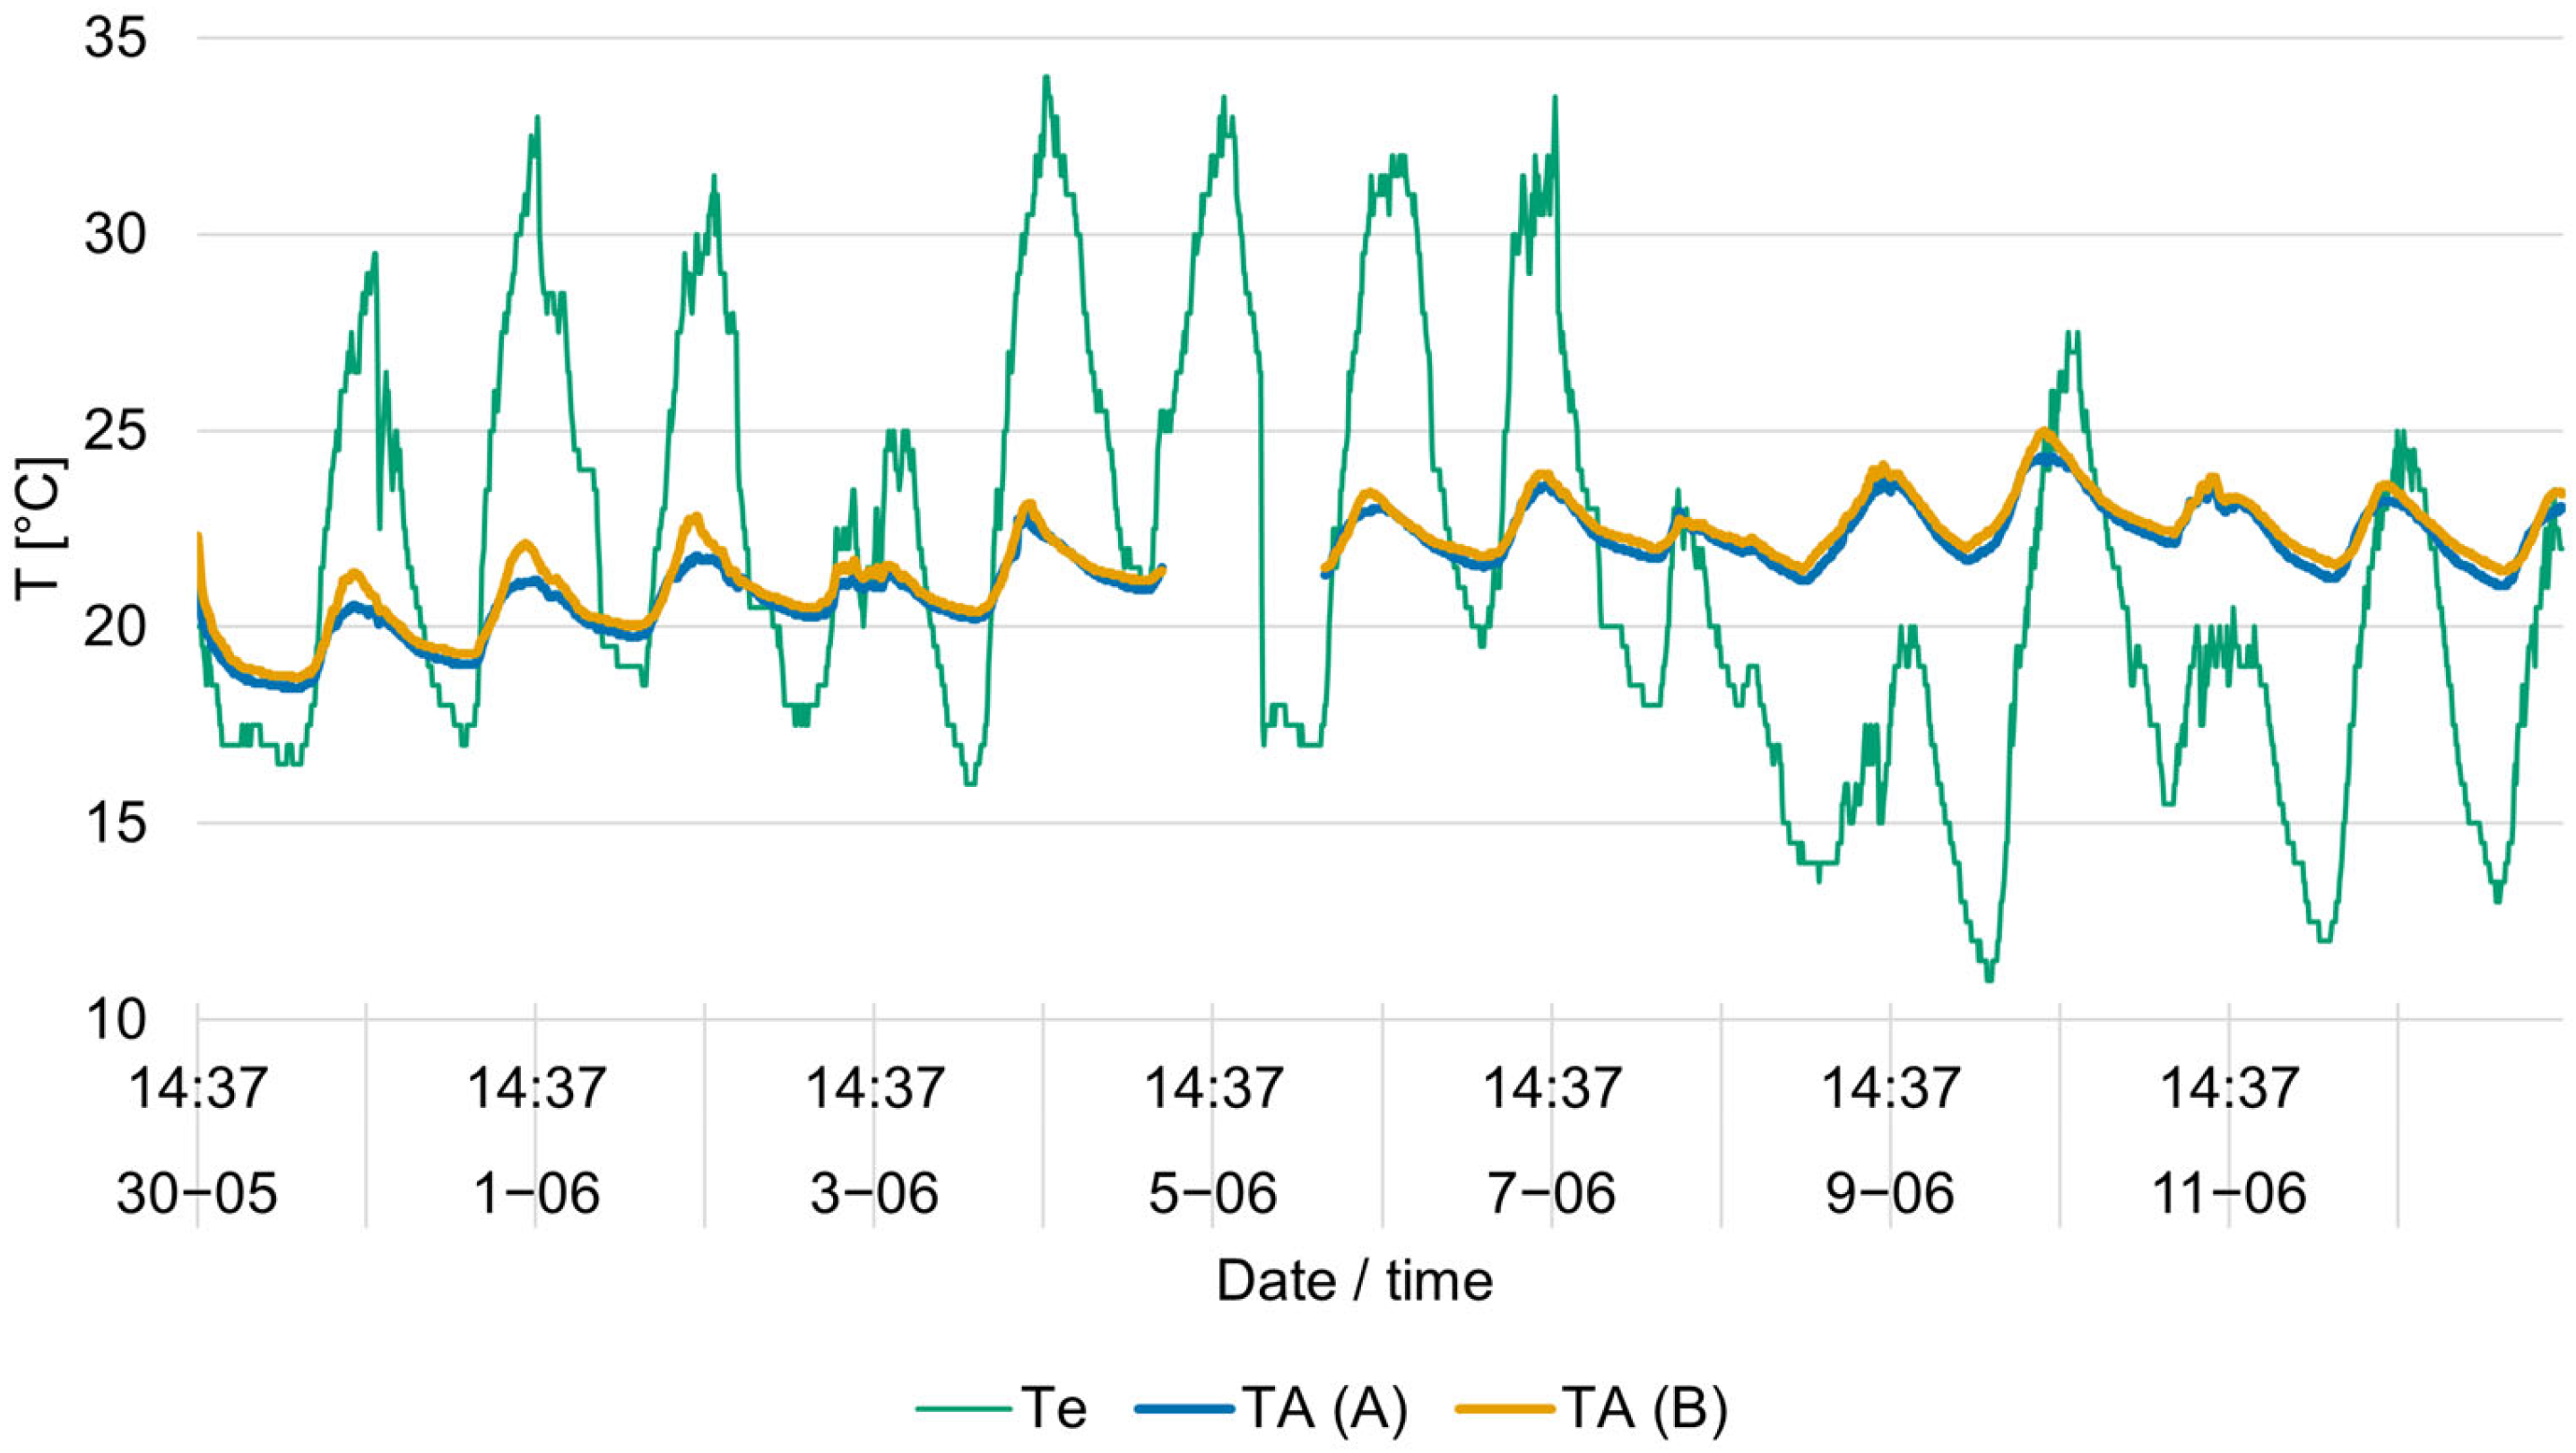
Figure 16 presents the results of the indoor temperature measurements in the room with large glazing (point A) and in the room with a window (point B), along with the outdoor temperature, recorded during the period 30 May–13 June 2025.
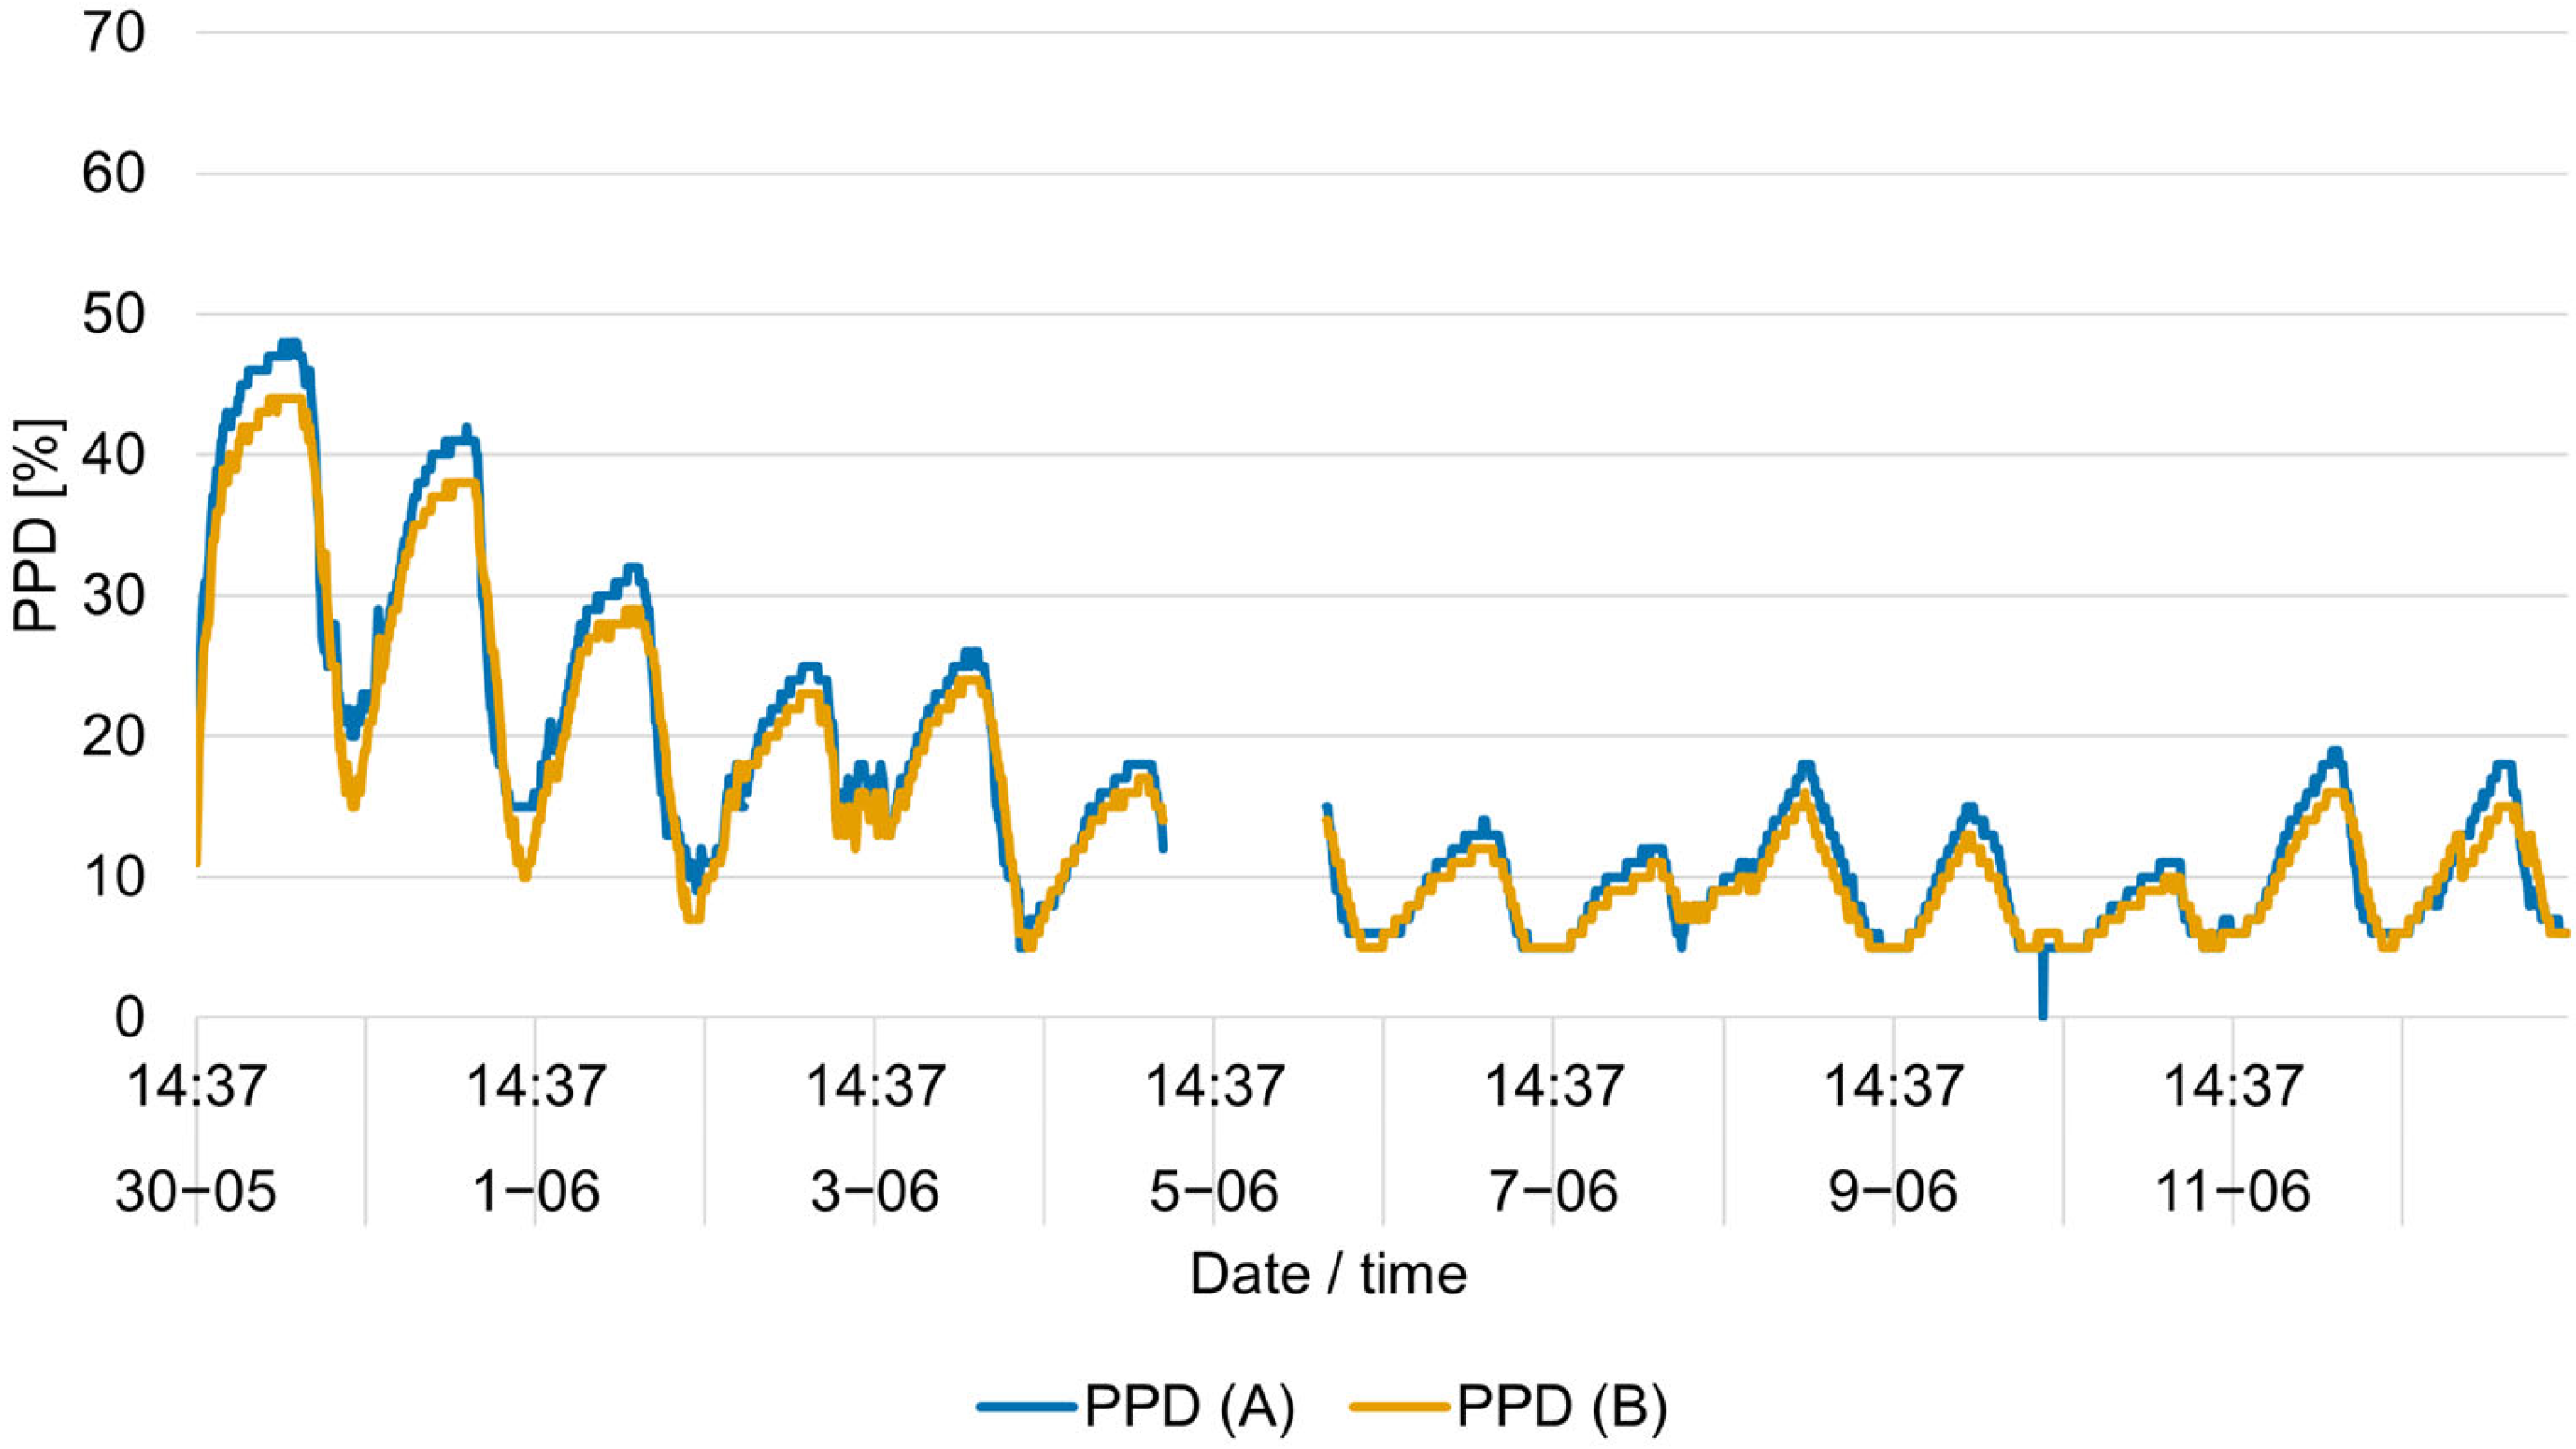
Figure 17 presents the results of the PPD comfort index measurements in the room with large glazing (point A) and in the room with a window (point B) during the period 30 May–13 June 2025.
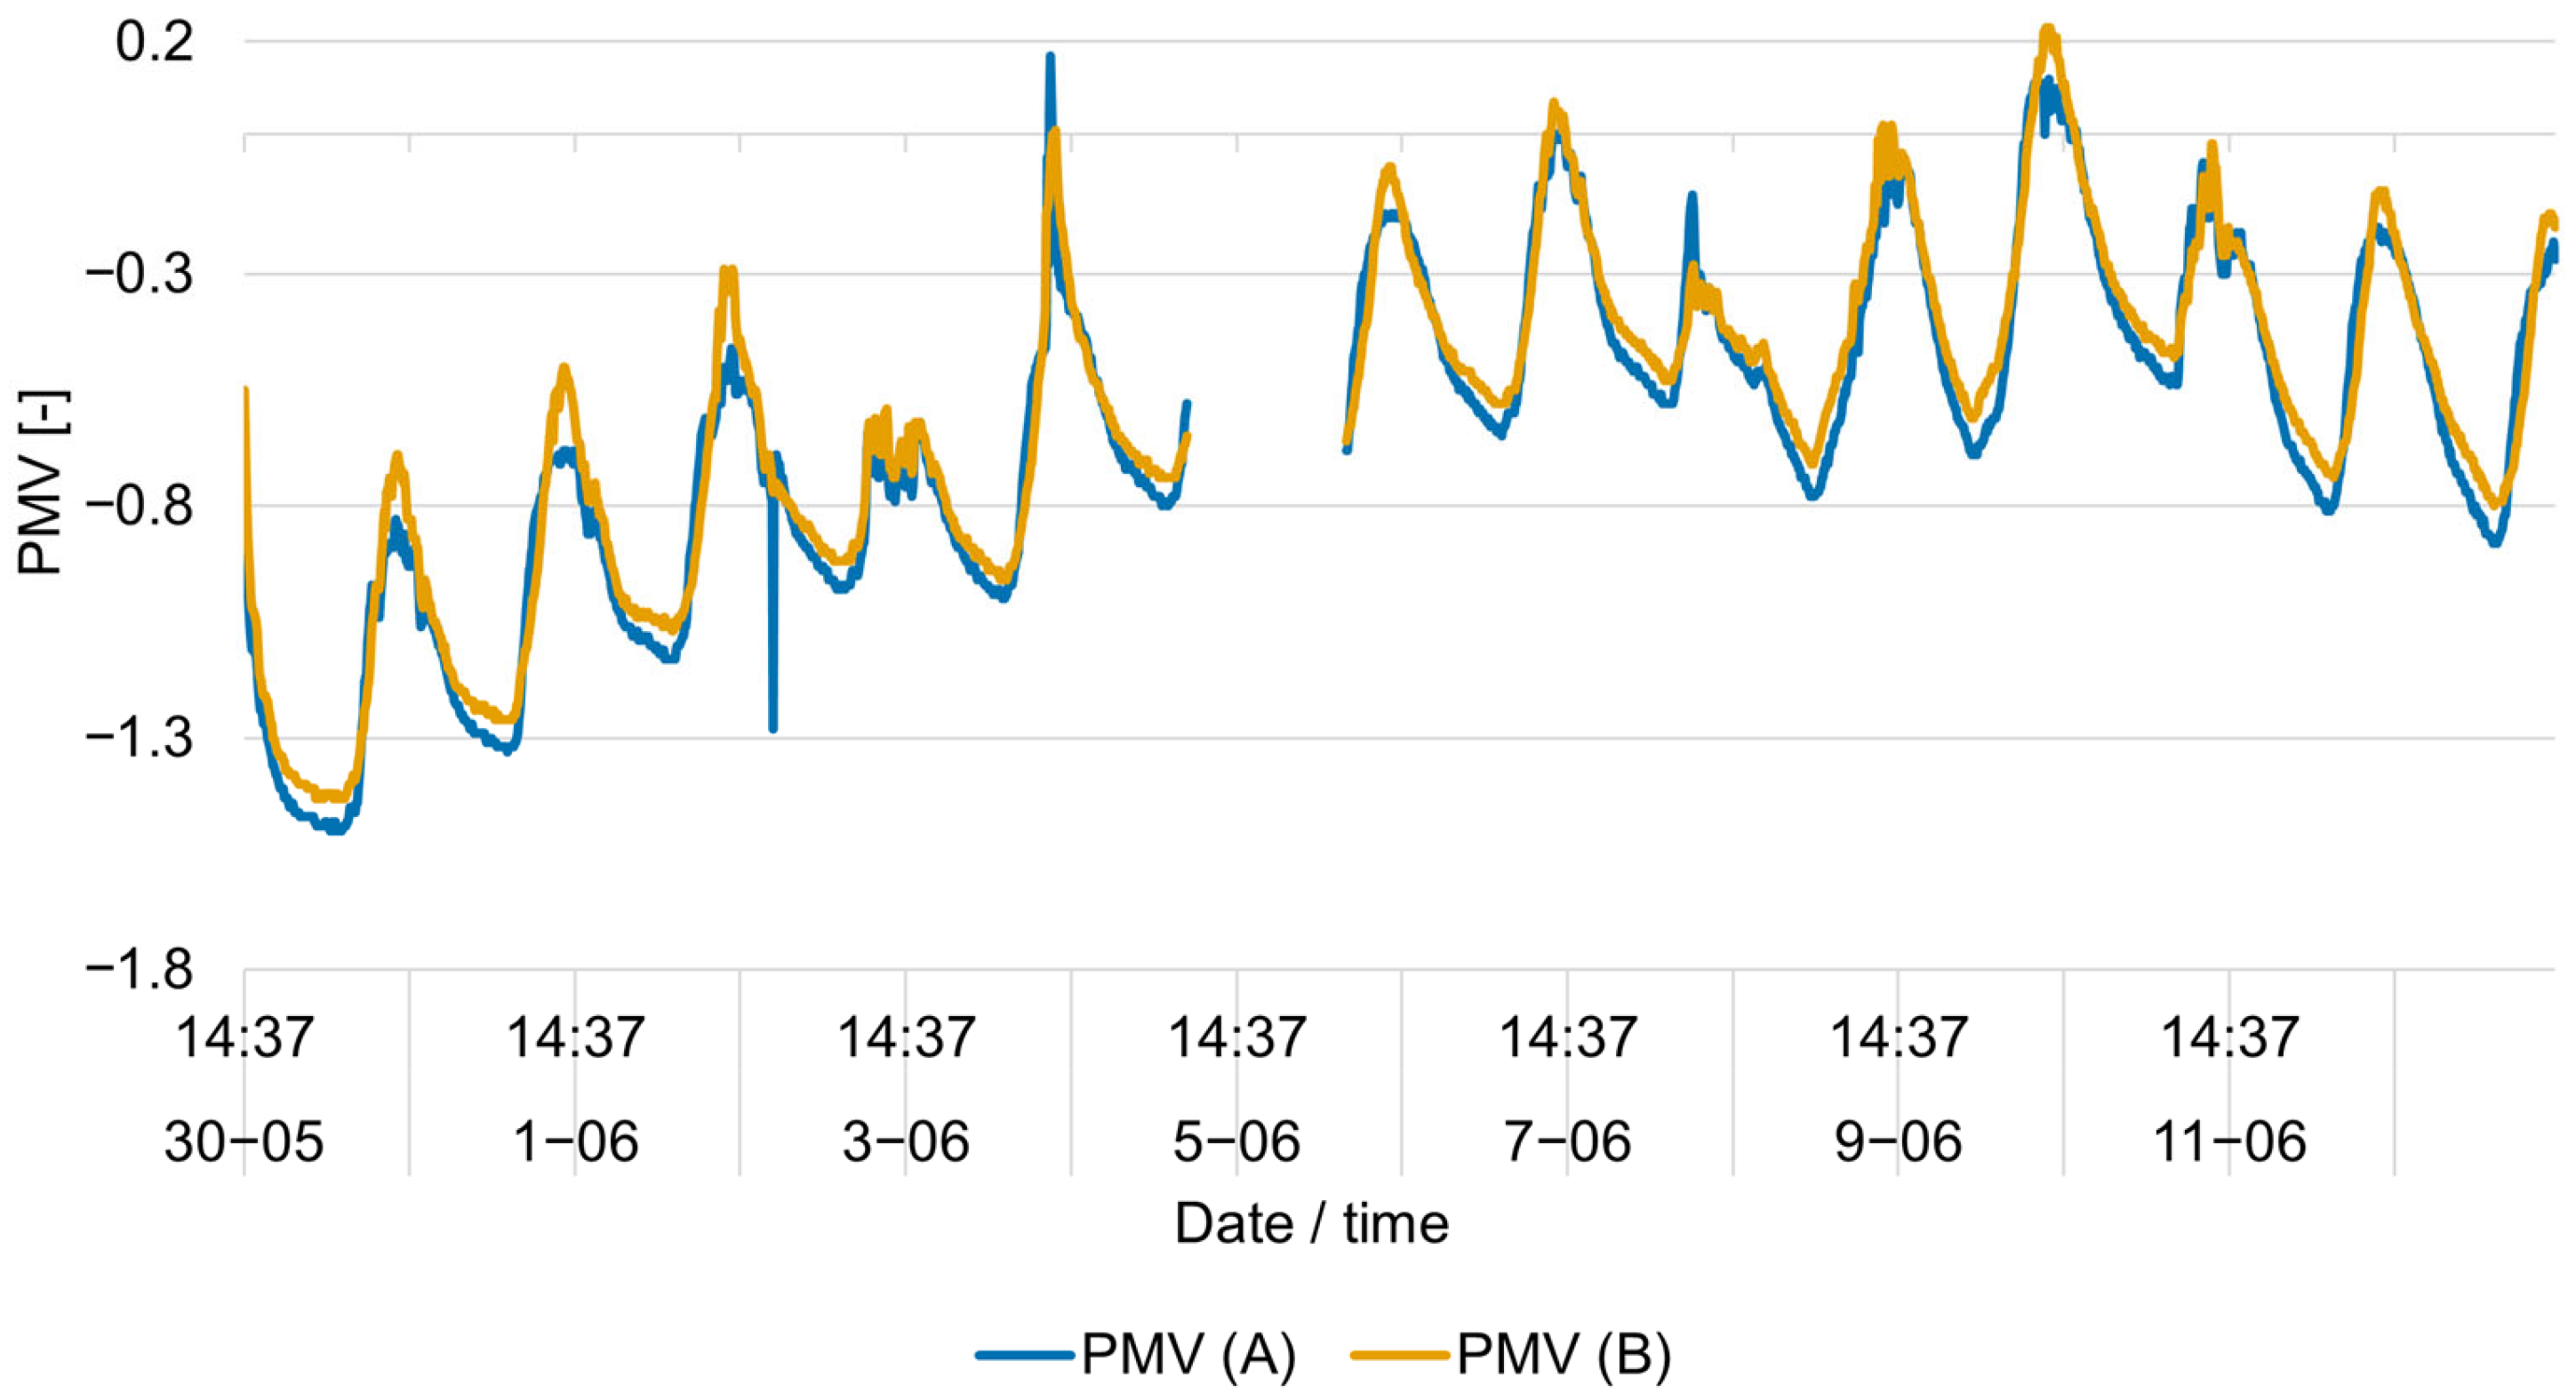
Figure 18 presents the results of the PMV comfort index measurements in the room with large glazing (point A) and in the room with a window (point B) during the period 30 May–13 June 2025.
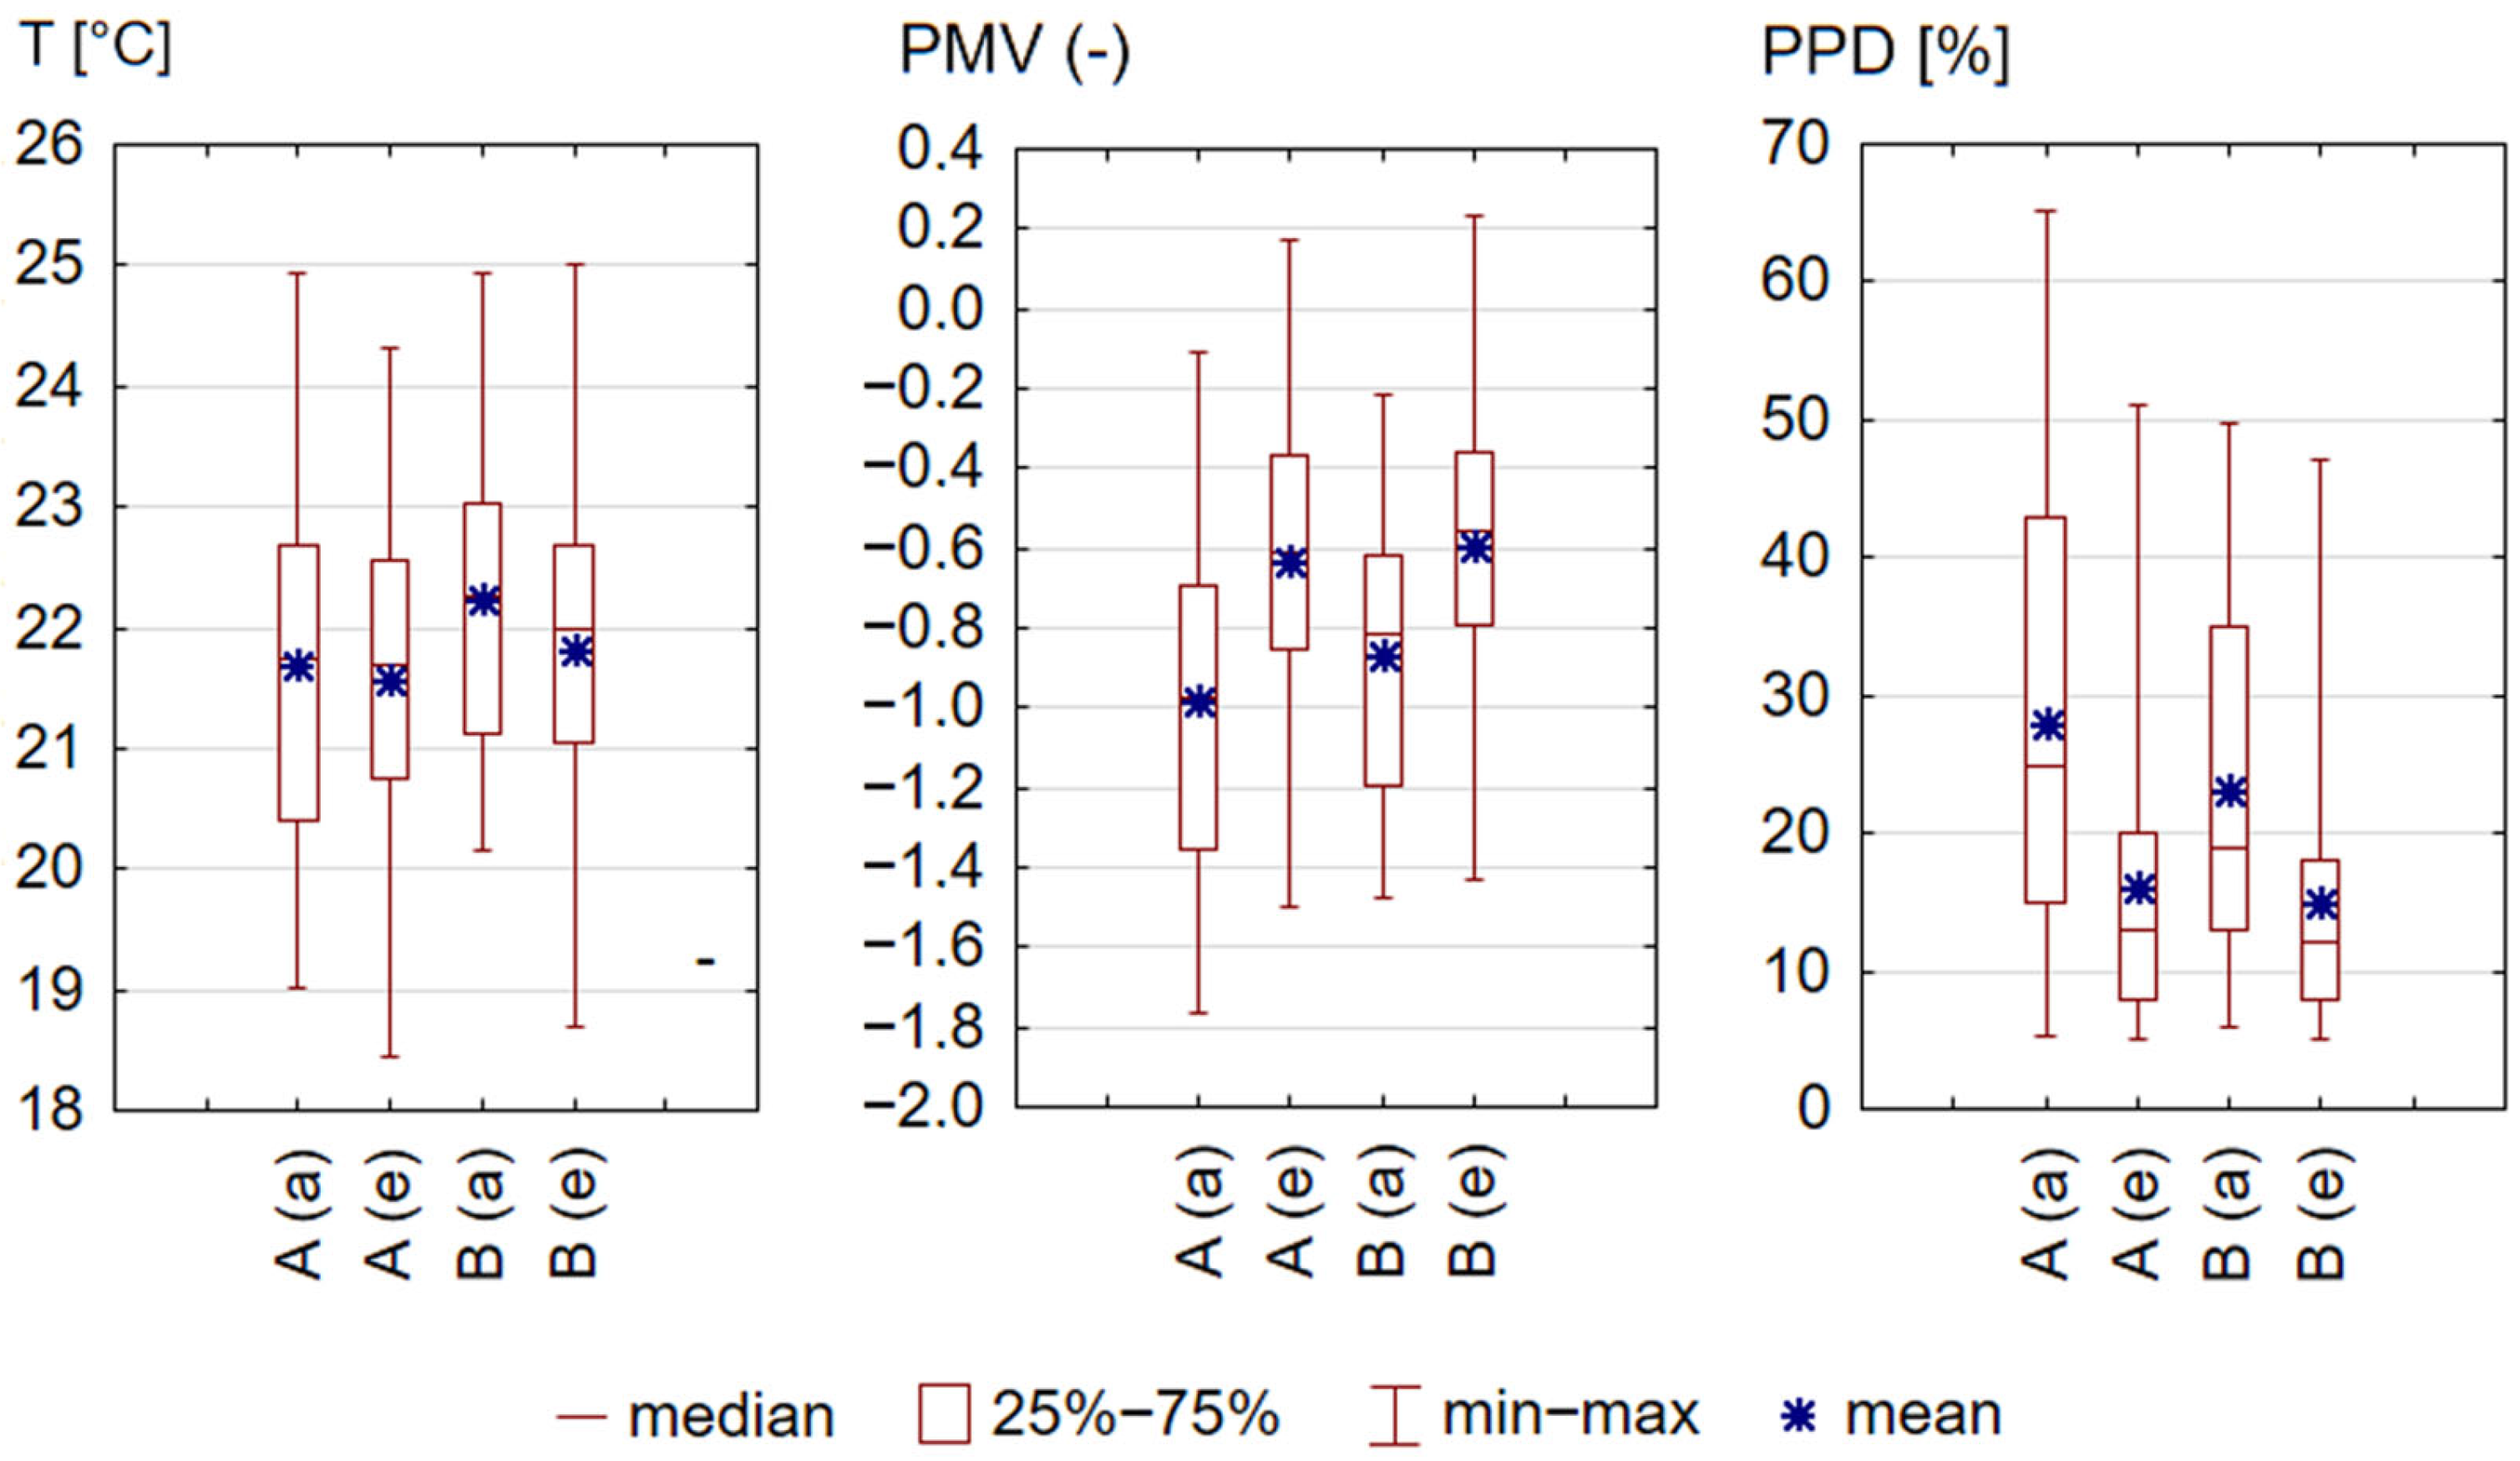
Figure 19 shows the distribution of values for selected microclimate parameters at points A and B for the design-stage analysis and the in situ measurements during the operational stage, while Table 7 summarizes their descriptive statistics. The comparison of microclimatic conditions between points A and B revealed statistically significant differences (p < 0.01) in mean air temperature, PMV, and PPD values. The average PMV index was slightly lower at point A in both simulations (−0.98) and measurements (−0.63) compared to point B (−0.87 and −0.60, respectively). This pattern corresponds to the mean air temperatures, which were 21.7 °C and 21.58 °C for point A, versus 22.24 °C and 21.83 °C for point B. The mean daily maximum temperature was also lower at point A by 0.56 °C in the simulations and 0.47 °C in the measurements. During the in situ measurements, the variability of both PMV and temperature remained at a similar level at the two points (PMV: SD = 0.36 vs. 0.35; temperature: SD = 1.31 vs. 1.30), whereas the simulations suggested slightly greater variability (PMV: SD = 0.39 vs. 0.34; temperature: SD = 1.46 vs. 1.21).

3.3. Outdoor Thermal Comfort at the Estate Scale

3.3.1. Analyses at the Design Stage

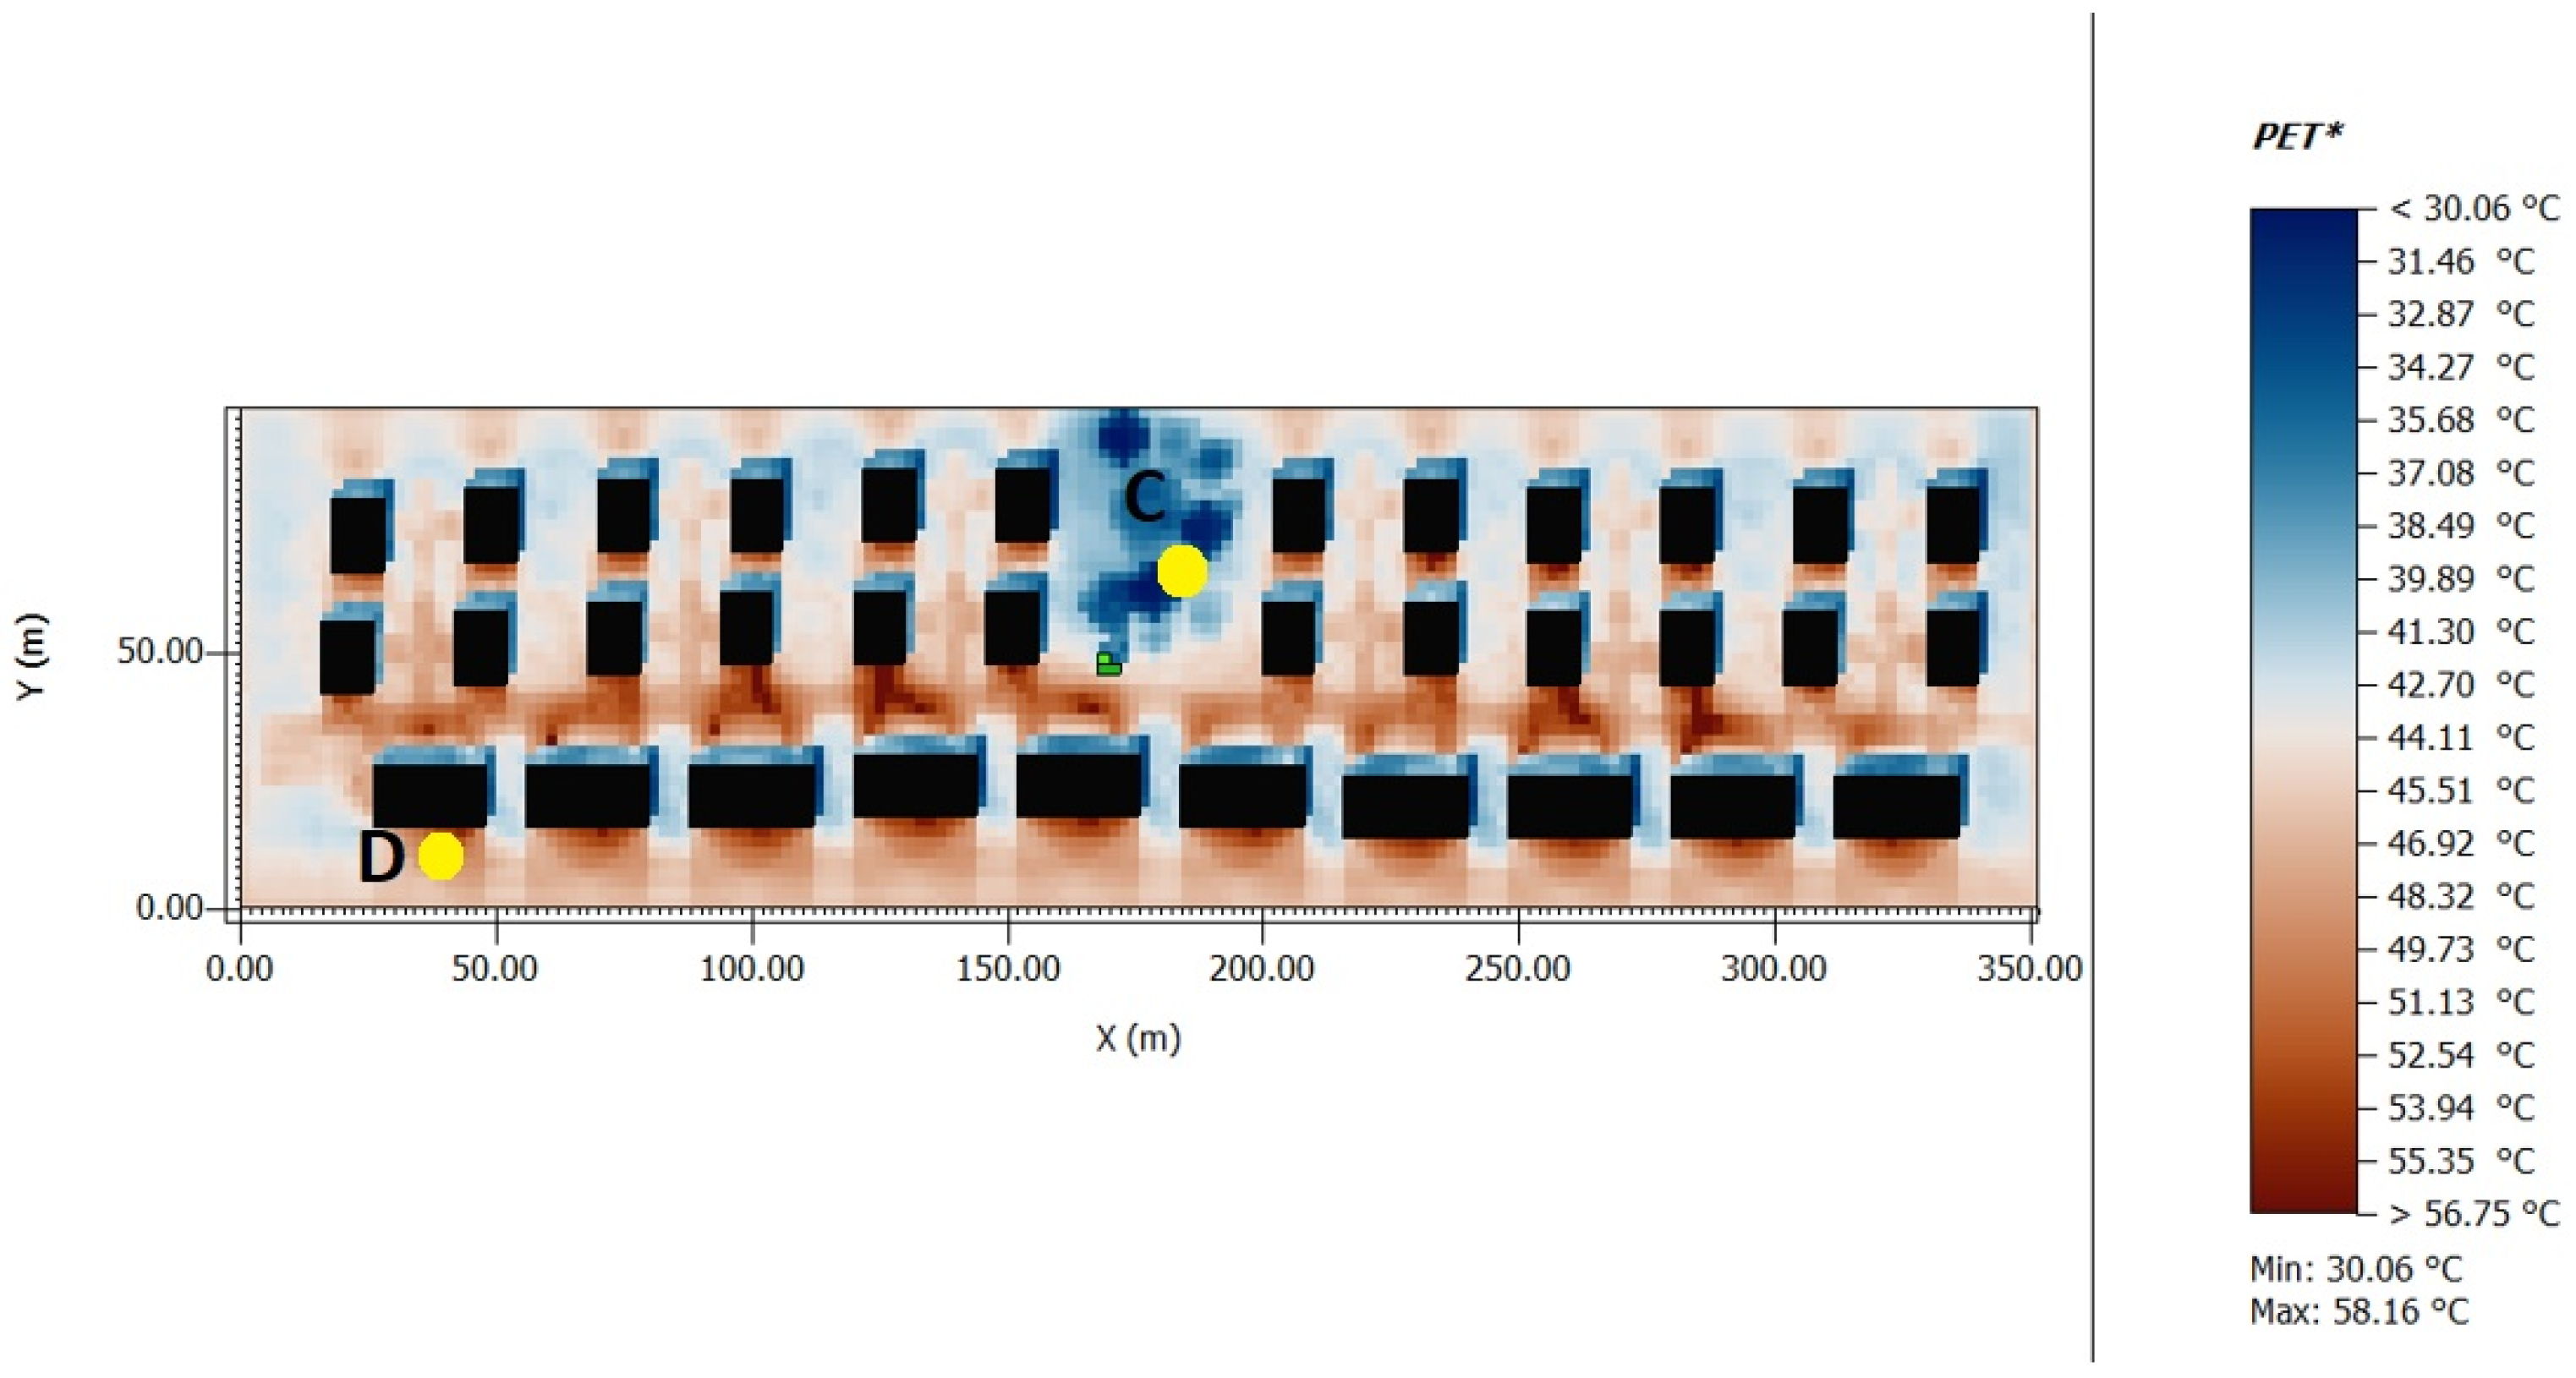
The results of summer conditions at two measurement points, C—the green common area and D—the unshaded private garden, are presented in Figure 20.
Analysis of the PET index results makes it possible to assess the level of thermal comfort in selected locations at a given time of day. The values presented for 12:00, at a height of 0.6 m, show significant differences between measurement points C and D. The temporal variability of the PET index for these locations is shown in Figure 21. According to the physiological thermal stress perception scale (Table 6), at point C—located in the park–users may experience a moderate level of heat stress. In contrast, at point D, representing home gardens with limited shading, the PET index reaches values corresponding to extreme heat stress of the second level (level 2). The maximum PET index at point D was 51.83 °C, which was 10.01 °C higher than at point C. Similarly, the mean PET index for the analyzed period was 43.84 °C at point D, exceeding that at point C by 9.37 °C (p < 0.01)—see Table 8. These differences clearly indicate the impact of tall greenery and shading on mitigating heat stress and improving microclimatic conditions in urbanized spaces.
At point D, PET values systematically increase from the morning hours, reaching their peak around midday. High values persist for several hours, indicating prolonged exposure to strong and extreme heat stress. The lack of significant drops around noon suggests that this space does not provide mechanisms for limiting heat accumulation—such as shade, cooling retention, or the presence of vegetation. In contrast, point C shows a much more balanced PET profile. After a short rise in the morning, the values stabilize and do not reach levels typical of the highest heat stress categories. The noticeable drop in PET around noon may be the result of shading generated by nearby trees or buildings. The subsequent increase in the late afternoon may be due to shifting shadows and greater exposure to reflected radiation. The comparison of these two trends clearly indicates that the presence of tall greenery and shading plays a crucial role in regulating microclimatic conditions and reducing physiological heat stress in human-used spaces.

3.3.2. Studies at the Operational Stage

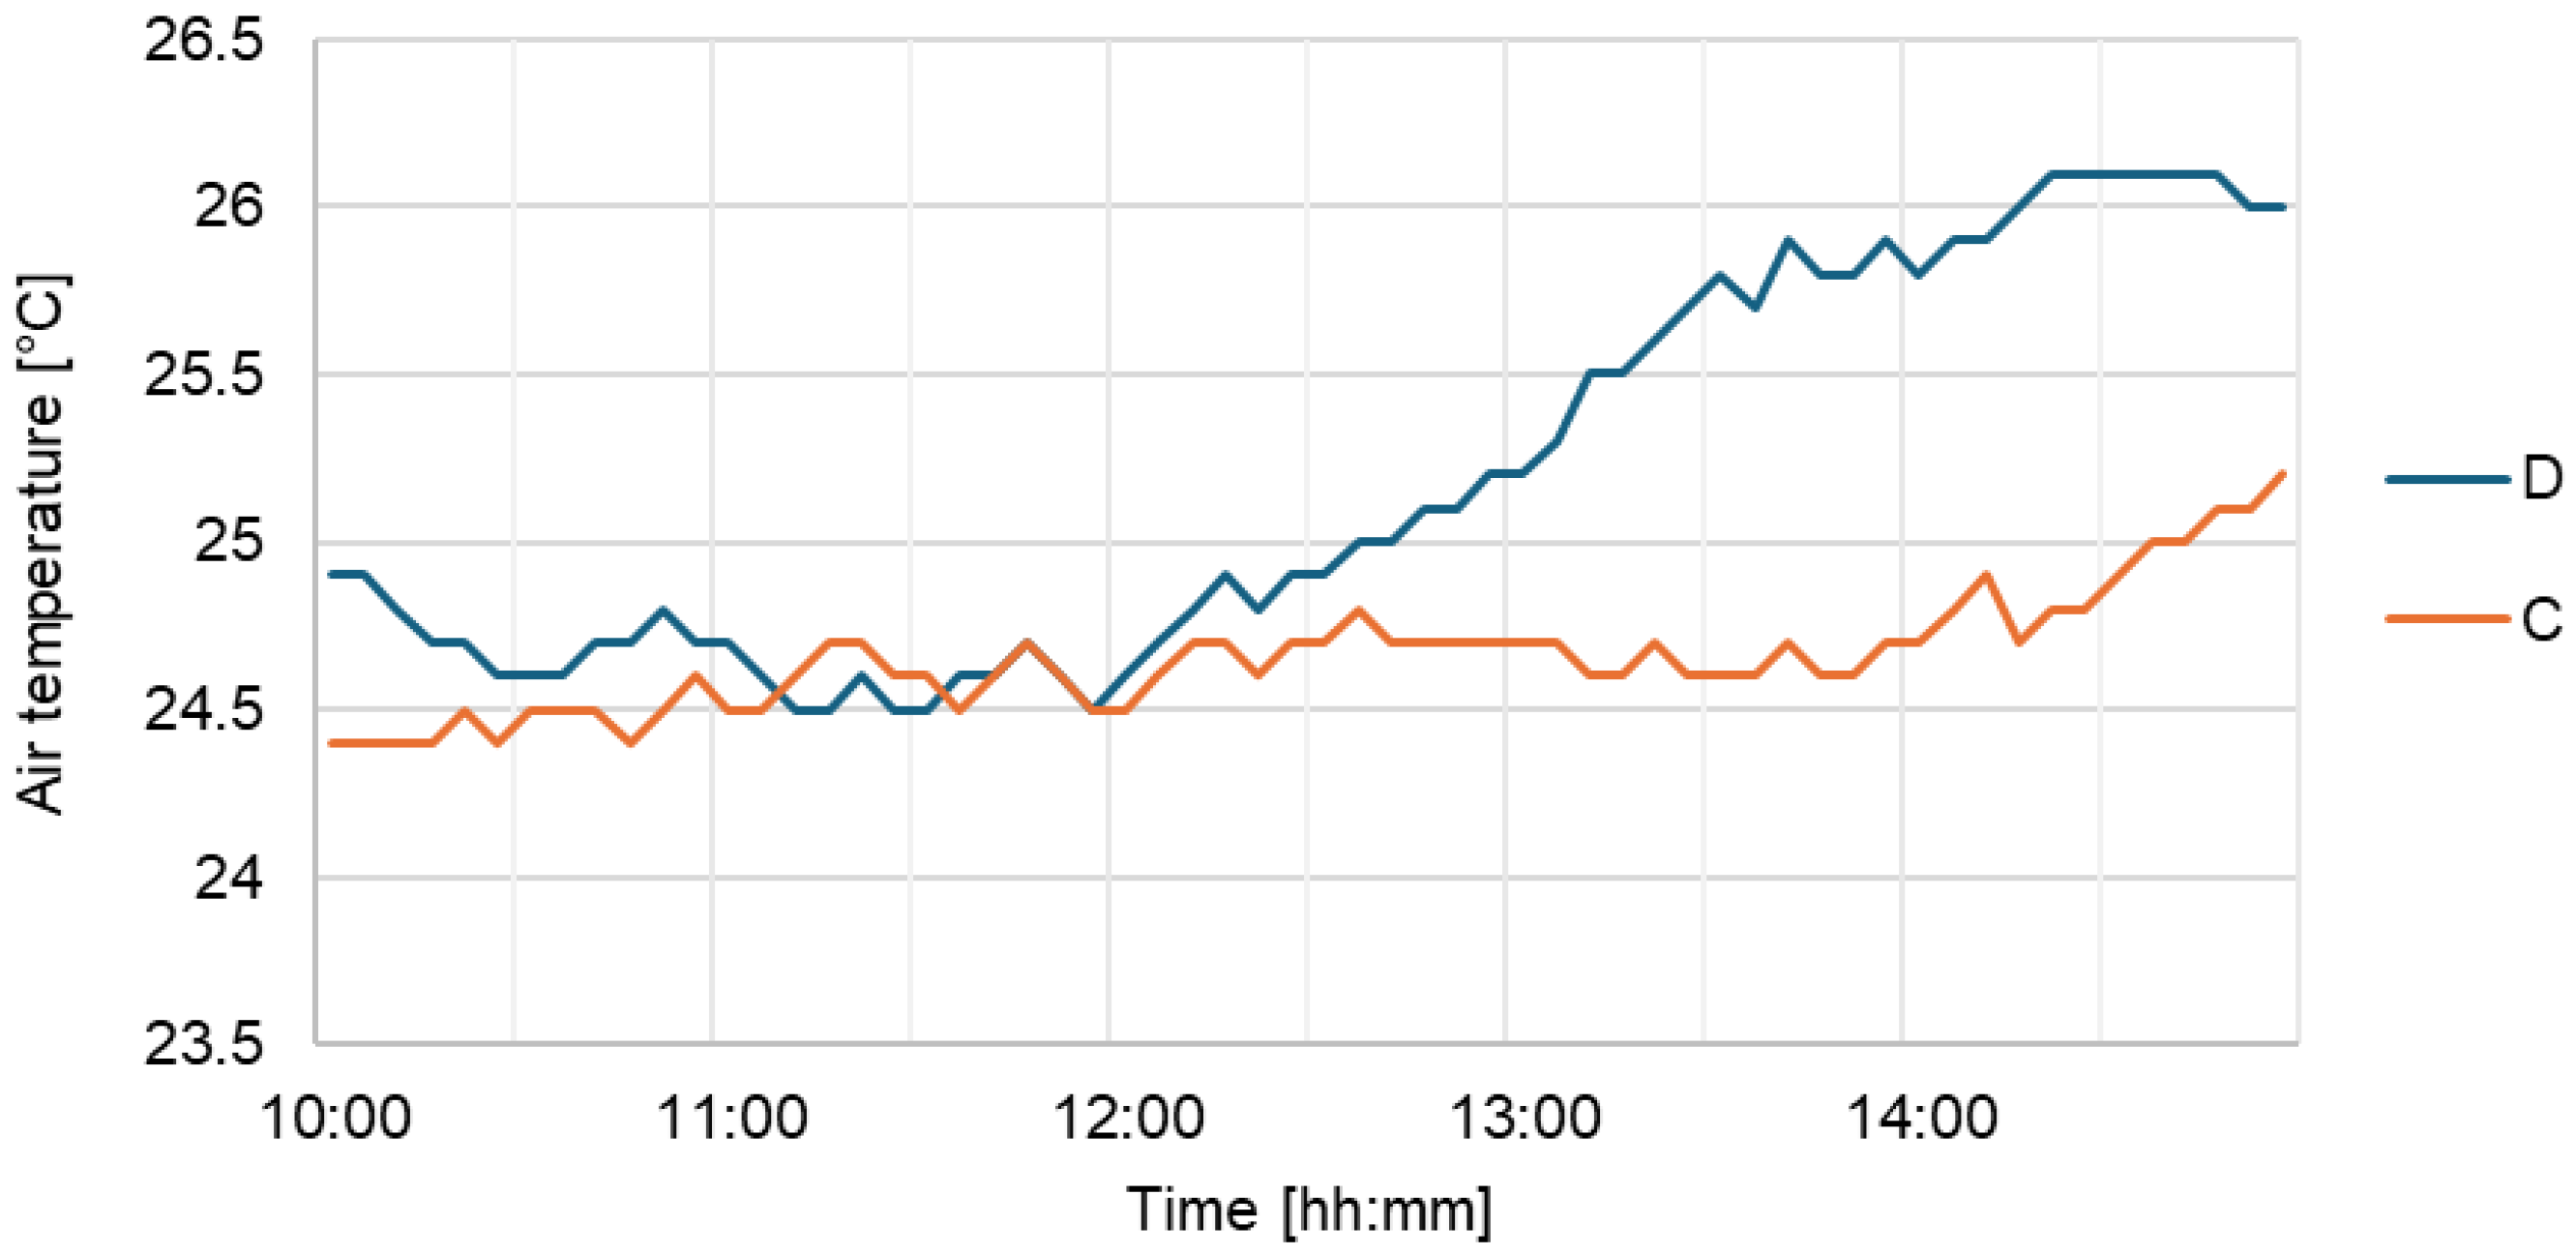
As part of the article, field measurements (in situ) were carried out to assess the actual microclimatic conditions in two selected locations within the housing estate: in a private garden (point D) and in the green common area—the estate park (point C). The study was conducted on 4 June 2025. The aim of the measurements was to compare thermal conditions in spaces with varying levels of greenery and exposure to solar radiation.
Figure 22 shows clear differences in the air temperature patterns between the two analyzed locations: the private garden and the estate park. In the initial phase of the measurements, up until around 12:00, the temperature curves follow a similar course, indicating comparable thermal conditions in the morning. However, after this time, a distinct divergence occurs—in the private garden, the temperature begins to rise sharply, reaching significantly higher values than in the park area. The maximum temperature at point D reached 26.1 °C, which was 0.9 °C higher than at point C. Similarly, the mean temperature for the entire measurement period at point D was 25.18 °C, exceeding that at point C by 0.52 °C (p < 0.01)—see Table 9. This phenomenon can be directly linked to the lack of effective shading, which leads to faster heating of both the surfaces and the surrounding air. In the case of the park, the rate of temperature increase is noticeably lower, which can be explained by the presence of tall greenery and a large share of biologically active surfaces, providing cooling through shading and transpiration. These differences confirm the significant role of greenery in mitigating thermal conditions and improving the microclimate in public spaces.

4. Discussion

The design of residential estates is a complex, interdisciplinary process that combines architecture, urban planning, infrastructure, and the social aspect, which takes into account the thermal and functional comfort of residents. Blue–green infrastructure plays an important role here, helping to mitigate the impacts of climate change in the form of sudden storms or heatwaves on hot sunny days. When designing housing estates, it is essential to consider the preferences and expectations of potential users. Such information can be obtained, for example, through housing market research using survey methods. Survey results conducted among people planning to purchase an apartment in a residential estate show that respondents prefer the presence of shared green infrastructure spaces intended for communal use (e.g., playgrounds, mini-parks). Potential residents would rather spend their free time in a green, shaded common area than in their own small, unshaded gardens, especially during hot summer days. Therefore, ensuring outdoor comfort is a crucial element in housing estate design, so that residents are not exposed to thermal stress when spending time outdoors.
For users of nearly zero-energy buildings (nZEBs), a standard in force in Poland since 2021, user comfort is just as important as low utility costs. Buildings constructed to this standard often use large glazed areas to capture free solar energy. On the one hand, this is highly beneficial for the energy balance; however, if poorly designed, it often leads to significant thermal stress and overheating, especially on warm, sunny days. In the analyzed estate, the original building design featured small cornices between floors. On the ground floor, the living room was designed with a large glazed façade. The expert team introduced a modification by adding a large terrace above the façade with an area of 14 m2.
The study was conducted during the transitional period from 30 May to 13 June 2025, when the heating and cooling systems were switched off and, thus, did not affect the indoor temperatures of the building. Figure 13 and Figure 16 present the courses of indoor temperatures in relation to outdoor temperature, determined respectively from simulations carried out at the design stage and from in situ measurements during the operational stage. The graphs clearly show heating trends inside the building during consecutive hot days with outdoor temperatures exceeding 25–30 °C, as well as cooling trends during cooler periods. Results show that in both cases, for nearly the entire analyzed period, shading the southwest-oriented glazed façade with an overhanging terrace provided slightly lower indoor temperatures in the ground-floor room compared to the room with a standard unshaded window (see Figure 13, Figure 16 and Figure 19). Despite the absence of curtains or blinds shading the glazed façade, the terrace provided sufficient protection against solar radiation, limiting daytime overheating. This suggests that introducing such additional shading devices at a later stage of the building’s operation would not significantly improve the conditions in the room already protected by the terrace, whereas a stronger effect on reducing overheating would likely be observed in the room with a standard unshaded window. In the evening and at night, the large glazed surface led to more intense cooling of the room. This effect is clearly visible in the simulated temperature profiles but much less pronounced in the experimental data. It results from the larger glazed area, characterized by poorer thermal insulation compared to solid walls, and from the phenomenon of radiative cooling through glazing. Radiative cooling occurs when heat is emitted as longwave radiation from the glass surface toward the colder night sky, lowering the indoor temperature. Due to the relatively low indoor temperatures combined with the assumed clothing level and activity, the room with the glazed façade exhibited slightly worse thermal comfort according to the PMV-PPD model (see Figure 17, Figure 18 and Figure 19) compared to the room with the standard unshaded window. Nevertheless, this indicates the potential of such a solution to maintain relatively low indoor temperatures during hotter periods of the year.
The analyses carried out at the design stage and the measurements of indoor thermal comfort showed relatively good agreement (see Figure 19). The observed discrepancies can be explained by differences between actual local meteorological conditions at the studied housing estate and those recorded at the reference weather station, the simplifications of physical reality inherent in the simulation model, and the internal accuracy limits of the simulation software. In building design simulations in Poland, standardized meteorological datasets are typically used from the nearest reference stations located within the same national climatic zone. Due to the spatial distribution of stations, the distance from the design site to the reference station may extend to several tens of kilometers. In this study, data were sourced from the nearest station, located approximately 15 km away. In the context of input data for the design phase, this can be regarded as a relatively short distance. Moreover, both the station and the study site are located in suburban areas of Kraków with a comparable level of urbanization, which supports the assumption that the selected dataset is sufficiently representative of local conditions. Studies on the representativeness of meteorological stations indicate that point-to-site distances of 1–5 km are generally recommended [37], yet distances on the order of 15 km may still provide sufficiently representative data under relatively homogeneous terrain and climatic conditions [38].
The analysis of microclimatic conditions between private garden spaces and the estate park revealed significant differences. Spending time in small gardens without tall greenery and shading is associated with noticeably reduced thermal comfort. According to the interpretive scale of the PET index, these locations are characterized by moderate to strong heat stress, which may negatively affect users’ well-being and limit their outdoor activity, particularly during midday hours. In contrast, the shared space in the form of a park, thanks to the presence of trees and an extensive biologically active surface, demonstrates the ability to stabilize temperature and reduce overheating. The analyzed measurement data clearly confirm that urban parks play an important cooling role, improving local thermal comfort compared to areas lacking vegetation. The results indicate that, from the perspective of thermal conditions, shared spaces with a high degree of greenery are more favorable for daily use during the summer season than individual gardens. In the context of further research, it is recommended to expand the scope of analysis to include different types of greenery (e.g., trees, shrubs, climbing plants) and their distribution relative to building orientation and terrain layout. Long-term measurements covering different seasons, as well as extreme events such as heatwaves, will also be important. An additional aspect worth investigating is the potential impact of supplementary window shading devices. Complementing the study with residents’ subjective thermal sensations—taking into account age, activity level, and individual preferences—could further enrich the interpretation of results and provide design recommendations for residential spaces under changing climate conditions.

5. Conclusions

This study investigated both indoor and outdoor comfort in a newly built residential estate designed to meet nZEB standards. The research combined simulation-based assessments at the design stage, in situ measurements during the operational phase, and a user survey on spatial preferences.
Results show that shading the southwest-oriented glazed façade with an overhanging terrace provided slightly lower temperatures in ground-floor rooms compared to rooms with standard unshaded windows. Outdoors, users experienced lower thermal comfort in small, unshaded gardens than in the larger, vegetated communal area (pocket park), which demonstrated greater capacity for temperature moderation and thermal stress reduction. Survey responses further indicate that potential future residents prefer the inclusion of a shared green–blue infrastructure area, even at the expense of building some housing units in semi-detached form, instead of maximizing the number of detached units with unshaded individual gardens.
Overall, the findings highlight three key messages: (1) even in highly glazed nZEB buildings, proper architectural solutions such as shading devices can help maintain acceptable indoor comfort; (2) outdoor thermal comfort is significantly improved in shaded communal green spaces compared to small private gardens; and (3) the integration of shared green–blue infrastructure not only enhances thermal resilience but is also aligned with residents’ spatial preferences. Taken together, these findings emphasize the importance of addressing both indoor and outdoor comfort in residential nZEB design, showing that technological efficiency must be complemented by user-centered design strategies. This integrated approach can improve the well-being of residents while supporting climate change adaptation in the built environment.

Author Contributions

Conceptualization, M.F.-C., M.D., A.B.-C. and T.K.; methodology, M.F.-C., E.R.-Z., M.D. and A.B.-C.; software, M.F.-C., M.D. and A.B.-C.; validation, M.F.-C., E.R.-Z., M.D. and T.K.; formal analysis, M.F.-C., E.R.-Z., M.D. and A.B.-C.; investigation, M.F.-C., E.R.-Z., M.D., A.B.-C., B.S., M.C. and T.K.; resources, M.F.-C., E.R.-Z. and T.K.; data curation, M.F.-C., M.D., A.B.-C. and B.S.; writing—original draft preparation, M.F.-C., E.R.-Z., M.D., A.B.-C., B.S., M.C. and T.K.; writing—review and editing, M.F.-C., E.R.-Z., M.D. and A.B.-C.; visualization, M.F.-C., M.D., A.B.-C., B.S. and M.C.; supervision, M.F.-C., E.R.-Z. and T.K.; project administration, M.D. and A.B.-C.; funding acquisition, M.F.-C., E.R.-Z. and T.K. All authors have read and agreed to the published version of the manuscript.

Funding

This research received no external funding.

Data Availability Statement

The data that support the findings of this study are available from the corresponding authors upon reasonable request.

Conflicts of Interest

The authors declare no conflicts of interest.

Abbreviations

The following abbreviations are used in this manuscript:
nZEBnear-zero energy building; standard applicable in the European Union
PMVpredicted mean vote
PPDpredicted percentage dissatisfied
PETphysiological equivalent temperature
UFAusable floor area
EPnon-renewable primary energy indicator
EPH+Wnon-renewable primary energy indicator for heating and ventilation
ΔEPCnon-renewable primary energy indicator for cooling
ΔEPLnon-renewable primary energy indicator for lighting

References

  1. Directive-2010/31-EN-EUR-Lex. Available online: https://eur-lex.europa.eu/eli/dir/2010/31/oj (accessed on 22 August 2024).
  2. Fanger, P.O. Thermal Comfort: Analysis and Applications in Environmental Engineering. Available online: https://archive.org/details/thermalcomfortan0000fang/page/n5/mode/2up (accessed on 17 July 2024).
  3. Baquero Larriva, M.T.; Higueras, E. Health Risk for Older Adults in Madrid, by Outdoor Thermal and Acoustic Comfort. Urban Clim. 2020, 34, 100724. [Google Scholar] [CrossRef]
  4. Rodler, A.; Leduc, T. Local Climate Zone Approach on Local and Micro Scales: Dividing the Urban Open Space. Urban Clim. 2019, 28, 100457. [Google Scholar] [CrossRef]
  5. Narodowy Bank Polski. Informacja o cenach mieszkań i sytuacji na rynku nieruchomości mieszkaniowych i komercyjnych w Polsce w I kwartale 2025 r. [Information on Housing Prices and the Situation on the Residential and Commercial Real Estate Market in Poland in the First Quarter of 2025, in Polish]; NBP: Warsaw, Poland, 2025; Available online: https://nbp.pl/wp-content/uploads/2025/06/Informacja-o-cenach-mieszkan-i-sytuacji-na-rynku-nieruchomosci-mieszkaniowych-i-komercyjnych-w-Polsce-w-I-kw.-2025-r.pdf (accessed on 23 September 2025).
  6. Chyb, A.; Sokołowski, P.; Bąk-Patyna, P. O współczesnych tendencjach kształtowania przestrzeni publicznych w obrębie osiedli mieszkaniowych [On contemporary trends in shaping public spaces within housing estates, in Polish]. Inżynieria I Bud. 2023, 79, 282–287. [Google Scholar]
  7. Vida Manzano, J.; Radicchi, A.; Xiao, J.; Szczepánska, M.; Gałecka-Drozda, A.; Wilkaniec, A. Green Space at New Housing Estates: Flat Price Versus Accessibility to Good Quality Greenery. Sustainability 2023, 15, 9997. [Google Scholar] [CrossRef]
  8. Benduch, P.; Butryn, K. Prawne i normatywne zasady obmiaru powierzchni użytkowej budynków i ich części [Legal and normative rules for measuring the usable area of buildings and their parts, in Polish]. Infrastrukt. I Ekol. Teren. Wiej. 2018, I/1, 225–238. [Google Scholar] [CrossRef]
  9. Grycuk, A.; Russel, P. Minimalna powierzchnia użytkowa nowo budowanych mieszkań w Polsce w ocenie studentów Szkoły Głównej Handlowej w Warszawie [Minimum usable floor area of newly built dwellings in Poland in the assessment of students of the Warsaw School of Economics, in Polish]. Stud. BAS 2023, 76, 123–148. [Google Scholar] [CrossRef]
  10. Oloś, G. Green Facades Support Biodiversity in Urban Environment—A Case Study from Poland. J. Water Land Dev. 2023, 59, 257–266. [Google Scholar] [CrossRef]
  11. Starczewski, T.; Rogatka, K.; Noszczyk, T.; Kukulska-Kozieł, A.; Cegielska, K. Green Spaces in Polish Large Prefabricated Housing Estates Developed in the Socialist Era. J. Hous. Built Environ. 2024, 39, 1987–2007. [Google Scholar] [CrossRef]
  12. Danek, T.; Weglinska, E.; Zareba, M. The Influence of Meteorological Factors and Terrain on Air Pollution Concentration and Migration: A Geostatistical Case Study from Krakow, Poland. Sci. Rep. 2022, 12, 11050. [Google Scholar] [CrossRef]
  13. Sekuła, P.; Bokwa, A.; Ustrnul, Z.; Zimnoch, M.; Bochenek, B. The Impact of a Foehn Wind on PM10 Concentrations and the Urban Boundary Layer in Complex Terrain: A Case Study from Kraków, Poland. Tellus B Chem. Phys. Meteorol. 2021, 73, 1933780. [Google Scholar] [CrossRef]
  14. Guergour, H.; Cheraitia, M.; Dechaicha, A.; Alkama, D. Optimization of Urban Morphology to Enhance Outdoor Thermal Comfort: A Microclimate Analysis. J. Bulg. Geogr. Soc. 2024, 51, 107–130. [Google Scholar] [CrossRef]
  15. Yilmaz, S.; Kurt, A.; Gölcü, M. ENVI-Met Simulations of the Effect of Different Landscape Design Scenarios on Pedestrian Thermal Comfort: Haydar Aliyev Street. Yuz. Yil Univ. J. Agric. Sci. 2023, 33, 338–353. [Google Scholar] [CrossRef]
  16. Xiang, Y.; Chang, D.; Cheng, J. Exploring the Correlation Between Urban Microclimate Simulation and Urban Morphology: A Case Study in Yeongdeungpo-Gu, Seoul. In Proceedings of the 2023 IEEE International Conference on Industrial Engineering and Engineering Management, IEEM, Singapore, 18–21 December 2023; pp. 1224–1228. [Google Scholar] [CrossRef]
  17. Elshabshiri, A.; Aly, M.; Alharbat, R.; Abdalla, M.J.; Alsyouf, L.; Ghanim, A.; Yahia, M.W. Enhancing the Microclimate of Outdoor Campus Spaces in Hot Humid Climates: The Example of the University of Sharjah. Comput. Urban Sci. 2025, 5, 35. [Google Scholar] [CrossRef]
  18. Tsoka, S.; Tsikaloudaki, A.; Theodosiou, T. Analyzing the ENVI-Met Microclimate Model’s Performance and Assessing Cool Materials and Urban Vegetation Applications–A Review. Sustain. Cities Soc. 2018, 43, 55–76. [Google Scholar] [CrossRef]
  19. Qin, H.; Zhou, B. Optimizing Vegetation Configurations for Seasonal Thermal Comfort in Campus Courtyards: An ENVI-Met Study in Hot Summer and Cold Winter Climates. Plants 2025, 14, 1670. [Google Scholar] [CrossRef]
  20. Zukowski, M. Study of Various Types of Glazing in a Building Constructed Using Hybrid Technology with a Large Window Area. Appl. Sci. 2025, 15, 4488. [Google Scholar] [CrossRef]
  21. Chen, H.; Nie, J.; Liu, Y.; Li, Y. Theoretical Study on Impact of Solar Radiation Heat Gain on Thermal Comfort and Energy Efficiency in Glass Curtain Wall Buildings Based on PMV Index. Buildings 2025, 15, 2228. [Google Scholar] [CrossRef]
  22. Firląg, S.; Baig, A.S.; Koc, D. Historical Analysis of Real Energy Consumption and Indoor Conditions in Single-Family Passive Building. Sustainability 2025, 17, 717. [Google Scholar] [CrossRef]
  23. Rozporządzenie Ministra Rozwoju i Technologii z dnia 31 stycznia 2022 r. zmieniające rozporządzenie w sprawie warunków technicznych, jakim powinny odpowiadać budynki i ich usytuowanie [Regulation of the Minister of Development and Technology of 31 January 2022 Amending the Regulation on Technical Conditions to be Met by Buildings and Their Location, in Polish]. Journal of Laws of 2022, Item 248. Available online: https://isap.sejm.gov.pl/isap.nsf/DocDetails.xsp?id=WDU20220000248 (accessed on 22 August 2024).
  24. Szymańska, E.J.; Kubacka, M.; Woźniak, J.; Polaszczyk, J. Analysis of Residential Buildings in Poland for Potential Energy Renovation toward Zero-Emission Construction. Energies 2022, 15, 9327. [Google Scholar] [CrossRef]
  25. Skrzyniowska, D. Parameters of indoor air residental and non-residental buildings (thermal comfort). Czas. Tech. Sr. 2012, 109, 15–35. [Google Scholar]
  26. Google Maps. Aerial View of the Area at Coordinates 50.0885675 N, 19.9719989 E (Kraków, Poland) [Map]. n.d. Available online: https://www.google.com/maps/@50.0885675,19.9719989,9717m/data=!3m1!1e3?entry=ttu (accessed on 2 July 2025).
  27. Kowalska-Koczwara, A.; Pachla, F.; Tatara, T.; Fedorczak-Cisak, M. Measurement and Interpretation Methodology for Determining Comfort in Passive Buildings and NZEB Buildings. In Proceedings of the IOP Conference Series: Materials Science and Engineering, Prague, Czech Republic, 17–21 June 2019; Institute of Physics Publishing: Bristol, UK, 2019; Volume 603, p. 042036. [Google Scholar] [CrossRef]
  28. Instytut Meteorologii i Gospodarki Wodnej—Państwowy Instytut Badawczy. Charakterystyka Wybranych Elementów Klimatu w Polsce w 2023 Roku—Podsumowanie [Characteristics of Selected Climate Elements in Poland in 2023—Summary, in Polish]. Available online: https://www.imgw.pl/wydarzenia/charakterystyka-wybranych-elementow-klimatu-w-polsce-w-2023-roku-podsumowanie (accessed on 22 July 2025).
  29. Instytut Meteorologii i Gospodarki Wodnej—Państwowy Instytut Badawczy. Klimat w Polsce [Climate in Poland, in Polish]. Available online: https://klimat.imgw.pl/ (accessed on 22 July 2025).
  30. EN ISO 7730:2005; Ergonomics of the Thermal Environment—Analytical Determination and Interpretation of Thermal Comfort Using Calculation of the PMV and PPD Indices and Local Thermal Comfort Criteria. International Organization for Standardization: Geneva, Switzerland, 2005.
  31. EN 16798-1:2019; Energy Performance of Buildings—Ventilation for Buildings—Part 1: Indoor Environmental Input Parameters for Design and Assessment of Energy Performance of Buildings Addressing Indoor Air Quality, Thermal Environment, Lighting and Acoustics—Module M1-6. European Committee for Standardization: Brussels, Belgium, 2019.
  32. EN ISO 7726:2002; Ergonomics of the Thermal Environment—Instruments for Measuring Physical Quantities (ISO 7726:1998). International Organization for Standardization: Geneva, Switzerland, 2002.
  33. Monam, A.; Rückert, K. The Dependence of Outdoor Thermal Comfort on Urban Layouts; Young Cities Developing Urban Energy Efficiency: Tehran, Iran, 2013. [Google Scholar] [CrossRef]
  34. Höppe, P. The Physiological Equivalent Temperature—A Universal Index for the Biometeorological Assessment of the Thermal Environment. Int. J. Biometeorol. 1999, 43, 71–75. [Google Scholar] [CrossRef] [PubMed]
  35. Niu, J.; Liu, J.; Lee, T.C.; Lin, Z.; Mak, C.M.; Tse, T.K.T.; Tang, B.S.; Kwok, K.C.S. A New Method to Assess Spatial Variations of Outdoor Thermal Comfort: Onsite Monitoring Results and Implications for Precinct Planning. Build. Environ. 2015, 91, 263–270. [Google Scholar] [CrossRef]
  36. Reis, C.; Lopes, A. Evaluating the Cooling Potential of Urban Green Spaces to Tackle Urban Climate Change in Lisbon. Sustainability 2019, 11, 2480. [Google Scholar] [CrossRef]
  37. Gao, K.; Feng, J.; Yao, L.; Lau, K.; Ng, E. Ensuring Accurate Microclimate Research: How to Select Representative Meteorological Data of Local Climate in Microclimate Studies. Build. Environ. 2025, 267, 112166. [Google Scholar] [CrossRef]
  38. Chen, L.; Wang, K. Decreasing Representativeness Scale of Nighttime Surface Temperature of Meteorological Stations in China from 2001 to 2021. J. Geophys. Res. Atmos. 2025, 130, e2024JD041969. [Google Scholar] [CrossRef]
Figure 1. Design and implementation criteria for nZEB housing estates that are climate-neutral and comfortable for users [own source].
Energies 18 05209 g001
Figure 2. Location of the experimental residential development in relation to the city center of Kraków. Author’s own study based on [26].
Energies 18 05209 g002
Figure 3. Visualization of the designed residential development [author’s own source].
Energies 18 05209 g003
Figure 4. Ground floor plan of the building with designated locations for indoor thermal comfort measurements (point A—room with a large glass façade, point B—room with a medium-sized window) [own source].
Energies 18 05209 g004
Figure 5. Annual average temperature in Poland (2015–2024) [°C] [own source].
Energies 18 05209 g005
Figure 6. Urban layout of a single-family residential estate with small private gardens (approx. 118 m2 to 226 m2), type A (without a shared green area) [own source].
Energies 18 05209 g006
Figure 7. Urban layout of a single-family residential estate, type B (with a shared green area). Locations of outdoor thermal comfort measurements are marked (C—in the communal green space/mini-park; D—in a small private garden) [own source].
Energies 18 05209 g007
Figure 8. Sensors included in the microclimate meter (indoor thermal comfort measurement) [own source].
Energies 18 05209 g008
Figure 9. Preparation for in situ measurements of microclimatic parameters: (a) in the room with a large glazed façade; (b) in the room with a standard-sized window [own source].
Energies 18 05209 g009
Figure 10. View of the sensors of the portable weather station.
Energies 18 05209 g010
Figure 11. Distribution of respondents’ answers regarding preferred outdoor spaces for spending free time (n = 85) [own source].
Energies 18 05209 g011
Figure 12. Distribution of respondents’ answers regarding estate layout preferences (n = 85) [own source].
Energies 18 05209 g012
Figure 13. Simulated indoor temperature in the room with large glazing (point A) and in the room with a window (point B) in relation to outdoor temperature during the period 30 May–13 June 2025.
Energies 18 05209 g013
Figure 14. The results of the design-stage analysis of the PPD comfort index in the room with large glazing (point A) and in the room with a window (point B) during the period 30 May–13 June 2025.
Energies 18 05209 g014
Figure 15. The results of the design-stage analysis of the PMV comfort index in the room with large glazing (point A) and in the room with a window (point B) during the period 30 May–13 June 2025.
Energies 18 05209 g015
Figure 16. Results of indoor temperature measurements in the room with large glazing (point A) and in the room with a window (point B), along with the outdoor temperature, recorded during the period 30 May–13 June 2025.
Energies 18 05209 g016
Figure 17. Results of the PPD comfort index measurements in the room with large glazing (point A) and in the room with a window (point B) during the period 30 May–13 June 2025.
Energies 18 05209 g017
Figure 18. Results of the PMV comfort index measurements in the room with large glazing (point A) and in the room with a window (point B) during the period 30 May–13 June 2025.
Energies 18 05209 g018
Figure 19. Distribution of values for selected microclimate parameters at points A and B for the design-stage analysis (a) and the in situ measurements during the operational stage (e).
Energies 18 05209 g019
Figure 20. Computer simulation results for measurement points C and D.
Energies 18 05209 g020
Figure 21. Values of the PET index over time at point C (orange) and point D (blue)—design stage.
Energies 18 05209 g021
Figure 22. Air temperature measured in situ in the estate park (point C—orange) and in the private garden (point D—blue).
Energies 18 05209 g022
Table 1. Thermal insulation parameters of the building envelope achieved in the analyzed building, along with the minimum values specified in [23], confirming the Polish requirements for the nZEB standard of single-family residential buildings. Values of heat transfer coefficients U [W/m2K].
NoBuilding PartitionU-Value Parameter [W/(m2K)]Maximum U-Value Parameter [W/(m2K)] Characterizing the Polish nZEB Standard for Single-Family Residential Buildings
1External wall0.170.20
2Roof0.140.15
3Ground floor0.250.30
4WindowsUg = 0.78; Uf = 0.820.90
5Doors1.01.3
Table 2. Non-renewable primary energy index (EP) indicator for heating and ventilation (EPH+W), cooling (ΔEPC), and lighting (ΔEPL) achieved in the analyzed building, along with the maximum values specified in [23], confirming the Polish requirements for the nZEB standard of single-family residential buildings.
NoNon-Renewable Primary Energy Indicator EPEP [kWh/(m2·Year)] of the Analyzed BuildingMaximum EP Value [kWh/(m2·Year)] Characterizing the Polish nZEB Standard for Single-Family Residential Buildings
1EPH+W44.9570.00
2ΔEPC0.00ΔEPC = 5 · UFAC/UFA *
3ΔEPL0.00ΔEPL = 0.00
4SUM EP44.95
* where UFA—floor area of rooms with regulated air temperature (heated or cooled). UFAC—floor area of rooms with regulated air temperature (cooled). If the building is equipped with a cooling system; otherwise, ΔEPC = 0 kWh/(m2·year).
Table 3. Thermal comfort scale [30].
ScaleThermal Perception
+3Very hot
+2Hot
+1Warm
0Comfortable
−1Cool
−2Cold
−3Very cold
Table 4. Specification of sensors in the thermal comfort measurement device [32].
Measured ParameterMeasurement RangeResolutionAccuracy
Temperature−20 °C ÷ +50 °C (wet thermometer 0 °C ÷ +50 °C)0.01 °C±0.4 °C
Temperature of the blackened sphere−20 ÷ +50 °C0.01 °C±0.4 °C
Relative humidity (RH)0 ÷ 100% RH0.1% RH ±2% RH
Air velocity (Va) (thermoanemometer)0 ÷ 5 m/s0.01 m/sfor 0 ÷ 1 m/s ±0.05 + 0.05 Va m/s, for 1 ÷ 5 m/s ±0.05 + 0.05 Va m/s
Table 5. Specification of the weather station sensors.
Measured ParameterMeasurement RangeResolutionAccuracy
Temperature−40 °C ÷ +65 °C0.1 °C±0.5 °C
Relative humidity (RH)0 ÷ 100%1% RH±2 ÷ 3% RH
Wind speed0.5 ÷ 89 m/s0.1 m/s±0.5 m/s
Wind direction0° ÷ 360°±3°
Atmospheric pressure540 ÷ 1100 hPa0.1 hPa±1.0 hPa
Solar radiation0 ÷ 1800 W/m21 W/m2±5%
UV radiation0–16 UV index0.1 UV±5%
Table 6. PET thermal stress perception scale [36].
PET [°C]Physiological Stress Grade
13–18slight cold stress
18–23no thermal stress
23–29slight heat stress
29–35moderate heat stress
35–41strong heat stress
41–46extreme heat stress (level 1)
46–51extreme heat stress (level 2)
51–56extreme heat stress (level 3)
>56extreme heat stress (level 4)
Table 7. Descriptive statistics of selected microclimate parameters at points A and B for the design-stage analysis and the in situ measurements during the operational stage.
PointT
Min [°C]
T Mean
(SD; 95% CI) [°C]
T
Max [°C]
PMV MinPMV Mean (SD; 95% CI)PMV MaxPPD Min [%]PPD Mean
(SD; 95% CI) [%]
PPD Max [%]
design-stage analysis
A19.0121.7 (1.46; 21.63 ÷ 21.77)24.94−1.76−0.98 (0.39;
−1.00 ÷ −0.96)
−0.115.2528.03 (15.18; 27.35 ÷ 28.72)65.14
B20.1522.24 (1.21; 22.18 ÷ 22.29)24.94−1.47−0.87 (0.34;
−0.89 ÷ −0.86)
−0.225.9623.23 (12.49; 22.67 ÷ 23.80)49.69
in situ measurements during the operational stage
A18.4421.58 (1,31; 21.52 ÷ 21.63)24.31−1.50−0.63 (0.36;
−0.65 ÷ −0.62)
0.175.0016.02 (10.87; 15.53 ÷ 16.52)51.00
B18.6921.83 (1.30; 21.77 ÷ 21.89)25.00−1.43−0.60 (0.35;
−0.61 ÷ −0.58)
0.235.0014.97 (10.11; 14.52 ÷ 15.43)47.00
Table 8. Descriptive statistics of the PET index at point C and point D—design stage.
PointPET
Min [°C]
PET Mean
(SD; 95% CI) [°C]
PET
Max [°C]
C28.7834.47 (4.67; 31.33 ÷ 37.60)41.82
D31.2443.84 (7.80; 38.61 ÷ 49.08)51.83
Table 9. Descriptive statistics of the air temperature measured in situ at point C and point D.
PointT
Min [°C]
T Mean
(SD; 95% CI) [°C]
T
Max [°C]
C24.4024.66 (0.18; 24.40 ÷ 25.20)25.20
D24.5025.18 (0.58; 24.50 ÷ 26.10)26.10
Disclaimer/Publisher’s Note: The statements, opinions and data contained in all publications are solely those of the individual author(s) and contributor(s) and not of MDPI and/or the editor(s). MDPI and/or the editor(s) disclaim responsibility for any injury to people or property resulting from any ideas, methods, instructions or products referred to in the content.