Article

A Dual-Layer Optimal Operation of Multi-Energy Complementary System Considering the Minimum Inertia Constraint

1
Power Dispatch and Control Center Guangxi Power Grid Co., Ltd., Nanning 530013, China
2
School of Electrical Engineering, Guangxi University, Nanning 530004, China
3
State Grid Henan Electric Power Company, Zhoukou 466000, China
*
Author to whom correspondence should be addressed.
Energies 2025, 18(19), 5202; https://doi.org/10.3390/en18195202
Submission received: 26 August 2025 / Revised: 20 September 2025 / Accepted: 24 September 2025 / Published: 30 September 2025

Abstract

The large-scale utilization of wind and solar energy is crucial for achieving carbon neutrality targets. However, as extensive wind and solar power generation is integrated via power electronic devices, the inertia level of power systems continues to decline. This leads to a significant reduction in the system’s frequency regulation capability, posing a serious threat to frequency stability. Optimizing the system is an essential measure to ensure its safe and stable operation. Traditional optimization approaches, which separately optimize transmission and distribution systems, may fail to adequately account for the variability and uncertainty of renewable energy sources, as well as the impact of inertia changes on system stability. Therefore, this paper proposes a two-layer optimization method aimed at simultaneously optimizing the operation of transmission and distribution systems while satisfying minimum inertia constraints. The upper-layer model comprehensively optimizes the operational costs of wind, solar, and thermal power systems under the minimum inertia requirement constraint. It considers the operational costs of energy storage, virtual inertia costs, and renewable energy curtailment costs to determine the total thermal power generation, energy storage charge/discharge power, and the proportion of renewable energy grid connection. The lower-layer model optimizes the spatiotemporal distribution of energy storage units within the distribution network, aiming to minimize total network losses and further reduce system operational costs. Through simulation analysis and computational verification using typical daily scenarios, this model enhances the disturbance resilience of the transmission network layer while reducing power losses in the distribution network layer. Building upon this optimization strategy, the model employs multi-scenario stochastic optimization to simulate the variability of wind, solar, and load, addressing uncertainties and correlations within the system. Case studies demonstrate that the proposed model not only effectively increases the integration rate of new energy sources but also enables timely responses to real-time system demands and fluctuations.

1. Introduction

Currently, the escalating energy crisis underscores the imperative of harnessing abundant renewable energy as an effective solution to global energy demand challenges. However, the integration of most renewable energy sources into the power grid through power electronic devices is causing a decline in the inertia level of the power system, posing a severe threat to frequency stability [1,2]. Additionally, the high uncertainty of wind and solar power outputs presents new challenges to system inertia and frequency stability. In recent years, insufficient inertia in power systems due to the large-scale integration of wind and solar power has led to sharp drops in system frequency, resulting in numerous major power outages [3,4]. Therefore, to ensure the stable operation of high-penetration renewable energy power systems, it is crucial to address the issues of low inertia and frequency security during the integration of renewable energy. The coordinated operation of multi-energy complementary systems is an effective approach to addressing the aforementioned challenges. By optimizing the allocation structure and operational strategies of various energy sources, system stability and disturbance resistance can be significantly enhanced [5,6,7].
Furthermore, accurately assessing the inertia of the power system and the required minimum inertia, determining appropriate dispatch strategies to ensure that the total inertia level of the system does not fall below the predetermined minimum value, is also an important measure to ensure the stable and economical operation of the system. To this end, scholars have conducted extensive research on the optimization dispatch strategies of power systems considering frequency security stability and inertia requirements. Reference [8] proposes a simplified dynamic frequency response model to derive an analytical expression for the minimum frequency point. Although incorporating inertia constraints, it treats inertia as constant, failing to obtain an analytical expression for inertia demand and instead focusing on the analysis of primary frequency regulation resource requirements. Reference [9] builds upon [8] by addressing the issue of fixed inertia constraints, thereby formulating a dispatch scheme that satisfies inertia requirements. The frequency response models employed in these references are overly simplistic and fail to accurately capture the actual dynamics of frequency response. At the transmission network level, reference [10] linearizes dynamic frequency constraints, using the post-disturbance minimum frequency as the constraint, to construct an optimized model for unit combinations, effectively improving the stability of large-scale wind power penetration systems. Reference [11] considers the correlation between inertia and frequency change rate, analyzing and calculating the minimum inertia during peak and non-peak loads to enhance the frequency stability of the Bali power system. References [12,13] established a frequency-secure constrained dispatch model incorporating inertia support provided by wind turbines. Simulation validation demonstrated that the proposed strategy significantly enhances active grid support performance. Reference [14] decouples frequency stability constraints into minimum inertia evaluation and optimization operation, ensuring system frequency stability through the inclusion of minimum inertia constraints. The aforementioned literature has conducted in-depth research on the optimization dispatch problem with frequency constraints and inertia requirements, but mostly from the perspective of system stability and dispatch operating costs at the transmission network level, with little focus on energy storage configuration at the distribution network level. However, introducing virtual inertia into the power system requires additional equipment, increasing the operating costs of the system. Therefore, it is important to consider the economic operation of the system not only at the main grid level but also to optimize the spatial distribution and output of energy storage at the distribution network level to reduce the overall operating costs of the system.
Therefore, Reference [15] constructs a dual-layer optimization model considering the characteristics of mixed energy storage, achieving optimal location and capacity determination for mixed energy storage in distributed power systems to enhance the economic and stable operation of the distribution network. Reference [16] addresses the issue of improving system reliability and reducing operating costs through a two-stage energy storage optimization configuration method that comprehensively considers distribution network reliability and economic efficiency, analyzing the impact of different blackout risk prices on planning results. Reference [17] proposes a time-series simulation-based coordinated optimization configuration method for multi-source complementary power systems’ energy storage capacity, optimizing the capacity of various energy storage devices to enhance the economic and environmental performance of system operation. However, these studies often neglect the coupling between wind and solar power generation and fail to consider how to improve the system’s resilience in energy storage optimization configuration. Moreover, the aforementioned literature has rarely set constraints on the rate of change of frequency (ROCOF), leaving room for further optimization and refinement.
To address the challenges posed by renewable energy grid integration, this study focuses on resolving two key issues: firstly, the high proportion of new energy sources reduces system inertia, threatening frequency stability; secondly, the randomness and volatility of wind and photovoltaic power generation increase operational uncertainty within the system. To tackle these problems, this paper proposes a two-layer optimization model for transmission and distribution systems that incorporates minimum inertia constraints. Its principal contributions are as follows:
(1)
Consider the coupling of wind and photovoltaic power generation by analyzing their joint output through time-varying Copula functions to generate specific scenarios. Simultaneously, linearize the frequency dynamic response curve of the perturbed system to derive an expression for the minimum synchronous inertia requirement that satisfies both the maximum frequency change rate and frequency deviation constraints. Establish the relationship between system frequency security metrics and inertia.
(2)
In terms of optimization methodology, a two-layer optimization model for transmission and distribution systems incorporating minimum inertia constraints has been developed. Compared to centralized single-layer optimization approaches, the two-layer scheme offers greater flexibility and efficiency in computational complexity and solution quality, better addressing challenges posed by renewable energy integration. Unlike conventional two-layer optimization, this model concurrently addresses large-scale dispatch issues in transmission networks and local distribution problems in distribution networks. Its core advantage lies in balancing economic operation optimization with system stability assurance, thereby providing a more comprehensive solution. The upper-layer optimization focuses on the transmission network, establishing a coordinated optimization dispatch model for wind, solar, thermal, and storage resources to minimize daily operational costs while meeting minimum inertia requirements. The lower-layer optimization targets the distribution network, minimizing total network losses through optimized energy storage deployment. These two layers are synergistically coupled to enhance renewable energy integration, reduce operational configuration costs, and ensure system stability.
(3)
In addressing uncertainty, a multi-scenario stochastic optimization strategy is employed in day-ahead scheduling to manage the volatility of wind power, photovoltaic generation and load fluctuations, thereby achieving more refined and flexible power system dispatch.
Finally, the effectiveness and correctness of the proposed method were validated through practical case studies.

2. Dual-Layer Optimization Architecture of the Power Transmission and Distribution System

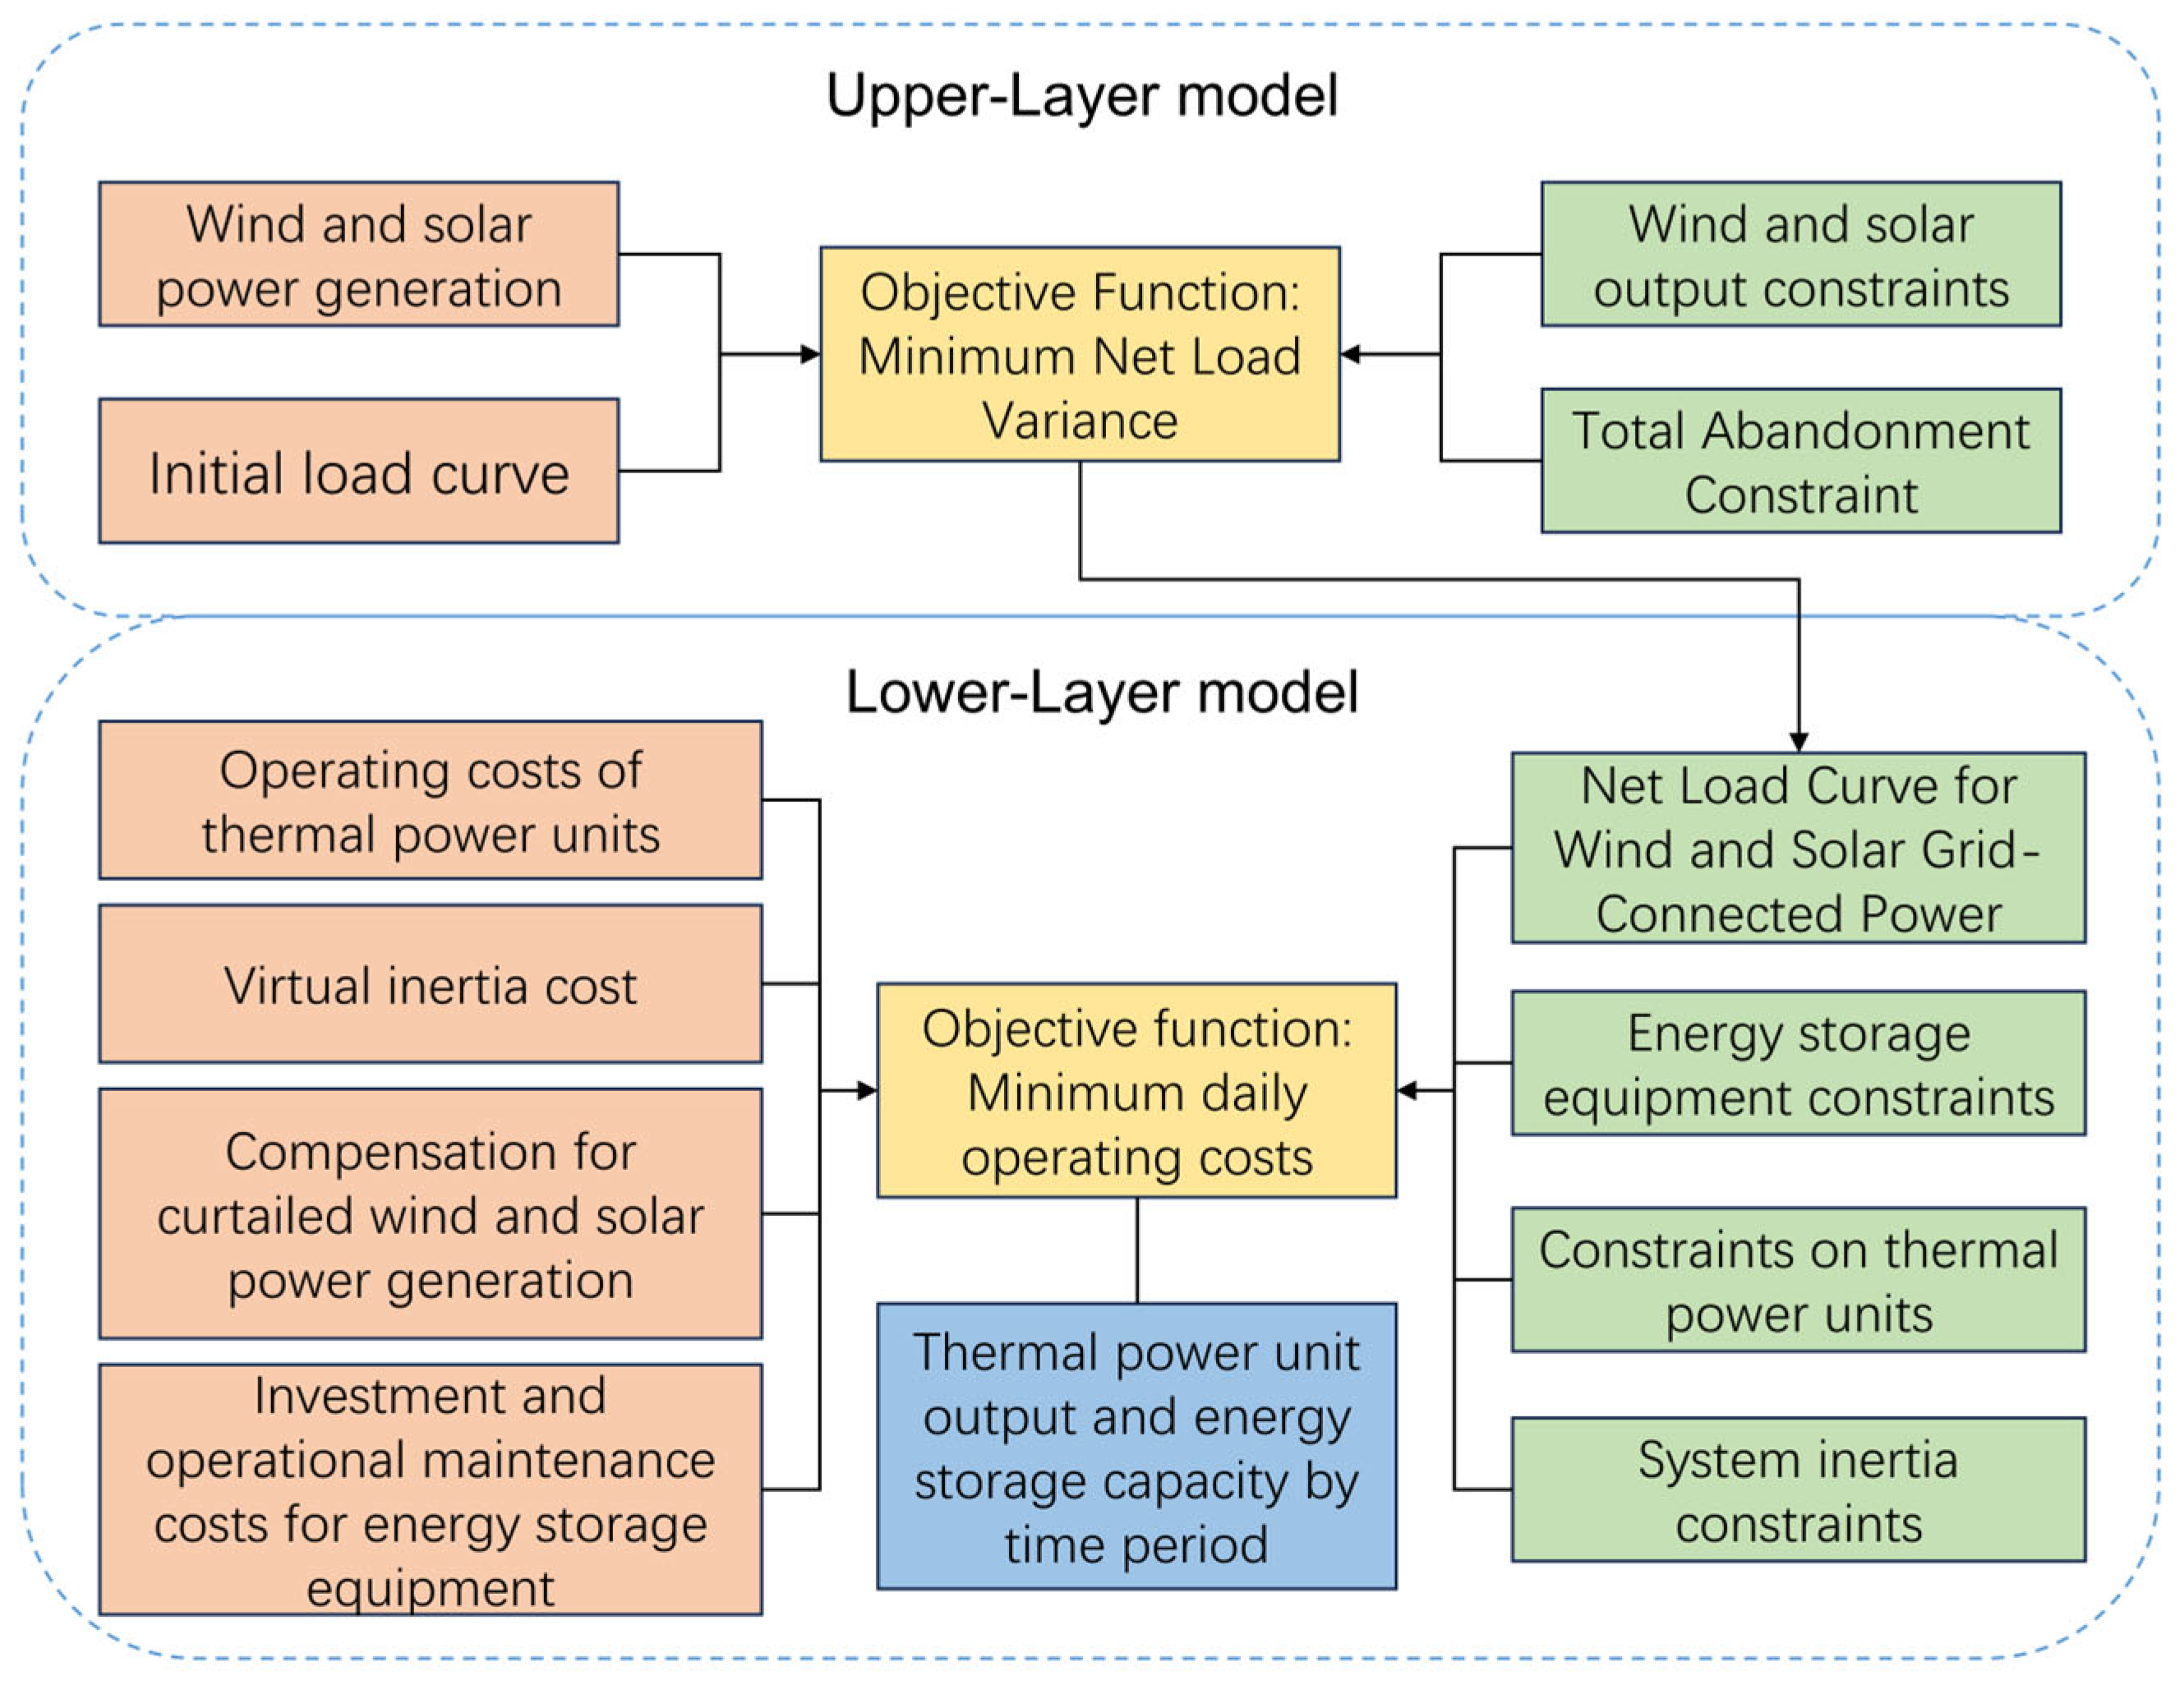
The dual-layer optimization architecture of this study is illustrated in Figure 1. The transmission network layer mainly consists of thermal power, wind power, photovoltaic power, and energy storage. The system’s inertia is primarily provided by thermal power units. Additionally, wind power and photovoltaics, in conjunction with energy storage units, can provide virtual inertia. At the transmission network level, the minimum inertia requirements for each time period are calculated. It is required that the system’s inertia at each moment exceeds the corresponding demand value. This constraint is added to the optimization scheduling model to ensure the safe and stable operation of the system. At the distribution network level, the total charging and discharging load of the energy storage devices need to be optimally distributed to the nodes of the distribution network based on the power supply situation of the transmission network and the spatial distribution of the energy storage devices in the distribution network. The coupled operation of the transmission and distribution systems can make the entire system more economically stable.

3. Description of Wind and Solar Power Output Characteristics and Generation of Typical Scenarios

Traditional static copula functions can characterize the correlation between wind and solar power outputs. However, the production of wind and solar energy is jointly influenced by multiple time-varying factors such as seasonality, diurnal cycles, and weather system transitions, meaning their dependency structure is not constant. During system operation, wind and photovoltaic power outputs exhibit temporal correlation and complementarity [18]. Given this, employing an optimal approach is prudent. Based on optimality criteria, the optimal Copula function is selected for the time-varying N-Copula function. Its core performance advantage lies in the fact that the Copula function parameter ρ is no longer a constant but a function varying with time t or state variables (such as time periods, forecast output levels, etc.), denoted as ρ t . The expression for the time-varying N-Copula function is as follows [18]:
C N ( u , v ; ρ N , t ) = Φ 1 ( u ) Φ 1 ( v ) 1 2 π 1 ρ N , t 2 e s 2 2 ρ N , t s t + t 2 2 ( 1 ρ N , t 2 ) d s d t
In the equation, u and v represent the marginal distribution functions of wind and solar power outputs; s and t are variables related to the distribution functions; Φ−1(·) denotes the inverse function of the standard normal distribution; the evolution equation for the correlation parameter ρ N , t is given by [18]
ρ N , t = Λ [ ω N + β N ρ N , t 1 + α N q i = 1 q Φ 1 ( u t i ) Φ 1 ( v t i ) ]
In the expression, Λ · is defined as: Λ ( x )   =   1 e x 1 + e x , with the aim of ensuring that the correlation coefficient ρ N , t always remains within the interval (−1, 1); ω N , β N and α N are parameters of the time-varying equation; q represents the lag order and is typically chosen as q ≤ 10.
In assessing the linear relationship between wind and solar power generation, the Pearson correlation coefficient represents a simpler approach. However, compared to traditional linear correlation metrics such as the Pearson correlation, time-varying N-Copula functions more accurately capture the nonlinear, time-dependent structure between wind and solar outputs. They demonstrate superior capability in characterizing the complementarity and uncertainty inherent in wind-solar systems. Therefore, based on annual historical data for wind and solar energy, time-varying N-Copula functions were employed to analyze and characterize their output characteristics. Inverse transformations were performed using cubic spline interpolation to generate wind and solar output values accounting for time-varying correlations and complementarity. Subsequently, scenario simplification was achieved through synchronous reverse substitution, yielding a specific number of representative scenarios [19].

4. Minimum Inertia Requirements for the System

4.1. Inertia in Power Systems

The inertia in a power system refers to its ability to resist external disturbances or internal faults, preventing excessive frequency deviations and ensuring the safe and stable operation of the system. To enhance the frequency response capability of renewable energy generator units, virtual synchronous machine technology is employed to improve the control strategy of converters. This modification equips them with inertia response capability, enabling them to provide virtual inertia support to the grid [20]. The virtual inertia of wind turbines primarily stems from the rotational inertia of their blades. Photovoltaic generation units, together with energy storage devices, collectively form a photovoltaic virtual synchronous machine. Additionally, energy storage devices not only increase the system’s inertia support capacity but also facilitate the rapid suppression of frequency fluctuations after the integration of renewable energy into the grid. The inertia of a unit can be characterized by the inertia time constant H, defined as the ratio of the kinetic energy E k of the unit at rated speed to its rated capacity SB [21], namely:
H = E k S B
If the power grid consists of m synchronous generator units and n renewable energy units, the total kinetic energy of the system is given by
E k = i = 1 m H G i S G i τ G i + j = 1 n H N j S N j τ N j
In the expression, H G i and S G i represent the inertia time constant and rated capacity of synchronous generator i; H N j and S N j represent the inertia time constant and grid capacity of renewable energy unit j; τ represents the on/off state of the unit (1 for running, 0 for shutdown).
Substituting Equation (4) into Equation (3), we can derive the equivalent inertia time constant of the system during time period t as
H t = i = 1 m H G i S G i τ G i + j = 1 n H N j S N j τ N j i = 1 m S G i τ G i + j = 1 n S N j τ N j

4.2. Frequency Security Constraints in the System

The frequency variation in the system, following a disturbance, can be divided into processes such as inertia response, primary frequency control, secondary frequency control, etc. [22]. Through virtual inertia technology, wind and solar power units can participate in the primary frequency control of the system. The key frequency indicators in the system include steady-state frequency deviation, frequency nadir deviation, and the Rate of Change of Frequency (RoCoF). Steady-state frequency deviation is determined by the magnitude of power imbalance and the primary frequency control of the units, independent of the system’s inertia level. However, frequency nadir deviation and RoCoF depend not only on the primary frequency control capability of the units but also on the influence of the system’s inertia [23]. Frequency deviation represents the maximum frequency deviation during transient processes, whilst the rate of frequency change reflects the speed at which frequency varies. Both metrics are crucial for assessing a system’s dynamic stability when subjected to sudden load changes or other transient events.

4.2.1. RoCoF Constraints

When the balance between the mechanical power and electromagnetic power of a generator is disrupted, it leads to fluctuations in the system frequency. The rate of frequency change reflects the speed at which a system’s frequency varies per unit time. A high rate of frequency change indicates that the system experiences rapid frequency fluctuations when subjected to external disturbances or imbalances. This may lead to system instability or compromise operational safety. Consequently, the rate of frequency change serves as a critical metric for evaluating a system’s responsiveness to diverse operational conditions and emergency scenarios. Under the assumption of considering only inertia response and primary frequency control, the frequency response process of the system can be represented by the rotor motion equation of the equivalent generator units:
2 H f N d Δ f d t = Δ P G Δ P L D Δ f
In the equation, H is the system equivalent inertia time constant; f N is the rated frequency of the system; Δ f is the frequency deviation; ΔPG and ΔPL are the incremental power of the generator units and load; D is the damping coefficient.
At the initial moment when the system is disturbed, the power imbalance in the system reaches its maximum value. At this time, ∆PG|t=0 = 0 can be expressed as the maximum rate of change of frequency:
R o C o F max = d Δ f Δ t | t = 0 + = f N Δ P L 2 H

4.2.2. Frequency Nadir Deviation Constraints

After experiencing a significant power loss, the frequency of the power grid will drop, undergo oscillations, and eventually reach a new steady state. In the process of oscillation, the system will pass through the point of lowest frequency, known as the frequency nadir. The frequency nadir is a crucial indicator that measures the power system’s ability to withstand power disturbances and ensure safety. If the frequency nadir is too low, it may lead to instability in the system frequency, trigger protective devices such as low-frequency load shedding or high-frequency machine tripping, and even result in system faults or widespread power outages. Therefore, maintaining the minimum frequency at a reasonable level is of paramount importance for ensuring the reliability of the power supply.
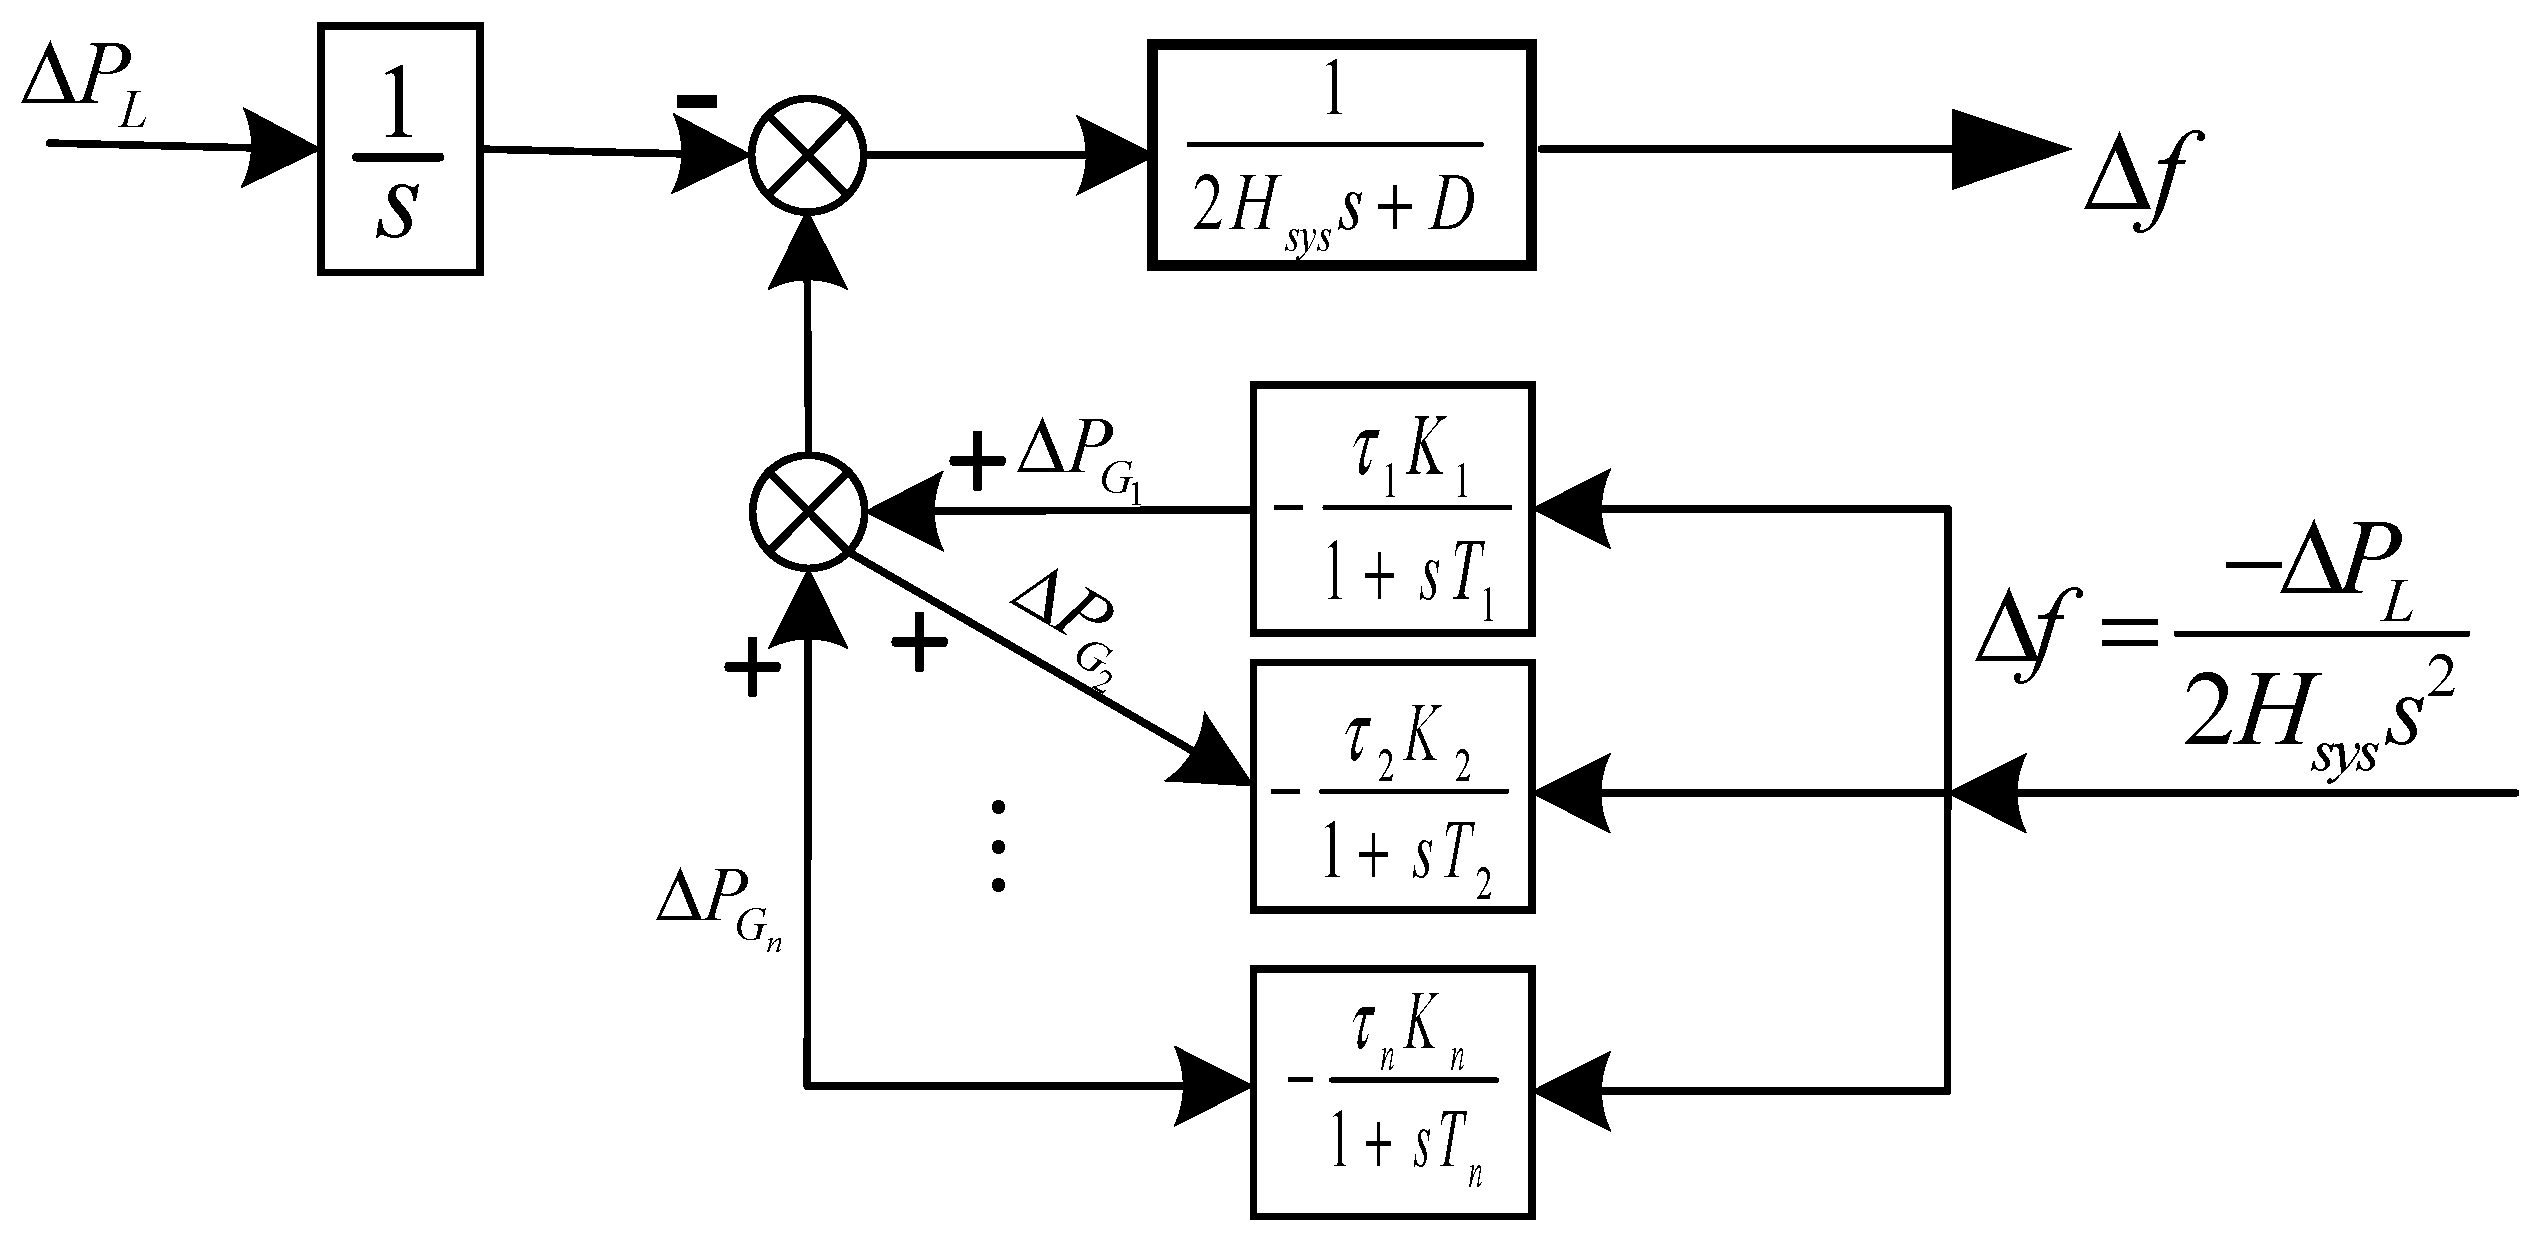
Each generator unit can be simulated using a first-order inertia link, representing the dynamic process of the prime mover and governor. The average frequency response model of a multi-machine system is established as shown in Figure 2 [24]:
In the figure, s represents the operator in the frequency domain. τ i represents the on/off state of the synchronous machine, K i and K j are the frequency-watt characteristic coefficients of the synchronous machine and renewable energy unit, T i are the inertia time constants of the governor response for the synchronous machine and renewable energy unit, respectively.
The mechanical power increment of the primary frequency response for the synchronous units in Figure 2 can be expressed as
Δ P G i ( s ) = τ i K i 1 + s T i Δ f ( s )
By simultaneously neglecting the damping effects of the load as shown in Figure 2, the expression for the frequency response is obtained as
Δ f ( t ) = Δ P L 2 H s y s s 2
By combining Equation (9) with Figure 2, the frequency response is decoupled into an open-loop representation, as illustrated in Figure 3.
From Figure 3, the following can be obtained:
Δ P i = Δ f τ i K i 1 + s T i = Δ P L 2 H s y s s 2 τ i K i 1 + s T i Δ P j = Δ f τ j K j 1 + s T j = Δ P L 2 H s y s s 2 τ j K j 1 + s T j
By performing the inverse Laplace transform on Equation (10) and incorporating Equation (6) along with the methodology in [25], the system’s post-disturbance frequency nadir f min and the time to reach the nadir t min can be derived as follows:
f min = f 0 Δ P L 2 i = 1 n C i f N t min = 2 H i = 1 n C i
In the equation, f 0 is the initial frequency of the system; f N is the rated frequency of the system; n and m are the numbers of synchronous machines and renewable energy units, respectively. The coefficients are C i = τ i K i ( 1 T i t min ( 1 e t min T i ) ) .
In practical operation, to prevent triggering the low-frequency load shedding safety device, it is necessary to ensure that the system’s minimum frequency f n a d i r does not fall below a predetermined threshold, namely
f n a d i r f min
In the equation, f min denotes the lower frequency threshold for triggering low-frequency load reduction.

4.3. Minimum Inertia Constraints in the System

The dynamic frequency constraints of the system shall satisfy
R o C o F R o C o F max f min f n a d i r
To ensure the stability of the system operation, the system inertia must be higher than the minimum inertia restricted by frequency stability [25]. This means:
H H R o C o F = Δ P L 2 R o C o F max f N H H Δ f = Δ P L t min 4 ( f 0 f min ) f N
Therefore, the critical inertia is
H min = max { Δ P L 2 R o C o F max f N , Δ P L t min 4 ( f 0 f min ) f N }
To ensure the safe and stable operation of the system while meeting dynamic frequency constraints, it is necessary to have H t H min , where
H t = i = 1 m H G i S G i τ G i + j = 1 n H N j S N j τ N j i = 1 m S G i τ G i + j = 1 n S N j τ N j H min

5. Dual-Layer Optimization Scheduling Model for Multi-Energy Complementary Systems Considering Minimum Inertia Constraints

Dual-layer optimization theory is an important theoretical framework used to describe an optimization problem with two hierarchical levels [26]. In dual-layer optimization theory, there are two decision-makers, typically referred to as the upper layer and the lower layer. Each layer has its own objective functions and constraints, and they interact and influence each other during the optimization process. The dual-layer optimization model constructed in this paper involves two levels: the transmission network and the distribution network, each responsible for optimization scheduling and load flow optimization tasks, respectively. In the upper-layer optimization operation model, the goal is to minimize the annual operating cost of the multi-energy complementary system by optimizing the equipment on/off and output under typical scenarios. The lower-layer load flow optimization model aims to minimize the total network loss by optimizing the assembly of energy storage devices. As shown in Figure 4:

5.1. Upper-Layer Optimization Operation Model

The upper-level optimization in this paper corresponds to day-ahead optimization, with the objective of coordinating the output of conventional generators, wind power, photovoltaic (PV) systems, and energy storage devices to enhance the overall economic efficiency. The goal is to minimize daily operational costs while considering the system’s inherent constraints and the minimum inertia requirements. This approach provides an optimal 24-h operation schedule for the system under the given scenario.

5.1.1. Upper-Layer Objective Function

F u p = min ( F c + F q + F g + F b )
In the equation, F c is the operating cost of thermal power units in yuan; F q is the penalty cost for wind and solar curtailment in yuan; F g is the investment cost for increasing virtual inertia in yuan; F b is the investment and maintenance cost of energy storage devices in yuan.
The operating cost of the thermal power units ( F c ) is given by
F c = [ i = 1 N ( t = 1 T C i ( P i , t ) τ i + C i U + C i D ) ] C i P i , t = a i P i , t 2 + b i P i , t + c i
In the equation, C i is the fuel cost for the i-th thermal power unit; P i , t is the output power of the i-th thermal power unit in time period t; τ i is the on/off state of the i-th unit; C i U and C i D are the start-up and shut-down costs, respectively, for the i-th thermal power unit; a i , b i , c i are the coal consumption coefficients for the i-th thermal power unit.
The penalty cost for wind and solar curtailment ( F q ) is given by
F q = C w i n d , q + C p v , q C w i n d , q = t = 1 T λ w w ( t ) C p v , q = t = 1 T λ p v p ( t )
In the equation, C w i n d , q and C p v , q are the penalty costs for wind and solar curtailment; λ w and λ p v are the unit costs of wind and solar curtailment; w ( t ) and p ( t ) are the curtailed wind and solar amounts in time period t.
The investment cost for increasing virtual inertia ( F g ) is given by
F g = C w 365 i ( i + 1 ) T w ( i + 1 ) T w 1 Δ H
In the equation, C w is the unit cost of configuring virtual inertia; i is the annual interest rate; T w is the expected lifespan of the added virtual inertia devices; ∆H is the additional virtual inertia required to meet the inertia demand [27].
The investment and maintenance cost of energy storage devices ( F b ) is given by
F b = η P P b a t , max + η S E b a t , max T s + M b a t
In the equation, η P and η S are the power cost and capacity cost of the energy storage device, respectively, with units of yuan/kW and yuan/kWh; P b a t , max and E b a t , max are the maximum charge/discharge power and maximum capacity of the energy storage device; T s is the expected number of days the energy storage device is used; M b a t is the daily maintenance cost of the energy storage device.

5.1.2. Constraint Conditions

Power Balance Constraint
i = 1 N P i , t + P w i n d , t + P p v , t + P c h a , t = i = 1 N L P d , t + P d i s , t
In the equation, P i , t , P w i n d , t and P p v , t are the output powers of thermal power units, wind power plants, and photovoltaic stations in time period t; P d , t is the load demand in time period t.
Spinning Reserve Constraint
i = 1 N ( P i , max τ i , t P i , t ) ρ i = 1 N L P d , t
In the equation, P i , max is the maximum output limit for unit i ; ρ is the thermal reserve coefficient.
Generator Output Constraint
P i , min P i , t P i , max 0 P w i n d P w i n d , max r e 0 P p v P p v , max r e
In the equation, P i , min and P i , max represent the lower and upper limits, respectively, of the output for the i-th thermal power generation unit; P w i n d , m a x r e and P p v , m a x r e correspondingly denote the forecasted output upper limits for the wind farm and photovoltaic power station during time period t.
Unit ramping constraint
P i , t P i , t 1 τ i , t 1 R u S i , u + S i , u P i , t 1 P i , t τ i , t R d S i , d + S i , d
In the equation, R u and R d represent the ascent and descent rates, respectively, for the i-th thermal power generation unit; S i , u and S i , d denote the maximum startup ascent rate and maximum shutdown descent rate, respectively, for the i-th thermal power generation unit.
Constraints on Unit Start-up and Shutdown
k = t t + T S 1 1 τ i , k T S τ i , t 1 τ i , t k = t t + T O 1 τ i , k T O τ i , t τ i , t 1
In the equation, TS and TO represent the minimum shutdown and startup times, respectively, for the i-th thermal power generation unit.
Energy Storage Operation Constraints
E b a t , max = α P b a t , max E b a t , t = E b a t , t 1 + ( η d i s P d i s , t 1 η c h a P c h a , t ) Δ t E 0 = μ E b a t , max 10 % E b a t , max E b a t , t 90 % E b a t , max 0 P d i s , t τ d i s , t P b a t , max 0 P c h a , t τ c h a , t P b a t , max τ d i s , t + τ c h a , t 1 τ d i s , t { 0 , 1 } , τ c h a , t { 0 , 1 }
In the equation, P d i s , t and P c h a , t represent the charging/discharging power of the energy storage system in time period t; τ d i s , t and τ c h a , t are variables with values ranging from 0 to 1, ensuring that the energy storage device can only charge or discharge at any given moment within the scheduling period; P b a t , max is the maximum charging/discharging power of the energy storage; α is a fixed ratio coefficient between the power limit and capacity of the energy storage; E b a t , max is the maximum capacity of the energy storage; Δ t represents the time step, typically set to 1 h in the context; E 0 is the initial energy storage level; η d i s and η c h a denote the charging and discharging efficiency of the energy storage, respectively [28].
System Inertia Constraints
H t H min

5.2. Subordinate Optimization Configuration Strategy

The upper-level optimization operational model determines the output of generation units, wind and photovoltaic power, and the charging/discharging status of energy storage devices at the transmission network level. At the distribution network level, based on the power supply conditions from the transmission network and the configured capacity of energy storage devices, an optimization of power flow distribution is carried out to optimally allocate energy storage devices to various nodes.

5.2.1. Subordinate Objective Function

Typically, distribution network operators aim to strategically allocate energy storage devices to the most suitable nodes to improve power flow distribution and reduce overall network losses in the distribution grid. Therefore, the subordinate optimization dispatch model sets the reduction of total network losses in the distribution grid as its optimization objective, aiming to optimally allocate energy storage devices across distribution network nodes [29]. The objective function of the subordinate optimization dispatch strategy can be expressed as
F d o w n = min u , v L t P L o s s , u v P L o s s , u v = t = 1 T G u v ( V u , t 2 + V v , t 2 2 V u , t V v , t cos δ u v , t )
In the equation, F d o w n represents the network losses in the distribution system; Lt is the set of distribution system lines; P L o s s , u v denotes the network losses in the distribution system after the integration of energy storage devices. G u v represents the line conductance between node u and node v; V u , t and V v , t represent the voltage magnitudes at nodes u and v during time period t, respectively; δ u v , t represents the voltage phase angle difference between node u and node v during time period t.

5.2.2. Constraint Conditions

P G u , t + P d u , t = P D u , t + P c u , t + P T u , t Q G u , t Q D u , t Q T u , t = 0 V u , min V u , t V u , max | P u v , t | P u v , max 0 P c u , t + P d u , t P u , max P u v , t = G u v V u , t V v , t cos δ u v , t + B u v V u , t V v , t sin δ u v , t G u v , t V u , t 2
In the equation, P G u , t represents the active power output of the active power source at node u during time period t; P d u , t represents the discharge power of the energy storage device at node u during time period t; P D u , t is the active load of node u in time period t; P c u , t represents the charging power of the energy storage device at node u during time period t; P T u , t is the active power transmitted from node u in time period t; Q G u , t is the reactive power generated by source i in time period t; Q D u , t is the reactive load of node u in time period t; Q T u , t is the reactive power transmitted from node u in time period t; V u , min and V u , max are the minimum and maximum allowable voltage values at node u; P u v , max is the maximum power that can be transmitted between node u and node v; P u , max is the maximum capacity of the energy storage system that can be simultaneously connected to the grid at node u. B u v represents the line susceptance between node u and node v.

5.3. Analysis of Source-Load Uncertainty and Correlation

The foregoing content explores a dual-layer optimization strategy. Whilst this approach significantly enhances the stability of power systems, challenges persist in ensuring both the secure and economical operation of the system due to the high uncertainty and volatility of wind and solar power generation. Consequently, an analysis of source-load uncertainty has been conducted. During the day-ahead scheduling phase, a multi-scenario stochastic optimization method is employed to characterize the uncertainty associated with wind, solar, and load.

5.3.1. Scene Generation

In power system analysis, wind and solar power generation output alongside electricity load typically comprise two components: one being a deterministic forecast value, the other an uncertain forecast error. The sum of these two components constitutes the comprehensive forecast for wind and solar output and load. That is
P w , t = P w , t p r e + δ w , t P p , t = P p , t p r e + μ p , t P l , t = P l , t p r e + ζ l , t
In the formula, P w , t p r e , P p , t p r e and P l , t p r e denote the forecast values for wind power, photovoltaic power, and load, respectively, determined at time period t; δ w , t , μ p , t , and ζ l , t represent the uncertain forecast errors.
Based on historical wind conditions, load data, and forecast errors, these are employed as inputs for the Copula function. Given that non-parametric kernel density estimation requires no assumptions about the distribution form of the data and exhibits high accuracy, adopting this method for datasets with substantial sample sizes can enhance efficiency while yielding relatively precise results. Taking wind power forecast errors as an example, the expression for non-parametric kernel density estimation is
f t ( δ t ) = 1 n h i = 1 n K ( δ t X i , t h )
In the equation, f t ( δ t ) is the probability density function of wind power output; n denotes the total sample size; h represents the window width; K(•) is the kernel function, commonly the Gaussian kernel; X i , t is the prediction error of wind power output at time t on day i. Integrating the probability density function generated by Equation (32) yields the marginal distribution function.

5.3.2. Latin Hypercube Sampling

Based on the aforementioned joint distribution function, Latin Hypercube Sampling (LHS) is employed to generate a series of prediction error scenarios meeting predefined conditions. LHS constitutes an efficient statistical method designed to estimate model outputs within a multidimensional parameter space by generating sample points.
The LHS process comprises two principal steps: sampling and arrangement. A schematic representation of the LHS is shown in Figure 5.
Suppose there are N sets of data concerning wind power, photovoltaic output, and load forecasting errors. For each set, the values at any time t within the 24-h period are denoted as K 1 , K 2 , …, K N . Through data analysis and fitting, the cumulative distribution function for K N can be obtained as follows:
F N = F N ( K N )

6. Case Study Analysis

This paper employs an enhanced six-unit, thirty-node configuration. The system comprises six thermal power units, one wind farm, and one photovoltaic power station. The parameters of the thermal power units are detailed in Table 1 and Table 2. The upper-layer model parameters are: maximum permissible wind and solar curtailment rate of 0.1%. The lower-layer model parameters are: reference frequency set at 50 Hz, maximum rate of change of frequency ( R o C o F max ) set at −1 Hz/s, and low-frequency load shedding action threshold set at 0.8 Hz, resulting in a minimum frequency threshold f min = 49.2 Hz. Both wind farms and photovoltaic power stations have a capacity of 500 MW. The unit cost of wind curtailment is 300 yuan/MW, while the unit cost of solar curtailment is 600 yuan/MW. The virtual inertia constants for wind and photovoltaic power are set at 4.2 s and 3 s, respectively. The cost of augmented virtual inertia is 400 yuan/MW, with a lifespan of 10 years and an annual interest rate of 5%. The operational range for energy storage is set at 10–90% of capacity, with an initial storage level of 20%. The capital cost of energy storage equipment is 1000 yuan/kWh, the power cost is 1500 yuan/kW, and the operational and maintenance cost is 72 yuan/(year·kW). The lifecycle of the energy storage facility is 8 years. Compensation costs for incentive-based demand response are uniformly set at 120 yuan/MWh. The scheduling time scale is 24 h with a scheduling duration of 1 h. This optimized scheduling problem is solved using the CPLEX solver via the YALMIP toolbox in MATLAB R2022a.
To better highlight the focus of this study and assess the practical applicability of the proposed model, the following assumptions are made:
  • It is assumed that the forecasts for wind and photovoltaic (PV) generation are highly accurate, with any potential forecast errors being neglected in this analysis.
  • It is assumed that the energy storage systems operate stably, unaffected by external factors such as temperature and humidity.

6.1. Simulation Analysis of the Transmission Network

This study employs two comparative scenarios to validate the effectiveness and correctness of the proposed model:
Scenario 1: Without inertia constraints.
Scenario 2: With minimum inertia constraints.
The combined scheduling results and the dynamic frequency response of both scenarios are compared. Optimization computations for the two scenarios are contrasted, and a detailed analysis is presented as follows.

6.1.1. Analysis of Generator Outputs and System Operation Costs

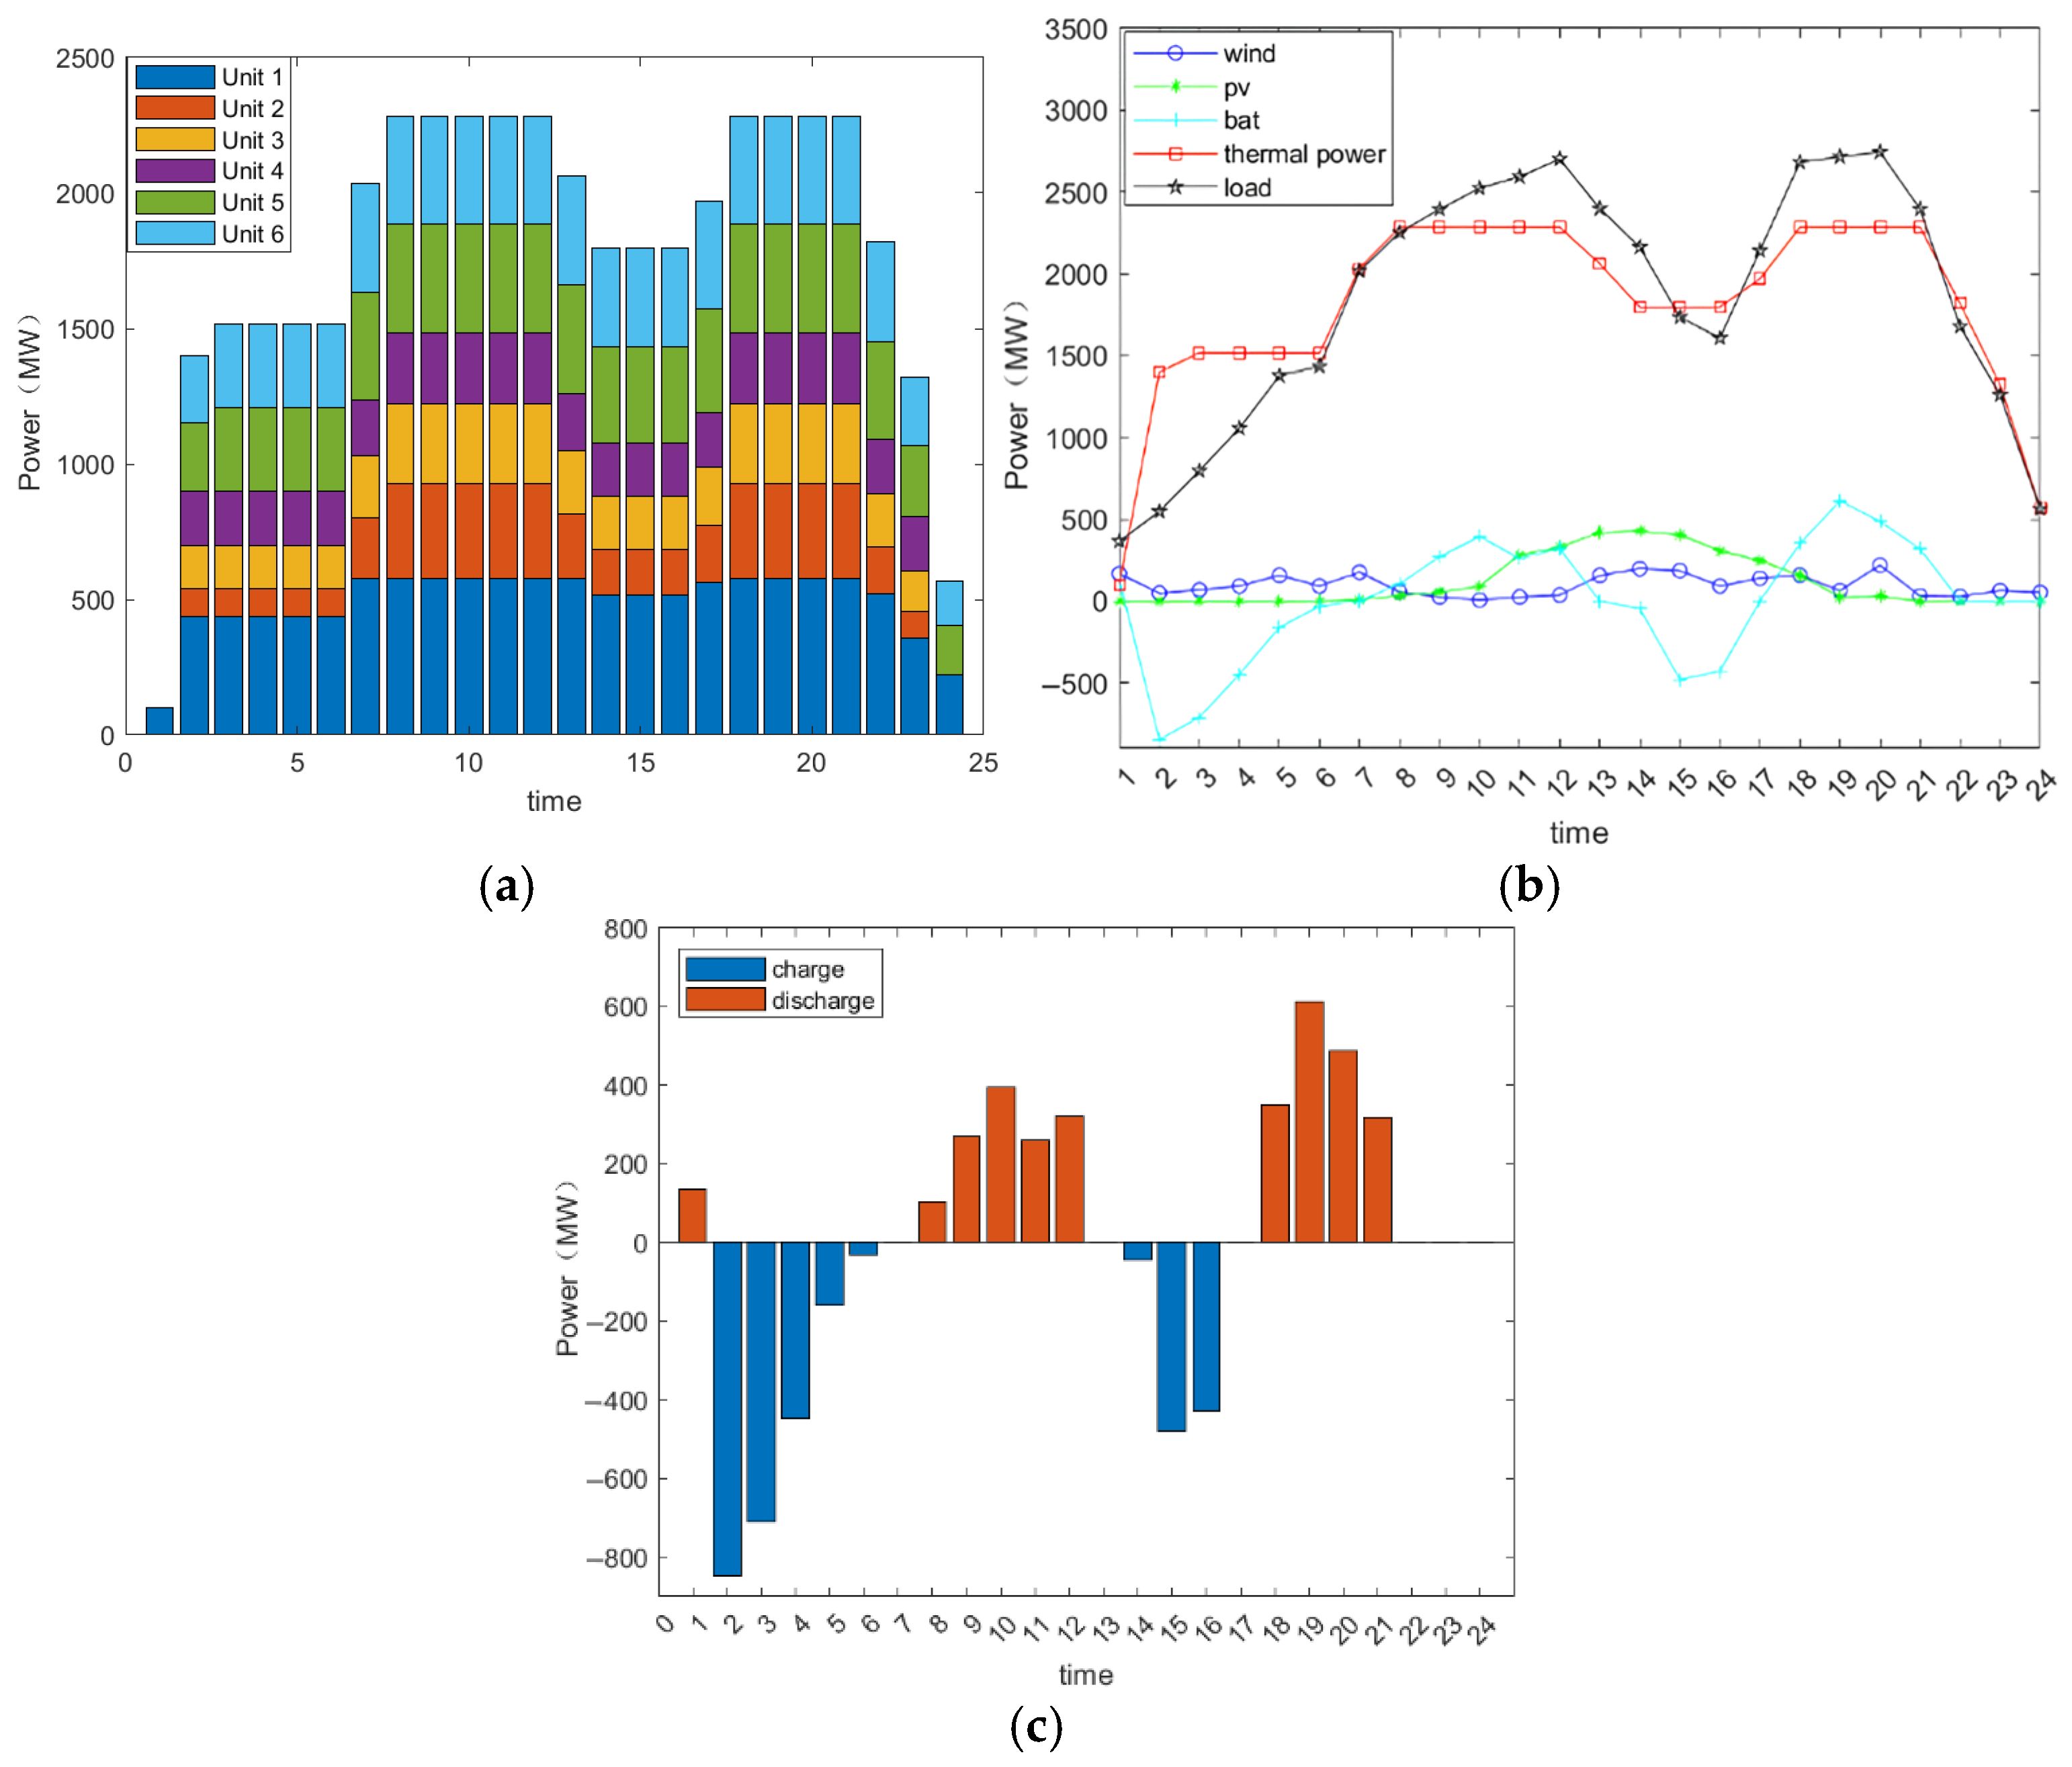
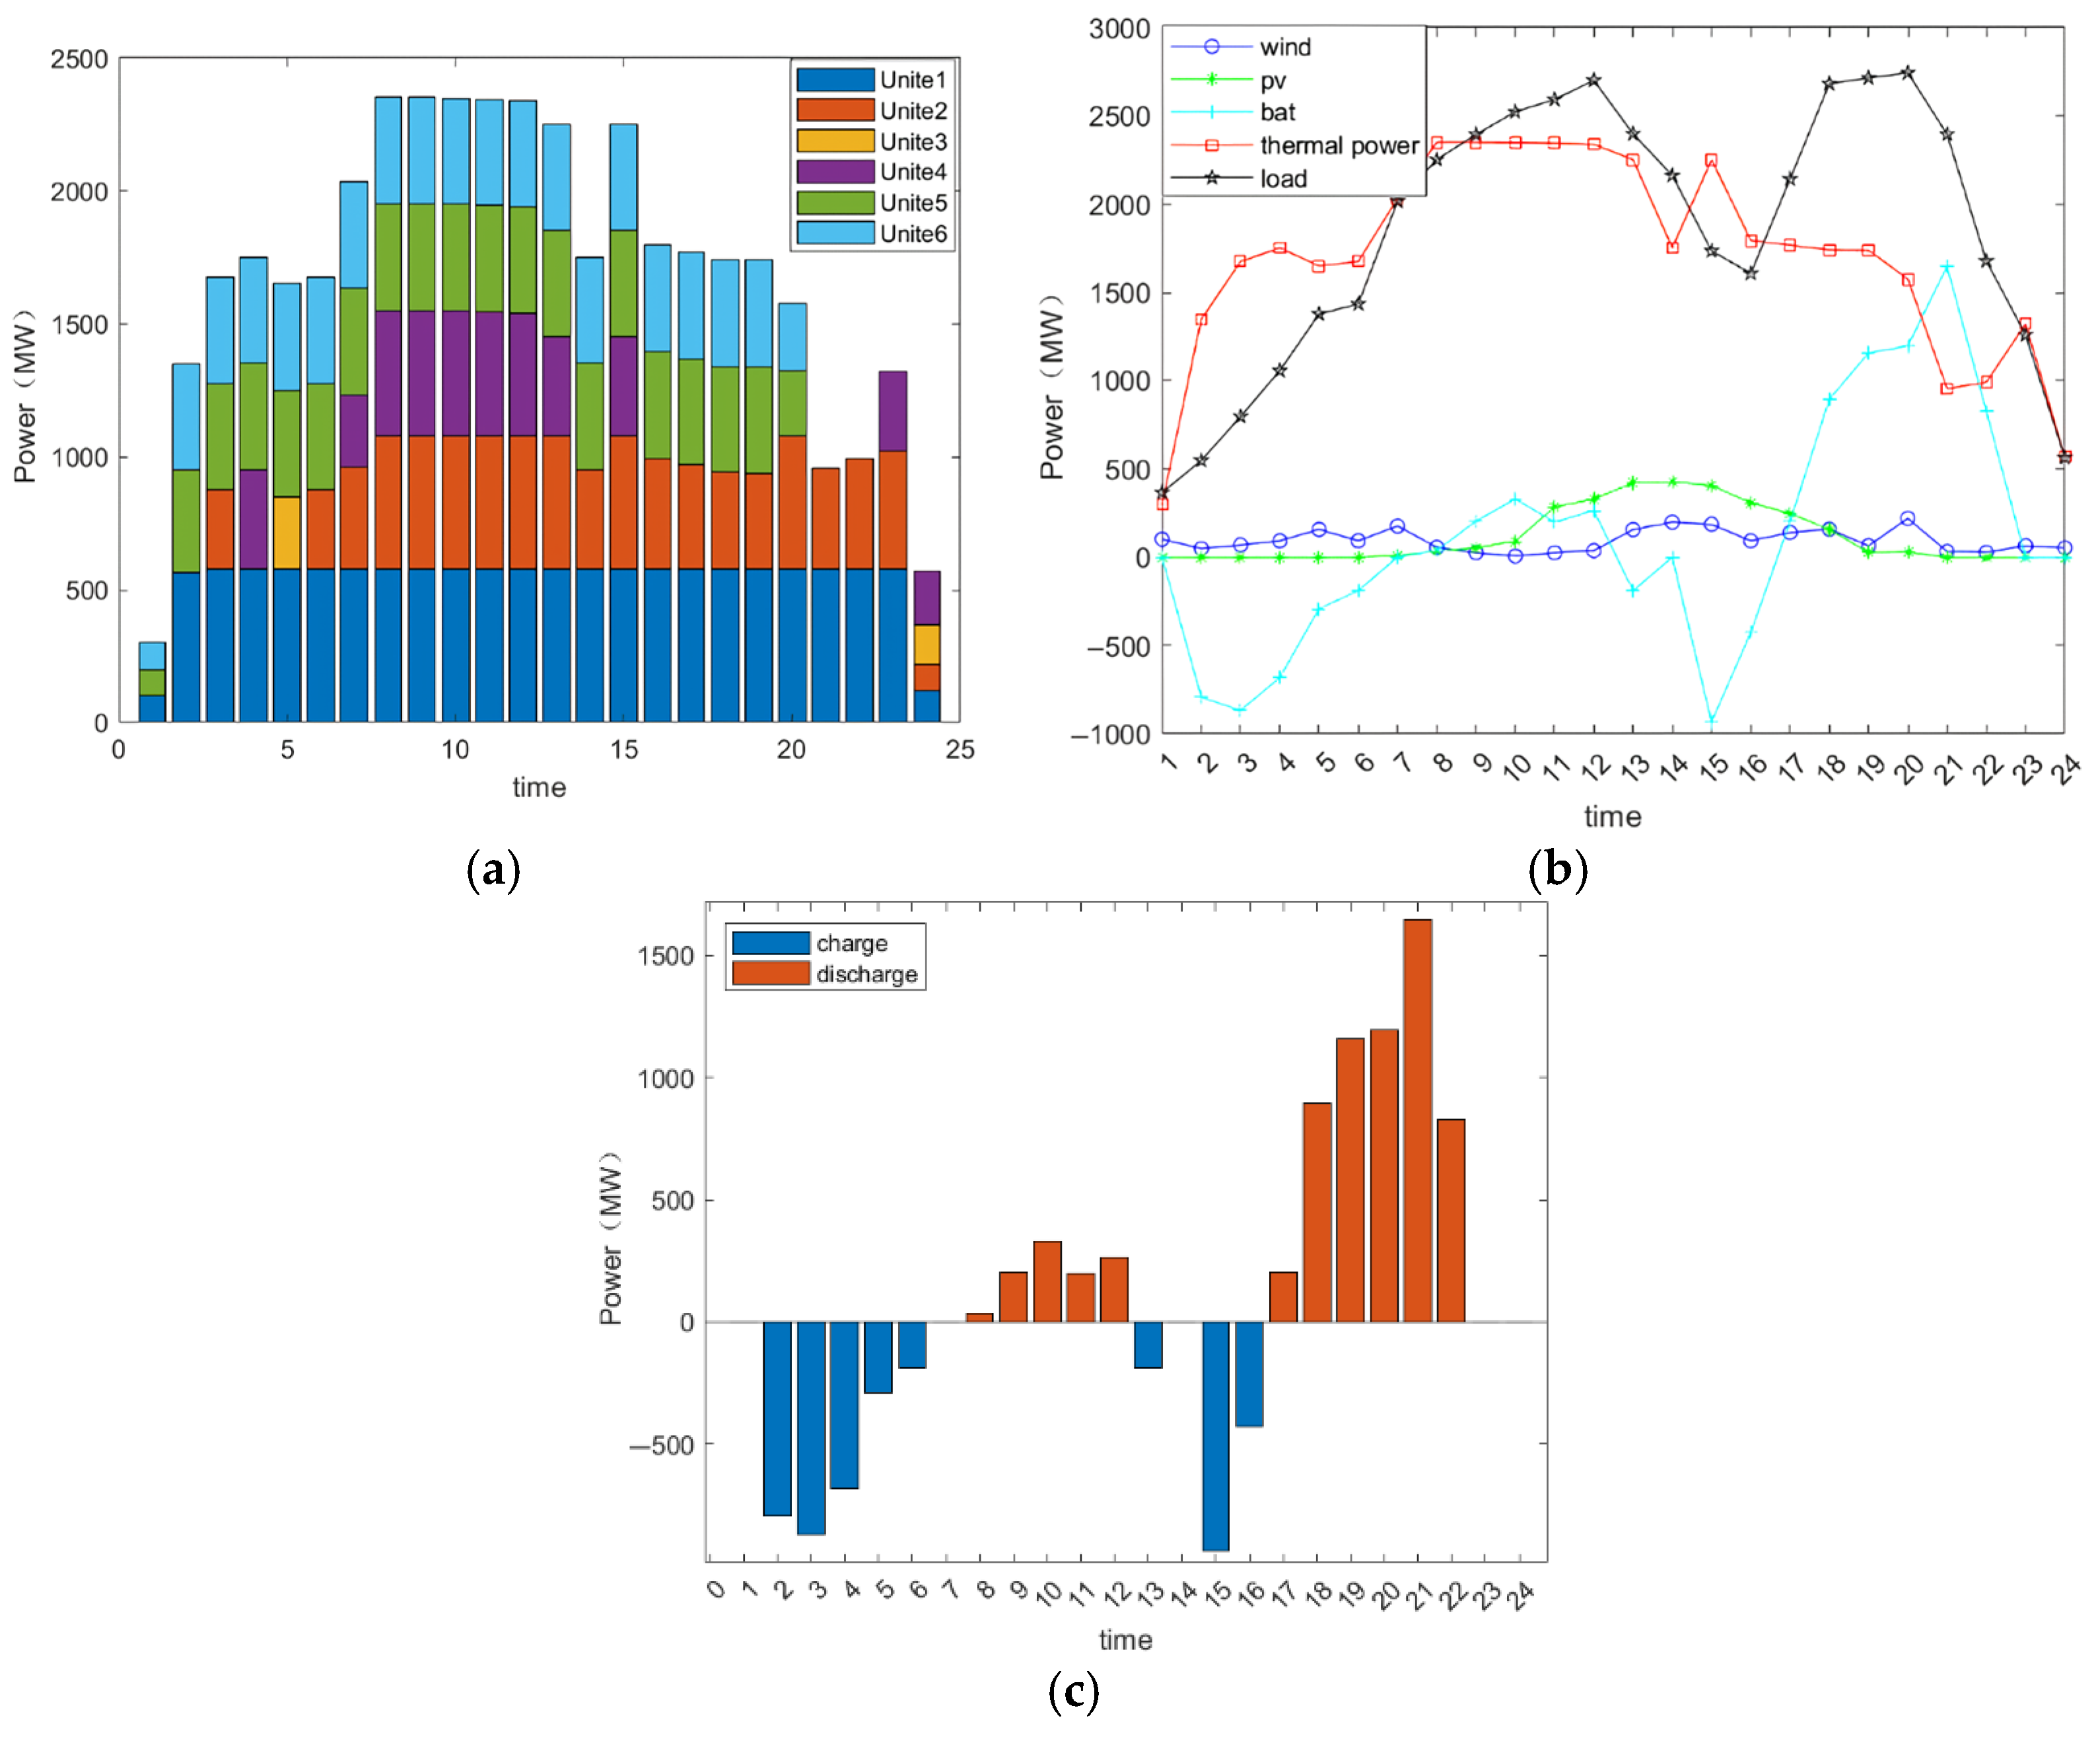
The comparison of system operation costs for the two scenarios is illustrated in Table 3. The outputs of thermal power generators, as well as the charging/discharging status of wind power, photovoltaics, and energy storage devices, are depicted in Figure 3 and Figure 4, respectively.
From Figure 6 and Figure 7, it is evident that following a disturbance, the system employing inertia constraints in Scenario 2 tends to operate using units with relatively large inertia time constants. Whilst this results in increased operational costs for the system, it enhances its disturbance resilience, thereby providing greater stability.
Compared to Scenario 1, Scenario 2 involves the deployment of larger-capacity energy storage equipment. This can effectively mitigate the intermittency of renewable energy sources and enhance the system’s renewable energy absorption rate by smoothing electricity output. Moreover, through their rapid energy release and absorption capabilities, energy storage devices can emulate traditional inertia characteristics, providing virtual inertia support to enhance system stability and response speed. Therefore, to maintain wind and solar integration while meeting the system’s minimum inertia requirements, it is necessary to configure additional energy storage devices, aligning with actual operational scenarios.
Scenario 1 operates at a lower cost, yet it cannot guarantee system safety and stability when confronted with external disturbances. This indicates that while it offers high economic efficiency, it exhibits significant shortcomings in ensuring system stability. Scenario 2 aims to enhance system stability by introducing a minimum inertia constraint. This constraint ensures the system maintains superior performance under disturbances, yet requires additional or more costly resources—such as virtual inertia technology—resulting in a 7.1% higher cost than Scenario 1. This demonstrates the economic trade-off incurred when improving system stability. Consequently, within a limited cost-increase framework, systems incorporating inertia constraints can achieve a balance between stability and economic efficiency.

6.1.2. Validation of Inertia and Frequency Response Indicators

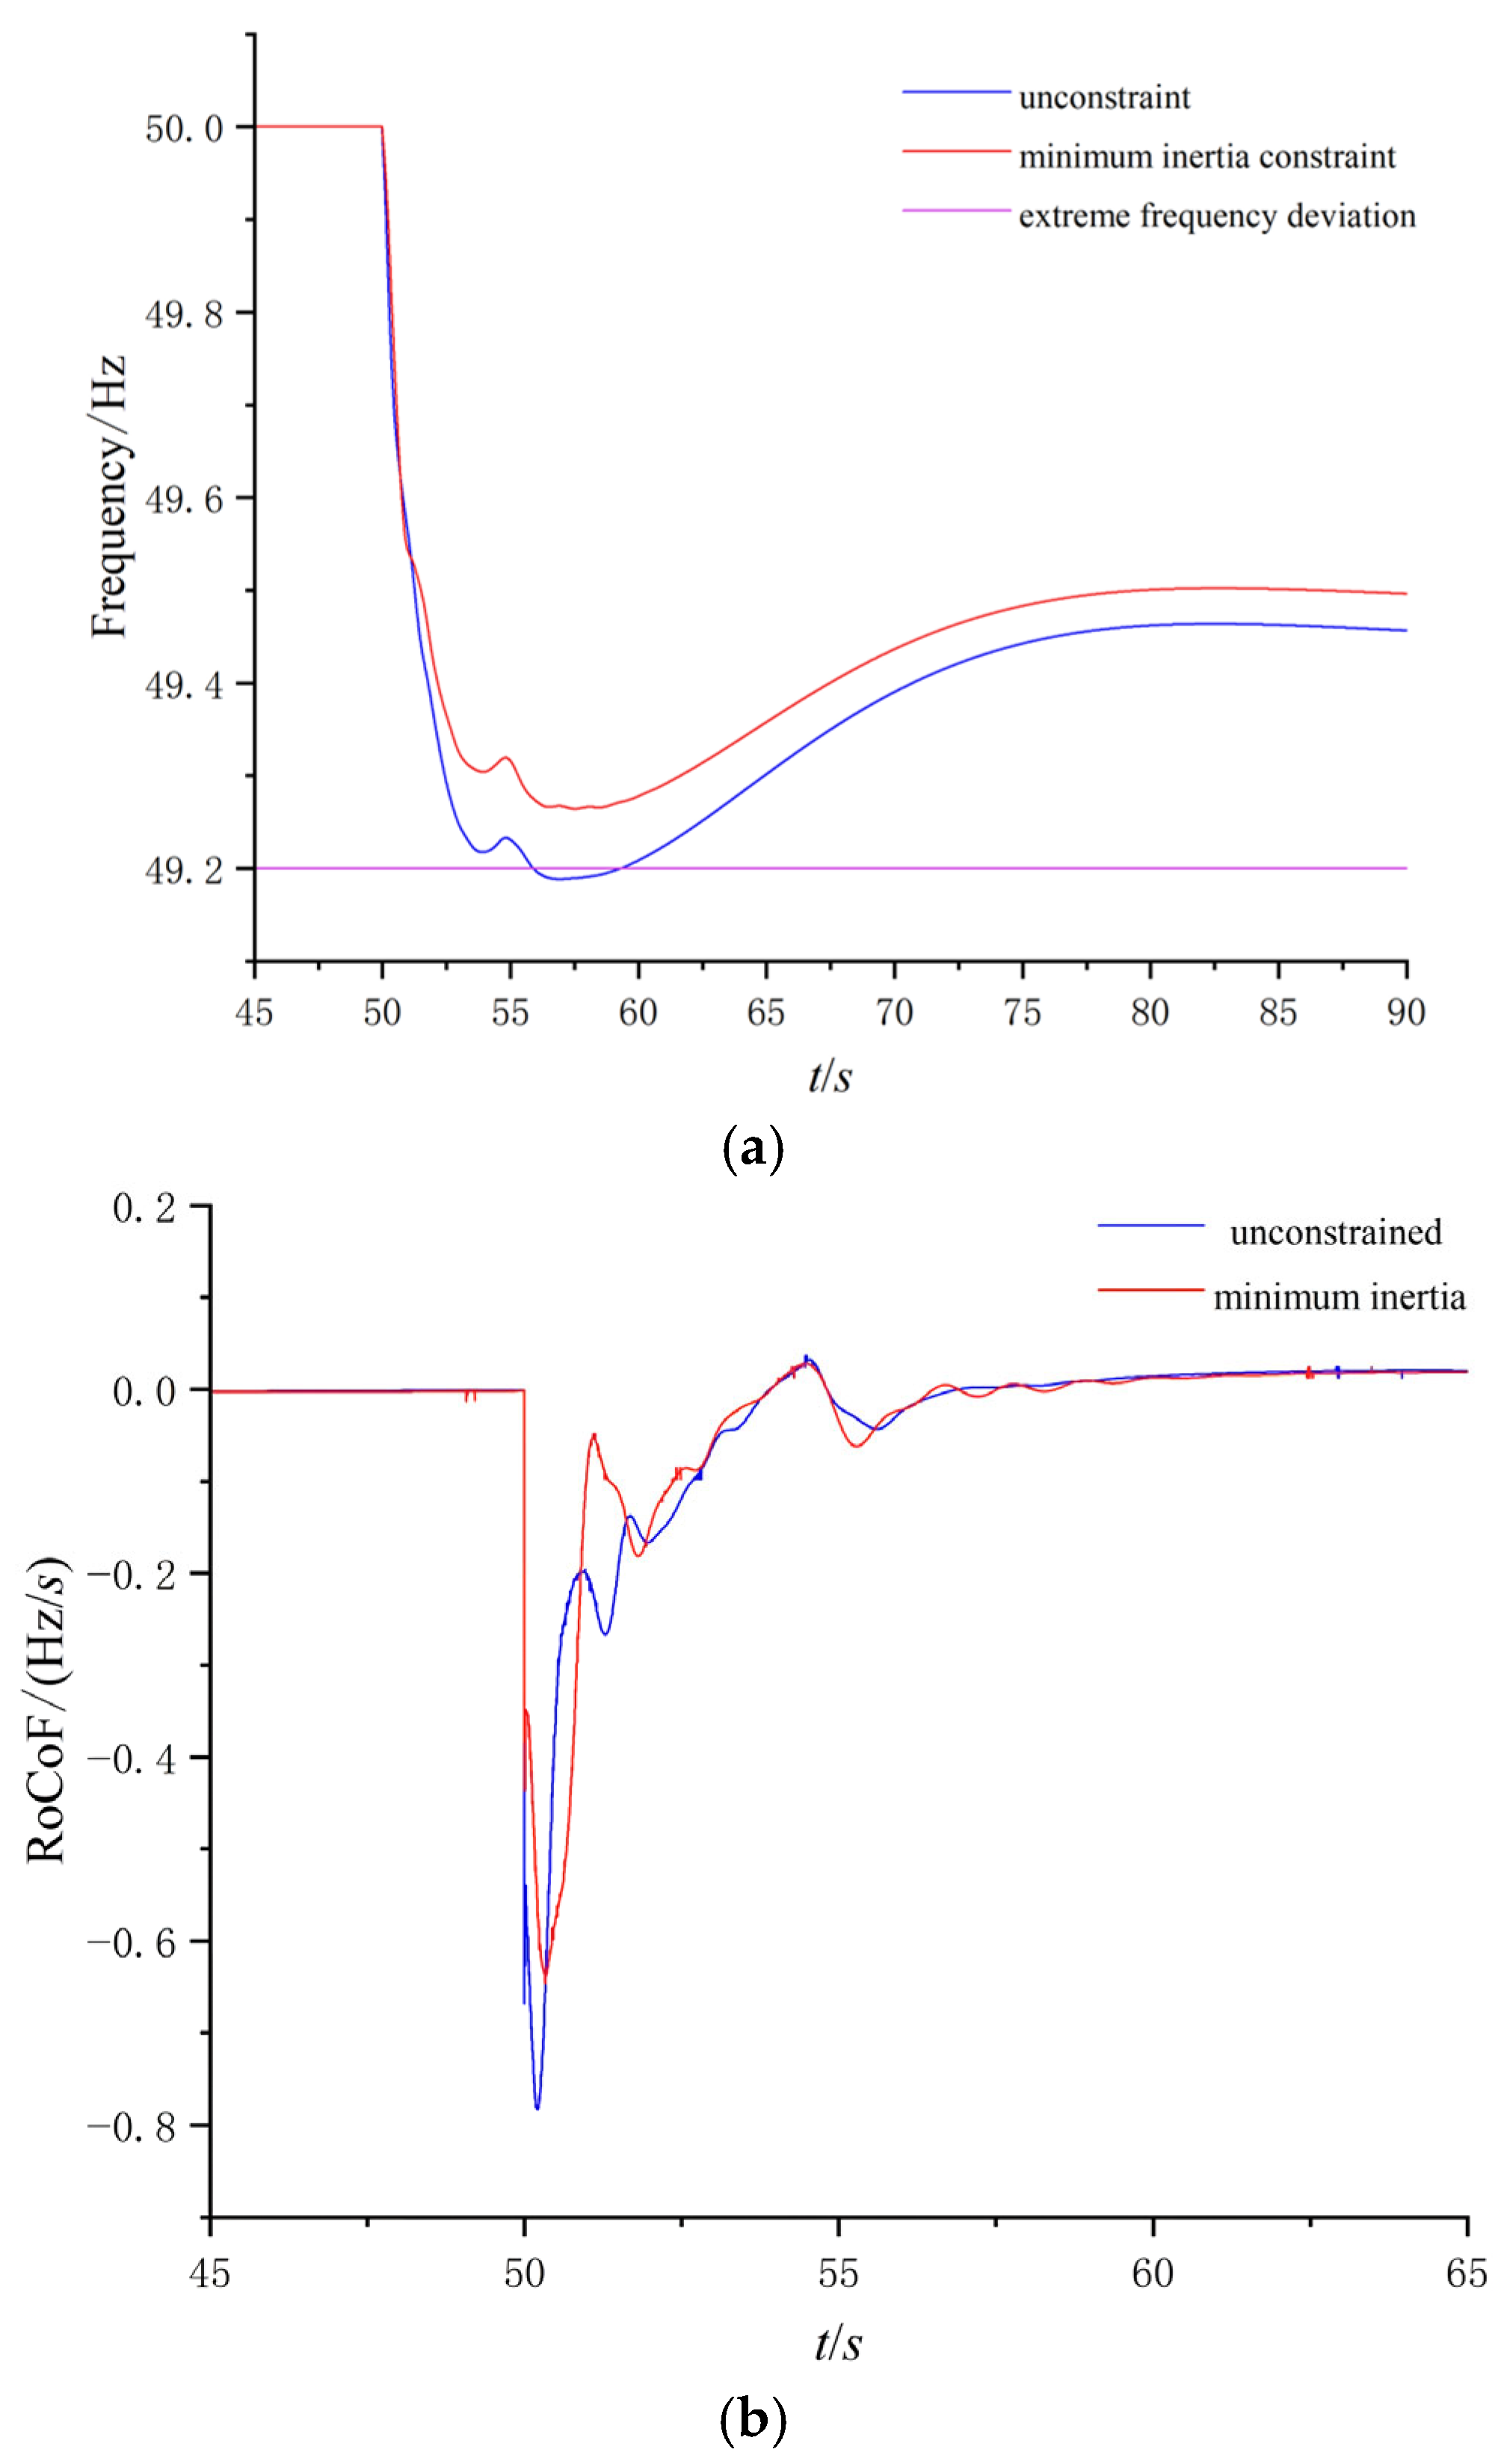
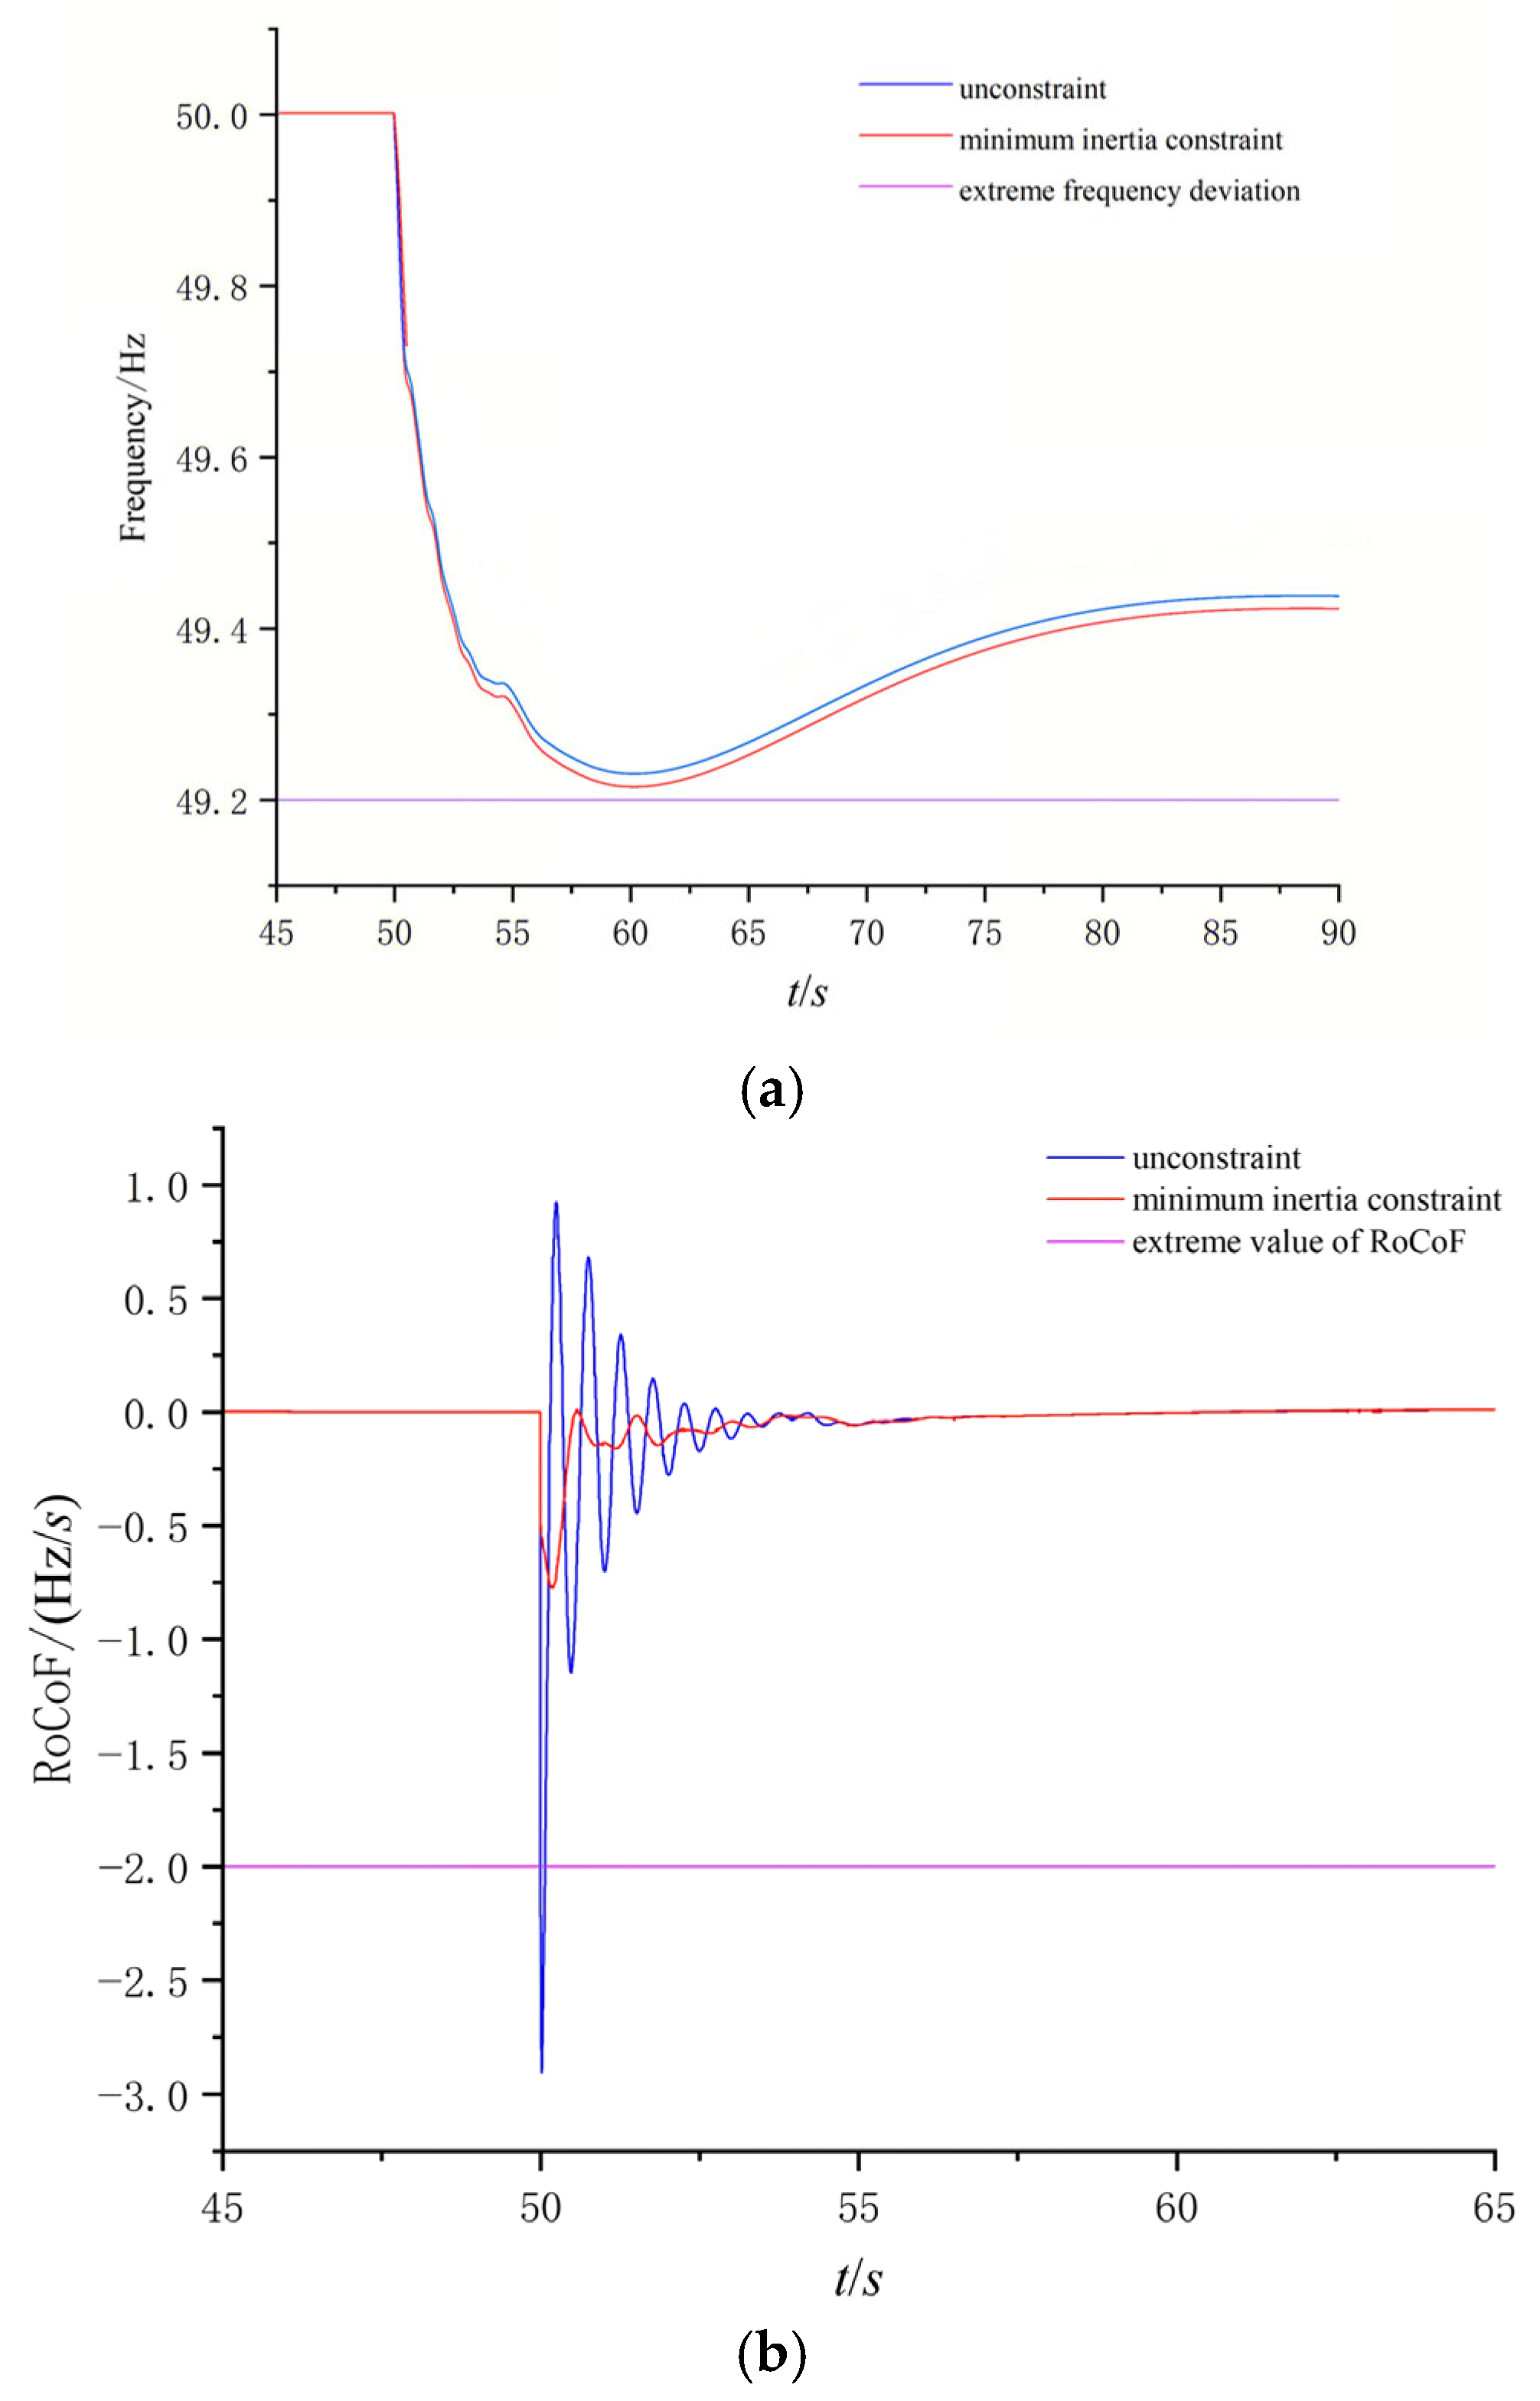
To validate the effectiveness and accuracy of the frequency response in a system considering inertia constraints, disturbances were introduced at the 50 s mark during both 06:00 and 12:00, causing a sudden 10% increase in the rated load. A comparison was made between the quasi-steady-state lowest frequency points and the frequency variation rate curves of the system without inertia constraints. This is illustrated in Figure 8 and Figure 9.
From Figure 8, it is evident that when a sudden load increase disturbance occurs at 06:00, the system’s lowest frequency point drops to 49.18 Hz, which is below the safety threshold of 49.2 Hz. The introduction of inertia and dynamic frequency response constraints raises the lowest frequency point to 49.27 Hz, surpassing the safety requirement of 49.2 Hz. Additionally, the frequency variation rate consistently complies with the safety threshold of −1 Hz/s, with the dynamic frequency constraint being the dominant factor in determining the lowest frequency point.
Figure 9 reveals that when a sudden load increase disturbance occurs at 12:00, the frequency variation rate drops to −2.9 Hz/s, falling below the safety threshold of −1 Hz/s. With the inclusion of inertia and dynamic frequency response constraints, the frequency variation rate is improved to −0.75 Hz/s, exceeding the safety requirement of −1 Hz/s. Moreover, the lowest frequency point consistently meets the safety threshold of above 49.2 Hz, with the dynamic frequency constraint being the dominant factor.
Through simulation calculations, it is observed that when system inertia is considered as a constraint, the quasi-steady-state frequency nadir and frequency rate of change remain within the specified limits during external disturbances. This implies that the system can effectively resist severe frequency fluctuations in the face of load variations or changes in renewable energy output, thereby preventing frequency excursions and enhancing system stability. The results validate the correctness and effectiveness of the proposed approach in this paper. Furthermore, as indicated by Equations (15) and (20), the minimum inertia requirement is determined by the constraints on the frequency deviation nadir and the maximum rate of change of frequency (ROCOF). These constraints are typically established based on the operational requirements of the local power system. For a given disturbance load, increasing the frequency deviation nadir and the maximum ROCOF results in a higher inertia requirement for the system. While this increases the operational cost, it enhances the system’s ability to withstand disturbances.

6.2. Simulation Analysis of the Distribution Network

The lower-level optimization scheduling strategy is simulated and validated in the IEEE 33-node distribution network. To facilitate the study of the impact of energy storage device placement on different network nodes, the distribution network is divided into three functional zones: residential area, commercial area, and office area. Seventy percent of the area belongs to the residential zone, 20% to the commercial zone, and 10% to the office zone.
The capacity configuration and power loss of the two energy storage devices in the distribution network are shown in Figure 10 and Figure 11.
For Scenario 1, the total network loss in the distribution network is 2.4755 MW, while for Scenario 2, it is 2.4495 MW. This indicates that optimizing the charging and discharging of energy storage devices at different times and locations can enhance the system’s power flow, reducing overall network losses.
Additionally, from Figure 10 and Figure 11, it is observed that energy storage discharge primarily occurs during high-demand periods, such as noon, while energy storage charging is concentrated during low-demand periods, such as early morning. In Scenario 1, energy storage devices are mainly concentrated at the beginning of the distribution network, whereas in Scenario 2, energy storage devices are relatively evenly distributed among nodes. Distributing energy storage devices uniformly across the beginning, middle, and end of the distribution network can reduce total network losses and enhance the economic efficiency of distribution network operation. In practical planning, to meet the minimum inertia requirements of the system while minimizing network losses, it is advisable to evenly distribute energy storage devices throughout the distribution network. Upon comparing the two diagrams, it becomes evident that the distribution grid system based on minimal inertia constraints requires a greater deployment of energy storage units. This necessity arises from the role of energy storage units in providing inertia support alongside wind and photovoltaic power generation. Despite the increased cost associated with deploying energy storage, the overall power losses are reduced. In conclusion, the distribution grid system based on minimal inertia constraints not only enhances economic considerations but also further improves system stability and resilience to disturbances.

6.3. Uncertainty Analysis of Wind and Solar Power

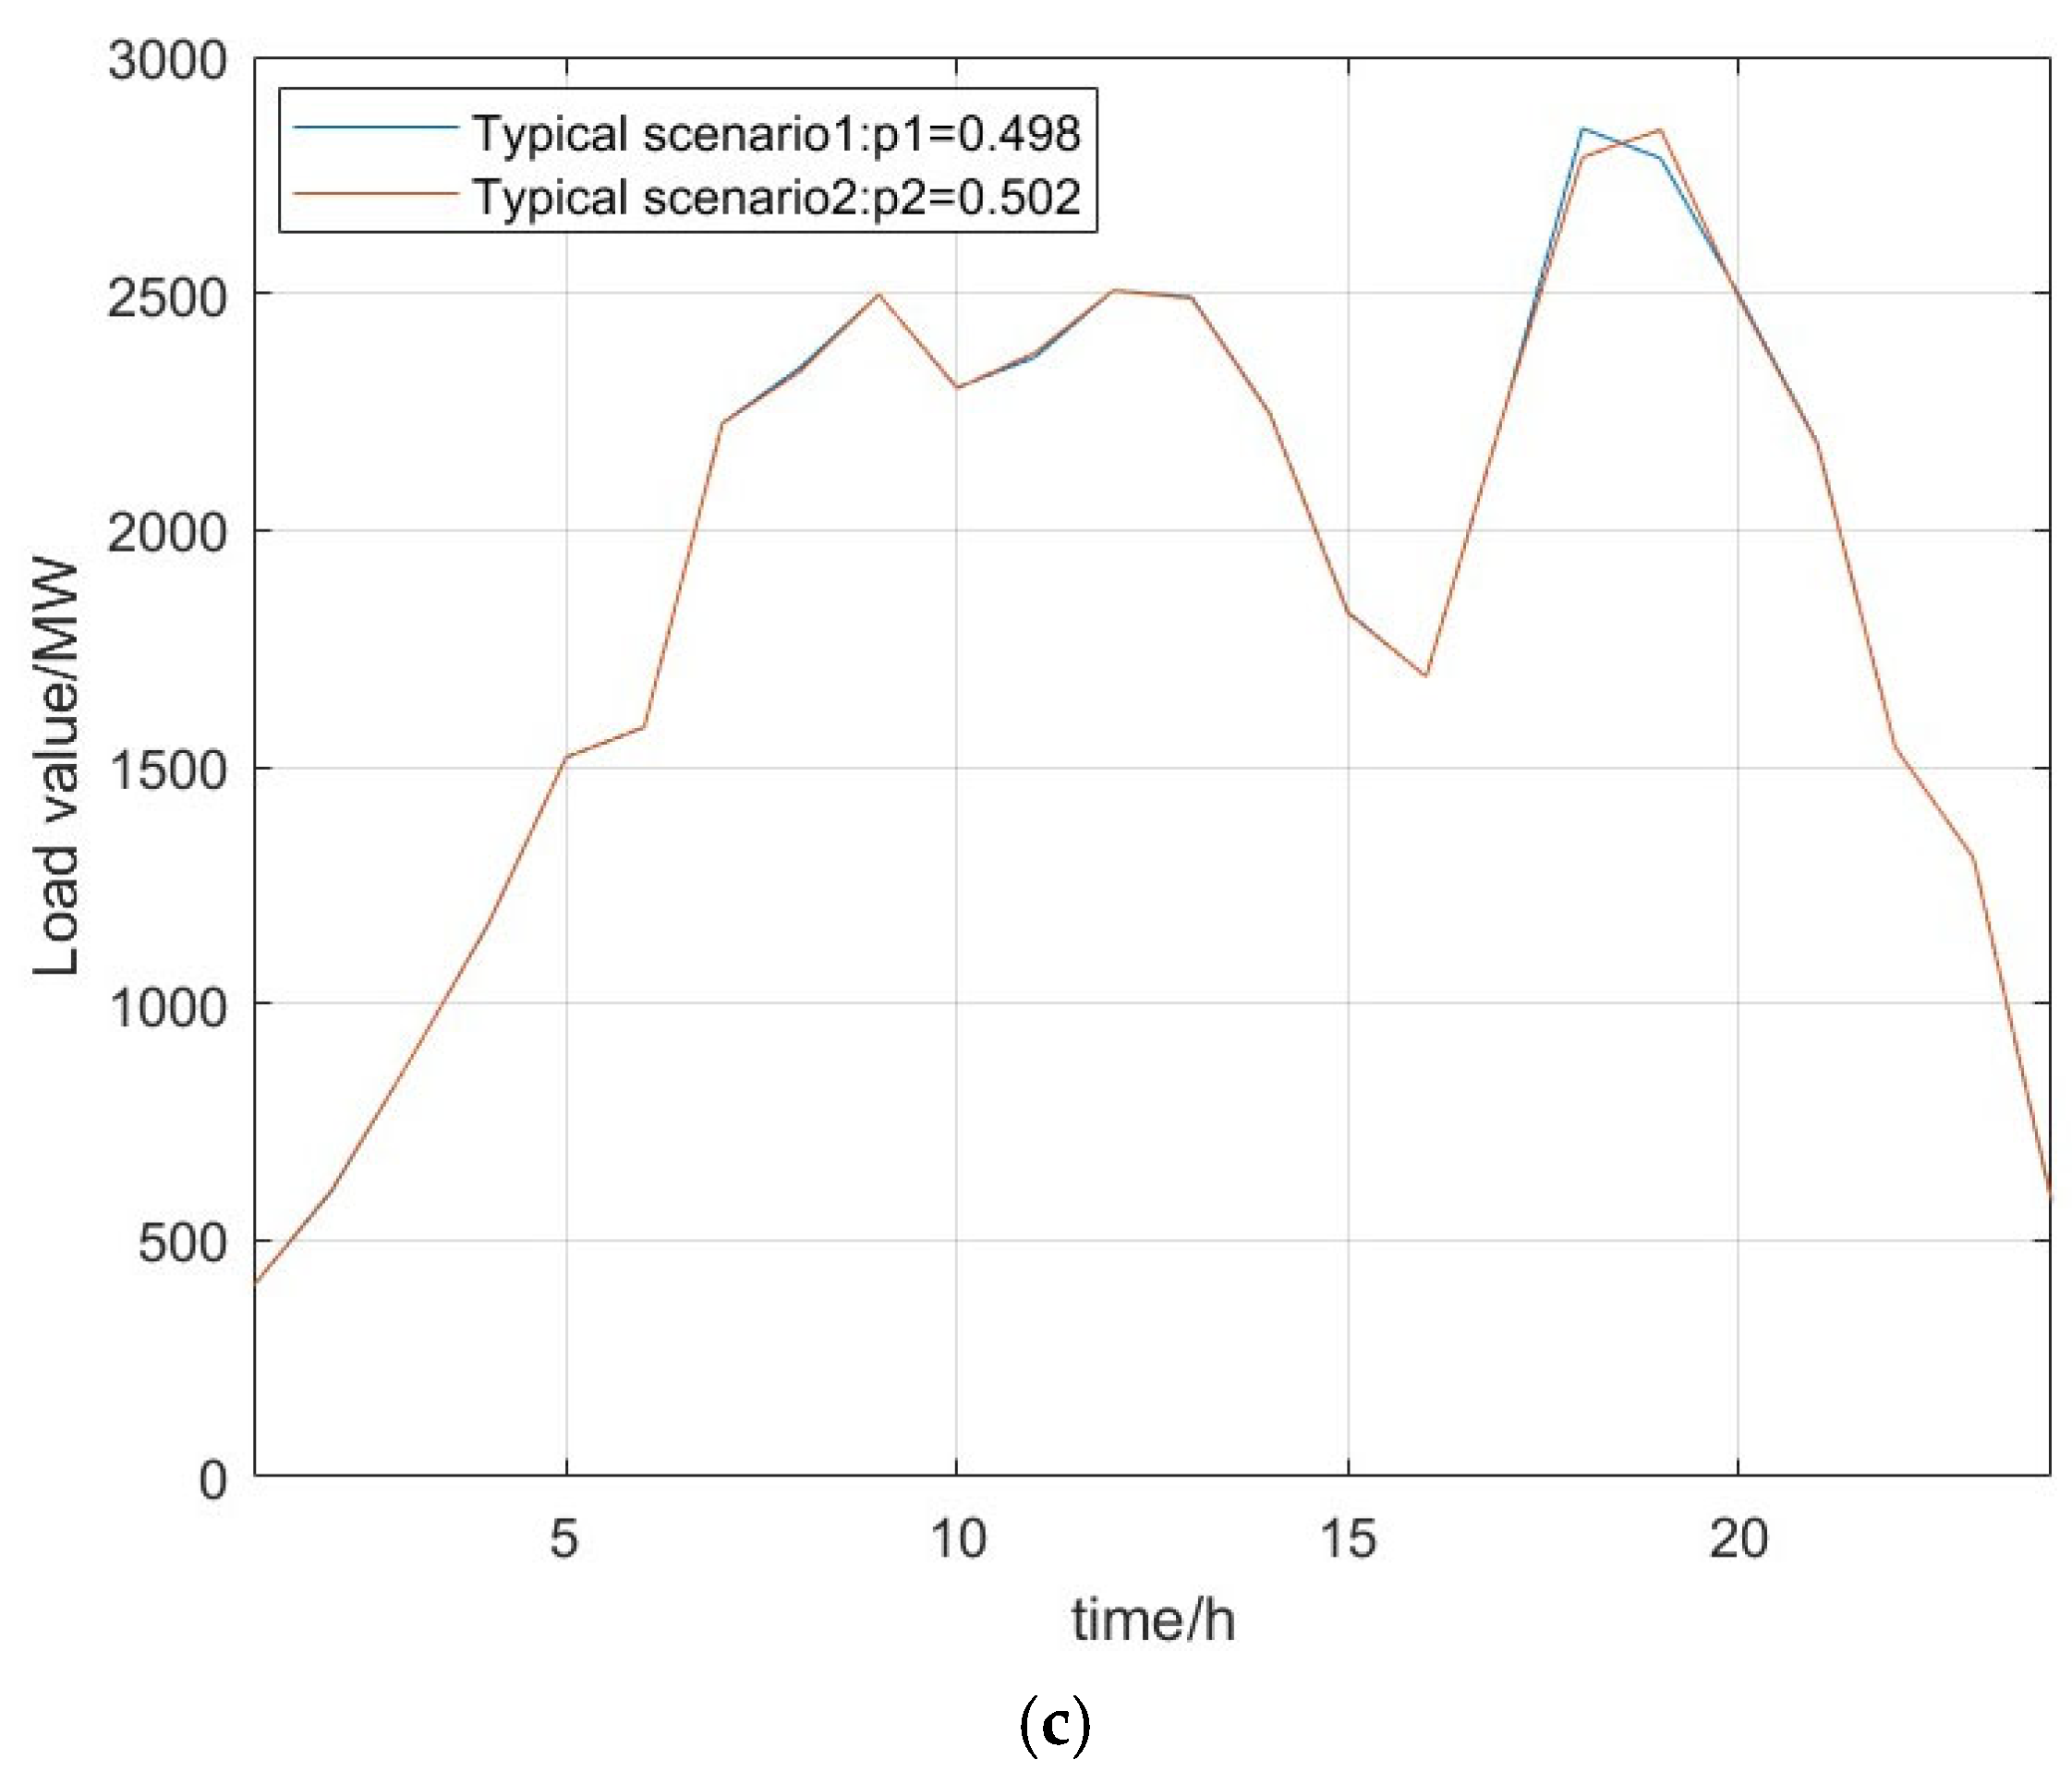
Random sampling and preliminary screening of wind and solar output and load forecast error data were conducted using LHS, excluding scenarios that failed to meet requirements. Ultimately, 500 valid scenarios were retained. The final generated scenarios for wind power, photovoltaic, and load correlations are illustrated in Figure 12.
By randomly arranging and combining typical wind power generation scenarios, typical photovoltaic generation scenarios, and typical load scenarios, a total of eight distinct combinations of typical scenarios can be obtained.
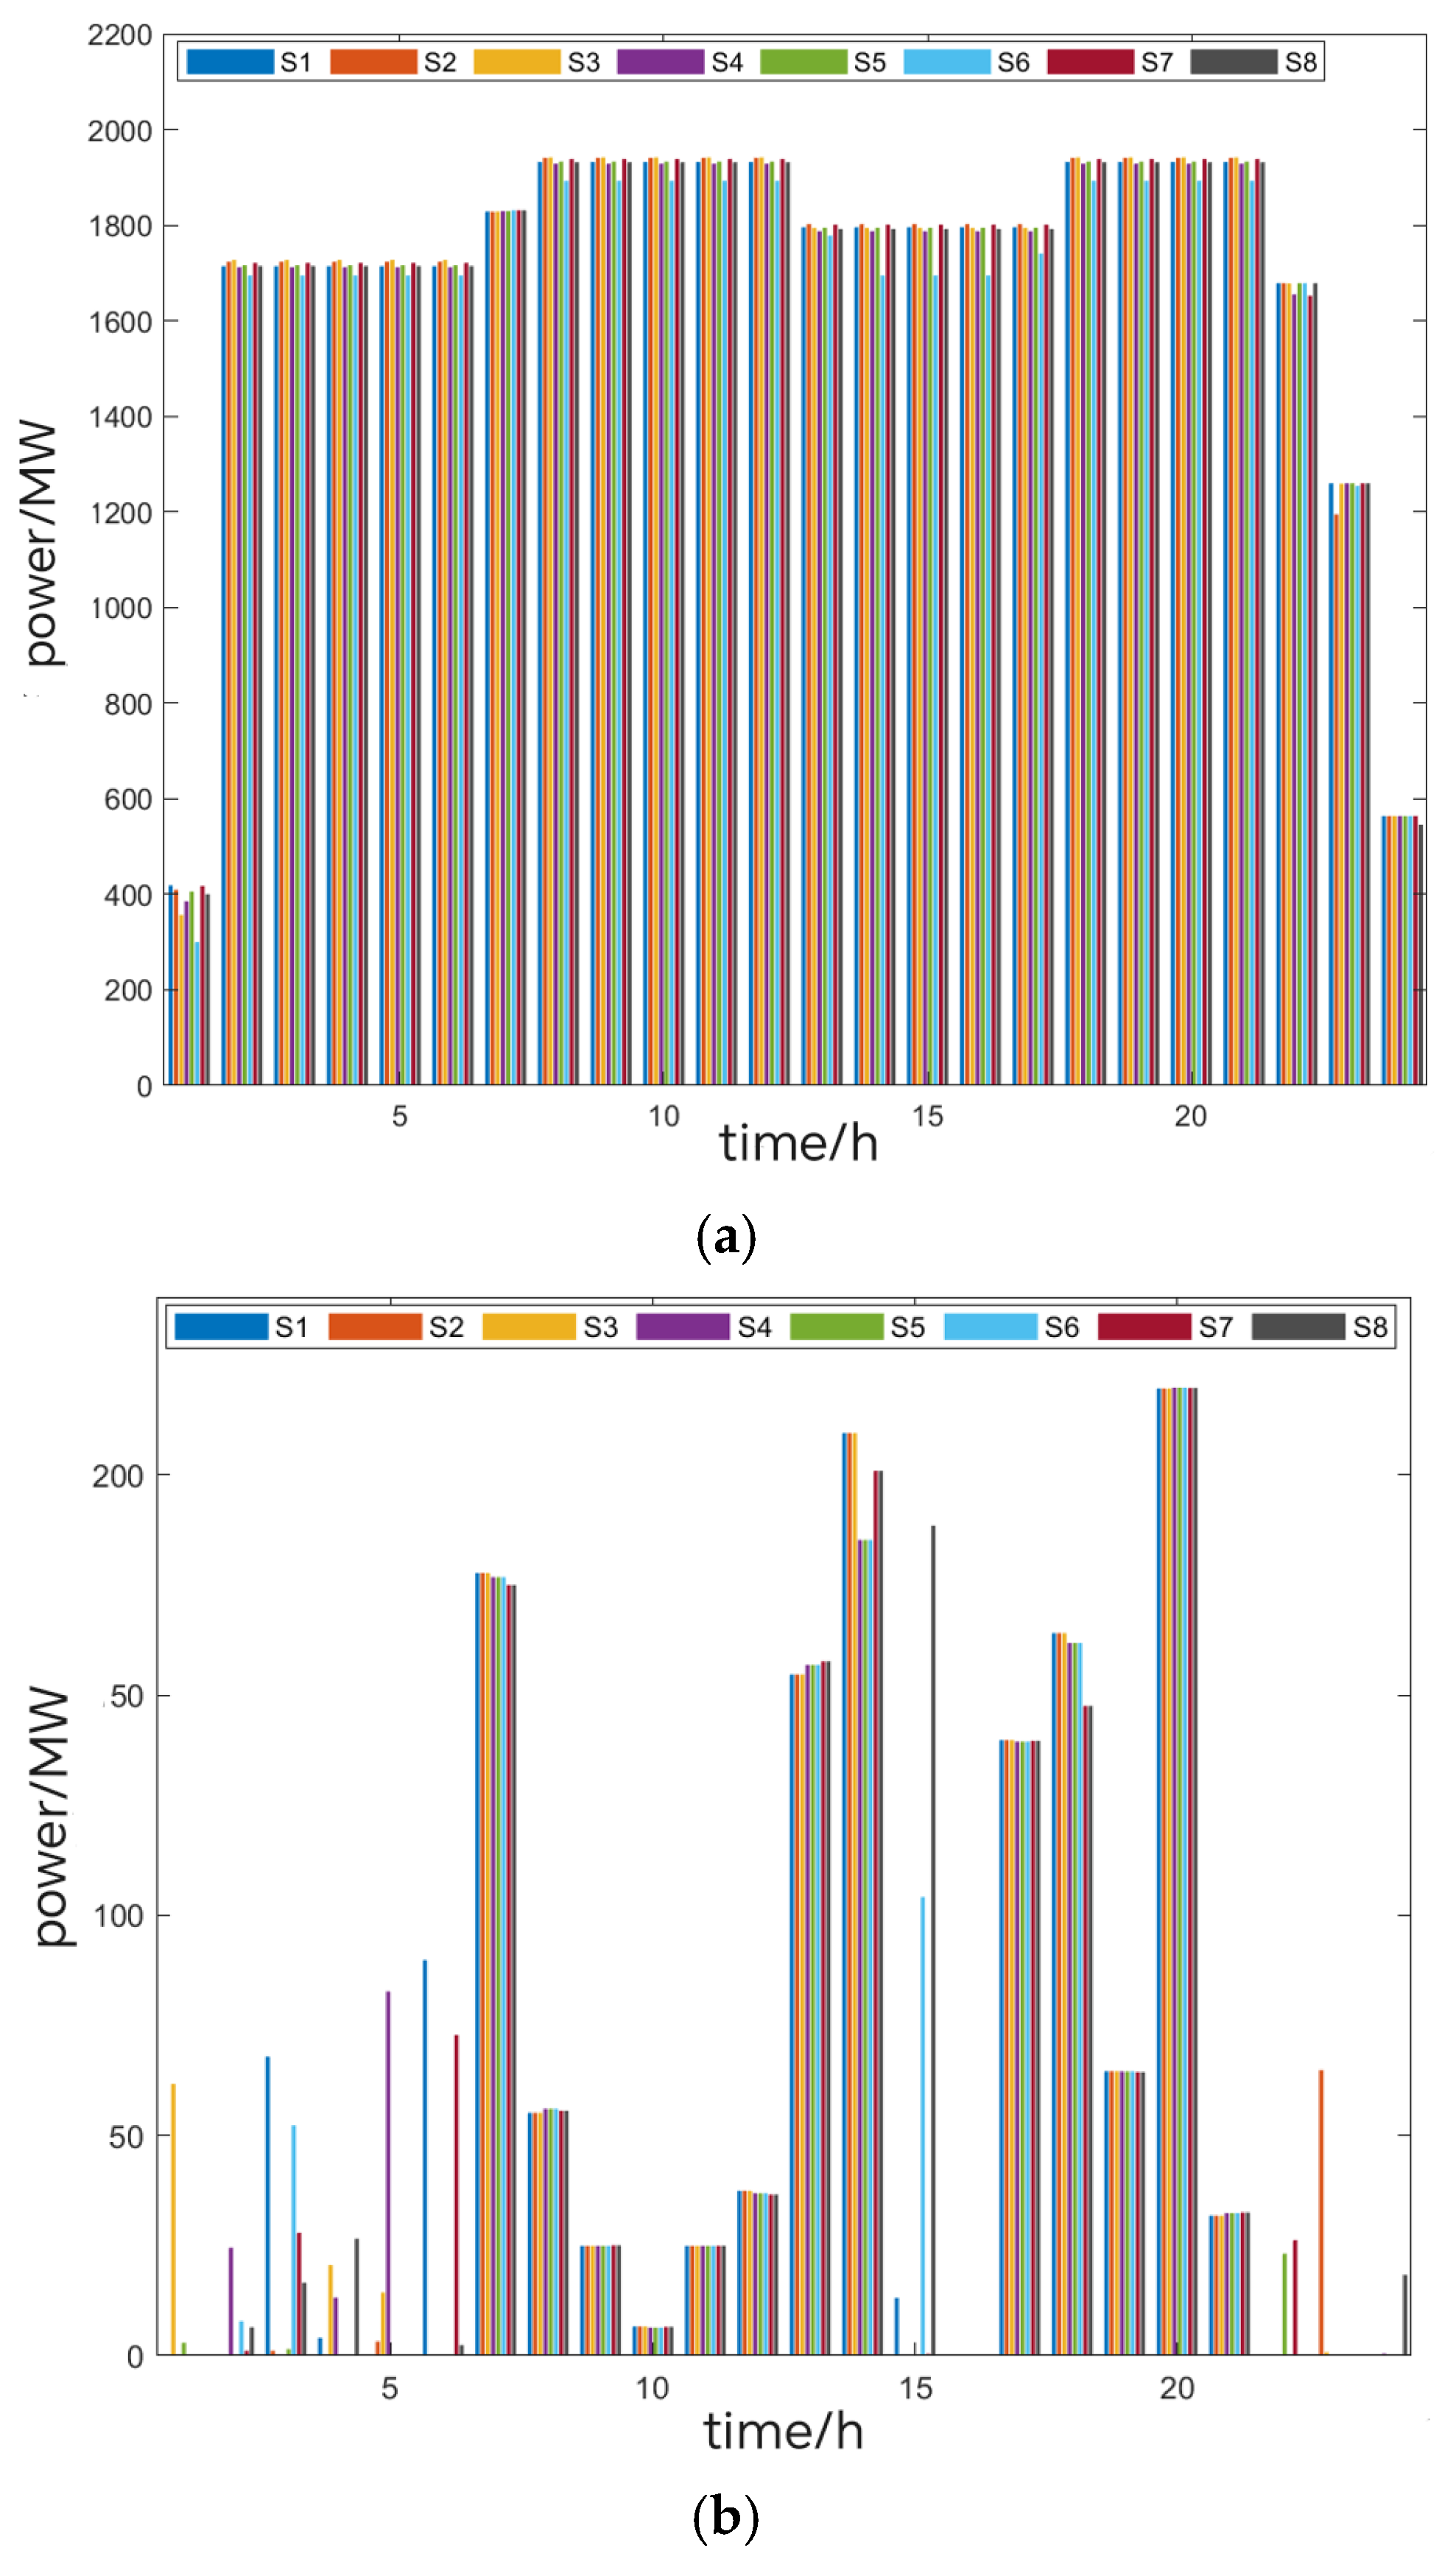
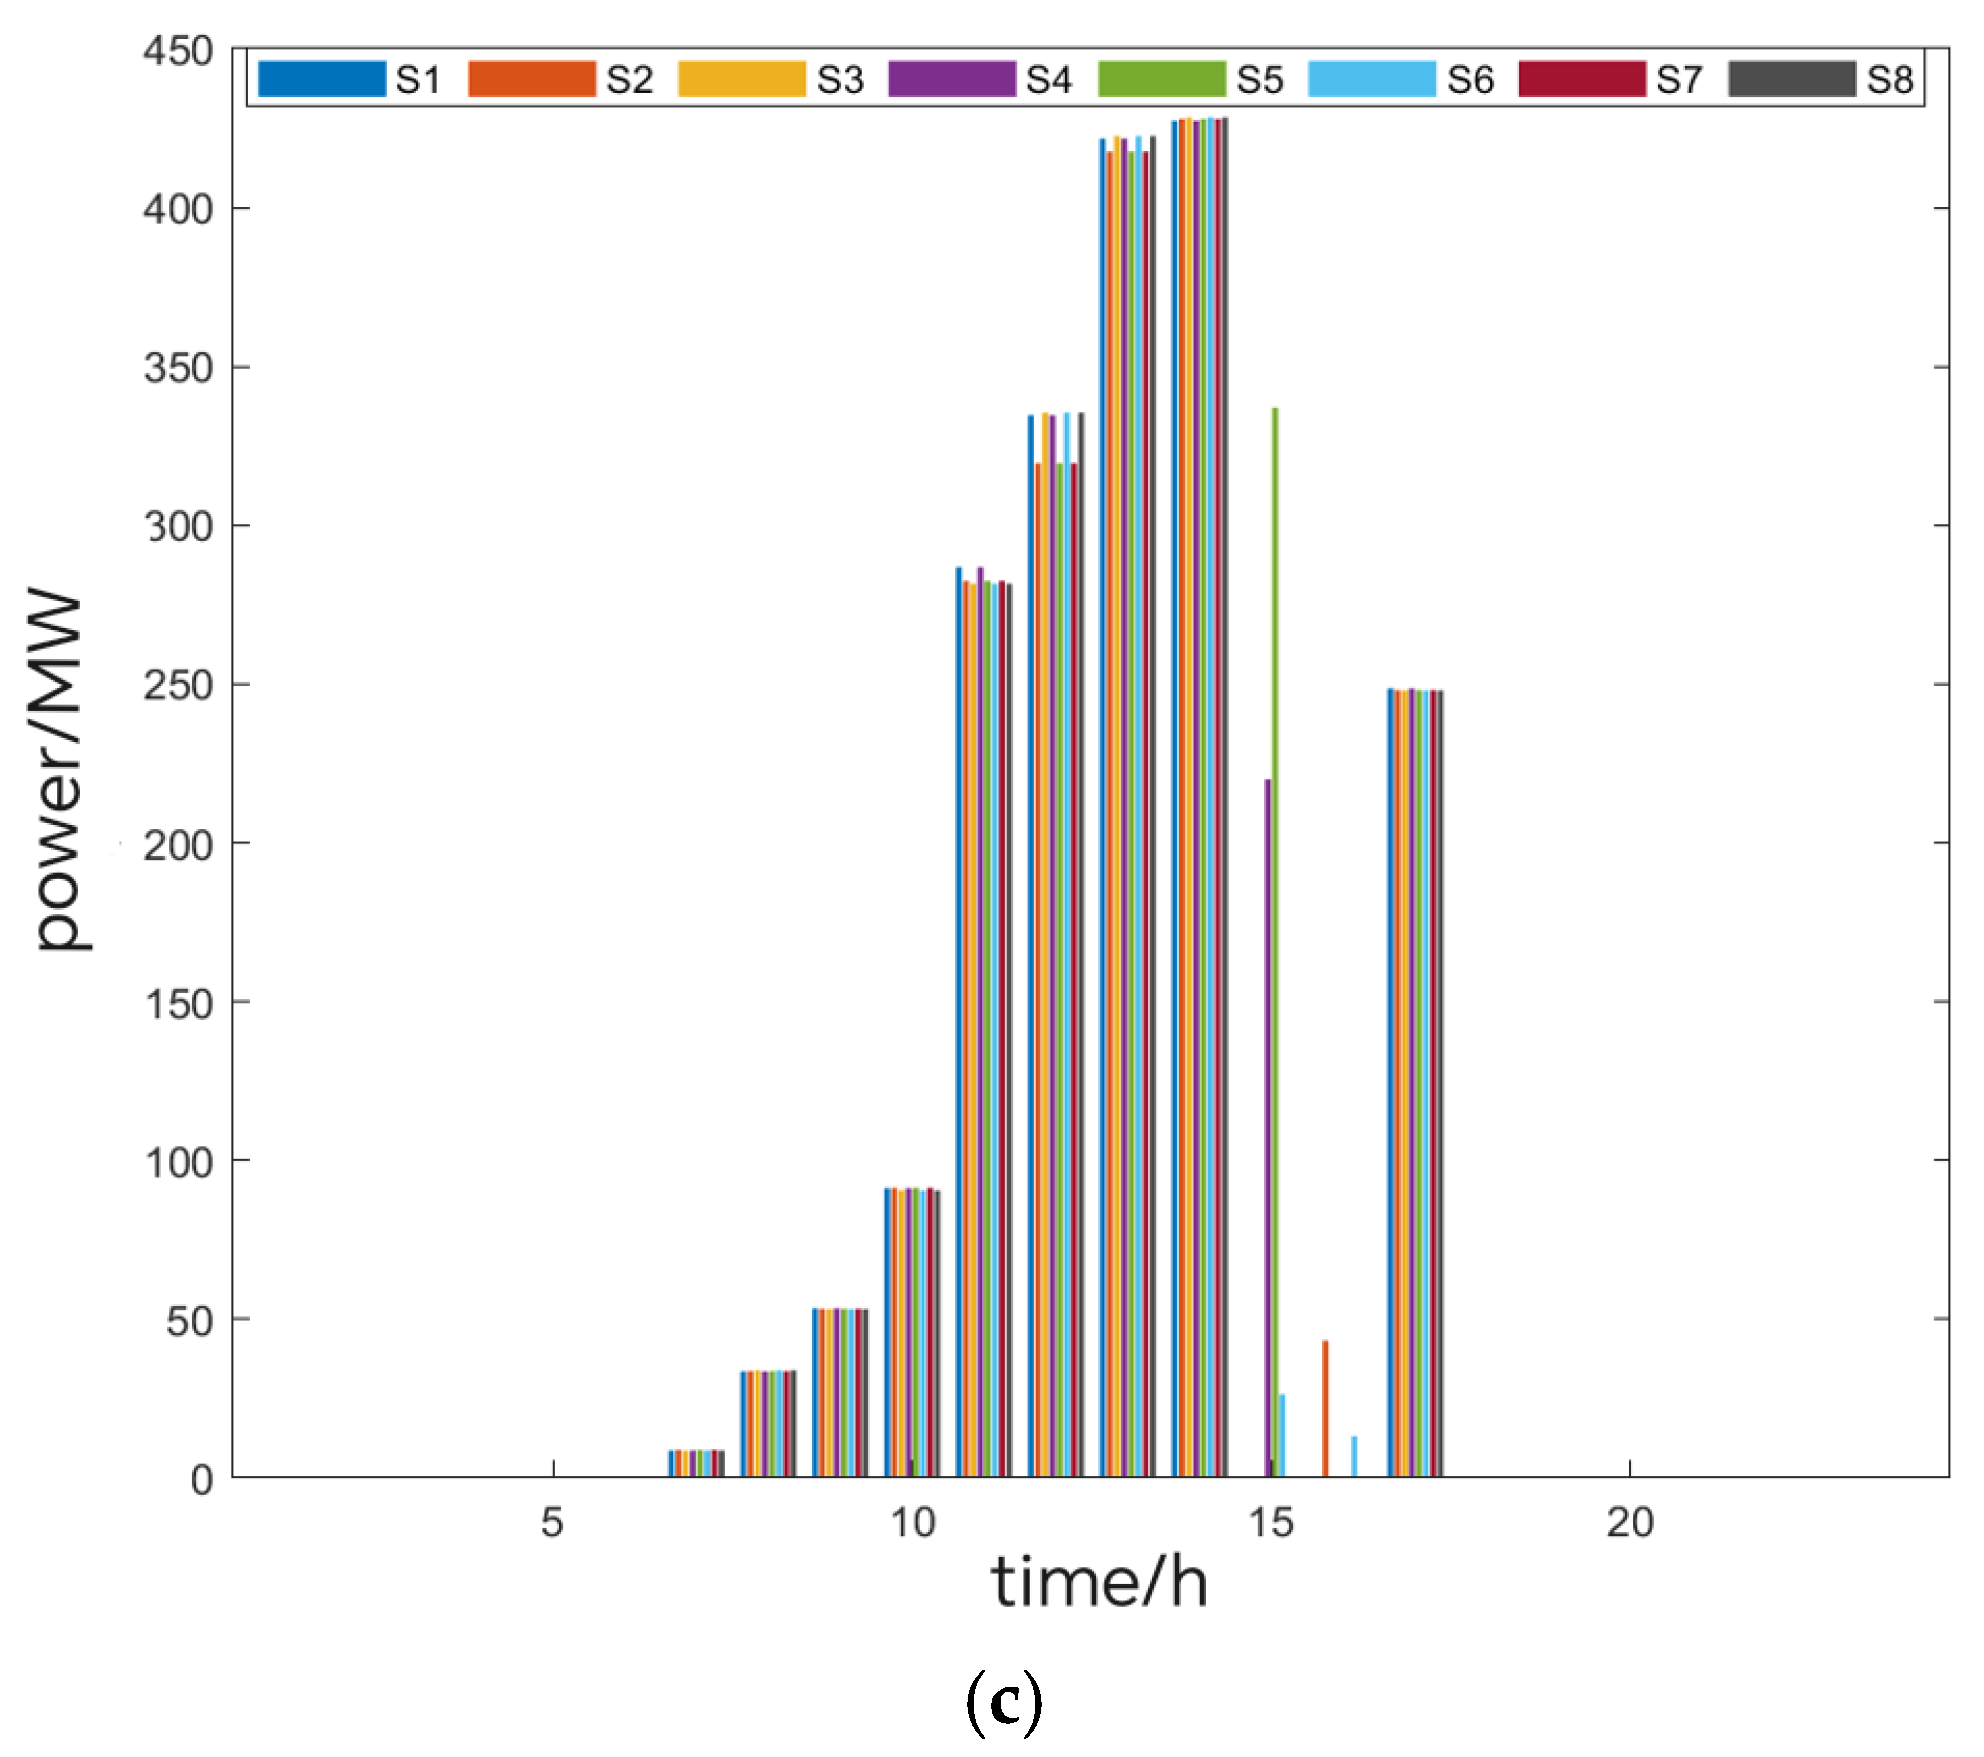
Optimized operation was conducted across eight distinct scenarios. Figure 13 illustrates the dispatch output of thermal power units, alongside the curtailed output of wind power and photovoltaic power.
Through a comprehensive analysis of Figure 13, one may gain deeper insight into the dynamics of energy consumption across different time periods and their impact on the inertia support of the power system. During the 1–7 and 22–24 periods, the absorption of wind and solar power was relatively low. Owing to insufficient solar radiation during nighttime and early morning hours, photovoltaic generation declined significantly, while wind power also produced lower outputs due to inadequate wind conditions. During these periods, the system’s inertia support primarily relies on thermal power units, supplemented by energy stored in energy storage devices. With relatively low load demand, thermal power units maintain output at subdued levels, aiding stable system operation while ensuring economic efficiency. Between 07:00 and 10:00, as daylight increases and solar irradiance intensifies, PV integration gradually rises. Given the strong complementarity between wind and solar power within the same geographical area, wind power absorption gradually diminishes. Thermal power units and virtual inertia serve as the system’s inertia support sources. To meet system inertia requirements, thermal power unit output must be adjusted in a timely manner. Between 10:00 and 12:00, both wind and solar power absorption increase simultaneously, marking a period of high renewable energy output. Further increasing the number of operational thermal units and their output would elevate system operating costs, thereby compromising economic viability. Between 12:00 and 17:00, thermal unit output fluctuates in response to load demand, with energy storage devices accumulating surplus energy. Finally, during the 18:00–22:00 period, as solar irradiance diminishes, PV output approaches zero, leaving wind power as the primary renewable energy absorbed by the system. At this stage, energy storage systems also participate in system operation. Through discharge operations, they smooth load variations, enabling a reduction in thermal power plant output. This further optimizes economic efficiency and system stability.
In summary, this dynamic energy absorption and inertia management strategy not only enhances the system’s resilience to disturbances but also ensures its economically efficient operation.

7. Conclusions and Expectations

In response to the issue of insufficient inertia in the power system and the resulting decrease in frequency security due to the large-scale integration of highly volatile and complementary new energy sources such as wind and photovoltaics, this paper fully considers the time-varying correlation between wind and solar power. It proposes a dual-layer optimization strategy for a multi-energy complementary system that takes into account the minimum inertia constraint. The conclusions drawn are as follows:
(1)
Integrating wind and solar power generation can effectively smooth out combined energy supply and reduce volatility, thereby enhancing grid stability. Employing time-varying N-Copula functions with high-precision fitting capabilities accurately captures the time-varying characteristics of wind and solar outputs. This approach helps improve the utilization rate of power generation systems, minimize uncertainty, and bolster the overall reliability of energy supply.
(2)
At the transmission network level, an upper-level optimization dispatch model for multi-energy complementary systems incorporating the constraint of minimum system inertia is proposed. Based on an analysis of the system’s dynamic frequency response, mathematical relationships between the minimum frequency point, frequency change rate, and system inertia are derived and incorporated as key constraints within the generation dispatch model. Results demonstrate that this model enables the system to effectively withstand external disturbances within acceptable operational cost increases, maintaining quasi-steady-state frequency deviation and rate of change within safe limits. Concurrently, by incorporating energy storage and virtual inertia support, system stability is enhanced while sustaining high penetration levels of renewable energy sources.
(3)
At the distribution network level, a lower-level optimized dispatch strategy based on optimal power flow is proposed to enhance the economic operation of the distribution system. Building upon the upper-level dispatch plan, this strategy incorporates the spatial distribution characteristics of energy storage devices to optimally allocate the total charging and discharging power of energy storage across distribution network nodes during each time period.
(4)
A simulation test platform was constructed based on an enhanced six-machine system and an IEEE 33-node distribution network for case validation. Simulation results at the transmission level demonstrate that the proposed upper-layer optimization model effectively enhances the system’s disturbance resilience, improves stability, and reduces wind and solar curtailment rates. Findings at the distribution network level confirm that optimizing the deployment locations of energy storage significantly improves the economic efficiency of the distribution network and reduces system transmission losses.
(5)
The multi-scenario stochastic optimization dispatch model developed, which accounts for uncertainties and correlations between power sources and loads, provides effective risk management strategies for system operation. This model quantifies and addresses uncertainties across different time scales, enhancing the accuracy and economic efficiency of dispatch plans. Case studies further demonstrate that the forecasting accuracy of wind and solar power significantly impacts system operating costs and performance. Achieving more precise renewable energy power forecasts at the day-ahead stage facilitates the formulation of more economical and reliable dispatch schedules.
The bilevel structure of the proposed model exhibits strong modularity, making it adaptable to power systems of various scales, ranging from small regional grids to large national grids. By adjusting model parameters and constraints, it can flexibly address different system requirements and complexities. This hierarchical design facilitates the gradual addition of computational resources and optimization modules as the system scale expands, without the need to reconfigure the entire model. However, this study also has certain limitations. To emphasize the effectiveness and clarity of the core optimization framework, no sensitivity analysis was conducted on key parameters, nor were composite disturbance scenarios involving simultaneous fluctuations in renewable energy output and load demand considered. Furthermore, as system scale increases, computational challenges will arise from model complexity and the processing of vast datasets. Nevertheless, these limitations do not undermine the validity and reliability of the study’s principal conclusion: the proposed two-layer optimization strategy, incorporating the minimum inertia constraint, significantly enhances system frequency stability and integration capacity. Future research will address these limitations: firstly, introducing sensitivity analysis to evaluate the impact of parameter uncertainties on dispatch outcomes, while constructing more complex composite fault scenarios to further validate and enhance the robustness and practicality of this optimization model; secondly, applying the model to provincial-scale power grids to assess its computational efficiency and feasibility. These endeavors aim to comprehensively enhance system stability, economic performance, and operational efficiency.

Author Contributions

X.X.: Conceptualization, Funding acquisition, Project administration, Supervision, Methodology, Resources, Writing—review & editing. X.H.: Data curation, Formal Analysis, Investigation, Software, Validation, Visualization, Writing—original draft. H.Z.: Data curation, Formal Analysis, Investigation, Software, Validation, Visualization, Writing—original draft. Y.Q.: Data curation, Formal Analysis, Investigation, Software, Validation, Visualization, Writing—original draft. H.Q.: Data curation, Formal Analysis, Investigation, Software, Validation, Visualization, Writing—original draft. J.H.: Data curation, Formal Analysis, Investigation, Software, Validation, Visualization, Writing—original draft. J.T.: Data curation, Formal Analysis, Investigation, Software, Validation, Visualization, Writing—original draft. All authors have read and agreed to the published version of the manuscript.

Funding

Research on intelligent analysis and knowledge mining technologies for ubiquitous new energy multi-source heterogeneous data: GXKJXM20240059.

Data Availability Statement

The original contributions presented in the study are included in the article, further inquiries can be directed to the corresponding author.

Acknowledgments

This research work was supported by the National Natural Science Foundation of China under Grant 51867004.

Conflicts of Interest

Authors Houjian Zhan, Yiming Qin, Huanxing Qi, Jiaqiu Hu and Jian Tang were employed by the company Power Dispatch and Control Center Guangxi Power Grid Co., Ltd. Author Xiaokun Han was employed by the company State Grid Henan Electric Power Company. The remaining authors declare that the research was conducted in the absence of any commercial or financial relationships that could be construed as a potential conflict of interest.

References

  1. Shazon, N.H.; Masood, N.A.; Jawad, A. Frequency control challenges and potential countermeasures in future low-inertia power systems: A review. Energy Rep. 2022, 8, 6191–6219. [Google Scholar] [CrossRef]
  2. Zhang, W.; Wen, Y.; Chi, F.; Wang, K.; Li, L. Research framework and prospect on power system inertia estimation. Proc. CSEE 2021, 41, 6842–6856. [Google Scholar] [CrossRef]
  3. Fang, Y. Reflections on frequency stability control technology based on the blackout event of 9 august 2019 in UK. Autom. Electr. Power Syst. 2019, 43, 1–5. [Google Scholar] [CrossRef]
  4. Yan, D.; Wen, J.; Du, Z.; Yang, D.; Yao, W.; Zhao, H.; Liu, J. Analysis of texas blackout in 2021 and its enlightenment to power system planning management. Power Syst. Prot. Control 2021, 49, 121–128. [Google Scholar] [CrossRef]
  5. Kerdphol, T.; Rahman, F.S.; Mitani, Y.; Watanabe, M.; Küfeoğlu, S.K. Robust virtual inertia control of an islanded microgrid considering high penetration of renewable energy. IEEE Access 2017, 6, 625–636. [Google Scholar] [CrossRef]
  6. Sajadinia, M. An adaptive virtual inertia control design for energy storage devices using interval type-2 fuzzy logic and fractional order PI controller. J. Energy Storage 2024, 84, 110791. [Google Scholar] [CrossRef]
  7. Xu, C.; Liang, C.; Huimin, Q. Virtual Inertia Control of Wind Turbine Based on Model Predictive Control. J. Phys. Conf. Ser. 2022, 2310, 012092. [Google Scholar] [CrossRef]
  8. Chávez, H.; Baldick, R.; Sharma, S. Governor rate-constrained OPF for primary frequency control adequacy. IEEE Trans. Power Syst. 2014, 29, 1473–1480. [Google Scholar] [CrossRef]
  9. Wen, Y.; Li, W.; Huang, G.; Liu, X. Frequency dynamics constrained unit commitment with battery energy storage. IEEE Trans. Power Syst. 2016, 31, 5115–5125. [Google Scholar] [CrossRef]
  10. Wang, B.; Yang, D.; Cai, G. Dynamic frequency constraint unit commitment in large-scale windpower grid connection. Power Syst. Technol. 2020, 44, 2513–2519. [Google Scholar] [CrossRef]
  11. Rosyadi, I.; Shadiq, J.; Putra, H. Calculation of Minimum Generator Inertia Based on Unit Commitment to Increase Awareness of Stability in the Jawa Bali System. In Proceedings of the 2023 4th International Conference on High Voltage Engineering and Power Systems (ICHVEPS), Denpasar Bali, Indonesia, 6–10 August 2023; pp. 320–324. [Google Scholar] [CrossRef]
  12. Chu, Z.; Markovic, U.; Hug, G.; Teng, F. Towards optimal system scheduling with synthetic inertia provision from wind turbines. IEEE Trans. Power Syst. 2020, 35, 4056–4066. [Google Scholar] [CrossRef]
  13. Zhang, X.; Jin, Z.; Fu, Y.; Wan, Y. Constraint and Support Control of Virtual Inertia for Wind Power Based on Frequency Change Extremum Time. High Volt. Technol. 2023, 49, 2491–2505. [Google Scholar] [CrossRef]
  14. Ye, C.; Liu, D.; Yang, X.; Liu, Z.; Ji, X.; Cao, K.; Wang, W. Optimal operation strategy of high proportion new energy power system based on minimum inertia evaluation. Power Syst. Technol. 2023, 47, 502–516. [Google Scholar] [CrossRef]
  15. Sun, D.; Zhao, L.; Sun, K. Research on Site Selection and Capacity Optimization Strategies for Hybrid Energy Storage Systems in Distribution Networks Under New Energy Integration. Acta Energiae Solaris Sin. 2024, 45, 423–432. [Google Scholar] [CrossRef]
  16. Zhang, J.; Ouyang, S.; Wu, H.; Xin, X.; Huang, Y. Optimal configuration of grid-side energy storage considering reliability and operation economy of distribution network. Electr. Power Autom. Equip. 2024, 44, 62–68+85. [Google Scholar] [CrossRef]
  17. Li, P.; Han, P.; Liu, S.; Zhang, J. Capacity Coordinated Optimization of Battery, Thermal and Hydrogen Storage System for Multi-Energy Complementary Power System. In Proceedings of the 2023 IEEE 6th International Electrical and Energy Conference (CIEEC), Hefei, China, 12–14 May 2023; pp. 765–770. [Google Scholar] [CrossRef]
  18. Duan, S.; Miao, S.; Huo, X.; Li, L.; Han, J.; Chao, K. Modeling and dynamic correlation analysis of wind/solar power joint output based on dynamic copula. Power Syst. Prot. Control 2019, 47, 35–42. [Google Scholar] [CrossRef]
  19. Yang, J.; Xie, L.; Song, X.; Ye, H.; Zhang, P.; Bian, Y. Optimal configuration of pv-fire-hydrogen polysilicon park based on multivariate copula function. Acta Energiae Solaris Sin. 2023, 44, 180–188. [Google Scholar] [CrossRef]
  20. Sun, H.; Wang, B.; Li, W.; Yang, C.; Wei, W.; Zhao, B. Research on inertia system of frequency response for power system with high penetration electronics. Proc. CSEE 2020, 40, 5179–5192. [Google Scholar] [CrossRef]
  21. Ren, K.; Zhang, D.; Huang, Y.; Li, C. Large-scale system inertia estimation based on new energy output ratio. Power Syst. Technol. 2022, 46, 1307–1315. [Google Scholar] [CrossRef]
  22. Bian, Y.; Wyman-Pain, H.; Li, F.; Bhakar, R.; Mishra, S.; Padhy, N.P. Demand side contributions for system inertia in the GB power system. IEEE Trans. Power Syst. 2018, 33, 3521–3530. [Google Scholar] [CrossRef]
  23. Li, D.; Sun, Y.; Xu, B.; Zhang, J.; Liu, Q. Minimum inertia and primary frequency capacity assessment for a new energy high permeability power system considering frequency stability. Power Syst. Prot. Control 2021, 49, 54–61. [Google Scholar] [CrossRef]
  24. Yi, P.; Jing, Z.; Xu, F.; Chen, L.; Qi, J.; Jiang, X.; Gao, X. Calculation of the critical inertia of a power system considering frequency security constraints. J. Tsinghua Univ. (Sci. Technol.) 2022, 62, 1721–1729. [Google Scholar] [CrossRef]
  25. Li, S.; Tian, B.; Li, H.; Luo, Y.; Huang, S.; Xu, S. Method for limiting wind power output in time periods based on frequency safety constraints and a critical inertia calculation. Power Syst. Prot. Control 2022, 50, 60–71. [Google Scholar] [CrossRef]
  26. Xiong, W.; Ma, Z.; Zhang, X.; Wang, K.; Zhou, Q.; Chen, W. Two-layer optimal dispatch of WF-PV-CSP hybrid power generation considering wind power and photovoltaic consumption. Acta Energiae Solaris Sin. 2022, 43, 39–48. [Google Scholar] [CrossRef]
  27. Sun, L.; Wang, W.; Wang, Y.; Wu, C. Optimal dispatch of Wind-photovoltaic-thermal-storage combined system considering minimum inertia constraints. Proc. CSU-EPSA 2024, 36, 30–38. [Google Scholar] [CrossRef]
  28. Hu, W.; He, L.; Chen, J.; Yu, T.; Meng, L. A bi-layer optimization based schedule considering large-scale electric vehicles. Power Syst. Prot. Control 2016, 44, 22–28. [Google Scholar] [CrossRef]
  29. Sun, L.; Shen, C.; Zhu, T.; Yang, G.; Yang, M.; Sun, Y. Electric vehicle charging load prediction and charging station planning considering traffic flow capture. Electr. Power Autom. Equip. 2024, 44, 263–270. [Google Scholar] [CrossRef]
Figure 1. Dual-layer optimization architecture of the transmission and distribution network.
Energies 18 05202 g001
Figure 2. Average Frequency Response Model of the System.
Energies 18 05202 g002
Figure 3. Illustrates the open-loop configuration of the frequency response model for a multi-machine system.
Energies 18 05202 g003
Figure 4. Structure of the bi-level optimization model.
Energies 18 05202 g004
Figure 5. Schematic diagram of Latin hypercube sampling.
Energies 18 05202 g005
Figure 6. Outputs and state diagram of each unit without inertia constraints: (a) Outputs and start-stop states of thermal power units; (b) Temporal outputs of wind, solar, thermal, and energy storage; (c) Energy storage outputs and charging/discharging states.
Energies 18 05202 g006
Figure 7. Outputs and state diagram of each unit with minimum inertia constraints: (a) Outputs and start-stop states of thermal power units; (b) Temporal outputs of wind, solar, thermal, and energy storage; (c) Energy storage outputs and charging/discharging states.
Energies 18 05202 g007
Figure 8. Frequency response curve of the system at 06:00 when disturbance occ: (a) Frequency response curve after disturbance; (b) Frequency variation rate curve after disturbance.
Energies 18 05202 g008
Figure 9. Frequency response curve of the system at 12:00 when disturbance occ: (a) Frequency response curve after disturbance; (b) Frequency variation rate curve after disturbance.
Energies 18 05202 g009
Figure 10. Energy storage and network losses without inertia constraints: (a) Spatiotemporal distribution of charging/discharging Energy Storage; (b) Network loss curve.
Energies 18 05202 g010
Figure 11. Energy storage and network losses with minimum inertia constraints: (a) Spatiotemporal distribution of charging/discharging Energy Storage; (b) Network loss curve.
Energies 18 05202 g011
Figure 12. Typical scenarios of wind, photovoltaic power and load: (a) Typical Scenarios for Wind Power Output; (b) Typical Scenarios for Photovoltaic Power Output; (c) Load Scenario.
Energies 18 05202 g012aEnergies 18 05202 g012b
Figure 13. (a) Dispatched output of thermal power units; (b) absorbed output of wind power; (c) absorbed output of pv power.
Energies 18 05202 g013aEnergies 18 05202 g013b
Table 1. Operating parameters of synchronous generator units.
Unit NumberPi,max/MWPi,min/MWabcRu/RdQJ
15751000.012438.5397786.798837539,372.519,686.25
25001000.0150846.1591945.633230080006000
34001500.02840.39651049.99815010,0007500
46002000.035438.30551243.53120020,00010,000
54001000.021136.32781658.5715010,0005000
64001000.017938.27041356.65915010,0005000
Table 2. Dynamic parameters of synchronous generator units.
Unit NumberHKRF
15.80.950.0450.75
25.80.950.0480.75
34.50.980.0510.65
45.80.980.0540.65
55.80.930.0550.75
64.50.930.0580.75
Table 3. Comparison of System Operating Costs and Stability.
ScenarioCosts/yuanComparison with Scenario OneStability
Scenario 1: Without inertia constraints194,170.69 Weaker robustness
Scenario 2: With minimum inertia constraints207,979.457.1% ↑Stronger robustness
↑ in the table denotes the cost increase rate relative to Scenario One.
Disclaimer/Publisher’s Note: The statements, opinions and data contained in all publications are solely those of the individual author(s) and contributor(s) and not of MDPI and/or the editor(s). MDPI and/or the editor(s) disclaim responsibility for any injury to people or property resulting from any ideas, methods, instructions or products referred to in the content.