Article

Impact of Ion Crossover on Mass Transfer Polarization Regulation in High-Power Vanadium Flow Batteries

by
Jianbin Li
1,*,
Zhengxiang Song
1 and
Zihan Li
2
1
School of Electrical Engineering, Xi’an Jiaotong University, Xi’an 710049, China
2
Emerging Green Energy and New Materials Research Institute Co., Ltd., Tianjin 300450, China
*
Author to whom correspondence should be addressed.
Energies 2025, 18(19), 5192; https://doi.org/10.3390/en18195192
Submission received: 20 June 2025 / Revised: 7 July 2025 / Accepted: 16 July 2025 / Published: 30 September 2025

Abstract

In order to solve the problems of mass transfer polarization spatiotemporal distribution variations, uncontrollable regulation error, and accelerated capacity decay caused by ion crossover in high-power vanadium liquid flow batteries (VFBs), a three-dimensional battery model with a flow-type flow field based on the three-dimensional transient COMSOL Multiphysics® 6.1 numerical modeling method was developed in this study. The model combines the ion transmembrane migration equation with the mass transfer polarization theory, constructs an objective function to quantify the regulation error, and is validated by multifluid-field structural simulations. The results indicate the following: (1) Ion crossover induces a 3–5% electrolyte concentration deviation and a current density distribution bias reaching 11%; (2) The intensity of mass transfer polarization exhibits a linear increase with the flow rate difference between the positive and negative electrodes; (3) Ion crossover significantly degrades system performance, causing Coulombic efficiency (CE) and Energy efficiency (EE) to decrease by 1.1% and 1.5%, respectively. This research demonstrates that unlike conventional flow field optimization, our strategy quantifies the regulation error by directly compensating for the ΔQ caused by ion crossing, and further regulation minimizes the effect, providing a theoretical basis for mass transfer intensification and capacity recovery in flow batteries.

1. Introduction

Vanadium flow batteries (VFBs) have become one of the core technologies for medium-to-long duration energy storage in intermittent renewable energy sources like wind and solar due to advantages such as long cycle life, high safety, and independent tunability of power/capacity [1]. However, under high-power VFB operation with large reaction areas and high current densities, the mass transfer kinetics deteriorate at the electrode surface, leading to significant intensification of ohmic polarization and mass transfer polarization (primarily concentration polarization) [2]. Simultaneously, side reactions (such as hydrogen evolution and self-discharge) induced by ion crossover further reduce system Energy efficiency and power density [3], increasing application costs and hindering commercialization [4].
To break through the Energy efficiency bottleneck, existing research focuses on the development of new materials [5,6] and optimization of membrane transport properties [7,8]. However, the development cycle for new materials is long and carries high cost risks. In contrast, flow field design and mass transfer polarization regulation (i.e., dynamic flow rate adjustment to compensate ion crossover) based on numerical simulation offer greater engineering feasibility [9]. This involves optimizing the electrode flow field design to regulate electrolyte mass transport, and enhancing the availability of reactants at electrode surface reaction sites, thereby reducing battery mass transfer polarization. Nevertheless, vanadium ions/protons migrate across the membrane in hydrated forms under osmotic pressure (i.e., ion crossover) [10], leading to electrolyte concentration/volume imbalance, altering mass transfer characteristics, and causing regulation errors [11]. Although recent studies have made progress in ion crossover modeling [12,13], hydration structure quantification [12], and transient migration analysis [14], the quantitative impact mechanism of ion crossover on mass transfer polarization remains unclear. Furthermore, existing flow field optimization studies (e.g., serpentine/interdigitated flow fields) can improve mass transfer uniformity [15,16], but are constrained by mechanical strength, process cost, etc., making them unsuitable for high-power modules. Flow-through flow fields are the preferred solution for high-power VFBs due to their structural robustness [17]. However, current three-dimensional models often neglect the coupling effect between ion crossover and side reactions [18,19], resulting in increased prediction deviations at high current densities [20].
Aiming at the lack of understanding of the coupling mechanism of ion crossing–mass transfer polarization in high-power VFBs, this study establishes a three-dimensional transient model integrating the ion crossing equation and the mass transfer polarization theory to quantify the effect of ion crossing on the mass transfer regulation in a coherent flow field. Through multi-structure flow field simulations, the mapping relationship between the polarization regulation error and the system performance is revealed, providing a theoretical basis for the design of high-power VFBs. Table 1 shows a comparison of recent VFB ion crossing and mass transfer regulation modeling approaches in terms of dynamic compensation mechanisms and spatiotemporal analysis advantages. This work advances previous mass transfer regulation approaches by integrating real-time ion crossover compensation, which eliminates uncontrolled errors caused by electrolyte imbalance [20]. The main innovation of this work is the first combination of dynamic ion crossover effects with real-time capacity loss quantification for asymmetric electrode configurations. Specifically, a direct correlation between vanadium concentration gradients and nonlinear efficiency decay was established and the difference in flow rate due to ion crossing was quantified as a direct correction factor for mass transfer polarization, thus enabling error-compensating flow field design to improve efficiency.

2. VFB Modeling

The flow-through VFB with inlet/outlet flow guiding structures (Figure 1a,b) consists of a stack formed by bolting together two stainless steel end plates, two positive/negative current collectors, two inlet/outlet flow guide frames, two porous electrodes (SGL Carbon) integrated with bipolar plates, and an ion-conducting membrane (Nafion 117) sandwiched in the middle. The inlet/outlet flow guide frames and the porous electrodes together form the flow-through flow field for electrolyte flow, as shown in Figure 1c,d. The inlet/outlet flow guide frame contains an inlet flow channel and an outlet collection channel (designed as an asymmetric structure in this work). Electrolytes flow into and out of the electrodes through these guide frames. This structure enables large electrode reaction areas and is primarily used in high-power vanadium flow batteries. The electrolyte composition is 1.7 mol/L VO2+, 4 mol/L H2SO4, with 10 L each for the positive and negative electrolytes.

2.1. Battery Model and Computational Domain

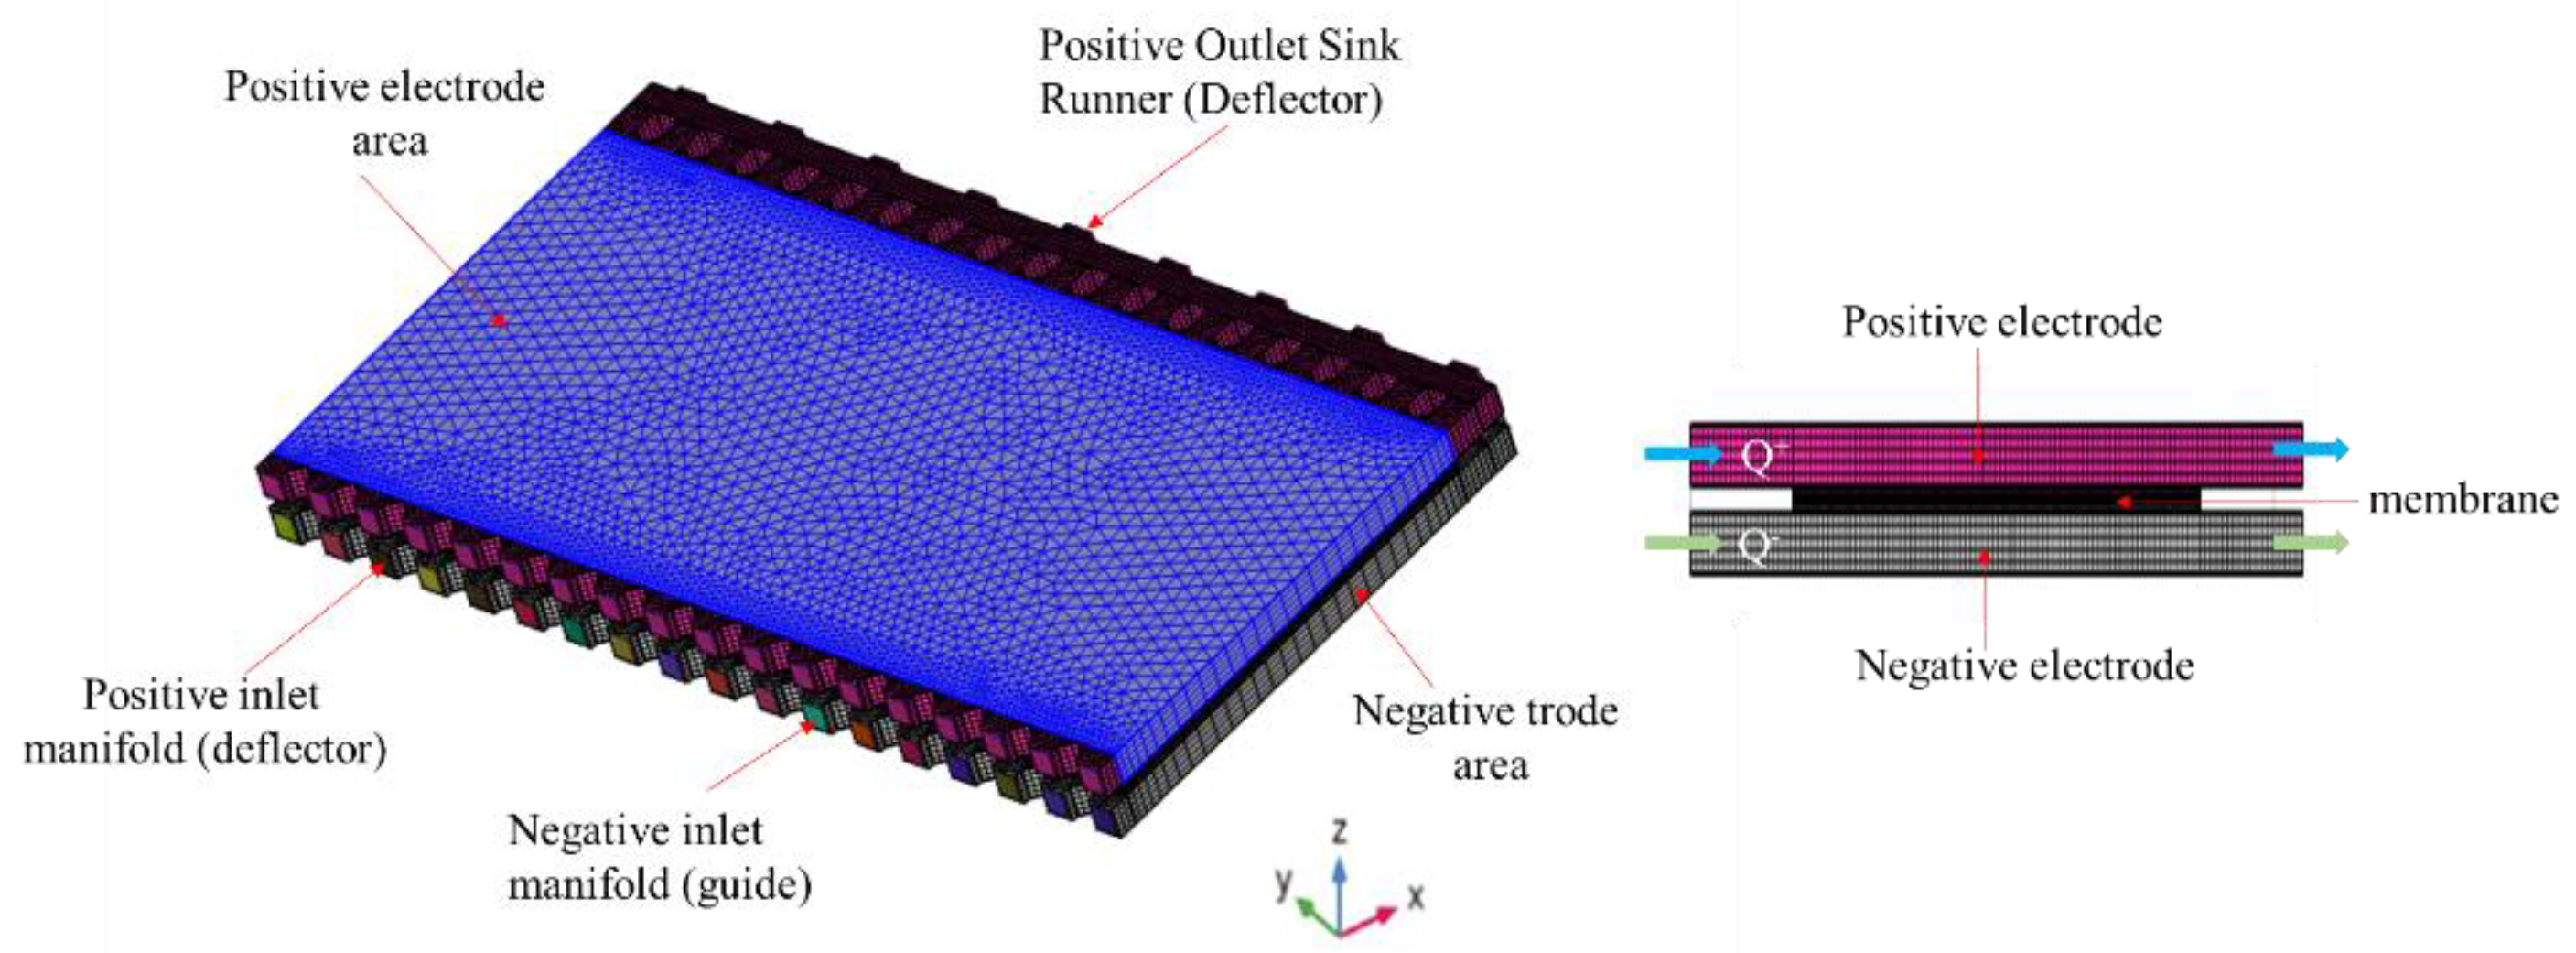
This study establishes a three-dimensional numerical model of a vanadium flow battery to investigate the impact of ion crossover on mass transfer polarization regulation. The model adopts the flow-through plug-flow field mode of the high-power module described in Figure 1. The model mesh geometry is shown in Figure 2, including positive/negative porous electrodes, an ion-conducting membrane, and inlet/outlet ports connected to the electrodes via inlet/outlet flow guide channels. Electrolytes flow into the inlet flow guide channel via the inlet port and enter the interior of the porous electrode after initial distribution. Model parameters are listed in Table 2. The current density ranges between 80 and 160 mA cm−2, the state of charge (SOC) ranges from 0.1 to 0.9, and the single-cell open-circuit voltage varies between 1 V and 1.7 V.
To simplify calculations, the model is based on the following assumptions: (1) The electrolyte is a homogeneous, incompressible fluid at any location within the battery. (2) The vanadium ion concentration gradient in the electrolyte exhibits a linear distribution along the outlet direction. (3) Interactions between vanadium ions, sulfate ions, and protons are neglected; (4) Gas side reactions and bypass currents are neglected. (4) Isothermal operation at 298 K (±1 K) maintained by external cooling, consistent with experimental conditions. Based on these assumptions, the multiphysics coupling calculations of the momentum conservation equation, material (mass) conservation equation, charge conservation equation, and the reaction kinetics Butler–Volmer equation are implemented using the finite element method and Lagrange-quadratic approach via the software COMSOL Multiphysics 6.1. The model mesh is divided using hexahedral elements, with a relative error tolerance of 1.0 × 10⁻⁶. Assumptions (1)–(4) align with widely adopted VFB models [10,20,21] to balance accuracy and computational efficiency.

2.2. Mass Transfer Polarization Theory

During the VFB charging/discharging process, reactants in the electrolyte are transported to the electrode surface where electrochemical reactions occur on the porous electrode surface. Reaction products are subsequently transferred back into the electrolyte. This continuous cycle is termed the mass transfer process [22]. When the reactants transported to the electrode surface are insufficient to maintain the redox reaction rate, a concentration gradient forms between the reactants near the electrode and the bulk electrolyte, causing the electrode potential to deviate from its equilibrium potential. This phenomenon is known as mass transfer polarization [23]. Mass transfer polarization is essentially concentration polarization. According to Fick’s law, the flux of species i is J i = D i C i Δ t . At the electrode surface, the concentration overpotential η c relates to surface/bulk concentration difference: η c = R T n F ln C b u l k C s u r f a c e , combining with material balance under flow rate Q: Q C b u l k C s u r f a c e = I n F . Solving for C s u r f a c e and substituting into η c yields Equation (1):
η c C i , Q , I = R T n F I n F Q C i S O C
where η c represents the mass transfer polarization overpotential (V), F = 96,485 C/mol is the Faraday constant, n is the number of electrons transferred in the reaction, R = 8.314 J/(mol·K) is the gas constant, T is the standard laboratory temperature, Q is the electrolyte flow rate (L·min−1), C i (i = 2, 3, 4, 5) is the concentration of vanadium ions at various valence states, and I is the charging/discharging current. From Equation (1), it can be seen that the charging/discharging current I, electrolyte flow velocity Q, and reactant concentration affect the VFB mass transfer polarization η c . Higher flow rates and reactant concentrations help reduce mass transfer polarization.
For high-power VFBs, mass transfer polarization is primarily caused by limitations in reactant mass transport. The relationship between the voltage E c e l l of a stack composed of N single cells and the mass transfer polarization overpotential is
E c e l l = N E 0 + R T n F I n c 2 c 3 c 5 c 4 I R c o m η c
where E o = 1.255 V is the standard potential, and R c o m represents inherent ohmic polarization. Stack voltage is affected by vanadium concentration changes and mass transfer polarization.

2.3. Ion Crossover Reactions

The positive and negative electrolytes of a VFB consist of the redox couples V O 2 + / V O 2 + and V 2 + / V 3 + dissolved in H 2 S O 4 . During charging, positive and negative electrolytes are pumped from storage tanks to the battery reaction zone. Oxidation of V O 2 + to V O 2 + occurs at the positive electrode, and reduction of V 3 + to V 2 + occurs at the negative electrode. The reactions are reversed during discharge. The overall reactions are as follows: Positive electrode: V O 2 + + H 2 O V O 2 + + 2 H + + e . Negative electrode: V 3 + + e V 2 + . Due to effects such as permeation and convection, vanadium ions of different valence states on either side of the ion-conducting membrane can migrate across the membrane and cause side reactions, known as ion crossover [10]. Specifically, V O 2 + and V O 2 + ions migrate from the positive electrode through the membrane to the negative electrode, where they are reduced by V 2 + and V 3 + . Similarly, V 2 + and V 3 + ions migrate from the negative electrode to the positive electrode, where they are oxidized to V O 2 + . The vanadium ion crossover reaction equations are as follows:
Positive Electrode:
V 2 + + 2 V O 2 + + 2 H + 3 V 3 + + H 2 O V 3 + + V O 2 + 2 V O 2 +
Negative Electrode:
V O 2 + + V 2 + + 2 H + 2 V 3 + + H 2 O V O 2 + + 2 V 2 + + 4 H + 3 V 3 + + 2 H 2 O
where total positive electrode reaction equation (cross over V2+ oxidation): V 2 + + 2 V O 2 + + 2 H 2 O 2 V O 2 + + 4 H + . Anodic oxidation releases 1e. Negative electrode total reaction equation (reduced cross VO2+): V O 2 + + 2 V 2 + + 4 H + 2 V 3 + + 2 H 2 O . Cathodic reduction consumes 1e. To analyze the impact of ion crossover on the dynamic mass transfer process, based on the law of mass conservation and reactions (3) and (4), dynamic differential equations describing vanadium ion concentration and electrolyte volume affected by ion crossover are established [24]:
V t k Δ V c H 2 O d c 2 d t = N A m J V 2 + 2 J V 5 + J V 4 N I F V t k V t k Δ V c H 2 O d c 3 d t = N A m J V 3 3 J V 5 2 J V 4 + N I F V t k V t k Δ V c H 2 O d c 4 d t = N A m J V 4 3 J V 2 2 J V 3 + N I F V t k V t k Δ V c H 2 O d c 5 d t = N A m J V 5 + 2 J V 2 + J V 3 N I F V t k
where V t k represents the electrolyte volume (L), J V i ( i = 2 , 3 , 4 , 5 ) represents the transmembrane crossover diffusion flux of vanadium ions at valence i (according to Fick’s law: J V i = k i d C i / d d m ), dm represents the membrane thickness (m), k i ( i = 2 , 3 , 4 , 5 ) represents the diffusion coefficient of vanadium ions at valence i (see Table 3), A m represents the membrane surface area (m2); N represents the number of single cells, F is the Faraday constant. The first term on the right side of Equation (5) describes the rate of change in vanadium ion concentration caused by ion crossover; V c H 2 O (m3/s or L·min−1) on the left side of Equation (6) represents the volume change in the positive/negative electrolytes caused by water molecule migration across the membrane [12]. During prolonged charging, the positive electrolyte volume tends to decrease ( V c H 2 O < 0 ), and the negative volume tends to increase. The opposite occurs during discharge: the positive volume tends to increase ( V c H 2 O > 0 ) and the negative volume tends to decrease. Based on the volume migration mechanism, an expression for the water migration volume change V c H 2 O caused by ion crossover is established:
Δ V c H 2 O = N A m ρ d m i = 2 4 M i k i C i Δ t + k p μ w p o s m N A m d m Δ t
where M i (i = 2, 3, 4, 5) represents the molar mass of vanadium ions at valence i (kg/mol), ρ is the electrolyte density (kg/m3), its change is negligible, k p and μ w represent water permeability and viscosity (Pa·s), k i represents the ion membrane permeability coefficient, p o s m represents osmotic pressure (Pa). The first term on the right side represents the volume change caused by vanadium ion transmembrane migration carrying their hydrated water molecules (V2+·6H2O, V3+·6H2O, VO2+·5H2O, VO2+·4H2O) [25]. The second term represents the electrolyte volume change caused by osmotic pressure. Osmotic pressure is given by the van’t Hoff formula p o s m = N C 4 + C 5 C 2 + C 3 R T d m [12]. During long-term battery operation, the cumulative effect of water migration caused by ion crossover leads to positive/negative electrolyte volume imbalance (e.g., positive volume increase, negative volume decrease), thereby altering their mass transfer characteristics.

3. Relationship Between Ion Crossover and Mass Transfer Polarization Regulation

Mass transfer polarization regulation aims to enhance the uniformity of mass transfer distribution and reduce mass transfer resistance by optimizing flow field structural design and adjusting electrolyte transport parameters. However, changes in the composition and volume of positive/negative electrolytes caused by ion crossover exacerbate the mass transfer polarization process [20]. Therefore, this section first establishes the relationship of ion crossover’s impact on mass transfer polarization and then constructs an equivalent flow resistance function relationship for the mass transfer polarization regulation flow field that reflects the influence of ion crossover.

3.1. Quantification of Ion Crossover Impact on Mass Transfer Characteristics

As known from Section 2.3, the volume change in positive/negative electrolytes caused by ion crossover, V c H 2 O , leads to pressure imbalance between the positive and negative electrodes. Assuming consistent viscosity μ for both electrolytes, the relationship between the rate of water migration volume change V c H 2 O and the pressure drop difference between positive and negative electrodes can be derived based on Darcy’s law [27]:
Δ V c H 2 O Δ t = k m A m μ d m Δ p e N Δ p e P
where k m is the ion-conducting membrane permeability coefficient, μ is the electrolyte viscosity (mPa·s), p e N and p e P represent the pressure drop in the electrode region for the negative and positive electrolytes, respectively (Pa). Combining the relationship between the pressure drop in the electrode region ΔPe and the electrolyte volume flow rate Q (ΔPe∝Q specific form depends on the flow field) and substituting Equation (7), the relationship between V c H 2 O and the flow rate difference ΔQ between positive and negative electrolytes caused by ion crossover can be obtained:
Δ Q = Δ V c H 2 O Δ t 2 d m k e L k m
where Q represents the flow rate difference between positive and negative electrolytes caused by ion crossover, L represents the electrode length, and k e represents the permeability of the porous electrode.
In summary, ion crossover causes a flow rate difference ΔQ between positive and negative electrodes under steady-state operation by inducing changes in positive/negative pressure drops, thereby affecting the effectiveness of mass transfer polarization regulation. According to Equation (1), under a constant charging/discharging current I, ΔQ causes the actual positive/negative flow rates to deviate from their designed (rated) values, thus increasing mass transfer polarization ηc.

3.2. Mass Transfer Regulation Design Considering Ion Crossover

In the electrode flow field region, mass transfer polarization, electrolyte flow, and battery pressure drop are strongly coupled [28]. This paper designs a flow-through flow field with an asymmetric upper and lower inlet/outlet flow guiding structure (Figure 1c). Using COMSOL simulation, an equivalent flow resistance model R ~ for this flow field is established, as shown in Figure 3. R ~ is a function of the number of inlet flow channels n, the number of outlet collection channels m, and the channel width l, i.e., R ~ m , n , l .
To account for the influence of the flow rate difference ΔQ caused by ion crossover, the average flow rate needs to be corrected. This is completed by combining the equivalent flow resistance R ~ with the flow rate–pressure drop relationship ( Q ¯ = P e / R ~ ), to quantify the effect of ion crossover on mass transfer polarization modulation and pressure drop by establishing the relationship between mass transfer polarization modulation and pressure drop, i.e., constructing the equivalent flow resistance as a function of electrode pressure drop based on the evaluation of the flow field design.
Δ p e _ c r o = R ˜ Q ¯ ± Δ Q
where P e _ c r o indicates the value of electrode pressure drop for ionic cross-influence (Pa). This relationship aims to guide flow field design (adjusting m, n, l) to optimize mass transfer polarization regulation in the presence of ΔQ.

4. Results and Discussion

4.1. Model Validation

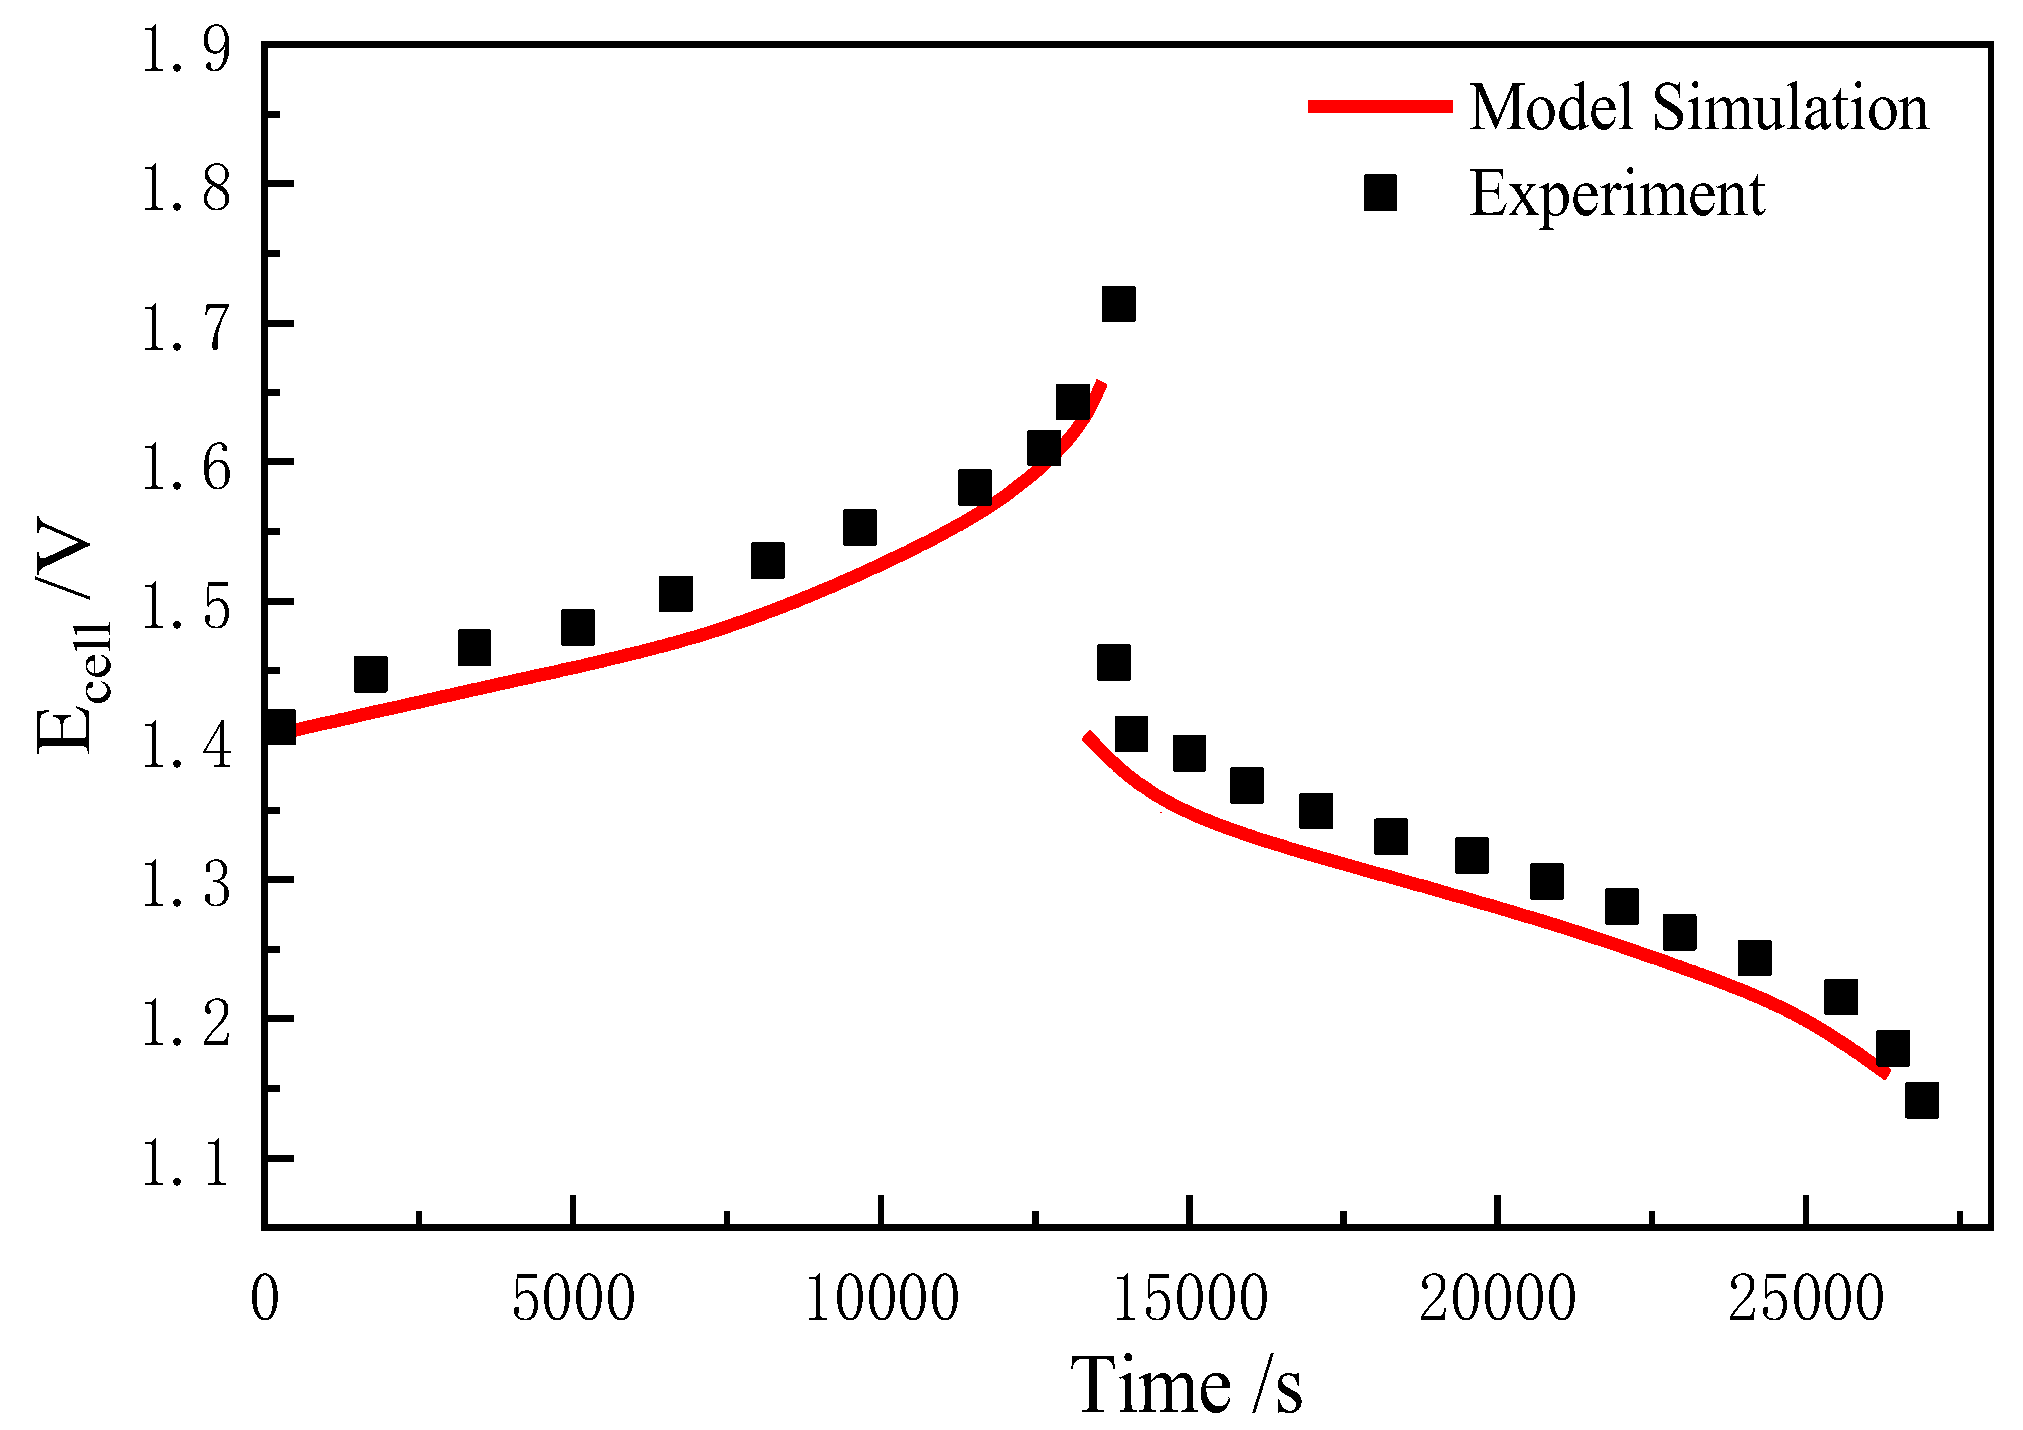
To validate the model’s accuracy, experimental data obtained from the setup shown in Figure 1a was used to calibrate the model run in COMSOL Multiphysics 6.1 under identical parameter settings. Experimental conditions: experiments were performed at room temperature using electrodes (SGL Carbon GFD 4.6 EA, Adelphia, Germany) and diaphragms (Nafion 117) of batches standardized by supplier batch number. Data acquisition was performed using an Arbin 2000 with a sampling frequency of 1 Hz, terminating when the current fell below 10 mA or the voltage reached 1.0 V (discharge)/1.7 V (charge). Each test was repeated three times with a root mean square error of less than 2% (Figure 4).
Figure 4 shows a comparison of simulated and experimental charge/discharge curves. As shown, the voltage during the charging phase is significantly higher than during discharge. This is primarily because charging is an oxidation process of vanadium ions, requiring an external voltage to overcome the reaction energy barrier, especially at high current densities and towards the end of charging when the reactant concentration gradient increases, necessitating a higher voltage. Discharging is a spontaneous reduction process; the output voltage is determined by the reaction’s thermodynamic equilibrium; hence, it is lower. Error analysis shows the maximum voltage error during charging is 1.5%, and during discharging is 2.0%. Errors primarily originate from neglecting the Donnan potential effect in the model and potential changes in the porous electrode structure during charge/discharge cycles.

4.2. Ion Crossover Characteristics

This section references the method in [10] to study the distribution of electrolytes along the flow direction affected by ion crossover, comparing characteristic changes under conditions with and without ion crossover. The focus is on the impact of vanadium ion crossover on electrolyte concentration distribution and reaction current density distribution, which reflect changes in the mass transfer process.
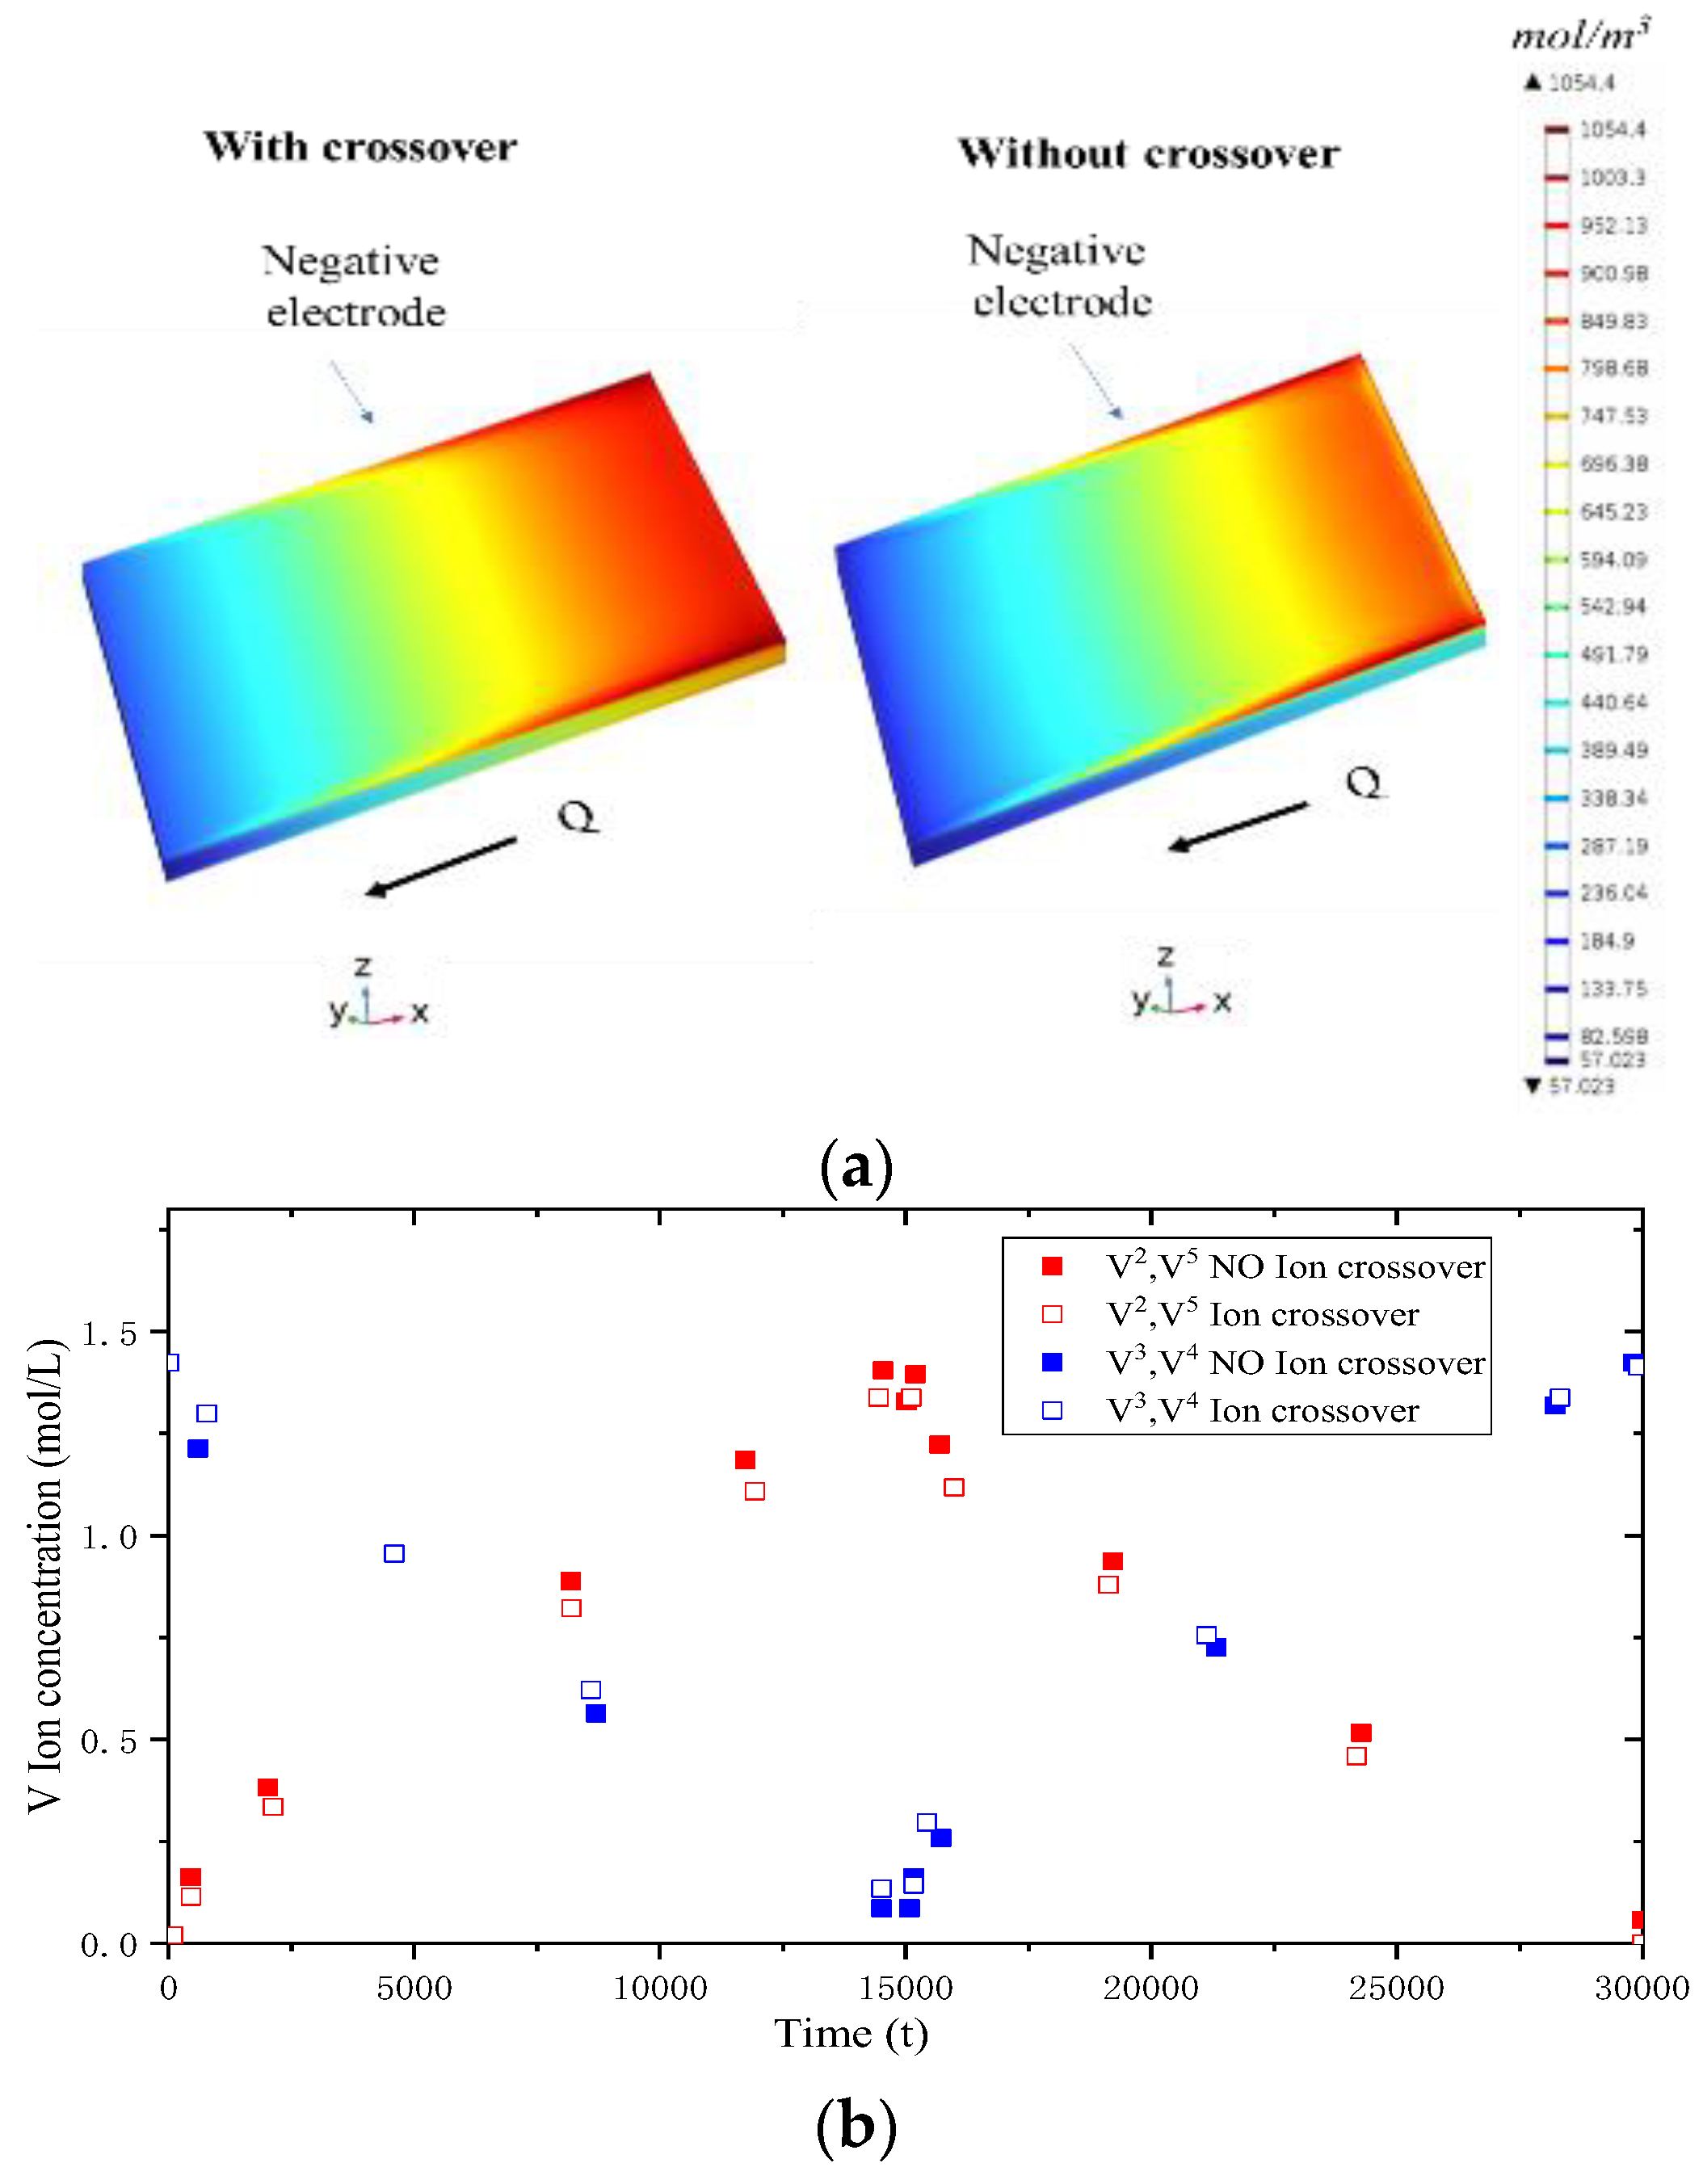
Vanadium Crossover and Concentration Distribution. During battery charging/discharging, reactant ion concentration gradually decreases along the electrolyte flow direction. Figure 5a shows a simulation comparison of reactant concentration gradients in the negative half-cell at SOC = 0.2 (early charging stage) with and without considering ion crossover. Significant concentration gradients exist along the flow direction in the early charging stage, with higher concentrations at the electrode edges than in the center. Ion crossover significantly affects the negative electrolyte concentration gradient: when ion crossover is considered, the electrolyte concentration at the electrode outlet is about 5.4% lower than without considering crossover. This indicates ion crossover exacerbates the non-uniformity of concentration distribution. Figure 5b compares the average concentrations of vanadium ions at various valences during charging/discharging with and without considering ion crossover. Overall, the differences are relatively small, with average deviations in the range of 3–5%. Specifically, when ion crossover is considered, V2+ and VO2+ concentrations are lower than without crossover, mainly due to their consumption in crossover side reactions; whereas V3+ and VO2+ concentrations are higher than without crossover, resulting from the generation of these ions in crossover side reactions.
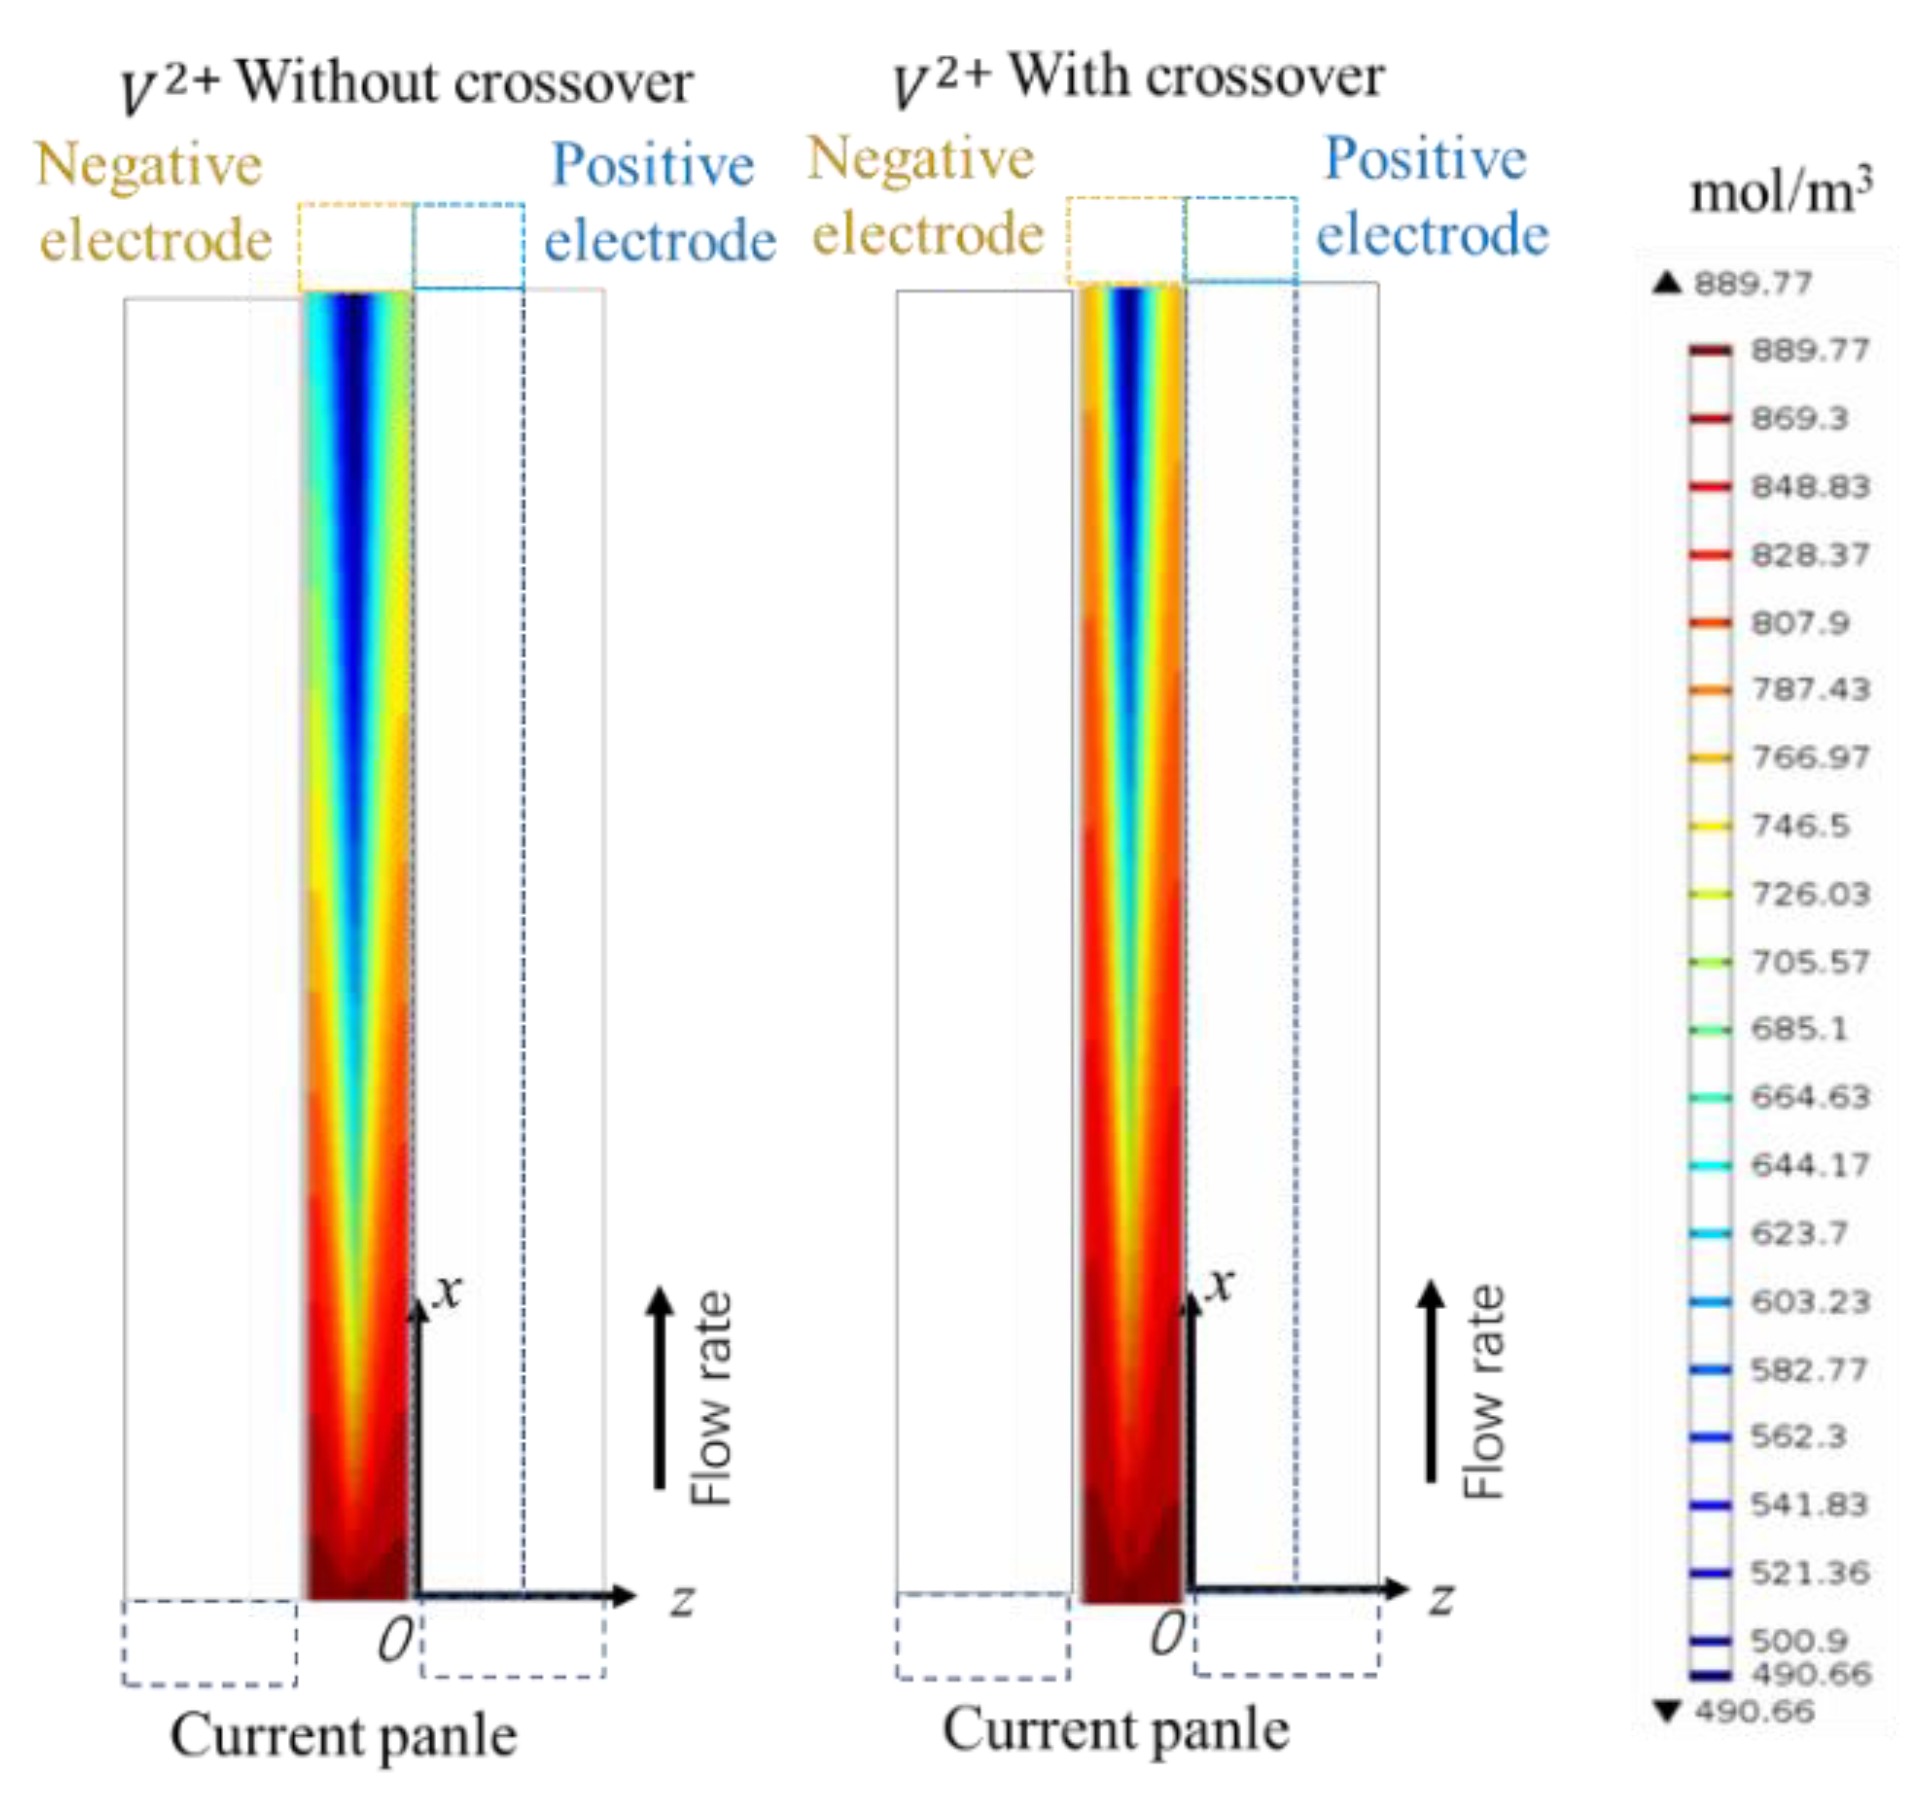
Figure 6 shows the concentration distribution of V2+ ions (significantly affected by ion crossover due to high diffusivity) in the negative electrolyte at SOC = 0.8. Without considering ion crossover, the V2+ concentration distribution is more uniform with a smaller gradient. When ion crossover is considered, its distribution non-uniformity intensifies. This is mainly because V2+ has high diffusivity, its concentration changes significantly, and the concentration is higher near the membrane side where V2+ readily reacts with VO2+ crossing from the positive electrode to form VO2+ via side reactions, consuming V2+ and altering its local concentration.
Figure 7 shows the net depletion of active substance due to ionic cross side reactions. Figure 7a shows the loss of active substance due to the ion-crossover side reaction: after 100 cycles, the net consumption of V²⁺ amounted to 0.27 mol, or 3.1% of the total initial amount. This loss is positively correlated with the current density (R2 = 0.96) and is the main cause of the decrease in Coulombic efficiency. Figure 7b The side reaction rate is highest in the electrode-membrane interface region (up to 3.2 × 10⁻³ mol m−3 s−1), consistent with the distribution of the V2+/VO2+concentration gradient.
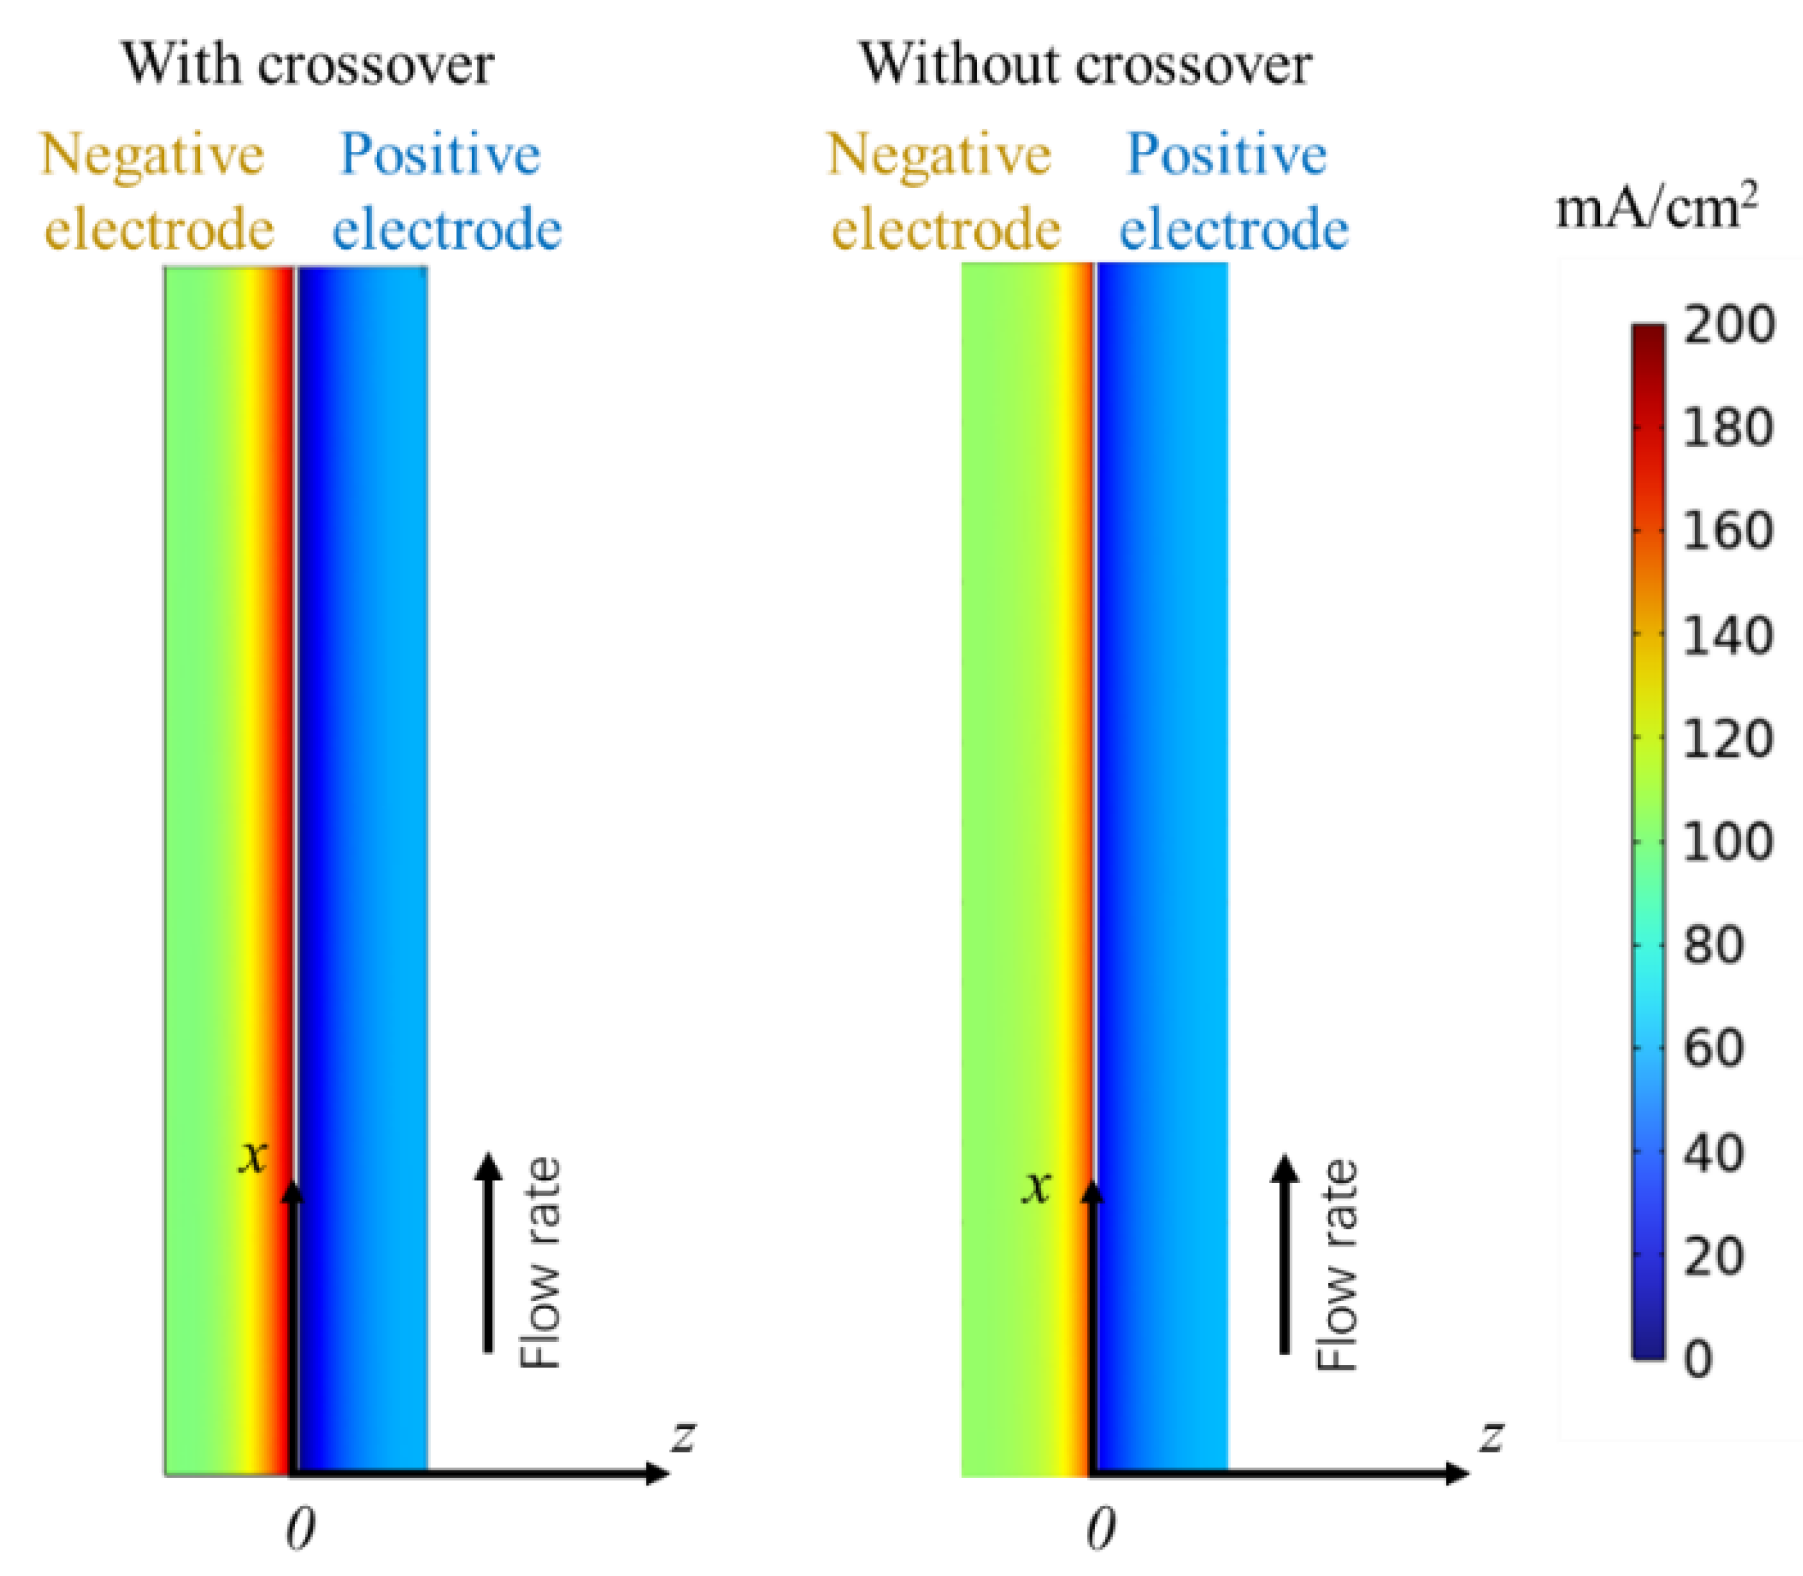
Vanadium Ion Crossover and Current Density Distribution. The model simulated the reaction current density distribution with and without ion crossover under rated flow rate 1 L·min−1, constant discharge current 10 A (corresponding to an average current density of ~41.67 mA/cm2, based on electrode area 0.24 m2), and SOC = 0.5. Results are shown in Figure 8. The reaction current density is higher in the region close to the ion-conducting membrane and gradually decreases towards the current collectors on both sides. The impact of ion crossover on the negative electrode reaction current density distribution is more significant. When ion crossover is considered, the average reaction current density in the negative and positive electrodes decreases by about 11% and 5% (the current density reduction stems from crossover-induced side reactions (Equation (4))), respectively, compared to without crossover. Without ion crossover, the current density distribution is relatively more uniform. This is primarily because ion crossover side reactions consume active material (vanadium ions), reducing the vanadium ion flux available for the main reaction, thereby lowering the average current density and disrupting its distribution uniformity.

4.3. Quantification of Ion Crossover Impact on Mass Transfer Polarization Regulation

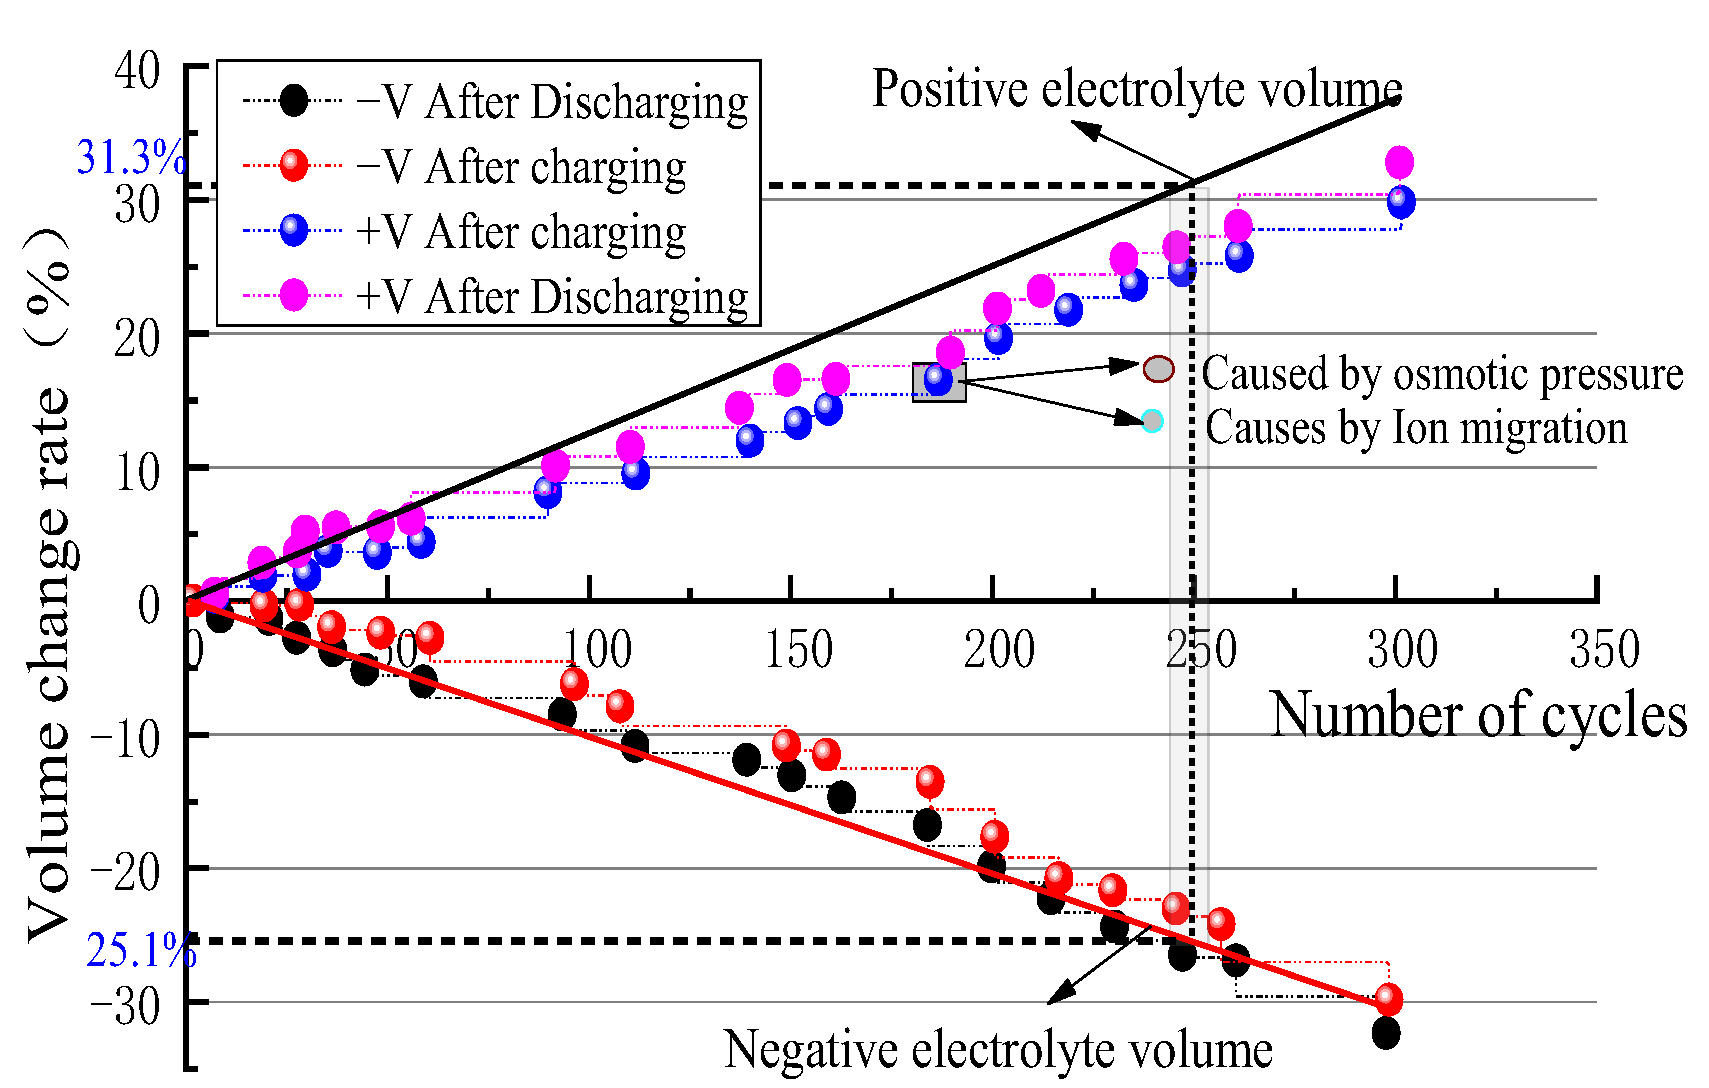
Relationship Between Ion Crossover and Mass Transfer Polarization. Figure 9 shows the simulated change in positive and negative electrolyte volumes with charge/discharge cycle number when ion crossover is considered. The simulation, based on a module composed of six single cells, was run for 300 charge/discharge cycles at a current density of 160 mA/cm2 and a single-cell flow rate of 1.2 L·min−1. It can be seen that as the number of cycles increases, the positive electrolyte volume gradually increases, while the negative electrolyte volume correspondingly decreases. After 250 simulated cycles, the positive volume increases by about 6.2% (from initial 10 L to ~10.62 L), and the negative volume decreases by about 6.2% (to ~9.38 L). The water migration volume change V c H 2 O recorded during the 245th cycle is approximately 11 mL. This clearly indicates that the water migration effect caused by ion crossover leads to a cumulative intensification of positive/negative electrolyte volume imbalance over cycling time.
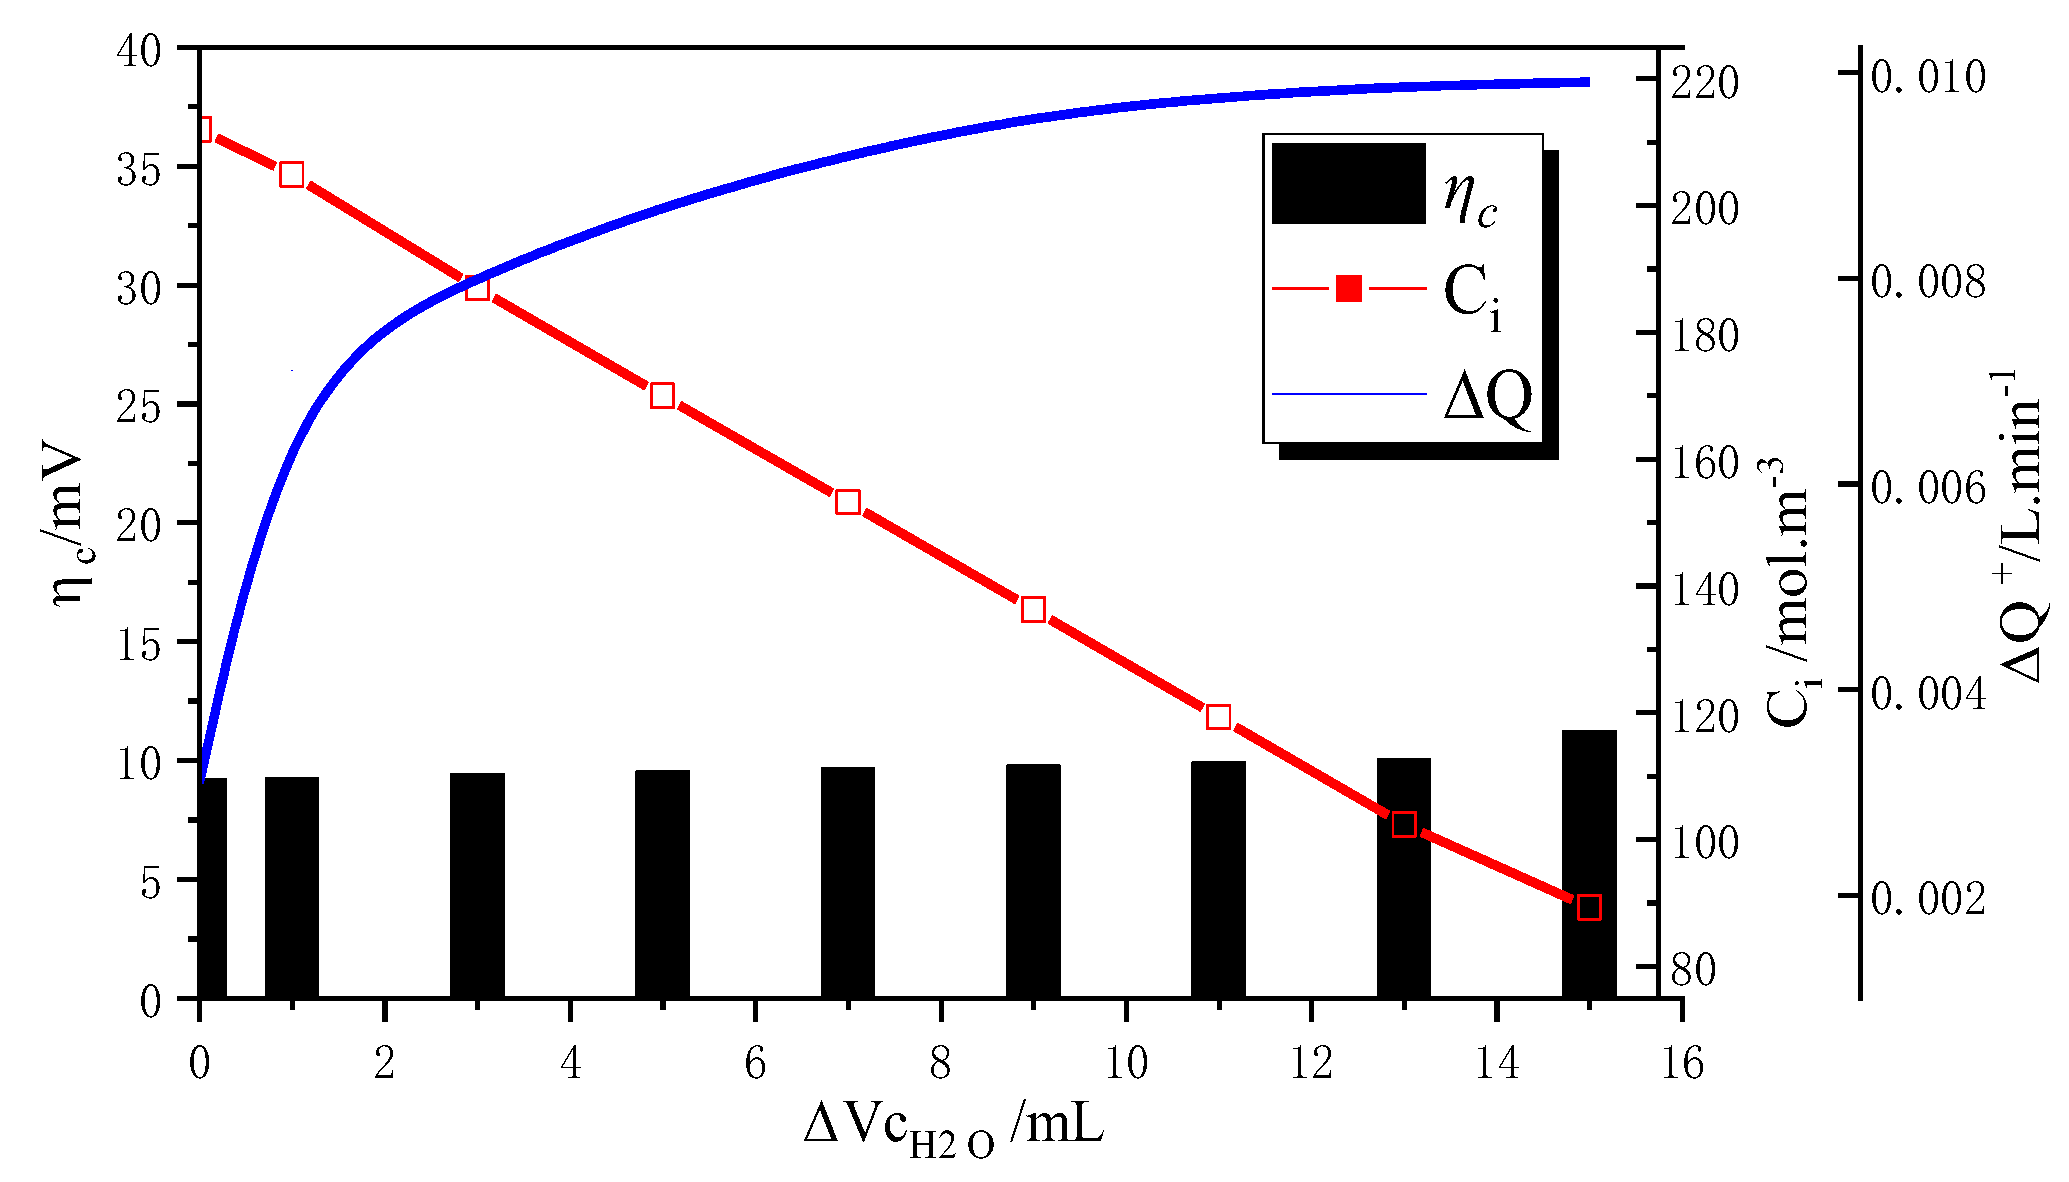
Figure 10 shows the relationship between the mass transfer polarization overpotential η c and the flow rate difference ΔQ caused by water migration under different cumulative water migration amounts V c H 2 O . Based on V c H 2 O data collected during charging/discharging, the corresponding ΔQ and η c were analyzed. As shown, as V c H 2 O slowly increases, and both ΔQ and η c show a non-linear increasing trend. Within the V c H 2 O range of 0–15 mL, the mass transfer polarization overpotential η c increases from 0 mV to about 10 mV. The flow rate difference ΔQ increases with V c H 2 O in the range of 0 to ~0.0099 L·min−1, reaching a maximum ΔQ ≈ 0.0099 L·min−1 at V c H 2 O ≈ 15 mL. This indicates that as the reaction proceeds and active material is consumed, the cumulative water migration amount V c H 2 O increases, leading to an increase in the steady-state flow rate difference ΔQ. The increase in ΔQ further exacerbates the imbalance in electrolyte concentration distribution, thereby increasing the mass transfer polarization overpotential η c . The nonlinear rise in η c at V c H 2 O >10 mL (Figure 9) aligns with Equation (8)’s prediction: ΔQ∝ V c H 2 O amplifies concentration gradient, causing exponential η c growth beyond ΔQ > 0.01 L·min−1. This validates the threshold where flow control becomes essential, consistent with the theoretical relationship established in Section 3.1. ΔQ > 0.01 L·min−1 causes η c saturation (>15 mV), beyond which irreversible depletion occurs for >80% of the actives, indicating a threshold beyond which regulation requires active flow control.
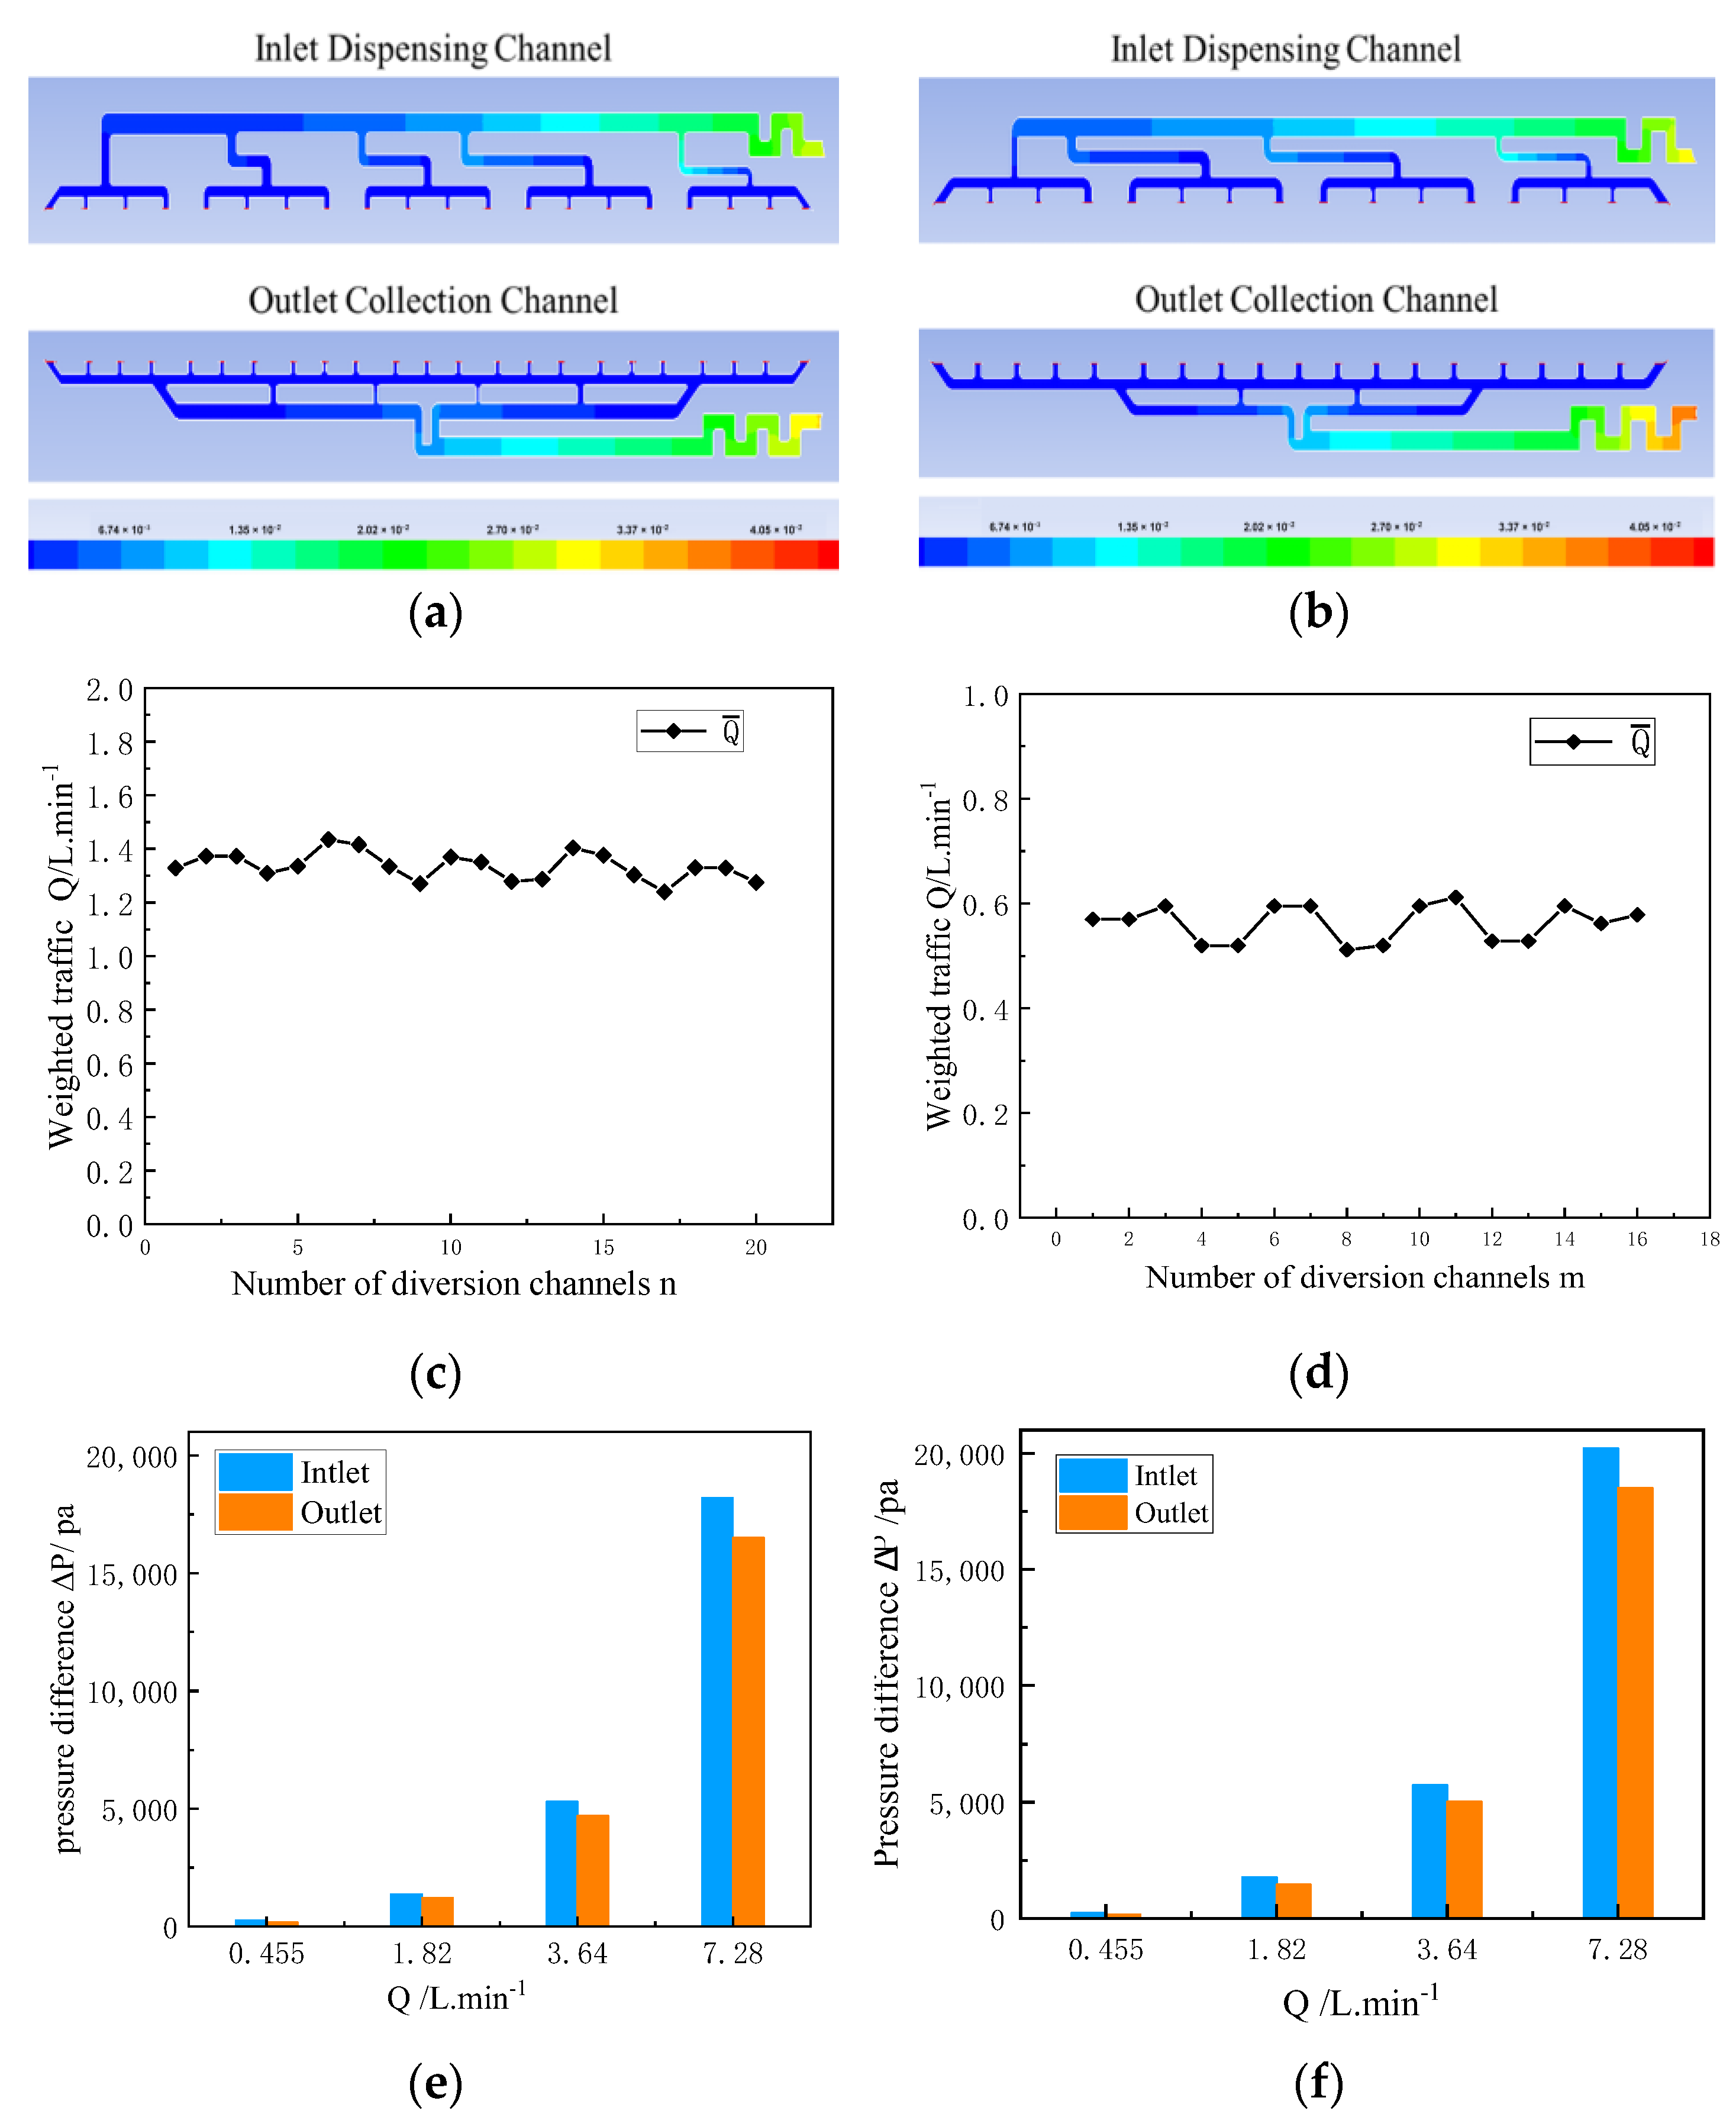
Mass Transfer Polarization Regulation Flow Field Design. Flow field structure optimization is the primary means to regulate mass transfer polarization. This paper designed two different asymmetric inlet/outlet flow guiding structures (VFB-1 and VFB-2) for simulation comparison; their design parameters are listed in Table 4. The electrode reaction area for both structures is 2200 cm2. Figure 11a,b show the pressure drop distribution within the flow channels of the two structures, indicating a basically uniform distribution. Figure 11c,d show the weighted flow rate distribution in the flow channels. In terms of flow uniformity (defined as (1—flow velocity standard deviation/average flow velocity) × 100%), VFB-1 has a uniformity above 77.3%, and VFB-2 above 73.5%. Figure 11e,f show the relationship between total pressure drop at the inlet/outlet and flow rate for both structures. The inlet total pressure drop is generally slightly higher than the outlet. Both inlet and outlet pressure drops increase significantly with flow rate. At the rated flow rate of 1.8 L·min−1, the pressure drop of VFB-1 is over 13% lower than that of VFB-2. The pressure difference for both structures at the maximum simulated flow rate is below 2000 Pa, meeting the requirement relative to the system design margin of 50,000 Pa for inlet/outlet pressure difference. The 13% pressure drop reduction in VFB-1 exceeds the 5–10% improvement reported for serpentine designs [17], demonstrating superior suitability for high-power stacks. Overall, the VFB-1 structure performs better in flow uniformity and pressure drop, exhibiting superior mass transfer regulation capability compared to VFB-2. While VFB-1 improves flow uniformity and reduces pressure drop, the increase in the number of guide frame runners increases the manufacturing cost by less than 5% compared to the monolithic design of VFB-2. Economic analysis shows that only systems larger than 1 MW can justify paying a cost premium of less than 9% for the increased EE. However, for smaller installations (under 2 kW), VFB-2 is still the preferred choice because of its slightly reduced cost and smaller impact on system efficiency.
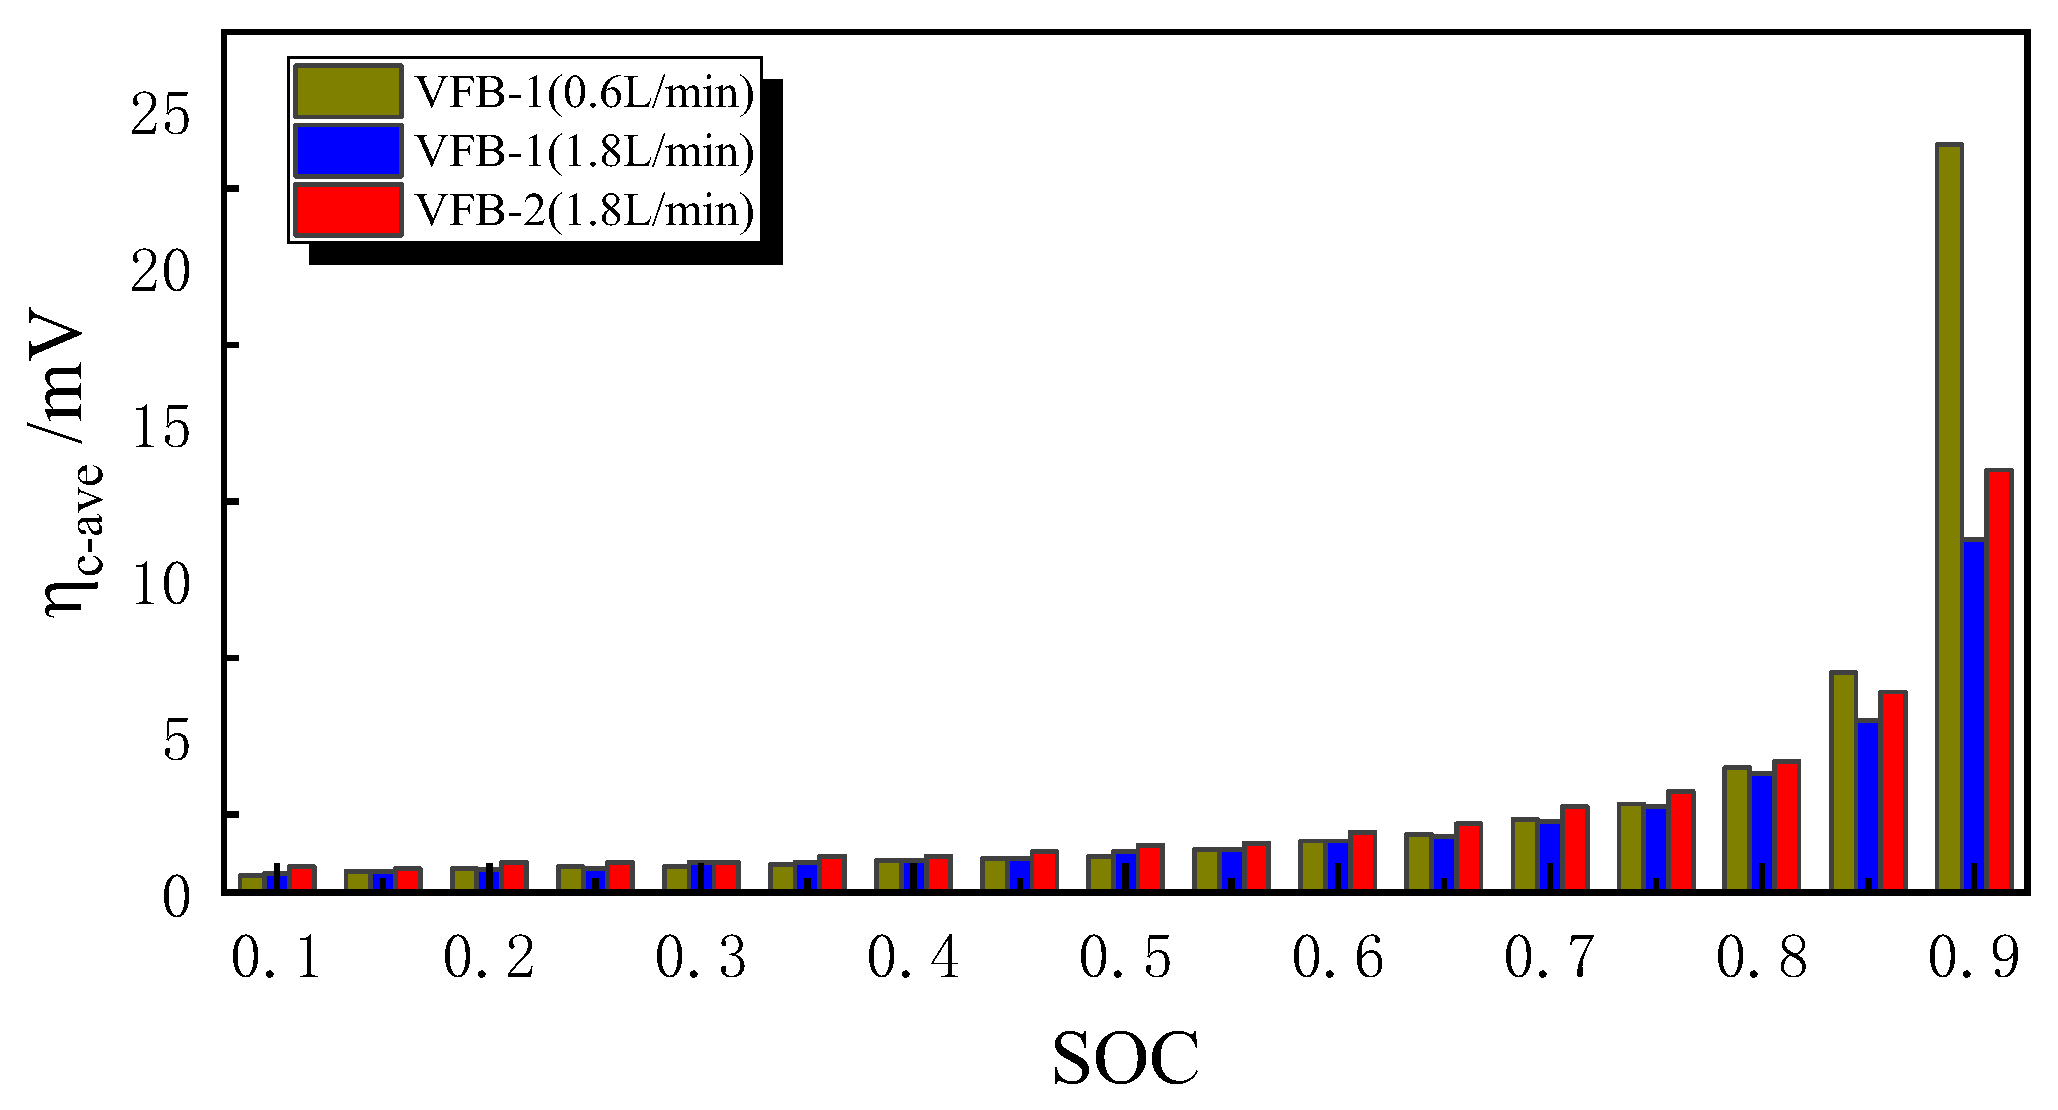
Figure 12 compares the distribution of mass transfer polarization overpotential η c versus SOC in half-cells employing the VFB-1 and VFB-2 flow fields at different flow rates. Simulations were conducted at a rated current density of 120 mA/cm2, with flow rates of 1.82 L·min−1 and 0.6 L·min−1. When SOC < 0.8, the difference in η c between the two flow field structures and the impact of flow rate on η c are not significant; η c increases slowly with SOC. When SOC > 0.8 (end of charging), η c rises rapidly with the charging process. At a low flow rate (0.6 L·min−1), the increase in η c for VFB-1 is the largest; whereas at a high flow rate (1.82 L·min−1), the increase in η c for VFB-1 is the smallest. This trend generally matches results reported in the literature [20]. The main reasons are that VFB-1 is an optimization of VFB-2, with more reasonable flow velocity and concentration distributions, significantly improving the spatial uniformity of mass transfer. This results in stronger suppression of mass transfer polarization at high flow rates and relatively less impact from flow rate reduction. At the end of charging/discharging (SOC > 0.8), reactant concentration imbalance intensifies sharply, leading to a larger increase in η c . At low flow rates, severe insufficient reactant transport is the dominant factor causing the rapid increase in η c , where the advantage of flow field structure optimization is diminished.
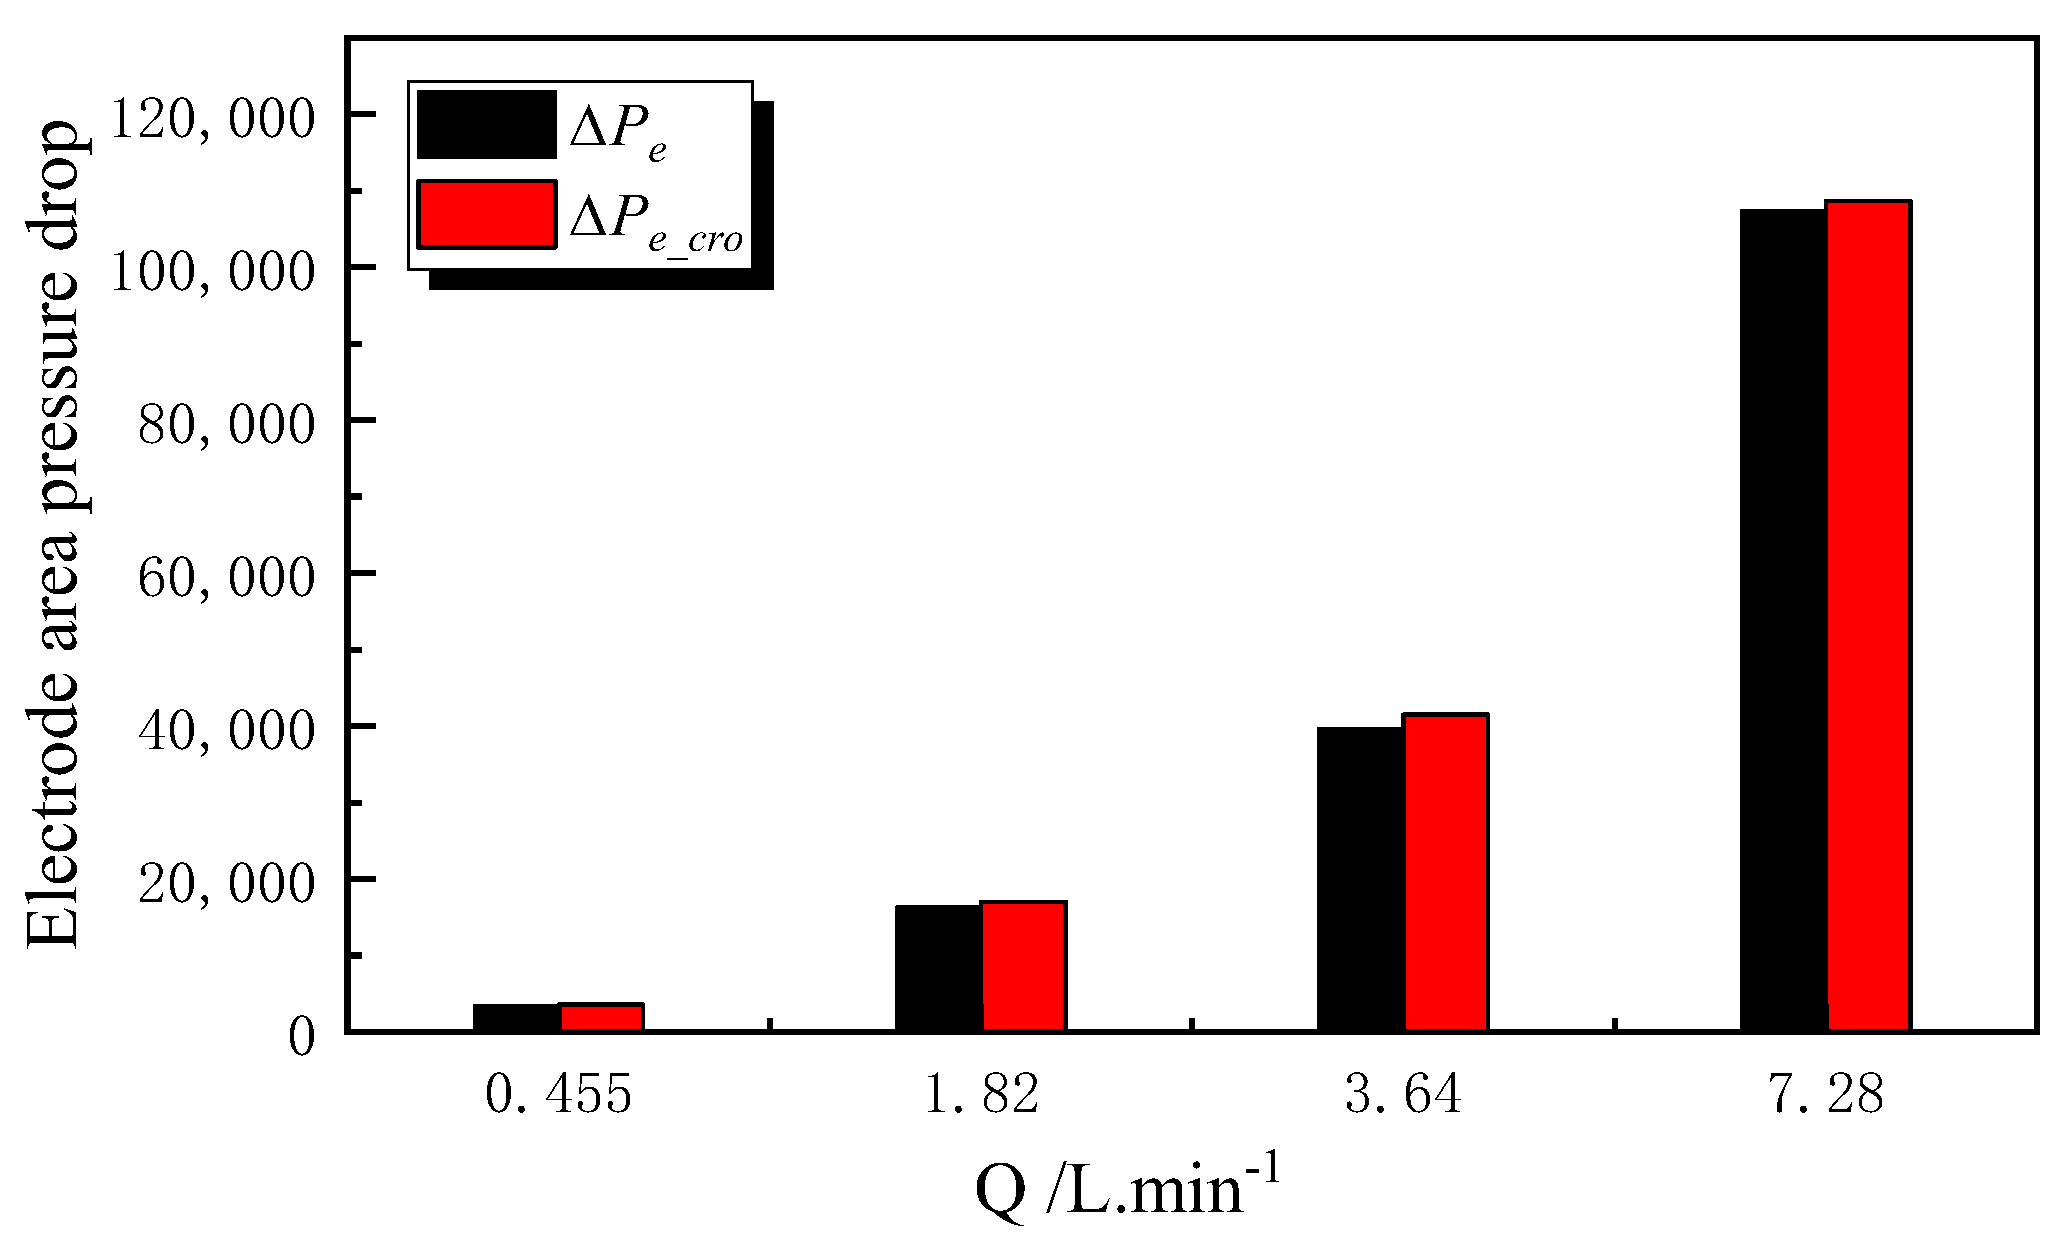
Impact of Ion Crossover on Mass Transfer Polarization Regulation. As known from Section 3.2, the flow rate difference ΔQ caused by ion crossover alters the pressure drop in the electrode region, reducing charge/discharge performance, thereby affecting mass transfer polarization regulation effectiveness. To analyze the impact of ΔQ on the pressure drop in the electrode region and the overall performance of high-power batteries, this study used the better-performing VFB-1 flow field structure to build a stack model composed of 44 single cells. Simulations of four charge/discharge cycles were performed at a charge/discharge current density of 120 mA/cm2 under different flow rate conditions. Figure 13 compares the change in electrode region (positive electrode) pressure drop with flow rate for the VFB-1 flow field with and without considering ion crossover. As shown, the electrode pressure drop increases with flow rate. More importantly, when ion crossover is considered ( P e _ c r o ), the electrode pressure drop is significantly higher than without considering crossover. This is mainly because ΔQ disrupts the designed flow balance, causing the flow velocity and pressure distribution within the actual flow field to deviate from the optimal state, thereby increasing the pressure drop ΔPe in the electrode region.
The above recommendation to optimize the channel width to mitigate the ΔQ effect is based on the superior pressure drop uniformity of the VFB-1 (Figure 11) and the ion crossover affecting the ΔQ effect. Reducing the main channel width from 2.7 mm to 2.3 mm reduces R ˜ by 18% (Equation (9)) and suppresses crossover-induced ΔP e by 22% at Q = 1.8 l/min. Future work will utilize a genetic algorithm-driven design to balance ΔQ compensation with manufacturing costs (currently less than 5% increase for VFB-1).
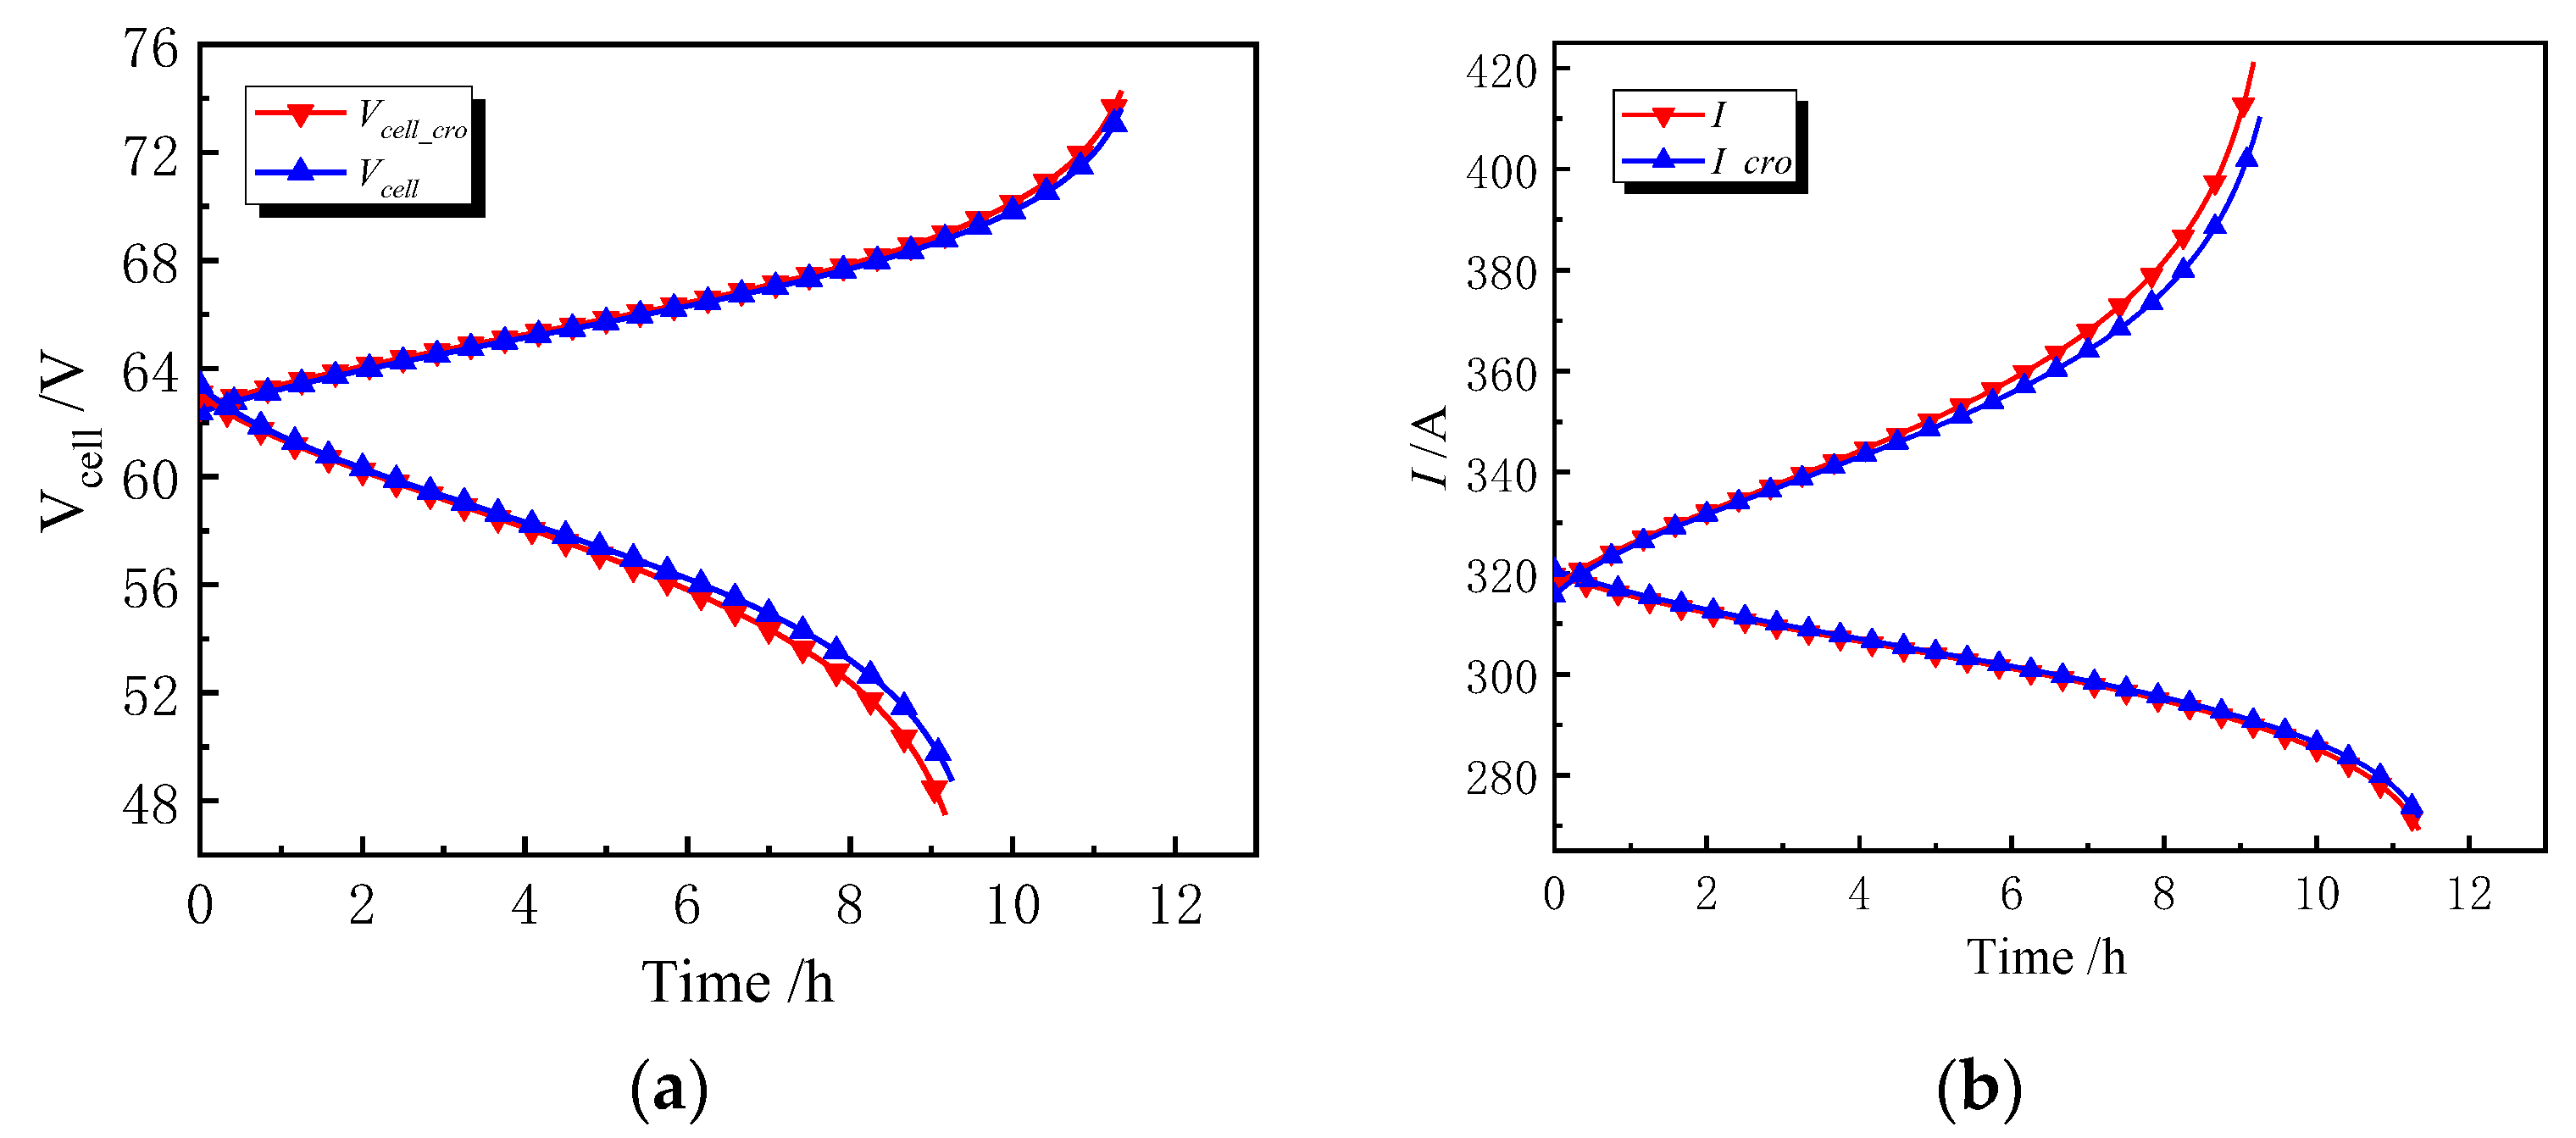
Figure 14 shows the simulated impact of ion crossover on the charge/discharge performance curves of a battery employing the VFB-1 flow field. Comparing curves considering ion crossover ( I c r o , V c r o ) and without ion crossover (I, V). The charging voltage without ion crossover influence is on average ~0.85% lower than with influence, while the discharging voltage is on average ~1.1% higher. The charging current without influence is on average ~1.7% lower than with influence, while the discharging current is on average ~0.55% higher. These differences are most significant at the end of charging/discharging, indicating the maximum influence of ion crossover at that stage. This stems from the following: charging voltage is the sum of the open-circuit voltage and total polarization (including ohmic, activation, and mass transfer polarization); discharging voltage is the difference between open-circuit voltage and total polarization. Ion crossover increases total polarization by causing the flow rate difference ΔQ, which exacerbates mass transfer polarization. Therefore, during charging, it manifests as an increased voltage plateau (higher voltage needed to overcome increased polarization), and the current plateau might slightly decrease (under tester constant current control, voltage increase reflects increased equivalent internal resistance). During discharging, it manifests as a decreased voltage plateau (increased polarization loss), and the current plateau may change under constant power mode but remains constant under constant current mode (Figure 14b shows constant current mode).
Figure 15 compares the Coulombic efficiency (CE) and Energy efficiency (EE) of a high-power battery employing the VFB-1 flow field, with and without considering ion crossover, under different flow rates. From Figure 15a, as the flow rate increases, CE first increases and then gradually decreases. At flow rate Q = 1.82 L min−1, CE with ion crossover considered (CE_cro) reaches a maximum of 96.7%, while CE without crossover reaches 97.8%, a difference of about 1.1%. This is mainly because ion crossover side reactions consume some charge, causing additional Coulombic losses. From Figure 15b, as the flow rate increases, EE gradually decreases. EE without ion crossover is consistently higher than E E c r o with crossover. At high flow rate Q = 7.28 L·min−1, EE decreases from 75.3% without crossover to 73.8% with crossover, a difference of 1.5%. This is primarily because the flow imbalance ΔQ caused by ion crossover increases the reaction zone pressure drop (as shown in Figure 12), leading to increased pumping power loss, thereby reducing the system Energy efficiency. Simulated CE/EE trends were validated against experimental data from a 5-kW VFB stack [26], showing <2% deviation (Figure 16). The observed 1.5% EE loss exceeds the grid-scale tolerance (<0.8%). Mitigation strategies include (i) graphene oxide-coated membranes that reduce cross-capacity attenuation by more than 20% [29], and (ii) quarterly rebalancing cycles that restore 98.2% of the initial EE at a cost of 0.03 USD/kWh—economically viable for >500 kW systems [30].

5. Conclusions

This study established a three-dimensional numerical model of a high-power VFB module with a flow-through flow field structure to investigate the impact of ion crossover on mass transfer polarization regulation. The model’s accuracy was validated. The conclusions are as follows:
(1)
Model Validation and Error Analysis: The simulated charge/discharge voltage curves agree well with experimental data, with errors within ±2% and a maximum error of 1.5% (charging phase). This indicates the established 3D numerical model can accurately describe the mass transfer behavior of high-power VFB modules during actual operation. Limitations of the model include neglecting the Donnan potential and ionic interactions, which produces modeling errors, which may affect long-term accuracy. Future models could use the Poisson–Boltzmann equation to address this coupling.
(2)
Ion Crossover Characteristics and Distribution: The degree of ion crossover is positively correlated with the concentration gradient across the membrane between the positive and negative electrodes. Simulations show ion crossover has a more significant impact on the concentration distribution and current density distribution in the negative electrolyte. During charging, ion crossover causes an average reactant concentration distribution deviation of 3–5%, and reduces the average reaction current density in the negative and positive electrodes by about 11% and 5%, respectively.
(3)
Impact of Ion Crossover on Mass Transfer Polarization Regulation: In high-power VFBs, ion crossover significantly affects the electrode reaction zone pressure drop, charge/discharge performance curves, and system efficiency by inducing a flow rate difference ΔQ between positive and negative electrolytes. Specifically, it increases the electrode region pressure drop, causing the charging voltage to increase by ~0.85% and the discharging voltage to decrease by ~1.1%; it significantly reduces system efficiency, causing a Coulombic efficiency (CE) decrease of ~1.1% at the optimized flow point and an Energy efficiency (EE) decrease of ~1.5% during high-flow-rate operation. The 1.5% EE loss is critical for grid-scale VFBs. Future work will optimize channel width/layout using genetic algorithms to minimize ΔQ impact, with experimental validation.

Author Contributions

Methodology, J.L.; software, J.L.; data curation, J.L. and Z.S.; formal analysis, J.L., J.L. and J.L.; writing—original draft, J.L.; validation, Z.L.; investigation, J.L., Z.S. and Z.L.; project administration, Z.L. and Z.S.; supervision, Z.S.; resources, J.L.; writing—review and editing, J.L.; conceptualization, Z.S.; funding acquisition, Z.S. All authors have read and agreed to the published version of the manuscript.

Funding

This research was funded by Xinjiang Uygur Autonomous Region Key R&D Program (2022B01019-2), and the Xi’an City Science and Technology Project (2024JH-ZCLGG-0037).

Data Availability Statement

The data that support the findings of this study are available from the corresponding author, Jianbin Li, upon reasonable request.

Conflicts of Interest

Author Zihan Li was employed by the company Emerging Green Energy and New Materials Research Institute Co., Ltd. The remaining authors declare that the research was conducted in the absence of any commercial or financial relationships that could be construed as a potential conflict of interest.

References

  1. M2 PRESSWIRE. Vanadium Redox Flow Battery (VFB) Market 2018 Global Analysis, Opportunities and Forecast to 2025; Normans Media Ltd.: Coventry, UK, 2018. [Google Scholar]
  2. Zeng, C.; Kim, S.; Chen, Y.; Fu, Y.; Bao, J.; Xu, Z.; Wang, W. In-situ characterization of kinetics and mass transfer for vanadium redox flow batteries. Electrochem. Soc. 2023, 170, 030507. [Google Scholar] [CrossRef]
  3. Yan, T.; Lin, H.; Xu, Y.; Ma, K.; Liu, L.; Xi, J. In situ mapping of oxygen evolution reaction in aqueous flow batteries. Power Sources 2024, 592, 233919. [Google Scholar] [CrossRef]
  4. Huang, Z.; Mu, A.; Wu, L. Critical issues in all-vanadium redox flow batteries. ACS Sustain. Chem. Eng. 2022, 10, 7993–8003. [Google Scholar] [CrossRef]
  5. Yeonho, A.; Dukjoon, K. High efficiency of vanadium flow battery using pore-filled anion exchange membranes. Ind. Eng. Chem. 2022, 110, 395–404. [Google Scholar]
  6. Jiang, S.; Li, Y.; Wang, H.; Li, L.; Wei, Q.; Shi, H. SPEEK composite membrane with ultrahigh selectivity for vanadium flow battery. Membr. Sci. 2024, 699, 122663. [Google Scholar] [CrossRef]
  7. Zhang, X.; Liu, L.; Zhang, K.; Zhang, D.; Hou, S.; Zhao, J.; He, H.; Wu, X.; Liu, J.; Yan, C. Modulating sulfur-vacancy defect in MoS2−x for vanadium flow batteries. Energy Storage Mater. 2024, 69, 103442. [Google Scholar] [CrossRef]
  8. Xavier, M.M.; Sivasankaran, S.; George, A. Stable ion exchange membranes for vanadium batteries. Power Sources 2024, 591, 233857. [Google Scholar]
  9. Wang, X.; Ye, Q. Aggravation of side reactions by insufficient liquid supply in vanadium flow battery. Energy Storage Sci. Technol. 2022, 11, 1455–1467. [Google Scholar]
  10. Chou, Y.-S.; Yen, S.-C.; Arpornwichanop, A.; Singh, B.; Chen, Y.-S. Mathematical model to Study vanadium ion crossover in an All-Vanadium Redox Flow Battery. ACS Sustain. Chem. Eng. 2021, 9, 5377–5387. [Google Scholar] [CrossRef]
  11. Lawton, J.S.; Jones, A.M.; Tang, Z.; Aaron, D.S.; Mench, M.M. Polarization losses in vanadium flow batteries. Electrochem. Soc. 2017, 164, A2987–A2994. [Google Scholar] [CrossRef]
  12. Oh, K.; Moazzam, M.; Gwak, G.; Ju, H. Water crossover phenomena in all-vanadium redox flow batteries. Electrochim. Acta 2019, 297, 101–111. [Google Scholar] [CrossRef]
  13. Yang, B.Y. Study on Hydration Structure and Permeation Mechanism of Vanadium Ions. Master’s Thesis, Dalian University of Technology, Dalian, China, 2019; pp. 115–177. [Google Scholar]
  14. Sharma, H.; Kumar, M. Enhancing power density using modified serpentine channels. Power Sources 2021, 494, 229753. [Google Scholar] [CrossRef]
  15. Wang, Z.; Guo, Z.; Fan, X.; Li, X. Comparison of snake shaped and finger shaped flow channels in all vanadium flow batteries. Energy Storage Sci. Technol. 2022, 11, 10. [Google Scholar]
  16. Huang, Z.; Mu, A.; Wu, L.; Wang, H. Flow field design and flow rate optimization. Energy 2021, 234, 121266. [Google Scholar]
  17. Wang, Z.Y.; Guo, Z.X.; Fan, X.Z.; Zhao, T.S. Comparative study between serpentine and interdigitated flow fields for vanadium redox flow batteries. Energy Storage Sci. Technol. 2022, 11, 1121–1130. [Google Scholar]
  18. Ali, E.; Kwon, H.; Kim, J.; Park, H. Numerical study on serpentine flow channels. Energy Storage 2020, 32, 101802. [Google Scholar] [CrossRef]
  19. Al-Yasiri, M.; Park, J. Channel geometry of vanadium flow batteries. Electrochem. Soc. 2017, 164, A1970–A1982. [Google Scholar] [CrossRef]
  20. Zheng, Q.; Xing, F.; Li, X.; Ning, G.; Zhang, H. Mass transport polarization regulation in flow-through vanadium battery. Power Sources 2016, 324, 402–411. [Google Scholar] [CrossRef]
  21. Pan, J. Model Study of Vanadium Flow Battery. Ph.D. Thesis, Central South University, Changsha, China, 2025. [Google Scholar]
  22. Li, Z.; Wang, F.; Huang, Z. Numerical Analysis and Research on Mass Transfer Performance of Vanadium Redox Flow Battery Based on Novel Spiral Flow Field. Electrochem. Soc. 2024, 171, 060512. [Google Scholar] [CrossRef]
  23. Kim, J.; Park, H. Mass transfer in flow batteries characterized by comparison of electrical potentials according to regions of porous electrodes. Energy Storage 2022, 55, 715–723. [Google Scholar] [CrossRef]
  24. Wang, Z.-J.; Kim, Y.-B.; Jung, S. Capacity fade prediction for vanadium redox flow batteries during long-term operations. Appl. Energy 2024, 356, 122329. [Google Scholar]
  25. Xiong, R.; Xiong, B.; Zhang, Q.; Shi, S.; Su, Y.; Zhang, D. Capacity fading model of vanadium redox flow battery considering water molecules migration. Int. Green Energy 2022, 19, 1613–1622. [Google Scholar] [CrossRef]
  26. Weber, R.; Schubert, C.; Poisl, B.; Pettinger, K.-H. Analyzing Experimental Design and Input Data Variation of a Vanadium Redox Flow Battery Model. Batteries 2023, 9, 122. [Google Scholar] [CrossRef]
  27. Song, Y.; Li, X.; Xiong, J.; Yang, L.; Pan, G.; Yan, C.; Tang, A. Electrolyte transfer mechanism and optimization strategy for vanadium flow batteries adopting a Nafion membrane. Power Sources 2020, 447, 227503. [Google Scholar] [CrossRef]
  28. Wang, Q.; Qu, Z.G.; Jiang, Z.Y.; Yin, Y.; Chen, L. The numerical study of vanadium redox flow battery performance with different electrode morphologies and electrolyte inflow patterns. Energy Storage 2020, 28, 101941. [Google Scholar] [CrossRef]
  29. Firouzabadi, S.M.Z.; Naji, L.; Ghadiri, L. Comparative study on graphene oxide and sulfonated graphene oxide reinforced polyethersulfone-based cation-exchange membrane. Colloids Surf. A Physicochem. Eng. Asp. 2024, 696, 134392. [Google Scholar] [CrossRef]
  30. Li, T.; Xing, F.; Liu, T.; Sun, J.; Shi, D.; Zhang, H.; Li, X. Cost, performance prediction and optimization of a vanadium flow battery by machine-learning. Energy Environ. Sci. 2020, 13, 4353–4361. [Google Scholar] [CrossRef]
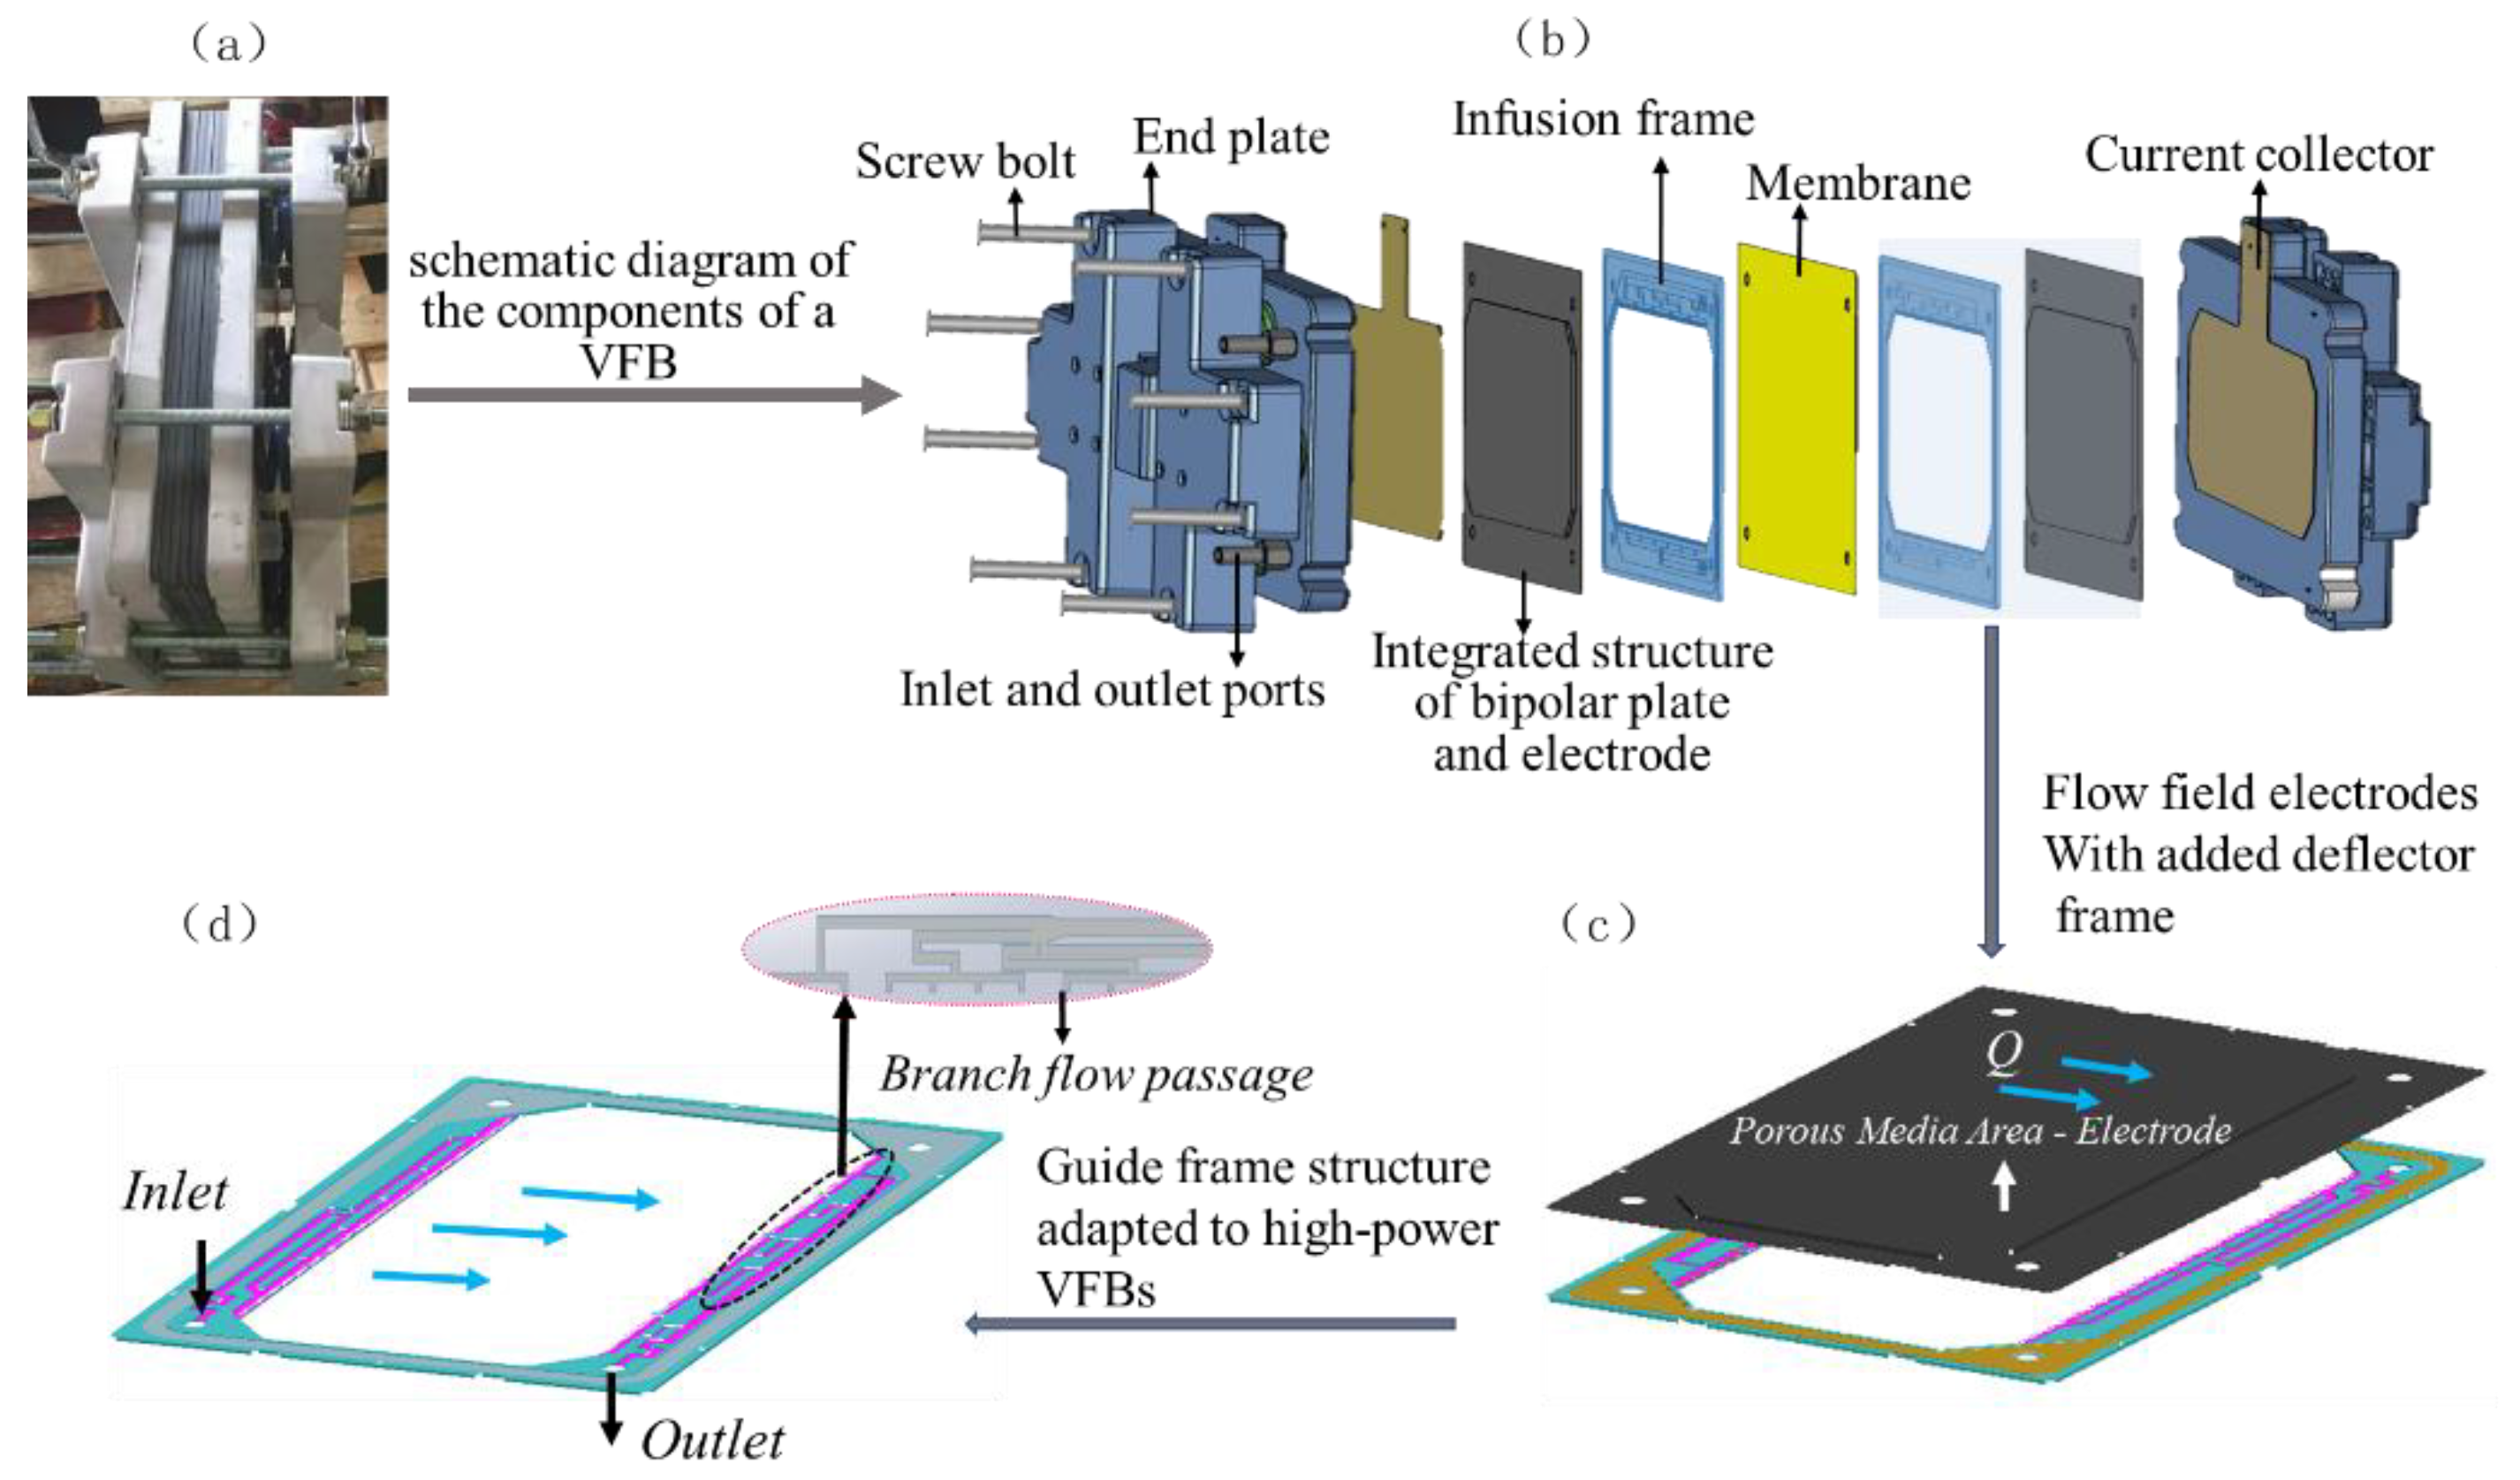
Figure 1. (a) VFB experimental cell; (b) Schematic diagram of the assembly; (c) Decomposition of the flow field electrodes (including bipolar plates) (subplot); (d) infusion frame structure.
Energies 18 05192 g001
Figure 2. Computational domain of the VFB model.
Energies 18 05192 g002
Figure 3. Equivalent flow resistance model of the VFB flow field.
Energies 18 05192 g003
Figure 4. Simulated vs. experimental VFB voltage–time curves (RMSE = 12.3 mV during charging, 15.7 mV during discharging).
Energies 18 05192 g004
Figure 5. Simulated reactant concentrations with and without ion crossover. (a) Simulated reactant concentration gradient in negative electrode (with/without crossover); (b) Simulated ion concentration comparison; (mean deviation: V2+ = 4.2 ± 0.3%, VO2+ = 3.8 ± 0.4%, V3+ = 5.1 ± 0.2%, VO2+ = 4.7 ± 0.5%).
Energies 18 05192 g005
Figure 6. Simulated V2 concentration distribution with and without ion crossover.
Energies 18 05192 g006
Figure 7. Net depletion of active substance due to ionic cross-reactivity. (a) Depletion of active substance due to side effects; (b) Side-reaction rate distribution (mol·m−3·s−1).
Energies 18 05192 g007
Figure 8. Simulated current density distribution with and without ion crossover.
Energies 18 05192 g008
Figure 9. Dynamic change in electrolyte volume under long-term cycling.
Energies 18 05192 g009
Figure 10. Relationship between mass transfer polarization and positive and negative flux difference under different V c H 2 O conditions.
Energies 18 05192 g010
Figure 11. Performance of two asymmetric flow field structures (VFB-1, VFB-2). (a) VFB-1 pressure drop, (b) VFB-2 pressure drop, (c) VFB-1 weighted flow, (d) VFB-2 weighted flow, (e) VFB-1 inlet/outlet pressure drop, (f) VFB-2 inlet/outlet pressure drop.
Energies 18 05192 g011
Figure 12. Half-cell SOC vs. mass transfer polarization potential for VFB-1 and VFB-2.
Energies 18 05192 g012
Figure 13. Effect of VFB-1 ion crossover on the voltage drop in the electrode reaction zone (positive electrode). Key insight: electrode pressure drop considering ion crossover is higher than without crossover for different flow levels.
Energies 18 05192 g013
Figure 14. Effect of ion crossover on VFB-1 charge/discharge performance. (a) Charge/discharge voltage, (b) Charge/discharge current. Key insight: the effect of ion crossing on polarization is greatest in the late stage of charge and discharge, and different charge and discharge modes have different impacts.
Energies 18 05192 g014
Figure 15. Effect of ion crossover on system efficiency in VFB-1. (a) Coulombic efficiency, (b) Energy efficiency. Key insight: design considering ion crossover with 1.1% CE improvement and 1.5% EE improvement.
Energies 18 05192 g015
Figure 16. Comparison of simulated CE/EE with experimental data from literature [26]. (a) CE Validation, (b) EE Validation.
Energies 18 05192 g016
Table 1. Comparison of modeling approaches for VFB ion crossover and mass transfer regulation.
StudyIon Coupling SchemeError CompensationSpatiotemporal AnalysisKey Limitations
Zheng et al. [20]Static crossover factorNot consideredSteady-state onlyNeglects ΔQ-induced polarization
Huang et al. [16]Empirical water migrationFlow field optimization only2D simulationOmits dynamic SOC effects
Sharma et al. [14]CFD flow optimizationN/ALocal current densityNo ion crossover coupling
This workReal-time ΔQ compensationObjective function 3D transient SOC mapping Requires membrane parameter calibration
Table 2. Geometric parameters of the battery calculation area.
ParameterChannel Area (m2)Electrode Area (m2)Electrode Thickness (m)Inlet Velocity (L·min−1)Outlet Pressure (Pa)Mesh Count
value0.0060.240.0041.212,154,640hexahedral elements
Table 3. Parameters of the VFB model [21,26].
ParameterValueParameterValue
c v 1500 mol/m3 ε 0.929
k 4 4.095 × 10⁻⁶ m2 s−1 σ 103 S m−1
k 5 3.538 × 10⁻⁶ m2 s−1 S O C 0 0.15
k 2 5.261 × 10⁻⁶ m2 s−1T25 °C
k 3 1.933 × 10⁻⁶ m2 s−1 M 2 5.1 × 10⁻² kg/mol
c 4 c v × ( 1 S 0 ) M 3 5.1 × 10⁻² kg/mol
c 5 c v × S O C 0 M 4 6.5 × 10⁻² kg/mol
c 2 c v × S O C 0 M 5 8.3 × 10⁻² kg/mol
c 3 c v × ( 1 S O C 0 ) d e 4.4 cm
ρ 1350 kg/m3 μ 4.45 Pa·s
c v 1500 mol/m3
Table 4. Inlet/outlet channel design parameters.
StructureInlet Channels (n) Outlet Channels (m)Avg. Channel Width (mm)Secondary Channel Width (mm)
VFB-120232.72.8
VFB-216192.53.0
Disclaimer/Publisher’s Note: The statements, opinions and data contained in all publications are solely those of the individual author(s) and contributor(s) and not of MDPI and/or the editor(s). MDPI and/or the editor(s) disclaim responsibility for any injury to people or property resulting from any ideas, methods, instructions or products referred to in the content.