Article

Thermal and Kinetic Study of Waste Polypropylene, Cardboard, Wood Biomass, and Their Blends: A Thermogravimetry Approach

Faculty of Science and Engineering, Southern Cross University, Lismore, NSW 2480, Australia
*
Author to whom correspondence should be addressed.
Energies 2025, 18(19), 5193; https://doi.org/10.3390/en18195193
Submission received: 15 August 2025 / Revised: 23 September 2025 / Accepted: 23 September 2025 / Published: 30 September 2025

Abstract

In this study, a thermogravimetry approach was employed to investigate the thermal parameters of waste polypropylene (PP), mixed wood biomass (WB), cardboard (CB), and their blends during co-gasification under oxidative conditions at varying heating rates. The resulting data were used to quantify the mass loss profiles for each feedstock and to assess the effects of blending on process temperatures (onset and end), residual mass, and activation energies. Activation energies (Ea) were determined using three iso-conversional methods: Friedman, Kissinger–Akahira–Sunose (KAS), and Numerical Optimization. Among the feedstocks, PP exhibited the highest thermal stability. When blended with either CB or WB, both onset and end temperatures significantly (p < 0.05) increased with rising PP content. These trends were consistent at heating rates of 20 and 40 °C/min. In contrast, CB/WB blends showed no notable variation in onset temperature across blend ratios at either heating rate. However, PP/CB blends exhibited significantly lower residual masses (up to a six-fold decrease) with increasing PP content. Since both PP and WB individually yielded very low residual mass (<2 wt%), increasing PP content in PP/WB blends did not significantly affect the residual mass. Overall, higher heating rates shifted thermal decomposition into higher temperature regimes in both individual and blended feedstocks, but had no impact on residual mass. The Ea of WB was the highest (138–139 kJ/mol), followed by CB (113–116 kJ/mol) and PP (56–63 kJ/mol). The blending of PP/CB and CB/WB resulted in reduced Ea values compared to the pure feedstocks, indicating a positive synergistic effect during co-gasification. In essence, the co-gasification of mixed plastic waste presents a promising strategy for sustainable waste management and energy recovery.

1. Introduction

Sustainable management of residual municipal solid waste (MSW) is essential for achieving consistent environmental benefits. Residual MSW typically consists of a complex, heterogeneous mixture of materials that are often landfilled due to the limitations of mechanical recycling. However, its high content of combustible materials makes residual MSW a potential energy source [1]. Incineration is a widely used disposal method for residual MSW, offering significant volume reduction and energy recovery. Nonetheless, challenges such as low net electrical efficiency, substantial solid by-product generation [2] and the release of toxic off-gases render incineration less environmentally sustainable [3].
Thermochemical treatments, capable of producing both syngas and valuable chemicals, present a more suitable alternative for large-scale sustainable recycling [4]. Pyrolysis, for instance, is a well-established process for generating chemicals, fuel oils, and energy [5]. Gasification, another alternative thermal treatment method, offers greater flexibility by accommodating a broader range of feedstocks [4]. In waste-to-energy applications, gasification is considered more environmentally friendly due to its lower greenhouse gas (GHG) emissions compared to other thermal methods. The resulting syngas has diverse applications in hydrogen production, methanol synthesis, chemical manufacturing, and power generation [6]. A review by Maya et al. [7] comparing the environmental performance of incineration and gasification found that incineration emitted at least twenty times more Hg and SO2 than gasification, and NOx levels were five times higher. The operating temperature of gasification (>1000 °C) in a limited oxygen environment suppresses the formation of dioxins and furans, whereas incineration’s oxygen-rich conditions promote their formation [7]. In gasification, solid carbonaceous feedstocks are converted into a syngas mix of CO, H2, and CH4 under limited oxygen conditions, enabling the conversion of both pure and mixed waste into energy or chemical precursors [8].
Plastics, which constitute a significant portion of residual MSW, are ideal feedstocks for gasification due to their high energy density. The resulting syngas is rich in hydrogen and possesses high energy potential [9]. Single-feedstock gasification also allows for better control over product composition and reaction pathways, minimizing the formation of byproducts such as dioxins [10,11]. However, plastic gasification faces challenges including feedstock handling, agglomeration, and the generation of toxic pollutants [12,13]. High-tar formation, especially from aromatic polymers, can lead to clogging and reduced syngas quality. Additionally, mixed plastics exhibit varied thermal behaviors and elemental compositions, complicating process optimization. Additives and dyes may introduce heavy metals, further hindering gas cleanup and syngas quality [14].
Biomass is another abundant feedstock and can be carbon-neutral, as CO2 emissions during gasification can be offset by absorption during biomass growth [15]. A wide range of lignocellulosic feedstocks from woody waste to paper can be gasified, contributing to waste reduction and circular economy goals [16]. Despite its high exergy efficiency [17], biomass generally has lower volatile matter and energy density, and higher tar and ash content, which is less favorable for gasification. Variability in mixed biomass also affects the moisture content and particle size, influencing syngas composition [18]. If not properly managed, contaminated biomass feedstocks may emit NOx, SOx, and dioxins [16].
The co-gasification process is governed by complex thermochemical interactions, with activation energy (Ea) serving as a critical indicator of reaction kinetics. Notably, the presence of alkali and alkaline earth metals (AAEMs) in biomass ash can catalyze the reaction [19], reducing Ea and enhancing conversion rates [20]. Methodological differences also influence Ea estimates; values derived from the Flynn–Wall–Ozawa (FWO) method tend to be higher than those from Kissinger–Akahira–Sunose (KAS) approach, with discrepancies of up to 9.4 kJ/mol at full conversion [21]. Process temperature is another decisive factor in co-gasification performance [22]. Optimal gasification typically occurs between 800 and 1200 °C, where elevated temperatures accelerate devolatilization and char breakdown, improving syngas yield and carbon conversion efficiency [23]. However, excessive temperatures may lead to slagging or ash fusion, complicating reactor operation and residue handling [24]. Residue formation, particularly coarse solid residue (CSR), is an inevitable by-product of co-gasification [25]. Recent research has explored the valorization of CSR, demonstrating its potential as a catalyst for light olefin production due to its iron-rich composition and alkali content. These residues, once considered waste, now represent a secondary resource stream, especially when pre-treated to enhance catalytic activity [26]. Their composition and behavior under high-temperature conditions are crucial for reactor design, ash management, and downstream applications [27].
Thermogravimetry (TGA) is a thermochemical technique used to analyte degradation. It measures mass loss and heat flow using Differential Scanning Calorimetry (DSC) during thermal degradation [28]. TGA has broad applications, from detecting plastics in environmental samples [29], to studying the thermal degradation kinetics of plastics and biomass for gasification process development [30,31]. The combined use of TGA and DSC enables detailed kinetic studies, including devolatilization, pyrolysis and combustion. A key advantage is the ability to use small feedstock samples across wide temperature ranges under controlled conditions [32,33,34]. TGA also offers flexibility in rapidly evaluating factors influencing gasification, such as feedstock type, catalyst use and operational parameters.
The increasing complexity for heterogeneous waste streams and the global imperative for sustainable energy recovery have intensified interest in co-gasification as a viable thermochemical conversion pathway [35]. Despite its promise, the fundamental reaction kinetics, particularly activation energy variation across blended feedstock, remains insufficiently characterised, limiting predictive modelling and reactor optimization [36]. Moreover, the influence of process temperature on conversion efficiency and syngas composition demands deeper investigation, especially within the critical range of 800–1200 °C where devolatilization and char breakdown are most active [23]. Concurrently, the formation and behavior of coarse solid residues under high-temperature conditions present both operational challenges and untapped volatilization potential [25]. This research is motivated by the need to characterize these core parameters in co-gasification systems, thereby contributing to the development of more predictable, scalable, and more sustainable energy solutions.
Accordingly, this study aims to contribute to the emerging field of co-gasification by examining how mixed feedstock blending influences key process parameters under varying heating rates. The initial phase focuses on the kinetic and thermal properties of waste polypropylene (PP), mixed woody biomass (WB), and cardboard (CB). These feedstocks were co-gasified at different blend ratios under oxidative conditions, with heating rates of 20 and 40 °C/min applied. Parameters assessed included onset and end temperatures, residual mass, and activation energies.

2. Materials and Methods

2.1. Materials

Three distinct waste feedstocks and their respective blends were used in this study. Waste PP and CB were sourced from a local resource recovery center in Lismore, Australia, while mixed woody biomass waste comprising local species was collected from the Southern Cross University campus in Lismore. Prior to milling, both WB and CB feedstocks were oven-dried for 24 h at 105 °C to remove moisture. Waste PP was also milled to reduce the sample. To ensure consistency during TG measurements, each blend was mixed manually just before measurement. No bulk or mechanical mixing was performed. This helped maintain the natural structure of the materials while ensuring that each sample was evenly distributed in the crucible.
The feedstock blending ratios used in subsequent experiments are presented in Table 1. These ratios were designed using the Design of Experiments functionality in Minitab 20.4 Statistical Software (Minitab, LLC., State College, PA, USA).

2.2. Test Methods

2.2.1. Thermogravimetric Analysis

All thermogravimetric (TG) analyses in this study were conducted using a laboratory-scale thermal analyzer (NETZSCH 449 F3 Jupiter Series, Dresden, Germany). The instrument comprises a balance system, hoisting device, gas control units, and a furnace compartment. Within the furnace are key components including the thermocouple, heating element, feedstock carrier, protective tubes, and radiation shields. The thermocouple serves as a temperature sensor, enabling precise thermal measurements during the heating process. The analyzer accommodates feedstock weights ranging from 1 mg to 50 mg within the carrier. An attached gas outlet valve facilitates the capture of evolved gas, which can be further analyzed using gas chromatography–mass spectrometry (GC-MS) or Fourier transform infrared spectroscopy (FTIR). Detailed specifications are presented in Table 2.
For all TG/DTG measurements, 25 ± 0.5 mg of representative feedstock was placed in a sample carrier and top-loaded into the furnace compartment. The feedstocks were heated from 30 °C to 850 °C, followed by cooling to 30 °C. This process was conducted at heating rates of 20 and 40 °C/min. The selection of 20 and 40 °C/min heating rates in this study reflects a balance between kinetic precision and operational relevance. A heating rate of 20 °C/min enables detailed resolution of thermal events such as onset and peak degradation temperatures, which is essential for accurate activation energy profiling using model-free methods. This rate aligns with laboratory-scale pyrolysis and staged gasification setups, where controlled thermal ramping is critical for characterizing feedstock behavior and optimizing reaction kinetics [37,38]. Conversely, the 40 °C/min heating rate simulates moderate thermal acceleration typical of industrial systems such as fluidized bed gasifiers, rotary kilns, and modular waste-to-energy reactors. It offers a realistic representation of throughput-driven environments where rapid conversion is desired without compromising analytical clarity [35,39]. By avoiding excessively high heating rates, often associated with thermal lag and overlapping decomposition peaks, this study ensures that the kinetic and thermal data remain both scientifically robust and practically translatable. Together, these heating rates support applications ranging from reactor design and feedstock blending strategies to predictive modeling of energy recovery systems. They also provide a comparative framework for evaluating co-gasification performance under conditions that mirror both experimental and industrial thermal regimes. Air (N2O2 (80/20)) was used as a gasifying agent at a flow rate of 50 mL/min, introduced from below the pan and exiting at the top. In the top-loading TGA configuration, a stem support rod holds both the feedstock pan and the thermocouple above the balance. Instrument parameters and heating control were managed using STA 449 F3 Jupiter v8.0.3 software (NETZSCH, Dresden, Germany). The thermocouple enabled real-time temperature monitoring of the feedstock, which was recorded against corresponding mass losses to generate a thermogram. Thermogram analysis, including onset temperature, end temperature, and residual mass, was performed using a NETZSCH Proteus Analyzer v8.0.3 (NETZSCH, Germany). Activation energies were estimated from the TG thermograms using NETZSCH Kinetic Neo Software version 2.6.6 (Dresden, Germany) applying the Friedmann, KAS, and Numerical Optimization models. All experiments were conducted in triplicate to ensure reproducibility.

2.2.2. Activation Energy Determination

The activation energy (Ea) of the feedstocks was determined using the TG Data at heating rates of 20 and 40 °C/min. During the heating process, several phase transitions occur, including glass transition, crystallization, curing, melting, and decomposition [40]. TG Data enable the calculation of reaction order, activation energy, pre-exponential factor, and the rate constant [41]. It provides insight into mass changes during decomposition, which are dependent on both time and temperature. The derivative thermogravimetric (DTG) curve, representing the first-order derivative curve of the TG curve, reveals the shape and positions of peaks, which can be used to determine reaction rates. The Arrhenius equation describes the temperature dependence of the reaction rates. By plotting ln K versus 1/T (where K is the rate constant and T is the temperature in Kelvin), a linear relation can be obtained and a slope of the graph determined. This slope is −Ea/R, where R is the ideal gas constant and Ea is the activation energy [42]. Three comparative kinetic models were employed in this study to analyze activation energies across various conversion rates and temperatures: the Friedmann method, Kissinger–Akahira–Sunose method, and the Numerical Optimization model were used in this study to analyze the activation energies. Details of these models are presented in Table 3.

2.2.3. Statistical Analysis

Two-way ANOVA statistical analyses were performed using IBM SPSS Statistics Software 29.0.2.0 (IBM, Armonk, NY, USA). The objective was to evaluate the effects of the blending ratio and heating rate on three dependent variables: onset temperature, end temperature, and residual mass. Additionally, interaction effects between blending ratio and heating rate were assessed for each of these variables to determine their combined influence on thermal behavior.

3. Results

3.1. Thermal Parameters for Individual Feedstocks

The thermal behavior of PP, CB, and WB at heating rates of 20 °C/min and 40 °C/min was characterized using a thermogravimetric analyzer under oxidative conditions. Onset temperature is defined as the point on the TGA curve where a deflection from the baseline is first observed prior to a thermal event [49], while end temperature represents the maximum temperature at which mass loss ceases, beyond which no further decomposition is recorded. The first derivative (DTG) of the TGA curve is used to identify the peak temperature associated with each mass loss event and to delineate the decomposition stages of the material. DTG analysis also enables the evaluation of volatile components present at every mass loss peak based on the temperatures [50]. The TG/DTG thermograms for PP, CB, and WB at both heating rates of 20 and 40 °C/min are presented in Figure 1a–d.
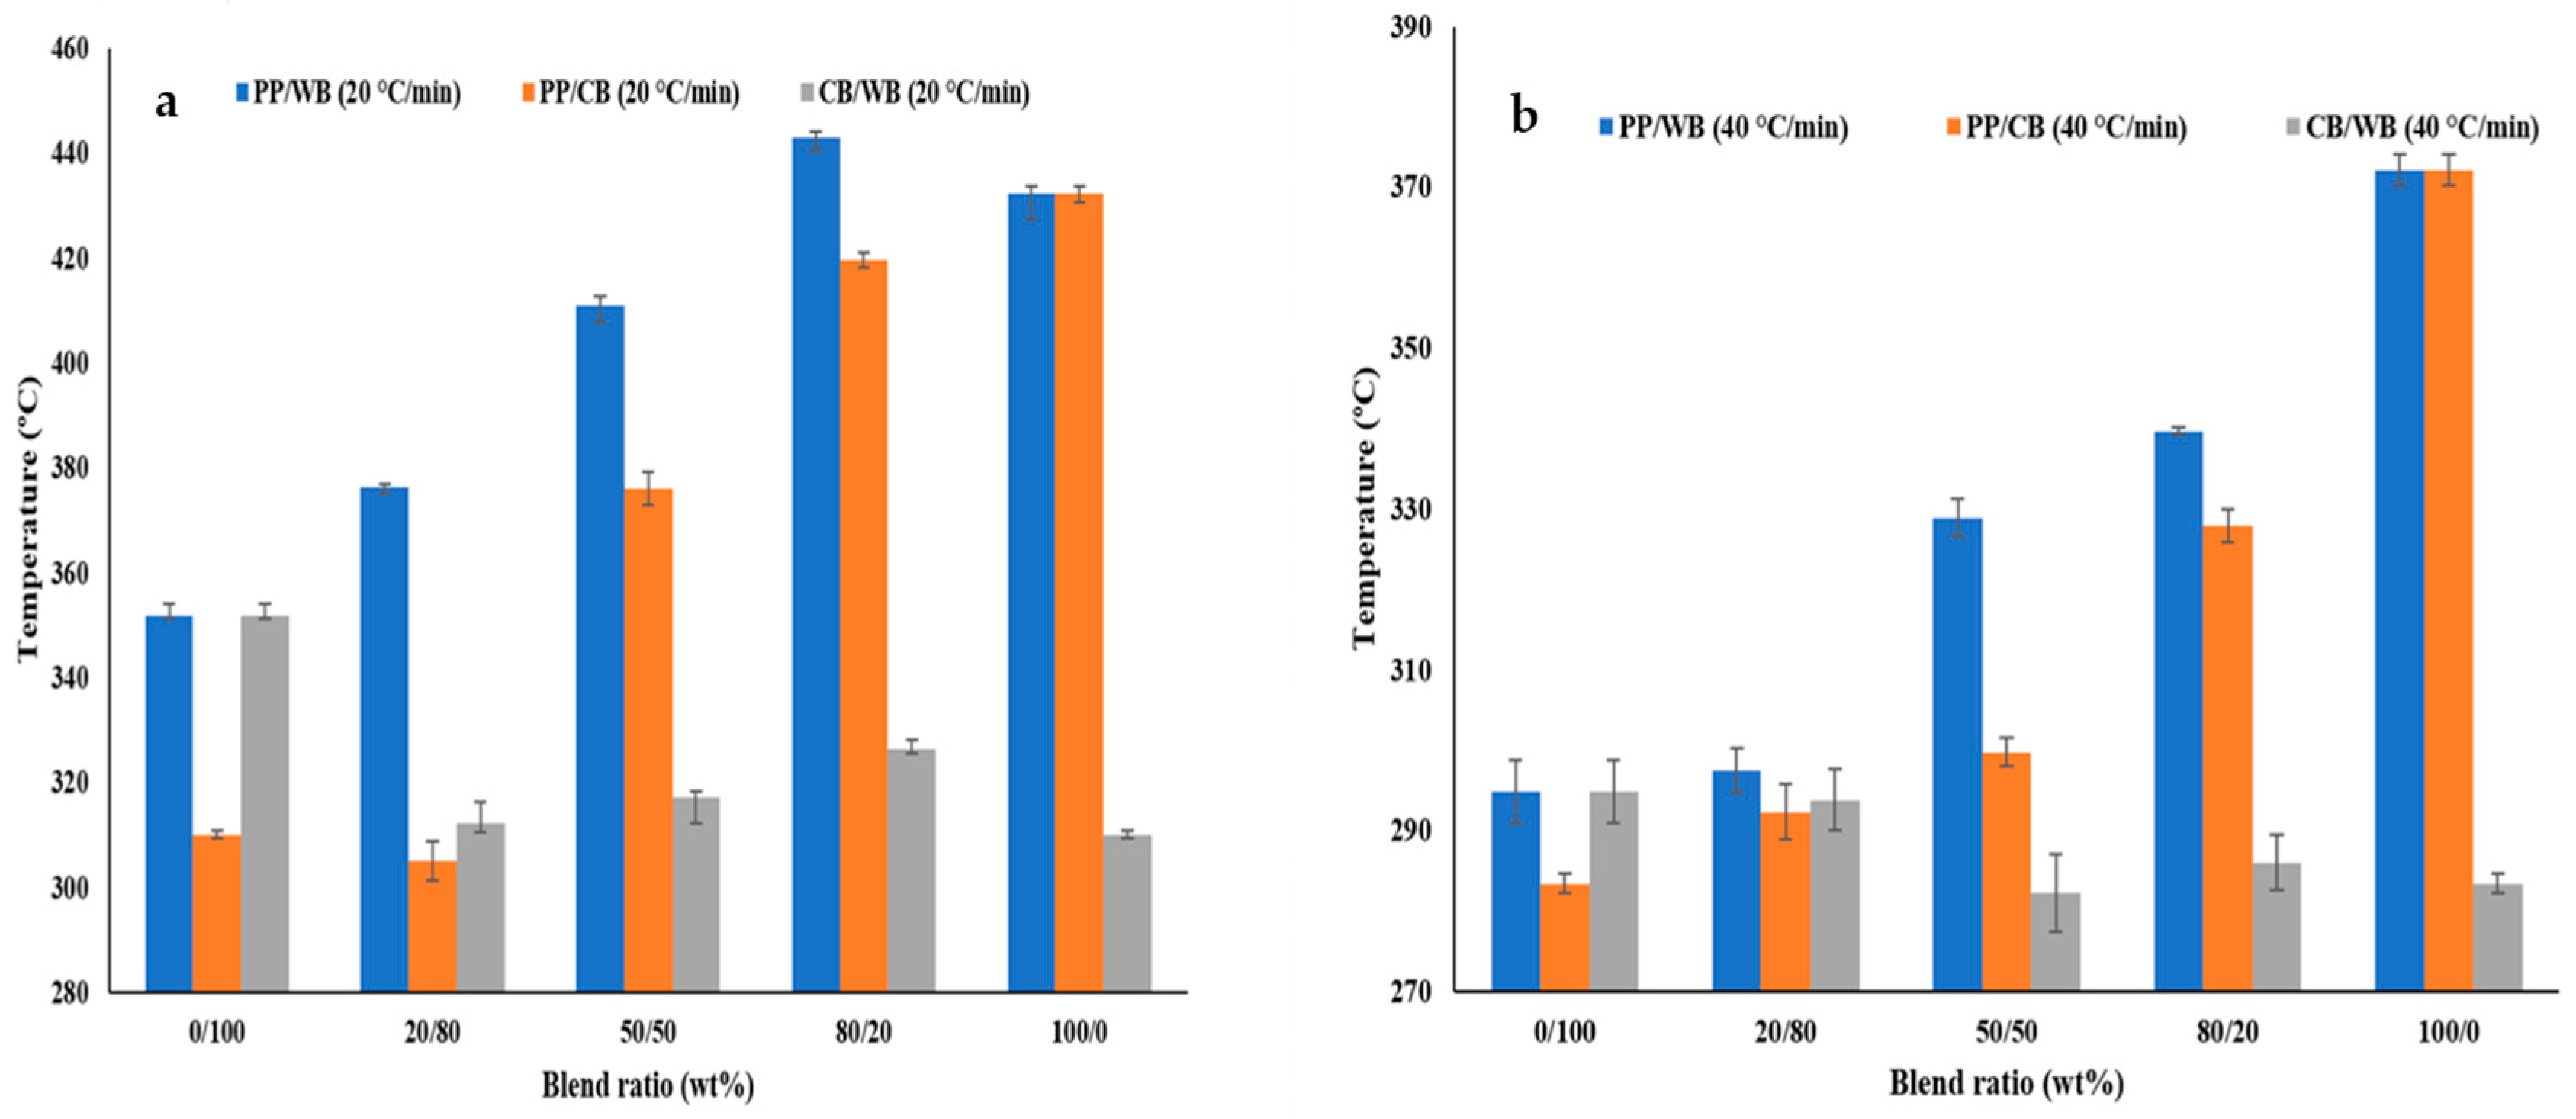
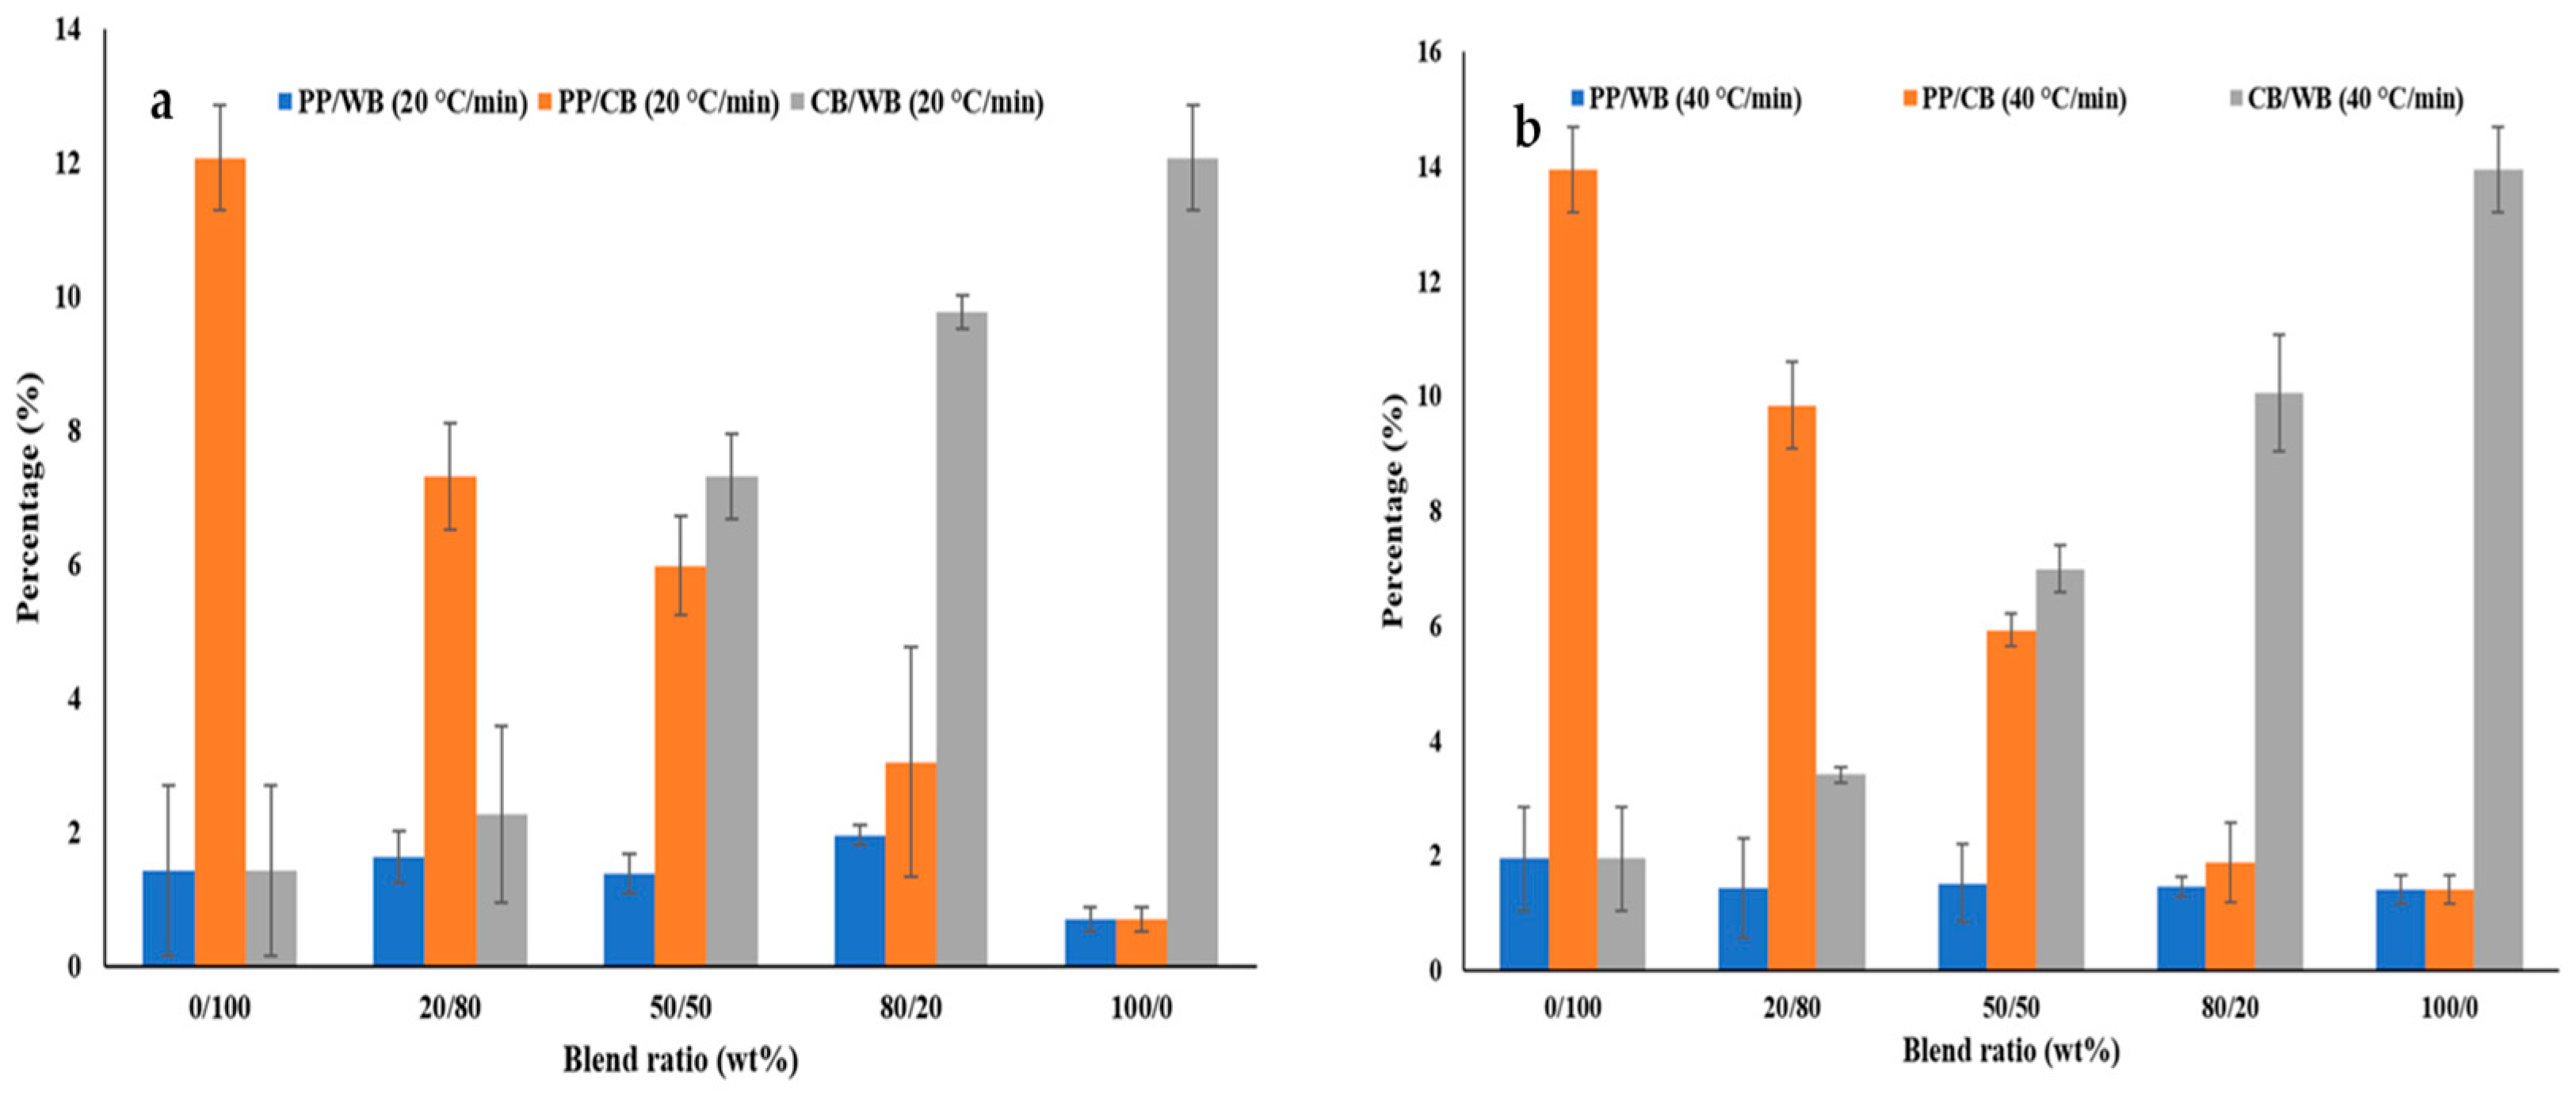
For PP, increasing the heating rate from 20 to 40 °C/min resulted in a shift in the thermogram toward higher temperature ranges. At both heating rates, PP exhibited a single-step degradation as indicated by a dominant peak observed in the DTG curves (a). At 20 °C/min, the mean onset and end temperature were 350.2 °C and 432.2 °C, respectively (Figure 2a and Figure 3a). At 40 °C/min, these values increased to 372.1 °C and 495.4 °C, respectively (Figure 2b and Figure 3b). Under both heating rates, PP underwent near-complete degradation with residual mass recorded at less than 2% (Figure 4a,b).
For WB and CB, three distinct degradation regimes were observed in the DTG curves at both heating rates (b and c). The first mass loss event occurs below 100 °C, followed by a second regime between 315 and 320 °C, and a third regime between 400 and 440 °C. The final mass loss corresponds to the oxidation of remaining char after volatile matter removal [51]. As with PP, increasing the heating rate shifted the thermogram of CB and WB into higher temperature ranges. For WB, the mean onset and end temperatures at 20 °C/min were 283.4 °C and 351.8 °C, respectively (Figure 2a and Figure 3a), while at 40 °C/min, they increased to 294.9 °C and 370.0 °C (Figure 2b and Figure 3b). For CB, the mean onset and end temperatures at 20 °C/min were 292.2 °C and 310.9 °C, respectively (Figure 2a and Figure 3a), and at 40 °C/min, they were 283.5 °C and 318.1 °C, respectively (Figure 2b and Figure 3b). Residual mass for WB remained low across both heating rates, ranging between 1.4 – and 2%. In contrast, CB exhibited significantly higher residual mass (~12%) at both heating rates (Figure 4a,b).

3.2. Thermal Parameters of Blended Feedstocks

For PP/CB blends, a consistent increase in onset temperatures was observed with rising PP content at both heating rates (Figure 2a,b). Specifically, onset temperatures increased from 292.20 °C to 350.20 °C at 20 °C/min, and from 283.50 °C to 372.13 °C at 40 °C/min, corresponding to blends ranging from 20% PP to pure PP. Statistical analysis confirmed that increasing PP mass significantly elevated onset temperatures across both heating rates and blend ratios (p < 0.05). Similarly, end temperatures for PP/CB blends increased with higher PP content, a trend evident at both heating rates (Figure 3a,b). The increase was also statistically significant (p < 0.05) for both heating rate and blend ratio effects. Residual mass decreased with increasing PP content, from 7% at 20% PP to below 2% for pure PP (Figure 4a). The effect of blend ratio on residual mass was statistically significant with p < 0.05, while the effect of heating rate alone was statistically insignificant (p > 0.05). However, the interaction between heating rate and blend ratio was significant with p > 0.05, indicating a combined influence on residual mass.
For PP/WB blends, similar trends were observed. Increasing the PP content led to higher onset temperatures overall. Onset temperatures rose from 283.40 °C to 350.23 °C at 20 °C/min, and from 294.87 °C to 372.13 °C at 40 °C/min (Figure 2a,b). Comparatively, onset temperatures were higher at 40 °C/min across all blend ratios. End temperatures for PP/WB also increased with rising PP content, mirroring the pattern seen in PP/CB blends (Figure 3a,b). These increases were statistically significant (p < 0.05) across both heating rates and blend ratios. Given that both PP and WB exhibited low residual individually, increasing PP content in PP/WB blends did not significantly affect the residual mass. Across all PP/WB blends, the residual mass ranged between 1 and 3% with no consistent increasing or decreasing trend (Figure 4a,b).
For the CB/WB blends, onset temperature at both heating rates showed no notable variation with changing blend ratios. Across all compositions, onset temperatures ranged from 280 to 297 °C (Figure 2a,b). At 20 °C/min, the onset temperature increased from 283.4 °C for pure WB to 292 °C for pure CB. Conversely, at 40 °C/min, pure WB recorded an onset temperature of 294.8 °C, while pure CB showed a lower value of 283.5 °C. Increasing CB content generally resulted in reduced end temperatures at both heating rates (Figure 3a,b). A positive correlation was observed between increasing CB and a higher residual mass value, which ranged from 1% to 12–14% for pure CB across both heating rates (Figure 4a,b). Overall, the effect of blending CB with WB was statistically significant (p < 0.05) with respect to residual mass. However, the interaction effect between blend ratio and heating rate was statistically insignificant (p > 0.05).

3.3. Kinetic Analysis for Individual Feedstocks and Blends

In the second phase of this study, the activation energies (Ea) of individual feedstocks and their blends under oxidative conditions were investigated. Activation energy represents the minimum energy required for reactants to transition into products, with higher Ea values indicating greater energy barriers to reaction [52]. Ea values were evaluated using NETZSCH Kinetic Neo Software 2.6.6 (NETZSCH, Germany). The model-free kinetic methods applied included the Friedmann, Kissinger–Akahira–Sunose (KAS) method, and the Numerical Optimization (Num. Op.) model. Table 4 summarizes the Ea of individual PP, CB, and WB across a conversion range of α = 10–90%. The corresponding plots of Ea versus conversion (%) are presented in Figure 5, Figure 6 and Figure 7.
Under oxidative conditions, the activation energy of PP was evaluated using the Friedmann, KAS, and Num. Op models. The mean Ea values calculated were 63.7 kJ/mol (Friedmann), 56.4 kJ/mol (KAS), and 63.9 kJ/mol (Num. Op.) with corresponding R2 values of 0.99661, 0.87527, and 0.99978, respectively. The Friedmann and Num. Op. models showed good agreement, whereas the KAS model yielded a slightly lower Ea.
For WB, all three models produced closely aligned results with the mean Ea values of 139.309 kJ/mol (Friedmann), 138.429 kJ/mol (KAS), and 139.261 kJ/mol (Num. Op.) and a high R2 of 0.99984, 0.99803, and 0.99997, respectively. Similarly, for CB, the models were in good agreement with mean Ea values ranging from 113.483 kJ/mol to 116.270 kJ/mol and R2 values of 0.99470 to 1.0000.

3.4. Activation Energies of the Blended Feedstocks

The influence of feedstock blending on activation energy (Ea) was further investigated using the same three model-free kinetic methods: Friedmann, KAS, and Num. Op. Table 5 presents the mean Ea across a conversion range of α = 0.1–0.9 for various blend ratios of PP/CB, PP/WB, and CB/WB under thermal oxidative conditions. Figure 5, Figure 6 and Figure 7 illustrate the variation in Ea across conversion rates for each blend, as determined by the three kinetic models.
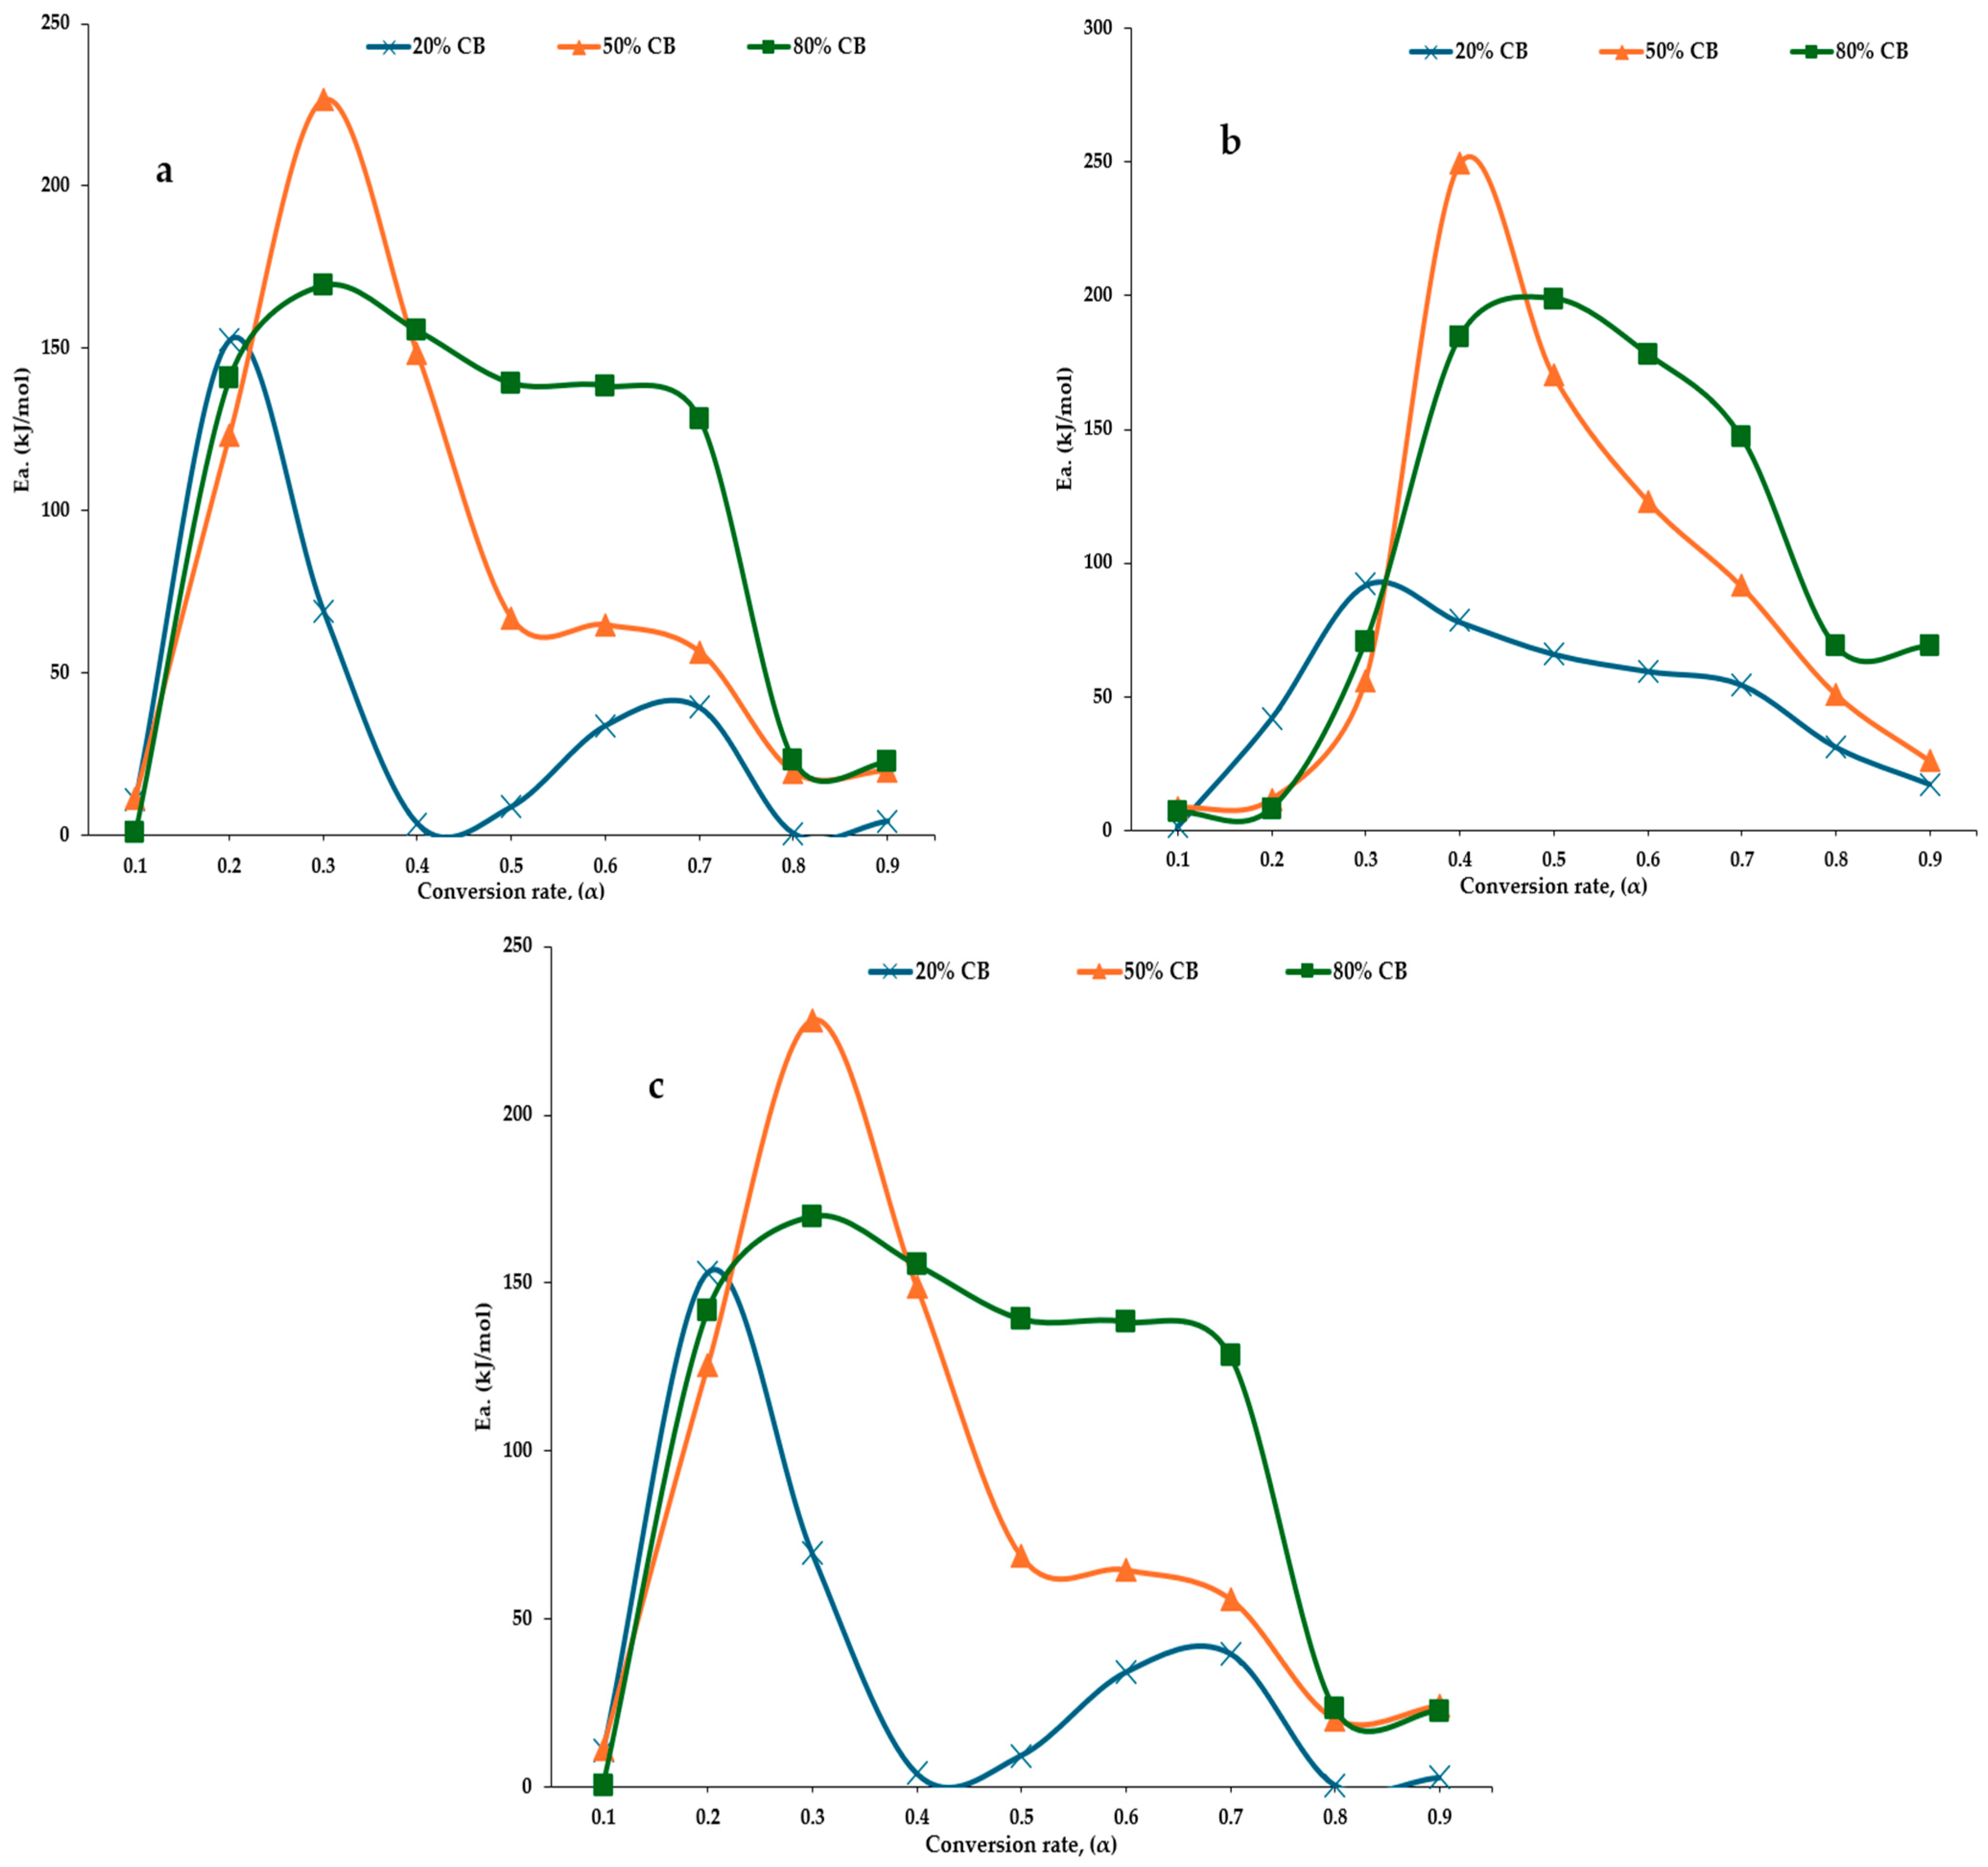
In PP/CB blends, an increase in mean Ea was observed with rising PP content. The Friedmann and Num. Op. models showed strong alignment, with mean Ea ranging from 22.5 kJ/mol (20% PP) to 46.2 kJ/mol (80% PP) for the Friedmann model. The KAS model yielded slightly higher Ea values at 20% and 50% PP (~35–37 kJ/mol), but was consistent with the other models at 80 wt% PP, recording 43.3 kJ/mol (Table 5). Across all models, peak Ea in PP/CB was recorded at the initial stage of decomposition (α = 0.1), particularly for 20% and 50% PP compositions (Figure 5). A general downward trend in Ea was observed as conversion progressed. The blend with the highest overall mean Ea was the 80/20 (PP/CB) composition with Ea values of 46.166, 43.318, and 46.961 kJ/mol for Friedmann, KAS, and Num. Op. models, respectively.
For PP/WB blends, mean Ea ranged from 25.4 kJ/mol (20% PP) to 55.1 kJ/mol (80% PP) using the Friedmann Model. Notably, the highest mean Ea values across all three models were recorded at 50% PP, with 82.9 kJ/mol (Friedmann), 66.0 kJ/mol (KAS), and 83.7 kJ/mol (Num. Op.) (refer to Table 5). Peak Ea values were observed early in the decomposition process (α = 0.1–0.2), following a general decline with increasing conversion for both Friedman and Num. Op models (Figure 6). For the 50% PP blend, a distinct pattern emerged with peak Ea at α = 0.2 and a second peak at α = 0.6 across all models. Overall, the 50/50 blend exhibited the highest mean Ea values of 82.895, 66.004, and 83.724 kJ/mol for the Friedmann, KAS, and Num. Op. models, respectively.
In the CB/WB blends, a consistent increase in mean Ea was observed with rising CB content across all models (Table 5). Ea values ranged from 32.96 kJ/mol (20% CB) to 102.25 kJ/mol (80% CB) for the Num. Op. model, 48.76 kJ/mol to 102.02 kJ/mol for the KAS model, and 32.40 kJ/mol to 101.89 kJ/mol for the Friedmann model (Table 5). The Ea profiles across the decomposition range were similar for all models (Figure 7), typically, starting low and peaking between α = 0.2 to 0.4. The highest peak Ea values (~226–250 kJ/mol) were recorded for the 50% CB blend at α = 0.3–0.4. However, the highest overall mean Ea was observed in the 80/20 blend, with values of 101.894, 102.015, and 102.250 kJ/mol for the Friedmann, KAS, and Num. Op. models, respectively. Across all blends and models, statistical correlation was good, with R2 factor all >0.96 for a conversion range of α = 0.1–0.9.

4. Discussion

4.1. Thermal Parameters

During the oxidative decomposition of PP, CB, WB, and their blended ratios (PP/WB, PP/CB, and CB/WB), onset and end temperatures as well as residual masses were investigated. TGA provided valuable insight into the thermal behavior of these feedstocks. For PP, increasing the heating rate resulted in elevated onset and end temperatures. This effect is attributed to shorter retention times at higher temperature rates, which limit molecular motion prior to decomposition [53]. The degradation of PP is further influenced by radical random scission, a mechanism commonly associated with the thermal breakdown of olefins [54]. Consequently, PP decomposition is influenced by both time and temperature factors.
For WB and CB, the DTG curves revealed three distinct mass loss events. The first regime, occurring below 100 °C, corresponds to moisture release, the volatilization of light compounds and other dehydration reactions within the feedstock [55]. The second regime, around 315–320 °C, represents the primary mass loss event, attributed to the oxidation and removal of the volatile matter. The third regime, observed between 400 and 440 °C, involved the oxidation of residual char following volatile matter removal [51]. Given that WB and CB are primarily composed of hemicellulose, cellulose, and lignin, their similar mass loss profiles are expected. These components decompose within overlapping temperature ranges: hemicellulose (150–250 °C), cellulose (250–400 °C), and lignin (280–450 °C) [56,57,58]. These overlapping decomposition intervals form the core mass loss regime for both WB and CB. An increase in heating rate led to higher onset and end temperature. At lower heating rates, heat release occurs more gradually, allowing for more effective water removal from the feedstock. In contrast, higher heating rates initiate decomposition more rapidly, limiting the time available for complete moisture diffusion. As a result, the drying phase is significantly influenced by the internal diffusion of water within the biomass structure [59].
When PP was blended with either CB or WB, both onset and end temperatures increased with rising PP content. Conversely, residual masses decreased with increasing PP mass, consistent with trends observed in other blends. A study by Chen et al. [60] confirms the low-to-negligible residual mass of waste PP following thermal degradation at 1000 °C. This minimal residue is characteristic of PP and other polyolefins, and this can be attributed to several factors: (1) the use of neutralizing agents during manufacturing to stabilize the low chloride ash levels, (2) the inherently low inorganic content compared to natural feedstocks, and (3) the inclusion of additives such as antioxidants, antistatic agents, slip agents, and UV stabilizers to enhance PP’s resistance to thermal degradation [61,62].
In PP/WB blends, the observed increase in temperature at higher heating rates is likely due to heat transfer limitations caused by temperature gradients between the particle surface and its core, which restricts the release of volatiles [63]. The rise in temperature with increasing PP mass is attributed to the enhanced thermal stability of the blend, driven by PP’s high-temperature resistance [64]. Interestingly, even a small proportion of wood in PP can significantly increase its thermal stability. This aligns with findings by Poletto et al. [65], who studied PP/wood fiber composites (70/30 wt%) heated to 700 °C without additives. The PP/WB blend recorded a maximum temperature of 451 °C, compared to 439 °C for pure PP [65]. Similarly, Stančin et al. [66] investigated PP/sawdust blends (a mixture of fir, oakwood, and beech wood) and observed elevated end temperatures at higher heating rates, at 25% PP blend compared to pure PP. Specifically, pure PP recorded end temperatures of 445 °C, 455 °C, 470 °C, and 475 °C at heating rates of 5 °C/min, 10 °C/min, 20 °C/min, and 30 °C/min, respectively, while the 25% sawdust blend recorded higher values of approximately 470 °C, 480 °C, 490 °C, and 500 °C under the same conditions [66]. These findings, along with results from the present study, suggest that even minimal wood biomass inclusion can enhance the thermal stability of PP. Notably, heating rate had a limited effect on final residual mass, accounting for less than a 3% change. The broader decomposition temperature ranges and shifts to higher temperatures observed in this study have also been reported in other investigations involving PP-rich feedstock blends [66,67,68].
In the CB/WB blends, the most pronounced effect was on the residual mass, which increased with higher CB content. This is likely due to the elevated inorganic content of CB. Leyssens et al. [69] reported a dry-basis ash content of 7.7 wt% in cardboard, compared to 0.2 wt% in milled wood. When blended at 50/50 wt% and 74/26 wt% CB/WB ratios, residual mass increased to 3.9 wt% and 6.2 wt%, respectively. The high residual mass in CB may be attributed to (1) chemical residues from the manufacturing process, (2) mineral matter formed during pulp production, (3) metallic contaminants from piping and machinery, and (4) added inorganic materials such as fillers, coatings, and pigments. The final residue content is influenced by these factors, as well as operational parameters such as temperature and feedstock size [70].

4.2. Activation Energy

In this phase of the study, Ea values were calculated for the thermal oxidative treatment of PP, WB, CB, and their blends using three model-free kinetic models: the Friedmann, KAS, and Num. Op.models. For PP, the Friedmann and Num. Op.models yielded closely aligned mean Ea values of 63.7 kJ/mol and 63.9 kJ/mol, respectively, while the KAS model produced a slightly lower one at 56.4 kJ/mol. Comparative literature reveals a wide range of Ea values for PP, depending on the kinetic model and experimental conditions. Mohammad et al. [71] using the Freeman–Carroll approach, recorded an Ea of 306.8 kJ mol−1. Paik and Kar1 [72] applied multiple kinetic models to PP degradation: the Coats–Redfern technique yielded Ea values of 98, 100, and 108 kJ/mol at heating rates of 5, 10, and 15 °C min−1, respectively; the second Kissinger technique produced Ea values of 76, 120, and 180 kJ/mol; and the first Kissinger method recorded Ea values as high as 229 kJ/mol. These variations underscore the model dependence of Ea estimation [73]. Additionally, recycled PP, used in this study, tends to exhibit lower Ea than virgin PP. Repeated reprocessing breaks down long polymer chains, resulting in lower molecular weight species that are more susceptible to thermal degradation, thereby lowering Ea [74]. Thus, recycled PP may be advantageous in processes where a lower Ea is desirable. Across all three kinetic models, PP consistently exhibited the lowest activation energy values, ranging from approximately 56 to 64 kJ/mol. This trend reflects PP’s relatively simple polymeric structure and low thermal resistance, which facilitate rapid chain scission during oxidative decomposition.
Among the individual feedstocks, WB recorded the highest Ea (~138–139 kJ/mol). The literature reports a broad range of Ea values for wood species under varying conditions. Tsapko et al. [67] reported significantly lower Ea values for pine, hornbeam, and ashwood under pyrolysis: 13.47 kJ/mol, 23.28 kJ/mol, and 19.95 kJ/mol, respectively. Shen et al. [75], using both the global kinetic model and the Distributed Activation Energy Model (DAEM), found Ea values ranging from 180 to 220 kJ/mol under inert conditions and 170 to 235 kJ/mol under oxidative conditions, across conversion rates of 10–85%. These studies were conducted at heating rates of 5 °C/min to 40 °C/min, with the correlation coefficient exceeding 0.9. This elevated thermal threshold is attributed to WB’s lignin-rich composition and structural complexity, which slow down devolatilization and char breakdown [76]. Ajorloo et al. (2025) emphasizes that biomass with high lignin content requires more energy for conversion, especially under oxidative co-gasification conditions [77].
Most studies on CB have focused on pyrolysis rather than oxidative conditions. Delgado et al. [55] estimated Ea for torrefied CB under oxidative conditions using the Starink and Coats–Redfern models, reporting values between 80 and 242.3 kJ/mol. CB showed intermediate Ea values, with mean estimates between 113 and 116 kJ/mol across models. These values suggest a more complex thermal degradation pathway than that in PP, likely due to CB’s semi-crystalline cellulose content and hydrogen bonding networks, which require greater energy input to initiate and sustain decomposition [78]. Among the isoconversional methods used in the thermal analysis, the Kissinger–Akahira–Sunose (KAS) technique consistently produced lower activation energy estimates compared to both the Friedman and Num. Op.models, primarily due to its integral formulation and smoothing effects [79]. As an integral method, KAS averages temperature data over a conversion range, which dampens the influence of local fluctuations and experimental noise, factors that often inflate activation energy in differential approaches like Friedman’s [79]. The Friedman method calculates activation energy from the slope of ln(dα/dt) versus 1/T at each conversion point, making it highly sensitive to noise and steep conversion gradients, especially in overlapping or multi-step reactions [80]. Numerical Optimization, while more robust and iterative, fits simulated curves to experimental data across multiple heating rates and conversion levels, often capturing mechanistic complexity more accurately but at the cost of higher apparent activation energies due to its precision in resolving reaction steps [81]. In contrast, KAS assumes a relatively constant reaction mechanism and does not deconvolute overlapping processes, leading to smoother and generally lower activation energy profiles [79].
Overall, the trend reveals a clear hierarchy in thermal reactivity: PP < CB < WB. These differences underscore the importance of feedstock selection in co-gasification systems, as Ea directly influences process efficiency, temperature requirements, and residue formation.
Blending studies further illuminate the influence of feedstock composition on Ea. Kabir et al. [82] investigated the thermo-oxidative stability of polyolefins blended with lignocellulosic biomass, finding increased Ea values (112–145 kJ/mol) compared to pure recycled PP (100 kJ/mol), correlating with higher phenolic content and longer oxidation induction times. Stančin et al. [66] attributed increased Ea in PP/wood blends to mutual feedstock interactions that hinder volatile release, delaying decomposition and increasing kinetic energy. Esmizadeh et al. [83] reported Ea values of 150 and 125 kJ/mol for PP blends containing 40% and 60% wood, respectively, compared to 75 kJ/mol for pure recycled PP. Consistent with these findings, the present study observed a higher mean Ea for 50 wt% PP/WB blends than for pure recycled PP. The increase was attributed to the high volatile content from wood degradation, which reduces oxygen diffusion and delays decomposition, thereby elevating Ea. Feedstock mixtures exhibit distinct decomposition mechanisms, and their heterogeneity significantly influences Ea [66]. Interestingly, while PP/WB blends showed increased Ea, the blending of PP/CB and CB/WB resulted in reduced Ea compared to the pure feedstocks. This suggests that blending alters reaction pathways during gasification, with shifts in Ea indicating the emergence of new dominant mechanisms. Given the wide range of Ea values reported in the literature, largely dependent on experimental conditions and kinetic models, process optimization will require careful selection of blend ratios to achieve the desired outcomes.

5. Conclusions

This study used thermogravimetric analysis to assess the thermal and kinetic behavior of waste polypropylene (PP), woody biomass (WB), and cardboard (CB), both individually and in blends. PP showed high thermal stability and minimal residue (<2%), with small additions of WB enhancing its end temperature. CB retained more residue than WB due to its inorganic content. Higher heating rates shifted decomposition to higher temperatures, influencing reactor design. Waste PP had lower Ea than virgin PP, and blending, especially CB/WB, which further reduced Ea, indicating synergistic reactivity. The recommended ratios include PP/CB (20/80 or 50/50) for reduced energy demand, PP/WB (50/50 or 80/20) for thermal resistance and low residue, and CB/WB (80/20) for high char yield. These synergistic blends enhance combustion efficiency by combining complementary thermal behaviors, such as PP’s volatile release and CB’s oxygenated groups or CB/WB’s lignocellulosic structure, resulting in optimized thermal stability, enhanced char yield, and optimal energy demand in waste-to-energy systems, aligned with circular economy goals.

Author Contributions

M.J.D.B.: conceptualization, methodology, investigation, writing (original draft); S.M.: formal analysis, methodology, writing (original draft); M.S.R.: supervision, methodology, writing (review and editing); L.Y.: investigation, methodology, writing (review and editing), supervision; G.P.: supervision, methodology, writing (review and editing); E.D.T.: validation, writing (review and editing), funding acquisition, project administration. All authors have read and agreed to the published version of the manuscript.

Funding

This research was funded by the Australian Government’s Strategic University Reform Fund.

Data Availability Statement

The original contributions presented in this study are included in the article. Further inquiries can be directed to the corresponding author(s).

Acknowledgments

The authors acknowledge the Faculty of Science and Engineering (Southern Cross University, Lismore) for providing the research facilities and project management for this study.

Conflicts of Interest

The authors declare no conflicts of interest.

References

  1. Biancini, G.; Moradi, R.; Cioccolanti, L.; Marchetti, B.; Moglie, M.; Del Zotto, L. A general model for air gasification of heterogenous municipal solid waste. Energy Convers. Manag. 2023, 278, 116749. [Google Scholar] [CrossRef]
  2. Veksha, A.; Giannis, A.; Yuan, G.; Tng, J.; Chan, W.P.; Chang, V.W.-C.; Lisak, G.; Lim, T.-T. Distribution and modeling of tar compounds produced during downdraft gasification of municipal solid waste. Renew. Energy 2019, 136, 1294–1303. [Google Scholar] [CrossRef]
  3. Gao, P.; Hu, Z.; Sheng, Y.; Pan, W.; Tang, L.; Chen, Y.; Chen, X.; Wang, F. Migration characteristics of chlorine during pyrolysis of municipal solid waste pellets. Waste Manag. 2023, 172, 208–215. [Google Scholar] [CrossRef]
  4. Lopez, G.; Artetxe, M.; Amutio, M.; Alvarez, J.; Bilbao, J.; Olazar, M. Recent advances in the gasification of waste plastics: A critical overview. Renew. Sustain. Energy Rev. 2018, 82, 576–596. [Google Scholar] [CrossRef]
  5. Lopez, G.; Artetxe, M.; Amutio, M.; Bilbao, J.; Olazar, M. Thermochemical routes for the valorization of waste polyolefinic plastics to produce fuels and chemicals: A review. Renew. Sustain. Energy Rev. 2017, 73, 346–368. [Google Scholar] [CrossRef]
  6. Alaedini, A.H.; Tourani, H.K.; Saidi, M. A review of waste-to-hydrogen conversion technologies for solid oxide fuel cell (SOFC) applications: Aspect of gasification process and catalyst development. J. Environ. Manag. 2023, 329, 117077. [Google Scholar] [CrossRef]
  7. Lora, E.E.S. Gasification of municipal solid waste for power generation in Brazil, a review of available technologies and their environmental benefits. J. Chem. Chem. Eng. 2016, 10, 249–255. [Google Scholar] [CrossRef]
  8. Weiland, F.; Lundin, L.; Celebi, M.; van der Vlist, K.; Moradian, F. Aspects of chemical recycling of complex plastic waste via the gasification route. Waste Manag. 2021, 126, 65–77. [Google Scholar] [CrossRef]
  9. Al-Qadri, A.A.; Ahmed, U.; Abdul Jameel, A.G.; Zahid, U.; Usman, M.; Ahmad, N. Simulation and modelling of hydrogen production from waste plastics: Technoeconomic analysis. Polymers 2022, 14, 2056. [Google Scholar] [CrossRef]
  10. Bashir, M.A.; Tuo, J.; Weidman, J.; Soong, Y.; Gray, M.L.; Shi, F.; Wang, P. Plastic waste gasification for low-carbon hydrogen production: A comprehensive review. Energy Adv. 2025, 4, 330–363. [Google Scholar] [CrossRef]
  11. Mojaver, P.; Chitsaz, A.; Hasannejad, S.J.; Khalilian, M. Plastic Waste Gasification. In Plastic Waste Treatment and Management: Gasification Processes; Springer: Berlin/Heidelberg, Germany, 2023; pp. 47–60. [Google Scholar]
  12. Chai, Y.; Gao, N.; Wang, M.; Wu, C. H2 production from co-pyrolysis/gasification of waste plastics and biomass under novel catalyst Ni-CaO-C. Chem. Eng. J. 2020, 382, 122947. [Google Scholar] [CrossRef]
  13. Du, S.; Yuan, S.; Zhou, Q. Numerical investigation of co-gasification of coal and PET in a fluidized bed reactor. Renew. Energy 2021, 172, 424–439. [Google Scholar] [CrossRef]
  14. Xu, H.; Shi, B. Design and system evaluation of mixed waste plastic gasification process based on integrated gasification combined cycle system. Processes 2022, 10, 499. [Google Scholar] [CrossRef]
  15. Sikarwar, V.S.; Zhao, M.; Clough, P.; Yao, J.; Zhong, X.; Memon, M.Z.; Shah, N.; Anthony, E.J.; Fennell, P.S. An overview of advances in biomass gasification. Energy Environ. Sci. 2016, 9, 2939–2977. [Google Scholar] [CrossRef]
  16. Gesese, T.N.; Admase, A.T.; Asrade, E.D.; Getahun, E. Biomass Gasification for Sustainable Energy Production: Effect of Operational Parameters on Product Gas; InTech: London, UK, 2025. [Google Scholar]
  17. Lackner, M.; Fei, Q.; Guo, S.; Yang, N.; Guan, X.; Hu, P. Biomass gasification as a scalable, green route to combined heat and power (CHP) and synthesis gas for materials: A review. Fuels 2024, 5, 625–649. [Google Scholar] [CrossRef]
  18. Allesina, G.; Pedrazzi, S. Barriers to success: A technical review on the limits and possible future roles of small scale gasifiers. Energies 2021, 14, 6711. [Google Scholar] [CrossRef]
  19. Yu, J.; Guo, Q.; Gong, Y.; Ding, L.; Wang, J.; Yu, G. A review of the effects of alkali and alkaline earth metal species on biomass gasification. Fuel Process. Technol. 2021, 214, 106723. [Google Scholar] [CrossRef]
  20. Zhang, J.-l.; Guo, J.; Wang, G.-w.; Xu, T.; Chai, Y.-f.; Zheng, C.-l.; Xu, R.-s. Kinetics of petroleum coke/biomass blends during co-gasification. Int. J. Miner. Metall. Mater. 2016, 23, 1001–1010. [Google Scholar] [CrossRef]
  21. Pachamaanickam, R.I.; Navaneethakrishnan, S.V.M. Thermogravimetric assessment and multi-model kinetic study of Indian fish tail nut biomass. React. Kinet. Mech. Catal. 2025. [Google Scholar] [CrossRef]
  22. Kirsanovs, V.; Žandeckis, A.; Rochas, C. Biomass gasification thermodynamic model including tar and char. Agron. Res. 2016, 14, 1321–1331. [Google Scholar]
  23. Ibrahim, S.; Samy, M. Syngas Compositions, Cold gas and Carbon conversion efficiencies for different Coal gasification processes and all Coal ranks. J. Min. Mech. Eng. 2020, 1, 59–72. [Google Scholar] [CrossRef]
  24. Vamvuka, D.; Deli, M.; Stratakis, A. Effect of Mineral Additives on Fusion Behavior of Agricultural Residue Ashes during Combustion or Co-combustion with Lignite. J. Energy Power Technol. 2021, 3, 1–27. [Google Scholar] [CrossRef]
  25. Meng, Z.; Xu, R.; Feng, Q.; Lin, X.; Li, M. Effect of residual carbon on crystallization and solidification behavior of coal gasification coarse slag. Int. J. Coal Sci. Technol. 2025, 12, 1. [Google Scholar] [CrossRef]
  26. Ten Have, I.C.; van den Brink, R.Y.; Marie-Rose, S.C.; Meirer, F.; Weckhuysen, B.M. Using biomass gasification mineral residue as catalyst to produce light olefins from CO, CO2, and H2 mixtures. ChemSusChem 2022, 15, e202200436. [Google Scholar] [CrossRef]
  27. Wehrung, Q.; Bernasconi, D.; Michel, F.; Destefanis, E.; Caviglia, C.; Curetti, N.; Mezni, M.; Pavese, A.; Pastero, L. Accelerated Carbonation of Waste Incineration Residues: Reactor Design and Process Layout from Laboratory to Field Scales—A Review. Clean Technol. 2025, 7, 58. [Google Scholar] [CrossRef]
  28. Kwon, G.; Cho, D.-W.; Park, J.; Bhatnagar, A.; Song, H. A review of plastic pollution and their treatment technology: A circular economy platform by thermochemical pathway. Chem. Eng. J. 2023, 464, 142771. [Google Scholar] [CrossRef]
  29. Majewsky, M.; Bitter, H.; Eiche, E.; Horn, H. Determination of microplastic polyethylene (PE) and polypropylene (PP) in environmental samples using thermal analysis (TGA-DSC). Sci. Total Environ. 2016, 568, 507–511. [Google Scholar] [CrossRef] [PubMed]
  30. Janajreh, I.; Adeyemi, I.; Elagroudy, S. Gasification feasibility of polyethylene, polypropylene, polystyrene waste and their mixture: Experimental studies and modeling. Sustain. Energy Technol. Assess. 2020, 39, 100684. [Google Scholar] [CrossRef]
  31. Felix, C.B.; Chen, W.-H.; Ubando, A.T.; Park, Y.-K.; Lin, K.-Y.A.; Pugazhendhi, A.; Nguyen, T.-B.; Dong, C.-D. A comprehensive review of thermogravimetric analysis in lignocellulosic and algal biomass gasification. Chem. Eng. J. 2022, 445, 136730. [Google Scholar] [CrossRef]
  32. Adeyemi, I.; Janajreh, I.; Arink, T.; Ghenai, C. Gasification behavior of coal and woody biomass: Validation and parametrical study. Appl. Energy 2017, 185, 1007–1018. [Google Scholar] [CrossRef]
  33. Chanda, M.; Roy, S.K. Industrial Polymers, Specialty Polymers, and Their Applications; CRC Press: Boca Raton, FL, USA, 2008. [Google Scholar]
  34. Ong, H.C.; Chen, W.-H.; Singh, Y.; Gan, Y.Y.; Chen, C.-Y.; Show, P.L. A state-of-the-art review on thermochemical conversion of biomass for biofuel production: A TG-FTIR approach. Energy Convers. Manag. 2020, 209, 112634. [Google Scholar]
  35. Jafri, Y.; Waldheim, L.; Lundgren, J. Emerging gasification technologies for waste & biomass. IEA Bioenergy 2020, 10, 14–75. [Google Scholar]
  36. Bai, Y.; Fu, L.; Zhang, X. Co-gasification of biomass and plastic wastes using a kinetic model in ASPEN plus. J. Mater. Cycles Waste Manag. 2025, 27, 2198–2206. [Google Scholar] [CrossRef]
  37. Manić, N.; Janković, B.; Dodevski, V. Model-free and model-based kinetic analysis of Poplar fluff (Populus alba) pyrolysis process under dynamic conditions. J. Therm. Anal. Calorim. 2021, 143, 3419–3438. [Google Scholar] [CrossRef]
  38. Das, P. Pyrolysis study of a waste plastic mixture through different kinetic models using isothermal and nonisothermal mechanism. RSC Adv. 2024, 14, 25599–25618. [Google Scholar] [CrossRef]
  39. Saghir, M.; Rehan, M.; Nizami, A.-S. Recent trends in gasification based waste-to-energy. In Gasification for Low-Grade Feedstock; IntechOpen: London, UK, 2018. [Google Scholar]
  40. Abd-Elghany, M.; Klapötke, T.M. A review on differential scanning calorimetry technique and its importance in the field of energetic materials. Phys. Sci. Rev. 2018, 3, 20170103. [Google Scholar] [CrossRef]
  41. Vyazovkin, S. Conversion dependence of activation energy for model DSC curves of consecutive reactions. Thermochim. Acta 1994, 236, 1–13. [Google Scholar] [CrossRef]
  42. Mandal, S.; Mohalik, N.K.; Ray, S.K.; Khan, A.M.; Mishra, D.; Pandey, J.K. A comparative kinetic study between TGA & DSC techniques using model-free and model-based analyses to assess spontaneous combustion propensity of Indian coals. Process Saf. Environ. Prot. 2022, 159, 1113–1126. [Google Scholar]
  43. Snegirev, A.Y.; Talalov, V.; Stepanov, V.; Harris, J. Formal kinetics of polystyrene pyrolysis in non-oxidizing atmosphere. Thermochim. Acta 2012, 548, 17–26. [Google Scholar] [CrossRef]
  44. Friedman, H.L. Kinetics of thermal degradation of char-forming plastics from thermogravimetry: Application to a phenolic plastic. J. Polym. Sci. Part C Polym. Symp. 1964, 6, 183–195. [Google Scholar] [CrossRef]
  45. Akahira, T. Trans. Joint convention of four electrical institutes. Res. Rep. Chiba Inst. Technol. 1971, 16, 22–31. [Google Scholar]
  46. Kissinger, H.E. Variation of peak temperature with heating rate in differential thermal analysis. J. Res. Natl. Bur. Stand. 1956, 57, 217–221. [Google Scholar]
  47. Kissinger, H.E. Reaction kinetics in differential thermal analysis. Anal. Chem. 1957, 29, 1702–1706. [Google Scholar] [CrossRef]
  48. Campbell, S.D.; Sell, D.; Jenkins, R.P.; Whiting, E.B.; Fan, J.A.; Werner, D.H. Review of numerical optimization techniques for meta-device design. Opt. Mater. Express 2019, 9, 1842–1863. [Google Scholar] [CrossRef]
  49. Strasser, C. Terminology in Pharmacy—Thermal Analysis Provides the Overall Picture; ASTM: West Conshohocken, PA, USA, 2019. [Google Scholar]
  50. Garenne, A.; Beck, P.; Montes-Hernandez, G.; Chiriac, R.; Toche, F.; Quirico, E.; Bonal, L.; Schmitt, B. The abundance and stability of “water” in type 1 and 2 carbonaceous chondrites (CI, CM and CR). Geochim. Cosmochim. Acta 2014, 137, 93–112. [Google Scholar]
  51. Yorulmaz, S.Y.; Atimtay, A.T. Investigation of combustion kinetics of treated and untreated waste wood samples with thermogravimetric analysis. Fuel Process. Technol. 2009, 90, 939–946. [Google Scholar] [CrossRef]
  52. Zholdassov, Y.S.; Kwok, R.W.; Shlain, M.A.; Patel, M.; Marianski, M.; Braunschweig, A.B. Kinetics of primary mechanochemical covalent-bond-forming reactions. RSC Mechanochem. 2024, 1, 11–32. [Google Scholar] [CrossRef]
  53. Selim, K.; Özkar, S.; Yilmaz, L. Thermal characterization of glycidyl azide polymer (GAP) and GAP-based binders for composite propellants. J. Appl. Polym. Sci. 2000, 77, 538–546. [Google Scholar] [CrossRef]
  54. Wang, K.; Addiego, F.; Bahlouli, N.; Ahzi, S.; Rémond, Y.; Toniazzo, V.; Muller, R. Analysis of thermomechanical reprocessing effects on polypropylene/ethylene octene copolymer blends. Polym. Degrad. Stab. 2012, 97, 1475–1484. [Google Scholar] [CrossRef]
  55. Delgado, B.; González, D.L.; Godbout, S.; Lagacé, R.; Giroir-Fendler, A.; Ramirez, A.A. A study of torrefied cardboard characterization and applications: Composition, oxidation kinetics and methane adsorption. Sci. Total Environ. 2017, 593, 406–417. [Google Scholar] [CrossRef]
  56. Acharya, B.; Sule, I.; Dutta, A. A review on advances of torrefaction technologies for biomass processing. Biomass Convers. Biorefinery 2012, 2, 349–369. [Google Scholar] [CrossRef]
  57. Shankar Tumuluru, J.; Sokhansanj, S.; Hess, J.R.; Wright, C.T.; Boardman, R.D. A review on biomass torrefaction process and product properties for energy applications. Ind. Biotechnol. 2011, 7, 384–401. [Google Scholar] [CrossRef]
  58. Zhou, C.; Yang, W.; Blasiak, W. Characteristics of waste printing paper and cardboard in a reactor pyrolyzed by preheated agents. Fuel Process. Technol. 2013, 116, 63–71. [Google Scholar] [CrossRef]
  59. Fraga, L.G.; Silva, J.; Teixeira, S.; Soares, D.; Ferreira, M.; Teixeira, J. Influence of operating conditions on the thermal behavior and kinetics of pine wood particles using thermogravimetric analysis. Energies 2020, 13, 2756. [Google Scholar] [CrossRef]
  60. Chen, G.-B.; Huang, K.-C. A study of copyrolysis characteristics of sewage sludge and waste polypropylene. Int. J. Energy Res. 2023, 2023, 1406397. [Google Scholar] [CrossRef]
  61. Campo, E.A. Selection of Polymeric Materials: How to Select Design Properties from Different Standards; William Andrew: Norwich, NY, USA, 2008. [Google Scholar]
  62. Mentes, D.; Nagy, G.; Szabó, T.J.; Hornyák-Mester, E.; Fiser, B.; Viskolcz, B.; Póliska, C. Combustion behaviour of plastic waste–A case study of PP, HDPE, PET, and mixed PES-EL. J. Clean. Prod. 2023, 402, 136850. [Google Scholar] [CrossRef]
  63. Jin, Q.; Wang, X.; Li, S.; Mikulčić, H.; Bešenić, T.; Deng, S.; Vujanović, M.; Tan, H.; Kumfer, B.M. Synergistic effects during co-pyrolysis of biomass and plastic: Gas, tar, soot, char products and thermogravimetric study. J. Energy Inst. 2019, 92, 108–117. [Google Scholar] [CrossRef]
  64. Rahman, A.; Adeboye, O.; Adebayo, A.; Salleh, M. Behaviour and Some Properties of Wood Plastic Composite Made from Recycled Polypropylene and Rubberwood. Jordan J. Mech. Ind. Eng. 2023, 17, 281–287. [Google Scholar] [CrossRef] [PubMed]
  65. Poletto, M. Polypropylene-based wood-plastic composites: Effect of using a coupling agent derived from a renewable resource. Maderas. Cienc. Tecnol. 2017, 19, 265–272. [Google Scholar]
  66. Stančin, H.; Mikulcic, H.; Manic, N.; Stojiljkovic, D.; Vujanović, M. Thermogravimetric and kinetic analysis of waste biomass and plastic mixtures. J. Sustain. Dev. Energy Water Environ. Syst. 2023, 11, 1–17. [Google Scholar] [CrossRef]
  67. Mishra, R.K.; Mohanty, K. Pyrolysis kinetics and thermal behavior of waste sawdust biomass using thermogravimetric analysis. Bioresour. Technol. 2018, 251, 63–74. [Google Scholar] [CrossRef]
  68. Mikulčić, H.; Jin, Q.; Stančin, H.; Wang, X.; Li, S.; Tan, H.; Duić, N. Thermogravimetric analysis investigation of polyurethane plastic thermal properties under different atmospheric conditions. J. Sustain. Dev. Energy Water Environ. Syst. 2019, 7, 355–367. [Google Scholar] [CrossRef]
  69. Leyssens, G.; Trouvé, G.; Caplain, I.; Schönnenbeck, C.; Cazier, F. Energetic performances and environmental impact of the combustion of cardboard/sawdust in a domestic boiler. Fuel 2014, 122, 21–27. [Google Scholar] [CrossRef]
  70. Tappi, T. Ash in wood, pulp, paper and paperboard: Combustion at 525 C. TAPPI Test Methods T 1993, 211, 3–4. [Google Scholar]
  71. Ali, M.F.; Ahmed, S.; Qureshi, M.S. Catalytic coprocessing of coal and petroleum residues with waste plastics to produce transportation fuels. Fuel Process. Technol. 2011, 92, 1109–1120. [Google Scholar] [CrossRef]
  72. Paik, P.; Kar, K.K. Kinetics of thermal degradation and estimation of lifetime for polypropylene particles: Effects of particle size. Polym. Degrad. Stab. 2008, 93, 24–35. [Google Scholar] [CrossRef]
  73. Pang, Y.; Zhu, X.; Li, N.; Wang, Z. Study on CO2 co-gasification of cellulose and high-density polyethylene via TG-FTIR and ReaxFF MD. Process Saf. Environ. Prot. 2024, 186, 1471–1480. [Google Scholar] [CrossRef]
  74. Abbas-Abadi, M.S.; Haghighi, M.N.; Yeganeh, H. Effect of the melt flow index and melt flow rate on the thermal degradation kinetics of commercial polyolefins. J. Appl. Polym. Sci. 2012, 126, 1739–1745. [Google Scholar] [CrossRef]
  75. Shen, D.; Gu, S.; Jin, B.; Fang, M. Thermal degradation mechanisms of wood under inert and oxidative environments using DAEM methods. Bioresour. Technol. 2011, 102, 2047–2052. [Google Scholar] [CrossRef]
  76. Olabisi, A.S.; Balogun, A.O.; Oni, T.O.; Fakinle, B.S.; Sotoudehnia, F.; McDonald, A.G.; Ikubanni, P.P. Physicochemical characterization of woody lignocellulosic biomass and charcoal for bio-energy heat generation. Sci. Rep. 2023, 13, 19242. [Google Scholar] [CrossRef]
  77. Ajorloo, M.; Ghodrat, M.; Scott, J.; Strezov, V. Evaluating the role of feedstock composition and component interactions on biomass gasification. Fuel 2025, 381, 133528. [Google Scholar] [CrossRef]
  78. Klein, H.C.; Cheng, X.; Smith, J.C.; Shen, T. Transfer matrix approach to the hydrogen-bonding in cellulose Iα fibrils describes the recalcitrance to thermal deconstruction. J. Chem. Phys. 2011, 135, 085106. [Google Scholar] [CrossRef]
  79. Vyazovkin, S.; Burnham, A.K.; Criado, J.M.; Pérez-Maqueda, L.A.; Popescu, C.; Sbirrazzuoli, N. ICTAC Kinetics Committee recommendations for performing kinetic computations on thermal analysis data. Thermochim. Acta 2011, 520, 1–19. [Google Scholar] [CrossRef]
  80. Mamleev, V.; Bourbigot, S.; Bras, M.L.; Lefebvre, J. Three model-free methods for calculation of activation energy in TG. J. Therm. Anal. Calorim. 2004, 78, 1009–1027. [Google Scholar] [CrossRef]
  81. Vyazovkin, S.; Wight, C.A. Model-free and model-fitting approaches to kinetic analysis of isothermal and nonisothermal data. Thermochim. Acta 1999, 340, 53–68. [Google Scholar]
  82. Kabir, A.S.; Yuan, Z.; Kuboki, T.; Xu, C.C. De-polymerization of industrial lignins to improve the thermo-oxidative stability of polyolefins. Ind. Crops Prod. 2018, 120, 238–249. [Google Scholar] [CrossRef]
  83. Esmizadeh, E.; Tzoganakis, C.; Mekonnen, T.H. Degradation behavior of polypropylene during reprocessing and its biocomposites: Thermal and oxidative degradation kinetics. Polymers 2020, 12, 1627. [Google Scholar] [CrossRef]
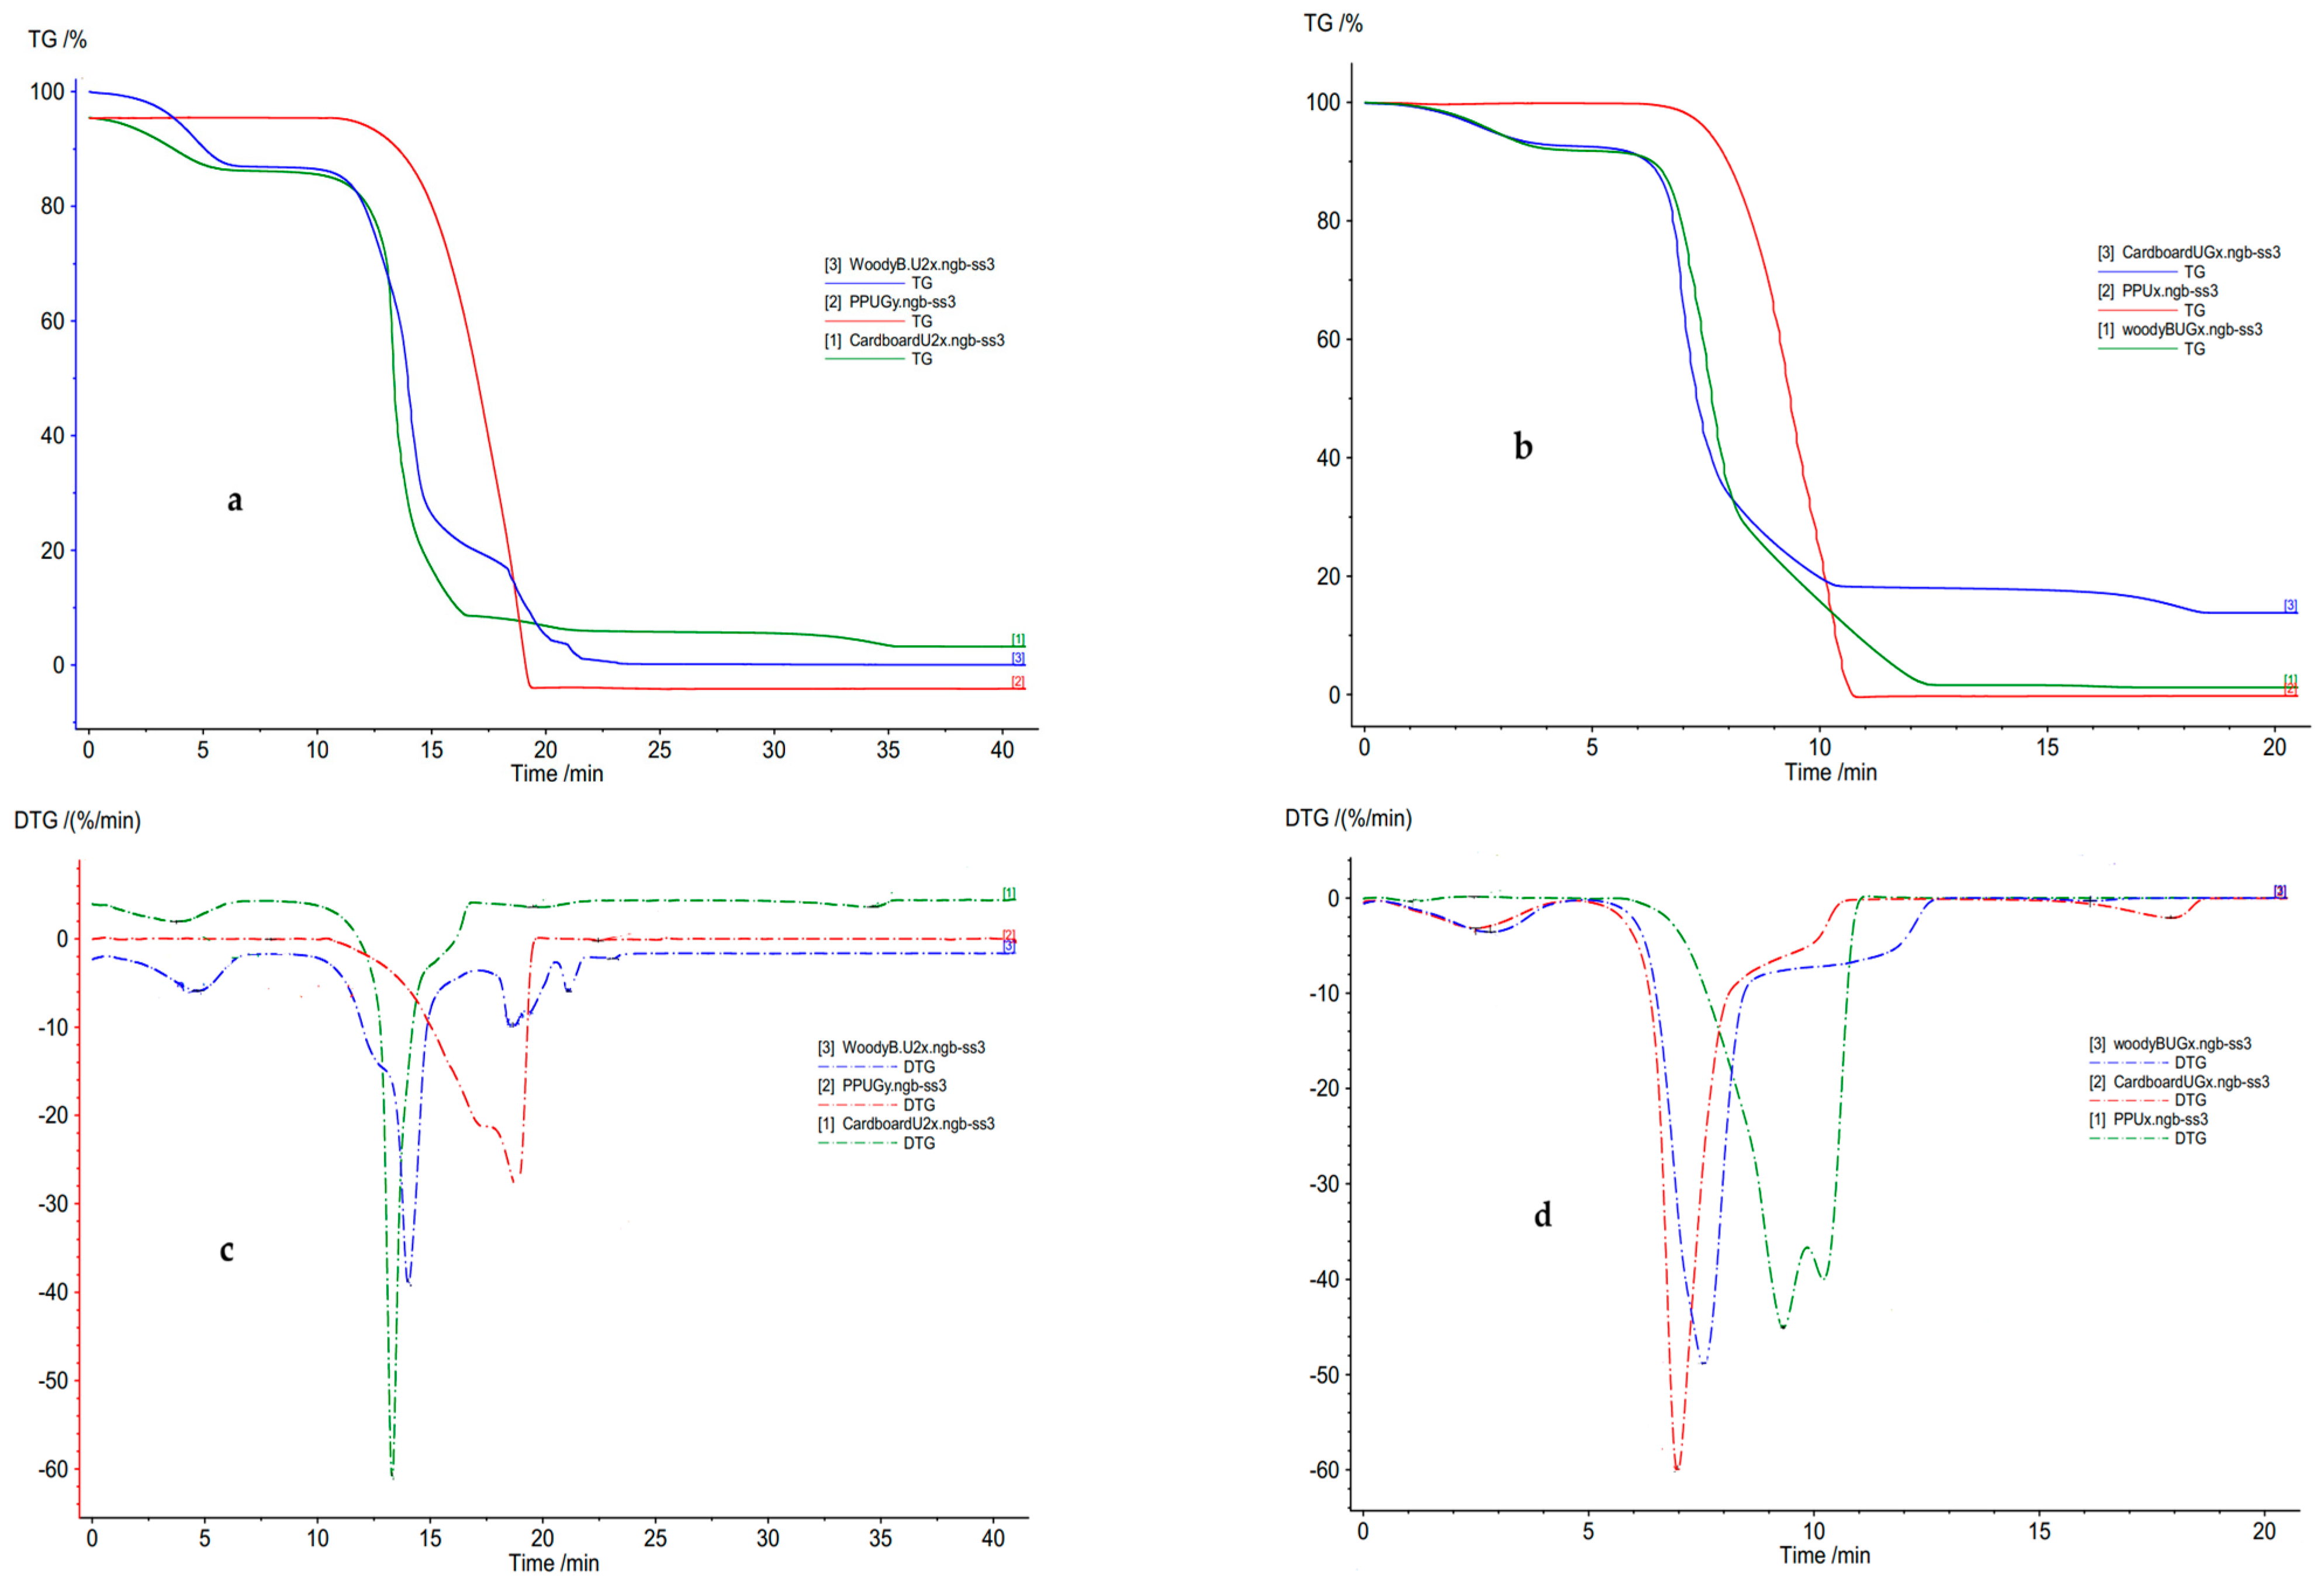
Figure 1. TG/DTG thermograms for individual components (a) TG for 100% PP, CB, and WB at 20 °C/min; (b) TG for 100% PP, CB, and WB at 40 °C/min; (c) DTG for 100% PP, CB, and WB at 20 °C/min; (d) DTG for 10% PP, CB, and WB at 40 °C/min.
Energies 18 05193 g001
Figure 2. Onset temperatures for PP/WB, PP/CB, and CB/WB at various blend ratios at heating rates of (a) 20 °C/min and (b) 40 °C/min.
Energies 18 05193 g002
Figure 3. End temperatures for PP/WB, PP/CB, and CB/WB at various blend ratios at heating rates of (a) 20 °C/min and (b) 40 °C/min.
Energies 18 05193 g003
Figure 4. Residual mass for PP/WB, PP/CB, and CB/WB at (a) 20 °C/min and (b) 40 °C/min.
Energies 18 05193 g004
Figure 5. Ea for PP/CB blends using model-free methods: (a) Friedmann model, (b) Kissinger–Akahira–Sunose, and (c) Numerical Optimization.
Energies 18 05193 g005
Figure 6. Ea for PP/WB blends using three model-free methods: (a) Friedmann, (b) KAS model, (c) Numerical Optimization.
Energies 18 05193 g006
Figure 7. Ea for CB/WB blends using three model-free methods: (a) Friedmann, (b) KAS model, (c) Numerical Optimization.
Energies 18 05193 g007
Table 1. Experimental materials and blend mix percentages.
CB (wt%)WB (wt%)Waste PP (wt%)
5050-
8020-
2080-
100--
--100
-8020
-5050
-2080
80-20
50-50
20-80
-100-
Table 2. TG Controls and parameters.
Apparatus/ControlsDescription
FurnaceSilicon Carbide (0 °C to 1600 °C). Operational heating rates range from 0 °C/min to 50 °C/min.
Gas ControlsPurge Gas MFC—Air (N2/O2 (80/20) at a flowrate of 50 L/min
Protective Gas MFC—Air (N2/O2 (80/20) at a flowrate of 20 L/min
CruciblesAl2O3 (temperature range of 0 °C to 1564 °C)
Temperature Resolution0.001 °C
Table 3. Models for the kinetic analysis.
MethodEquationPlotSlopeReference
Friedmann ln R R = E a R T + I n   A . f ( α ) I n   R   a g a i n s t 1 T E a R [43,44]
Kissinger–Akahira–Sunose (KAS) ln β T a 2 = I n A R E a g a E a R T I n β T a 2   a g a i n s t   1 T E a R [45,46,47]
Numerical Optimization ln R R = E a R T + I n A . f ( α ) [48]
Here, β = c o n s t a n t   h e a t i n g   r a t e   (°C/min); T = temperature (°C);   a = c o n v e r s i o n   r a t e   (min−1); A = p r e - e x p o n e n t i a l   f a c t o r   (s−1); R = i d e a l   G a s   c o n s t a n t   (8.314 J/(mol·K); E a = a c t i v a t i o n   e n e r g y   (kJ/mol); a n d   f ( α ) = f u n c t i o n   o f   k i n e t i c   m e c h a n i s m   ( i n   t h i s   c a s e , t h e   c o n v e r s i o n   d e g r e e ) (dimensionless). The Numerical Optimization model-free method is specific to Kinetic Neo Software. It is based on the Friedmann method. The method searches for the optimal functions for Ea and log A to obtain the best fit for the conversion.
Table 4. Activation energies of individual feedstocks using model-free isoconversional methods.
Conversion Rate (%)
Models102030405060708090Mean (kJ/mol)
FriedmannPP
(r2 = 0.9966)
120.1068.9054.2557.8077.2281.8154.6132.8217.9963.70
CB
(r2 = 0.9947)
59.3373.21130.89121.62110.79157.78181.69102.98107.80116.20
WB
(r2 = 0.9998)
231.51262.71304.84200.0995.5459.6154.1336.259.12139.31
KASPP
(r2 = 0.8753)
84.2260.4959.8648.3264.3166.6250.2140.2634.7456.36
CB
(r2 = 1.0000)
73.2199.13117.98146.49160.81165.59162.51141.1345.50113.48
WB
(r2 = 0.9980)
125.74190.6235.678227.37169.38120.3185.3654.8336.56138.43
Num. Op.PP
(r2 = 0.9998)
119.6668.4953.7657.9377.7281.4754.9232.8817.9963.89
CB
(r2 = 0.9964)
58.71140.10120.50122.30111.54158.61120.48108.66107.48116.27
WB
(r2 = 0.9999)
231.31262.76304.94200.0995.5459.6254.0236.029.06139.26
Table 5. Mean activation energies of blended feedstocks using model-free isoconversional methods.
BlendBlend Ratio (w/w%)ModelR2 ValueMean Ea (kJ/mol)
PP/CB20/80Friedmann0.993222.54
KAS1.000035.41
Num. Op.0.995226.21
50/50Friedmann0.993227.83
KAS1.000037.14
Num. Op.0.995227.22
80/20Friedmann0.973546.17
KAS1.000043.32
Num. Op.0.998346.96
PP/WB20/80Friedmann0.993225.39
KAS1.000037.14
Num. Op.0.995227.21
50/50Friedmann0.998882.89
KAS1.000066.00
Num. Op.0.999283.72
80/20Friedmann0.961055.10
KAS1.000063.28
Num. Op.0.986050.83
CB/WB20/80Friedmann0.997932.40
KAS0.999948.76
Num. Op.0.998732.97
50/50Friedmann0.998279.42
KAS0.999982.90
Num. Op.0.998680.56
80/20Friedmann0.9981101.89
KAS0.9995102.02
Num. Op.0.9983102.25
Disclaimer/Publisher’s Note: The statements, opinions and data contained in all publications are solely those of the individual author(s) and contributor(s) and not of MDPI and/or the editor(s). MDPI and/or the editor(s) disclaim responsibility for any injury to people or property resulting from any ideas, methods, instructions or products referred to in the content.