Abstract
In recent years, with the development of the electricity market, electricity users have also been able to participate in electricity trading. The energy storage capacity configuration of microgrids with renewable energy considering demand response is of great significance for reducing microgrid costs, improving renewable energy consumption levels, and enhancing microgrid performance. This study first establishes a microgrid model considering demand response. Constraints and economic models of the microgrid are then provided to obtain the cost of the microgrid. To identify the energy storage capacity and the energy scheduling strategy that minimizes the operation cost of the microgrid, this study proposes a two-layer optimization model. The inner layer uses solvers to optimize the transferable loads, interruptible loads, and the energy storage power under the demand response mechanism to minimize the short-term cost. The outer layer uses the particle swarm optimization (PSO) algorithm to optimize the energy storage capacity and minimize the long-term cost. A case analysis shows that the demand response mechanism and reasonable energy storage configuration have a significant effect on reducing the operation cost of the microgrid. In addition, energy storage can reduce power fluctuations in connecting lines and improve the stability of the microgrid.
1. Introduction
Distributed generation (DG) has the characteristics of flexible power source location, environmental friendliness, and low investment cost [1,2]. It adapts to dispersed power demand and serves as a backup for the main power grid, improving power supply reliability [3]. As an effective way to integrate multiple forms of energy, microgrids can increase the utilization efficiency of DG and mitigate the impact of direct integration on the main power grid [4]. However, renewable energy in distributed power generation is random, and the load in the system is uncertain [5]. Therefore, to enhance renewable energy utilization, balance power generation and consumption within the microgrid, ensure system safety and stability, and accommodate the flexible electricity demands of the load, it is necessary to integrate an appropriately configured energy storage system (ESS). This enables temporal electricity shifting and improves the overall economic performance of the microgrid [6,7].
The capacity configuration of energy storage systems has a significant impact on the operational efficiency of microgrids [8,9]. Insufficient storage capacity fails to enhance power quality and operational performance, whereas excessive capacity compromises economic efficiency. Due to the coupling between long-term planning and short-term operation of energy storage, combined with strong uncertainties in both generation and demand during operation, the rational configuration of energy storage capacity is an important issue in the planning and operation of microgrids [10].
Reference [11] proposes a capacity configuration technique for multiple types of energy storage, including electricity, heat, and exhaust gas together. In islanded mode, typical daily data in winter is selected to compare and study the results of the energy storage capacity configuration. Reference [12] optimizes the wind–PV–battery model with the lowest levelized energy cost as the objective and solves the model using Monte Carlo simulation embedded with the gravity search method to obtain the optimal wind–PV–battery capacity configuration scheme. Reference [13] proposes an input–output power allocation method based on second-order moving average filtering and a capacity optimization method based on continuous motion. Reference [14] introduces a multi-objective function that incorporates both the annual average comprehensive cost and a self-balancing indicator, employing the NSGA-II algorithm to compute the annual average comprehensive cost across varying self-balancing rates. However, the methods in [11,12] optimize energy storage capacity configuration exclusively for islanded operation, neglecting the impact of storage capacity on operation stability in grid-connected microgrids. The method in [13] effectively utilizes distributed energy to improve energy efficiency. However, the rationality of energy storage capacity is not considered. The correlation between energy storage power and energy storage economic cost is not considered in [14]. To address these limitations, this study proposes a microgrid model that can operate as an island and can also exchange power with the main grid and configures its energy storage capacity. In addition, the impact of the power and capacity of energy storage on its economic cost is also considered. The energy storage capacity is optimized in this study through the particle swarm optimization (PSO) algorithm.
The demand response (DR) mechanism is a strategy designed to enhance grid operational efficiency, boost power supply stability, and improve economic performance by actively shaping users’ electricity consumption patterns. It is divided into two types: price-based response [15] and incentive-based response [16]. Reference [17] integrates incentive-based DR and price-based DR models into a wind–PV–thermal multi-energy complementary system, achieving overall improvement in economic benefits and minimizing energy waste. Reference [18] proposes an incentive-based DR model that considers the coupling effect of consumer behaviors. Simulation results demonstrate that the proposed model effectively lowers overall expenses while enhancing the utilization rate of energy storage systems. Reference [19] comprehensively considers price-based DR and incentive-based DR and proposes a multisource peak-regulation transaction model. This study adopts an incentive-based DR approach, classifying loads as rigid, transferable, and interruptible. A certain capacity of energy storage is configured to achieve load transfer. We use Yalmip and Gurobi solvers to optimize battery power and load transfer power.
Though there are research works on energy storage capacity configuration and scheduling for microgrids, some research gaps still exist, including the following: (1) the impact of energy storage on the connection between the main grid and microgrid is not taken into account; (2) the effect of energy capacity configuration on the economic benefits of the microgrid is not fully considered based on long-term and short-term scales; and (3) DR is not considered together with energy storage configuration and scheduling for microgrids. In this paper, energy storage capacity is configured, and its charging and discharging power is scheduled considering the interaction between the microgrid and the main grid. In this configuration and scheduling process, DR is proposed together with energy storage to reduce the operation cost of the microgrid. This paper first presents the models of energy storage battery and DR in the microgrid. Then, the economic model of the microgrid and the constraints are presented. Considering the long-term and short-term economic benefits of the microgrid, a bi-level optimization algorithm is used to optimize the capacity of the energy storage battery, the real-time power of the battery, and the transfer and reduction in load. Finally, the proposed method is validated through simulation, and the conclusion is given.
2. Microgrid Model
As shown in Figure 1, a microgrid that includes fixed-capacity photovoltaics, wind turbines, and various types of loads is considered. The system is linked to the main power grid via a connection line, enabling both electricity purchase and sale transactions with the grid, while also retaining the capability to operate in island mode.
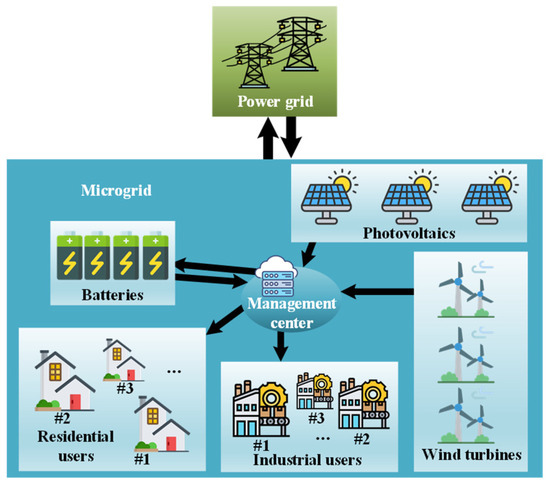
Figure 1.
The components of a microgrid.
2.1. Model of Wind Turbine
The output power of wind turbines depends on the wind speed, and its expression is as follows [20]:
where PWT denotes the output power of the WT; v, vin, vout, and vr are current wind speed, cut-in wind speed, cut-out wind speed, and rated wind speed, respectively; and Pr is the rated power of the WT. The corresponding power curve is illustrated in Figure 2.
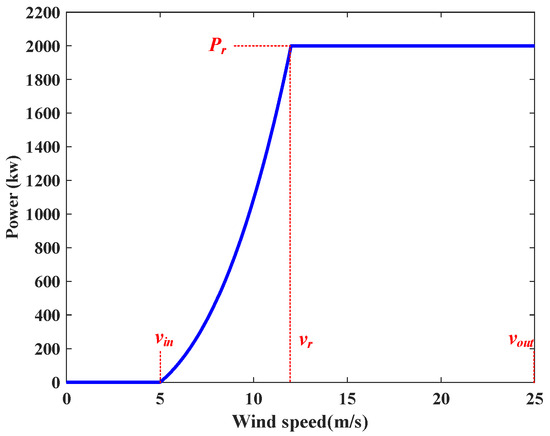
Figure 2.
The relationship between WT output power and wind speed.
2.2. Model of Photovoltaic
The output power of photovoltaics is mainly affected by environmental temperature and radiation intensity, and linear modeling of photovoltaic generators can be carried out [21]:
where PPV,STC is the maximum power point under standard test condition (STC), where the specific conditions of STC comprise a solar irradiance of 1000 W/m2, a panel temperature of 25 °C, and an atmospheric mass (air mass, AM) of 1.5. GT is the irradiation level. GT,STC is the irradiation level under STC. γ is the power-temperature coefficient. Tj is the temperature of photovoltaic modules. Tj,STC is the temperature of photovoltaic modules under STC. NPVs and NPVp are the number of photovoltaic modules connected in series and parallel. The expression for Tj is as follows:
where NOCT is Normal Operating Cell Temperature, Tamb is environmental air temperature, and GT,NOCT and Tamb,NOCT are the irradiation level and ambient air temperature under NOCT, both of which are constant.
2.3. Model of Energy Storage Battery
The energy storage system in this study adopts LiFePO4 batteries, which have stable chemical structures and a long cycle life. Its energy change can be expressed as [22]
where Ebat(t) is battery capacity at time t, Δt is the time period during which the energy of the battery changes, σ is the self-discharge rate, ηbat is battery operating efficiency and ηinv is converter and inverter efficiency, and Pch and Pdis are the battery charging power and discharging power, respectively.
The lifespan of a battery directly affects the cost of an energy storage system, which typically depends on its capacity decay. Battery degradation is a nonlinear process influenced by environmental temperature, depth of discharge (DOD), and operation time. The battery attenuation model used in this study is shown as [23]
where E′loss and Eloss are the battery capacity loss before and after a single cycle, Eini is the battery initial capacity, and fd is the capacity decay function, which is shown as
where fσ(σ), ft(t1), and fT(T) represent the effects of DOD, operation time, and temperature on battery attenuation, respectively; δ is the discharge depth of the battery; tb is the service time of the entire life cycle of the battery; Tamb is the ambient temperature; Tref is the ambient temperature reference; and k is a coefficient which is a constant.
2.4. Model of Demand Response
DR is a mechanism that encourages electricity users to adjust their usage patterns. It uses price signals or incentives when electricity costs rise or when grid reliability is at risk. The DR mechanism achieves the flexible adjustment of load resources through price-based responses and incentive-based responses. This study uses the incentive-based DR method to model the load, which is divided into three types: rigid, transferable, and interruptible.
Rigid load cannot be changed through simple control or adjustment. Its demand is constant and will not change due to external conditions or changes in the power supply. It is a relatively high-priority load that significantly impacts production and daily life and does not participate in DR. Transferable load refers to load that can be adjusted or transferred within a certain range. Usually, such loads can be shifted across different time periods according to grid operational needs, provided that the total electricity consumption remains constant over the entire scheduling cycle. Interruptible load refers to a load that can be interrupted or reduced in the situation of supply and demand tension or grid overload in the power system. For these loads, usually the customers have signed an agreement with the grid. The interruption of these loads will not have much impact on the customers. In addition, they will receive economic benefits for load interruptions, and the economic benefits will be paid by the operator, which also prevents the operator from interrupting these loads easily.
Transferable load, rigid load, and interruptible load satisfy the following equations:
where Ps(t) is the electricity load after DR; PR(t), Pin(t), Pout(t), and Pcut,max(t) are rigid load, load transferred to period t, load transferred out from the period t, and maximum reducible power of interruptible load, respectively; and αcut(t) is the reduction coefficient of the interruptible load. The compensation cost Ccom for users transferring and reducing load is shown as
where λs and λc are the unit compensation prices for transferable and interruptible loads.
2.5. Penalty Cost for Power Fluctuation of the Transmission Line
The uncertainty of photovoltaic and wind turbine output will exacerbate the fluctuation of power in microgrid systems, affecting power supply safety and equipment efficiency. Energy storage batteries in microgrids can not only improve system economy but also suppress power fluctuations in the system. Referring to reference [24], the penalty cost for power fluctuations in the interconnection line is introduced to measure the degree of power fluctuations over a day time scale. The expression for the total penalty cost is
where D is the total number of days of battery life, Pline,t is the transmission line power at time t, and Kline is the power fluctuation penalty factor.
2.6. Model of Line Loss
The impact of line loss is considered in this paper, and its calculation formula is as follows:
Subject to the following constraints:
where i and j are bus numbers, r is line resistance, I is line current, P is active power, Q is reactive power, U is node voltage, x is reactance, QL is reactive power of node load, PWT is wind turbine power, PPV is photovoltaic power, PBAT is battery power, and PL is node load active power. E is the set of all lines, B is the set of all buses, δ(j) is the set of buses that flow out of j, and π(j) is the set of buses that flow into j.
3. Microgrid Economic Model and Constraints
3.1. Objective Function
The optimization objective is to reduce the total cost CT of the microgrid, including energy storage construction cost CE, photovoltaic and wind turbine operation and maintenance costs CPV and CWT, penalty cost Cline for power fluctuation of transmission line, electricity purchase cost Cep, DR compensation cost Ccom, and electricity sales revenue Ces. In this paper, line loss in the microgrid is considered, and its corresponding cost is accounted for in the electricity purchase cost Cep. The optimization variables of the algorithm are battery capacity, battery power, transferable load after load transferring, and interruptible loads after load cutting. The objective function is shown as
where Ybat is the construction cost of a unit capacity battery, Ypv is the maintenance cost of a single photovoltaic cell per unit time, YWT is the maintenance cost of the wind turbine per unit time, tb is the service life of the battery, and λt is the time-of-use electricity price.
3.2. Constraints
(1) The system power balance constraint satisfies Equation (14):
where PL, Pes, and Pep are load power, power sold to the main grid, and power purchased from the main grid, respectively.
(2) The operation of the energy storage battery must comply with constraints related to its state of charge (SOC) as well as its charging and discharging power.
The maximum configurable capacity constraint for energy storage is as follows, subject to investment capital, site conditions, and other factors:
(3) The transmission line constrains the purchase and sale of power between the microgrid and the main grid:
(4) The reduction factor of the load satisfies
Under the combined effect of the above constraints, the power transferred by the load is limited accordingly.
4. Double-Layer Optimization Algorithm
This paper establishes a bi-level optimization framework in which the inner layer addresses short-term operational scheduling, aiming to minimize the daily operation costs of the microgrid. The optimization variables are the load transfer in and out and the charging and discharging power of the energy storage battery for each period. The DR mechanism is completed within the inner layer. The inner layer with operation optimization is solved using Yalmip and Gurobi solvers. The outer optimization objective of the double-layer optimization model is the daily average cost of the microgrid for the entire lifecycle of the energy storage battery, and the optimization variable is the energy storage capacity configured for the microgrid. The outer optimization model adopts the particle swarm optimization (PSO) algorithm. The optimization task of the outer layer is a nonlinear problem. The ability of the PSO algorithm to solve nonlinear problems has been widely verified, and it has a good global search capability [25]. Convex optimization algorithms such as linear programming and quadratic programming are suitable for solving the convex optimization problems, and they can find the global optimal solution. However, for nonconvex problems, these algorithms are not suitable. The configuration and scheduling model in this paper is with long-term and short-term scales, which is a complex and nonconvex problem, and the bi-layer optimization algorithm has proven effective in solving this problem with a good global search capability [26].
Figure 3 illustrates the workflow of the bi-level optimization model. The algorithm parameters are shown in Table 1.
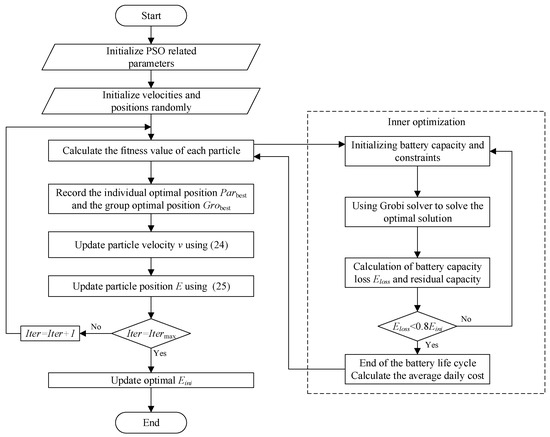
Figure 3.
The flow of the double-layer optimization model.

Table 1.
PSO parameters.
The specific process of the algorithm is as follows:
(1) Define algorithm parameters and the initial velocity and position of each particle.
(2) The fitness function of each particle is calculated by the inner optimization algorithm. In this study, the fitness function is the average daily cost of the microgrid.
(2.1) Determine the initial capacity Eini for the day.
(2.2) Solve intraday optimal scheduling policy, including DR scheduling and battery charge and discharge power using Gurobi solver.
(2.3) Use Equation (5) to calculate the battery loss and total loss for the day.
(2.4) If the total battery loss Eloss is greater than 20% [23,27], the battery life cycle ends, and the daily average cost of the cycle is calculated as the fitness function value and returned to the outer layer. Otherwise, go to step (3) and use the remaining battery capacity as the initial capacity for the next day.
(3) Record the optimal position of individual particles Parbest and the optimal position of the group Grobest.
(4) Update particle position E and velocity v using the following equation:
where c1 and c2 are self-learning and group-learning factors, respectively, and r1 and r2 are random numbers between [0, 1].
(5) If the maximum number of iterations has not been reached, proceed to step (2). Otherwise, output the final result.
Among the above steps, steps 2.1 to 2.4 belong to the inner layer optimization, while the rest are steps of the outer layer optimization. The inner layer optimization minimizes daily costs, while the outer layer optimization determines the battery capacity to minimize long-term costs.
5. Example Analysis
5.1. Case Study
The specific structure of the microgrid is shown in Figure 4. The microgrid adopts the IEEE 33 bus distribution system. In this case, the locations of PV and wind turbines are determined, and the capacities of the photovoltaic and wind turbine are 600 kw and 2000 kw, respectively. It is assumed that the interruptible loads exist at bus 26, the transferable loads exist at bus 11, and the location of energy storage is set at bus 15.
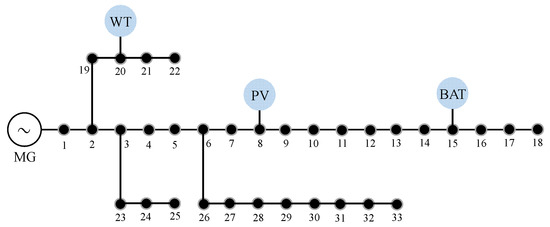
Figure 4.
The structure of the microgrid.
To verify the effectiveness of the proposed model and method, a typical day’s wind turbine output power, photovoltaic output power, and load data are selected for case analysis. Their data is presented in case 1 of Figure 5. The real-time electricity price and microgrid parameters are shown in Table 2 and Table 3.
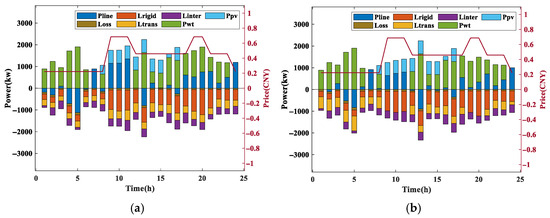
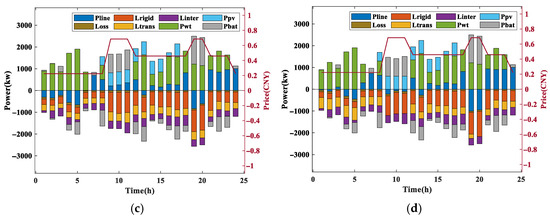
Figure 5.
The output power, load power, and real-time electricity prices of different cases. (a) Case 1: Excluding energy storage and demand response mechanisms. (b) Case 2: Excluding energy storage and including demand response mechanisms. (c) Case 3: Including energy storage and excluding demand response mechanisms. (d) Case 4: Including energy storage and demand response mechanisms.
Table 2.
Electricity prices in different periods.
Table 3.
Microgrid parameters.
Cases 1~4 represent four scenarios: original microgrid, microgrid considering DR, microgrid containing energy storage, and microgrid containing energy storage and considering DR mechanism. Figure 5 shows power output and load situation and real-time electricity prices, where Pline, Loss, Lrigid, Ltrans, Linter, Pwt, Ppv, and Pbat represent the line power, line loss, rigid load, transferable load, curtailable load, wind turbine output, PV output, and battery power, respectively. The red line in Figure 5 represents real-time electricity prices.
The loads in Figure 5a,c are loads without DR, so all loads are considered rigid loads. Figure 5b,d show the load situation when DR is considered. Comparing the situations with DR and those without DR, some of the transferable load in the high-price period is transferred to the low-price period. From Figure 5c,d, it can be seen that when there is an energy storage battery, it will discharge during periods of high electricity prices and sell electricity to the grid. When the electricity price is low, the battery is charged, and the power of the connecting line is kept relatively stable by adjusting the charging power.
Table 4 shows the microgrid’s total cost and its composition for different cases in a day. The daily maintenance costs of photovoltaics and wind turbines remain unchanged and are not shown in the table. It can be seen that when using the DR mechanism in case 2, although additional compensation costs are introduced, the cost of purchasing electricity and the penalty for power fluctuations in connecting lines are reduced through load transfer. Case 3 uses energy storage batteries to participate in regulation. Although it introduces battery construction costs, it can reduce the purchase of electricity and even sell electricity to the grid during periods of high electricity prices. When the DR mechanism and energy storage battery are used simultaneously, both the purchase cost of electricity and the penalty for power fluctuations in the interconnection line are reduced, which can improve the reliability of energy transmission.
Table 4.
Cost composition of different cases.
To verify the stability of the PSO algorithm for multiple simulations, five simulations of the PSO algorithm are performed under the same conditions. The results of the five simulations are shown in Figure 6. The value of the objective function is between CNY 4334.0 and CNY 4344.0. It can be seen that the results obtained by running the PSO algorithm multiple times are very similar, which reflects the stability of the algorithm.
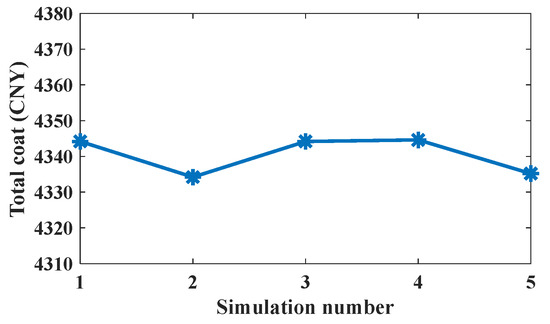
Figure 6.
Results of multiple simulations of PSO algorithm.
To show the effectiveness of the PSO algorithm, a genetic algorithm (GA) is adopted for comparison. Using GA instead of the PSO algorithm in this paper yields an energy storage capacity of 2045.3 kWh and a microgrid cost of CNY 4423.4. The total cost is slightly higher than the PSO method, which proves the effectiveness of the PSO algorithm.
5.2. The Impact of Battery Price on Energy Storage Configuration and Cost
With the advancement of technology, expansion of production scale, changes in raw material prices, and rapid development of electric vehicles, the cost of energy storage batteries is showing a downward trend year by year. According to the International Energy Agency (IEA), the price of lithium batteries has dropped by over 80% since 2010, and it is expected to continue decreasing in the coming years. In order to explore the impact of battery prices on energy storage capacity configuration and cost, the optimal energy storage capacity configuration and cost for microgrid are calculated when battery prices continue to decline. As shown in Figure 7, it can be seen that with the decrease in battery price, the optimal energy storage capacity configured for the microgrid becomes larger, and the average daily cost of the microgrid becomes smaller.
Figure 7.
Battery capacity and daily average cost of microgrid at different battery prices.
The load and renewable energy output of the typical day is selected to test the effect of different battery prices. Figure 8 shows the output power and load power at 1000 CNY/kWh and 500 CNY/kWh for the battery price. When the battery price is 1000 CNY/kWh, the cost of the microgrid on this day is CNY 4280.1. When the battery price is 500 CNY/kWh, the cost is CNY 3368.3. The capacity of energy storage when the battery price is 500 CNY/kWh is greater than that when the price is 1000 CNY/kWh, as shown in Figure 7. It can be seen from Figure 8 that after configuring larger-capacity energy storage, the energy storage battery will output greater power during high-electricity-price periods. With the decrease in energy storage prices, both energy storage costs and microgrid operating costs are reduced.
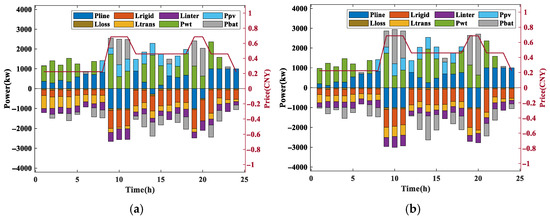
Figure 8.
The output power and load power with different battery prices: (a) 1000 CNY/kWh; (b) 500 CNY/kWh.
5.3. The Impact of Compensation Electricity Prices on Energy Storage Configuration and Cost
Electricity prices and compensation prices can affect users’ behaviors and microgrid costs. This section analyzes the impact of different compensation prices on microgrid. Select the load data for a typical day, as shown in Figure 9a. When the compensation price for interruptible load is reduced from 1 CNY/kWh to 0.5 CNY/kWh, the energy storage capacity is configured to be 1623.5 kWh, and the load is scheduled as shown in Figure 9b. When the compensation price of interruptible load is reduced to 0.5 CNY/kWh, it is lower than the peak price of electricity, and reducing the load helps to reduce the total cost. Therefore, as observed in Figure 9b, some of the interruptible loads are curtailed during the peak price of electricity, in comparison with Figure 9a, and all the transferable loads are transferred. Interruptible loads are not fully curtailed due to transmission line power constraints.
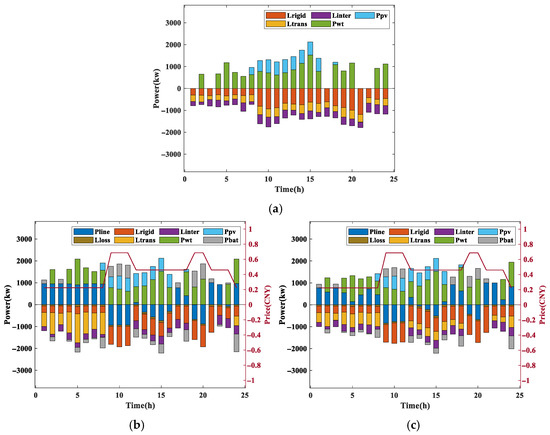
Figure 9.
The impact of different compensation prices on microgrid: (a) initial load; (b) interruptible load compensation price is 0.5 CNY/kWh; (c) transferable load compensation price is 0.3 CNY/kWh.
Based on an interruptible load compensation price of 0.5 CNY/kWh, when the transferable load compensation is raised from 0.2 CNY/kWh to 0.3 CNY/kWh, the optimization algorithm yields an energy storage capacity of 1185.3 kWh. The corresponding load transfer profile is presented in Figure 9c. In this case, the difference between the flat price and the valley price is 0.236 CNY/kWh, which is lower than the compensation price of 0.3 CNY/kWh, and the transfer of loads may increase the total cost of the microgrid. Therefore, the amount of transferable load that is transferred becomes less in comparison with the previous case.
5.4. The Impact of Photovoltaic Capacity on Energy Storage Configuration and Cost
In order to analyze the impact of different capacities of renewable energy connected to the microgrid on the cost of the microgrid, as well as to verify the effectiveness of the method proposed in this paper in different microgrids, the microgrid is optimized using the method of this paper at different PV capacities, and the results obtained are shown in Figure 10. It can be seen that as the PV capacity increases, the configured optimal energy storage capacity also increases. This increases the storage construction cost, but the total cost of the microgrid keeps decreasing due to the increase in power generation. The increase in battery capacity allows it to produce more power that can be released at high electricity prices. Figure 10 also shows that the cost of this paper’s method is significantly lower than that without energy storage and DR for different PV capacities, which proves the applicability of the proposed method to different microgrids.
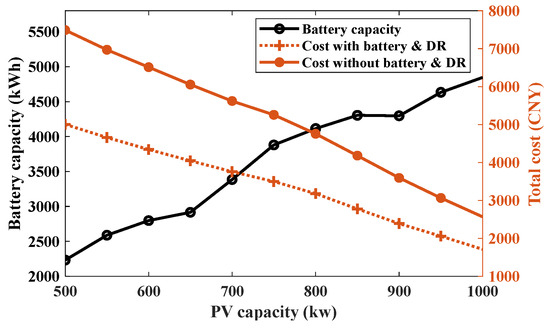
Figure 10.
Energy storage capacity and cost for microgrids with different PV capacities.
6. Conclusions
This paper proposes a method for configuring energy storage capacity in microgrids with the consideration of DR. The proposed method considers the impact of output fluctuations of renewable energy, transmission line power fluctuations, and battery capacity degradation on microgrid costs. The double-layer optimization algorithm used in this study simultaneously optimizes the short-term load scheduling and battery charging and discharging power, as well as the long-term battery capacity configuration. The case study shows that both the DR mechanism and the energy storage configuration help to reduce the operation cost of the microgrid. Simultaneous configuration of energy storage and DR mechanisms can reduce the operation cost by 35.3%. When the cost of the energy storage battery is reduced, the operation cost of the microgrid can be further reduced by configuring the battery with a larger capacity. For the DR mechanism, different electricity prices and DR compensation prices have different impacts on load shifting, which suggests that policymakers need to design appropriate pricing strategies according to different needs.
This study is based on an idealized generation and load model, and in future work, real data of different components of a microgrid can be considered to validate the proposed method. In addition, with the rapid development of electric vehicles, system flexibility can be further enhanced by considering vehicle–grid interaction technology.
Author Contributions
Conceptualization, T.P. and X.J.; Software, T.P.; Methodology, C.L.; Writing—original draft, T.P.; Formal analysis, C.L.; Supervision, C.L.; Writing-review & editing, X.J.; Investigation, Z.M. and X.C.; Validation, Z.M. and X.C.; Data curation, Z.M.; Resources, X.C.; Project administration, X.C. All authors have read and agreed to the published version of the manuscript.
Funding
This research was funded by the Science and Technology Project of China Southern Power Grid Company, grant number 036000KK52222004(GDKJXM20222117).
Data Availability Statement
The original contributions presented in this study are included in the article. Further inquiries can be directed to the corresponding author.
Conflicts of Interest
Authors Tingzhe Pan, Xin Jin were employed by the China Southern Power Grid Company Limited. Authors Chao Li, Zijie Meng and Xinlei Cai were employed by the Guangdong Power Grid Limited. The remaining authors declare that the research was conducted in the absence of any commercial or financial relationships that could be construed as a potential conflict of interest.
References
- Zheng, W.; Lu, H.; Zhang, M.; Wu, Q.; Hou, Y.; Zhu, J. Distributed Energy Management of Multi-Entity Integrated Electricity and Heat Systems: A Review of Architectures, Optimization Algorithms, and Prospects. IEEE Trans. Smart Grid 2024, 15, 1544–1561. [Google Scholar] [CrossRef]
- International Energy Agency. Unlocking the Potential of Distributed Energy Resources. 2022. Available online: https://www.iea.org/reports/unlocking-the-potential-of-distributed-energy-resources (accessed on 17 September 2025).
- Du, Y.; Mendes, N.; Rasouli, S.; Mohammadi, J.; Moura, P. Federated learning assisted distributed energy optimization. IET Renew. Power Gener. 2024, 18, 2524–2538. [Google Scholar] [CrossRef]
- Wang, C.; Yang, X.; Wu, Z.; Che, Y.; Guo, L.; Zhang, S.; Liu, Y. A highly integrated and reconfigurable microgrid testbed with hybrid distributed energy source. IEEE Trans. Smart Grid 2014, 7, 451–459. [Google Scholar] [CrossRef]
- Rouholamini, M.; Wang, C.; Nehrir, H.; Hu, X.; Hu, Z.; Aki, H.; Zhao, B.; Miao, Z.; Strunz, K. A review of modeling, management, and applications of grid-connected li-ion battery storage systems. IEEE Trans. Smart Grid 2022, 13, 4505–4524. [Google Scholar] [CrossRef]
- Morstyn, T.; Hredzak, B.; Agelidis, V.G. Control strategies for microgrids with distributed energy storage systems: An overview. IEEE Trans. Smart Grid 2018, 9, 3652–3666. [Google Scholar] [CrossRef]
- US Department of Energy. Energy Storage Grand Challenge Roadmap. 2020. Available online: https://www.energy.gov/energy-storage-grand-challenge/articles/energy-storage-grand-challenge-roadmap?nrg_redirect=365461 (accessed on 17 September 2025).
- Abdelghany, M.B.; Al-Durra, A.; Gao, F. A coordinated optimal operation of a grid-connected wind-solar microgrid incorporating hybrid energy storage management systems. IEEE Trans. Sustain. Energy 2024, 15, 39–51. [Google Scholar] [CrossRef]
- Wu, T.; Shi, X.; Liao, L.; Zhou, C.; Zhou, H.; Su, Y. A capacity configuration control strategy to alleviate power fluctuation of hybrid energy storage system based on improved particle swarm optimization. Energies 2019, 12, 642. [Google Scholar] [CrossRef]
- Zhu, N.; Ma, X.; Guo, Z.; Shen, C.; Liu, J. Research on the optimal capacity configuration of green storage microgrid based on the improved sparrow search algorithm. Front. Energy Res. 2024, 12, 1383332. [Google Scholar] [CrossRef]
- Zhao, D.; Xia, X.; Tao, R. Optimal configuration of electric-gas-thermal multi-energy storage system for regional integrated energy system. Energies 2019, 12, 2586. [Google Scholar] [CrossRef]
- Yao, Q.; Yuan, X.; Huang, B.L. Optimal configuration of independent microgrid based on Monte Carlo processing of source and load uncertainty. Energy Storage Sci. Technol. 2020, 9, 186–194. [Google Scholar]
- Luo, X.; He, Y.; Zhang, J.; Li, J. Optimal Allocation of Hybrid Energy Storage Capacity Based on ISSA-Optimized VMD Parameters. Electronics 2024, 13, 2597. [Google Scholar] [CrossRef]
- Tian, Y.; Li, X.; Zhu, Y.; Xia, R. Optimal capacity allocation of multiple energy storage considering microgrid cost. J. Phys. Conf. Ser. 2018, 1074, 012126. [Google Scholar]
- Monfared, H.J.; Ghasemi, A.; Loni, A.; Marzband, M. A hybrid price-based demand response program for the residential micro-grid. Energy 2019, 185, 274–285. [Google Scholar] [CrossRef]
- Duc, T.T.; Tuan, A.N.; Duc, T.N.; Takano, H. Energy management of hybrid AC/DC microgrid considering incentive-based demand response program. IET Gener. Transm. Distrib. 2024, 18, 3289–3302. [Google Scholar] [CrossRef]
- Zhu, X.; Sun, Y.; Yang, J.; Dou, Z.; Li, G.; Xu, C.; Wen, Y. Day-ahead energy pricing and management method for regional integrated energy systems considering multi-energy demand responses. Energy 2022, 251, 123914. [Google Scholar] [CrossRef]
- Zheng, S.; Sun, Y.; Li, B.; Qi, B.; Shi, K.; Li, Y.; Tu, X. Incentive-based integrated demand response for multiple energy carriers considering behavioral coupling effect of consumers. IEEE Trans. Smart Grid 2020, 11, 3231–3245. [Google Scholar] [CrossRef]
- Ju, L.; Zhou, Q.; Lu, X.; Yang, S.; Fan, W.; Li, J. A multi-objective peak regulation transaction optimization and benefits coordination model for multi-sources coupling system considering flexible load response. Energy Rep. 2022, 8, 13083–13100. [Google Scholar] [CrossRef]
- Fan, H.; Yuan, Q.; Cheng, H. Multi-Objective Stochastic Optimal Operation of a Grid-Connected Microgrid Considering an Energy Storage System. Appl. Sci. 2018, 8, 2560. [Google Scholar] [CrossRef]
- Tabar, V.S.; Jirdehi, M.A.; Hemmati, R. Energy management in microgrid based on the multi objective stochastic programming incorporating portable renewable energy resource as demand response option. Energy 2017, 118, 827–839. [Google Scholar] [CrossRef]
- Lin, L.; Ou, K.; Lin, Q.; Xing, J.; Wang, Y.-X. Two-stage multi-strategy decision-making framework for capacity configuration optimization of grid-connected PV/battery/hydrogen integrated energy system. J. Energy Storage 2024, 97, 112862. [Google Scholar] [CrossRef]
- Zhang, J.; Hou, L.; Zhang, B.; Yang, X.; Diao, X.; Jiang, L.; Qu, F. Optimal operation of energy storage system in photovoltaic-storage charging station based on intelligent reinforcement learning. Energy Build. 2023, 299, 113570. [Google Scholar] [CrossRef]
- Xie, P.; Cai, Z.; Liu, P.; Li, X.; Zhang, Y.; Xu, D. Microgrid system energy storage capacity optimization considering multiple time scale uncertainty coupling. IEEE Trans. Smart Grid 2018, 10, 5234–5245. [Google Scholar] [CrossRef]
- Xiao, Y.; Zhang, L. Smart grid energy storage capacity planning and scheduling optimization through PSO-GRU and multihead-attention. Front. Energy Res. 2023, 11, 1254371. [Google Scholar] [CrossRef]
- Du, Y.; Jiang, L.; Li, Y.; Wu, Q. A robust optimization approach for demand side scheduling considering uncertainty of manually operated appliances. IEEE Trans. Smart Grid 2018, 9, 743–755. [Google Scholar] [CrossRef]
- Ministry of Industry and Information Technology. Lithiumion Battery Industry Standardization Conditions. 2020. Available online: https://www.miit.gov.cn/jgsj/dzs/wjfb/art/2020/art_b6e8117aaf6b40cfafa945d42d3b3ac3.html (accessed on 17 September 2025).


Disclaimer/Publisher’s Note: The statements, opinions and data contained in all publications are solely those of the individual author(s) and contributor(s) and not of MDPI and/or the editor(s). MDPI and/or the editor(s) disclaim responsibility for any injury to people or property resulting from any ideas, methods, instructions or products referred to in the content. |
© 2025 by the authors. Licensee MDPI, Basel, Switzerland. This article is an open access article distributed under the terms and conditions of the Creative Commons Attribution (CC BY) license (https://creativecommons.org/licenses/by/4.0/).