Abstract
This study addresses the urgent demand for low-GWP refrigerant alternatives in rail vehicle air-conditioning systems by proposing a novel binary mixture, ZT01 (R13I1/R32 = 0.6/0.4 by mass), as a replacement for R407C. A comprehensive evaluation combining thermodynamic cycle modeling, refrigerant property analysis, and experimental validation shows that ZT01 delivers a coefficient of performance (COP) comparable to R407C, while providing a 45–49% improvement in volumetric cooling capacity, enabling smaller compressor displacement for the same cooling output, and reducing specific compressor work by 13–21%. In addition, ZT01 maintains a lower compression ratio, exhibits non-flammability, is compatible with POE lubricant, and has a GWP of only 308. Life Cycle Climate Performance (LCCP) analysis further indicates a 6.88% reduction in total carbon emissions and a 77.4% reduction in direct emissions compared to R407C, demonstrating that ZT01 is both technically feasible and environmentally sustainable for green retrofitting of rail vehicle HVAC systems.
1. Introduction
Climate impacts associated with global warming have led to increasing global concern over carbon emissions. On 15 October 2016, the Kigali Amendment to the Montreal Protocol was adopted in Kigali, Rwanda, extending the regulatory scope of the Montreal Protocol on Substances that Deplete the Ozone Layer to include hydrofluorocarbon (HFC) refrigerants [1]. This amendment entered into force in China on 15 September 2021. As a developing country, China is obligated to phase down the consumption of all HFC refrigerants by 2030 [2,3]. Currently, the majority of air-conditioning units in rail vehicles in China utilize R407C as the refrigerant. With a 100-year global warming potential (GWP100) of 1620, R407C presents a substantial risk of atmospheric warming if released through leakage or inadequate disposal after equipment decommissioning, and is listed among the six primary greenhouse gases restricted by the Kyoto Protocol [4].
China’s high-speed rail technology is world-leading; however, rail vehicle air-conditioning technology still lags significantly behind that of developed countries. The European Union mandates that refrigerants used in rail vehicle air-conditioning systems must have a GWP100 not exceeding 750 [5], yet China currently utilizes R22, R407C, and R134a—all of which far exceed this threshold. Statistics indicate that [6], by the end of 2024, China operated 81,000 passenger rail vehicles, including 38,448 electric multiple units, marking a 3.7% increase compared to 2023. Taking the KLR30YTH rail vehicle air-conditioning unit as an example, each unit is charged with 8 kg of R407C, corresponding to a total national charge of approximately 6.48 × 10⁵ kg in 2024. By reducing the refrigerant’s GWP100 from 1620 to 750, the resulting decrease in carbon-dioxide equivalent (CO2e) emissions would amount to 5.64 × 10⁵ tons.
Compared with residential and automotive air-conditioning systems, rail vehicle air-conditioning units require a substantially larger refrigerant charge, operate at higher speeds in more demanding thermal environments, and must function within confined car-body spaces with high passenger densities [7]. These factors impose stringent safety requirements on rail vehicle air-conditioning refrigerants, particularly concerning flammability and toxicity. Single-component refrigerants rarely provide both excellent thermodynamic performance and environmental safety along with favorable transport properties, whereas refrigerant mixtures can capitalize on the complementary advantages of their individual constituents. Moreover, the temperature glide inherent in refrigerant mixtures enables the cycle to more closely approximate the Lorenz cycle, thereby reducing irreversible losses associated with heat-transfer temperature differences and improving overall system performance.
With increasing emphasis on refrigerant environmental performance, global research investment in refrigerant mixtures has intensified. The constituent components of these mixtures have evolved from traditional refrigerants such as R22 and R152a to include compounds beyond conventional refrigerants, encompassing substances originally developed for other applications. Trifluoroiodomethane (R13I1), initially used as a fire suppressant and stabilizer, was considered in the 1990s as a principal constituent for next-generation, long-lasting, environmentally friendly refrigerant blends and was listed by the United Nations Environment Programme as a promising alternative refrigerant [8]. Although R13I1 has clear potential as a refrigerant, early limitations in synthesis technology, such as production challenges and high costs, prevented its widespread adoption. However, with continuous improvements in preparation techniques in recent years [9,10,11], R13I1 has once again attracted attention owing to its outstanding environmental performance. Duan [12,13] measured the saturated vapor-pressure data, saturated liquid and vapor densities, gas-phase p-v-T data, and critical parameters of CF3I with high accuracy, and developed comprehensive correlation equations that show excellent agreement with REFPROP 10.0 data. Based on these correlations, Wang [14] conducted theoretical cycle simulations of CF3I and its mixtures with R290 under nominal refrigerator conditions, demonstrating that R13I1/R290 mixtures with CF3I molar fractions between 50% and 65% can be directly charged into refrigerators as R12 replacement refrigerants. Chabot et al. [15] compared the COP and stability of 167 candidate fluids in heat-pump systems, identifying R161, R40, CF3I, R435a, and R510a as the most promising refrigerants. Sun et al. [16] experimentally determined the flammability limits of multiple mixtures containing CF3I or CF4, and found that the fully halogenated hydrocarbons CF3I and CF4 suppress the flammability of combustible refrigerants more effectively than inert gases such as N2 and CO2 or hydrogenated halocarbons like R134, R134a, and R125, while also raising the lower flammability limits of these mixtures. Wu [17] blended R13I1 as a flame-retardant additive with the flammable refrigerants R1243zf and RE170 to investigate the lower flammability limits and critical extinguishing concentrations of the mixtures at various compositions. Ye [18] utilized R13I1 as the base component to develop a MATLAB-based (R2017a) cycle model, conducted both simulations and experimental tests to evaluate system performance when directly charging the new refrigerant in place of R134a, and found that the R290/R13I1 (0.6/0.4) mixture demonstrates significant potential as an alternative to R134a in automotive air-conditioning systems. Zhang et al. [19] proposed a novel refrigerant blend, R13I1/R152a (0.35/0.65), for replacing R134a in automotive air-conditioning. A thermodynamic property model for R13I1/R152a was established, and the results indicate that the application of R13I1/R152a in automotive air-conditioning systems is technically feasible. Recent developments have improved the practicality of R13I1 (CF3I) for engineering deployment. Commercial suppliers now provide industrial-grade CF3I in cylinder packages with ton-scale availability, and public B2B quotes indicate bulk prices in the USD 300–1000/kg range depending on purity (99–99.999%) and order size, whereas small reagent bottles remain much more expensive. In parallel, patents and recent studies have reported gas-phase/one-step catalytic routes that support scale-up and cost reduction compared with early laboratory syntheses [20]. While pricing is volatile and specification-dependent, these supply-chain signals suggest that CF3I is increasingly obtainable for large-scale blending and testing.
To investigate the feasibility of replacing the existing refrigerant R407C with an R13I1-based refrigerant mixture in rail vehicle air-conditioning systems, a theoretical cycle model for rail vehicle air-conditioning was developed and its accuracy validated experimentally. Following a comparative analysis of refrigerant properties, the constituent components and their proportions for the refrigerant mixture were selected. Finally, the performance of the mixture and R407C under varying operating conditions was evaluated using the theoretical cycle model, and an LCCP assessment was conducted, thereby providing both theoretical and experimental foundations for refrigerant selection and substitution in rail vehicle air-conditioning systems.
2. Theoretical Cycle Model of Rail Vehicle Air-Conditioning and Experimental Validation
2.1. Establishment of a Theoretical Calculation Model
Rail vehicle air-conditioning systems typically utilize a single-stage vapor-compression refrigeration cycle, which consists of four primary components: compressor, condenser, expansion valve, and evaporator. The refrigerant enters the evaporator at an evaporation pressure p0 and temperature t0, where it evaporates and absorbs heat. The compressor then continuously draws the vapor from the evaporator and compresses it to the condensing pressure pk, after which it is delivered to the condenser. In the condenser, the refrigerant is cooled and condensed at constant pressure pk into a liquid. The condensed liquid then passes through the expansion valve, where its pressure is reduced from pk to p0, yielding a two-phase mixture at temperature t0 and pressure p0. This mixture exits the expansion valve and reenters the evaporator to initiate the next cycle.
Before establishing the theoretical cycle model for rail vehicle air-conditioning, the following assumptions are made for the cycle model [21]:
- The refrigerant incurs no pressure drop when flowing through heat exchangers or connecting pipes;
- Except within the condenser and evaporator, the refrigerant undergoes no heat exchange with the surroundings during cycle circulation;
- The refrigerant experiences adiabatic, isenthalpic throttling at the expansion valve;
- The compression process in the compressor is a non-isentropic adiabatic compression, with an isentropic efficiency of 0.65;
- The refrigerant is assumed to have 5 °C of superheat at the compressor inlet and 5 °C of subcooling at the condenser outlet.
In this preliminary evaluation, pressure drops in heat exchangers and pipes were assumed negligible, and the compressor isentropic efficiency was fixed at 0.65. These simplifications are commonly adopted in refrigerant screening studies [1], as they allow the focus to remain on the relative comparison between candidate refrigerants. While such assumptions may affect absolute values of COP and capacity, they do not materially change the comparative trends, which are the main objective of this study.
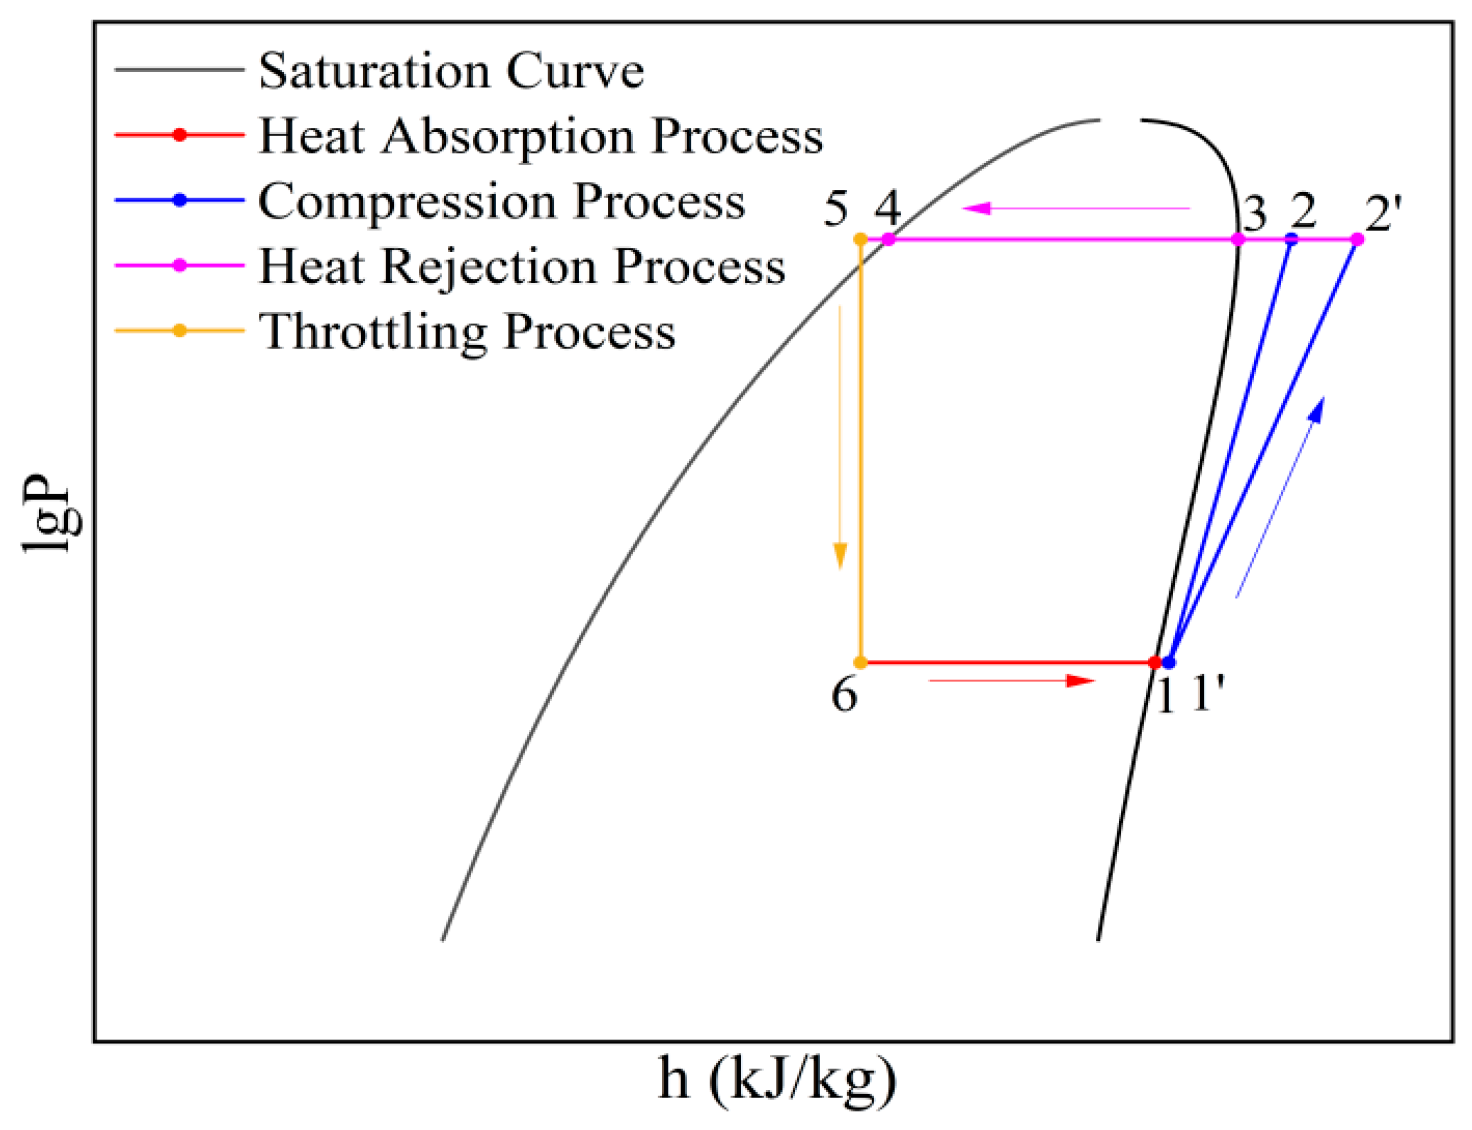
Based on the assumptions made above, the cycle of the rail vehicle air-conditioning system is represented on the log p-h diagram as shown in Figure 1. In this diagram, process 6–1 represents the two-phase refrigerant absorbing heat at constant pressure in the evaporator and turning into saturated vapor. Process 1–1 indicates the refrigerant vapor absorbs heat and becomes superheated. Process 1–2 represents the actual compression process where the refrigerant gas undergoes compression in the compressor, resulting in both pressure and temperature increase. Process 1–2 represents the ideal isentropic compression. Process 2–3 shows the superheated refrigerant gas releasing heat in the condenser to become a saturated gas. Process 3–4 represents the saturated refrigerant gas in the condenser releasing heat at constant pressure and turning into a saturated liquid. Process 4–5 involves the saturated refrigerant liquid being subcooled. Finally, process 5–6 shows the subcooled refrigerant liquid passing through the expansion valve, undergoing throttling to reduce both temperature and pressure, turning into a low-pressure gas-liquid mixture entering the evaporator.
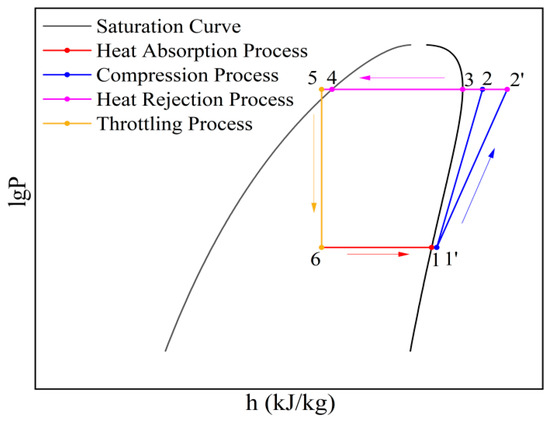
Figure 1.
Log p-h diagram of the rail vehicle air-conditioning system cycle.
The detailed calculation procedures are as follows: Condenser pressure pk:
where pk is the refrigerant’s saturation pressure at the condensing temperature. Evaporating pressure p0:
where p0 is the refrigerant’s saturation pressure at the evaporating temperature. Pressure ratio:
Specific cooling capacity q0:
where h6 and h1′ are the refrigerant enthalpies at the evaporator outlet and inlet. Volumetric refrigeration capacity qv:
where v1′ is the refrigerant specific volume at the compressor inlet. Specific power consumption of compressor w:
where h1′ and h2 are the refrigerant enthalpies at the compressor outlet and inlet under ideal compression; ηk is the compressor isentropic efficiency. Refrigerant mass flow rate qm:
where Q0 is the cooling capacity. Coefficient of performance (COP):
2.2. Experimental Validation
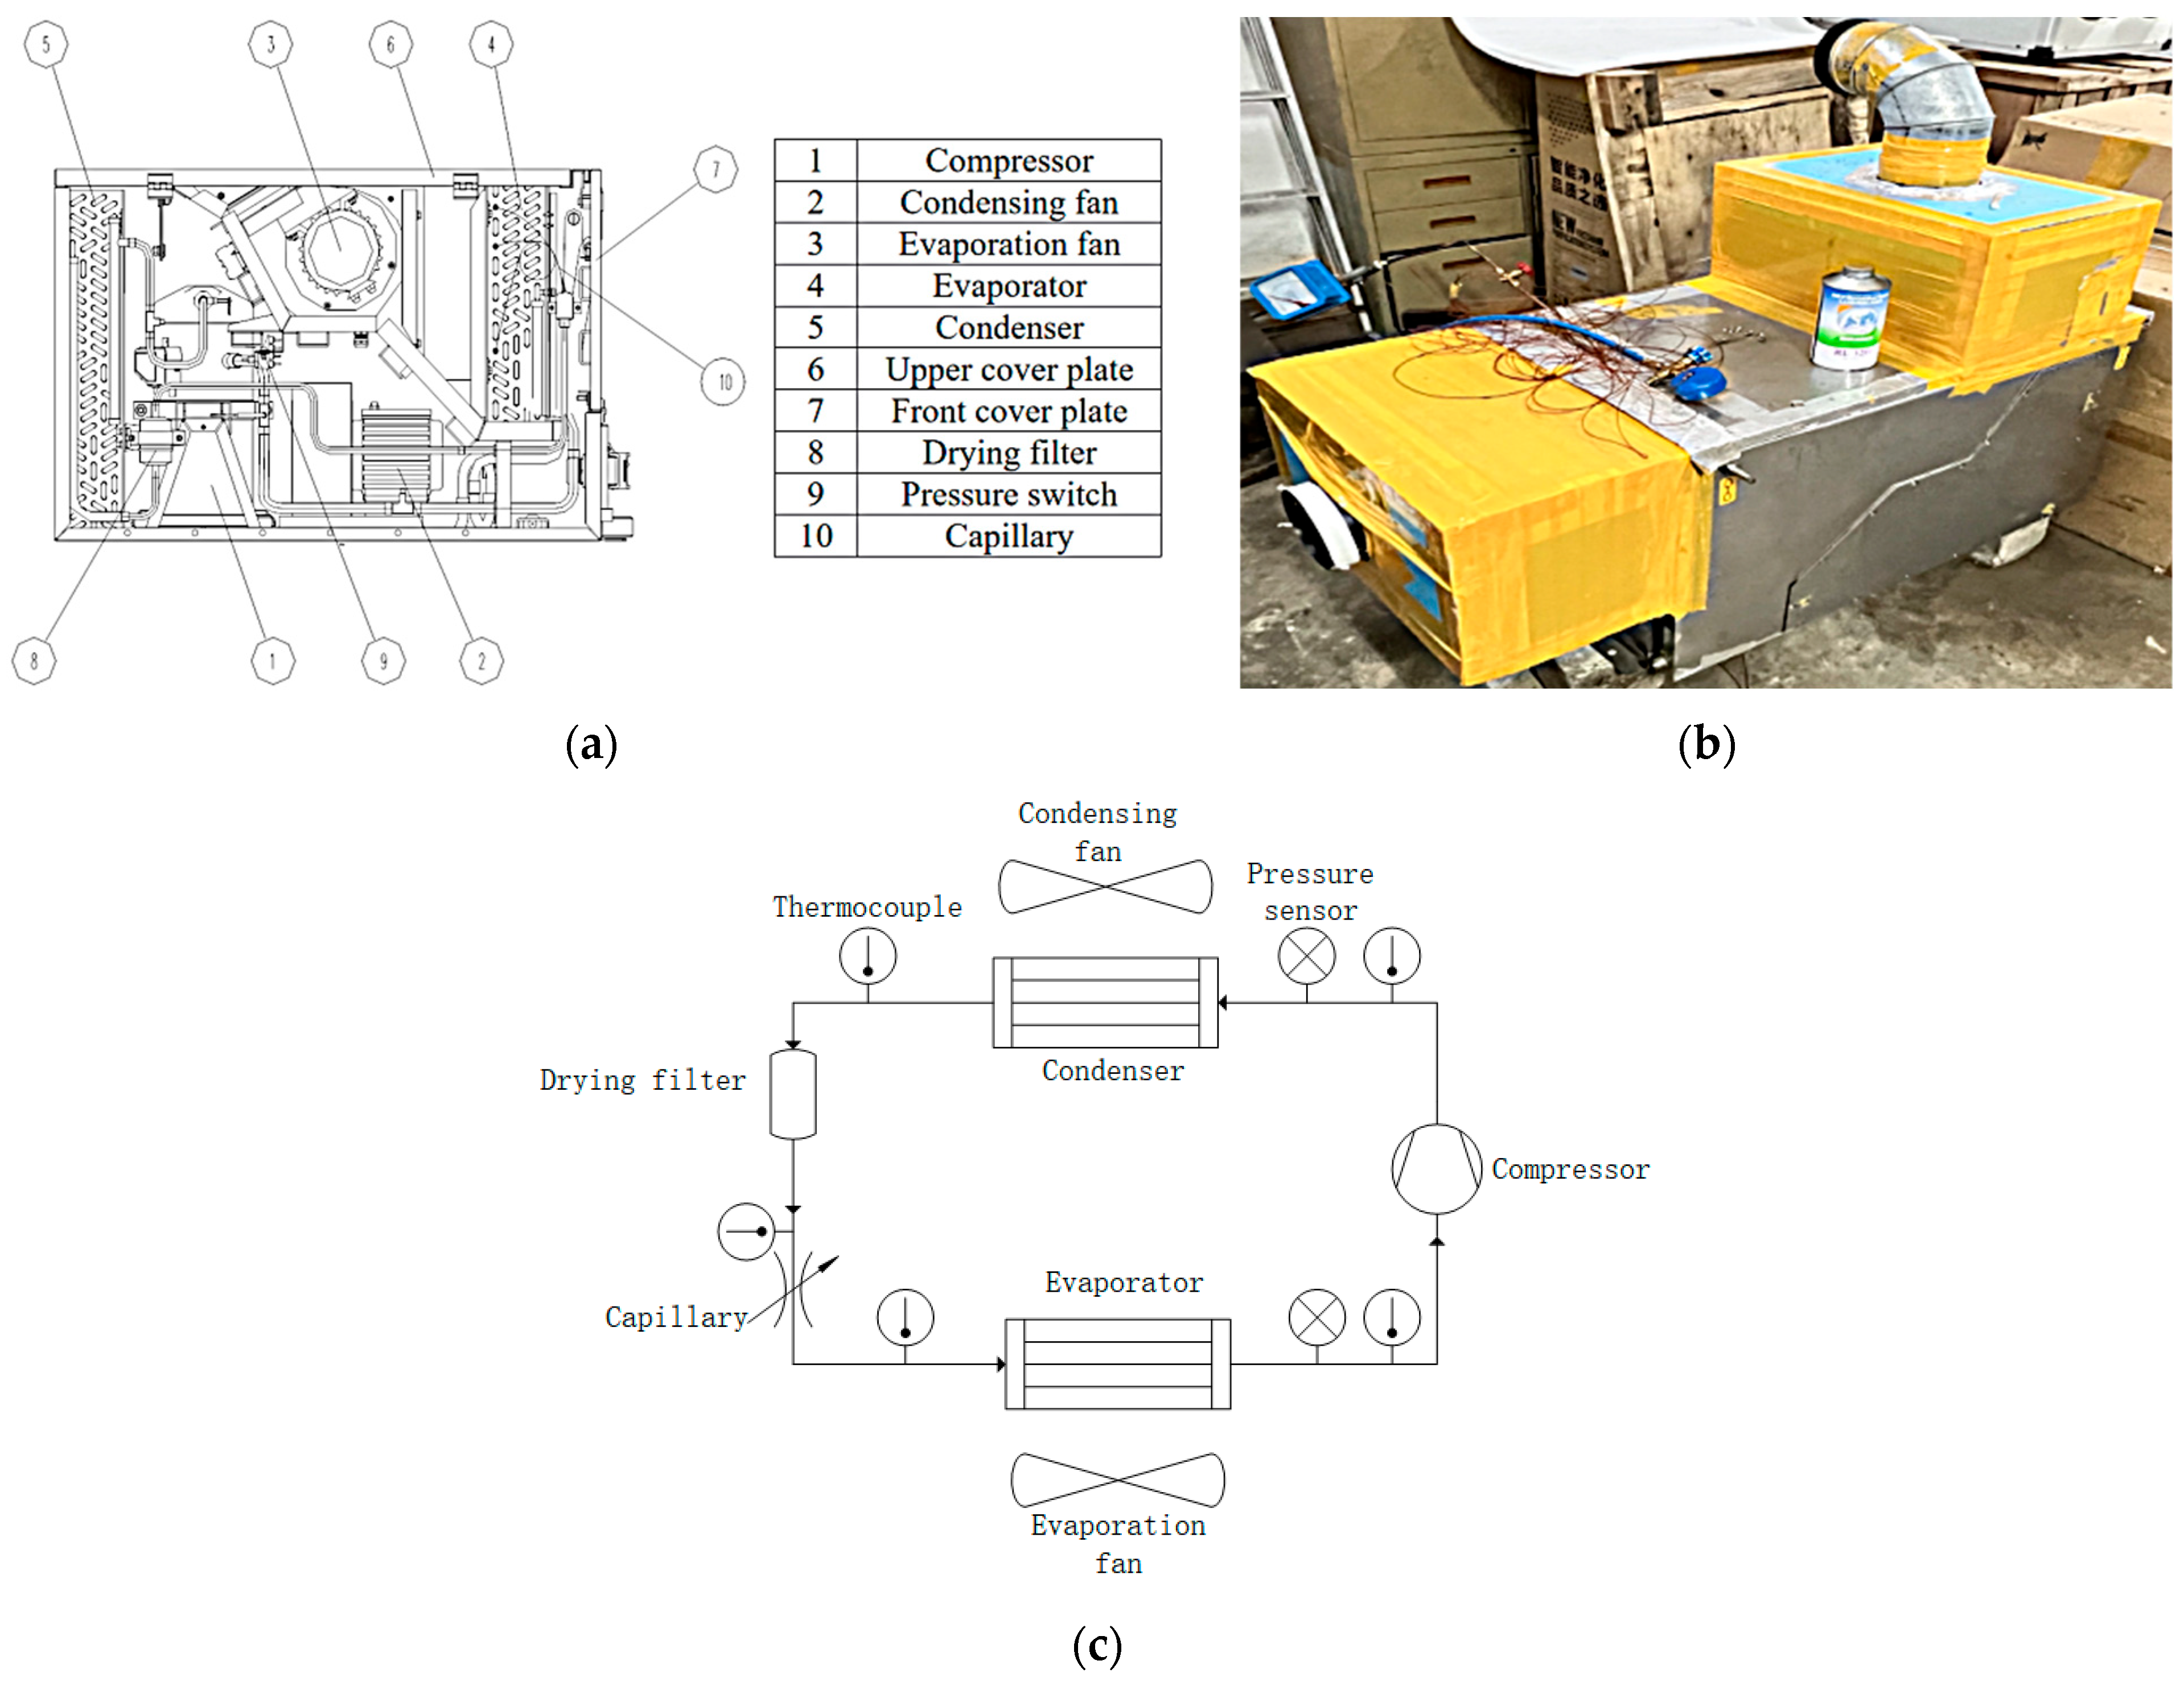
The experimental tests were conducted only with R407C to validate the cycle model under baseline conditions. Since ZT01 samples had not yet been prepared at the time of testing, experimental charging and operation with ZT01 were not possible. The validated model was therefore applied to ZT01 to ensure the reliability of the simulation results. In this section, a TTK7G-6.0GD air-conditioning unit was selected to perform R407C cycle performance tests under typical operating conditions in order to validate the accuracy of the theoretical cycle model. Similar experimental setups have been reported in the literature [1].
As shown in Figure 2, the unit is internally divided into two chambers: an evaporator chamber and a condenser chamber. The condenser chamber contains the compressor, pressure switch, liquid-line dryer, condenser, and condenser fan. The evaporator chamber contains the evaporator fan, evaporator coil, and capillary tube. The unit is equipped with a scroll compressor with a displacement of 39.2 cm3/rev, operating at a rotational speed of 2900 rev/min.
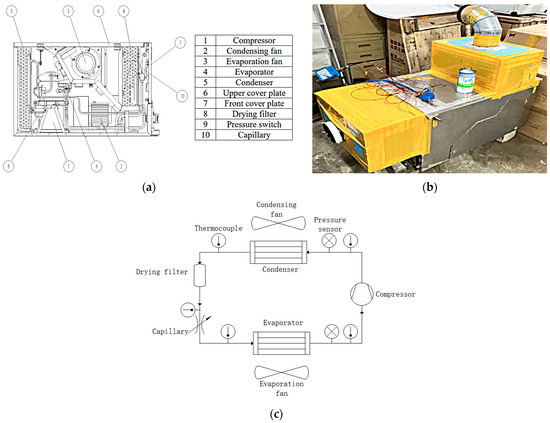
Figure 2.
TTK7G-6.0GD air-conditioning unit. (a) Structure, (b) photograph of the unit, (c) schematic of the test loop.
Under the combined action of the air-handling unit and the air-conditioning unit, the air conditions in the evaporator and condenser chambers are maintained at the specified test points. Using an air-sampling apparatus, the dry-bulb and wet-bulb temperatures of the unit’s inlet air (t1, t2) and outlet air (t3, t4) were measured, and the circulating airflow rate Q was determined with a turbine flowmeter. The enthalpy value h1 of the inlet-air can be obtained from t1 and t2, and the enthalpy value h2 of the return-air can be obtained from t3 and t4. The cooling capacity was then calculated by multiplying the circulating airflow rate Q by the enthalpy difference (h1 − h2) between the unit’s return and supply air. Performance tests with R407C charging were carried out under the three test conditions specified in the national standard TB/T 1804-2009 “Rail-Car Air-Conditioning Units” [22]. The detailed test-point parameters are given in Table 1, and the measurement instrument specifications are listed in Table 2.

Table 1.
Test conditions for the rail vehicle air-conditioning unit.

Table 2.
Measurement instrument specifications.
According to error propagation theory, the combined uncertainty of measurement variables is evaluated using the root-sum-of-squares method. Thus, the uncertainty associated with each measurement variable can be expressed as follows [23]:
The experimental results for R407C and the corresponding theoretical model calculations are summarized in Table 3. Table 4 summarizes the measurement uncertainties of discharge temperature, cooling capacity, compressor power, and COP, together with the relative errors obtained under the rated operating condition.

Table 3.
Comparison of experimental results and theoretical calculations.

Table 4.
Uncertainty and relative error under the rated operating condition.
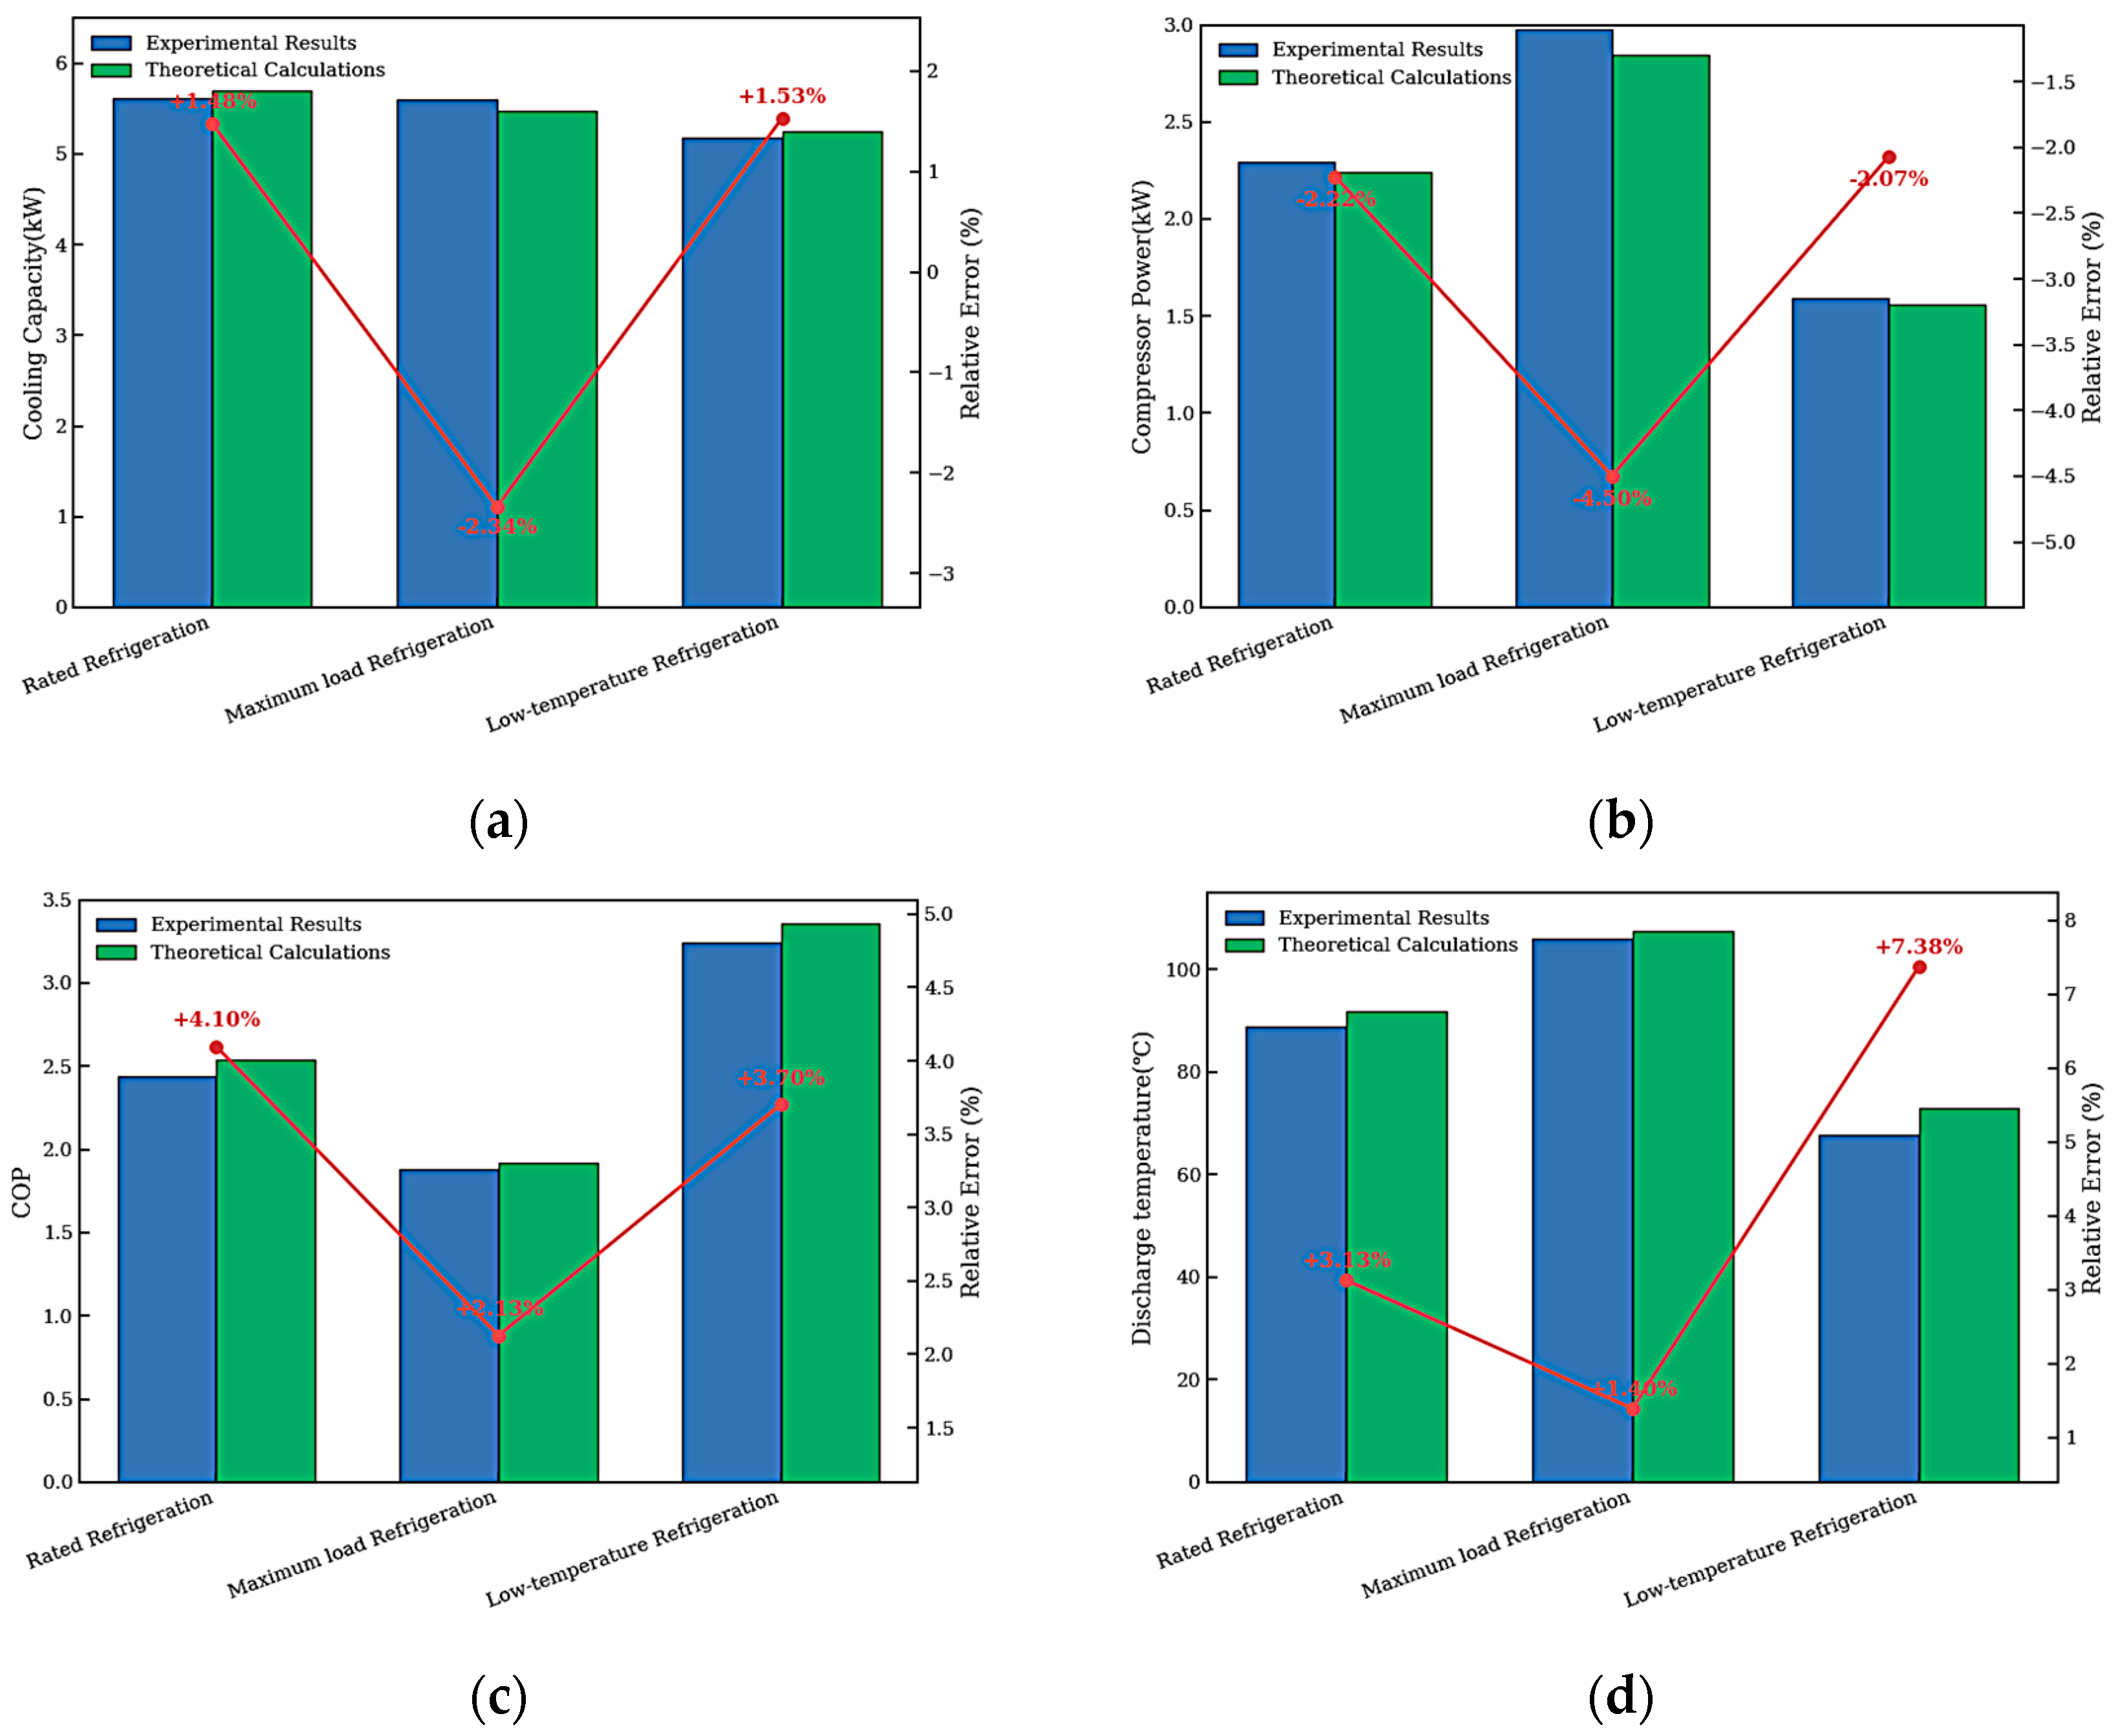
A comparison of the results in Table 3 and Figure 3 indicates that the experimental and theoretical cycle calculations for R407C are in close agreement. The errors in cooling capacity and compressor power are approximately 2%, with a maximum deviation of only 4.50%. Owing to energy losses in the actual system, the theoretically calculated COP values are higher than the experimental values, but the discrepancies remain below 5%. With respect to discharge temperature, the rated-cooling and maximum-load conditions produce comparable results, whereas under low-temperature conditions, the discharge-temperature error reaches 7.38%, which is still below 10% [24,25]. This comparison demonstrates that the proposed theoretical calculation model for rail vehicle air-conditioning can provide a reliable theoretical basis for numerical calculation.
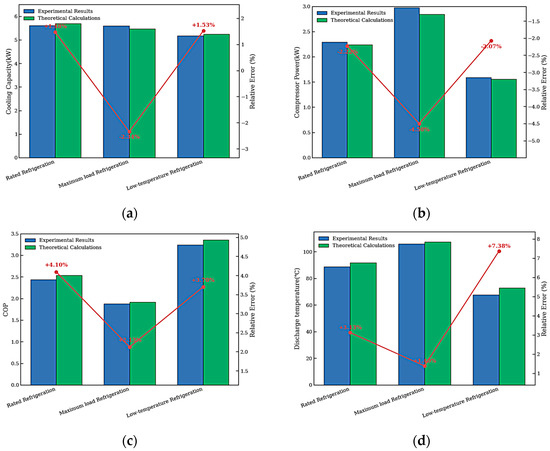
Figure 3.
Comparison of experimental results and theoretical calculations. (a) Cooling capacity, (b) compressor power, (c) COP, (d) discharge temperature.
3. Selection and Composition Ratio of Refrigerant Mixtures
3.1. Selection of Refrigerant Mixture Components
When selecting components for refrigerant mixtures, the thermophysical properties of candidate refrigerants must be compared to identify suitable constituents. The following criteria were adopted for selecting refrigerant mixture components for rail vehicle air-conditioning systems:
- Superior thermodynamic performance to satisfy the cooling requirements of rail vehicles;
- Environmental benignity, with an ozone depletion potential (ODP) of 0 and GWP100 not substantially exceeding 750.
- Favorable safety characteristics, including low flammability and toxicity;
- Commercial availability and low cost.
Based on the aforementioned substitution criteria, six refrigerants—excluding R13I1—were selected for formulating refrigerant mixtures intended to replace R407C. The physicochemical and thermodynamic properties of these candidates were compared, and a theoretical cycle model for rail vehicle air-conditioning refrigerants was developed to assess their performance. Refrigerant property data were sourced from the NIST REFPROP database.
The physicochemical properties of refrigerants primarily include safety, thermal stability, and miscibility with lubricating oil. Safety encompasses both toxicity and flammability. The classification of these safety parameters is defined in GB/T 7778–2017 “Refrigerant Numbering System and Safety Classification” [26], which categorizes refrigerant toxicity into two levels: A, indicating no or low toxicity, and B, indicating high toxicity. Flammability is classified into three levels—1, 2, and 3—with higher values indicating greater flammability. Level 2 is further subdivided into 2L, indicating that the refrigerant is mildly flammable. Better thermal stability means the refrigerant is less prone to decomposition when heated; good miscibility with lubricating oil is highly beneficial for the stable operation of the refrigeration system. Environmental performance quantifies a refrigerant’s environmental friendliness, offering a more intuitive measure of its impact. The primary indicators of environmental performance are ODP and GWP. The safety and environmental performance parameters of several refrigerants potentially applicable to rail vehicle air-conditioning systems are presented in Table 5.

Table 5.
Initial screening of refrigerant components.
In terms of safety, all refrigerants in Table 5 are level A (no or low toxicity), with some exhibiting flammability—R290 and R600 are highly flammable. R13I1, originally used as a fire suppressant and stabilizer, has strong flame-retardant properties and, when blended, can effectively lower the flammability classification of the mixture. As pure refrigerants, all have an ODP of 0; only R152a, R290, R600, and R13I1 satisfy the environmental requirement of GWP100 < 750.
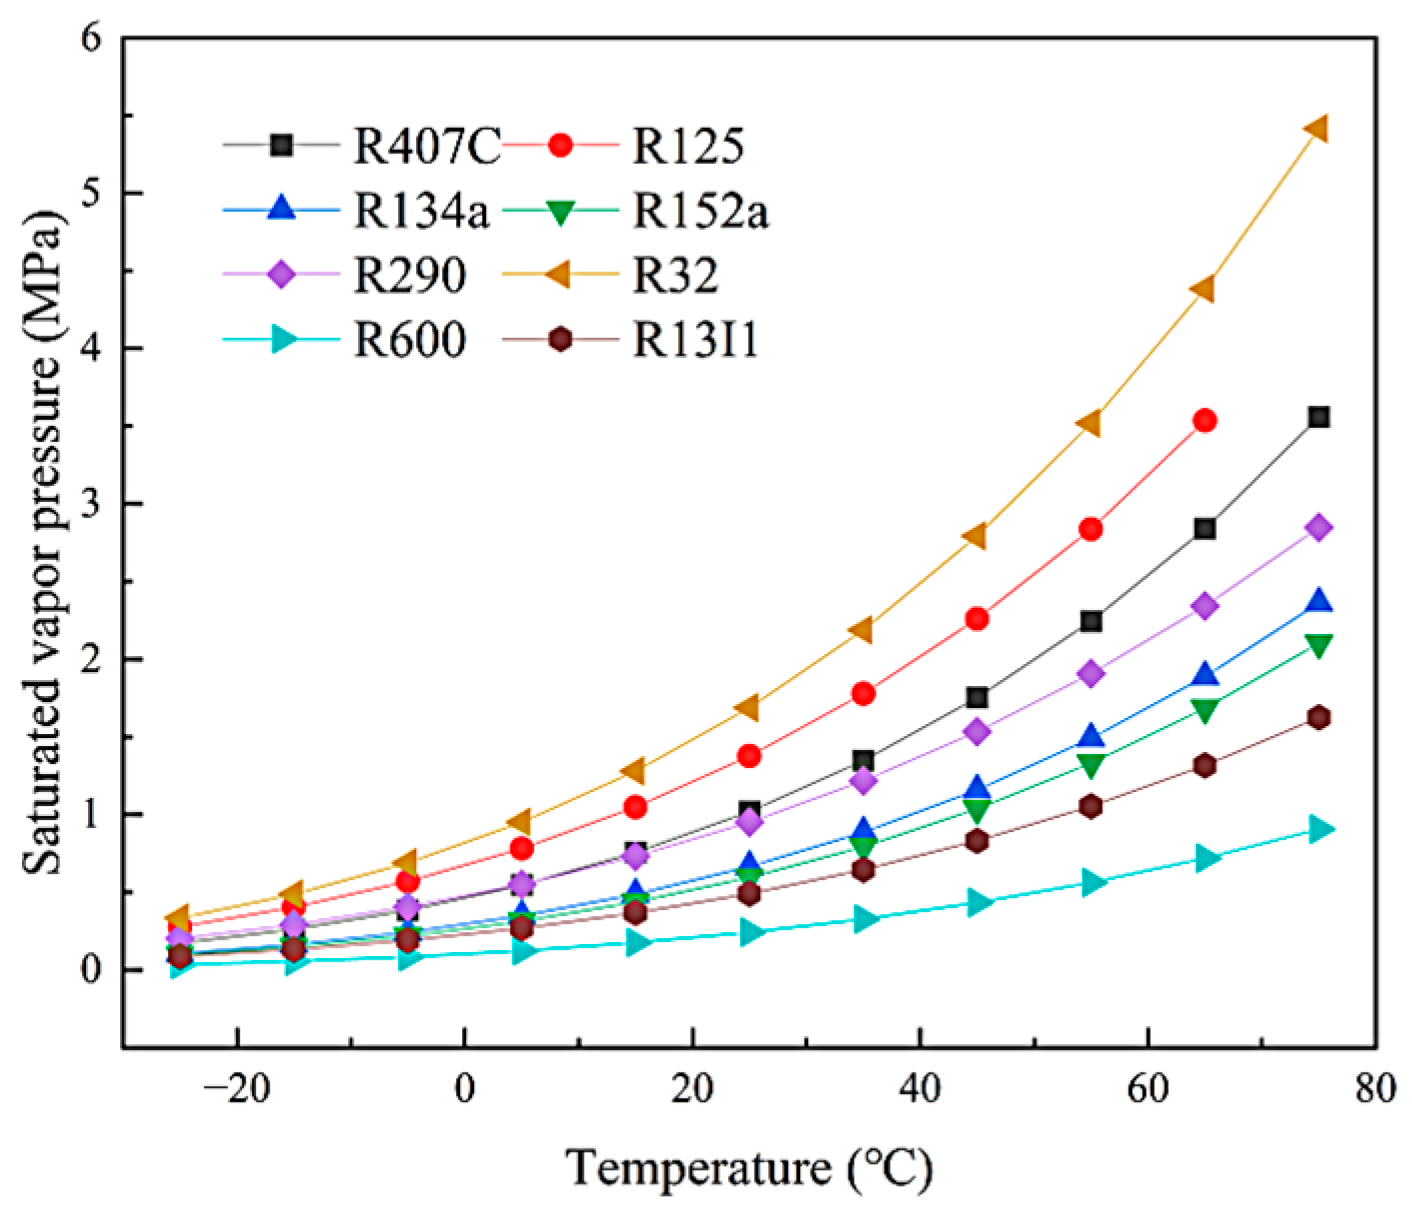
The saturation vapor-pressure curve of the refrigerant has a significant impact on the performance of the unit: if the pressure is too low, the evaporating pressure may fall below atmospheric pressure, causing negative pressure within the unit; if the pressure is too high, the equipment must withstand greater loads, increasing the economic cost of substitution. Furthermore, an excessively large pressure ratio can lead to elevated compressor discharge temperatures and a reduction in isentropic efficiency. Figure 4 presents the saturation vapor-pressure versus temperature curves for the various refrigerants. The pressure differences among the refrigerants increase with temperature. R290 and R125 exhibit saturation vapor pressures close to that of R407C. At the same temperature, R32 has the highest saturation pressure and R600 the lowest, and both remain above standard atmospheric pressure. The closer the saturation vapor-pressure curves of the replacement and original refrigerants are to each other, the more similar their thermophysical properties, which minimizes the need for modifications to existing air-conditioning units. Therefore, mixture components should be selected to have saturation pressures close to R407C, or by blending constituents with pressures both above and below that of R407C.
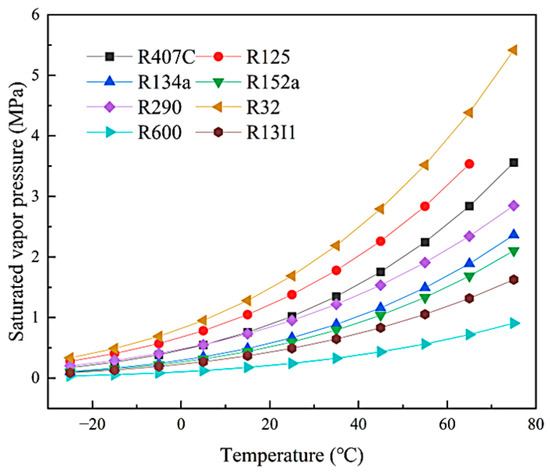
Figure 4.
Variation in saturation vapor pressure with temperature for different refrigerants.
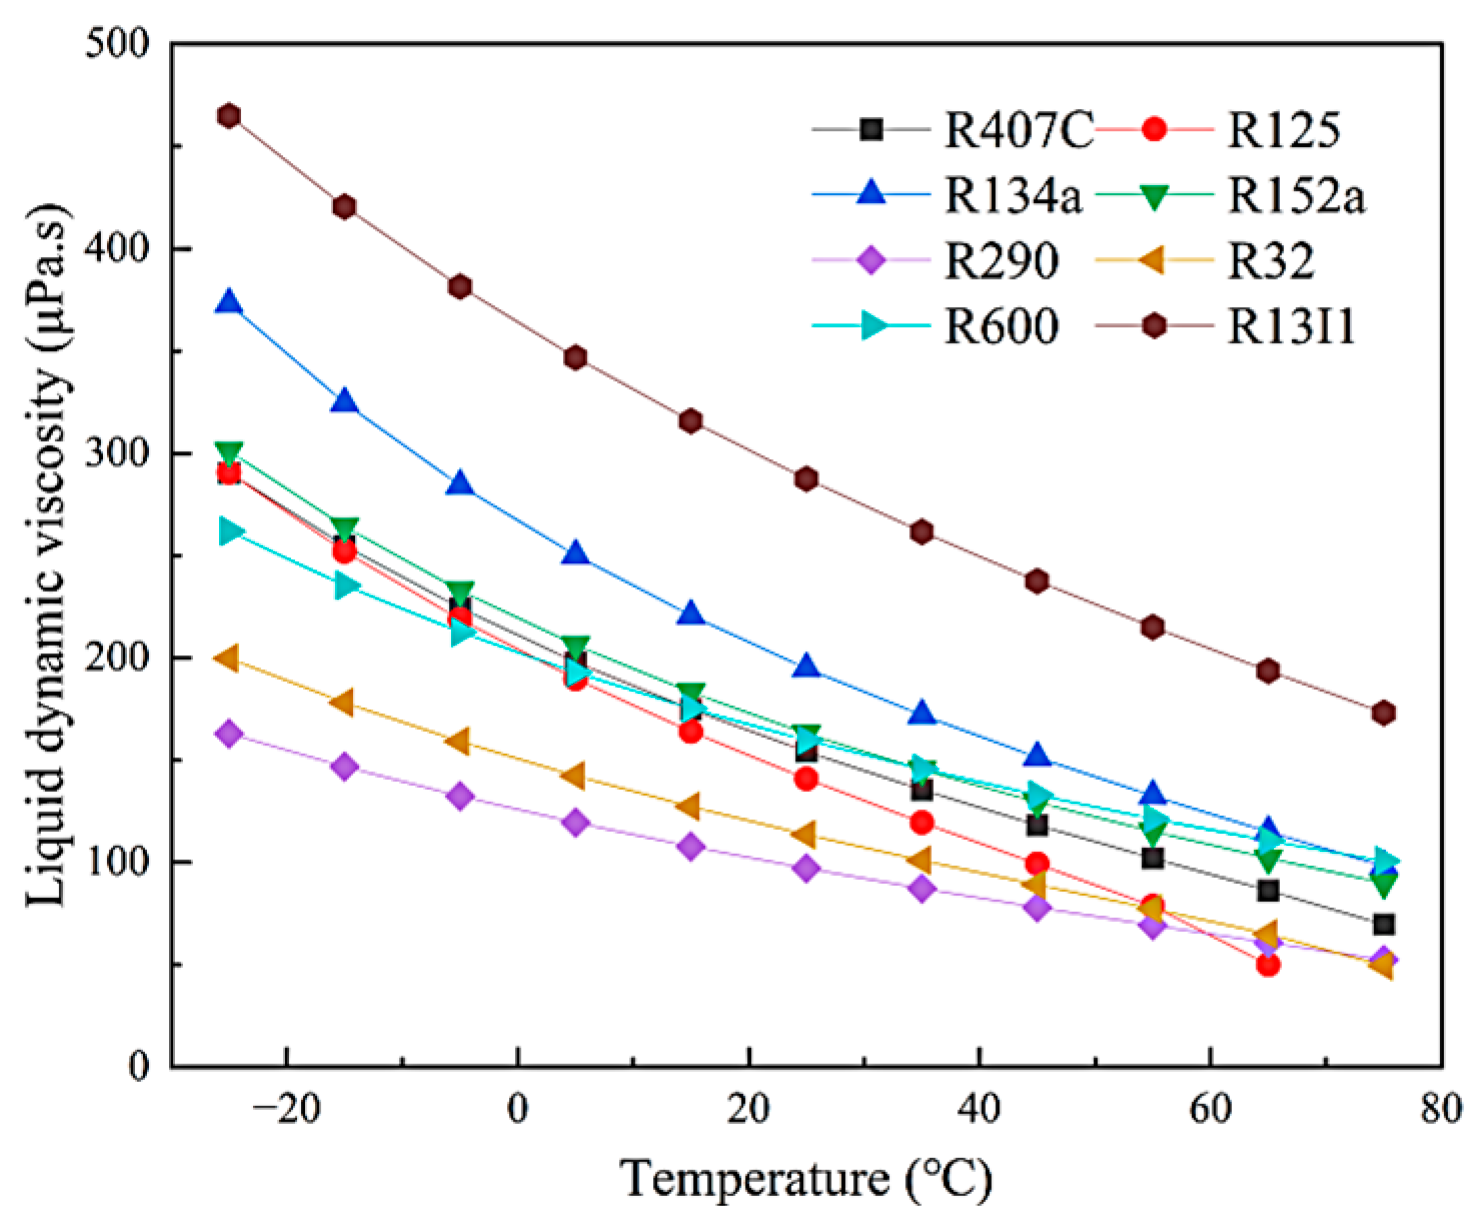
During system operation, the refrigerant remains in continuous circulation; therefore, refrigerants with low viscosity and density are preferred. Lower density and viscosity reduce frictional losses within the air-conditioning system piping, effectively minimizing pressure drops and optimizing the required refrigerant charge. Furthermore, low viscosity helps thin the thermal boundary layer, thereby enhancing the heat-transfer coefficient. Figure 5 shows the variation in liquid dynamic viscosity with temperature for different refrigerants. As shown in Figure 5, R32 and R290 exhibit relatively low liquid dynamic viscosity, whereas R13I1 and R134a have higher viscosities; the remaining refrigerants show only minor differences in liquid dynamic viscosity.
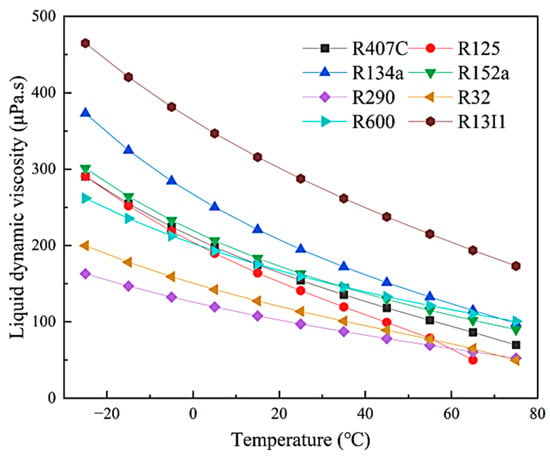
Figure 5.
Variation in liquid dynamic viscosity of different refrigerants with temperature.
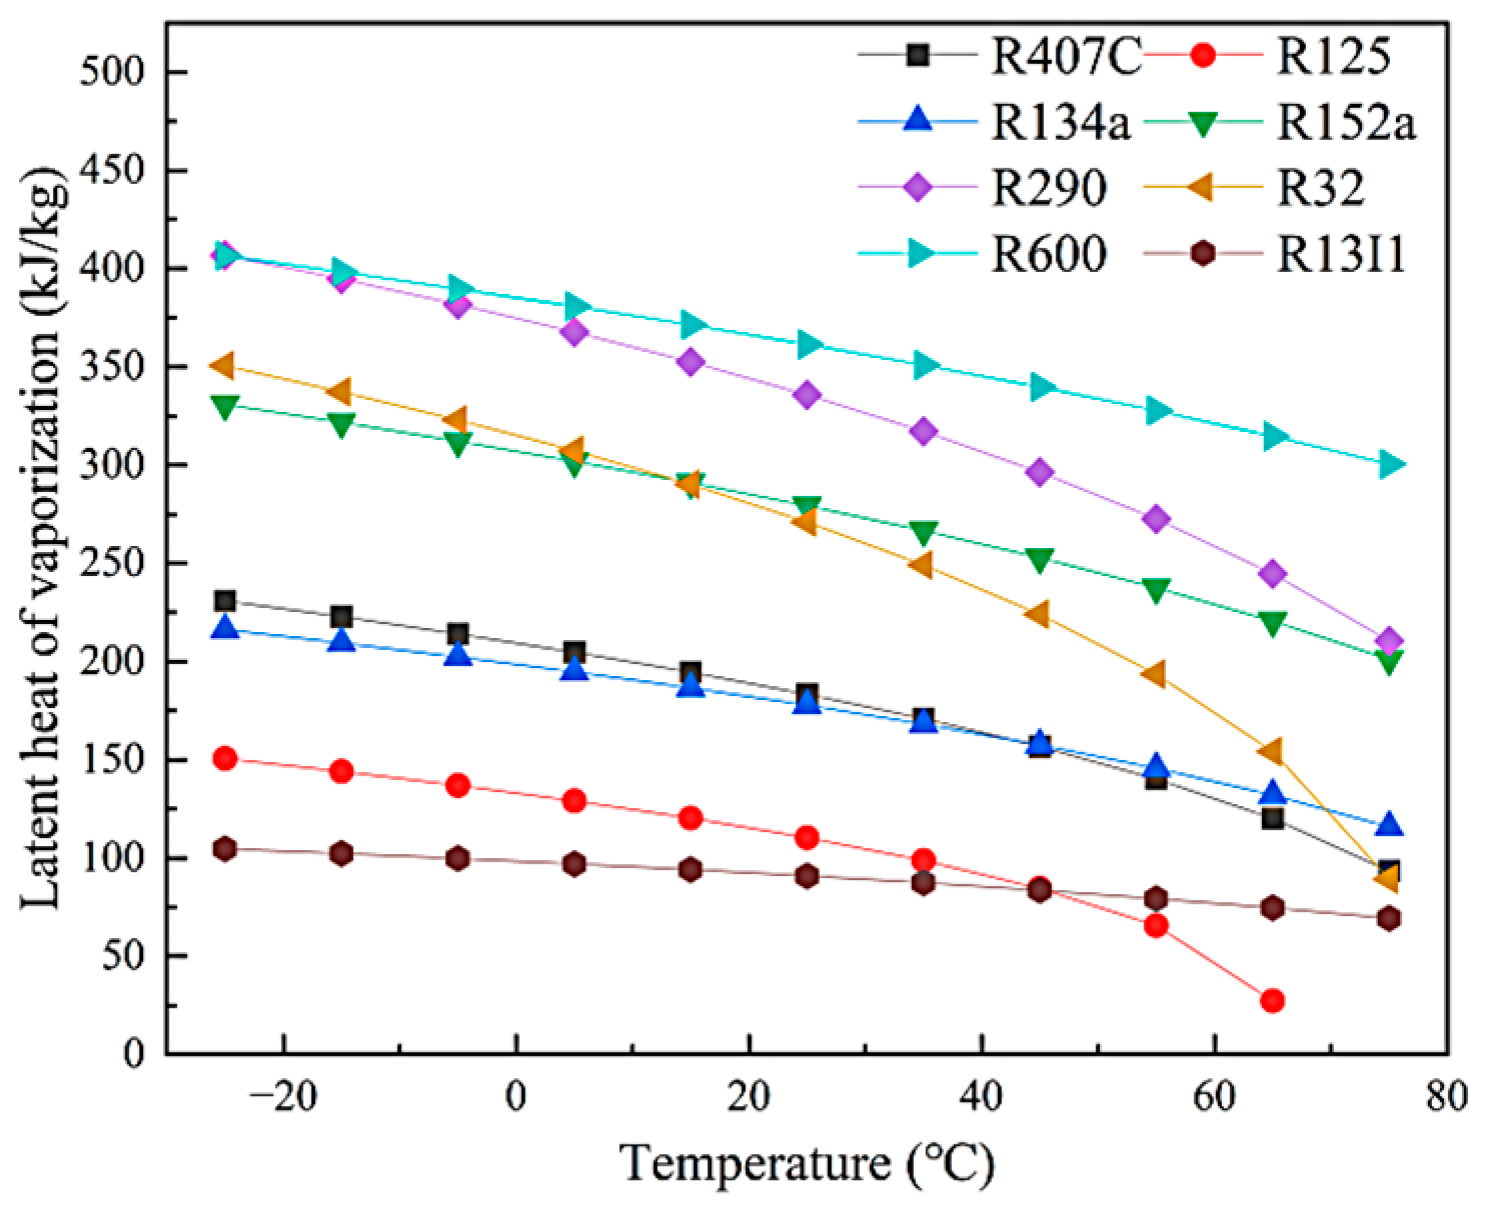
Latent heat of vaporization is the heat absorbed by the refrigerant when it changes from saturated liquid to saturated vapor at constant pressure. It is one of the key factors affecting the thermodynamic performance of a refrigerant. Under a fixed cooling capacity, the greater the latent heat of vaporization, the smaller the required refrigerant charge. Refrigerants with higher latent heat of vaporization not only support environmental conservation and cost savings, but also enable smaller equipment size and, to some extent, reduce the risk of refrigerant leakage. Figure 6 shows the variation in latent heat of vaporization with temperature for different refrigerants. As depicted in Figure 6, the latent heats of R600, R290, R152a, and R32 all exceed that of R407C; R134a’s latent heat curve most closely matches that of R407C; and R13I1 exhibits the smallest variation in latent heat with temperature.
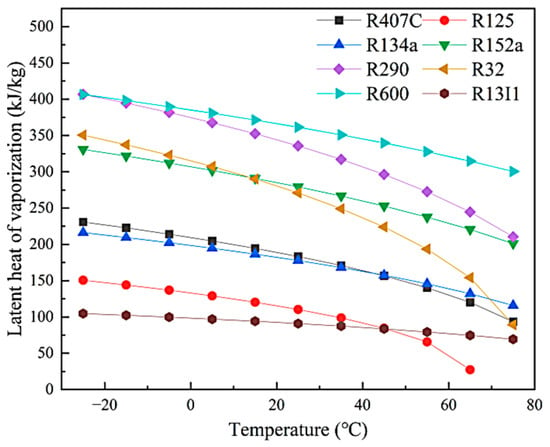
Figure 6.
Variation in latent heat of vaporization with temperature for different refrigerants.
3.2. Study on Composition Ratios of Refrigerant Mixtures
Based on the property comparisons in Section 3.1, R32 and R13I1 were selected as the base components for the refrigerant mixture, and their blending ratios were investigated with respect to physicochemical and thermodynamic properties. The basic thermophysical properties and environmental performance parameters of R32 and R13I1 are presented in Table 6.

Table 6.
Physicochemical and environmental performance parameters of R32 and R13I1.
Since both R32 and R13I1 have an ODP of 0, any blend of the two will also have an ODP of 0, posing no threat to the ozone layer. R32 has a GWP100 of 771, whereas R13I1’s GWP100 is less than 1. When the mass fraction of R32 in the mixture does not exceed 97.27%, the blend’s GWP100 remains below 750. In terms of safety classification, both R32 and R13I1 are Class A refrigerants; R32 is mildly flammable (A2L), while R13I1 possesses strong flame-retardant properties. R13I1 provides strong flame inhibition and can attenuate the flammability tendency of blends that contain R32. With suitable composition, standard testing, and basic vehicle-level controls such as charge management and leak detection, the mixture has clear potential to meet railway HVAC safety requirements. Although R13I1 provides flame inhibition, the safety classification and railway applicability of ZT01 are composition-dependent and must be confirmed by standardized flammability testing in accordance with ASHRAE 34, followed by system-level conformity with ASHRAE 15, ISO 5149, EN 378, and applicable railway fire-safety codes; additional prototype and in-service tests will be conducted to verify compliance before deployment [27,28,29].
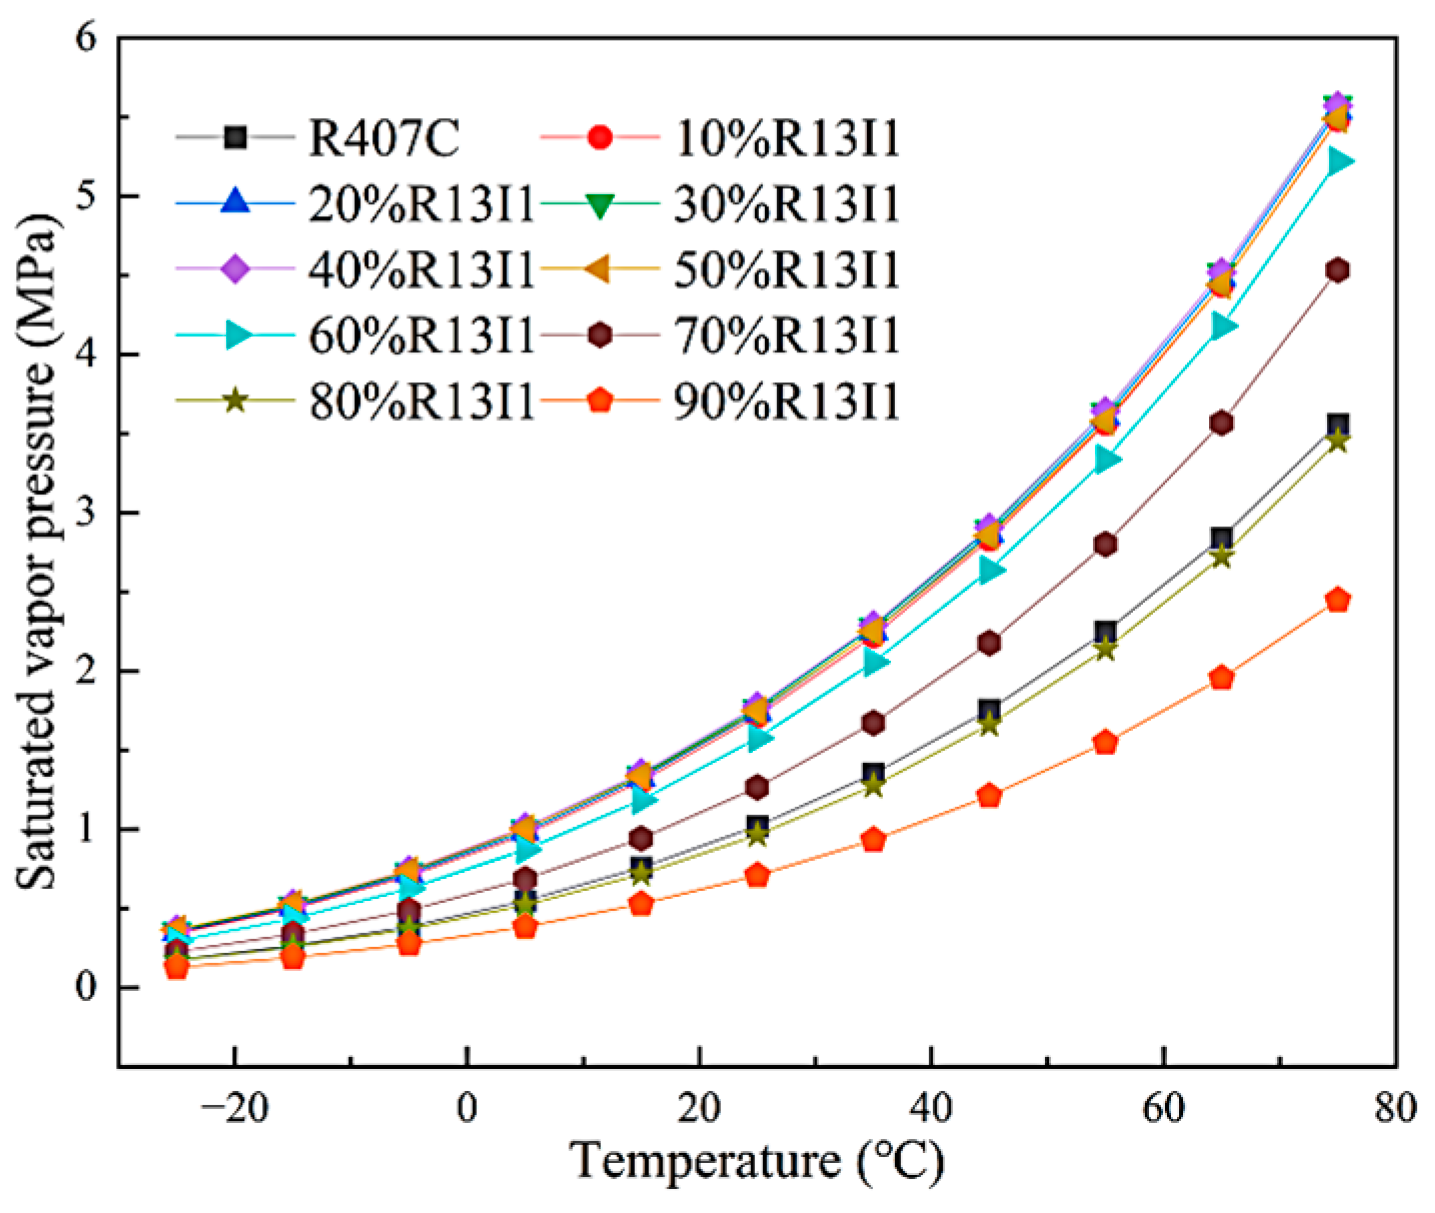
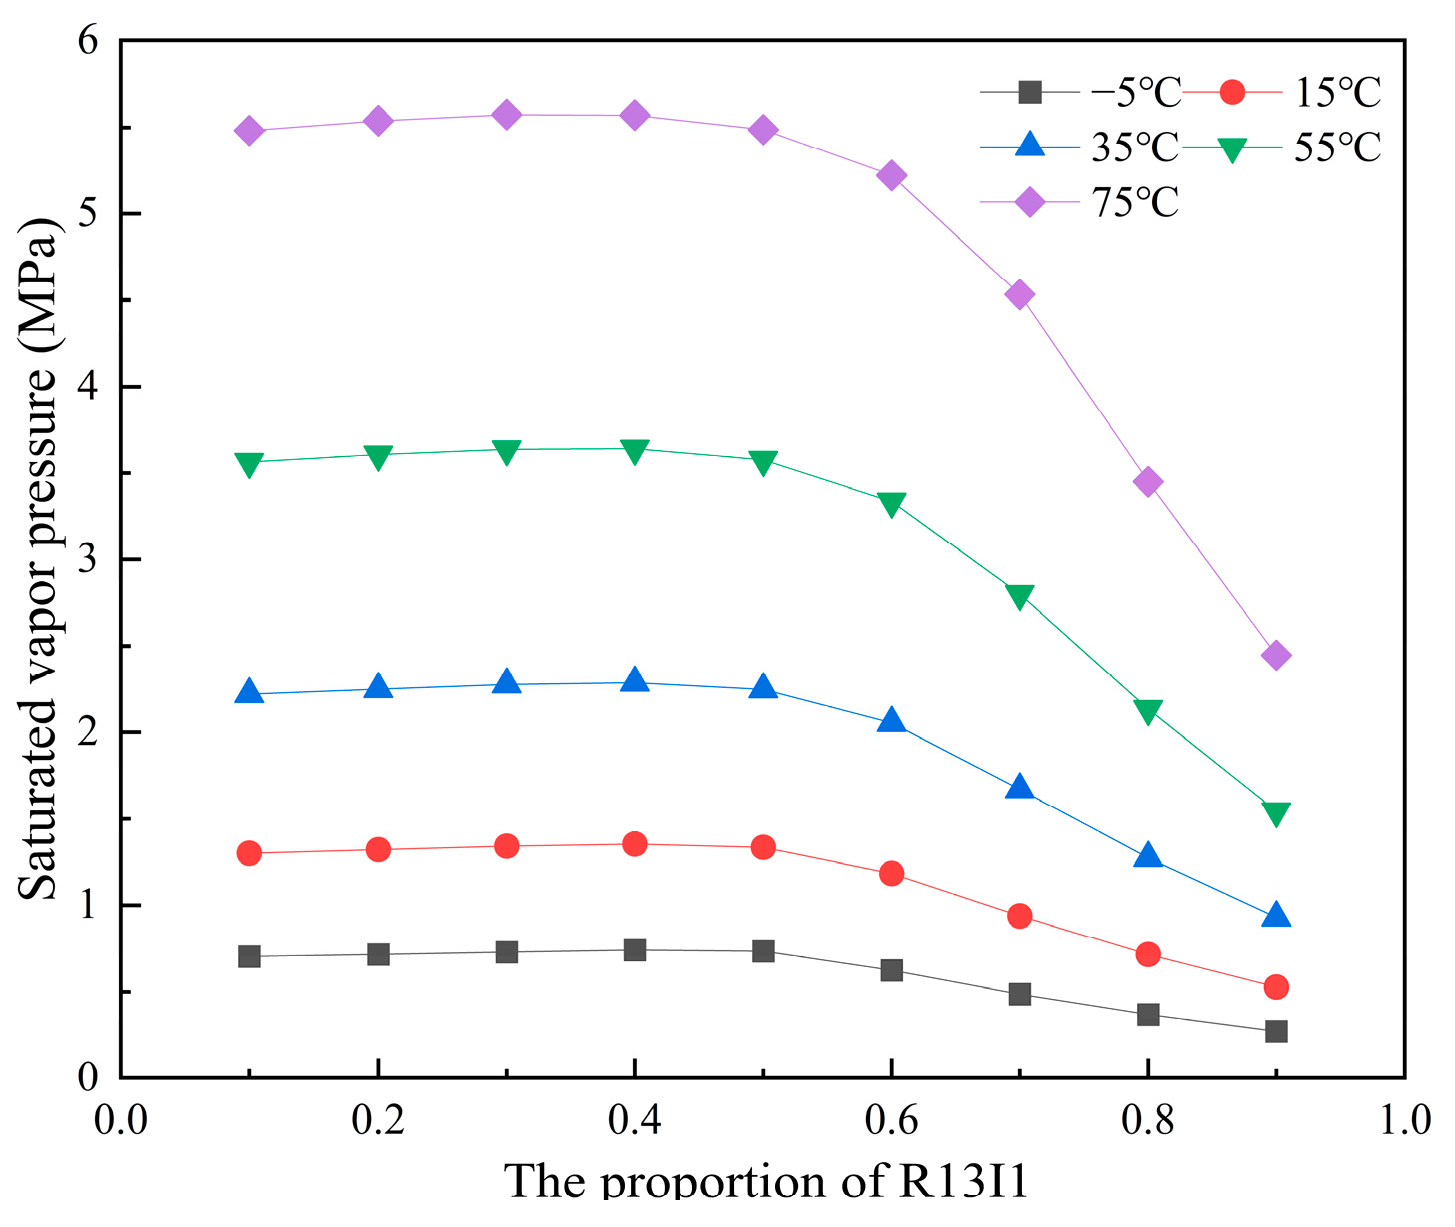
The saturation vapor-pressure versus temperature curves for the R13I1/R32 binary mixture and R407C are shown in Figure 7, and the variation in saturation pressure with R13I1 mass fraction at a given temperature is presented in Figure 8. As illustrated in Figure 7 and Figure 8, when the R13I1 mass fraction in the R13I1/R32 mixture is below 50%, the mixture’s saturation pressure is virtually independent of the R13I1 content; however, once the R13I1 fraction exceeds 50%, the saturation pressure decreases sharply, with the decline becoming more pronounced at higher temperatures. At an R13I1 mass fraction of 80%, the mixture’s saturation vapor-pressure curve most closely aligns with that of R407C.
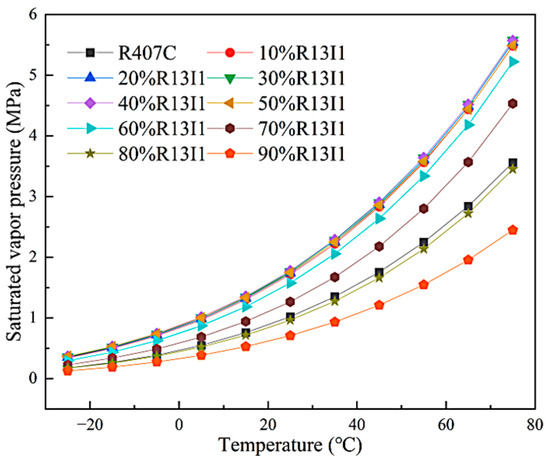
Figure 7.
Saturation vapor pressure versus temperature for the binary mixtures and R407C.
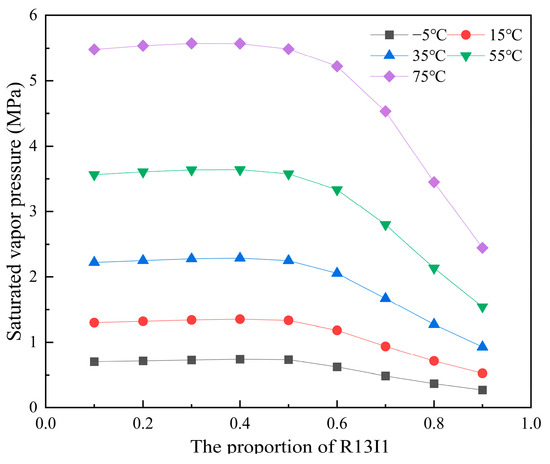
Figure 8.
Dependence of saturation vapor pressure on the R13I1 mass fraction in the R13I1/R32 mixtures at fixed temperatures.
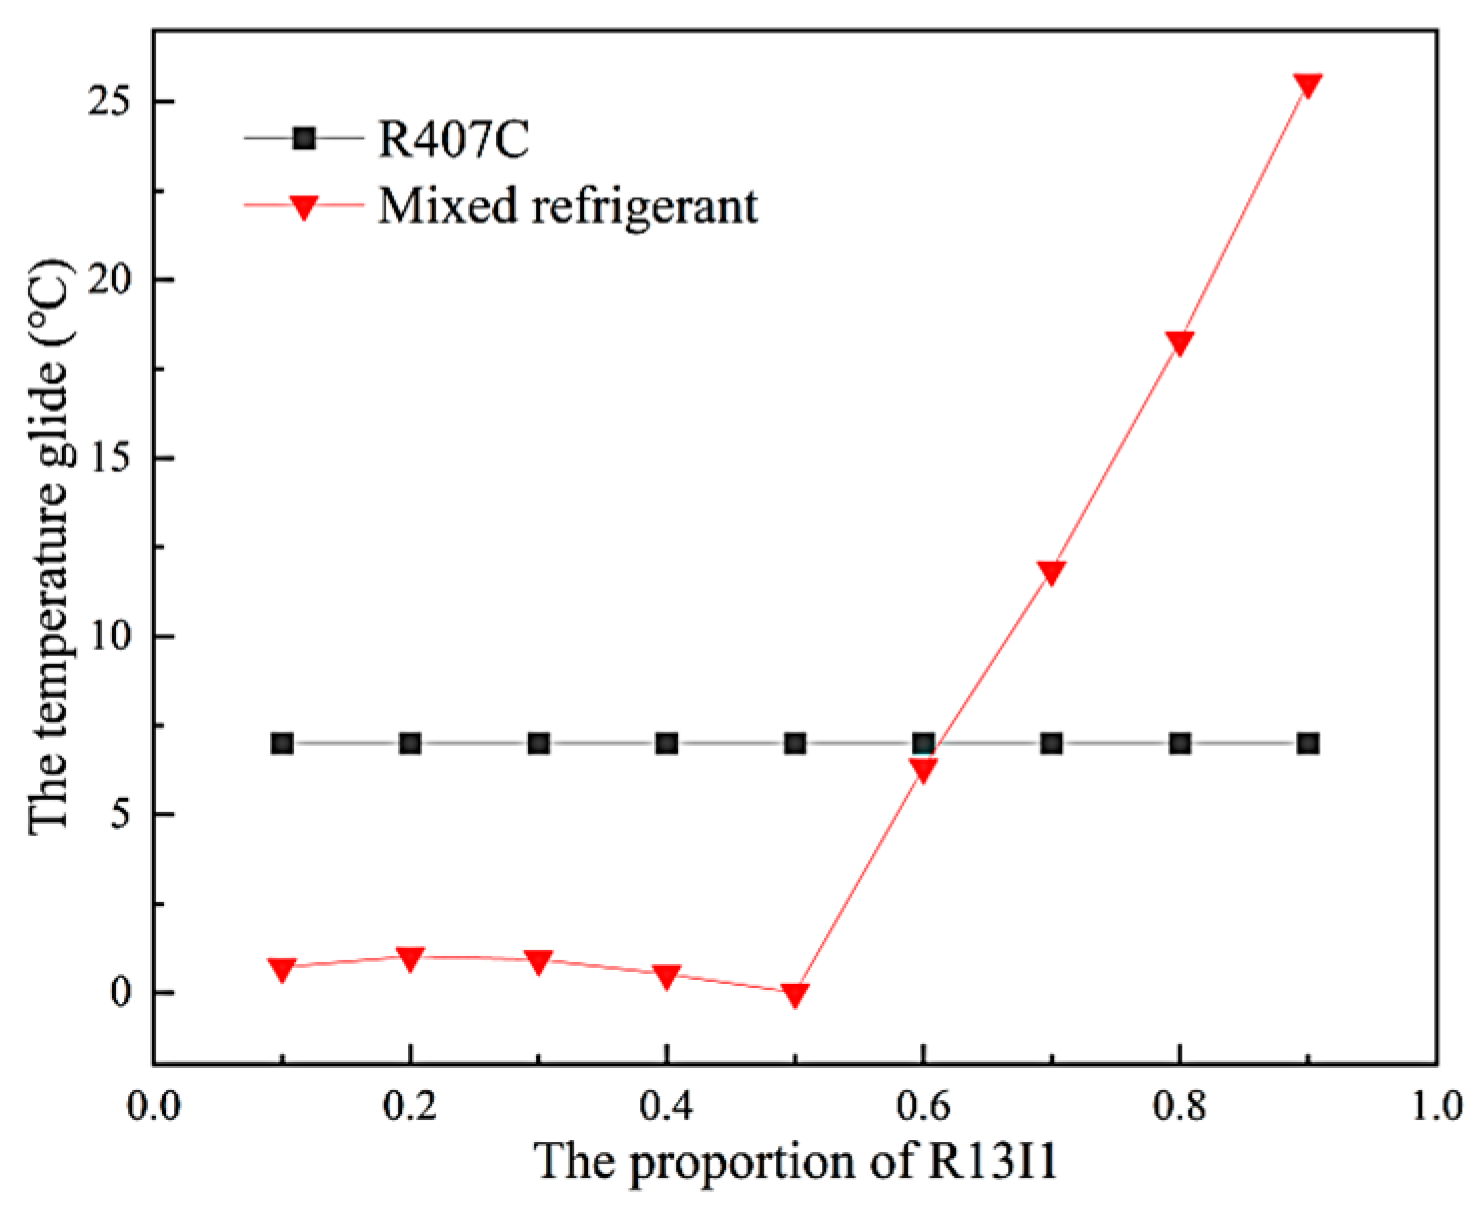
Temperature glide refers to the difference between the bubble-point and dew-point temperatures of a refrigerant mixture during isobaric phase change. This characteristic directly affects the heat-transfer efficiency and energy consumption of the refrigeration system. The temperature-glide property facilitates matching variable-temperature heat sources, reduces irreversible losses during phase-change heat transfer, and improves the cycle’s thermodynamic performance [30]. However, excessive temperature glide can induce pinch-point effects in counter-flow heat exchangers, resulting in locally increased temperature differences and higher irreversible losses. As shown in Figure 9, the temperature glide of the mixture initially decreases slightly and then rises sharply as the R13I1 mass fraction increases. Keeping the temperature glide close to that of R407C preserves pinch margins, flow distribution, and control stability, thereby minimizing hardware and control modifications. To minimize modifications to existing system components when replacing R407C, the temperature glide of the new refrigerant blend should be as close to or lower than that of R407C; hence, the R13I1 mass fraction should not exceed 60%.
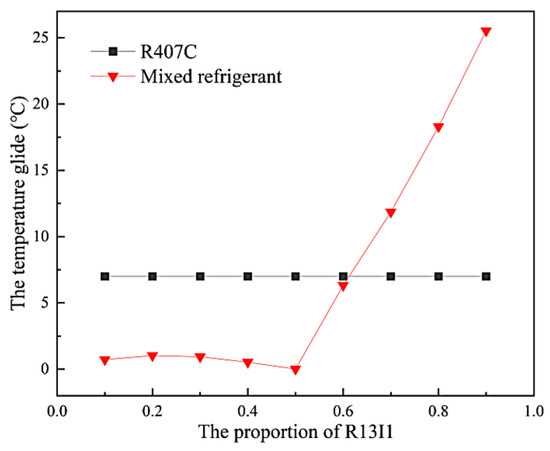
Figure 9.
Temperature glide of the R13I1/R32 mixtures as a function of R13I1 mass fraction.
Considering physicochemical and thermodynamic properties, the R13I1/R32 mixture at a mass ratio of 0.6/0.4 was selected for further theoretical calculations and experimental investigation, hereafter designated as ZT01. ZT01 is non-toxic and non-flammable, with an ODP of 0 and a GWP100 of only 308, posing no risk to the ozone layer. Under standard atmospheric pressure, ZT01 exhibits a smaller temperature glide than R407C, demonstrating its capability to replace R407C.
4. Theoretical Analysis
The basic thermophysical properties and environmental performance parameters of ZT01 and R407C are presented in Table 7.

Table 7.
Physicochemical and environmental performance parameters of ZT01 and R407C.
Table 7 indicates that, compared to R407C, ZT01 has a critical temperature that is 9.45 °C lower, a critical pressure that is 19.6 % higher, and a critical specific volume that is 26.7 % lower. These properties not only satisfy the operating temperature range of rail vehicle air-conditioning systems but also enable a more compact unit design, albeit with increased pressure-containment requirements. Furthermore, the polyolester (POE) lubricant used in R407C-charged units is fully compatible with ZT01, indicating good compatibility with POE lubricants used in R407C units; field verification of oil miscibility and return is still required, and oil conversion is not typically necessary when POE is already in use.
In practical applications, the operating conditions of refrigerants are not constant. For rail vehicles, the air-conditioning system’s operating conditions are influenced by environmental factors. During the actual cycle, to prevent the refrigerant from fully evaporating into gas within the evaporator, which could result in liquid refrigerant entering the compressor and causing a phenomenon known as “liquid slugging,” it is common practice to allow the refrigerant to evaporate and continue to absorb heat until it reaches a superheated gas state before entering the compressor. Moreover, to improve the refrigerant’s cycle performance, the refrigerant is typically in a subcooled liquid state at the condenser outlet. However, different refrigerants have varying degrees of tolerance to superheat, and the impact of subcooling on cycle performance also differs. In order to analyze the replacement performance of ZT1, this chapter investigates the effects of condensing temperature, evaporating temperature, superheating, and subcooling on the operating performance of the refrigerant mixture, comparing it with the theoretical performance of R407C.
4.1. Variable Condensation Temperature Working Conditions
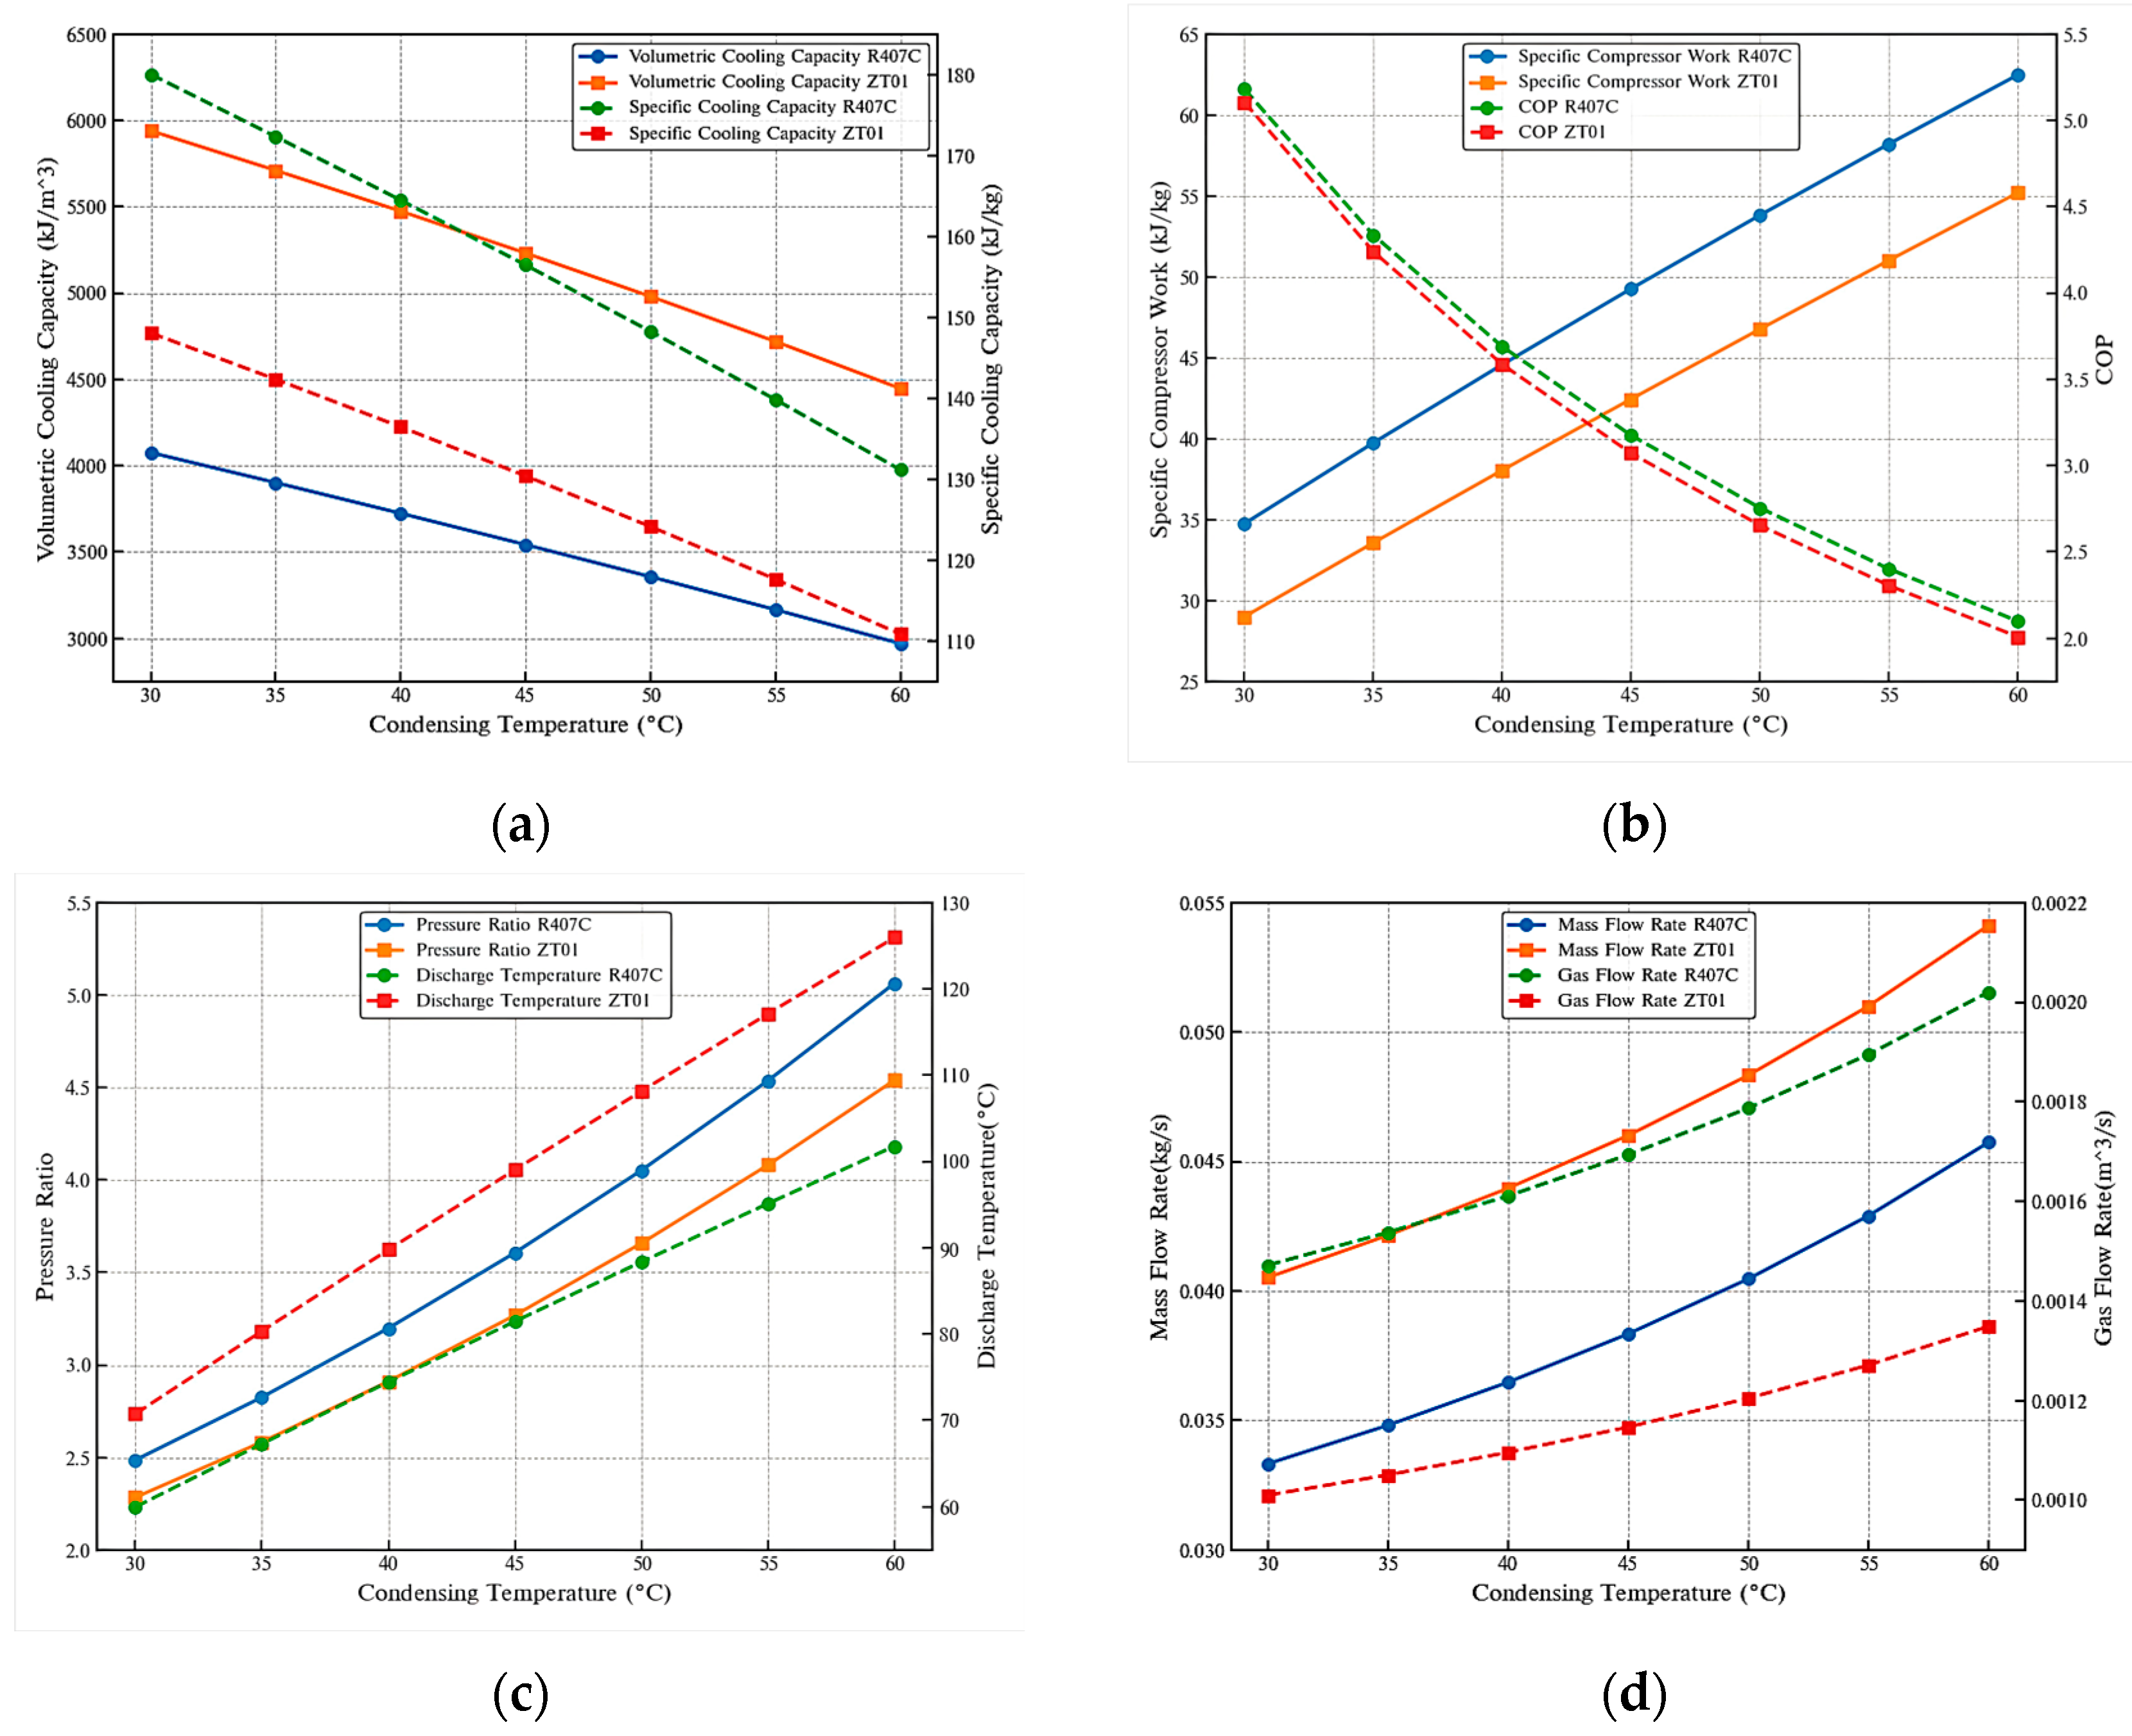
The calculation conditions were set with a condensing temperature range of 30~60 °C in 5 °C increments, an evaporating temperature of 5 °C, and both subcooling and superheating of 5 °C. Theoretical cycle calculations yield Figure 10, which illustrates the effects of condensing-temperature variation on volumetric cooling capacity, specific cooling capacity, specific compressor work, COP, pressure ratio, discharge temperature, mass flow rate, and gas flow rate.
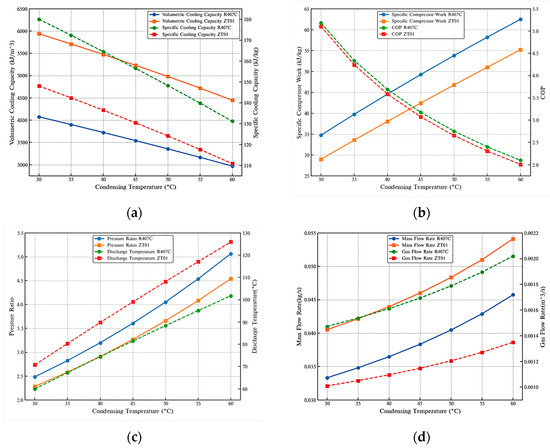
Figure 10.
The effect of condensing temperature on the cycle performance of R407C and ZT01: (a) volumetric cooling capacity and specific cooling capacity; (b) specific compressor work and COP; (c) pressure ratio and discharge temperature; (d) mass flow rate and gas flow rate.
With rising condensing temperature, both volumetric cooling capacity and specific cooling capacity show a marked decline for the tested refrigerants, reflecting the combined effects of increasing condenser pressure and diminishing enthalpy difference across the evaporator. Across the entire temperature range, ZT01 delivers 45.73–49.75% higher volumetric cooling capacity than R407C, even though its specific cooling capacity is 15.48–17.75% lower. The reason is that ZT01 provides higher suction-vapor density and more effective volumetric throughput, so more refrigerant mass is processed per unit swept volume, and the cooling delivered per unit compressor displacement rises by roughly 45–50%. As a result, the same duty can be achieved with a smaller-displacement compressor or by operating the existing machine at a lower speed, which is especially attractive where compressor size or installation space is constrained and can also reduce unit cost. Notably, this volumetric advantage becomes increasingly prominent at elevated condensing temperatures, where the relative performance gap widens. Consequently, ZT01 is particularly well-suited for compact system configurations or high-temperature refrigeration environments where maximizing cooling output within constrained volumetric and mechanical limits is a priority.
The superior volumetric capacity of ZT01 is accompanied by a markedly higher refrigerant mass flow rate, with values exceeding those of R407C by 21.5–26.4% across the investigated condensing temperature range. This elevated mass flow rate offers a practical pathway to offset the reduction in specific cooling capacity, as a greater refrigerant mass can be circulated through the system—achieved, for example, by a modest increase in expansion valve opening—without necessitating an increase in the total refrigerant charge. This approach not only avoids excessive charge inventory, thereby reducing leakage risk, but also helps sustain overall cooling output. In parallel, ZT01 exhibits a lower volumetric flow rate at the compressor suction compared with R407C, implying that a smaller suction volume is required to process the same cooling load. This characteristic directly translates into reduced compressor displacement requirements, which can facilitate the adoption of smaller, lighter, and potentially more cost-effective compressor designs. Such a combination of higher mass flow and reduced volumetric demand positions ZT01 as a promising candidate for system configurations where both footprint and mechanical capacity are constrained, without compromising on total cooling performance.
With increasing condensing temperature, the COP of both refrigerants exhibits a gradual decline, whereas their specific compressor work rises steadily. This behavior is primarily attributed to the elevation of condenser pressure, which increases the compression ratio and consequently the work input required for vapor compression, while simultaneously reducing the enthalpy difference across the evaporator and thereby diminishing the refrigeration effect. Despite these adverse thermodynamic shifts, the COP of ZT01 remains consistently close to that of R407C, with a deviation not exceeding 5% over the entire investigated temperature range. Notably, ZT01 requires 13.19–19.81% less specific compressor work compared with R407C. This substantial reduction in compression energy demand implies that, under equal refrigerant charge and operating conditions, a system charged with ZT01 can deliver an equivalent cooling capacity while consuming less electrical power. Such energy-saving potential, combined with the previously discussed volumetric advantages, underscores ZT01’s suitability for high-efficiency system designs, particularly in applications where energy cost and operational sustainability are of critical concern.
ZT01 exhibits a pressure ratio that is 8.83–11.53% lower than that of R407C under the same operating conditions. A lower pressure ratio reduces valve impact, bearing and thrust loads, shaft-seal differential pressure, and pressure pulsations; thermodynamically, it also enhances compressor volumetric efficiency and curbs internal leakage. Together, these effects lessen mechanical stress on moving components and are favorable for long-term compressor reliability, durability, and service life. In contrast, ZT01’s discharge temperature is approximately 17.5% higher than that of R407C, with the maximum observed value reaching 125.94 °C. While this temperature remains within the acceptable operational limits for most commercial compressors, elevated discharge temperatures can accelerate lubricant degradation, increase thermal loading on valves and seals, and heighten the risk of material fatigue in high-temperature components. ZT01’s higher discharge temperature requires attention to the compressor operating envelope and control settings. To avoid power/COP penalties, practical measures such as liquid injection or economizer operation, condenser-fan curve optimization, and superheat returning should be adopted; oil-cooling and enhanced heat rejection can be considered when necessary. By addressing these considerations, ZT01’s lower pressure ratio advantage can be fully leveraged without compromising system reliability and durability in long-term operation.
4.2. Variable Evaporation Temperature Working Conditions
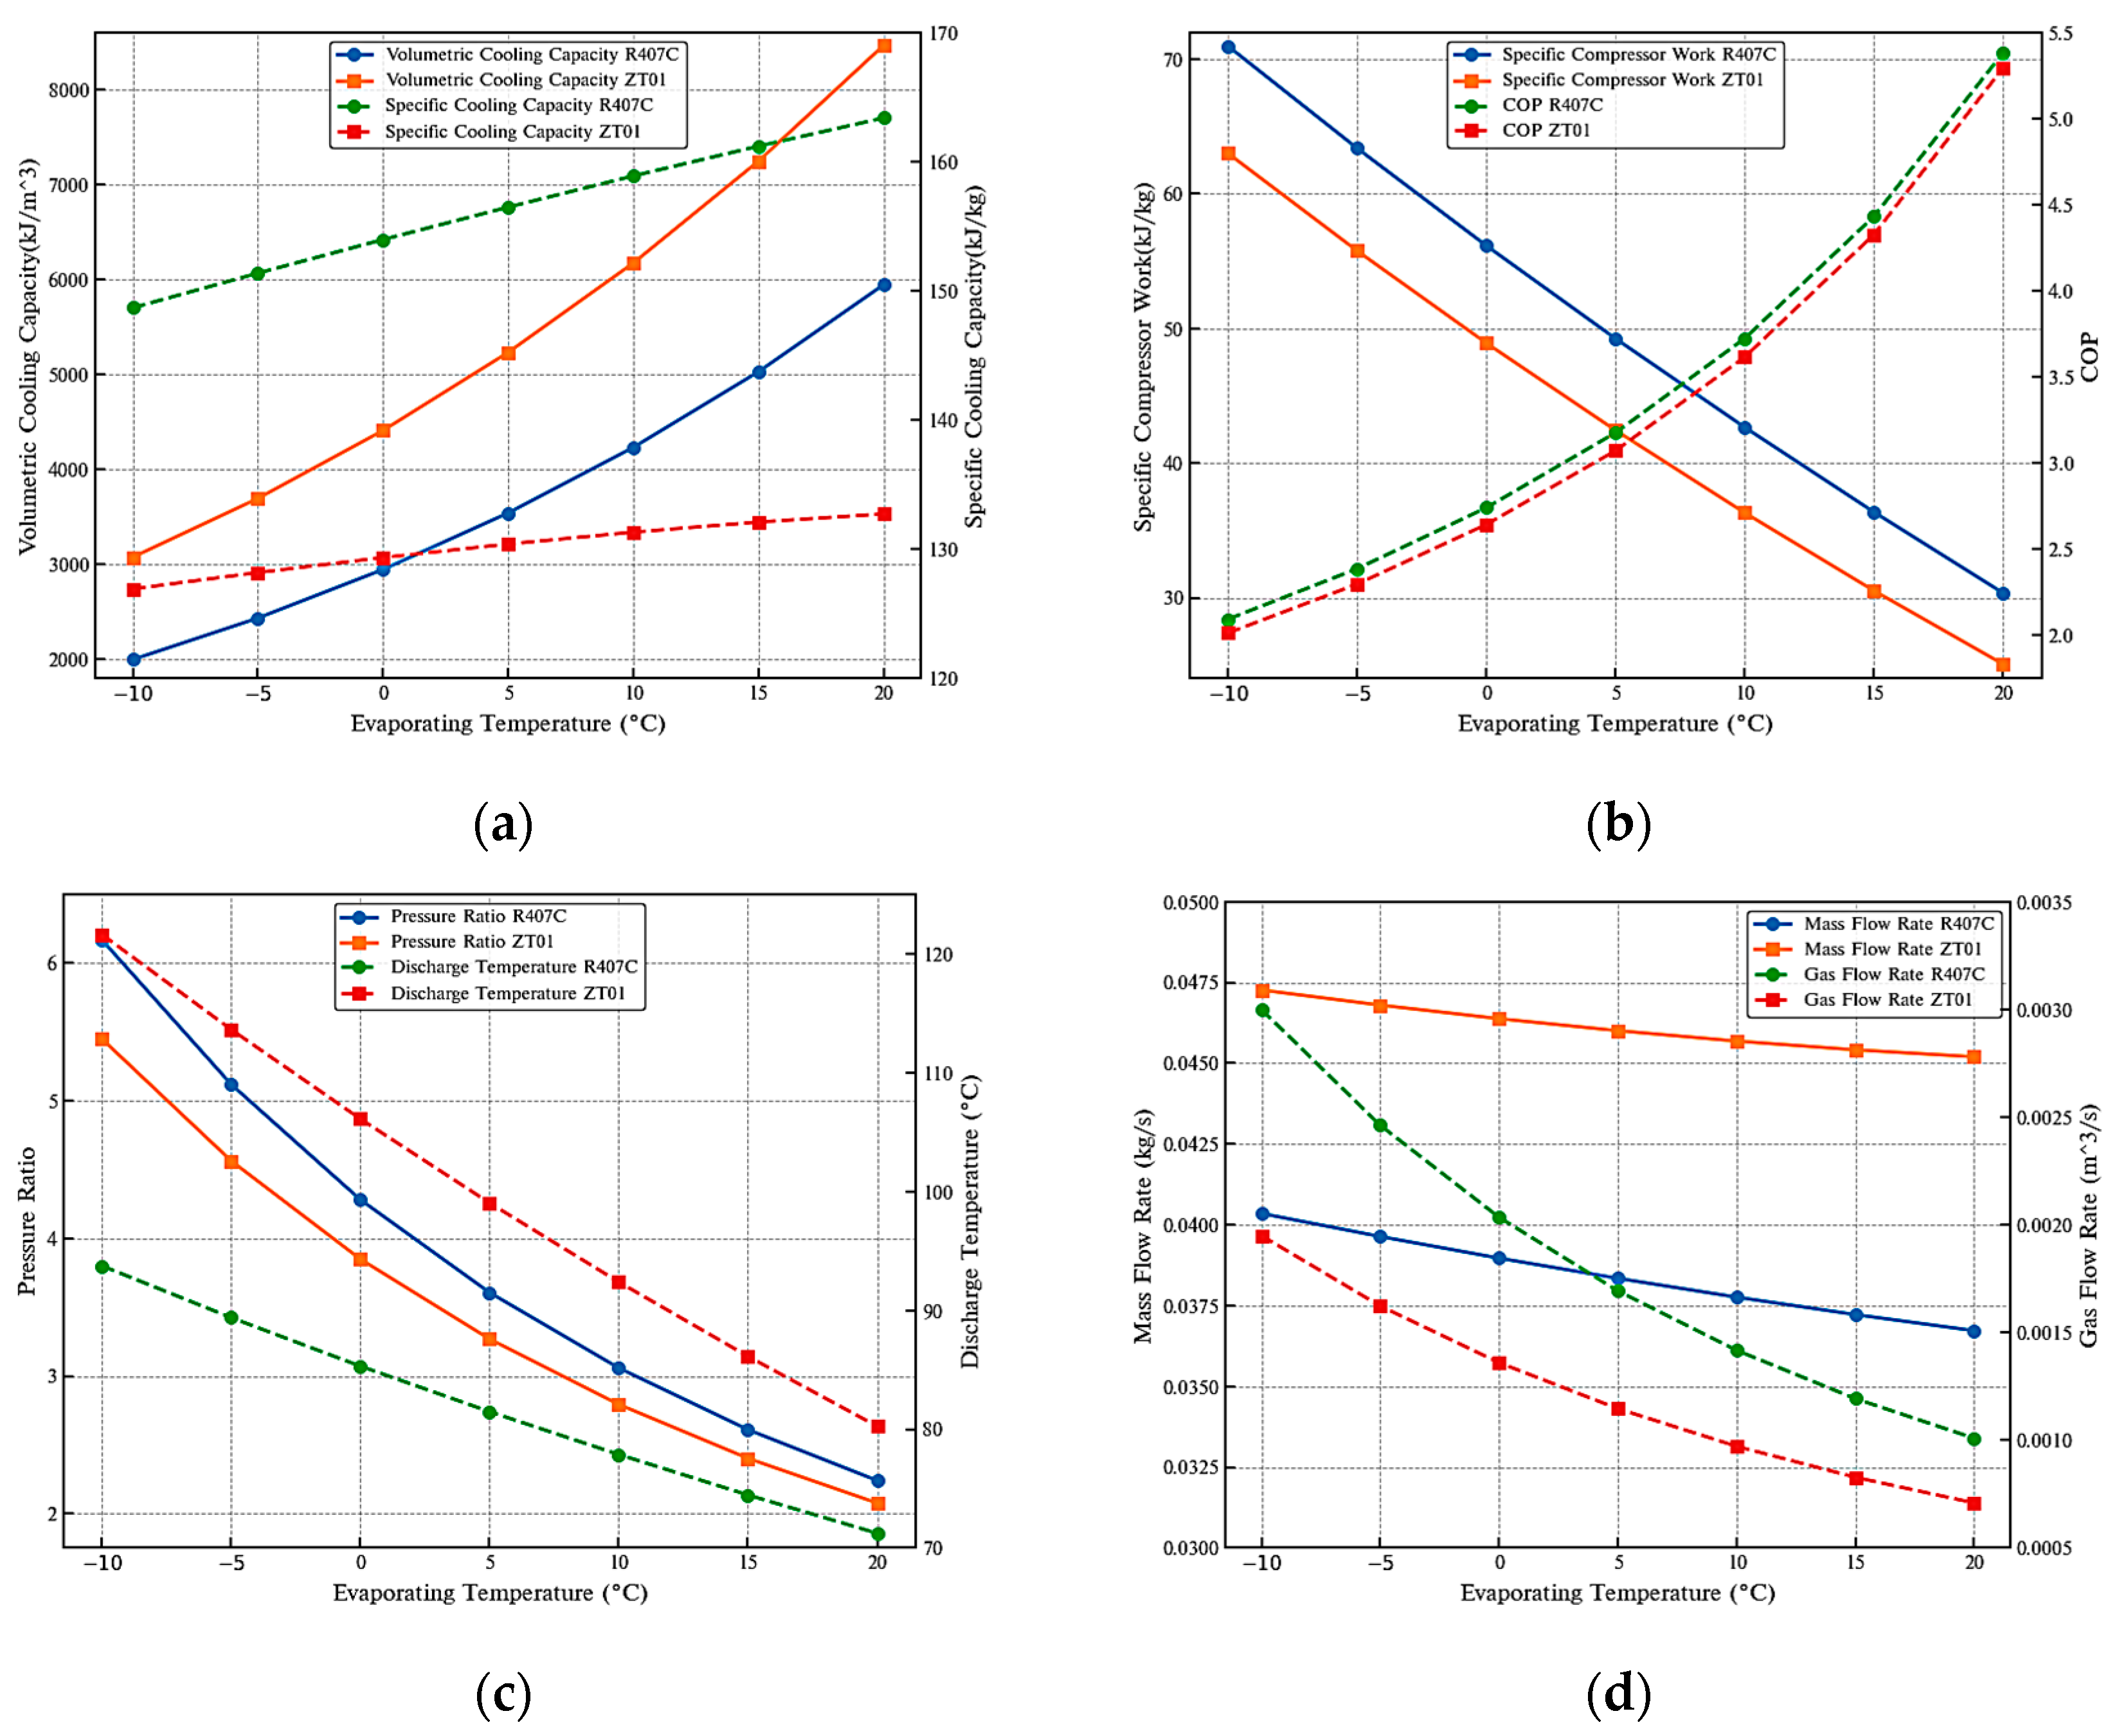
The calculation conditions were set with an evaporating temperature range of −10 °C to 20 °C in 5 °C increments, a condensing temperature of 45 °C, and both subcooling and superheat of 5 °C. Theoretical cycle calculations yield Figure 11, which depicts the effects of varying the evaporating temperature on volumetric cooling capacity, specific cooling capacity, specific compressor work, COP, pressure ratio, discharge temperature, mass flow rate, and gas flow rate.
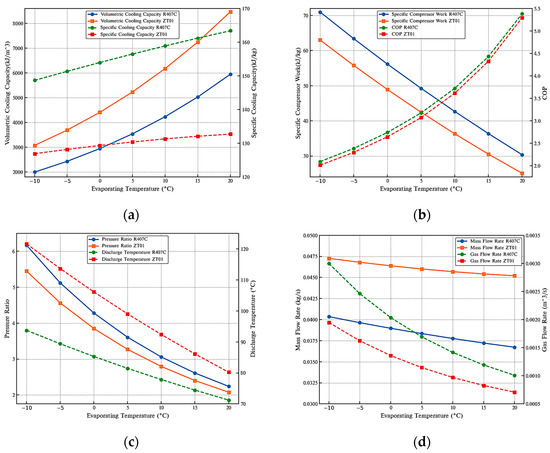
Figure 11.
The effect of evaporating temperature on the cycle performance of R407C and ZT01: (a) volumetric cooling capacity and specific cooling capacity; (b) specific compressor work and COP; (c) pressure ratio and discharge temperature; (d) mass flow rate and gas flow rate.
With increasing evaporating temperature, both volumetric cooling capacity and specific cooling capacity exhibit a clear and sustained upward trend. Across the investigated range, ZT01 delivers an average 47.87% improvement in volumetric cooling capacity relative to R407C, while its specific cooling capacity remains 16.67% lower. This performance profile indicates that, although ZT01 requires a greater mass flow rate to achieve the same cooling effect per unit mass, it can provide substantially higher total refrigeration output per unit of compressor displacement. Such an advantage in volumetric performance allows for more effective utilization of compressor capacity and may enable the selection of smaller, more cost-efficient compressors without compromising overall cooling output.
Analysis of mass flow characteristics further underscores ZT01’s volumetric advantage. Across the full evaporating temperature spectrum, ZT01 consistently achieves mass flow rates approximately 20% higher than those of R407C. Notably, despite this higher mass flow, ZT01 exhibits markedly lower gas volumetric flow rates—on average, about 35% less than R407C—reflecting its higher vapor density. This reduced volumetric demand on the compressor directly contributes to improved volumetric efficiency, lower suction volume requirements, and a reduction in specific compression work.
As the evaporating temperature increases, the COP rises while the specific compressor work decreases, reflecting both the thermodynamic benefits of reduced compression ratios and the improved enthalpy difference across the evaporator. Within this context, ZT01 demonstrates a 12.64–21.08% reduction in specific compressor work compared to R407C. Although ZT01’s lower specific cooling capacity translates into a marginally reduced COP, the difference remains within 4% across all tested conditions, indicating that the two refrigerants exhibit comparable overall energy efficiency.
The narrowing temperature difference between the evaporator and condenser at higher evaporating temperatures results in a decreasing pressure ratio and a reduction in discharge temperature for both refrigerants. ZT01 maintains a pressure ratio 7.88–13.20% lower than that of R407C, which enhances compressor mechanical efficiency, reduces operating stress, and can extend equipment service life. However, ZT01’s discharge temperature is, on average, 17.44 °C higher than that of R407C. While this temperature remains within the safe operating range for most commercial compressors, it may require attention to thermal management strategies—such as enhanced discharge-side cooling or optimized oil return design—to ensure long-term operational reliability under elevated-temperature conditions.
4.3. Variable Superheat Working Conditions
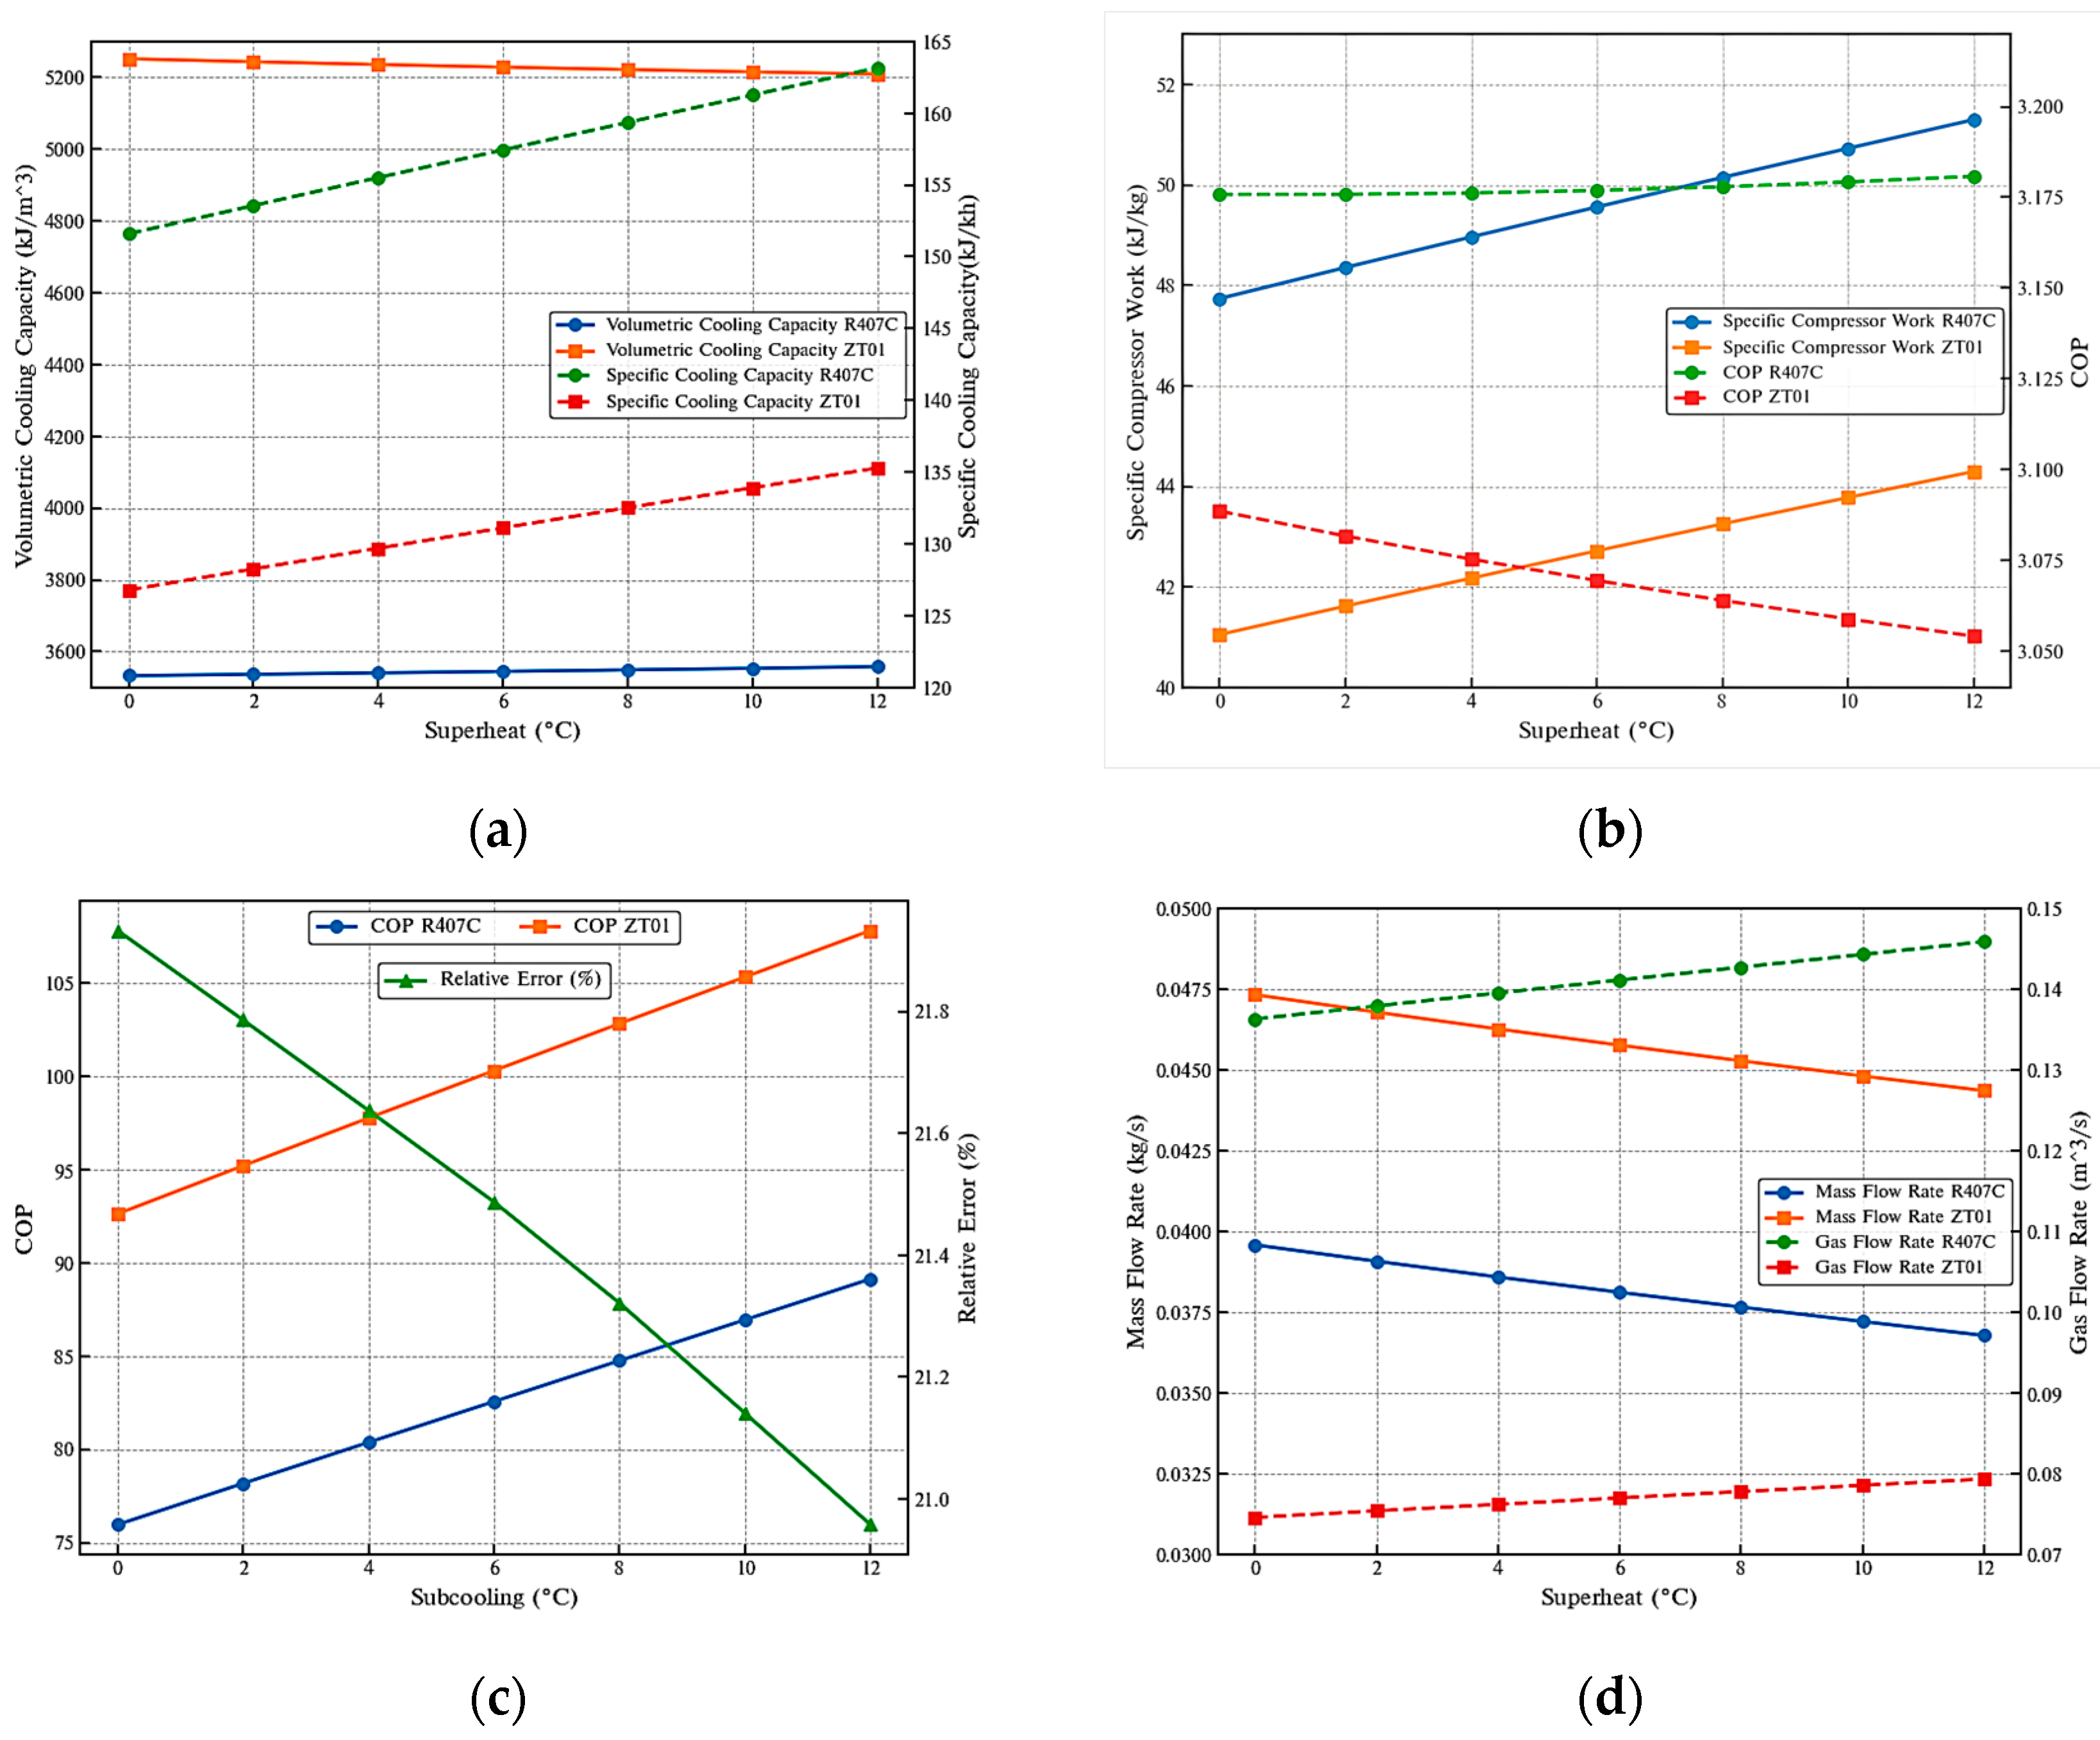
The calculation conditions were set with a superheat range of 0 °C to 12 °C in 2 °C increments, a condensing temperature of 45 °C, an evaporating temperature of 5 °C, and subcooling of 5 °C. Theoretical cycle calculations yield Figure 12, which depicts the effects of varying the superheat on volumetric cooling capacity, specific cooling capacity, specific compressor work, COP, pressure ratio, discharge temperature, mass flow rate, and gas flow rate.
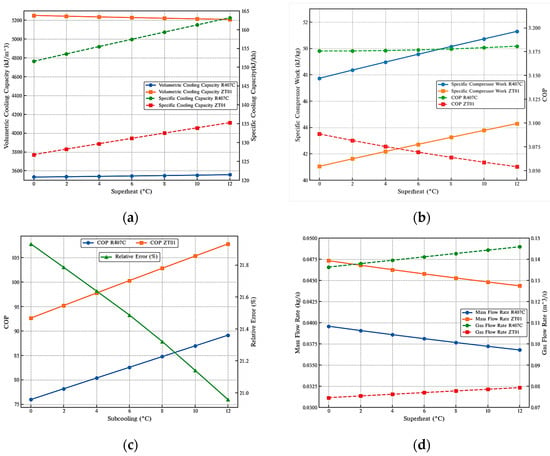
Figure 12.
The effect of superheat on the cycle performance of R407C and ZT01: (a) volumetric cooling capacity and specific cooling capacity; (b) specific compressor work and COP; (c) discharge temperature; (d) mass flow rate and gas flow rate.
The results indicate that the trends in cycle performance parameters for R407C and ZT01 under varying superheat are generally consistent. With increasing superheat, volumetric cooling capacity remains essentially constant, whereas specific cooling capacity, specific compressor work, discharge temperature, and gas flow rate all increase, while mass flow rate decreases. A key difference lies in COP behavior: for R407C, COP remains nearly unchanged across the superheat range, whereas for ZT01, COP shows a slight decline with increasing superheat.
In terms of volumetric cooling capacity, ZT01 maintains a significant advantage over R407C throughout the 0–12 °C superheat range, with an average increase of approximately 47.5%. This indicates that, for the same compressor displacement, ZT01 can deliver a higher cooling capacity. However, ZT01 exhibits a 15–17% lower specific cooling capacity compared to R407C, implying weaker cooling performance per unit mass flow. From a system design perspective, these characteristics suggest that ZT01 is more suitable for applications where compressor displacement is the limiting factor, whereas, in systems constrained by mass flow, its cooling efficiency may be somewhat restricted.
The specific compressor work for both refrigerants increases with superheat, with R407C consistently higher than ZT01 by approximately 13–20%. This demonstrates that, for equivalent cooling capacity, ZT01 requires lower compressor power input, contributing to reduced operating energy consumption. In terms of COP, R407C exhibits slightly higher values than ZT01, with differences remaining below 4% across the entire superheat range. The relatively small variation in COP with superheat indicates that superheat has a less pronounced effect on overall system efficiency compared to changes in condensing or evaporating temperature. Overall, ZT01 offers advantages in reducing compressor power consumption, although its slightly lower specific cooling capacity limits COP improvement. At a constant compression ratio, higher compressor suction temperatures lead to greater specific work. As superheat increases from 0 °C to 12 °C, the specific compressor work of R407C and ZT01 increases by 7.45% and 7.9%, respectively, with only minor differences between the two. While R407C’s higher specific cooling capacity contributes to a marginally higher COP, its specific compressor work remains consistently above that of ZT01.
Discharge temperature for both refrigerants rises with increasing superheat, with ZT01 maintaining an average discharge temperature approximately 17% higher than R407C. The relative difference is about 21%, decreasing slightly with superheat. Higher discharge temperatures can impose greater thermal loads on compressor valves, lubricating oil, and sealing components, potentially challenging long-term operational stability. Therefore, systems using ZT01 may require enhanced discharge-side cooling or optimized lubrication management to mitigate potential thermal failure risks. Nevertheless, the maximum discharge temperature of ZT01 remains below the widely accepted commercial compressor limit of 130 °C, ensuring safe operation under proper management.
Mass flow rate for both refrigerants declines as superheat increases, primarily due to the rise in suction specific volume, which reduces refrigerant mass intake at constant displacement. ZT01 consistently achieves mass flow rates 18–20% higher than R407C, largely due to its higher density characteristics. In contrast, R407C exhibits significantly higher gas flow rates, which gradually decline with increasing superheat. This suggests that, for the same displacement, ZT01’s higher mass flow partially offsets its lower specific cooling capacity. Furthermore, the lower gas flow rate helps reduce compressor volumetric load and improve volumetric efficiency.
4.4. Variable Subcooling Working Conditions
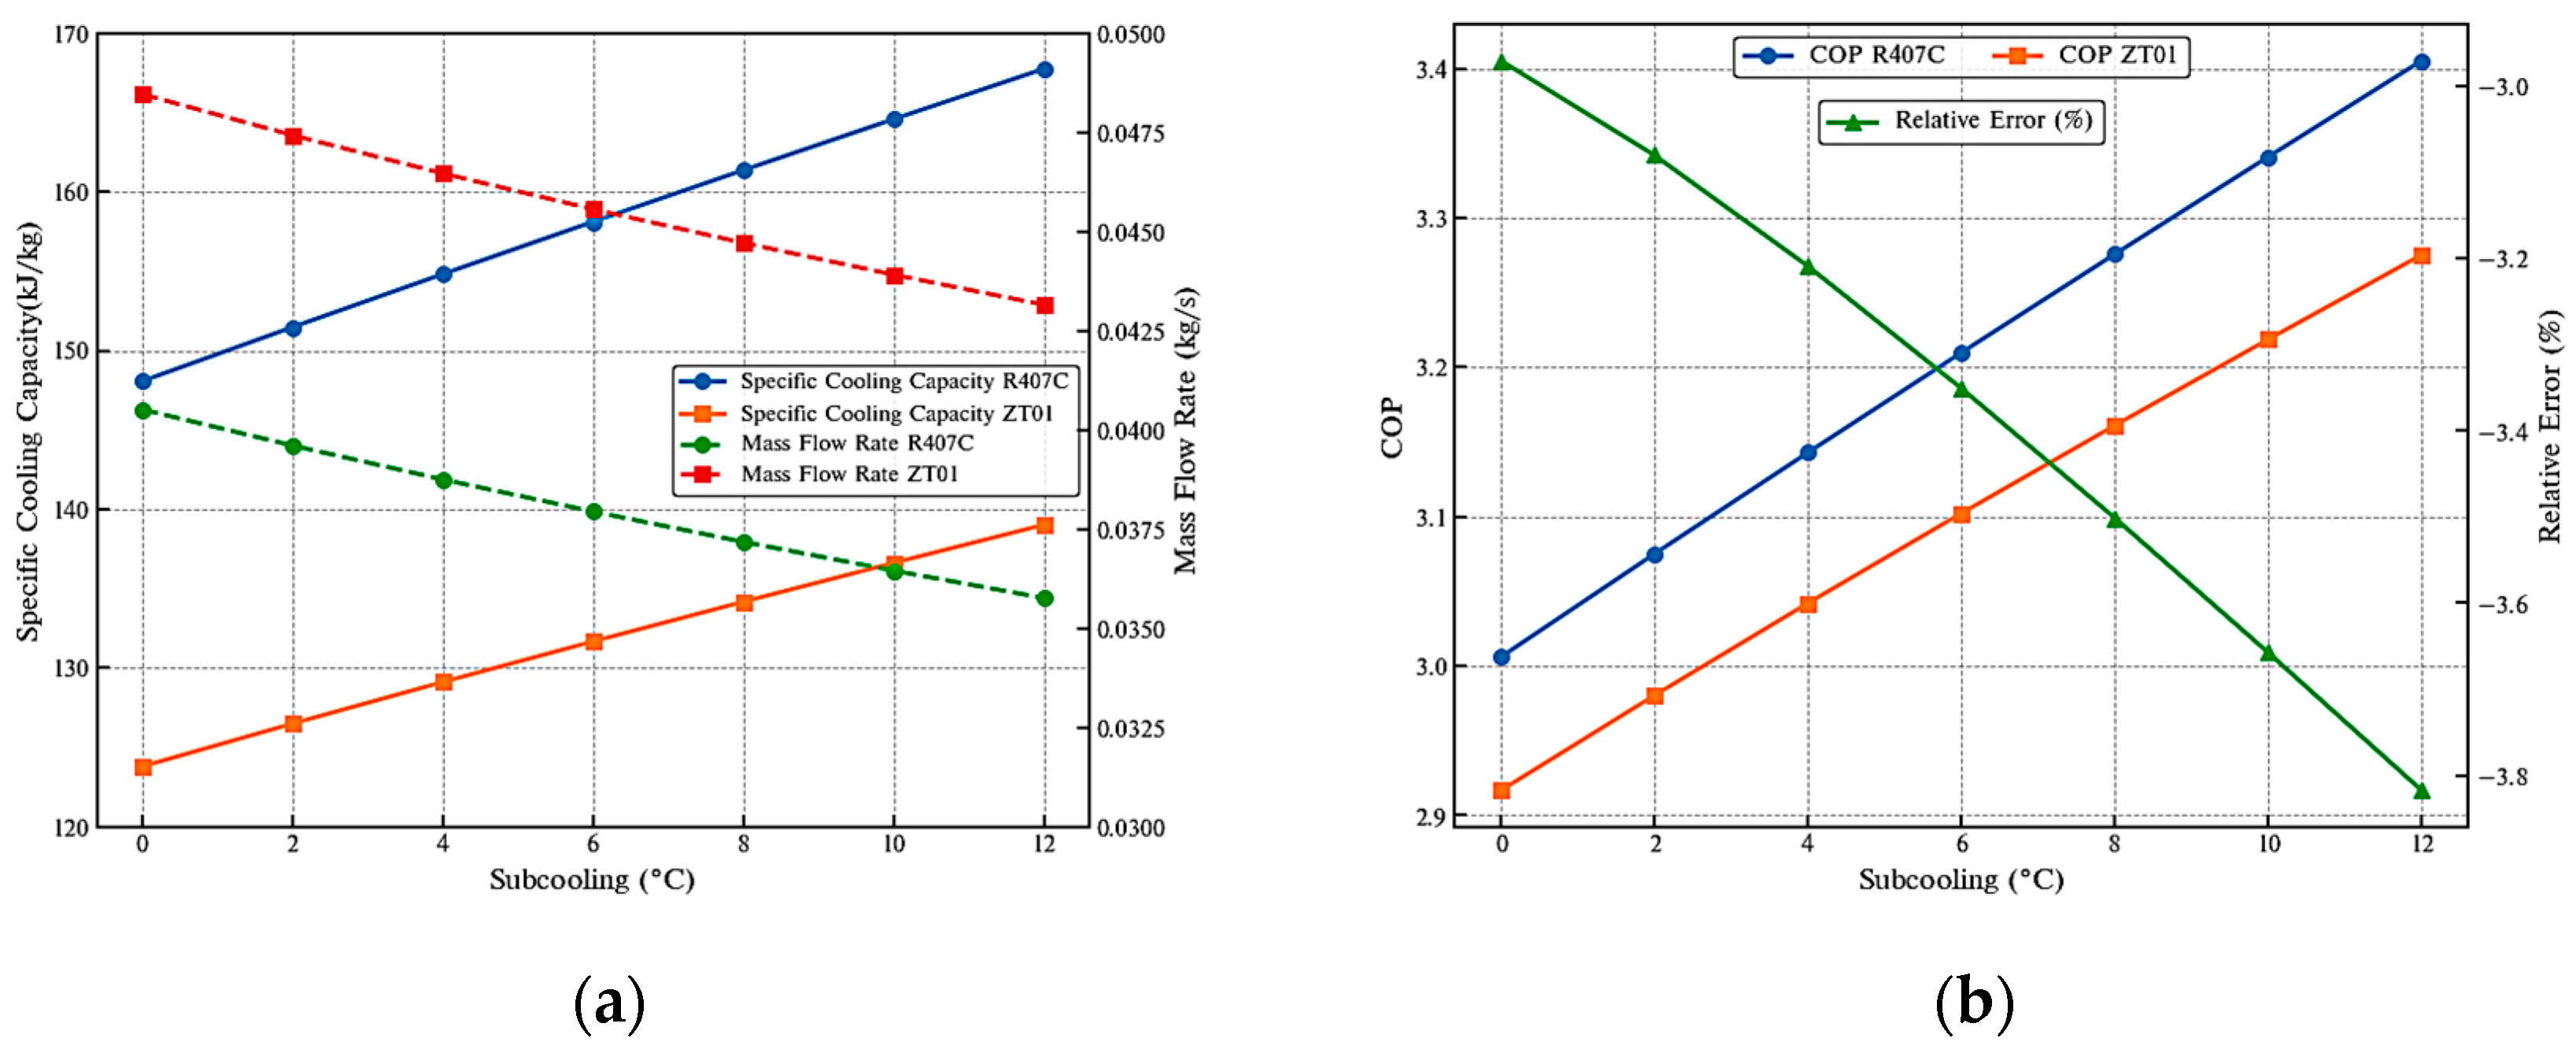
The calculation conditions were set with a subcooling range of 0 °C to 12 °C in 2 °C increments, a condensing temperature of 45 °C, an evaporating temperature of 5 °C, and superheating of 5 °C. Theoretical cycle calculations yield Figure 13, which depicts the effects of varying the superheat on volumetric cooling capacity, specific cooling capacity, COP, specific compressor work, pressure ratio, discharge temperature, mass flow rate, and gas flow rate.
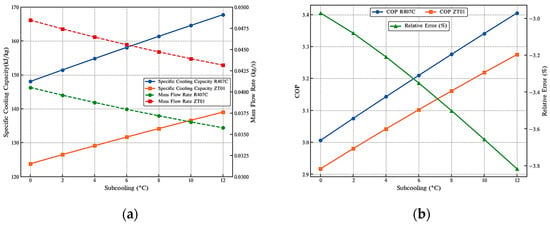
Figure 13.
The effect of subcooling on the cycle performance of R407C and ZT01: (a) specific cooling capacity and mass flow rate; (b) COP.
The subcooling increases from 0 °C to 12 °C, and the specific cooling capacity of both refrigerants exhibits a steady upward trend. This improvement is attributed to the reduction in refrigerant enthalpy prior to entering the evaporator, which enables greater heat absorption during the evaporation process and consequently enhances the cooling effect per unit mass. Across the entire subcooling range, R407C consistently demonstrates a 14–16% higher specific cooling capacity than ZT01, indicating superior cooling capability per unit mass flow. In contrast, ZT01 maintains a 16–20% higher mass flow rate than R407C over the same range. This difference primarily stems from ZT01’s higher density and lower specific volume under identical operating conditions, allowing a greater mass of refrigerant to be delivered at the same compressor displacement. From a system design perspective, R407C offers an advantage in specific cooling efficiency, whereas ZT01 can partially offset its lower specific cooling capacity by achieving higher mass flow rates, thereby sustaining substantial cooling output even when compressor displacement is limited.
Figure 13b illustrates the variation in COP with subcooling and the relative difference between the two refrigerants. As subcooling increases, the COP of both R407C and ZT01 rises, primarily due to the enhancement in specific cooling capacity while the specific compressor work remains nearly constant, leading to improved system energy efficiency. Across the entire subcooling range, the COP of R407C remains slightly higher than that of ZT01, with a gap of approximately 3–4%, and the relative difference decreases with increasing subcooling. This suggests that under high subcooling conditions, the energy efficiency of ZT01 approaches that of R407C, thereby narrowing their performance disparity. It is noteworthy that the magnitude of COP improvement is relatively modest, indicating that subcooling has a more pronounced effect on cooling capacity than on overall energy efficiency. Nevertheless, its role in reducing the performance gap between different refrigerants is non-negligible.
Overall, increasing subcooling simultaneously enhances the specific cooling capacity and COP of both R407C and ZT01. R407C maintains an advantage in cooling efficiency per unit mass, while ZT01 leverages its higher mass flow rate to boost total cooling output and narrows the COP gap with R407C under high subcooling conditions.
4.5. Life-Cycle Climate Performance (LCCP) Analysis
To further evaluate the feasibility of replacing R407C with ZT01 from an environmental perspective, this study introduces the Life-Cycle Climate Performance (LCCP) metric to quantify the total carbon emissions of the two refrigerants over the full service life of a rail vehicle air-conditioning system. LCCP accounts for both direct greenhouse-gas emissions from refrigerant leakage and indirect carbon emissions resulting from energy consumption during operation. The calculation formula is as follows:
where ED is direct emissions and EI is indirect emissions. Direct emissions are closely related to the refrigerant’s GWP, the charge amount, and the system leakage rate; indirect emissions depend primarily on the system’s energy consumption and the local electricity carbon-emission factor.
In this section, the analysis is based on the TTK7G-6.0GD air-conditioning unit, for which R407C has a rated charge of 1.6 kg, a rated cooling capacity of 6 kW, and a rated input power of 4 kW. Annual operating time is assumed to be 1500 h, with an average annual leakage rate of 15% [31] and a service life of 15 years. Theoretical calculations indicate that the ZT01 charge amount is approximately 1.9 kg. The calculation results are shown in Table 8.

Table 8.
LCCP of ZT01 and R407C.
The results show that ZT01’s direct emissions are 22.6% of those of R407C, a reduction of about 77.4%, so its low GWP substantially mitigates lifecycle leakage; because ZT01’s COP is about 4% lower, indirect emissions rise by roughly 4%, yet the large cut in direct emissions more than compensates, yielding an overall LCCP decrease of about 6.88%. Although the ZT01 charge is 1.9 kg versus 1.6 kg for R407C, this difference mainly reflects hold-up in the present rig rather than an intrinsic penalty, and vehicle-level safety will follow the applicable requirements for the selected safety class A1 or A2L, including charge-concentration limits and leak detection or ventilation when required by the operator or the standard. Charge can be minimized without changing system function by adopting lower hold-up heat exchangers such as microchannel designs, reducing receiver and liquid-line volumes, shortening piping, right-sizing the accumulator, and returning subcooling and superheat via the electronic expansion valve to the minimum stable settings; for new designs, the higher volumetric capacity of ZT01 enables smaller internal volumes and compressor displacement, which helps offset charge. Further optimization of the ZT01 system design and control could deliver even greater LCCP improvements.
It is worth noting that the LCCP assessment is sensitive to assumptions regarding the carbon emission factor of the electricity grid and the annual refrigerant leakage rate. A higher emission factor, as observed in coal-dominated grids, would increase indirect emissions and thus reduce the relative benefit of efficiency improvements. Conversely, cleaner grids with lower emission factors amplify the advantage of low-GWP refrigerants by lowering the indirect component of LCCP. Similarly, an increase in leakage rate would proportionally increase direct emissions, whereas improved maintenance practices and leak-tight system design could further enhance the environmental benefit of ZT01. These factors indicate that while absolute LCCP values may vary by region and operational conditions, the comparative advantage of ZT01 over R407C remains consistent.
5. Conclusions
This study addresses the environmental issues associated with the widespread use of the high-GWP refrigerant R407C in rail vehicle air-conditioning systems by proposing a novel refrigerant blend, ZT01 (R13I1/R32, 0.6/0.4), as an alternative. Through theoretical thermodynamic cycle analysis, the feasibility of applying ZT01 in rail vehicle air-conditioning systems was systematically evaluated. The main conclusions are as follows:
- (1)
- The thermodynamic performance of ZT01 meets the cooling requirements of rail vehicle air-conditioning. Compared with R407C, ZT01 delivers 45–49% higher volumetric cooling capacity, although its specific cooling capacity is 15–18% lower. Under equivalent cooling output, a smaller-displacement compressor can be used to reduce system cost. The COP of ZT01 differs by no more than 5% from that of R407C, demonstrating excellent energy-efficiency compatibility.
- (2)
- ZT01 exhibits superior operational characteristics. Across varying condensing and evaporating temperatures, ZT01 consistently delivers an 8–13% lower pressure ratio and a 13–21% lower specific work compared to R407C, thereby enhancing compressor volumetric efficiency and extending system lifespan. Although its discharge temperature is higher than that of R407C, it remains within the safe operating range of standard compressors, and thermal management can be achieved by optimizing the cooling and lubrication systems.
- (3)
- Under typical operating conditions, its GWP100 is only 308, far below R407C’s 1620. LCCP analysis indicates that ZT01 reduces direct greenhouse-gas emissions by approximately 77.4%. Although its slightly higher energy consumption yields a 4% increase in indirect emissions, the net effect is a 6.88% reduction in total LCCP compared with R407C. In the context of carbon-peak and carbon-neutrality goals, ZT01 thus presents a clear advantage.
- (4)
- ZT01 demonstrates practical engineering feasibility and strong substitution potential. Its environmental performance and safety characteristics meet the rail-transportation requirement for low-toxicity, non-flammable, low-GWP refrigerants, and are compatible with POE lubricants used in many R407C units; however, integration should follow a retrofit with a limited adjustments pathway rather than a drop-in claim, with oil miscibility/return verified in practice. This provides a reliable technical pathway for the green, low-carbon upgrade of rail vehicle air-conditioning systems. While ZT01 is classified as A1 under laboratory conditions, vehicle-level confined-space leakage behavior and interactions with other substances will be verified in forthcoming prototype and in-service trials, with results reported in a follow-up study.
- (5)
- For zeotropic blends such as ZT01 and R407C, long-term leaks influence performance through two coupled mechanisms: progressive charge loss reduces evaporator wetting, raises suction superheat, lowers suction density, and degrades capacity and COP; composition shift due to preferential loss of the more volatile component alters mixture properties, further reducing volumetric capacity and control stability until the nominal composition and charge are restored. Chronic undercharge can also narrow protection margins and increase cycling. To manage these risks in rail HVAC service, we recommend the following: fixed leak detection in equipment bays with periodic functional checks; trend monitoring of superheat, subcooling, capacity, and power to flag early undercharge; no top-off after a leak, but full recovery, evacuation and weigh-in recharge to the nominal composition and charge, followed by verification of expansion-device settings and superheat; timely replacement of filter-driers and adherence to deep-vacuum and dehydration practices; design-for-tightness measures that reduce joints and permeation, favor-brazed connections and minimized hold-up volumes in receivers and liquid lines; scheduled leak inspections during maintenance intervals; and documentation plus technician training specific to zeotropic blends. These steps limit performance drift, shorten downtime, and help preserve both energy efficiency and component integrity over the service life.
- (6)
- Based on the theoretical assessment, ZT01 is not a strict drop-in but a retrofit-ready candidate requiring limited adjustments. Given its differences from R407C in discharge temperature, mass flow, and pressure, implementation should include expansion-device retuning, updates to control and protection settings, charge determination and minimization, compressor-envelope verification, and vehicle-level safety conformity. We will conduct prototype and in-service trials following this process to confirm equivalence in performance, reliability, and safety. In addition, prior to fleet deployment, materials and lubricant compatibility should be verified (elastomers/seals, polymers, metals, desiccants) and POE miscibility and oil return confirmed; where a non-POE oil is installed, conversion to POE should follow standard procedures.
This study systematically analyzed the thermodynamic performance and cycle characteristics of R407C and the low-GWP mixture ZT01 under various operating conditions, and partially validated the theoretical model with experimental data. The results indicate that the model can reasonably capture the performance trends of the refrigerants. However, the experimental validation was conducted over a relatively limited range of operating conditions, which may not fully represent the complex scenarios encountered by rail vehicle air-conditioning systems under diverse climates and operational modes. Furthermore, the analysis primarily focused on steady-state conditions, without fully accounting for load fluctuations, part-load performance of components, and non-ideal heat and mass transfer effects during actual operation. In addition, key engineering issues such as the long-term stability of the mixture, composition glide, and lubricant compatibility remain insufficiently addressed.
Economic considerations: Beyond climate impact, the economic feasibility of an R407C→ZT01 retrofit depends on fleet- and region-specific drivers: (i) refrigerant price and required charge; (ii) conversion scope and outage cost (retuning controls/expansion device, possible seal/valve replacements, safety conformity items); (iii) electricity cost over the duty cycle given the observed small COP difference and local tariffs; (iv) maintenance and reliability effects associated with the lower pressure ratio (spares, labor, unplanned downtime); (v) carbon pricing/fees and phase-down-related price/availability risks for R407C; (vi) leak management and detection costs; (vii) end-of-life recovery/reclamation; and (viii) documentation and staff training. An economic advantage is expected when the present value of items (iii)–(viii) outweighs items (i)–(ii). For new designs, ZT01’s higher volumetric capacity can reduce compressor displacement and internal hold-up volumes, further improving lifecycle costs.
Future research should expand the scope of experimental validation to cover a wider range of operating conditions and environments; investigate the long-term property variations and system compatibility of ZT01; incorporate variable-condition experiments and dynamic simulations to evaluate performance stability under realistic operation; explore optimized compressor, heat exchanger, and control strategies tailored to ZT01; and conduct full life-cycle environmental and economic assessments. In addition, it will be essential to validate ZT01 under real rail vehicle operating conditions, where complex thermal environments, varying passenger loads, and dynamic duty cycles may influence refrigerant behavior. Long-term stability tests should also be carried out to evaluate potential composition changes, lubricant compatibility, and material interactions during extended operation. Such efforts will provide more comprehensive and reliable technical support for the adoption of low-GWP refrigerants in rail vehicle air-conditioning systems.
In summary, ZT01 is a low-GWP refrigerant mixture that balances thermodynamic performance, environmental friendliness, and system compatibility. It demonstrates both technical feasibility and environmental superiority for replacing R407C in rail vehicle air-conditioning applications, and offers strong prospects for engineering deployment.
6. Safety Clarification
“Non-flammable” denotes an A1 classification under standardized laboratory tests and does not guarantee safety in confined railway environments. Vehicle-level safety must be demonstrated by scenario-based assessment and testing. Method summary: HAZID (Hazard Identification) is an early, scenario-driven review in which a multidisciplinary team lists credible leak/ignition scenarios, initiating events, consequences, existing safeguards, and a preliminary risk ranking (likelihood × severity), defining actions and test needs. HAZOP (Hazard and Operability Study) is a structured, node-by-node review that applies guidewords (e.g., No/More/Less/Reverse/Other than) to key parameters (flow, pressure, temperature, concentration) to identify deviations, analyze causes and consequences, confirm safeguards, and assign recommendations. These methods will be applied alongside confined-space dispersion testing and code-conformity checks to verify ZT01 safety for rail applications.
Author Contributions
Conceptualization, C.L.; Methodology, Y.Z.; Validation, Y.Z.; Formal analysis, Y.Z.; Investigation, Y.Z. and C.L.; Resources, C.S.; Data curation, C.L.; Writing—original draft, Y.Z.; Writing—review & editing, J.Z. and X.C.; Visualization, Y.Z.; Supervision, C.S. and J.Z. All authors have read and agreed to the published version of the manuscript.
Funding
This research received no external funding.
Data Availability Statement
The original contributions presented in this study are included in the article. Further inquiries can be directed to the corresponding author.
Conflicts of Interest
The authors declare no conflict of interest.
Nomenclatures
The following nomenclatures are used in this manuscript:
| Nomenclatures | |
| pk | Condenser pressure |
| p0 | Evaporating pressure |
| ε | Pressure ratio |
| q0 | Specific cooling capacity |
| qv | Volumetric refrigeration capacity |
| w | Specific power consumption of compressor |
| ηk | Compressor isentropic efficiency |
| qm | Refrigerant mass flow rate |
| Q0 | Cooling capacity |
| Abbreviations | |
| GWP | Global Warming Potential |
| COP | Coefficient of Performance |
| LCCP | Life Cycle Climate Performance |
| HVAC | Heating Ventilation Air Conditioning |
| HFC | Hydrofluorocarbon |
| ODP | Ozone Depletion Potential |
References
- Khan, A.; Alkhatib, A.; Pfeiffer, T.; Bradshaw, C.R. Hot gas bypass, economized, compressor load stand development and experimental data collection for flammable, low-GWP refrigerants. Int. J. Refrig. 2025, 179, 342–358. [Google Scholar] [CrossRef]
- Shi, W.J.; Li, C.L.; Zhang, J.J.; Chen, J.L.; Xu, J.; Hui, Y.; Li, Q.Z. Research Status and Trends of Standards for Refrigerant Mixtures. Refrig. Air Cond. 2020, 20, 6–9. [Google Scholar]
- Zhang, C.; Wang, R.; Gao, Y.; Liu, L.; Chen, J. Exploration of Industry Development Path in the New Era through the Refrigerant Substitution Process. Refrig. Air Cond. 2023, 23, 1–10, 15. [Google Scholar]
- Öztürk, Ş.T.; Toprak, Z.F. The Success of the Kyoto Protocol in Reducing Carbon Emissions in the EU. Int. J. Glob. Warm. 2025, 36, 53–66. [Google Scholar] [CrossRef]
- Skea, J. Roadmap 2050: A Practical Guide to a Prosperous, Low-Carbon Europe. Environ. Innov. Soc. Transit. 2012, 4, 367–368. [Google Scholar]
- Ministry of Transport of the People’s Republic of China. 2024 Statistical Bulletin on Transportation Industry Development; Ministry of Transport of the People’s Republic of China: Beijing, China, 2025.
- Li, C. Application Study of Low-GWP Refrigerants in Rail Vehicle Air-Conditioning Systems. Ph.D. Dissertation, South China University of Technology, Guangzhou, China, 2018. [Google Scholar]
- UNEP. 1994 Report of the Refrigeration, Air Conditioning and Heat Pumps Technical Options Committee; United Nations Environment Programme: Nairobi, Kenya, 1995. [Google Scholar]
- Zhong, S.Y.; Yang, Z.J.; Wang, W.J.; Zhang, J.; Di, S.Q.; Wang, X.P. A Preparation Method of Trifluoroiodomethane. China Patent CN115181004A, 14 October 2022. [Google Scholar]
- Dong, L.; Qing, F.Y.; Zhang, C.P.; Jia, X.Q.; Quan, H.D. Near-Azeotropic Mixture of Trifluoroiodomethane and Octafluorobutylene, Preparation Method and Applications. China Patent CN113214794B, 8 July 2022. [Google Scholar]
- Yan, H.; Feng, C.H.; Chen, W.S.; Ren, L.H.; Gao, H.S.; Kong, X.M. Progress in Synthesis of CF3I, a Novel PFAS Replacement Gas Fire Suppressant. J. Civ. Aviat. Univ. China 2024, 42, 13–18. [Google Scholar]
- Duan, Y.Y.; Zhu, M.S.; Han, L.Z. Experimental Vapor Pressure Data and a Vapor Pressure Equation for Trifluoroiodomethane (CF3I). Fluid Phase Equilibria 1996, 121, 227–234. [Google Scholar] [CrossRef]
- Duan, Y.Y. Thermophysical Properties of Trifluoroiodomethane (CF3I). J. Tsinghua Univ. 2009, 40, 60–63. [Google Scholar]
- Wang, H.X.; Zhang, Y.; Zheng, C.M.; Ma, L.M. Theoretical Cycle Analysis of Trifluoroiodomethane as a Refrigerant for Refrigerators. Trans. Chin. Soc. Refrig. 2005, 1, 33–37. [Google Scholar]
- Chabot, A.; Mathieu-Potvin, F. Numerical Analysis of Heat Pumps: Selection of the Best Fluids for Maximizing the Coefficient of Performance. Int. J. Refrig. 2020, 112, 281–302. [Google Scholar] [CrossRef]
- Sun, E.Y.; Li, Z.M.; Gong, M.Q.; Wu, J.F. Experimental Study on Flame Retardancy of Fully Halogenated Hydrocarbons CF3I and CF4. Cryog. Eng. 2011, 2, 13–18. [Google Scholar]
- Wu, Y.Z.; Ou, Z.; Guan, H.; Zhu, X.; Yang, Z.; Xu, S. Flammability Limits of Theoretical Azeotropic Mixtures Consisting of R1243zf, RE170 and Flame Retardants (R13I1, R134a, or R227ea). Int. J. Refrig. 2024, 159, 208–217. [Google Scholar] [CrossRef]
- Ye, M.J. Theoretical Cycle Performance Study of Three Refrigerant Mixtures as Alternatives to R134a for Automotive Air Conditioning. Master’s Thesis, Nanchang University, Nanchang, China, 2017. [Google Scholar]
- Zhang, N.; Dai, Y.; Feng, L.; Li, B. Study on Environmentally Friendly Refrigerant R13I1/R152a as an Alternative for R134a in Automotive Air Conditioning Systems. Chin. J. Chem. Eng. 2022, 44, 292–299. [Google Scholar] [CrossRef]
- Mao, C.Z.; Jiang, Q.; Wang, F.; Chen, W.; Ni, H. Progress in the Synthesis and Application of Trifluoroiodomethane. Fine Chem. Intermed. 2022, 52, 18–25. [Google Scholar] [CrossRef]
- Wu, Y.Z. Principles and Equipment of Refrigeration; Xi’an Jiaotong University Press: Xi’an, China, 2015; Volume 59. [Google Scholar]
- TB/T 1804-2009; Rail-Car Air-Conditioning Units. Ministry of Railways: Beijing, China, 2010.
- Xu, Y.; Fang, J.; Zhang, H.; Song, S.; Tong, L.; Peng, B.; Yang, F. Experimental investigation on the output performance of a micro compressed air energy storage system based on a scroll expander. Renew. Energy 2025, 243, 122602. [Google Scholar] [CrossRef]
- Jiang, X.X. Performance optimization of R290/R1233zd(E) in variable-temperature heat source ejector refrigeration cycle. HVAC 2024, 54, 101–109. [Google Scholar] [CrossRef]
- Mao, X.D.; Zhang, H.; Li, S.S.; Wen, Y.L. Study on the influence of refrigerant charge on aircraft vapor-compression refrigeration cycle. J. Air Force Eng. Univ. 2025, 26, 30–39. [Google Scholar]
- GB/T 7778-2017; National Refrigeration and Air-Conditioning Equipment Standardization Technical Committee (SAC/TC 238). Refrigerant Numbering System and Safety Classification. China Standards Press: Beijing, China, 2017.
- ANSI/ASHRAE Standard 15-2022; Safety Standard for Refrigeration Systems. American Society of Heating. Refrigerating and Air-Conditioning Engineers (ASHRAE): Atlanta, GA, USA, 2022.
- ISO 5149; (Parts 1–4): Refrigerating Systems and Heat Pumps—Safety and Environmental Requirements. International Organization for Standardization: Geneva, Switzerland, 2014–2022.
- EN 378; (Parts 1–4): Refrigerating Systems and Heat Pumps—Safety and Environmental Requirements. European Committee for Standardization (CEN): Brussels, Belgium, 2016; Amendment A1: 2020.
- Yang, J.L.; Zhang, K.Y. Performance Study of CO2/R1270 Mixture Heat Pump System for Electric Vehicles. Fluid Mach. 2025, 53, 89–96. [Google Scholar]
- Wang, Y.; Mi, H.; Xu, H.; Zang, J.; Wang, H. Carbon Emission Assessment and Economic Analysis of Refrigerant Recovery and Regeneration. J. Refrig. 2021, 42, 48–55. [Google Scholar]
Disclaimer/Publisher’s Note: The statements, opinions and data contained in all publications are solely those of the individual author(s) and contributor(s) and not of MDPI and/or the editor(s). MDPI and/or the editor(s) disclaim responsibility for any injury to people or property resulting from any ideas, methods, instructions or products referred to in the content. |
© 2025 by the authors. Licensee MDPI, Basel, Switzerland. This article is an open access article distributed under the terms and conditions of the Creative Commons Attribution (CC BY) license (https://creativecommons.org/licenses/by/4.0/).

