Article

Toward Sustainable Urban Transport: Integrating Solar Energy into an Andean Tram Route

by
Mayra-Gabriela Rivas-Villa
1,*,
Carlos Flores-Vázquez
2,3,
Manuel Álvarez-Vera
1,3 and
Juan-Carlos Cobos-Torres
1,3,*
1
Unidad Académica de Ingeniería, Industria y Construcción, Universidad Católica de Cuenca, Cuenca 010101, Ecuador
2
Unidad Académica de Informática, Ciencias de la Computación, e Innovación Tecnológica, Universidad Católica de Cuenca, Cuenca 010101, Ecuador
3
Unidad Académica de Posgrado, Universidad Católica de Cuenca, Cuenca 010101, Ecuador
*
Authors to whom correspondence should be addressed.
Energies 2025, 18(19), 5143; https://doi.org/10.3390/en18195143
Submission received: 6 August 2025 / Revised: 15 September 2025 / Accepted: 25 September 2025 / Published: 27 September 2025
(This article belongs to the Special Issue Solar Energy, Governance and CO2 Emissions)

Abstract

Climate change has prompted the adoption of sustainable measures to reduce greenhouse gas (GHG) emissions, particularly in urban transportation. The integration of renewable energy sources, such as solar energy, offers a promising strategy to enhance sustainability in urban transit systems. This study assessed solar irradiation along the tram route in Cuenca—an Andean city characterized by distinctive topographic and climatic conditions—with the aim of evaluating the technical feasibility of integrating solar energy into the tram infrastructure. A descriptive, applicative, and longitudinal approach was adopted. Solar irradiation was monitored using a system composed of a fixed station and a mobile station, the latter installed on a tram vehicle. Readings carried out over fourteen months facilitated the analysis of seasonal and spatial variability of the available solar resource. The fixed station recorded average irradiation values ranging from 3.80 to 4.61 kWh/m2·day, while the mobile station reported values between 2.60 and 3.41 kWh/m2·day, revealing losses due to urban shading, with reductions ranging from 14.7% to 18.8% compared to fixed-site values. It was estimated that a fixed photovoltaic system of up to 1.068 MWp could be installed at the tram maintenance depot using 580 Wp panels, with the capacity to supply approximately 81% of the annual electricity demand of the tram system. Complementary solar installations at tram stops, stations, and other related infrastructure are also proposed. The results demonstrate the technical feasibility of integrating solar energy—through fixed and mobile systems—into the tram infrastructure of Cuenca. This approach provides a scalable model for energy planning in urban transport systems in Andean contexts or other regions with similar characteristics.

1. Introduction

Global energy demand is expected to rise 50% by 2050 (IEA), driven by economic and technological growth, and electricity use projected to grow 4% annually until 2027, mainly due to electric vehicles and data centers [1,2]. At present, over 80% of the global energy supply is sourced from fossil fuels, contributing significantly to climate change. Global environmental challenges, coupled with the continuous growth in energy demand, have elevated the development of renewable energy sources to a strategic priority, highlighting the urgent need to explore innovative and sustainable methods of electricity generation [3]. Renewable sources, such as solar and wind energy, provide viable alternatives to reduce dependence on fossil fuels and mitigate climate change [4]. Their emissions are much lower (20 to 70 gCO2/kWh) compared to coal (800 to 1000 gCO2/kWh) whereas water use is minimal, though concentrated solar energy plants may require up to 3.5 m3/MWh [5]. In this context, solar energy represents an inexhaustible renewable resource, which has been demonstrated to be environmentally sustainable in terms of electricity generation [6,7]. Several studies suggest that photovoltaic energy systems will play a key role in electricity generation in the future [5,8]. In recent decades, solar energy generation has experienced significant growth relative to other renewable energy sources, driven by declining costs, technological advancements, and enhanced efficiency.
For instance, the efficiency of photovoltaic (PV) cells has been shown to reach up to approximately 34.1% in multi-junction PV cells, representing a significant advancement in the conversion of solar energy into electricity [9,10]. China, the world leader in PV panel production, has significantly expanded its use of renewable energy, increasing installed capacity to 1889 GW in 2024, which represents 56% of its total electricity generation capacity [11,12,13,14]. Brazil expanded its solar capacity from 2 GW in 2018 to 55 GW in 2024, making it the country’s second-largest source of electricity, with renewables accounting for 88.2% of its mix, mainly hydropower [15,16]. Photovoltaic technology continues to advance in durability, with current developments aiming for a lifespan of up to 50 years and an annual degradation rate as low as 0.2%. These improvements significantly enhance both system reliability and return on investment [17]. To maximize solar energy capture, the tilt angle and orientation of photovoltaic modules—comprising solar cells—are adjusted according to geolocation, thereby optimizing performance based on site-specific conditions [18].
In this context, the transition toward a sustainable society involves the adoption of electric mobility as a key strategy for reducing environmental impact [19,20]. However, integrating photovoltaic energy into electric mobility systems poses several challenges, such as limited roof space on vehicles, incident irradiance, and urban shading, all of which affect electricity generation and vehicle range [21]. For instance, Mexico, with a high solar potential of 5 kWh/m2/day, could take advantage of parking areas—which account for 6.6% of urban land—to generate 36.4 MWp and 66.2 GWh annually, achieving a 50% return over 25 years [22,23]. Furthermore, recent studies demonstrate that integrating photovoltaic energy into electric mobility reduces grid electricity consumption by 30% and decreases the cost per kWh by 35% [24]. Moreover, implementing electric vehicles in public transport worldwide accelerates the advancement of clean technologies. For instance, a proposed tram system incorporating renewable energy, supercapacitors, and batteries achieves a reduction of 8445.4 tCO2 per MWh by producing 867.62 MWh annually [25].
Various initiatives related to photovoltaic energy harvesting in electric vehicles are being evaluated worldwide. In Lisbon, Portugal, Centeno assessed the electricity output of mobile photovoltaic panels on an electric vehicle, finding that solar radiation losses reached up to 25% on highways and over 50% in urban areas. Despite these losses, the experiment proved viable, as the solar vehicle range increased by 10 to 18 km/day/kWp, thereby reducing its dependence on grid charging [26]. Similarly, in Cologne (Germany), the StreetScooter Work L—equipped with 930 Wp of integrated PV panels—was modeled under an 8-year operational lifespan with an assumed 30% shading factor. The life cycle assessment calculated an emission factor of 0.357 kg CO2-eq per kWh of onboard solar electricity, compared to 0.435 kg CO2-eq per kWh when charging from the grid, thus confirming the environmental benefits of Vehicle-Integrated Photovoltaics under these conditions [27]. Similarly, the system proposed by Bondu et al. [28] used a SEPIC converter integrated with Maximum Power Point Tracking (MPPT) to enhance the battery state of charge in an electric vehicle. In this setup, MPPT allows the battery state of charge to increase from 50% to 50.042%. Furthermore, photovoltaic systems in electric trains incorporate advanced technologies such as Luo Boost converters and Proportional-Integral (PI) controllers, validated through MATLAB simulations, to optimize voltage regulation. These systems operate on solar energy during the day and rely on grid power at night [29]. Likewise, tests performed on an electric vehicle integrated with a 350 W photovoltaic panel and a charge equalization system revealed a 27.9% increase in efficiency, resulting in an extended driving range of 14.35 km [30]. In another study, a hybrid system combining photovoltaic (535 W) and wind (135 W/s) power was installed into a Chok S2 electric vehicle, along with a charge equalization system to optimize five batteries. Tests conducted over a 17-km route showed a 20% improvement in vehicle efficiency, highlighting the potential of hybrid systems to enhance the range of electric vehicles [31].
Ecuador has a high potential for solar energy generation, particularly in urban areas such as Cuenca, due to its geographic location, which provides significant solar irradiation throughout the year [32]. In 2024, Cuenca inaugurated its first solar thermal plant at the Nutri company, with 58 panels producing 9000 L of hot water at 60 °C, helping reduce fossil fuel use and emissions [33]. Regarding electric urban transport, the Cuenca Tram, operational since May 2020, covers 10.7 km with 27 stations and operates using electricity sourced from hydroelectric power [34], complemented by electric buses such as the BYD models, which provide tourist and public transportation services with a range of 304 km and a battery capacity of 276.5 kWh [35]. Recent studies have assessed the feasibility of integrating photovoltaic systems into the electric urban transport network of Cuenca, indicating that solar energy could supply between 97% and 127% of the energy demand of electric buses, depending on the technology employed [36].
Building on previous research, this study assesses the solar irradiation index along the tram route in Cuenca—an Andean city—and aims to quantify solar irradiation throughout the route using a monitoring station installed on one of the tram units (mobile station), thereby facilitating the creation of detailed solar irradiation maps. A comparative methodology was applied to analyze the solar irradiation data collected from a fixed monitoring station alongside the data gathered by the mobile station. This article is structured as follows: Section 2 describes the methodology used, Section 3 presents the results obtained, and Section 4 provides a discussion of these results, and Section 5 presents the conclusions and main contributions of the study. This research aims to provide key information on the feasibility of integrating photovoltaic technology within urban transportation systems, taking into account the impact of shading from surrounding buildings on electricity generation efficiency.

2. Materials and Methods

2.1. Solar Irradiation Measuring System

Solar energy monitoring along the Cuenca tram route was conducted over a four-teen-month period, from November 2023 to December 2024. This duration allowed capturing the full seasonal variability, including both the dry and rainy seasons, ensuring a comprehensive assessment of solar irradiance patterns. Data were collected continuously using a mobile station and a fixed station, validated against reference pyranometers, and processed to account for minor data gaps.
Figure 1 illustrates the proposed system for measuring solar irradiation, comprising two operational configurations: a fixed station installed at the Academic Unit of Postgraduate Studies and a mobile station mounted on a tram unit. The architecture of the stations was designed to optimize electrical distribution and signal management, aiming at minimizing electromagnetic interference and ensuring robust, continuous operation under variable conditions.

2.1.1. Structures

Fixed Station
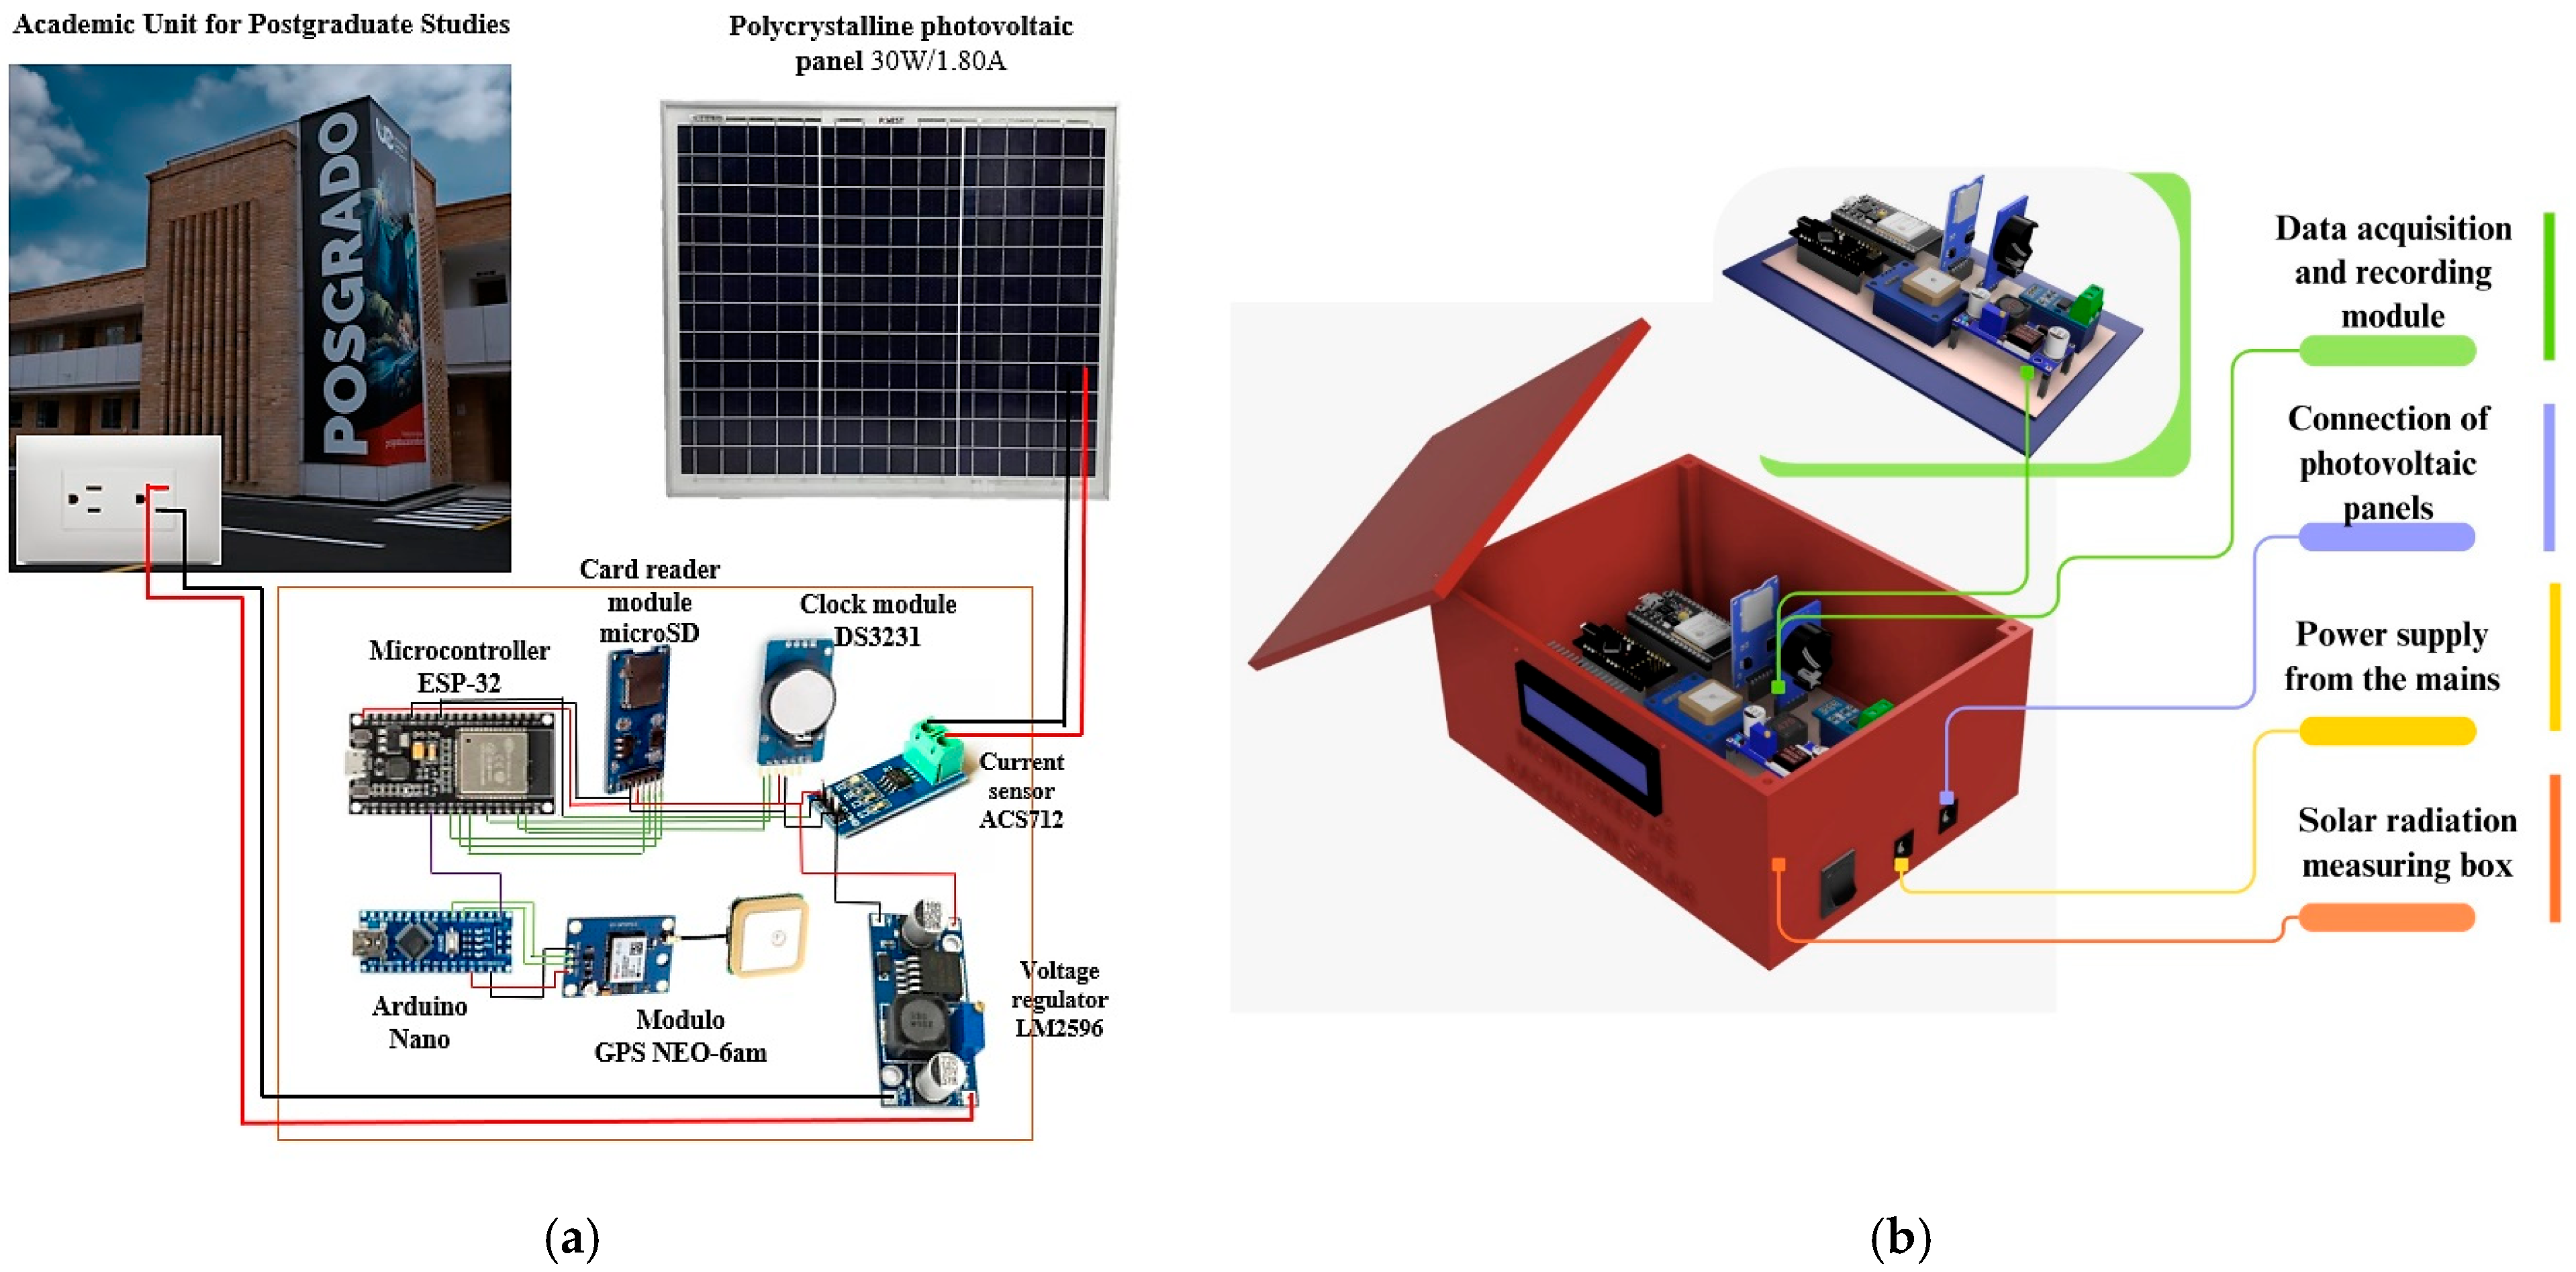
The fixed solar irradiance measuring station shared functional characteristics with the mobile unit; however, its primary role was data control and collection. Being installed at a stationary site with access to grid electricity, it did not require an autonomous power supply system, as illustrated in (Figure 2a).
A three-dimensional structure was developed to securely mount the sensors and electronic components, ensuring stability and resistance to vibrations that could affect measurement accuracy. The structure was modeled using Fusion 360 software (version 2604.0.316) (Figure 2b) and subsequently installed at the Academic Unit of Postgraduate Studies.
Mobile Station
The metallic structure of the mobile monitoring system, shown in Figure 3a, included an autonomous power supply module consisting of a solar panel, batteries, and a charge controller. Although the tram was equipped with its own power supply, operational protocols restricted the connection of external devices to its internal electrical system. To address this constraint, a standalone photovoltaic solution was implemented, ensuring continuous and independent operation of the monitoring system. The mechanical structure, designed using Fusion 360 software (Figure 3b), consisted of two main elements: a case for the electronic components (200 × 200 × 145 mm) and a structural support (1400 × 200 × 10 mm). The mobile system maintained functional similarities with the fixed station, enabling consistent technical comparison between both measurement setups while preserving the aesthetic and spatial constraints of the tram unit.

2.1.2. Electronic System

Sensors and Modules of the Measuring System.
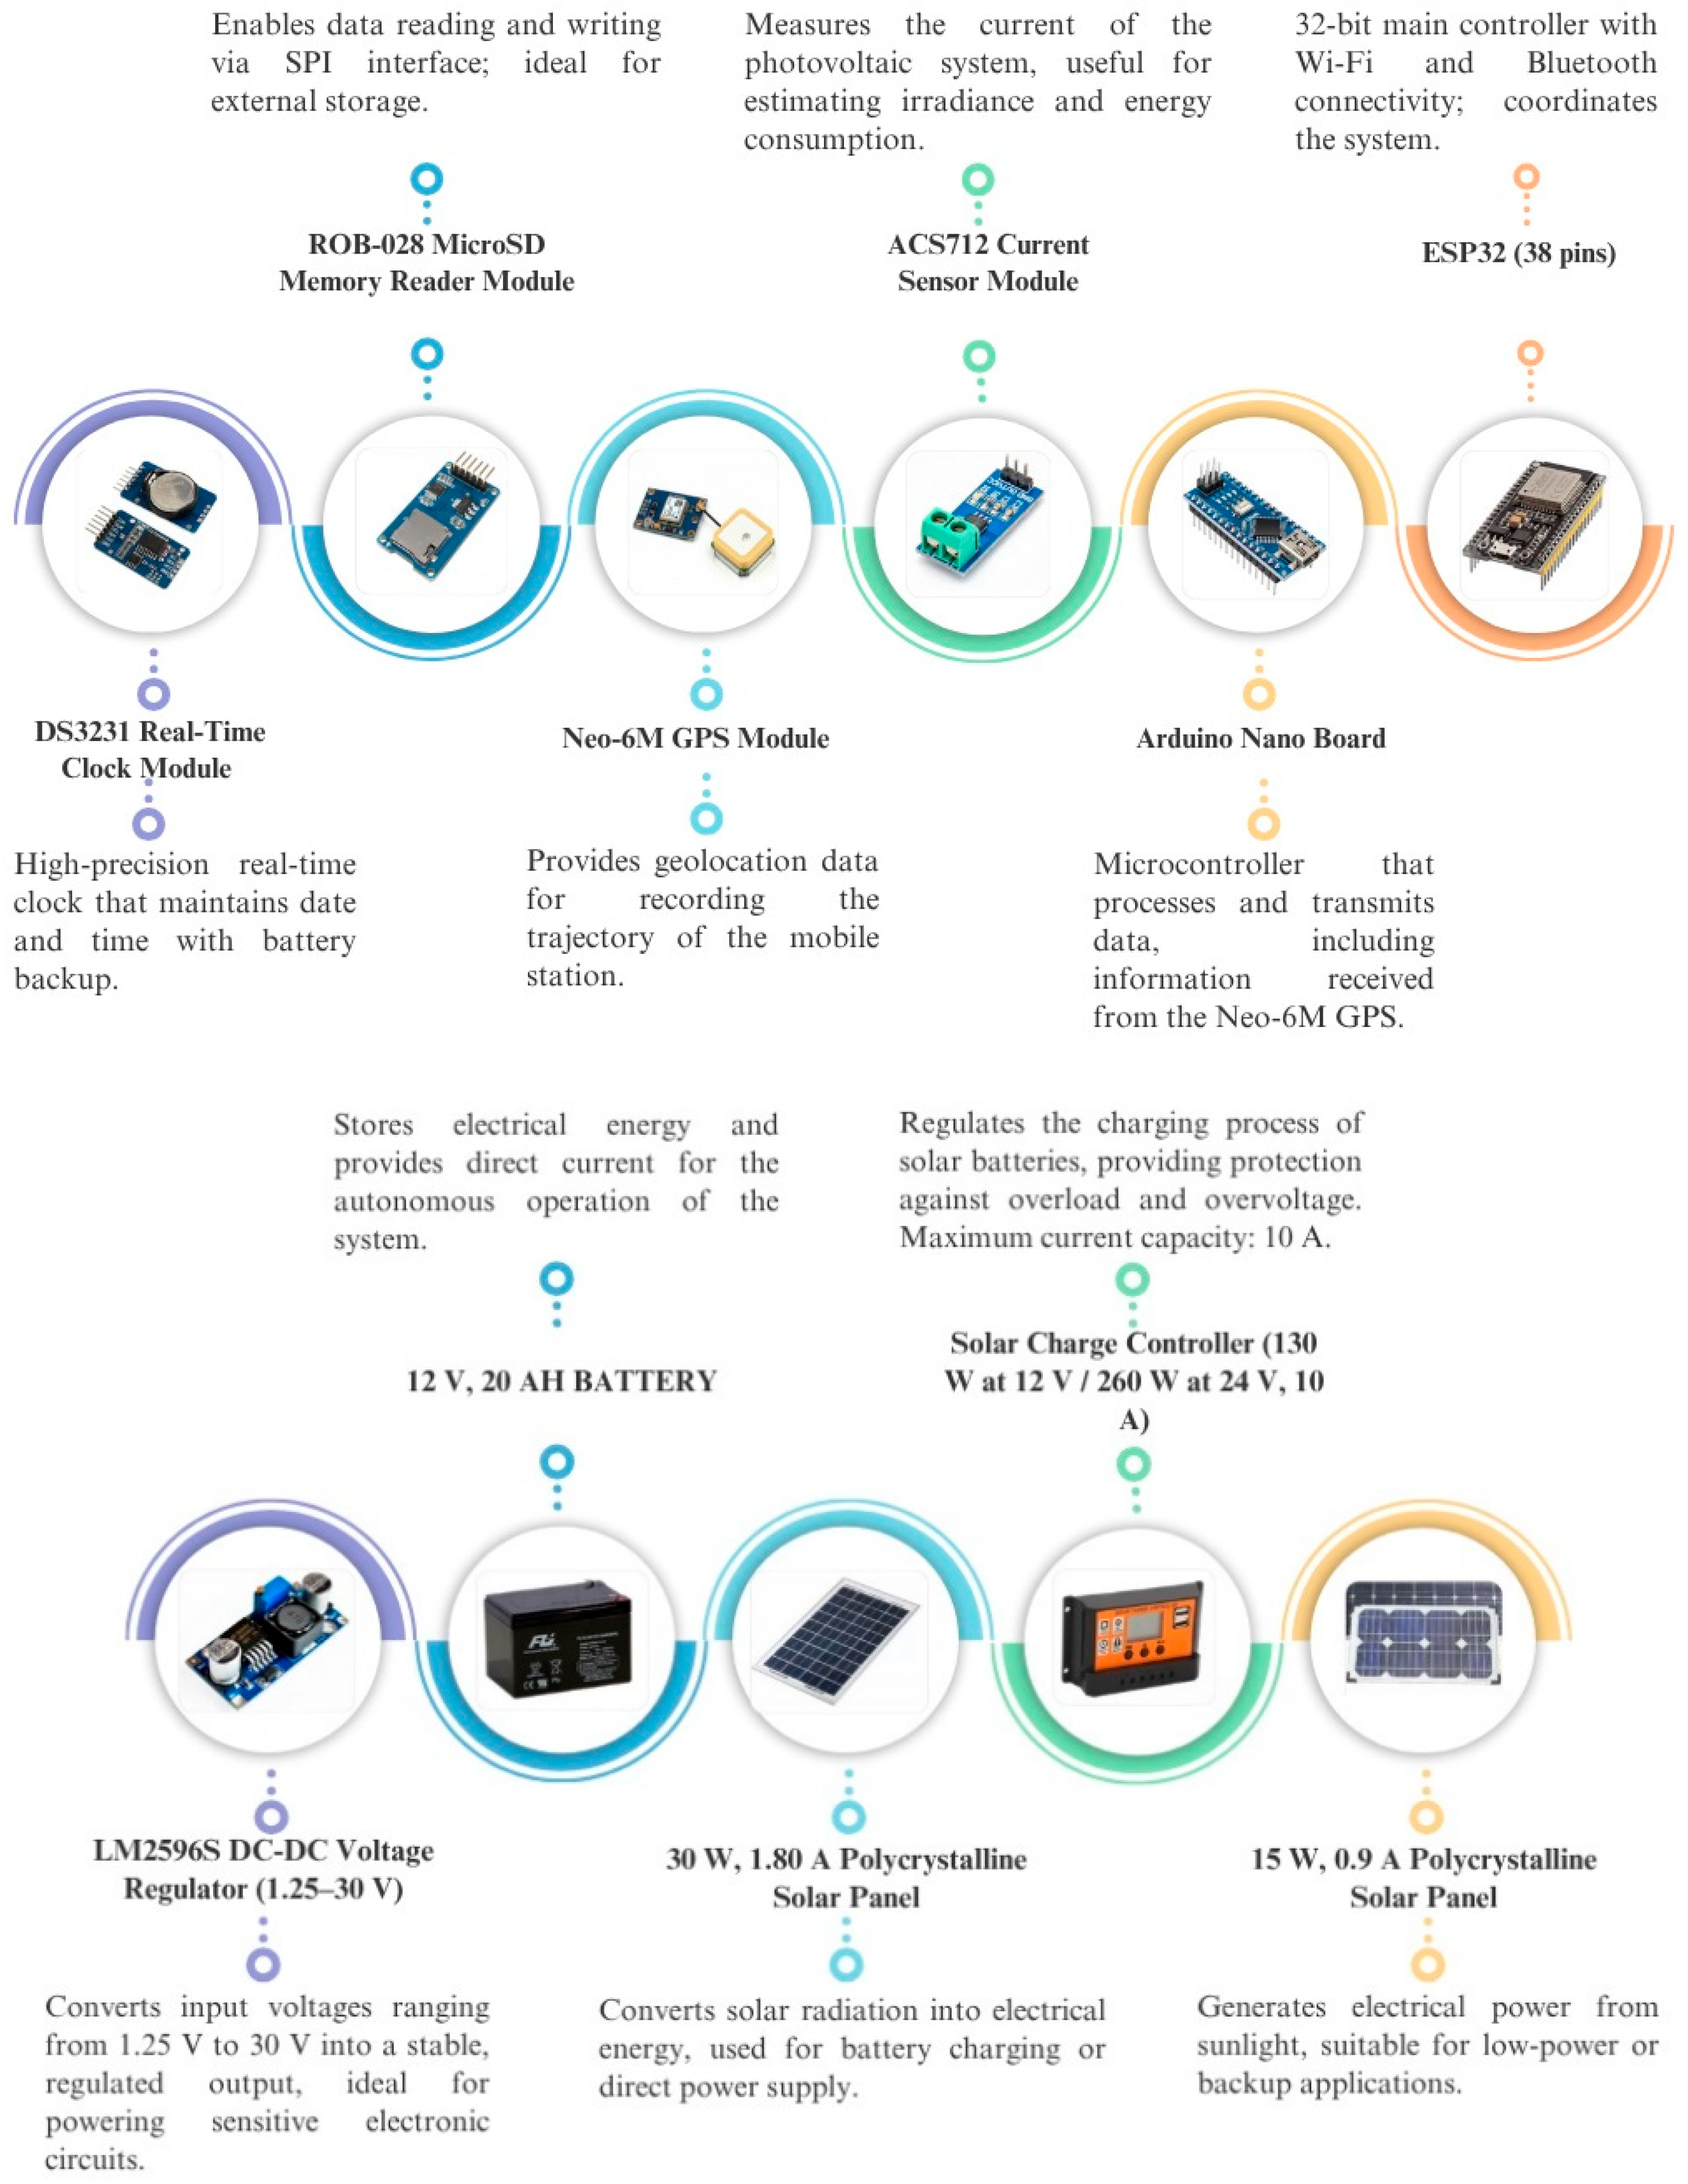
The solar irradiance measuring system was developed using sensors and electronic modules designed for data acquisition, storage, and geolocation. This configuration ensured high measurement accuracy and operational reliability in both mobile and fixed stations. The main components used are detailed in Figure 4 shown below.
Printed Circuit Board (Hardware):
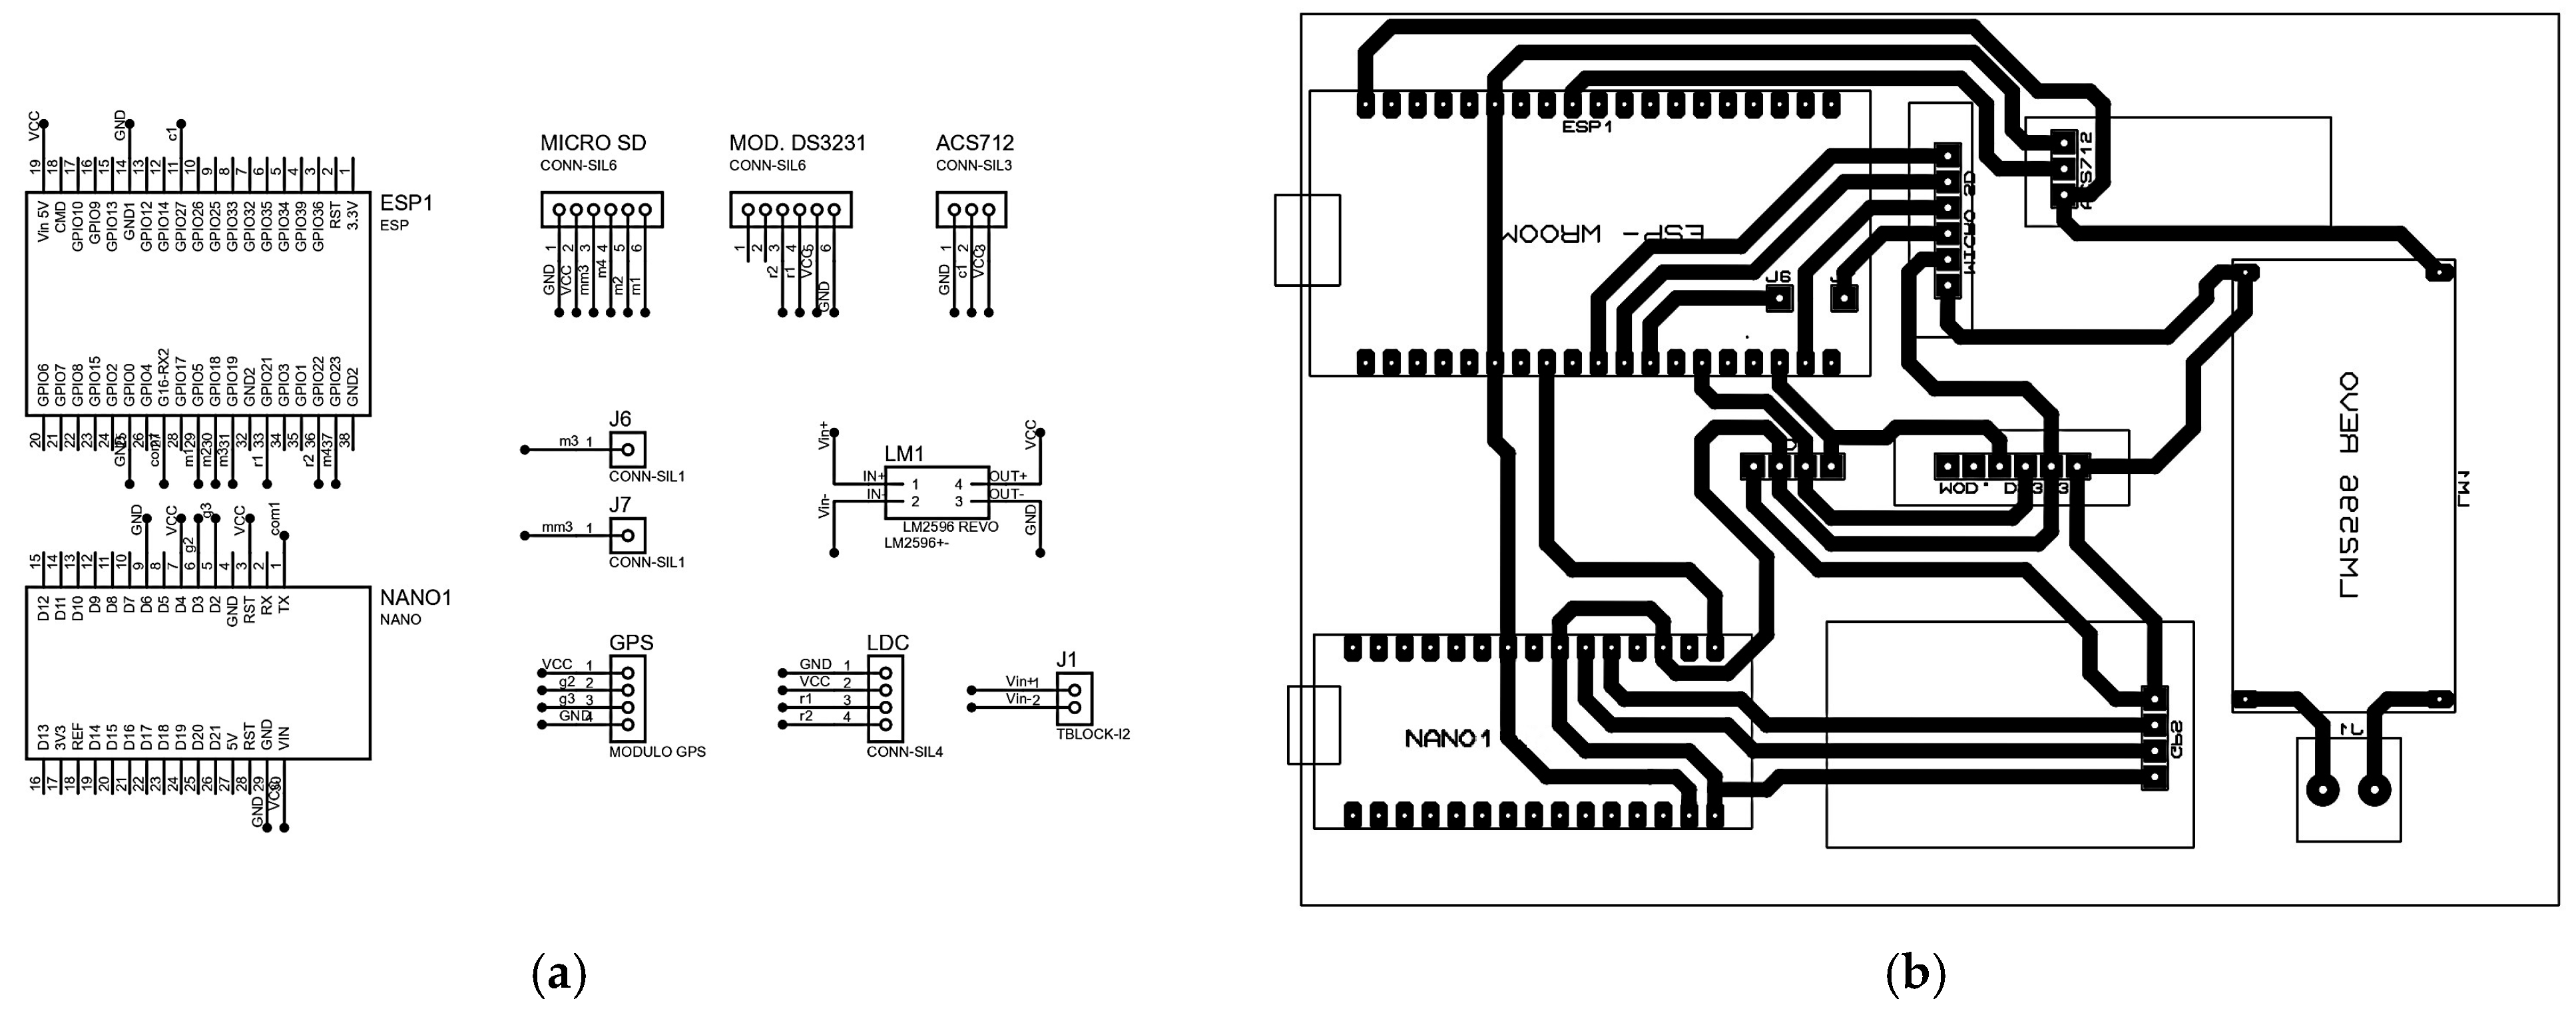
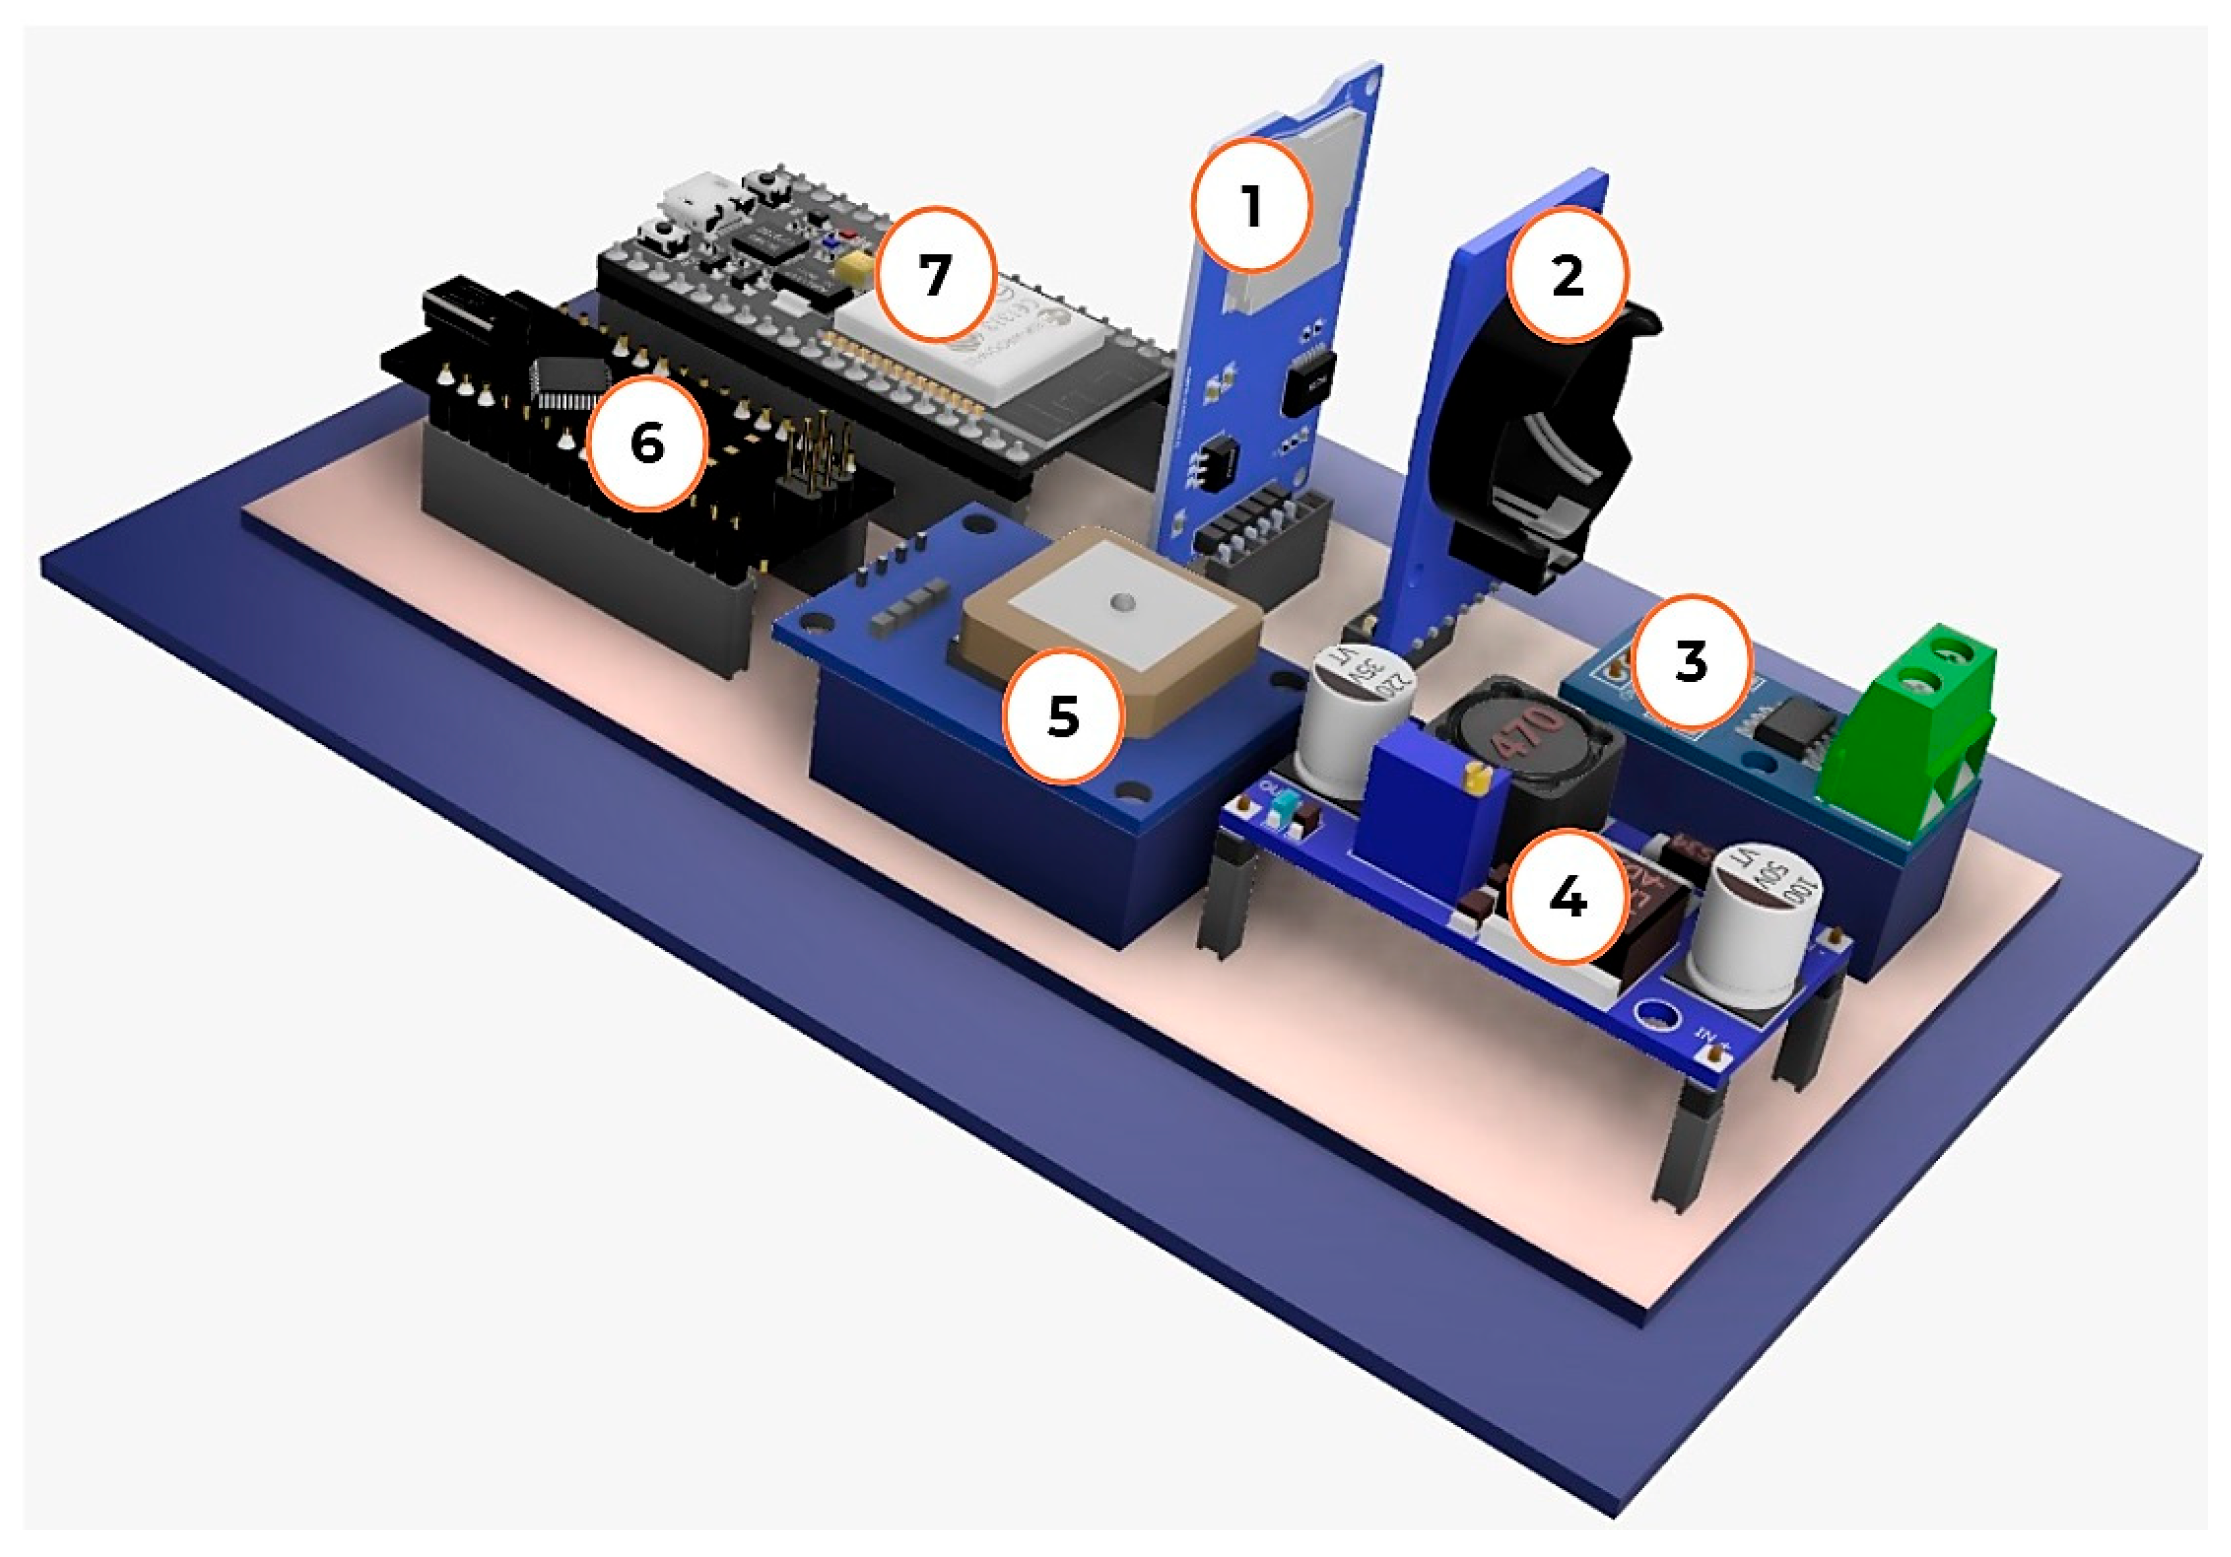
To efficiently use space and integration of the measuring system, a layout was designed to mount electronic modules on both the fixed and mobile stations (Figure 5). A custom printed circuit board (PCB) was developed using the Proteus design software to organize the components, reduce wiring, and improve reliability. Detailed schematics and PCB layouts are provided in Appendix A (Figure A1).
Programming (Software):
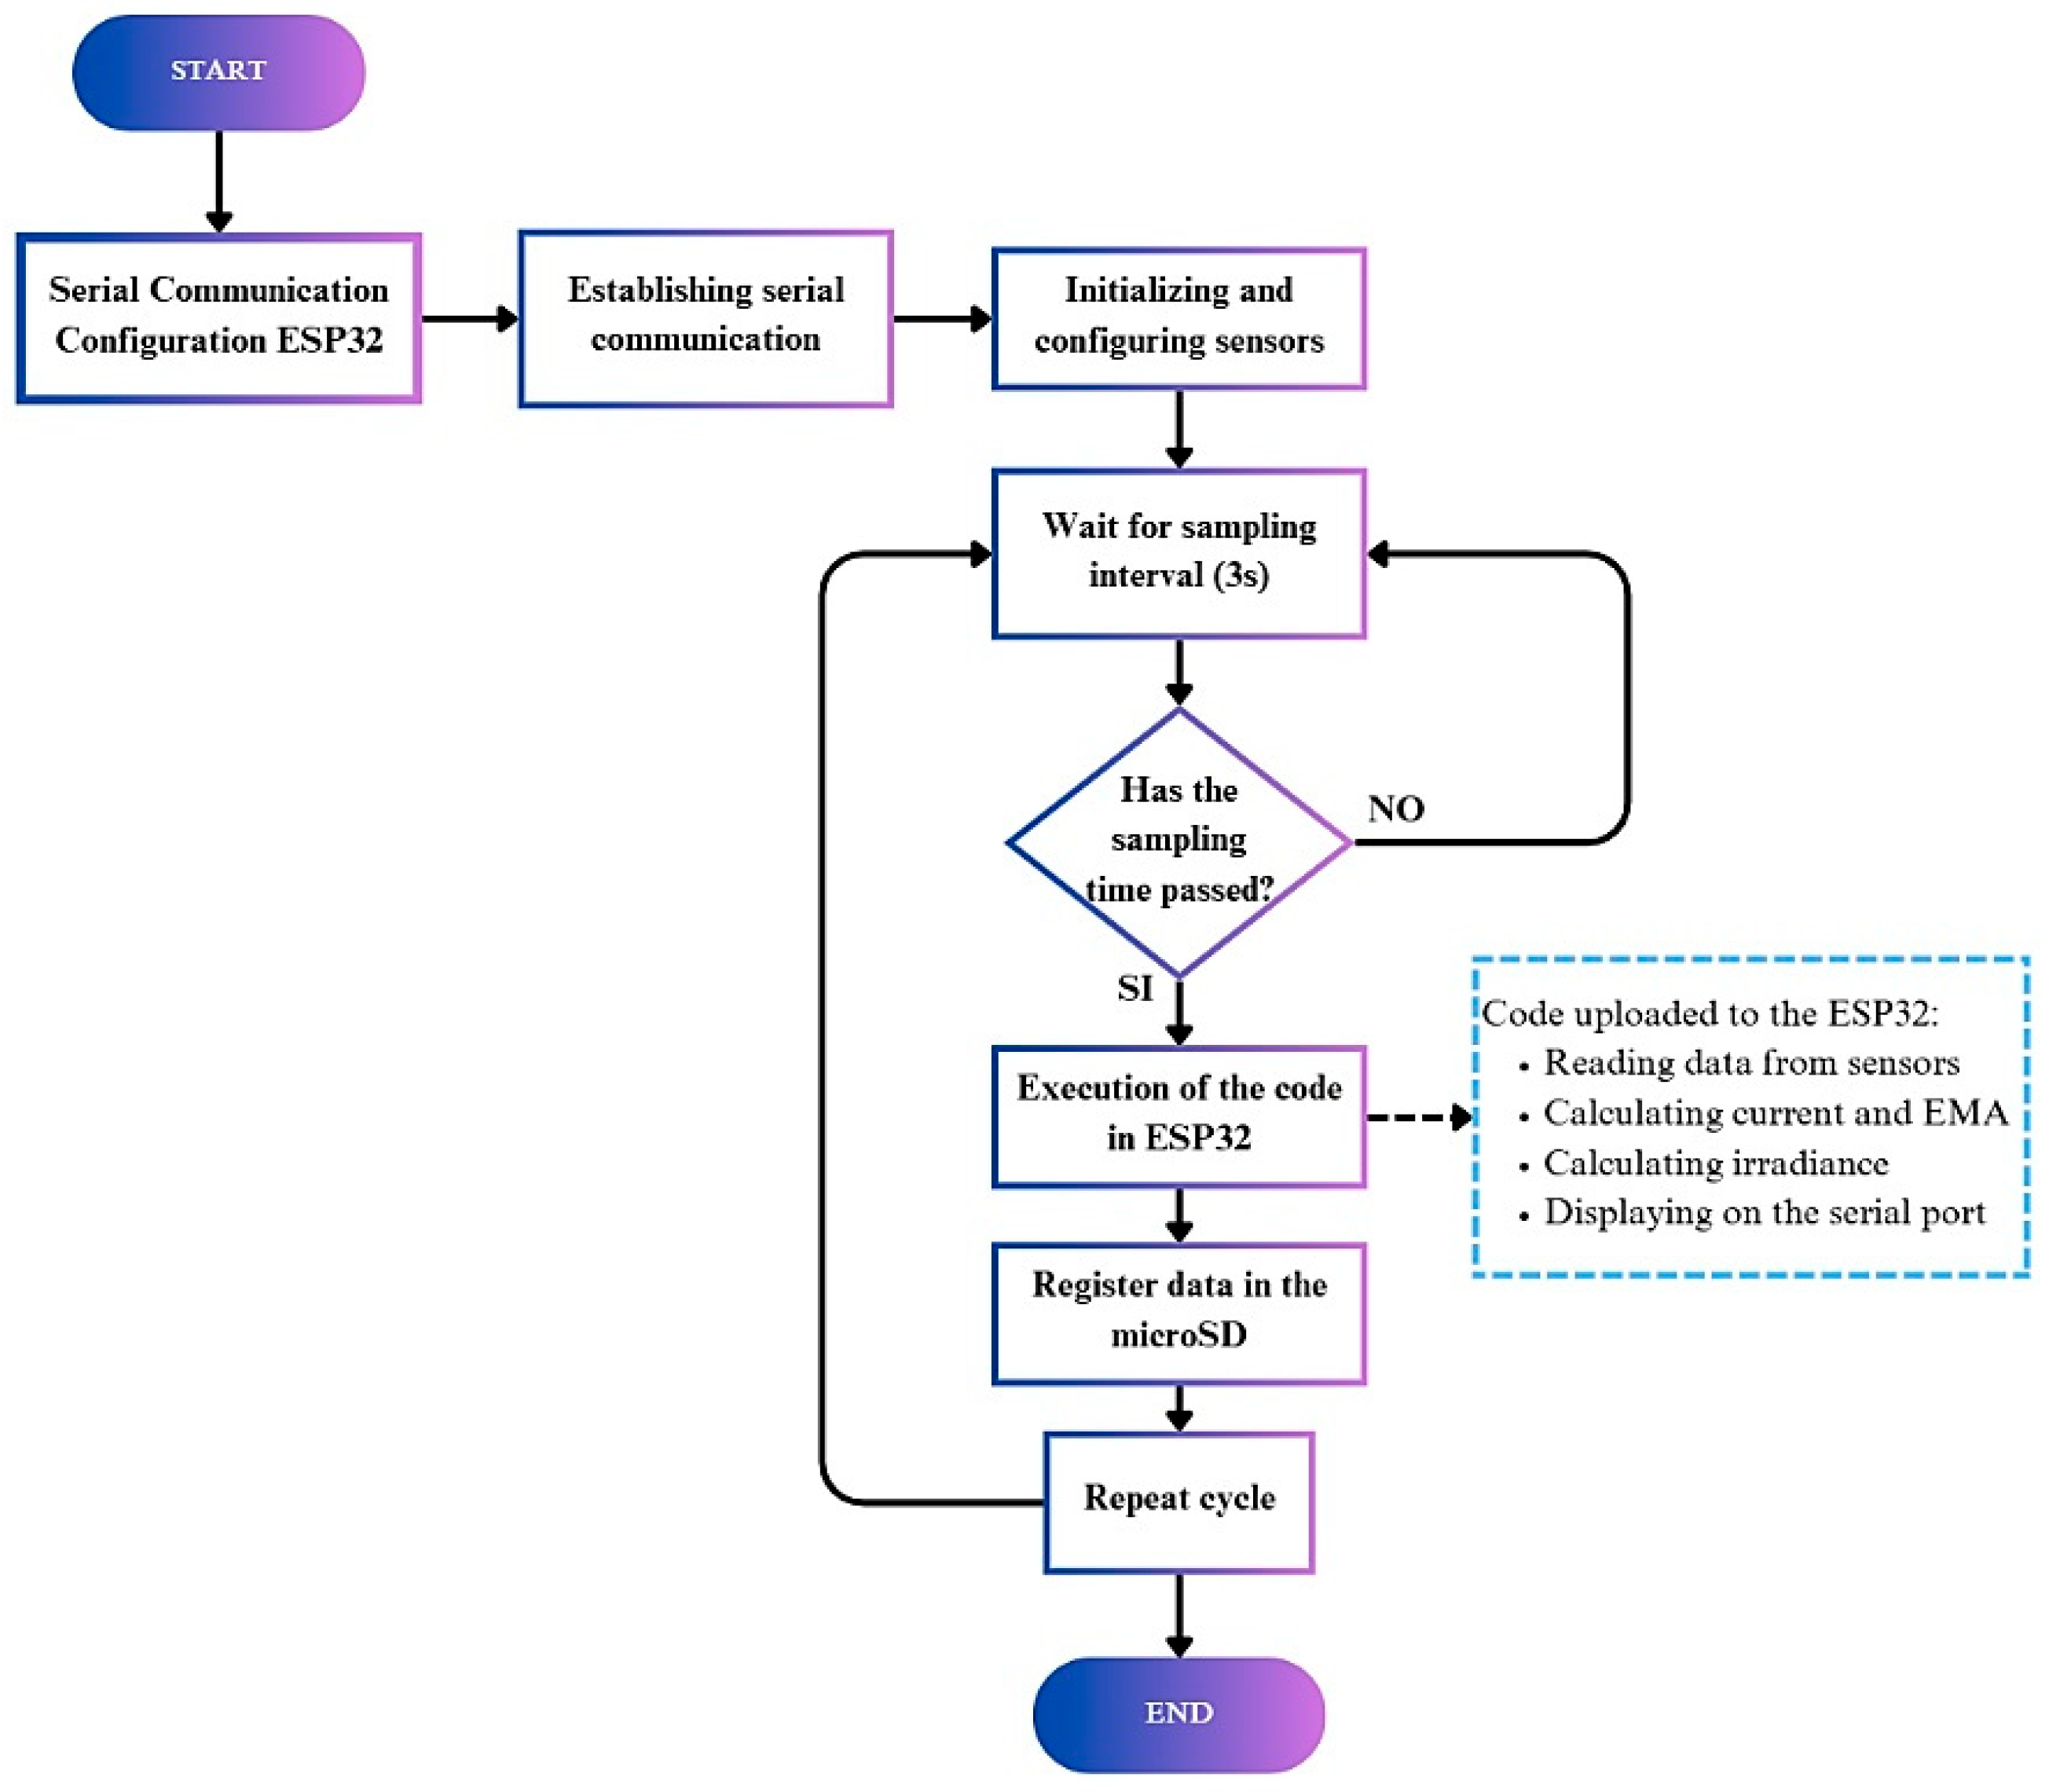
The measuring system was programmed using the Arduino IDE (version 2.3.4). platform and a programming language based on C/C++. The programming focused on collecting data from the modules, performing basic data processing, and storing and organizing data in an external microSD card (Figure 6).
The system was programmed to automatically record solar irradiance data daily from 06:00 to 17:00, sampling once every 3 s. This setup allowed for the collection of up to 28,800 data points per day, providing high temporal resolution for analyzing solar irradiance patterns throughout the day. Each record stored on the SD card included solar irradiance, electrical current, geographic coordinates (latitude and longitude), and the corresponding date and time of measurement.

2.1.3. Panels and Power Supply

Consumption Table
The consumption table was developed by considering the quantity, nominal power, current, and voltage of each load. Based on these data, the maximum daily energy consumption was determined Appendix B (Table A1). This section provides a detailed calculation of the energy consumed by the solar irradiance measurement module used in the measuring stations.
Solar Panels Requirements
The system integrates a 30 W photovoltaic panel to capture solar irradiance for both the fixed and mobile stations. Additionally, the mobile station incorporates a second 15 W photovoltaic panel dedicated exclusively to battery charging, enabling autonomous operation.
The number of solar panels required was calculated based on the system’s operational parameters described in Table A1, taking into account the energy demands of the electronic modules and sensors involved. Estimates of energy generation and consumption were obtained using Equations (1)–(3).
Eg = Pp × Hs = 15 W × 4 h = 60 Wh/day
Cd = Pc × Ho = 2.3805 W × 24 h = 57.132 Wh/day
Me = EgCd = 60 − 57.132 = 2.868 Wh/day
where
Eg: Generated energy
Pp: Panel power output
Hs: Sunlight hours per day
Cd: Daily consumption
Pc: Total power of components
Ho: Operating hours per day
Me: Energy margin
To estimate solar irradiance, a 30 W photovoltaic panel was integrated into the system. This selection was based on measurement and functional criteria, as the panel reliably generated a significant current under Standard Test Conditions (STC), with a rated short-circuit current (Isc) of 1.80 A. This value served as reference in Equation (4) for calculating irradiance.
I r r a d i a n c e   W m 2 = I I s c × 100 = 1.44   A 1.80   A × 100 = 80   W / m 2
where I represents the real-time current measured by the ACS712 Hall effect sensor.
The previously determined positive energy margin of 2.868 Wh/day proved useful to compensate for potential losses due to system inefficiencies and fluctuations in solar irradiance.
Batteries Requirements
Batteries requirements were established based on the system’s daily energy consumption, considering autonomy, depth of discharge (DoD), and storage efficiency. The required capacity to support two full days of continuous operation was calculated using Equation (5)
B c = ( E d × A ) / ( V n × D O D × η )
B c = 57.132   W h / d a y × 2   d a y s 12   V × 0.5 × 1 = 114.264 6 = 19.044   A h
where
Bc: Battery capacity (Ah)
Ed: Daily energy (Wh)
A: Autonomy (days)
Vn: Battery nominal voltage (V)
DOD: Depth of discharge (decimal)
η: System efficiency (decimal)
Based on this calculation, a single 12 V–20 Ah battery was selected to meet the system’s energy requirements, providing sufficient capacity for two days of autonomous operation.

2.2. System Fabrication and Calibration

Device calibration
To quantify the daily solar irradiance captured by the system during the tram route, the measuring interval was set between 06:00 and 17:00, corresponding to a continuous 11-h period. This time frame was selected because solar irradiance availability outside this period was minimal or nonexistent, unsuitable for reliable data acquisition. During this interval, the system installed on the tram continuously recorded the incident solar energy on the photovoltaic module, enabling an accurate estimation of the available solar resource along the route.
Irradiance (E) was calculated using the following equation:
E = G × t
where
G represents the average irradiance measured during the observation interval, expressed in watts per square meter (W/m2)
t represents the total exposure time, expressed in hours (h)
The total solar energy received per unit area (Wh/m2) over the specified period was calculated using this equation. The resulting value served as a key parameter for evaluating the performance of the photovoltaic system under real operating conditions, taking into account both the tram’s movement and the spatial and temporal variability of solar irradiance along its route.
Following the completion of the solar panels and electronic system assembly (Figure 7a), an optimal site for data acquisition was selected. At this site, continuous solar irradiance measurements were performed using both the fixed and mobile systems, simultaneously validated against a pyranometer (Apogee Instruments Inc., Logan, UT, USA; model MP-200) to ensure data accuracy. This data acquisition process spanned three days, enabling the precise calibration of the solar irradiance measuring module, as shown in Figure 7b.
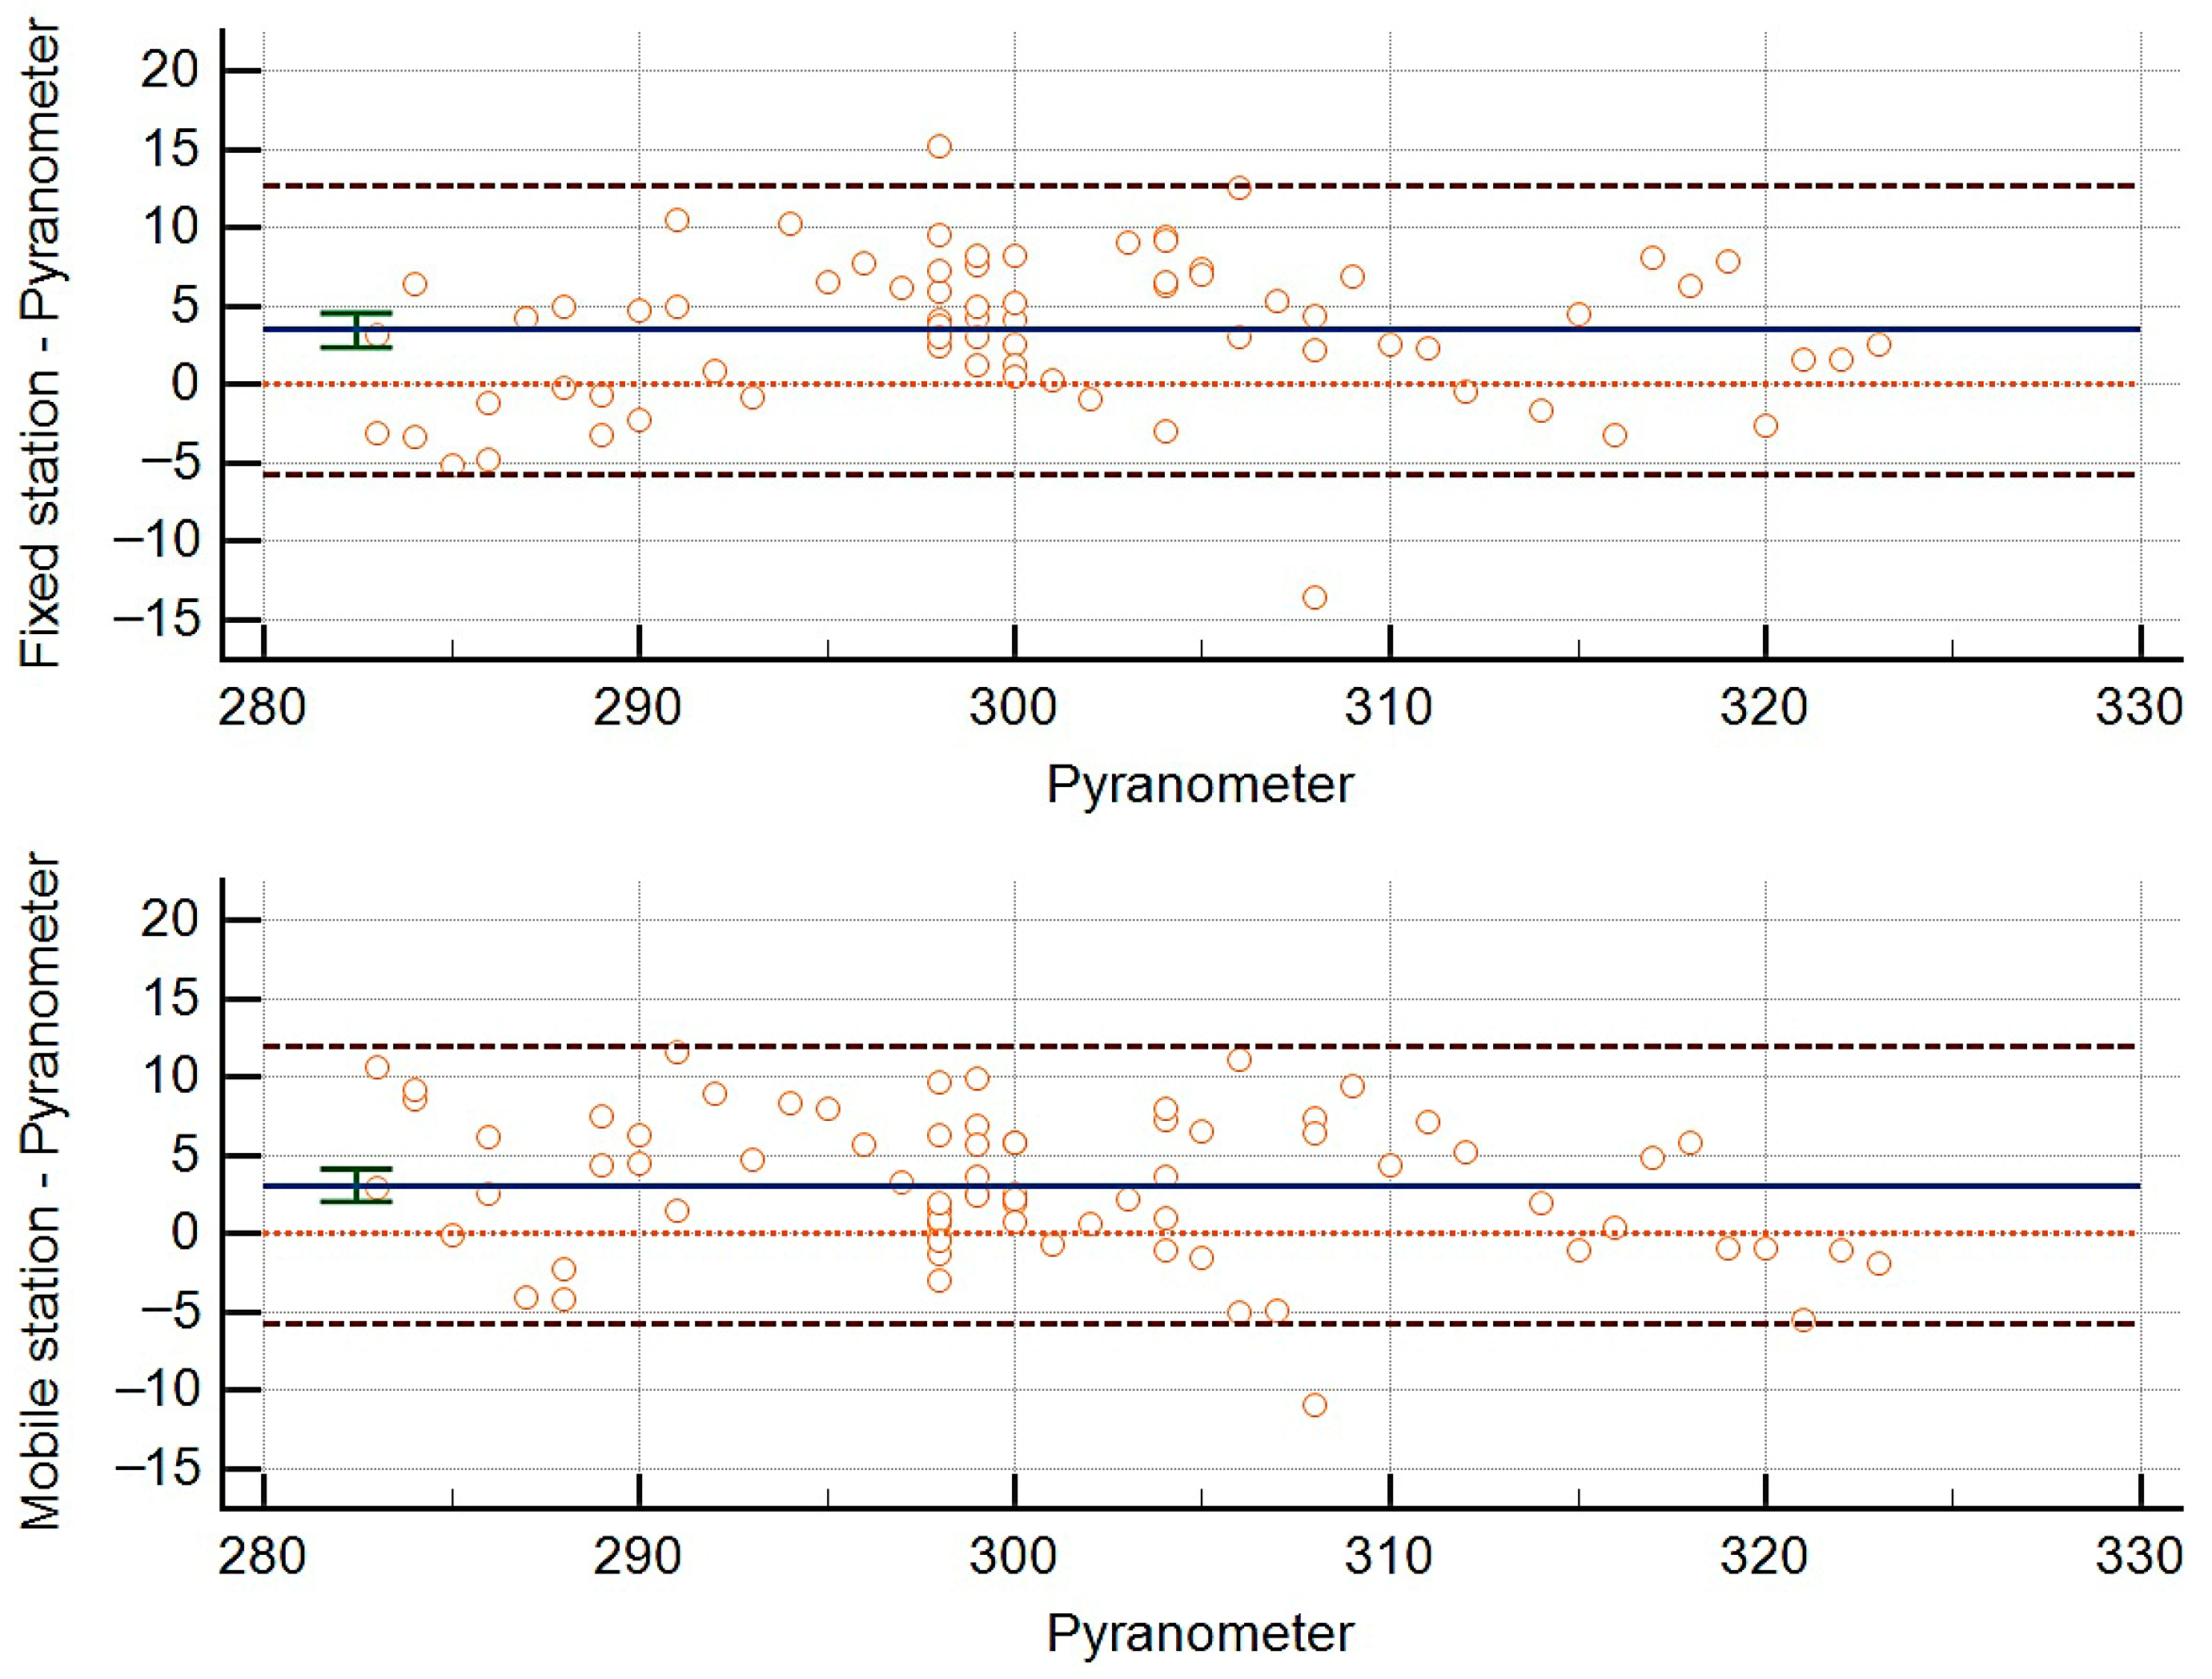
The comparative graph reveals a high level of consistency among the solar irradiance values recorded by the tram-mounted mobile station, the fixed station installed at the Academic Unit for Postgraduate Studies, and the reference sensor (pyranometer) (Figure 8). Bland–Altman plots were used to compare the measurements from both the mobile and the fixed station against those obtained with the pyranometer. In both cases, the mean differences were close to zero, and over 95% of the data points fell within the limits of agreement (±12 W/m2), indicating high precision and no evidence of systematic bias. The median absolute percentage error was 1.42% for the mobile station and 1.41% for the fixed station, with the latter showing slightly greater consistency relative to the reference instrument.

3. Results

3.1. Implementation and Data Acquisition

Based on the results obtained during the calibration tests, the fixed measuring system was installed and implemented at the Academic Unit of Postgraduate Studies at Universidad Católica de Cuenca. The three-dimensional structure was manufactured using 3D printing and ABS filament (SUNLU Industrial Co., Ltd., Zhuhai, China). The design featured a modular assembly system and a 3 mm wall thickness for quick assembly and disassembly, facilitating maintenance or replacement of electronic components when needed (Figure 9).
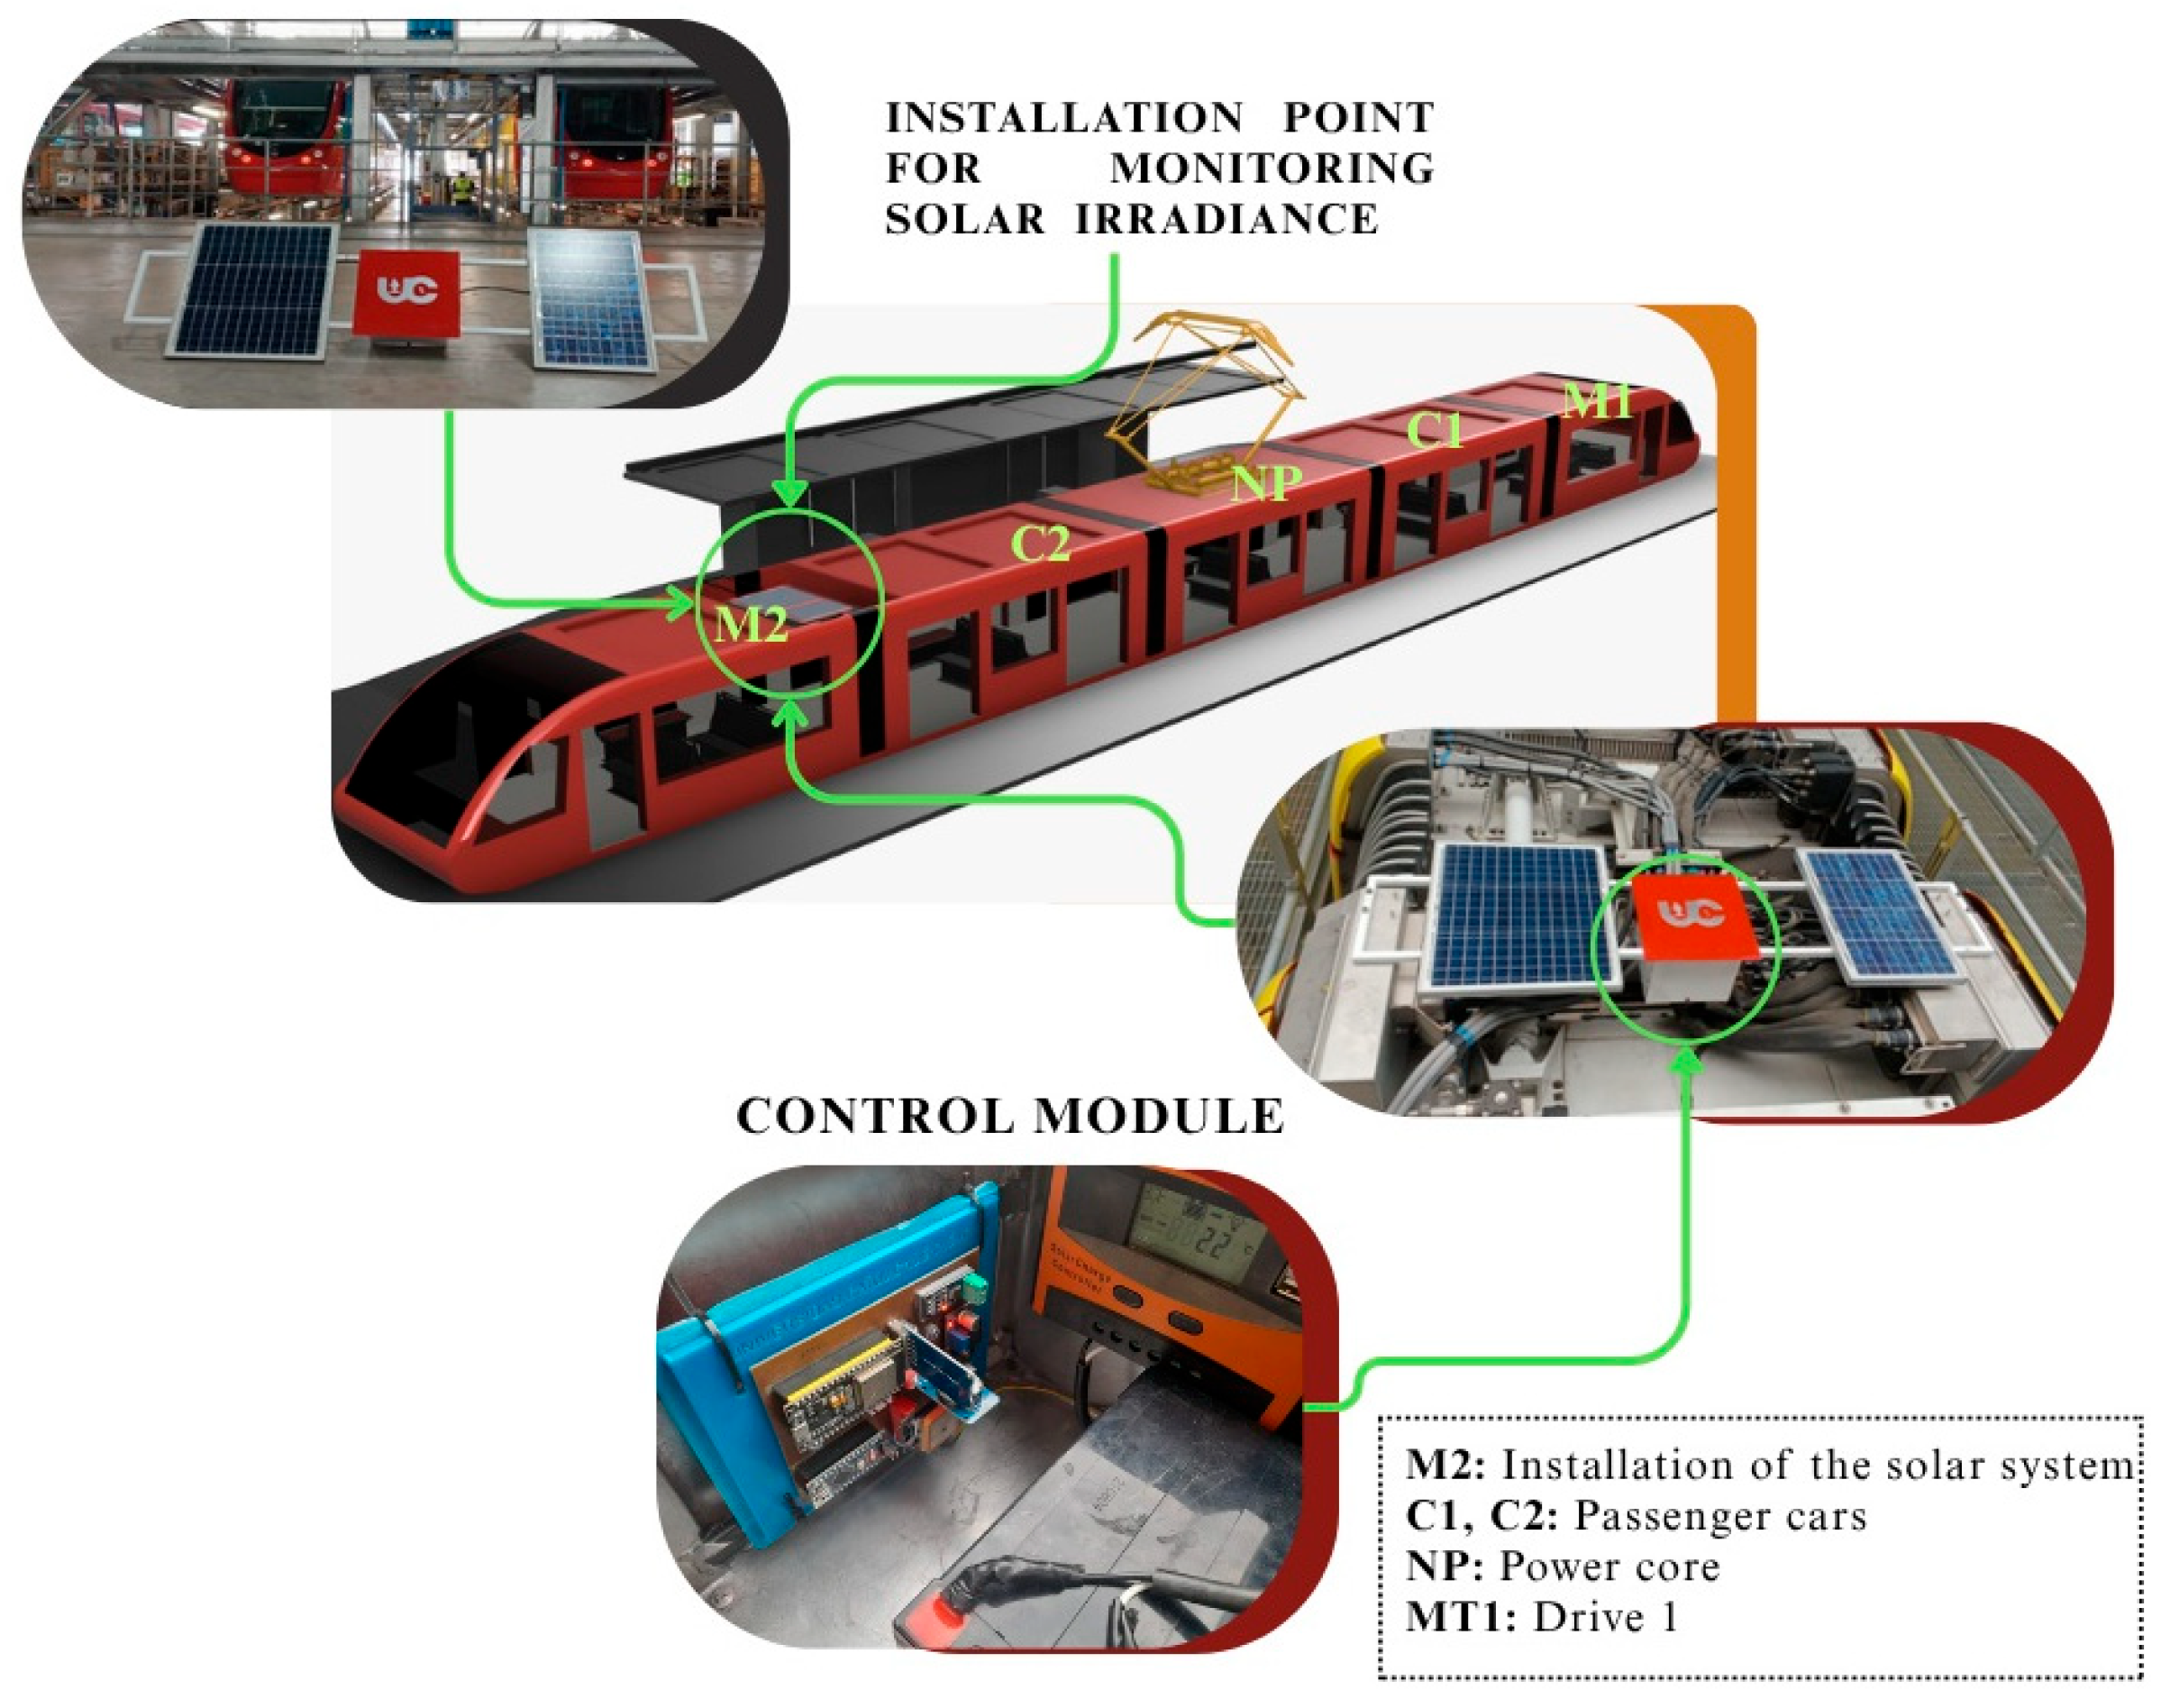
Figure 10 illustrates the assembled system with solar panels installed, in accordance with the previously developed 3D design. The structure was optimized to ensure robustness, efficiency, and stability, maximizing the use of available space. The mobile system was mounted on the roof of car M2 of tram unit 1007, ensuring proper integration and structural stability within the platform.
Data collection was conducted throughout the tram route (Figure 11), causing fluctuations in the volume of data collected according to the unit’s operational schedule. In certain cases, the tram operated exclusively in the morning, exclusively in the afternoon, or during both shifts, which influenced the actual measurement availability over the course of the day.

3.2. Solar Irradiance Analysis

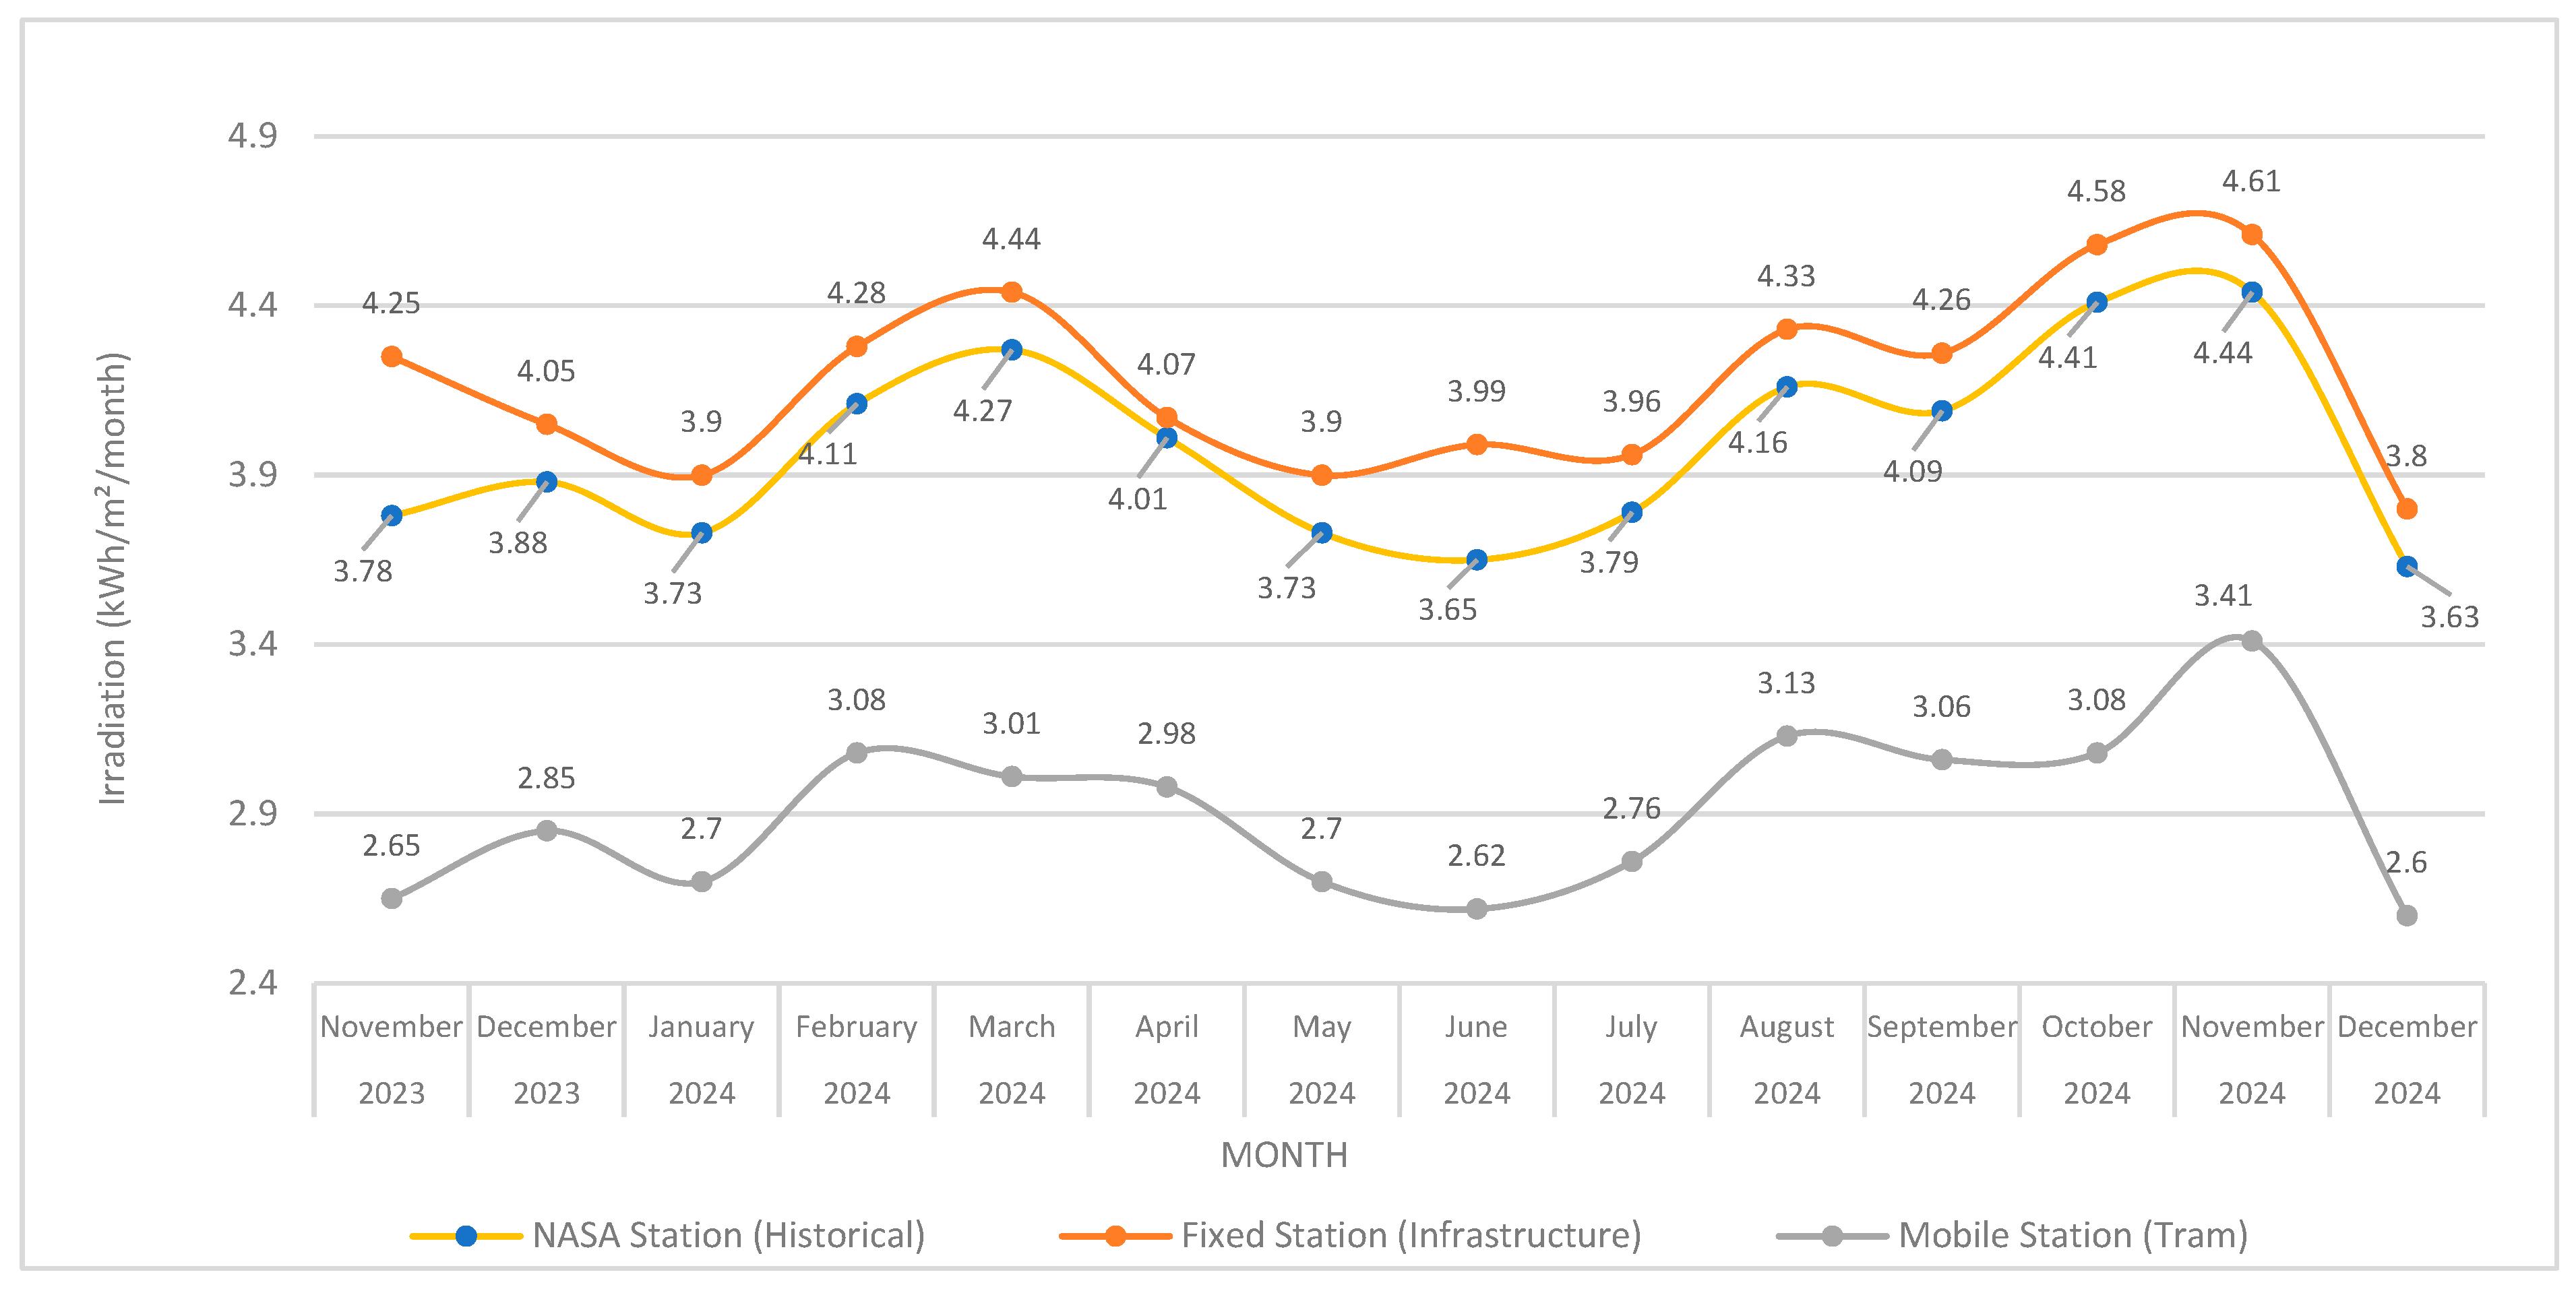
This section details the results and implementation process of the solar irradiance measuring system, including both fixed and mobile stations, which were tested and installed at the Academic Unit for Postgraduate Studies and at tram unit 1007. Additionally, historical data from the NASA meteorological station [37], were used as a reference to support the analysis and validate the measurements obtained by the system (see Figure 12). The analysis was conducted over the course of more than one year to evaluate the solar irradiation captured by the system, using data stored in Excel (.csv) files. The data were processed using Python (version 3.10.12) scripts to generate heatmaps and other visualizations, which facilitated the interpretation of the results.
NASA historical data (yellow line) depict the monthly averages of global solar irradiation (kWh/m2/day) along the Cuenca tram route between November 2023 and December 2024. Irradiation values range from 3.63 to 4.44 kWh/m2/day, peaking in November 2024. A clear upward trend is observed between September and November, followed by a decline during months characterized by lower solar radiation, such as December and January. The mobile station (gray line), installed on the tram car, recorded values ranging from 2.60 to 3.41 kWh/m2/day, also peaking in November 2024. Its behavior followed a similar seasonal pattern, with gradual increases starting in August and lower values observed in June and December 2024. In turn, the fixed station (orange line) reported irradiation values between 3.80 and 4.61 kWh/m2/day, the latter being the highest, also observed in November 2024. This station exhibited high solar resource availability from August to November 2024, while the lowest levels were recorded in the rainy season months of June and December 2024.
Collectively, these data characterize the seasonal variability of solar irradiation and are essential for evaluating the feasibility and performance of onboard photovoltaic systems in urban mobility scenarios.
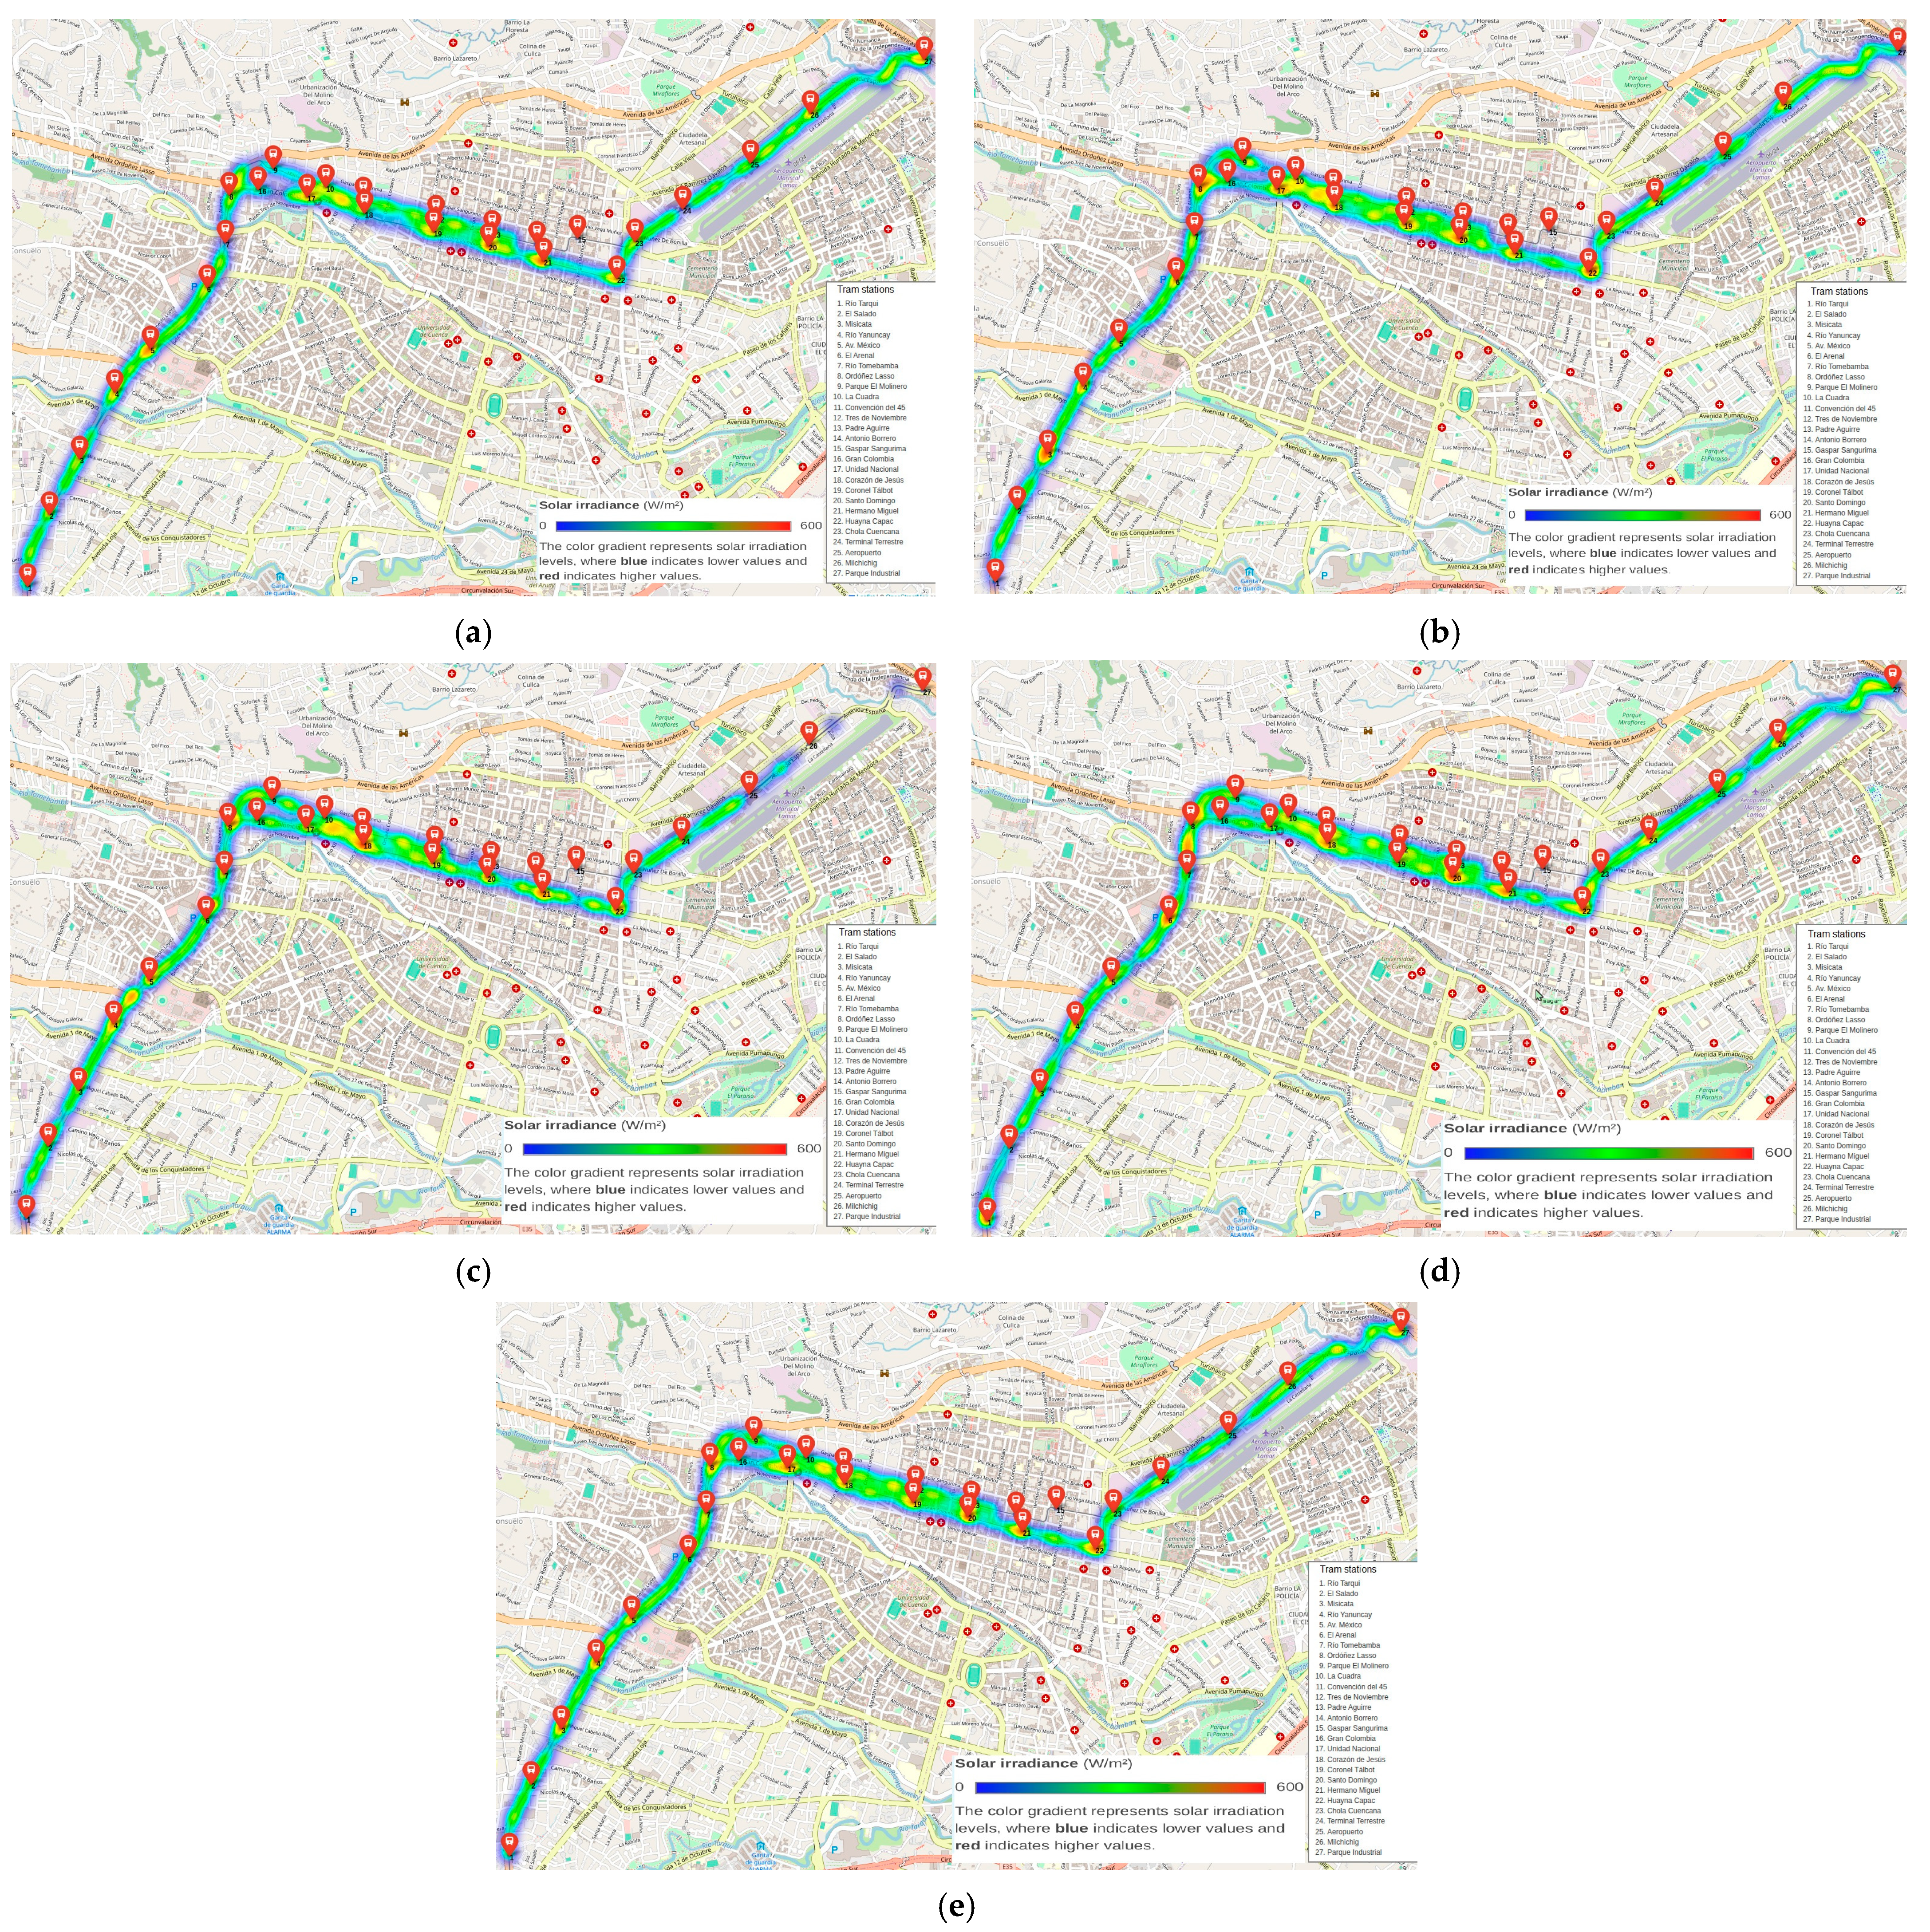
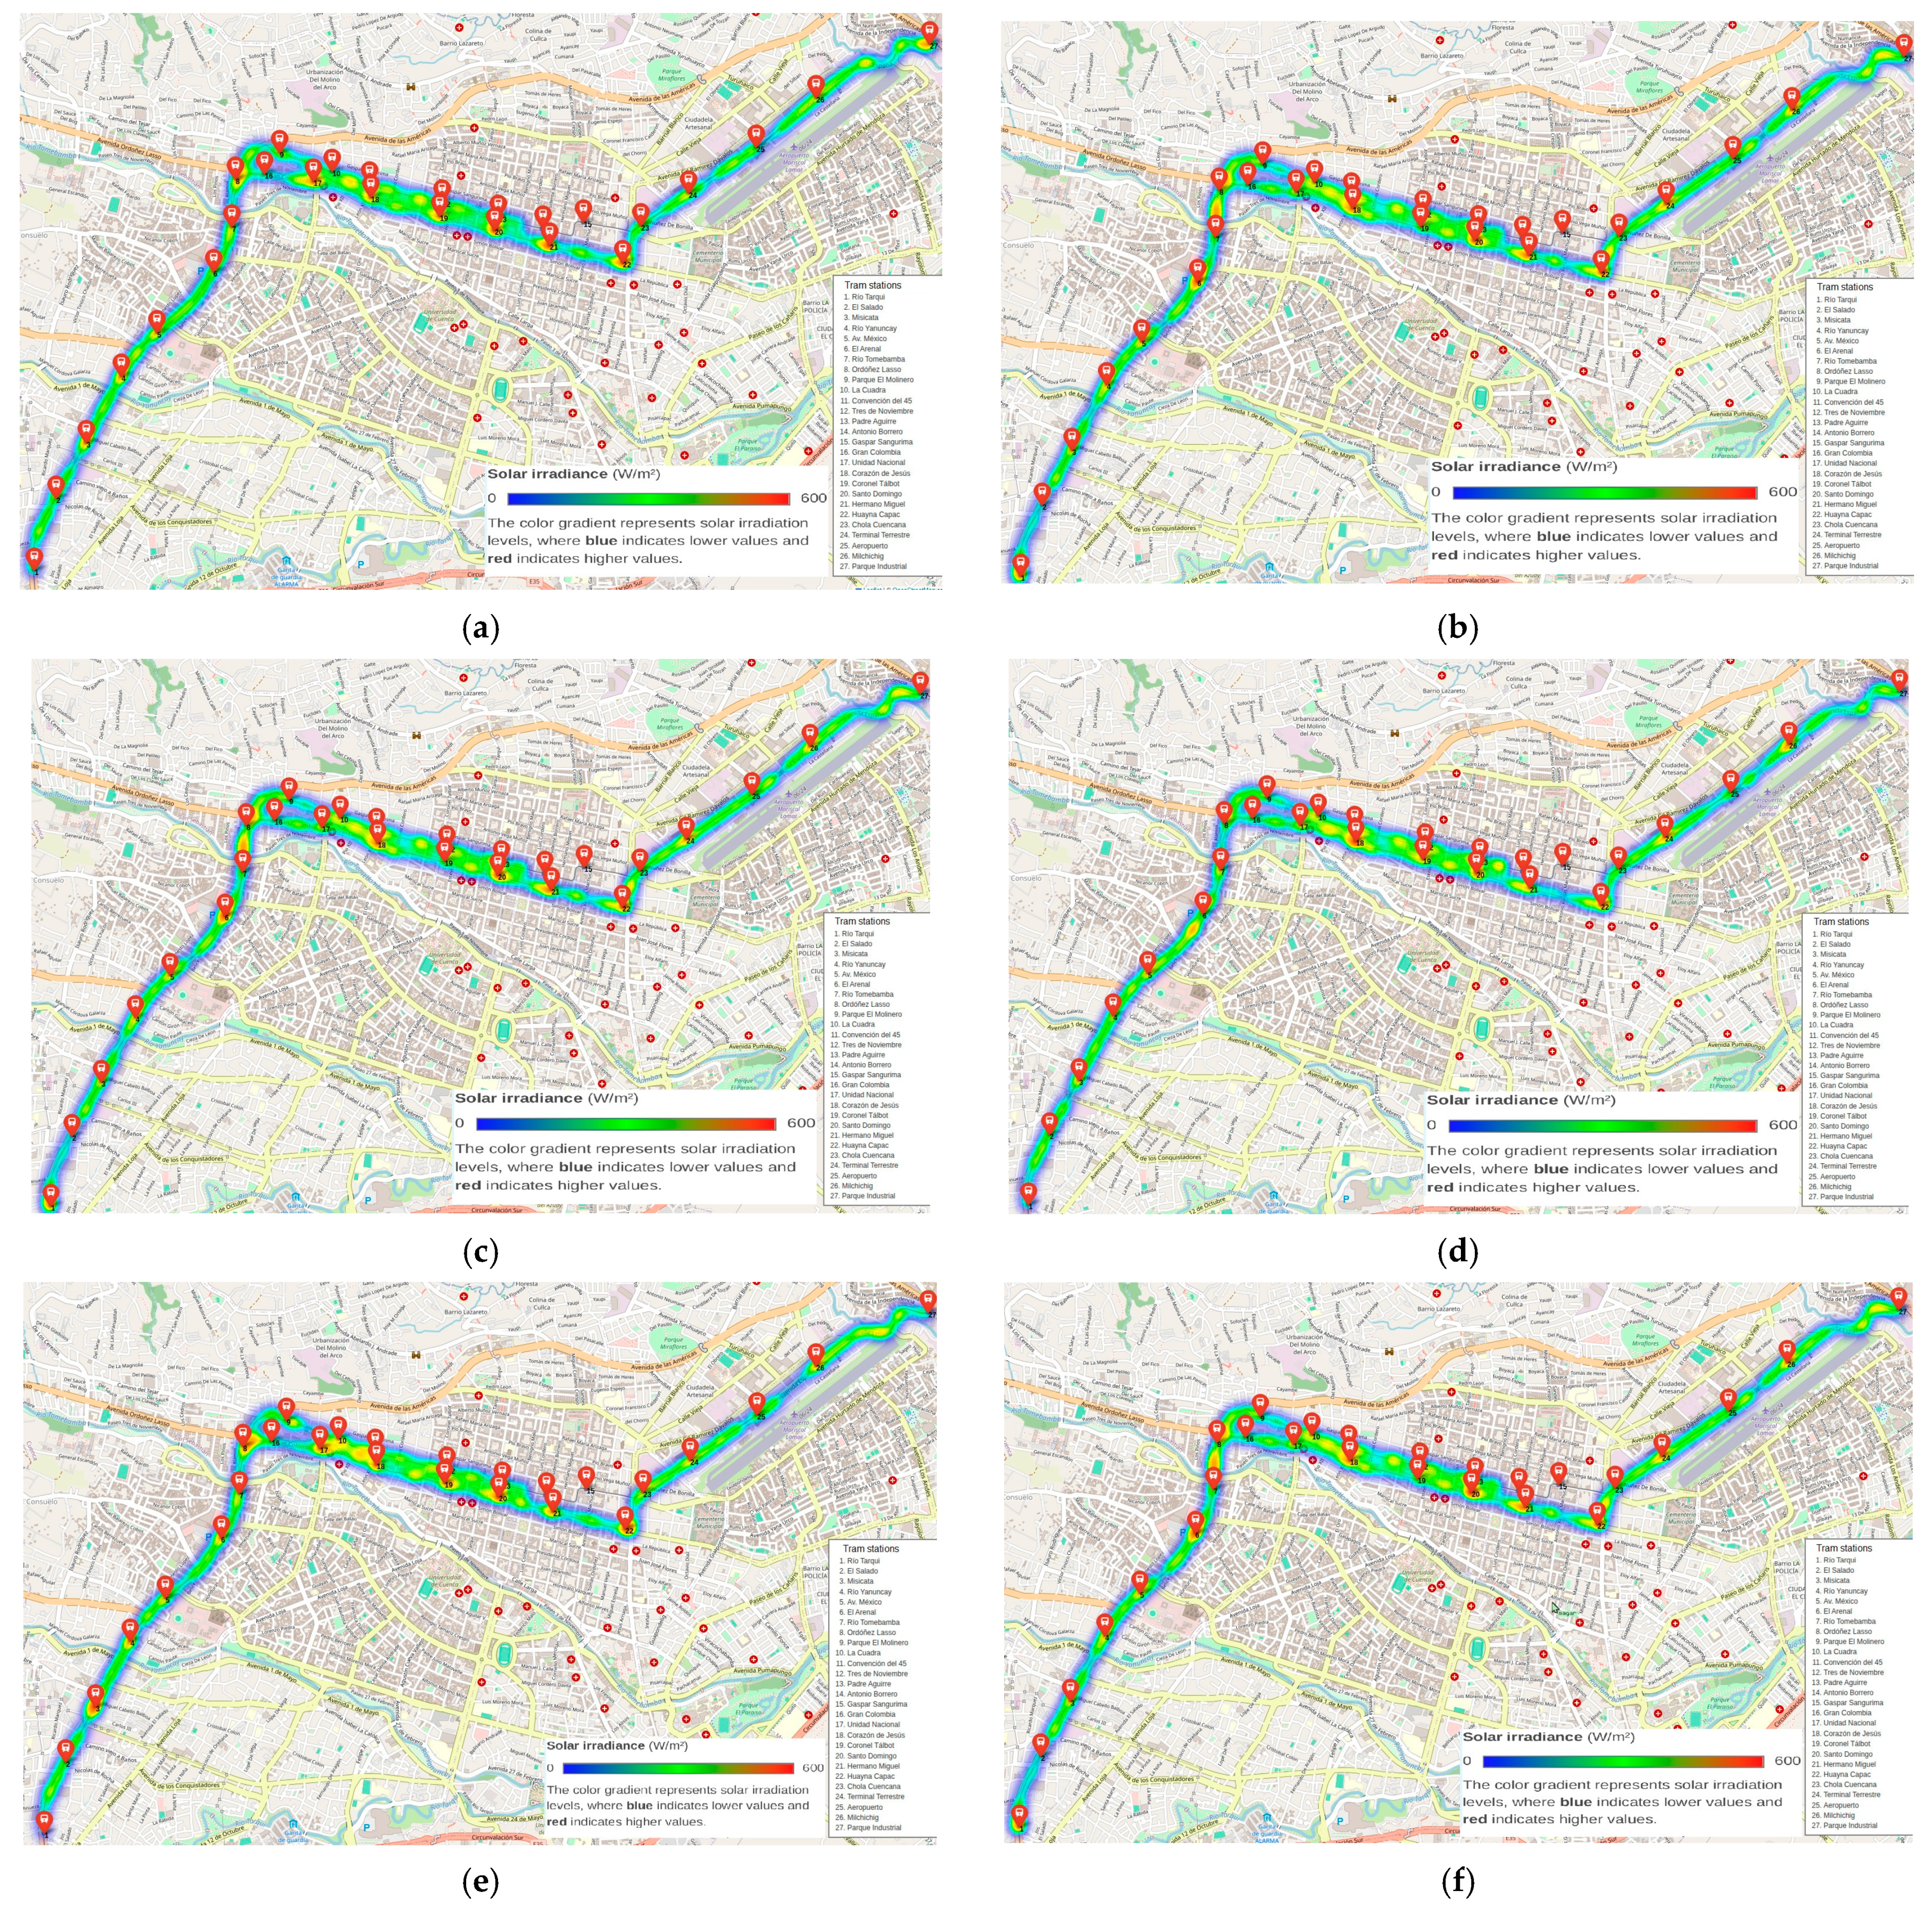
The following section provides a spatial and temporal analysis of solar irradiation along the tram route in Cuenca, Ecuador, from November 2023 to December 2024. To facilitate interpretation, the monthly heatmaps have been organized into three figures, following a regional climatic pattern that reflects the transition between the rainy and dry seasons. Figure 13 Presents data from November 2023 to March 2024, corresponding to the onset and progression of the rainy season. Figure 14 includes the transition to dry conditions and the full extent of the dry season, from April to September 2024. Lastly, Figure 15 shows the return to the rainy season, from October to December 2024.
Each subfigure represents a specific month and highlights the spatial variability of solar irradiation along the tram route. Areas with higher irradiation levels are shown in warm tones (red/yellow), while zones with lower exposure appear in cool tones (green/blue). This visual analysis facilitates the identification of seasonal solar coverage patterns and their potential impact on photovoltaic system performance or urban energy planning.
Figure 13 shows a gradual decrease in solar irradiation intensity over the analyzed period. In November and December (Figure 13a,b), moderate irradiation levels are observed in the western and central areas of the tram route, although zones of lower exposure begin to emerge, particularly toward the east. From January to March (Figure 13c–e), irradiation exhibits a more irregular distribution with predominantly low values, indicating increased cloud cover and higher precipitation frequency. This trend aligns with the typical rainy season in the Ecuadorian Andes, characterized by persistent cloud cover that significantly reduces solar irradiation reaching the surface.
Notably, the uniform decline in irradiation observed along the entire tram route during February and March may represent a critical period for solar energy generation in photovoltaic systems installed on the tram infrastructure or nearby areas. The reduced spatial variability further suggests a stabilization of climatic conditions characterized by consistently low irradiation levels during this time frame. Previous studies in the region confirm that such reductions significantly impair the energy yield of solar systems during extended rainy seasons.
Figure 14 illustrates solar irradiation maps along the tram route in Cuenca from April to September 2024, encompassing the transition from the rainy to the dry season (April–May) and the full duration of the dry season (June–September).
During April and May (Figure 14a,b), a gradual shift in the spatial distribution of irradiation is observed. Despite prevailing low solar irradiation levels in certain zones, particularly in the eastern segment of the route, a progressive increase is observable in central and western areas. This pattern suggests a decline in cloud cover and an improvement in conditions for solar energy capture.
Starting in June (Figure 14c) and continuing through the subsequent months (Figure 14d–f), the dry season is firmly established, characterized by higher and sustained solar irradiation levels that are relatively evenly distributed along the entire tram route. High irradiation areas expand to include sectors that previously exhibited low exposure.
This period represents the peak potential for photovoltaic energy generation during the year. In addition, a decrease in spatial variability is observed: contrasts among sectors diminish, resulting in more homogeneous irradiation conditions along the entire route. This uniformity may facilitate more efficient solar system design strategies by minimizing the need for localized adjustments due to microclimatic differences. The station names shown in Figure 14 correspond to the official Spanish denominations of the Cuenca Tram (Ecuador).
Figure 15 shows the evolution of solar irradiation along the tram route in Cuenca from October to December 2024, a period that marks the onset of the new rainy season. This time frame highlights the gradual decline in irradiation following the peak levels recorded during the dry season, as analyzed in Figure 14. In October (Figure 15a), moderately high irradiation levels persist, similar to those observed in September, although areas of lower solar intensity begin to appear, particularly in the eastern segment. This marks the beginning of the seasonal transition, characterized by increasing cloud cover and a decline in direct solar radiation.
In November and December (Figure 15b,c), irradiation levels continue to decrease, with a more uniform reduction observed along the entire tram route. These low-irradiation conditions align with increased precipitation and denser cloud cover, both of which are characteristic of the early rainy season in Ecuador’s Andean region. The transition into a lower-irradiation period poses relevant challenges for energy planning, particularly in the context of photovoltaic systems integrated into public transport infrastructure.
When compared to the early months of the year, a recurring seasonal pattern emerges: the last quarter also experiences diminished irradiation, although these are less severe than those recorded during the core months of the rainy season (January to March). The station names shown in Figure 15 correspond to the official Spanish denominations of the Cuenca Tram (Ecuador).

4. Discussion

The results obtained throughout the monitored period of fourteen months a marked seasonal variability in solar irradiation along the Cuenca tram route. The mobile station recorded a maximum irradiation value of 3.41 kWh/m2·day in November 2024, coinciding with the characteristic peak irradiation of the regional dry season, and a minimum value of 2.60 kWh/m2·day in May, in the midst of the rainy season This pattern aligns with NASA historical data and readings from the fixed station, both of which exhibited similar seasonal trends, although the fixed station recorded slightly higher irradiation levels due to its static location and absence of moving shadows.
A comparative analysis of the three data sources—the mobile station, the fixed station (4.2 kWh/m2·day), and the NASA historical data (4.0 kWh/m2·day)—reveals notable differences in measured irradiation. The mobile station recorded an 18.8% decrease relative to the fixed station and a 14.7% decrease compared to NASA historical data. These variations can be attributed to urban environmental factors such as tall buildings, signage, trees, utility poles, and overhead cables, which produce partial or complete shading along the tram route, thereby reducing solar irradiation capture. Previous studies conducted in urban settings such as Lisbon have reported comparable losses, ranging from 25% to 50% in densely built-up areas [26]. Likewise, Kanz et al. [27] confirmed that urban shading in Cologne significantly reduced the efficiency of mobile photovoltaic systems integrated into electric vehicles.
Each tram unit operates on a direct-current supply. The direct integration of photovoltaic modules into the onboard DC system eliminates the need for conversion to alternating current. This configuration also avoids reconversion losses during traction. On-site generation further reduces energy losses, because electricity is not transmitted or transformed before reaching the load. To mitigate the effects of partial shading on the tram roof, the design incorporates 535 W half-cut modules. These modules operate with module-level power electronics (DC–DC converters with MPPT). Embedded microcontrollers control these devices, optimize energy capture, and confine losses to the affected modules. This architecture improves overall efficiency. It also ensures higher energy availability for traction.
These modules were selected among commercially available options that balanced power density, weight, and installation constraints for tram roofs. Modules with higher or lower capacities were evaluated, but they did not provide significant advantages for the available space or operational requirements. In particular, 535 W half-cut modules were chosen for tram roofs because their split-cell design reduces resistive losses and improves performance under partial shading, while still meeting the criteria of power density, weight, and installation feasibility. For the maintenance depot, 580 W modules were selected due to local availability and cost considerations, as their higher capacity suits the larger area and remains economically advantageous.
From a technical and operational perspective, the available roof surface of the tram (82.5 m2) could accommodate up to 37 photovoltaic panels of 535 W each, yielding an approximate installed capacity of 19.8 kW and an estimated daily energy output of 41.6 kWh. However, considering that the main objective is to supply energy to auxiliary onboard systems, such as lighting, heating, ventilation, air conditioning, displays, and sensors, it may not be necessary to fully utilize the entire surface area for photovoltaic installation. According to operational data, these auxiliary systems consume a daily average of 28 kWh per tram. Given that, under local conditions, solar irradiation measured by the mobile station reached average values close to 2.90 kWh/m2·day, each 535 Wp photovoltaic panel was estimated to generate approximately 1.1–1.24 kWh/day. Therefore, 24–27 panels per unit would be required to fully meet the energy demand of these systems. This configuration would allow for an estimated daily generation of around 30 kWh, satisfying the stated demand and providing a modest energy surplus. The above analysis demonstrates that utilizing the entire surface area of the tram roof is not required to achieve partial energy autonomy, thus reducing costs, minimizing onboard weight, and facilitating system maintenance. However, factors such as shading, thermal derating, module degradation, and extreme weather conditions—including prolonged rainy seasons, persistent cloud cover, and particulate soiling—may reduce system performance. In large urban environments, soiling-induced losses can range from 5% to 17%, emphasizing the importance of preventive and corrective measures [38]. To mitigate these risks, scheduled cleaning, preventive maintenance, and partial grid backup are recommended. Installing the full 27 panels per unit further ensures a reliable year-round auxiliary power supply by accounting for potential efficiency losses. Similar findings have been reported in railway applications, where rooftop PV integration in locomotives effectively supported auxiliary loads, including lighting and air conditioning, confirming the technical feasibility of this approach for mobile urban transit systems such as trams [39].
These findings are consistent with previous research conducted by Angamarca Avendaño and Juan Carlos Cobos [30], who evaluated an onboard photovoltaic charging system installed on a Chok S2 electric vehicle, using a 350 W solar panel and a battery equalization system. Their study reported a 27.9% increase in vehicle efficiency, demonstrating that onboard photovoltaic integration can yield tangible improvements in energy performance and autonomy, even under variable urban conditions. These results further support the technical feasibility of the proposed mobile system for the tram, particularly in scenarios where the generated energy is allocated to auxiliary systems. In addition, the mobile system offers a thermal advantage that may enhance its energy performance: the constant movement of the tram provides continuous natural ventilation for the panels, thereby lowering their operating temperature. According to Adolf et al. [40], for every degree Celsius below the standard 25 °C, photovoltaic energy conversion efficiency may increase by approximately 0.3% to 0.5%. This suggests that the dynamic convective cooling effect could partially offset shading-related losses, provided that the system’s thermal design is properly optimized.
Within the same renewable energy framework, a usable surface area of 4754 m2 was identified at the maintenance depot of Cuenca’s tram system, specifically on the mechanical workshop rooftops, for the installation of a fixed photovoltaic system. This space could accommodate up to 1841 solar panels of 580 Wp each, enabling a total installed capacity of approximately 1.068 MWp Based on local average irradiation levels—measured at approximately 4.2 kWh/m2·day by both fixed and mobile stations—and an estimated system performance ratio of 0.78, the proposed fixed photovoltaic system is expected to generate approximately 1.274 GWh/year. When compared to the combined annual electricity consumption of the tram system’s two feeder lines, totaling 1.572 GWh, the estimated output would account for approximately 81% of the system’s total annual energy demand. These findings demonstrate the technical feasibility of installing a fixed photovoltaic system at the tram’s maintenance depot, which would substantially reduce reliance on the conventional electrical grid and enhance the sustainability of the urban transport system. Moreover, to maximize the energy supply to the tram system, complementary photovoltaic systems could be implemented on other available infrastructures, such as tram stops, station roofs, or nearby municipal spaces.
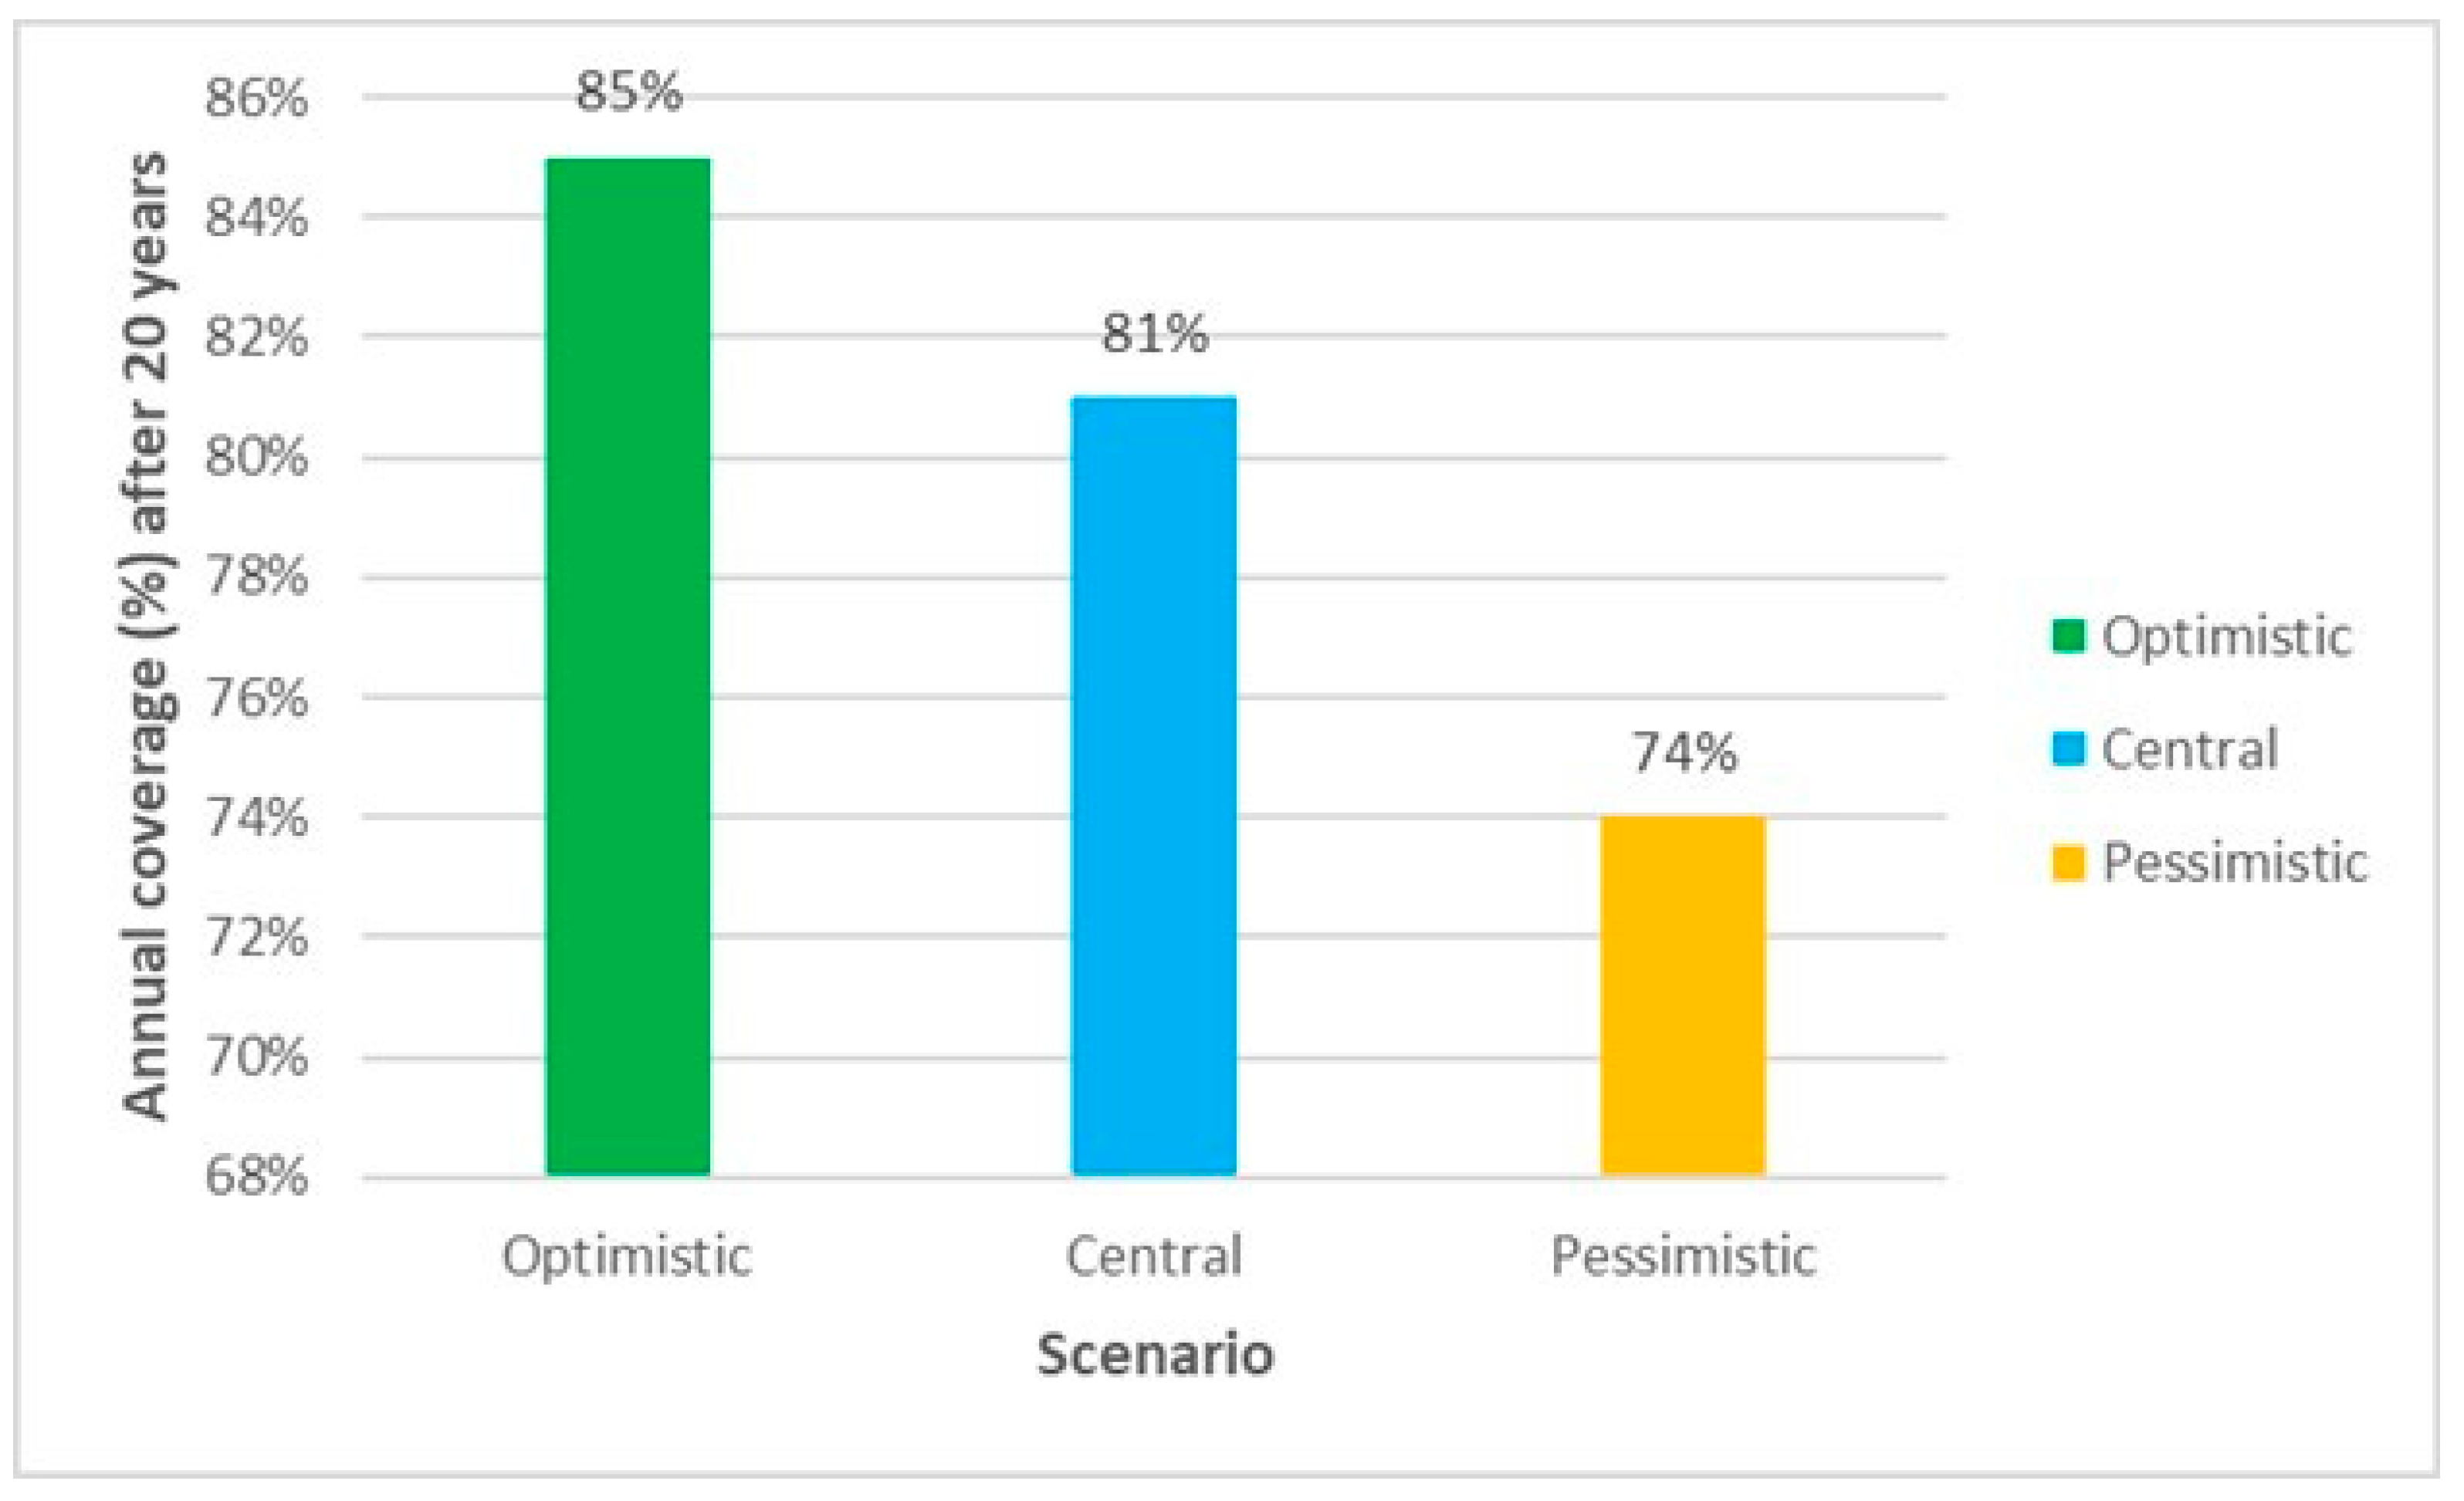
Although the estimated annual coverage for the fixed photovoltaic system is 81%, the sensitivity analysis indicates that this value may fluctuate between approximately 74% and 85% (Figure 16), considering uncertainties in system performance (±5%), inter-annual irradiance variability (±7%), and module degradation (0.5–1% per year). This variability highlights the need to incorporate safety margins in the design, as well as complementary strategies such as partial grid backup and energy storage, to ensure reliable long-term operation.
These complementary systems would facilitate progress toward meeting energy demands or achieving a positive energy balance, thereby reinforcing the city’s commitment to sustainable mobility and energy efficiency.
Moreover, an economic assessment of implementing the mobile photovoltaic system on a single tram was conducted. The main components include 27 solar panels of 535 Wp each, a 60 A MPPT charge controller, DC–DC converters, batteries, inverters, and associated cable management and protective devices. The estimated total cost per tram is approximately USD 6960–11,700. Considering the auxiliary energy demand of 28 kWh/day per tram and the average local electricity tariff for medium-voltage consumers of USD 0.116/kWh [41], the system can generate around 30 kWh/day (10,950 kWh/year), fully covering the auxiliary load with a modest surplus. Consequently, the estimated simple payback period for the investment is approximately 5.93–7.97 years. This analysis demonstrates that integrating photovoltaic systems into the tram fleet is technically feasible and economically justified for supporting auxiliary loads.
Similarly, an economic assessment of the fixed photovoltaic system proposed for the tram maintenance depot was carried out. The installation includes 1841 photovoltaic modules of 580 Wp, arranged over 4754 m2 of rooftop area, with a total installed capacity of 1.068 MWp. Based on market references for rooftop photovoltaic projects in Ecuador USD 0.85–1.10/Wp, including equipment, mounting structures, and installation), the required investment is estimated at USD 0.91–1.17 million. With an expected annual generation of 1.274 GWh, and considering the average electricity tariff for medium-voltage consumers USD 0.116/kWh [41], the system could produce annual savings of approximately USD 147,784, supplying about 81% of the energy demand of the tram network. The simple payback period, estimated at 6.63–8.58 years.
Although this study did not include a detailed maintenance cost analysis, the proposed mobile PV system is expected to require minimal upkeep, mainly periodic cleaning of panels and routine inspections of wiring, batteries, and electronics. The O&M (Operations and Maintenance) cost is expected to be low (<2% of CapEx (Capital expenditure) annually) but should be quantified in future studies. Future work should incorporate a comprehensive operation and maintenance cost assessment to complement the economic evaluation.
On the other hand, one of the main limitations of this study was the partial data loss during April 2024, caused by storage system failures. Additionally, the measuring system comprised low-cost sensors, which may have introduced an estimated uncertainty of ±5% in the irradiance readings. Nevertheless, the readings were validated against a reference pyranometer, and more than 95% of recorded values fell within the ±12 W/m2 limits of agreement according to the Bland–Altman. Moreover, absolute percentage errors remained below 3.5%, which indicates high accuracy and the absence of systematic bias. This strong agreement supports the reliability of the collected data and justifies considering them technically valid for estimating the solar resource in the study area. Although these tolerances could theoretically affect long-term performance estimates, their impact is minimal for a mobile, distributed system such as a tram. The installation of 27 panels per unit provides a sufficient safety margin, effectively compensating for potential errors in solar irradiation measurements. Therefore, the resulting uncertainty is considered negligible at the feasibility and design stage and does not compromise the reliability of the auxiliary power supply.
For future research, it is advisable to enhance the monitoring system by incorporating additional sensors for temperature, humidity, and panel tilt angle, alongside exploring the implementation of solar tracking mechanisms and backup batteries. Furthermore, the integration of artificial intelligence and real-time meteorological data could enable predictive optimization of solar energy capture in complex urban settings.
Overall, the results not only validate the effectiveness of the developed system but also highlight clear opportunities for integrating solar technologies into urban transport, through mobile and fixed installations—corresponding to onboard systems and supporting infrastructure, respectively—yielding energy, economic, and environmental benefits in the short to medium term. Future work could apply probabilistic or stochastic optimization techniques. These methods have already been used in renewable-based microgrids [42]. Their application would improve the representation of seasonal and interannual solar variability. They would also enhance the robustness of decision-making under uncertainty.

5. Conclusions

This study aimed to evaluate the technical feasibility of integrating solar energy into the tram infrastructure of Cuenca, an Andean city with complex topographic and climatic conditions. The findings provide the following key conclusions:
  • Feasibility of photovoltaic integration: The results demonstrate that solar energy integration is technically feasible for the Cuenca tram system. Fixed installations at the tram maintenance depot could supply up to 81% of annual energy demand, while rooftop mobile systems are suitable for auxiliary loads.
  • Quantified shading losses: Monitoring revealed that shading from urban structures reduces the effective solar resource by 14.7% to 18.8% compared to fixed-site conditions, a critical factor to consider in engineering design.
  • Potential and limitations of engineering applications: Photovoltaic integration offers substantial potential to enhance sustainability in urban mobility. However, its performance is limited by environmental variability, shading, and the need for complementary solutions such as intelligent energy management, hybrid renewable systems, and preventive maintenance.
Overall, this study establishes a basis for the application of photovoltaic systems in urban transport infrastructure in Andean contexts, providing a replicable model for other cities with similar geographic and climatic challenges.
Future studies should investigate the incorporation of additional environmental sensors, the application of solar tracking and hybrid solar–wind systems, the use of optimized storage and backup solutions, and the integration with smart grid platforms. Moreover, further work should include a preliminary life cycle assessment (LCA) to evaluate environmental impacts and extend the analysis to other tram systems in mountainous regions in order to test the generalizability of the findings.

Author Contributions

Conceptualization, M.-G.R.-V., C.F.-V., M.Á.-V. and J.-C.C.-T.; Data curation, M.-G.R.-V. and J.-C.C.-T.; Formal analysis, M.-G.R.-V., C.F.-V. and J.-C.C.-T.; Funding acquisition, J.-C.C.-T.; Investigation, M.-G.R.-V. and J.-C.C.-T.; Methodology, M.-G.R.-V., C.F.-V., M.Á.-V. and J.-C.C.-T.; Project administration, J.-C.C.-T.; Resources, J.-C.C.-T.; Supervision, M.-G.R.-V., C.F.-V., M.Á.-V. and J.-C.C.-T.; Validation, M.-G.R.-V., M.Á.-V. and J.-C.C.-T.; Visualization, M.-G.R.-V. and C.F.-V.; Writing—original draft, M.-G.R.-V., C.F.-V. and M.Á.-V.; Writing—review & editing, J.-C.C.-T. All authors have read and agreed to the published version of the manuscript.

Funding

This research was funded by the project “EVALUACIÓN Y MONITOREO DE BIENES INMUEBLES PATRIMONIALES IoT. ETAPA 1”, PICODS21-47 at Universidad Católica de Cuenca.

Data Availability Statement

The raw data supporting the conclusions of this article will be made available by the authors upon request.

Acknowledgments

This study was conducted as part of the activities of the ‘Laboratorio de Robótica, Automatización, Sistemas Inteligentes y Embebidos (RobLab)’ laboratory; ‘Sistemas Embebidos y Visión Artificial en Ciencias Arquitectónicas, Agropecuarias, Ambientales y Automática (SEVA4CA)’ research group at Universidad Católica de Cuenca, and as part of the project titled ‘EVALUACIÓN Y MONITOREO DE BIENES INMUEBLES PATRIMONIALES IoT. ETAPA 1.’ The authors gratefully acknowledge the logistical and technical support provided by the ‘Patio Taller del Tranvía de Cuenca’ during the execution of this research, including permission to install and operate the monitoring system on one of its vehicles. In addition, the authors acknowledge the support of the technical and administrative staff involved in the successful measurement process.

Conflicts of Interest

The authors declare no conflicts of interest regarding the preparation and publication of this article.

Appendix A

Figure A1. Detailed printed circuit board (PCB) design for the solar irradiance monitoring system: (a) Schematic diagram of the electronic components and connections; (b) PCB layout showing the routing and integration of the modules.
Energies 18 05143 g0a1

Appendix B

Table A1. Load calculation for the solar irradiance monitoring module, applicable to both the fixed solar station and the mobile solar station.
No.Electronic ModuleVCCPower (mW)Power (W)Current (mA)Current (A)
1Memory module
(Micro SD card)
(SanDisk, Milpitas, CA, USA)
510001.00002000.2000
2Real-Time Clock Module
(DS3231)
(Maxim Integrated/Analog Devices, San José, CA, USA)
510.00050.10.0001
3Voltage Regulator
(LM2596)
(Texas Instruments, Dallas, TX, USA)
(Espressif Systems, Shanghai, China)
5500.0500100.0100
4Microcontroller (ESP-32)58500.85001700.1700
5Georeferencing Module
(GPS NEO-6M)
(u-blox AG, Thalwil, Switzerland)
52250.2250450.0450
6Current Sensor Module
(ACS-712)
(Allegro MicroSystems, Manchester, NH, USA)
5550.0550110.0110
7Arduino Nano Microcontroller
(ATmega38)
(Arduino AG, Ivrea, Italy/Microchip Technology, Chandler, AZ, USA)
52000.2000400.0400
TOTAL 23812.38054760.4761
Note: Developed by the authors.

References

  1. Devabhaktuni, V.; Alam, M.; Depuru, S.S.S.R.; Green, R.C., II; Nims, D.; Near, C. Solar Energy: Trends and Enabling Technologies. Renew. Sustain. Energy Rev. 2013, 19, 555–564. [Google Scholar] [CrossRef]
  2. Saud, S.; Danish; Chen, S. An Empirical Analysis of Financial Development and Energy Demand: Establishing the Role of Globalization. Environ. Sci. Pollut. Res. 2018, 25, 24326–24337. [Google Scholar] [CrossRef]
  3. Mi, D.; Kim, J.-H.; Kim, H.U.; Xu, F.; Hwang, D.-H. Fullerene Derivatives as Electron Acceptors for Organic Photovoltaic Cells. J. Nanosci. Nanotechnol. 2014, 14, 1064–1084. [Google Scholar] [CrossRef]
  4. Burritt, R.L. Environmental Performance Accountability: Planet, People, Profits. Account. Audit. Account. J. 2012, 25, 370–405. [Google Scholar] [CrossRef]
  5. Jones, L.E.; Olsson, G. Solar Photovoltaic and Wind Energy Providing Water. Glob. Chall. 2017, 1, 1600022. [Google Scholar] [CrossRef]
  6. Gençer, E.; Agrawal, R. Synthesis of Efficient Solar Thermal Power Cycles for Baseload Power Supply. Energy Convers. Manag. 2017, 133, 486–497. [Google Scholar] [CrossRef]
  7. Kothari, R.; Tyagi, V.V.; Pathak, A. Waste-to-Energy: A Way from Renewable Energy Sources to Sustainable Development. Renew. Sustain. Energy Rev. 2010, 14, 3164–3170. [Google Scholar] [CrossRef]
  8. Zahraoui, Y.; Basir Khan, M.R.; Alhamrouni, I.; Mekhilef, S.; Ahmed, M. Current Status, Scenario, and Prospective of Renewable Energy in Algeria: A Review. Energies 2021, 14, 2354. [Google Scholar] [CrossRef]
  9. Hayat, M.B.; Ali, D.; Monyake, K.C.; Alagha, L.; Ahmed, N. Solar Energy—A Look into Power Generation, Challenges, and a Solar-Powered Future. Int. J. Energy Res. 2019, 43, 1049–1067. [Google Scholar] [CrossRef]
  10. Akikur, R.K.; Saidur, R.; Ping, H.W.; Ullah, K.R. Comparative Study of Stand-Alone and Hybrid Solar Energy Systems Suitable for off-Grid Rural Electrification: A Review. Renew. Sustain. Energy Rev. 2013, 27, 738–752. [Google Scholar] [CrossRef]
  11. Xinhua La Energía Renovable Representa El 56 Por Ciento de La Capacidad Instalada Total de China. Available online: https://english.www.gov.cn/archive/statistics/202501/28/content_WS6798de96c6d0868f4e8ef410.html (accessed on 9 June 2025).
  12. China-World Energy Investment 2024-Analysis-IEA. Available online: https://www.iea.org/reports/world-energy-investment-2024/china (accessed on 9 June 2025).
  13. Brazil|Ember. Available online: https://ember-energy.org/countries-and-regions/brazil/ (accessed on 9 June 2025).
  14. Brasil Logra Crecimiento Récord Del 18.7% En Generación de Energía|Agência Brasil. Available online: https://agenciabrasil.ebc.com.br/en/economia/noticia/2024-07/brazil-achieves-record-187-growth-power-generation (accessed on 9 June 2025).
  15. Brazil’s Power Gen Expands at Record Rate in 2024|Latest Market News. Available online: https://www.argusmedia.com/en/news-and-insights/latest-market-news/2646593-brazil-s-power-gen-expands-at-record-rate-in-2024 (accessed on 9 June 2025).
  16. Neves Lívia Brazil Generates 88% of Power from Renewables in 2024-Pv Magazine International. Available online: https://www.pv-magazine.com/2025/06/02/brazil-generates-88-of-power-from-renewables-in-2024/ (accessed on 9 June 2025).
  17. Dimitriou, T.; Skandalos, N.; Karamanis, D. Progress in Improving Photovoltaics Longevity. Appl. Sci. 2024, 14, 10373. [Google Scholar] [CrossRef]
  18. Yadav, A.K.; Chandel, S.S. Tilt Angle Optimization to Maximize Incident Solar Radiation: A Review. Renew. Sustain. Energy Rev. 2013, 23, 503–513. [Google Scholar] [CrossRef]
  19. Kumar, R.R.; Chakraborty, A.; Mandal, P. Promoting Electric Vehicle Adoption: Who Should Invest in Charging Infrastructure? Transp. Res. E Logist. Transp. Rev. 2021, 149, 102295. [Google Scholar] [CrossRef]
  20. Arioli, M.; Fulton, L.; Lah, O. Transportation Strategies for a 1.5 °C World: A Comparison of Four Countries. Transp. Res. D Transp. Environ. 2020, 87, 102526. [Google Scholar] [CrossRef]
  21. Osorio-Gómez, G.; Mejía-Gutiérrez, R.; Suárez-Castañeda, N.; Gil-Herrera, A.M.; Barrera-Velásquez, J.A. Solar Array Design Based on Shadow Analysis for Increasing Net Energy Collection in a Competition Vehicle. J. Photonics Energy 2015, 5, 53091. [Google Scholar] [CrossRef]
  22. Alghamdi, A.S.; Bahaj, A.S.; Wu, Y. Assessment of Large Scale Photovoltaic Power Generation from Carport Canopies. Energies 2017, 10, 686. [Google Scholar] [CrossRef]
  23. Mundo-Hernández, J.; de Celis Alonso, B.; Hernández-Álvarez, J.; de Celis-Carrillo, B. An Overview of Solar Photovoltaic Energy in Mexico and Germany. Renew. Sustain. Energy Rev. 2014, 31, 639–649. [Google Scholar] [CrossRef]
  24. Maurer, F.; Rieke, C.; Schemm, R.; Stollenwerk, D. Analysis of an Urban Grid with High Photovoltaic and e-Mobility Penetration. Energies 2023, 16, 3380. [Google Scholar] [CrossRef]
  25. Cano, A.; Arévalo, P.; Benavides, D.; Jurado, F. Sustainable Tramway, Techno-Economic Analysis and Environmental Effects in an Urban Public Transport. A Comparative Study. Sustain. Energy Grids Netw. 2021, 26, 100462. [Google Scholar] [CrossRef]
  26. Centeno Brito, M.; Santos, T.; Moura, F.; Pera, D.; Rocha, J. Urban Solar Potential for Vehicle Integrated Photovoltaics. Transp. Res. D Transp. Environ. 2021, 94, 102810. [Google Scholar] [CrossRef]
  27. Kanz, O.; Reinders, A.; May, J.; Ding, K. Environmental Impacts of Integrated Photovoltaic Modules in Light Utility Electric Vehicles. Energies 2020, 13, 5120. [Google Scholar] [CrossRef]
  28. Bondu, P.K.R.; Usha, V.R. Design and analysis of novel topology for PV-FED EV charging system. J. Eng. Technol. Ind. Appl. 2024, 10, 109–114. [Google Scholar] [CrossRef]
  29. Kancherla, A.B.; Prasad, N.B.; Kishore, D.R. PV-Based Grid Integrated EV with GWO Optimized PI Controller for Boost Integrated Luo Converter. J. Inst. Eng. Ser. B 2024, 105, 309–321. [Google Scholar] [CrossRef]
  30. Angamarca-Avendaño, D.A.; Saquicela-Moncayo, J.F.; Capa-Carrillo, B.H.; Cobos-Torres, J.C. Charge Equalization System for an Electric Vehicle with a Solar Panel. Energies 2023, 16, 3360. [Google Scholar] [CrossRef]
  31. Angamarca-Avendaño, D.-A.; Flores-Vázquez, C.; Cobos-Torres, J.-C. A Photovoltaic and Wind-Powered Electric Vehicle with a Charge Equalizer. Energies 2024, 17, 4665. [Google Scholar] [CrossRef]
  32. Ordóñez, M.; Javier, R. Potencial de Generación Fotovoltaica en Trayectorias de Transporte Urbano (Caso de Estudio en la Ciudad de Cuenca); Universidad Católica de Cuenca: Cuenca, Ecuador, 2022. [Google Scholar]
  33. Gobierno Autónomo Descentralizado Municipal del Cantón Cuenca. En Cuenca Se Inauguró Primera Planta Solar Térmica Como Parte de Proyecto Sustentable|GAD Municipal de Cuenca. Available online: https://www.cuenca.gob.ec/content/en-cuenca-se-inauguro-primera-planta-solar-termica-como-parte-de-proyecto-sustentable (accessed on 20 August 2025).
  34. Tranvía de Cuenca. Available online: https://es.wikipedia.org/wiki/Tranv%C3%ADa_de_Cuenca (accessed on 20 August 2025).
  35. BYD Bus Eléctrico de Cuenca Presenta Resultados Positivos y Realiza Recorridos a Delegaciones Del Foro de Ciudades Intermedias-BYD Eléctrico Ecuador. Available online: https://bydelectrico.com/ec/new/bus-electrico-cuenca-presenta-resultados-positivos-realiza-recorridos-delegaciones-del-foro-ciudades-intermedias/ (accessed on 20 August 2025).
  36. Cevallos-Escandón, A.; Barragan-Escandón, E.A.; Zalamea-León, E.; Serrano-Guerrero, X.; Terrados-Cepeda, J. Assessing the Feasibility of Hydrogen and Electric Buses for Urban Public Transportation using Rooftop Integrated Photovoltaic Energy in Cuenca Ecuador. Energies 2023, 16, 5569. [Google Scholar] [CrossRef]
  37. POWER|DAV. Available online: https://power.larc.nasa.gov/data-access-viewer/ (accessed on 9 June 2025).
  38. Uykan, O.; Çelik, G.; Birgül, A. Quantifying the Impact of Soiling and Thermal Stress on Rooftop PV Performance: Seasonal Analysis from an Industrial Urban Region in Türkiye. Sustainability 2025, 17, 8038. [Google Scholar] [CrossRef]
  39. Darvishpour, Y.; Mousavi Gazafrudi, S.M.; Jafari Kaleybar, H.; Brenna, M. Integration of Rooftop Solar PV on Trains: Comparative Analysis of MPPT Methods for Auxiliary Power Supply of Locomotives in Milan. Electronics 2024, 13, 3537. [Google Scholar] [CrossRef]
  40. Adolf, K.; Uzorka, A. Effects of Substrates on the Efficiency of a Monocrystalline Solar Panel. Sci. Rep. 2025, 15, 6667. [Google Scholar] [CrossRef]
  41. ARCONEL Aprueba Reforma al Pliego Tarifario Del Servicio Público de Energía Eléctrica Para 2025. Available online: https://avl.com.ec/arconel-aprueba-reforma-al-pliego-tarifario-del-servicio-publico-de-energia-electrica-para-2025/ (accessed on 19 August 2025).
  42. Li, Y.; Li, K.; Yang, Z.; Yu, Y.; Xu, R.; Yang, M. Stochastic Optimal Scheduling of Demand Response-Enabled Microgrids with Renewable Generations: An Analytical-Heuristic Approach. J. Clean. Prod. 2022, 330, 129840. [Google Scholar] [CrossRef]
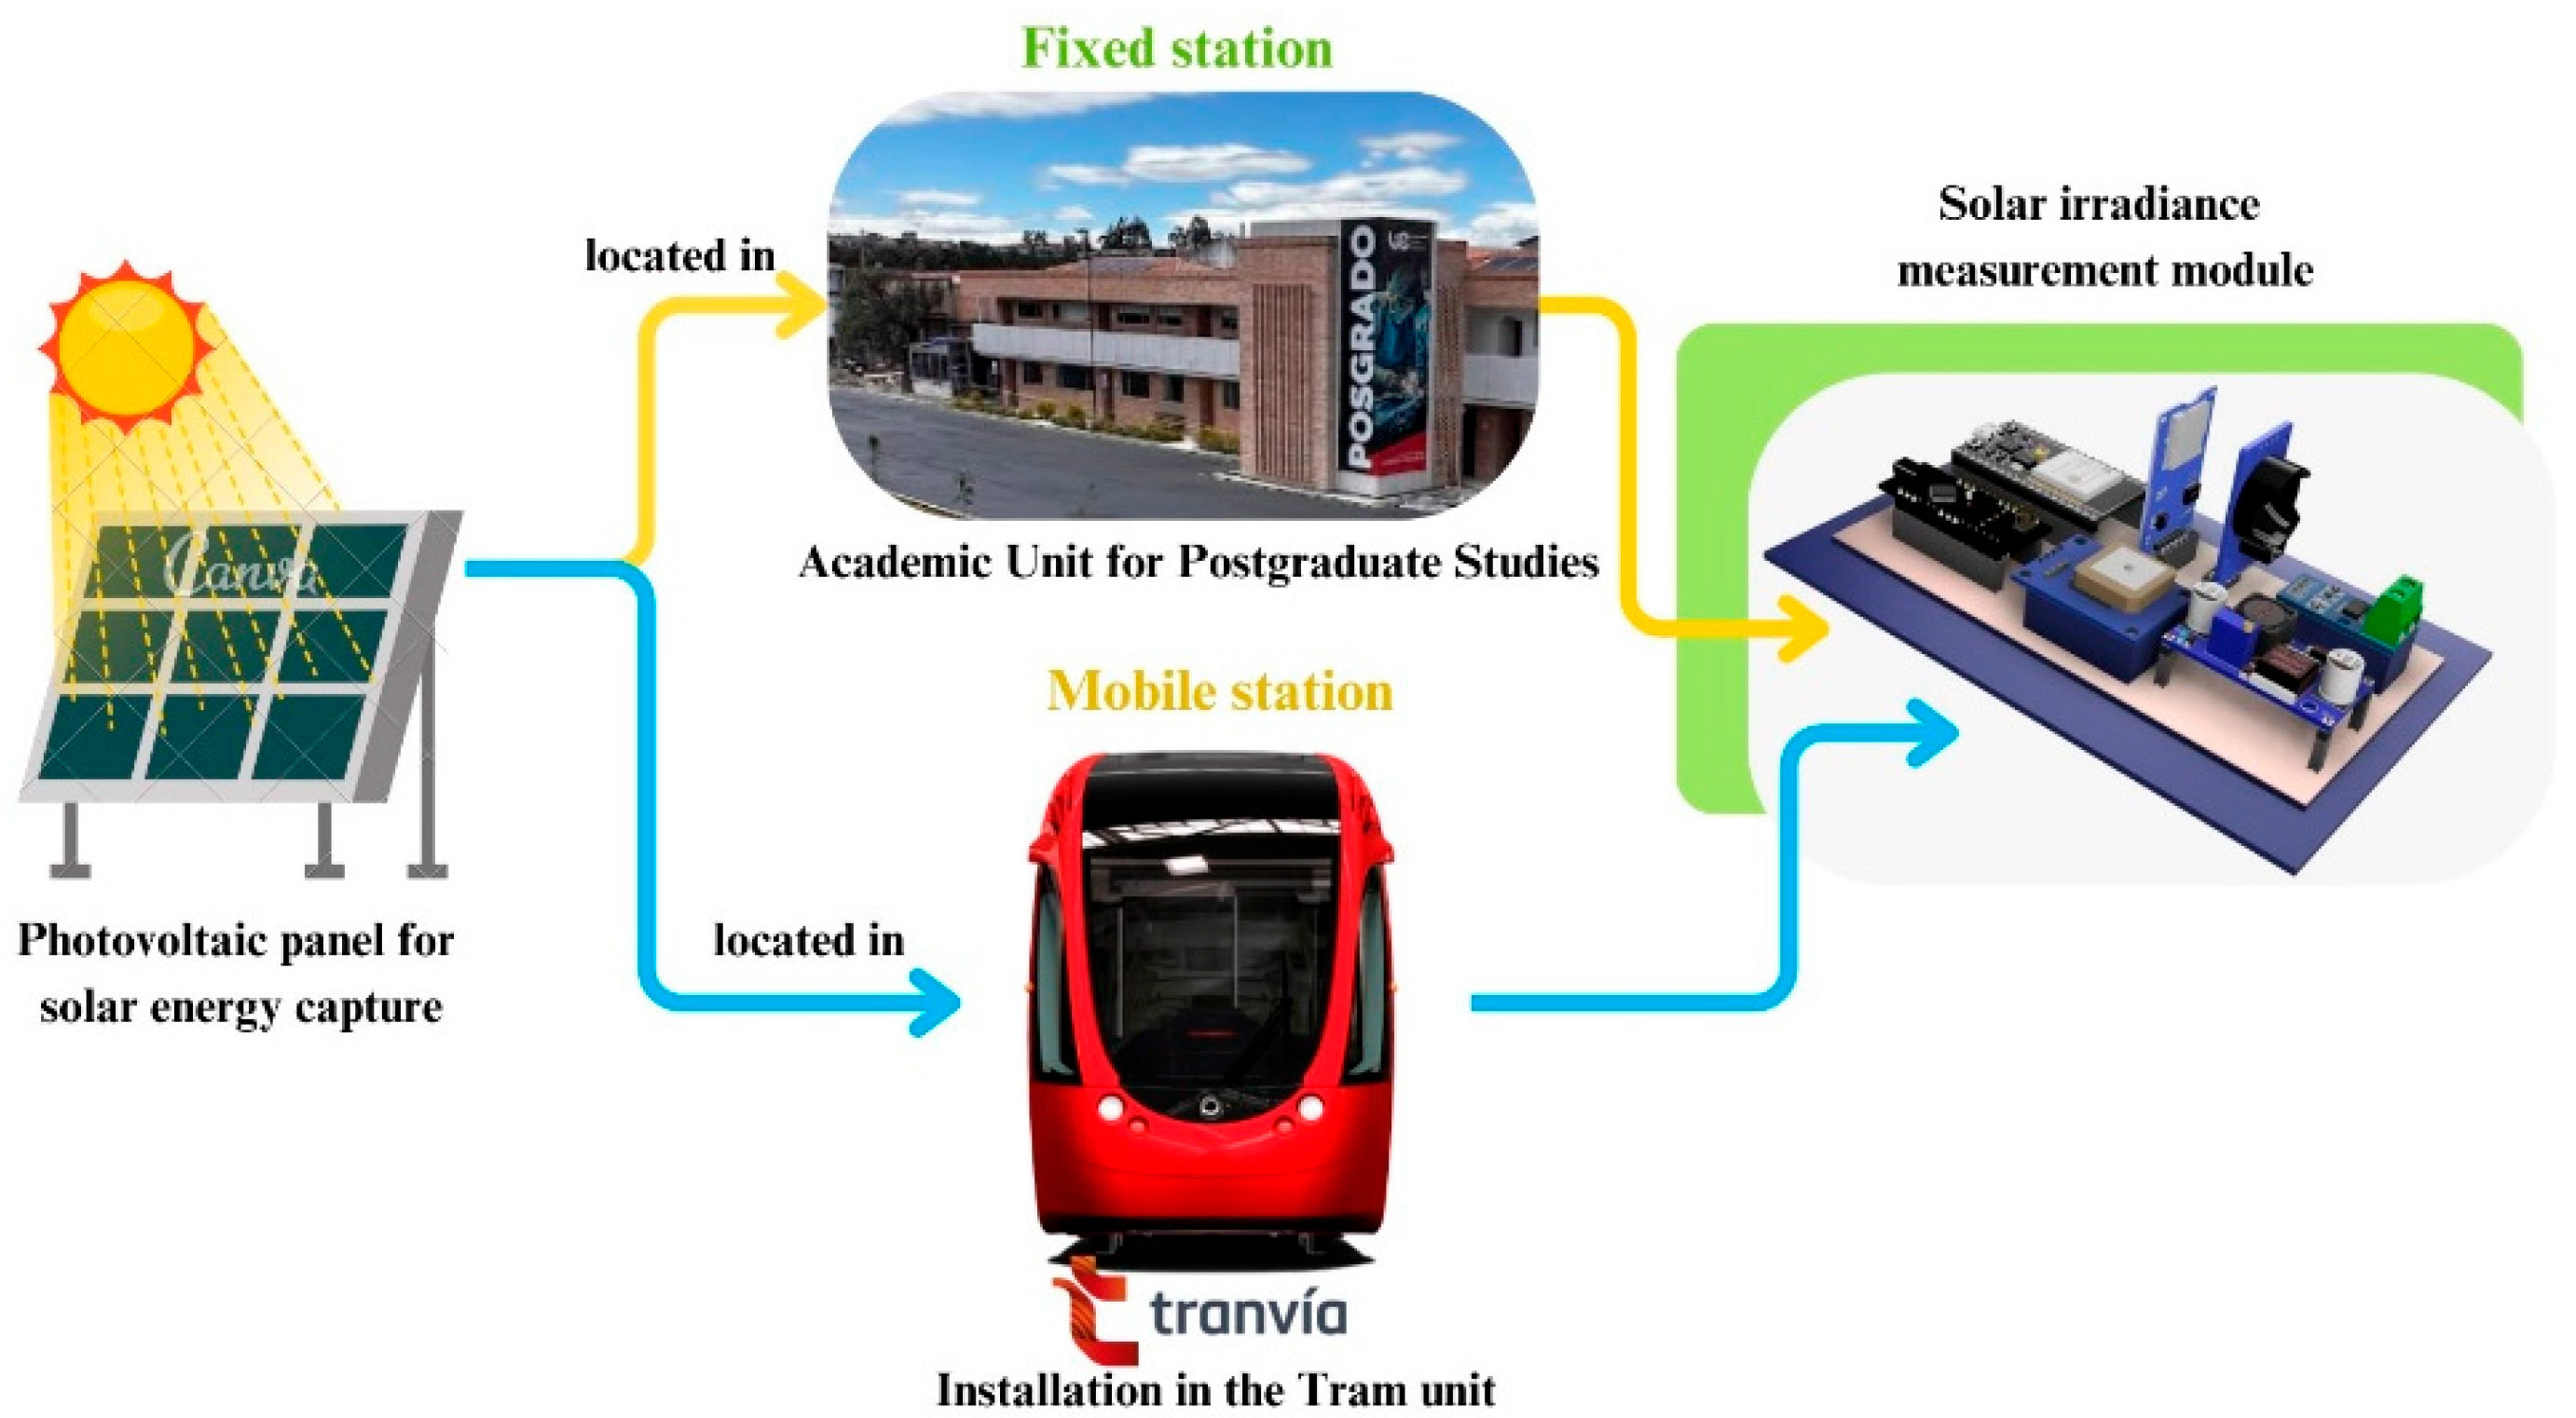
Figure 1. Hybrid solar irradiation monitoring system with fixed and mobile stations. Note: Developed by the authors.
Energies 18 05143 g001
Figure 2. Solar irradiance measuring system—fixed station: (a) Electronic circuit of the solar irradiance measuring system installed at the fixed station, including microcontrollers, sensors, and data acquisition modules; (b) 3D model of the instrument case to integrate the monitoring system, grid connection, and input from the photovoltaic panels. Note: Developed by the authors.
Energies 18 05143 g002
Figure 3. Solar irradiance measuring system—mobile station: (a) Diagram of the electronic system for measuring solar irradiance in the mobile station, comprising the data acquisition module and the autonomous power supply system consisting of photovoltaic panels, a battery, and a charge controller; (b) 3D model of the mobile metal structure, engineered to integrate the measuring system and the power supply components, optimized for installation on the tram unit. Note: Developed by the authors.
Energies 18 05143 g003
Figure 4. Electronic components and power system for measuring solar irradiance. Note: Developed by the authors.
Energies 18 05143 g004
Figure 5. Overview of the PCB design for the solar irradiance monitoring system: 3D model showing the integration of modules. 1. Memory Reader module, 2. Real-Time Clock module, 3 Current module sensor, 4. Voltage Regulator, 5 GPS module, 6. Arduino Nano board, and 7. ESP32 board. Detailed schematics and PCB layout are provided in Appendix A. Note: Developed by the authors.
Energies 18 05143 g005
Figure 6. Flowchart of the data collection and processing workflow for the solar irradiance monitoring system. (Solid arrows represent the main process flow, looped arrows indicate conditional repetition, and the dashed box shows additional functions executed by the ESP32). Note: Developed by the authors.
Energies 18 05143 g006
Figure 7. Experimental testing of the solar irradiance measuring system: (a) monitoring and data acquisition station in field operation; (b) calibration process for fixed and mobile stations using a pyranometer. Note: Developed by the authors.
Energies 18 05143 g007
Figure 8. Bland–Altman plots for solar irradiance calibration: comparison between the developed system and the reference pyranometer. Circles represent the measurement differences, the blue solid line indicates the mean bias, the red dotted line represents the zero reference, and the black dashed lines denote the limits of agreement. Note: Developed by the authors.
Energies 18 05143 g008
Figure 9. Fixed station prototype for monitoring solar irradiance: (a) internal layout showing the integration of electronic components and modules (microcontroller, GPS, sensors, converters, etc.); (b) structural assembly of the measuring box with LCD screen displaying irradiance, current, and time readings.
Energies 18 05143 g009
Figure 10. Solar system integration on tram unit 1007—car M2. Note: Developed by the authors.
Energies 18 05143 g010
Figure 11. Route of the Cuenca tram. The blue line represents the tram route, and the red points indicate the official tram stations. The place names appearing in the figures are kept in Spanish, as they are proper nouns. Note: Developed by the authors.
Energies 18 05143 g011
Figure 12. Monthly solar irradiation comparison between historical data (NASA) and readings from mobile and fixed stations.
Energies 18 05143 g012
Figure 13. Monthly irradiation heatmaps corresponding to the onset and peak of the rainy season: (a) November 2023, (b) December 2023, (c) January 2024, (d) February 2024, (e) March 2024. The place names appearing in the figures are kept in Spanish, as they are proper nouns. Note: Developed by the authors. The color gradient represents solar irradiation levels, where blue indicates lower values and red indicates higher values.
Energies 18 05143 g013
Figure 14. Monthly irradiation heatmaps during the transition and dry seasons: (a) April 2024, (b) May 2024, (c) June 2024, (d) July 2024, (e) August 2024, (f) September 2024. The place names appearing in the figures are kept in Spanish, as they are proper nouns. Note: Developed by the authors. The color gradient represents solar irradiation levels, where blue indicates lower values and red indicates higher values.
Energies 18 05143 g014
Figure 15. Monthly irradiation heatmaps illustrating the transition from the dry season to the onset of the rainy season: (a) October 2024, (b) November 2024, (c) December 2024. The place names appearing in the figures are kept in Spanish, as they are proper nouns. Note: Developed by the authors. the color gradient represents solar irradiation levels, where blue indicates lower values and red indicates higher values.
Energies 18 05143 g015
Figure 16. Annual coverage of the 1.068 MWp PV system after 20 years under three scenarios, accounting for technical and environmental uncertainties.
Energies 18 05143 g016
Disclaimer/Publisher’s Note: The statements, opinions and data contained in all publications are solely those of the individual author(s) and contributor(s) and not of MDPI and/or the editor(s). MDPI and/or the editor(s) disclaim responsibility for any injury to people or property resulting from any ideas, methods, instructions or products referred to in the content.