Enhancing Rural Energy Resilience Through Combined Agrivoltaic and Bioenergy Systems: A Case Study of a Real Small-Scale Farm in Southern Italy
Abstract
1. Introduction
- -
- How do different APV configurations affect crop yields in areas characterized by high solar radiation?
- -
- What is the optimal integration strategy for combining APV with biomass cogeneration to achieve energy self-sufficiency?
- -
- How do evolving energy market conditions affect the economic viability of integrated APV+biomass systems?
- -
- What are the practical implementation challenges for small-scale farms, particularly in rural Southern Italy?
1.1. APV Technology
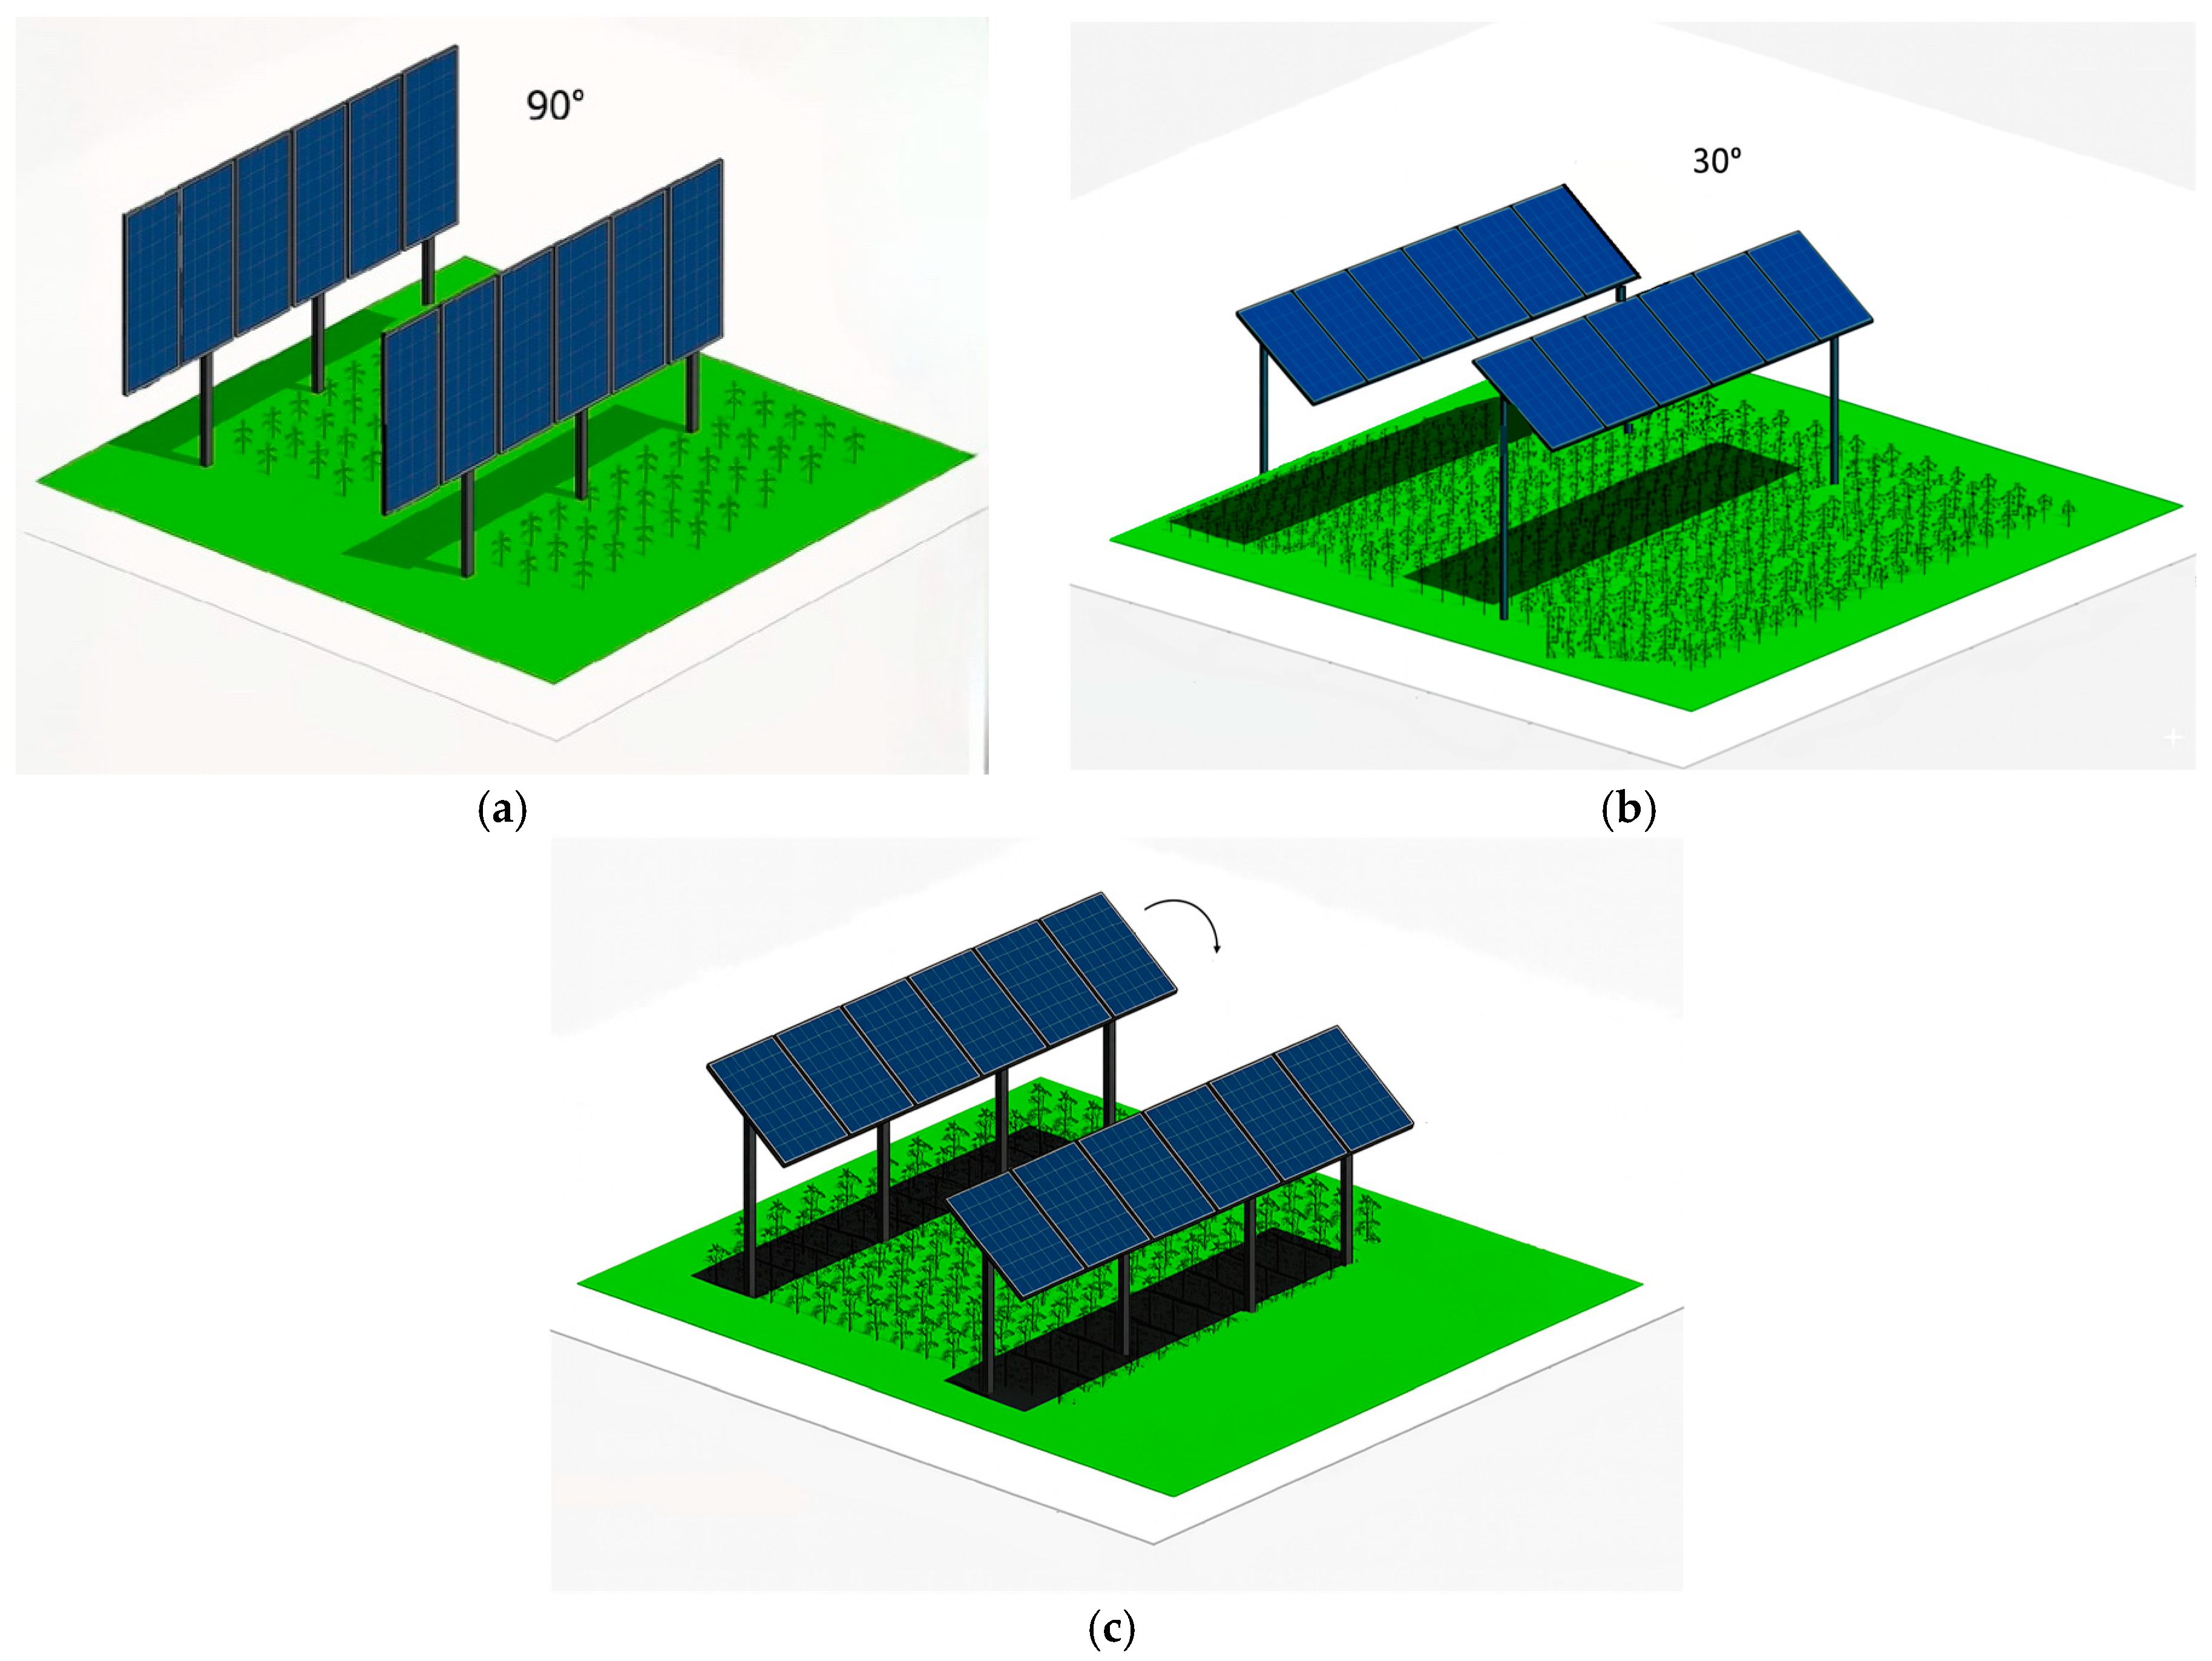
- Fixed-mounted systems are characterized by elevated panels mounted at predetermined heights and tilt angles, providing partial shading to underlying crops.
- Vertical bifacial systems utilize bifacial PV modules installed in vertical east–west orientations, creating alternating patterns of light and shade throughout the day.
- Dynamic systems employ tracking technologies to optimize panel orientation relative to solar position, potentially adjustable based on crop requirements.
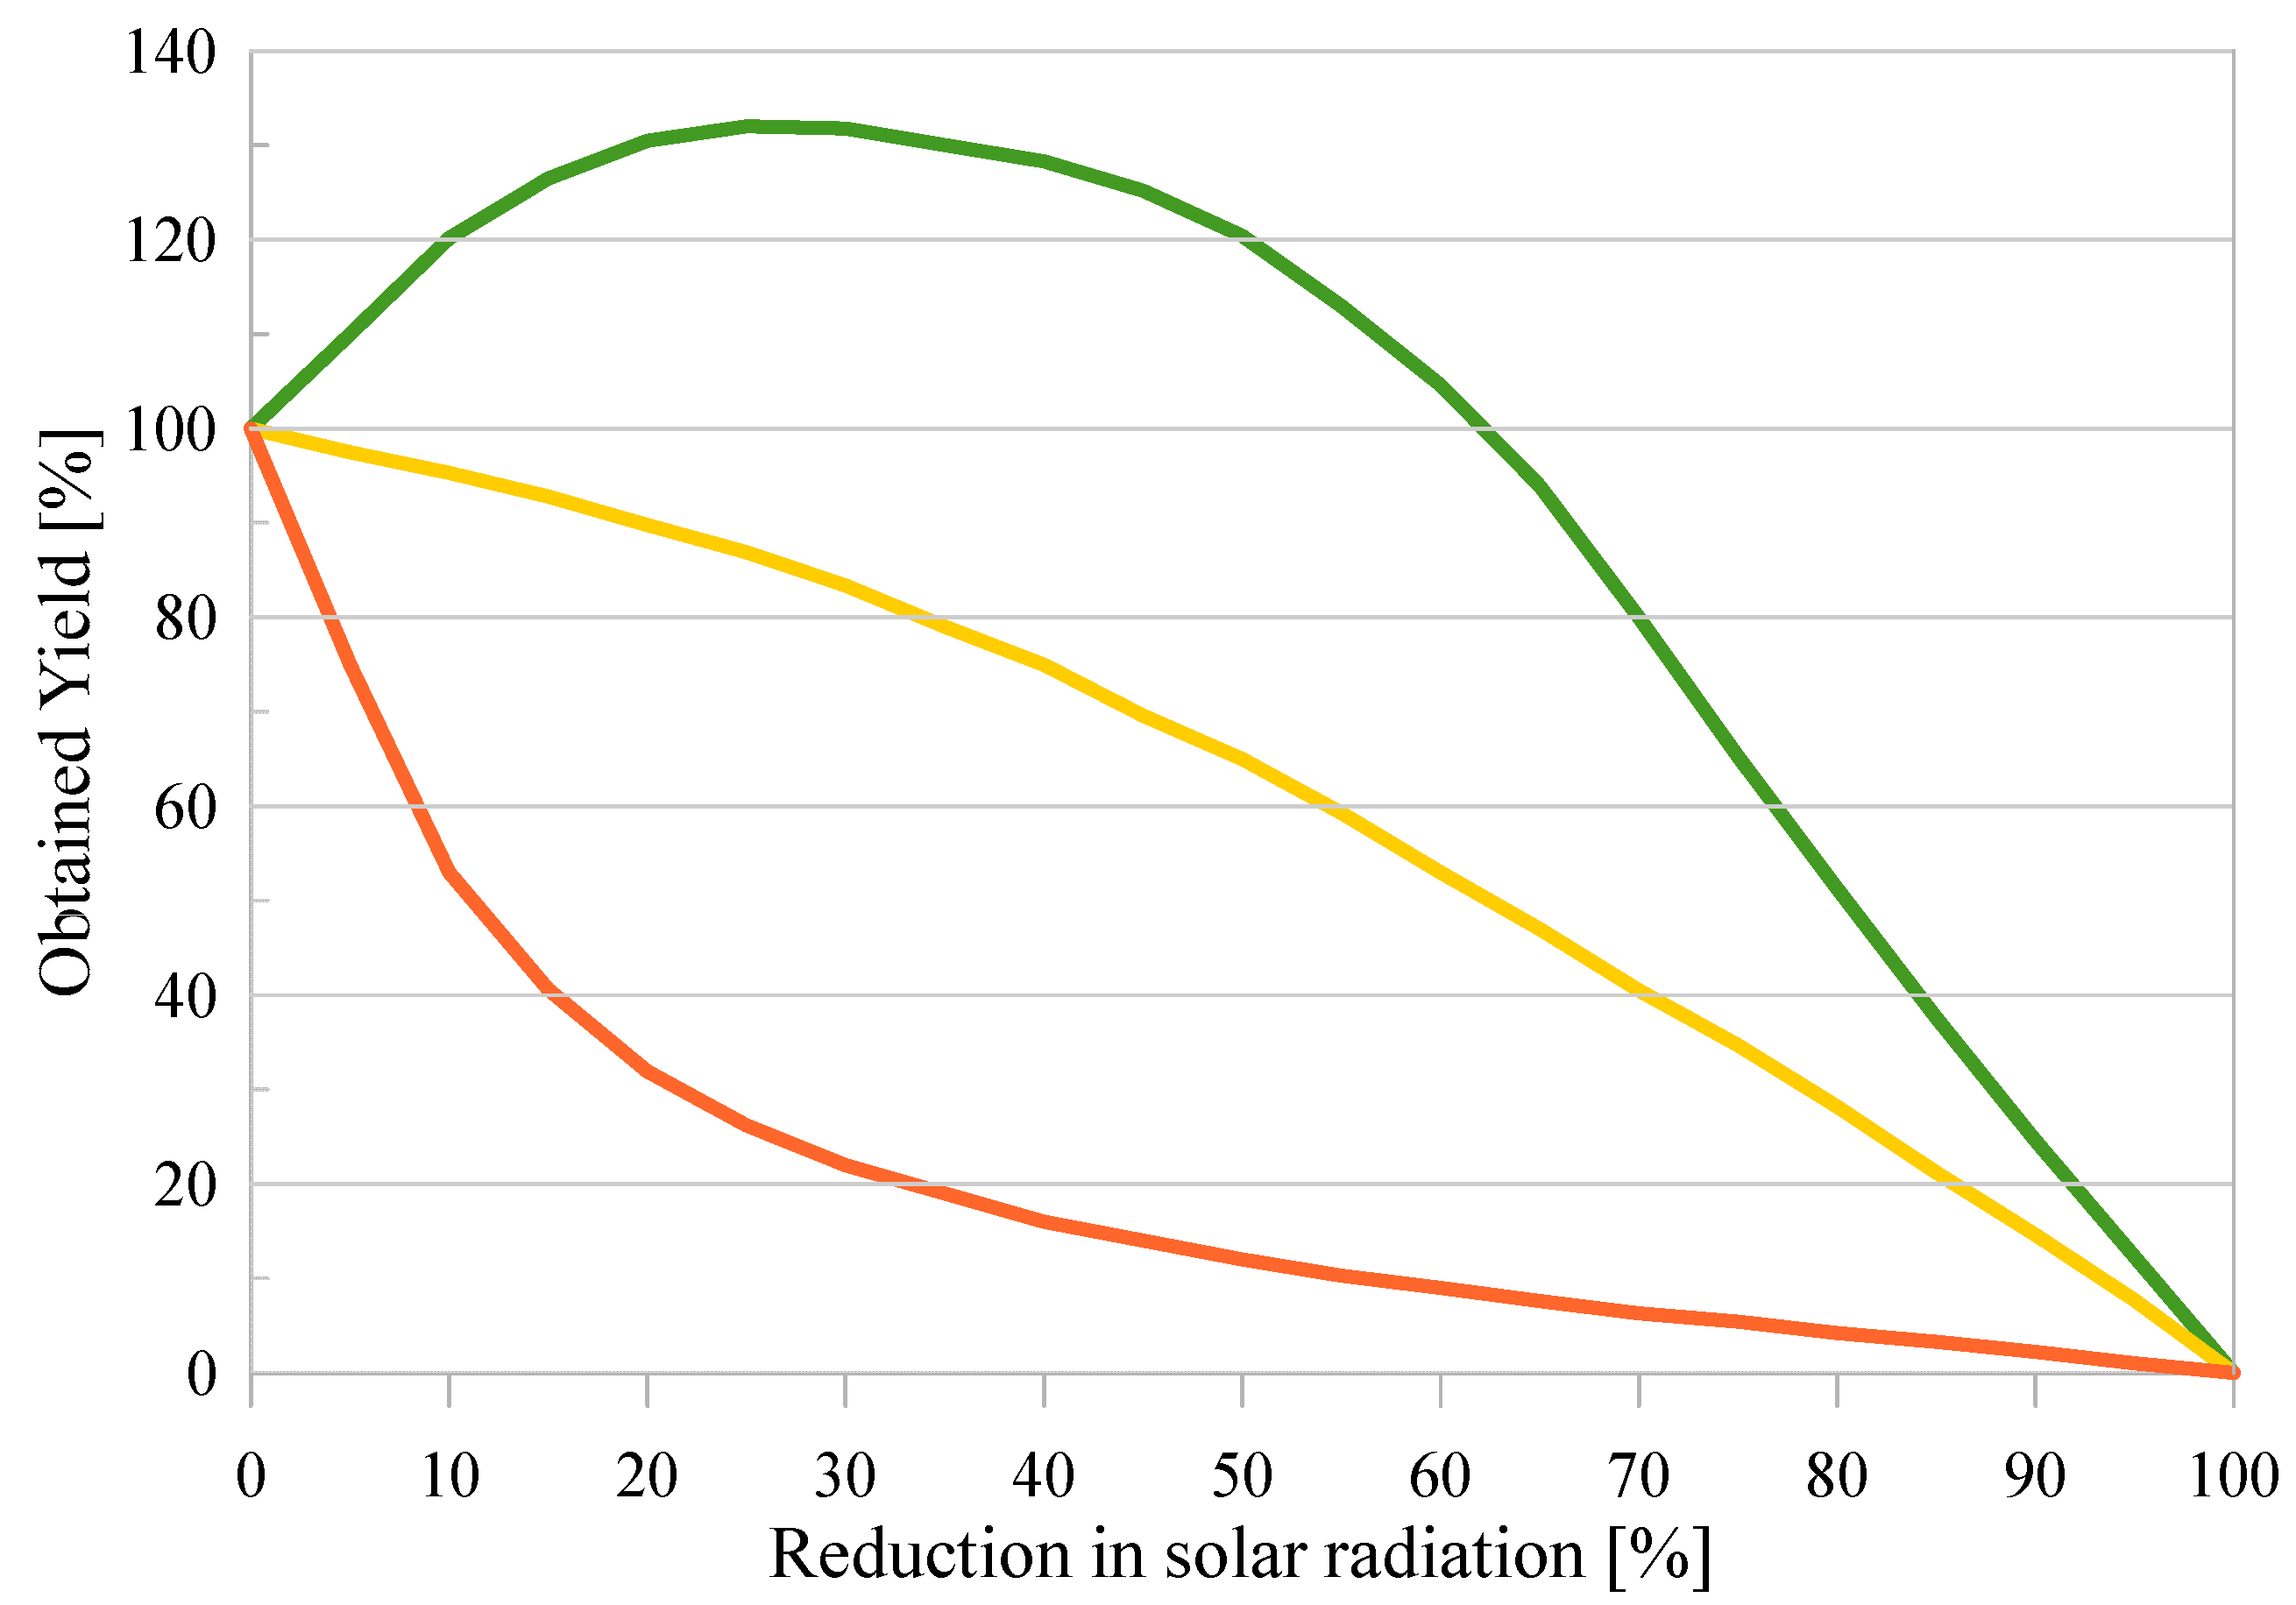
- Shade-tolerant crops, including many leafy vegetables, certain berry varieties, and shade-adapted specialty crops, demonstrate minimal yield reductions or even yield improvements under moderate shading.
- Moderately shade-tolerant crops, comprising many root vegetables, legumes, and certain cereal crops, can maintain acceptable yields with up to 30% reduction in incident solar radiation.
- Shade-intolerant crops, encompassing many fruiting vegetables, corn, and certain grain crops, exhibit substantial yield reductions under even moderate shading conditions.
- Long-term studies of soil health and biodiversity impacts under APV systems;
- Standardized methodologies for economic assessment incorporating multiple value streams;
- Crop-specific optimization protocols for different climate zones and agricultural systems;
- Technical innovations addressing maintenance challenges in combined systems;
- Socio-economic research addressing implementation barriers and adoption patterns.
1.2. Integration of APV with Biomass-Powered Cogeneration
2. The Case Study
- (a)
- The forestry and agroforestry sector, including residues from forest management, agroforestry activities, silvicultural operations, and related industries;
- (b)
- Wood and paper industries, comprising untreated wood processing residues and waste products from the paper industry (including sludge from water treatment);
- (c)
- The agricultural and agro-industrial sector, encompassing crop residues (prunings, trimmings), dedicated woody (willow, poplar, black locust) or herbaceous (miscanthus, sorghum, common reed) crops, oil-producing plants (sunflower, rapeseed), sugar crops (sugar beet, sweet sorghum), and residues from food processing industries (dairy, slaughterhouse, fish processing, sugar, and beverage industries);
- (d)
- The livestock sector, including animal manure (primarily used for biogas production);
- (e)
- Municipal waste, comprising residues from urban green space maintenance and the organic fraction of municipal solid waste.
3. Methodology
3.1. APV Shading Influence over Crop Yields
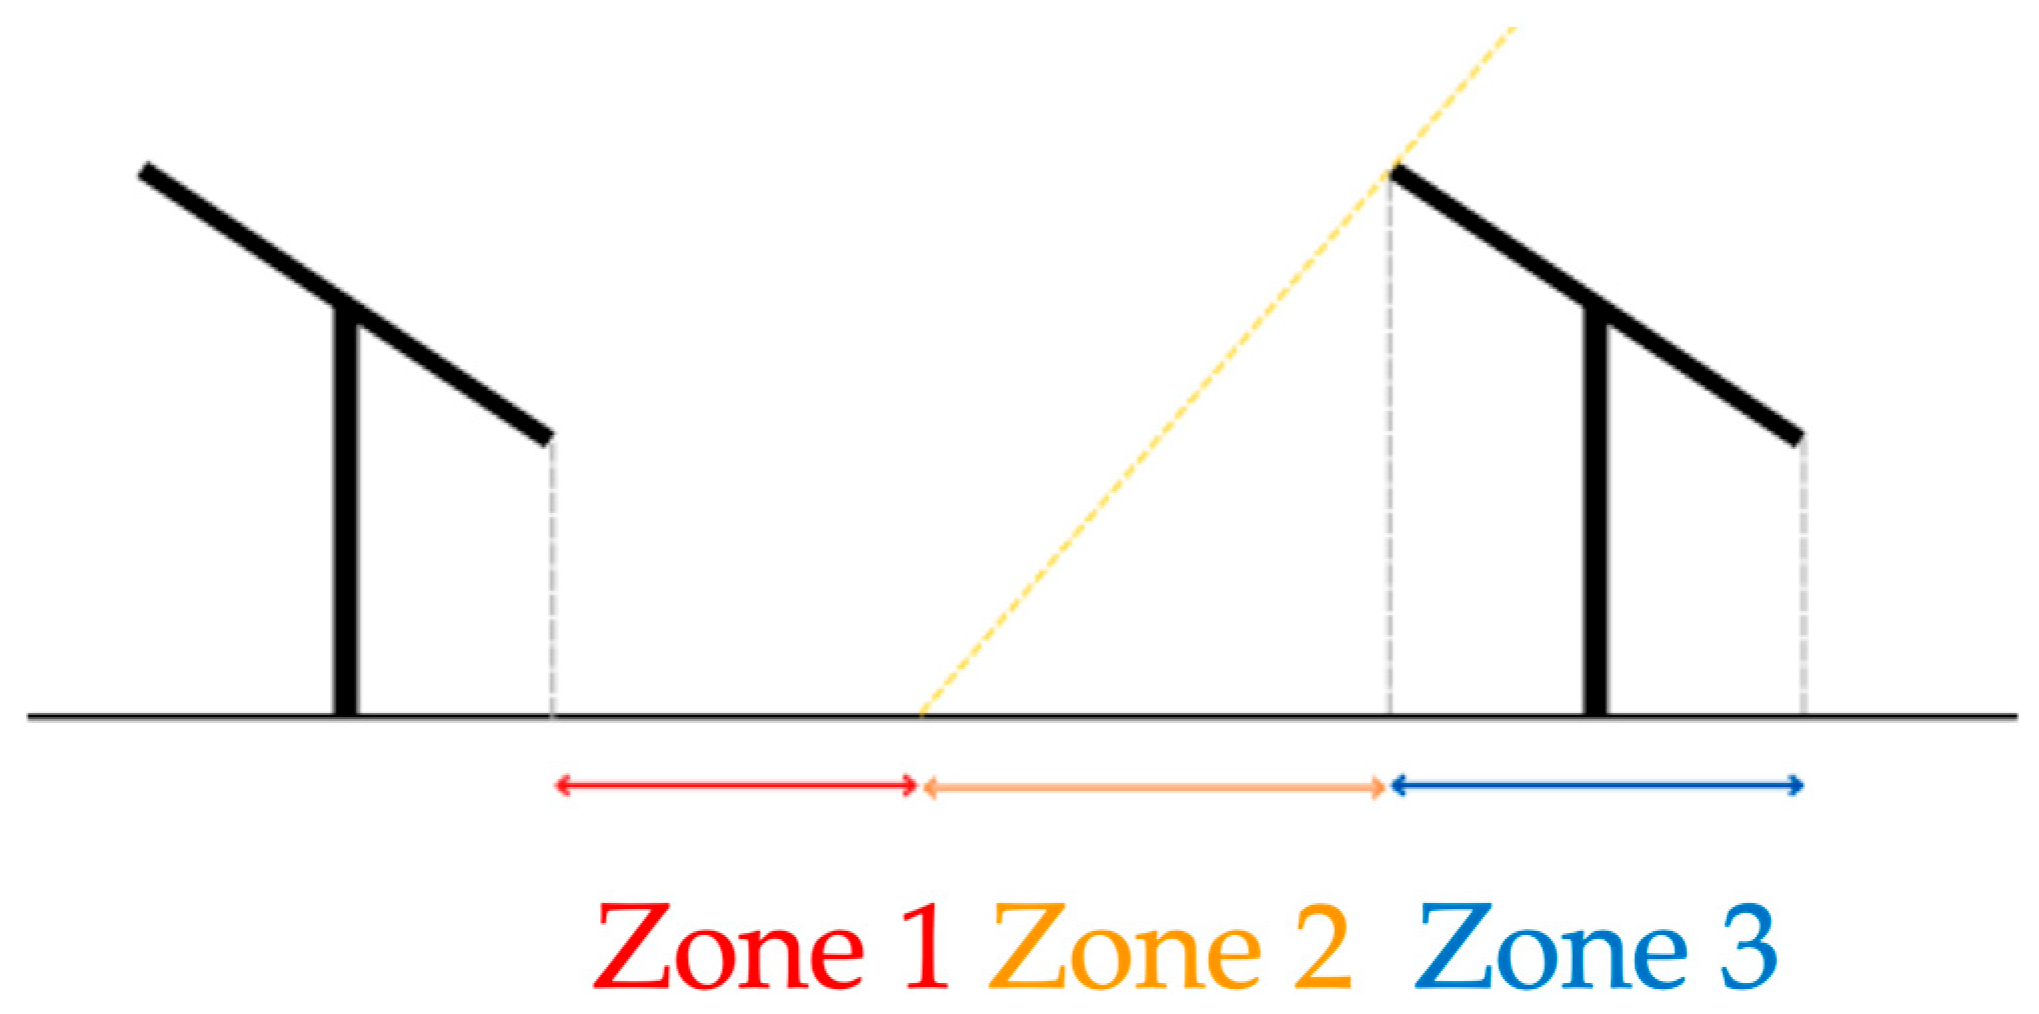
- Zone 1, characterized by low irradiation and high humidity levels;
- Zone 2, characterized by regular light exposure and sufficiently moist soil;
- Zone 3, characterized by the highest irradiation and lowest humidity.
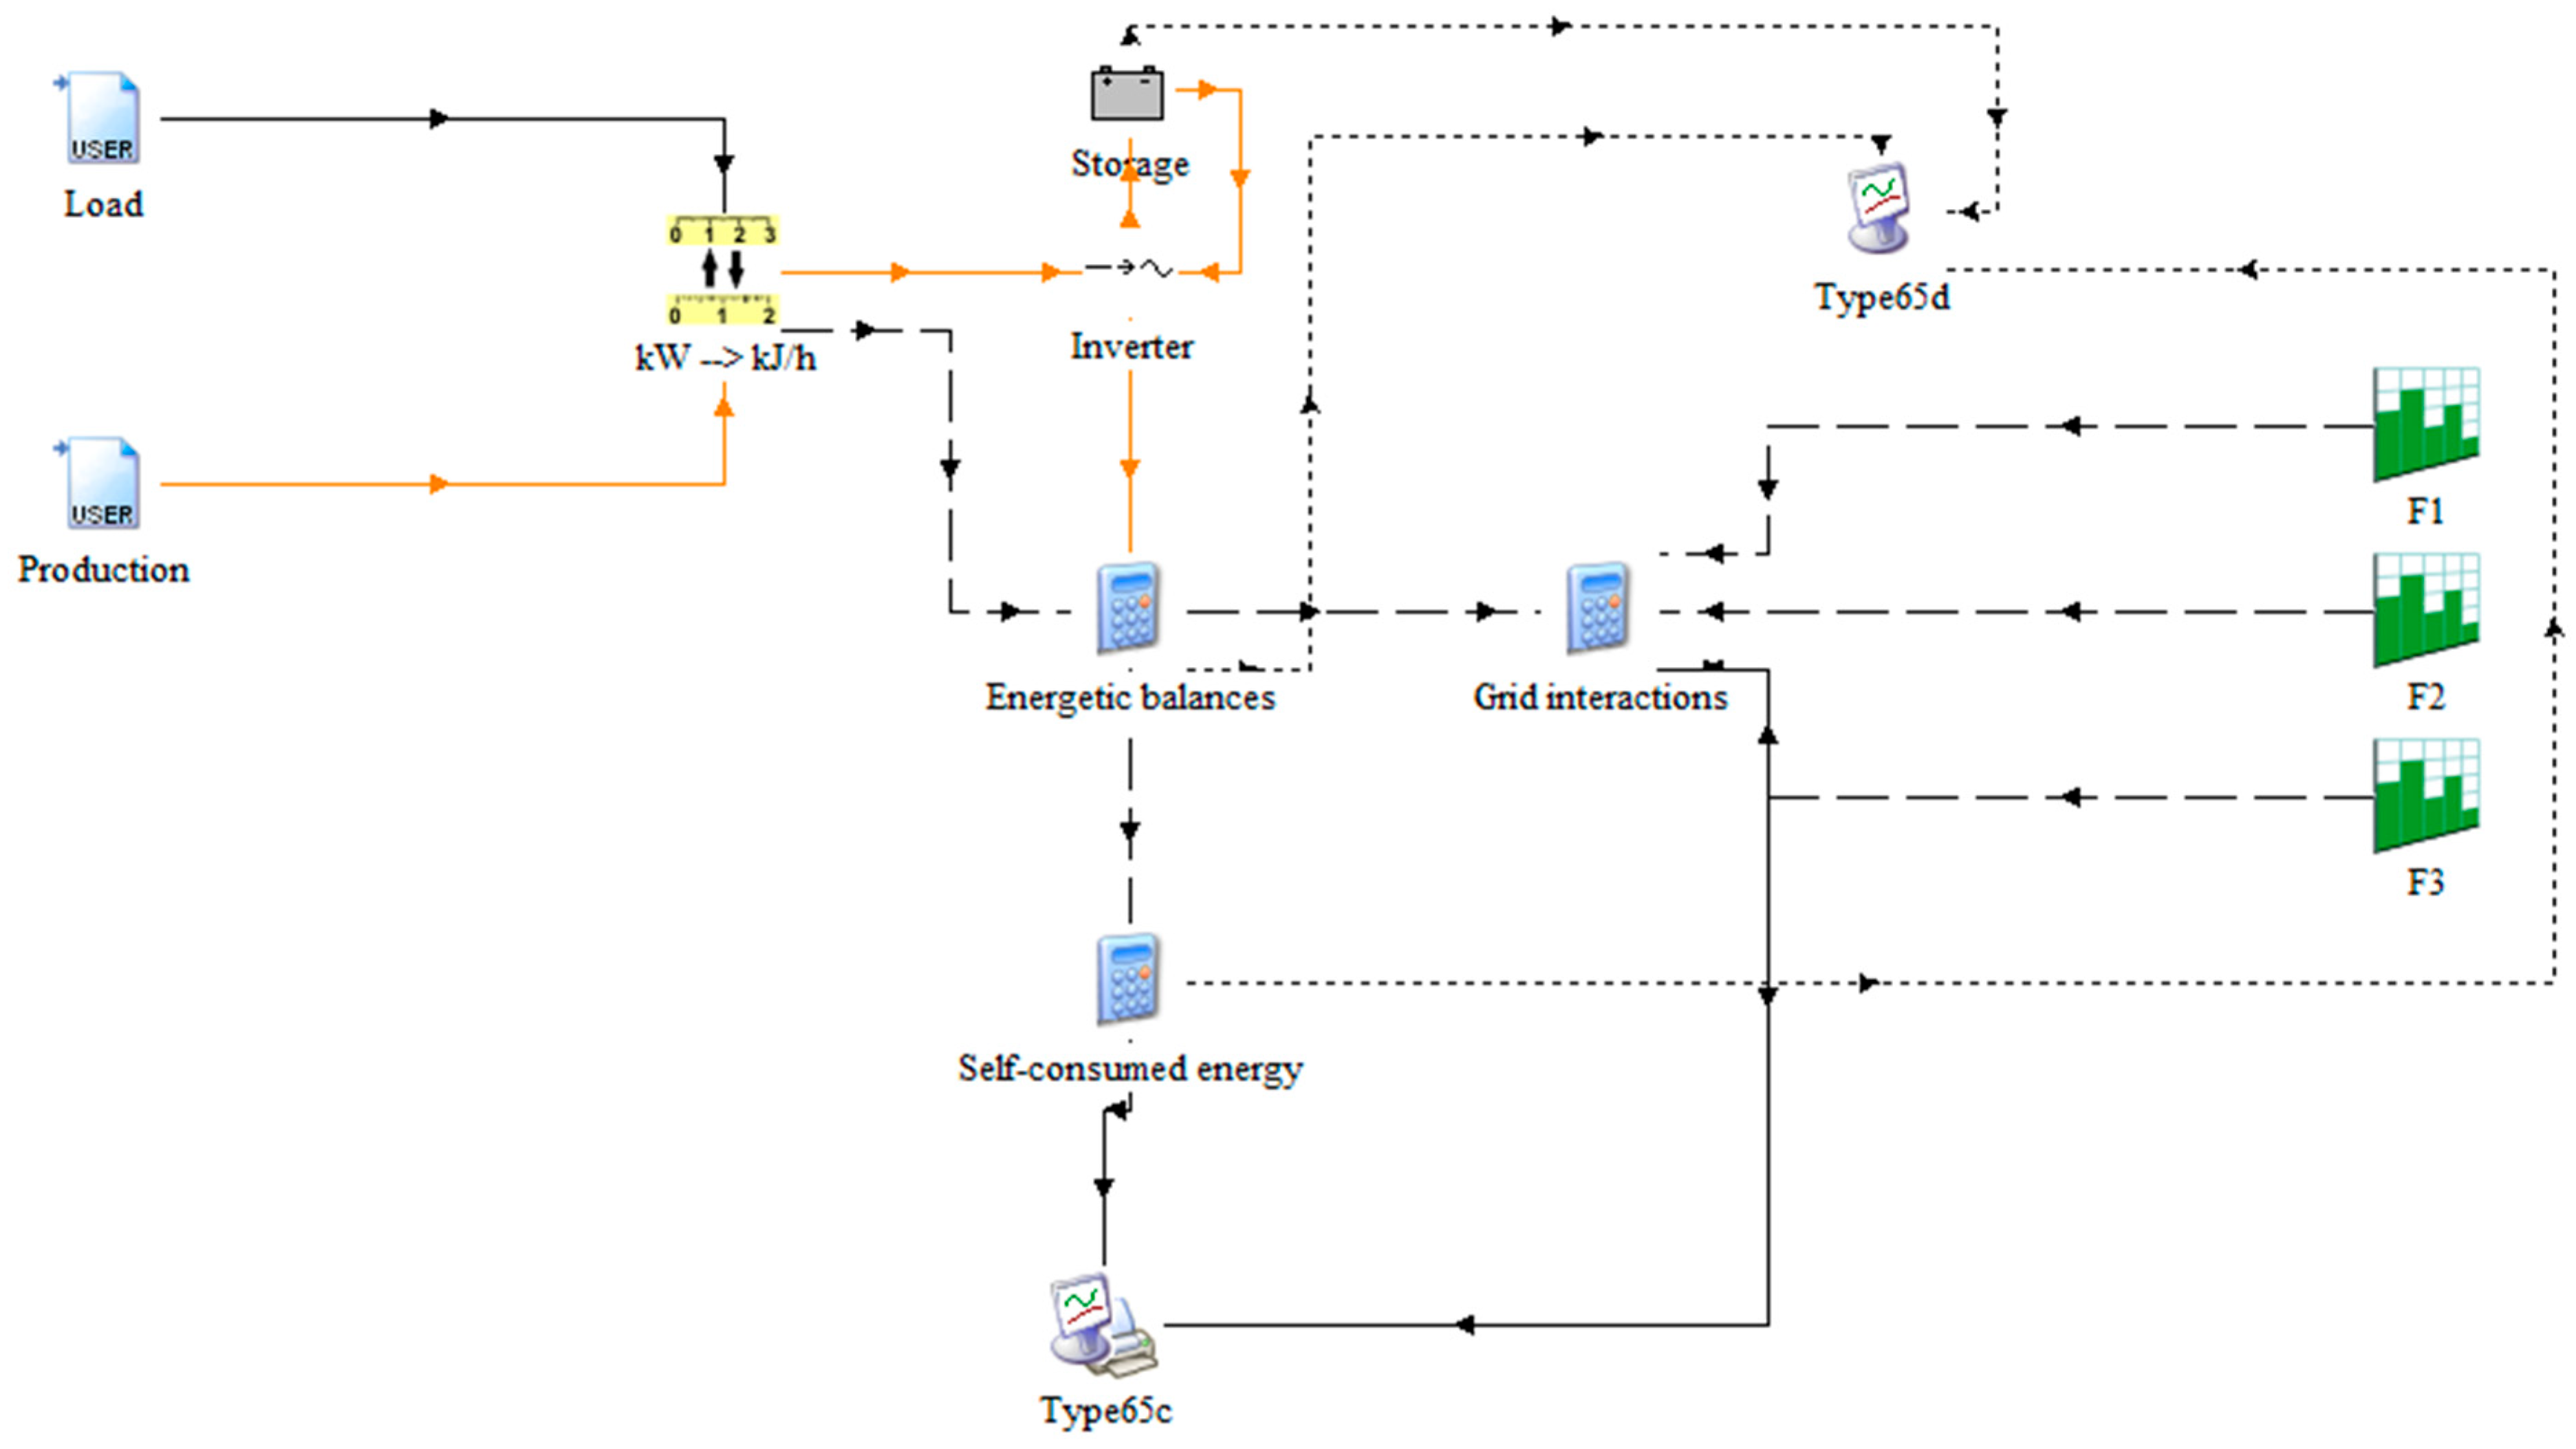
3.2. Numerical Model for the Assessment of Dynamic Operations of the APV Plant
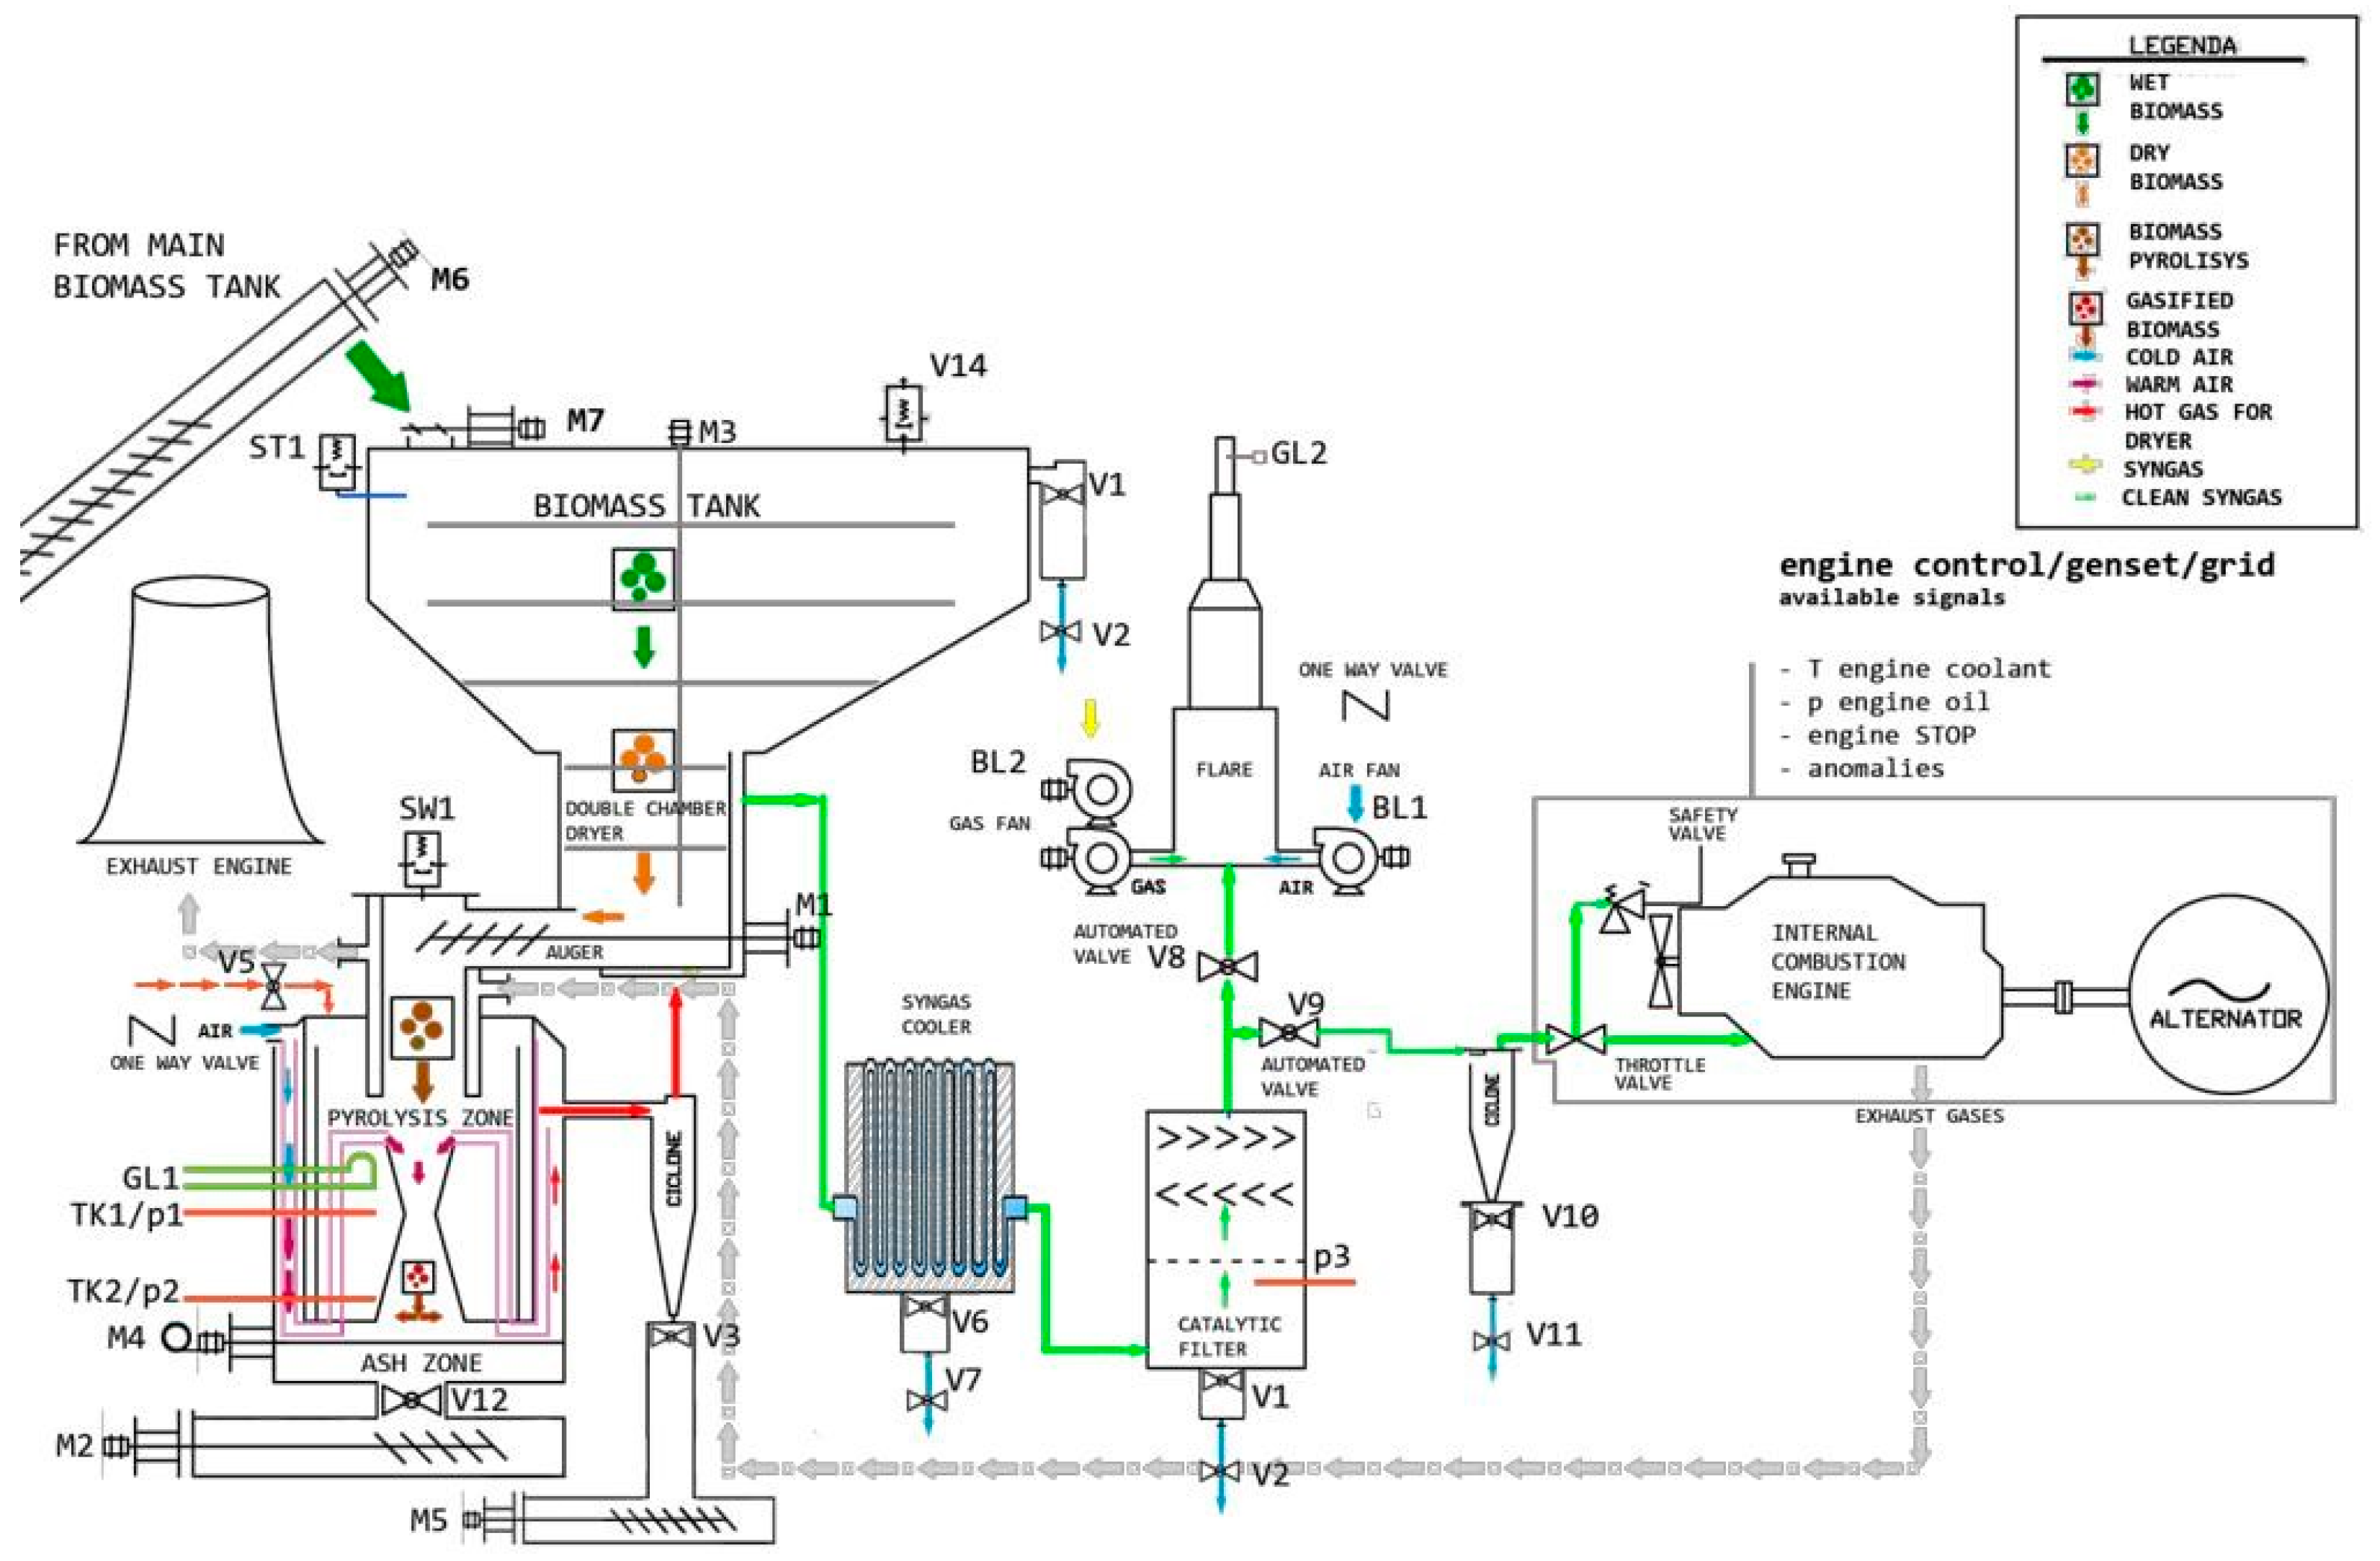
3.3. APV Integration with a Biomass-Powered Cogeneration Unit
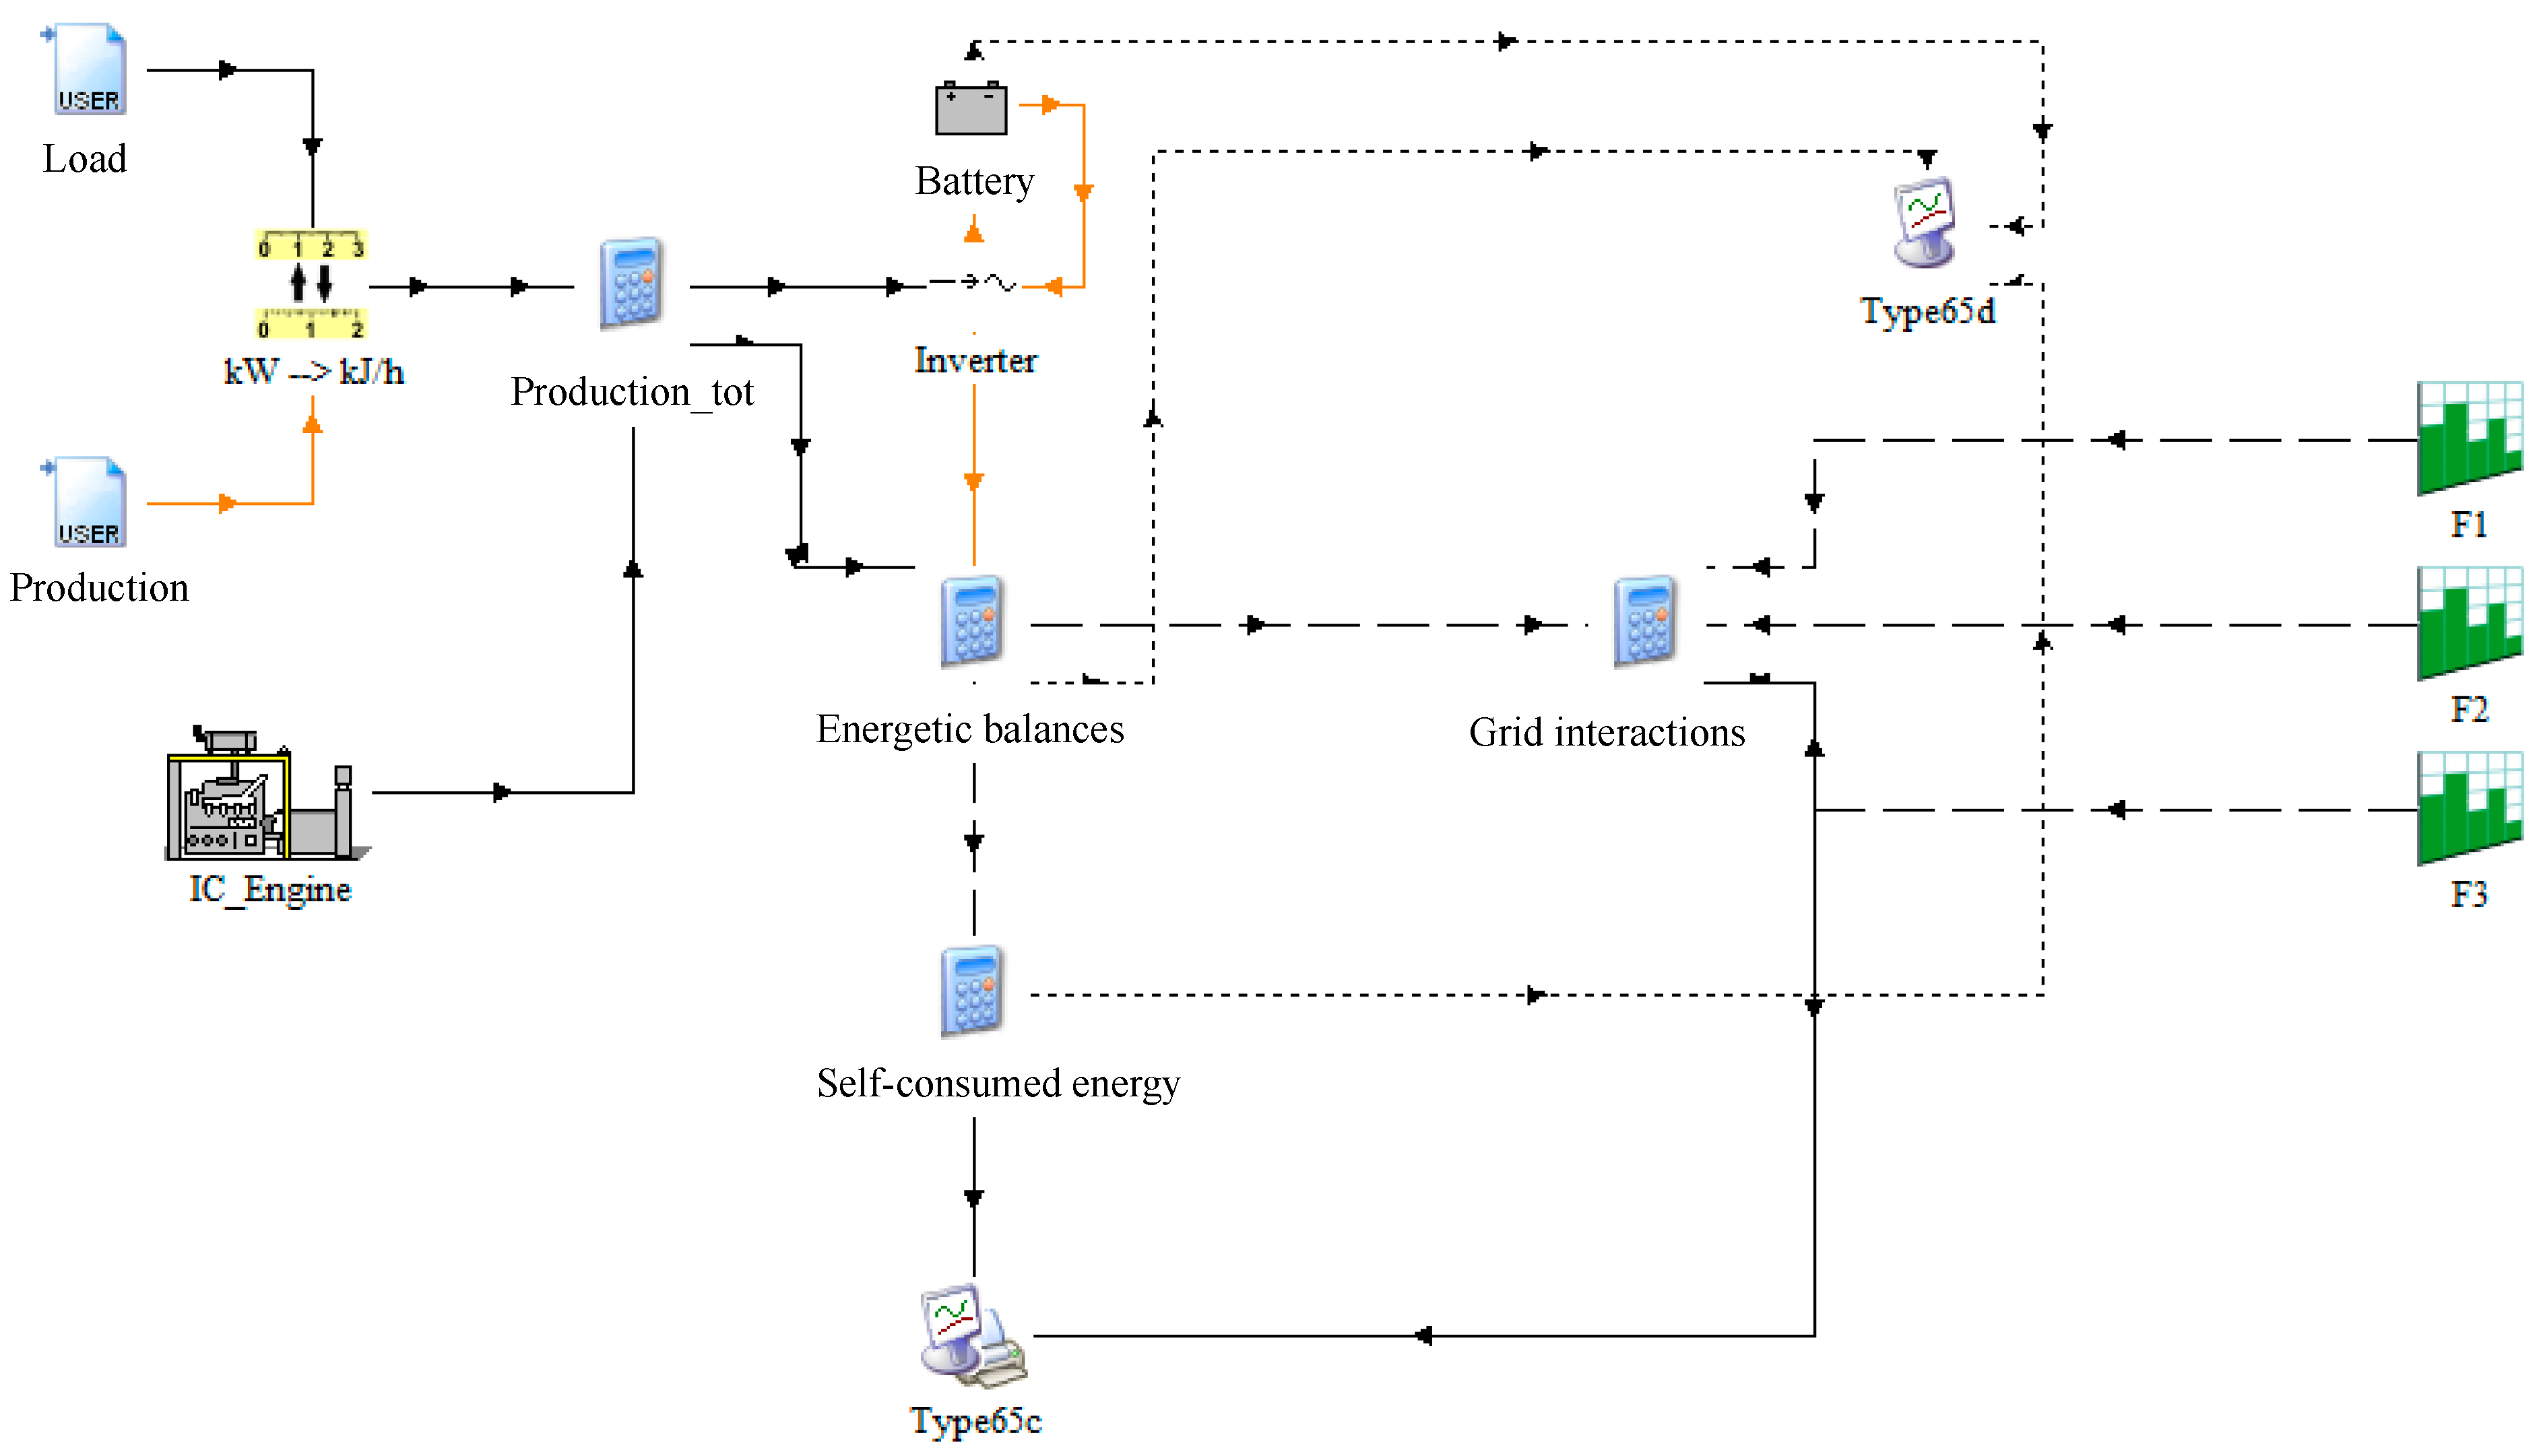
- Direct consumption of generated power;
- Battery charging when generation exceeds demand;
- Battery discharging when demand exceeds generation;
- Grid interaction only when the battery state-of-charge reaches operational limits (10–90%).
- -
- Minimum load factor: 30% (6 kW electrical output);
- -
- Start-up time: at least 30 min.
- -
- Shutdown time: 15 min;
- -
- Maintenance intervals: 400 operating hours.
4. Results and Discussion
4.1. Effect of APV on Crop Yields
4.2. Dynamic Simulation of the APV Installation
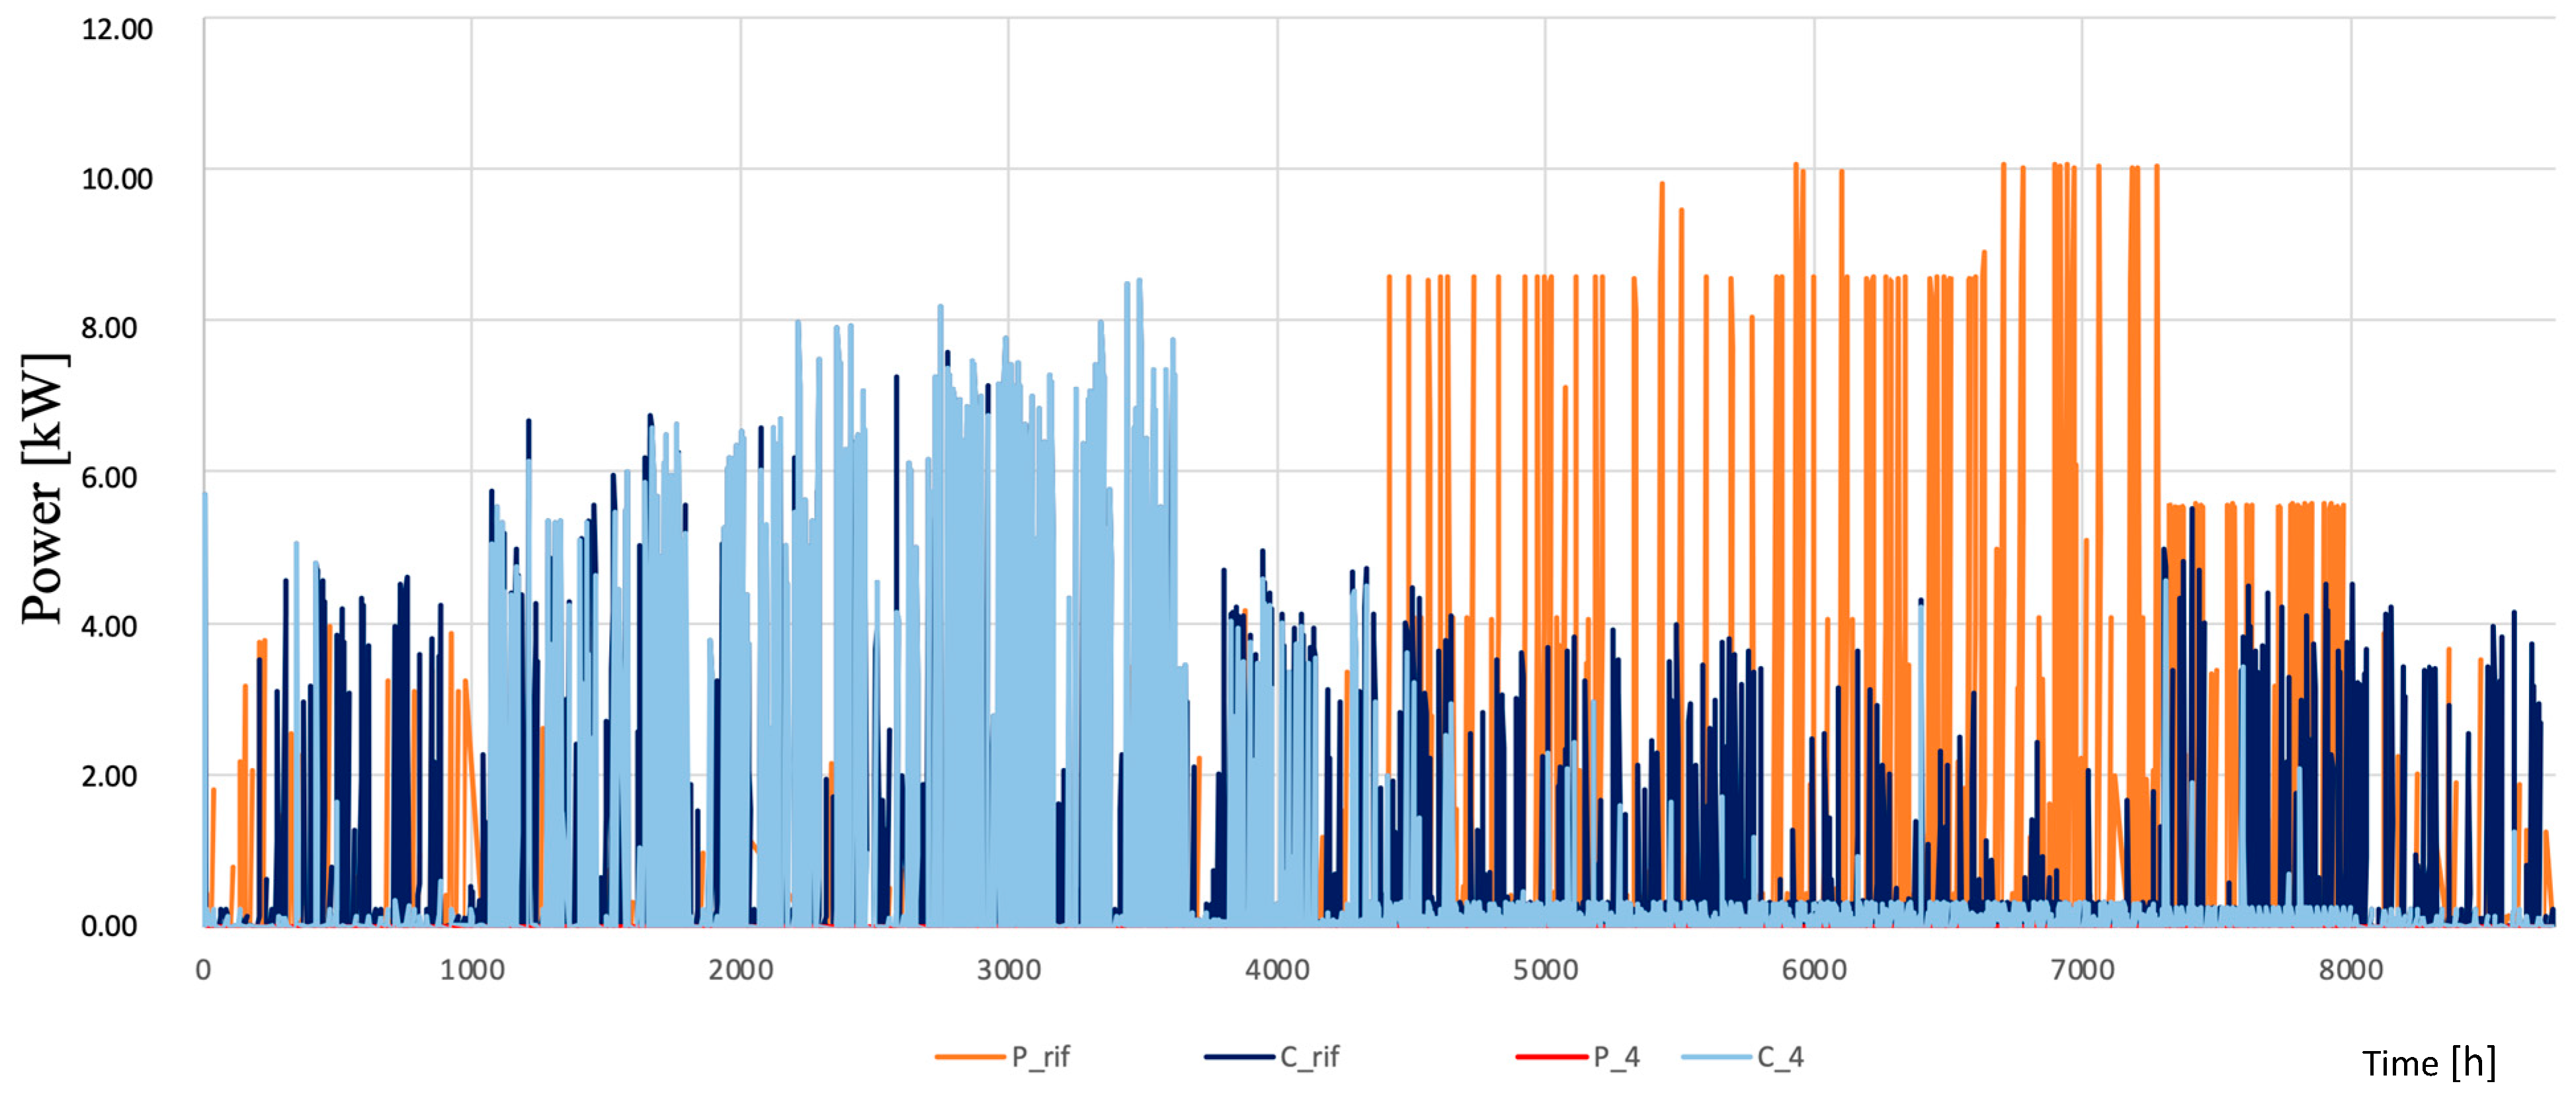
4.3. Combined Operation of APV and Biomass-Powered CHP
- ▪ The thermal power associated with the biomass input to the gasifier is equal to 124.87 kW;
- ▪ The thermal power associated with the air flow input to the gasifier is equal to 19.86 kW;
- ▪ The thermal power dissipated through the reactor walls is equal to 42.55 kW;
- ▪ The thermal power related to conversion losses is equal to 4.00 kW;
- ▪ The thermal power of ash sensible heat is equal to 0.18 kW;
- ▪ The thermal power related to the vaporization of moisture in the biomass is equal to 2.75 kW;
- ▪ The thermal power of syngas sensible heat is equal to 12.18 kW;
- ▪ The useful thermal power of syngas is equal to 83.07 kW.
5. Conclusions
Author Contributions
Funding
Data Availability Statement
Acknowledgments
Conflicts of Interest
List of Abbreviations
| APV | Agrophotovoltaic/Agrivoltaic |
| AC | Alternating Current |
| APS | Announced Pledges Scenario |
| CHP | Combined Heat and Power |
| CMD | Costruzioni Motori Diesel S.p.A. |
| DC | Direct Current |
| EMERA | Efficient Micro-grids powered by only Renewable sources for the Energy autonomy of rural Areas |
| ERDF | European Regional Development Fund |
| IEA | International Energy Agency |
| IEMD | Internal Electricity Market Directive |
| IoT | Internet of Things |
| IRENA | International Renewable Energy Agency |
| LER | Land Equivalent Ratio |
| LiFePO4 | Lithium Iron Phosphate |
| MPPT | Maximum Power Point Tracking |
| NOCT | Nominal Operating Cell Temperature |
| NPV | Net Present Value |
| NZE | Net-Zero Emission |
| PAR | Photosynthetically Active Radiation |
| PV | Photovoltaic |
| REC | Renewable Energy Community |
| RED | Renewable Energy Directive |
| SPB | Simple PayBack Period |
| STC | Standard Test Conditions |
| STEPS | Stated Policies Scenario |
| a | Factor taking into account the incidence of the cone relative to the circumsolar irradiance [-] |
| AG | Portion of soil committed to the crop [m2] |
| AS | Portion of the ground area affected by shading |
| c | Factor taking into account the incidence of the cone relative to the circumsolar irradiance [-] |
| F1, F2, F3 | Time band tariffs for electricity cost in Italy [-] |
| F | Factor determining sky conditions [-] |
| Fb | Direct shading factor, defined by the ratio of the shaded area to the surface area [-] |
| fc | Degree of modulation of cogenerator |
| fd | Diffuse shading factor [-] |
| fe | Electricity mix emission factor [kg CO2/kWh] |
| FracCOG | Load to be covered by cogenerator [kW] |
| Fsc | Sight factor for the celestial vault [-] |
| Gshaded | Incident radiation decreased by shading [W/m2] |
| Gtot | Global incident radiation to ground [W/m2] |
| h | Shed’s height from the ground [m] |
| Ib | Beam irradiance on a surface [W/m2] |
| Ibh | Beam irradiance on a horizontal surface [W/m2] |
| Id | Diffuse irradiance on a surface [W/m2] |
| Idh | Diffuse irradiance on a horizontal surface [W/m2] |
| Ih | Global irradiance on a horizontal surface [W/m2] |
| Ioh | Extraterrestrial irradiance on a horizontal surface [W/m2] |
| Ishaded | Global incident irradiance on any surface corrected for shading [W/m2] |
| Itot | Global incident irradiance on the surface [W/m2] |
| kd | Diffuse irradiance fraction |
| kt | Serenity index |
| l | Shed’s length [m] |
| lg | Ground length [m] |
| Pelsold | Profits linked to electricity sold to the grid [EUR/year] |
| Pveg_sales | Profits earned from the sale of fruits and vegetables [EUR/year] |
| PowCOG | Maximum power of cogenerator [kW] |
| PPV | Power generated by PV system [kW] |
| R | Radiance of the celestial vault |
| Rb | Ratio of the angle of incidence of irradiance to the surface and the zenith angle [-] |
| S | Vector identifying the direction of the sun’s rays |
| Saleprice | Selling price for fruit and vegetables [EUR/kg] |
| SPB | Simple Pay Back period [years] |
| w | Shed’s width [m] |
| WEprop | Energy withdrawn from the proposed system [kWh/year] |
| WEref | Energy withdrawn from the reference system [kWh/year] |
| wg | Ground width [m] |
| x | Reduction in solar irradiance |
| Yb | Yield of crops that benefit from shading |
| Ycrop,APV | Agricultural yield in the case of the combined production of energy and food [kg/m2] |
| Ycrop,only | Agricultural yield in the case that the whole field is used for agricultural purposes [kg/m2] |
| Yelectricity,APV | Electrical yield in the case of the combined production of energy and food [kWh/m2] |
| Yelectricity,only | Electrical yield in the case that the whole field is used for energy production [kWh/m2] |
| Yieldcrop | Expected yield of a crop [kg/m2] |
| Ys | Yield of crops that are susceptible to shading |
| Yt | Yield of crops that are tolerate shading |
| z | Zenith angle [°] |
| α | Solar height [°] |
| β | Half angle relative to the portion of the celestial vault as seen from the surface [°] |
| Δbeam | Decreases in the beam irradiance due to shadows |
| ΔCel_taken | Costs linked to electricity taken from the grid [EUR/year] |
| Δdiff | Decreases in the diffuse irradiance due to shadows |
| θ | Angle of incidence to the surface [°] |
| Σ | Surface tilt angle [°] |
| Ψ | Solar azimuth [°] |
References
- Barisano, D.; Bianco, L.; Nanna, F.; Pierro, N.; Villone, A.; Cirillo, D.; Caputo, C.; Caggiano, N.; Morone, A.; Giaccone, S.; et al. Efficient micro-grids powered by only renewables sources for the energy autonomy of rural areas—EMERA project. In Proceedings of the 31st European Biomass Conference and Exhibition (EUBCE), Bologna, Italy, 5–8 June 2023. [Google Scholar]
- CMD Engine. EMERA Project; CMD Engine: Caserta, Italy, 2023; Available online: https://www.cmdengine.com/gruppo-cmd/progetti-innovativi/progetto-emera/ (accessed on 12 May 2025).
- Di Leo, S.; Tortorella, M.M.; Fortes, P.; Viccaro, M.; Cozzi, M.; Romano, S.; Cosmi, C. The TIMES Land-WEF model: An integrated analysis of the agricultural system of the Basilicata Region (Southern Italy). Energy Nexus 2024, 15, 100315. [Google Scholar] [CrossRef]
- European Commission. REPowerEU Plan; European Commission: Brussels, Belgium, 2022; Available online: https://eur-lex.europa.eu/legal-content/EN/ALL/?uri=COM:2022:230:FIN (accessed on 12 May 2025).
- European Commission. Renewable Energy Directive Targets and Rules [Internet]; European Commission: Brussels, Belgium, 2023; Available online: https://energy.ec.europa.eu/topics/renewable-energy/renewable-energy-directive-targets-and-rules/renewable-energy-directive_en (accessed on 12 May 2025).
- International Energy Agency. World Energy Outlook 2024; IEA: Paris, France, 2024; Available online: https://www.iea.org/reports/world-energy-outlook-2024 (accessed on 12 May 2025).
- International Renewable Energy Agency. Renewables in 2024: 5 Key Facts Behind a Record-Breaking Year; IRENA: Abu Dhabi, United Arab Emirates, 2025; Available online: https://www.irena.org/News/articles/2025/Apr/Renewables-in-2024-5-Key-Facts-Behind-a-Record-Breaking-Year (accessed on 12 May 2025).
- Terna. Electrical Consumption Report 2024; Terna S.p.A.: Rome, Italy, 2024; Available online: https://www.terna.it/it/media/comunicati-stampa/dettaglio/consumi-elettrici-2024 (accessed on 12 May 2025).
- Bellone, Y.; Croci, M.; Impollonia, G.; Zad, A.N.; Colauzzi, M.; Campana, P.E.; Amaducci, S. Simulation-Based Decision Support for Agrivoltaic Systems. Appl. Energy 2024, 369, 123490. [Google Scholar] [CrossRef]
- Goetzberger, A.; Zastrow, A. On the coexistence of solar-energy conversion and plant cultivation. Int. J. Sol. Energy 1982, 1, 55–69. [Google Scholar] [CrossRef]
- Dupraz, C.; Marrou, H.; Talbot, G.; Dufour, L.; Nogier, A.; Ferard, Y. Combining solar photovoltaic panels and food crops for optimising land use: Towards new agrivoltaic schemes. Renew. Energy 2011, 36, 2725–2732. [Google Scholar] [CrossRef]
- Barron-Gafford, G.A.; Pavao-Zuckerman, M.A.; Minor, R.L.; Sutter, L.F.; Barnett-Moreno, I.; Blackett, D.T.; Thompson, M.; Dimond, K.; Gerlak, A.K.; Nabhan, G.P.; et al. Agrivoltaics provide mutual benefits across the food–energy–water nexus in drylands. Nat. Sustain. 2019, 2, 848–855. [Google Scholar] [CrossRef]
- Valle, B.; Simonneau, T.; Sourd, F.; Pechier, P.; Hamard, P.; Frisson, T.; Ryckewaert, M.; Christophe, A. Increasing the total productivity of a land by combining mobile photovoltaic panels and food crops. Appl. Energy 2017, 206, 1495–1507. [Google Scholar] [CrossRef]
- Trommsdorff, M.; Kang, J.; Reise, C.; Schindele, S.; Bopp, G.; Ehmann, A.; Weselek, A.; Högy, P.; Obergfell, T. Combining food and energy production: Design of an agrivoltaic system applied in arable and vegetable farming in Germany. Renew. Sustain. Energy Rev. 2021, 140, 110694. [Google Scholar] [CrossRef]
- Amaducci, S.; Yin, X.; Colauzzi, M. Agrivoltaic systems to optimize land use for electric energy production. Appl. Energy 2018, 220, 545–561. [Google Scholar] [CrossRef]
- Marrou, H.; Guilioni, L.; Dufour, L.; Dupraz, C.; Wery, J. Microclimate under agrivoltaic systems: Is crop growth rate affected in the partial shade of solar panels? Agric. For. Meteorol. 2013, 177, 117–132. [Google Scholar] [CrossRef]
- Adeh, E.H.; Good, S.P.; Calaf, M.; Higgins, C.W. Solar PV power potential is greatest over croplands. Sci. Rep. 2018, 8, 13786. [Google Scholar] [CrossRef]
- Weselek, A.; Ehmann, A.; Zikeli, S.; Lewandowski, I.; Schindele, S.; Högy, P. Agrophotovoltaic systems: Applications, challenges, and opportunities. A review. Agron. Sustain. Dev. 2019, 39, 35. [Google Scholar] [CrossRef]
- Sekiyama, T.; Nagashima, A. Solar sharing for both food and clean energy production: Performance of agrivoltaic systems for corn, a typical shade-intolerant crop. Environments 2019, 6, 65. [Google Scholar] [CrossRef]
- Dinesh, H.; Pearce, J.M. The potential of agrivoltaic systems. Renew. Sustain. Energy Rev. 2016, 54, 299–308. [Google Scholar] [CrossRef]
- Pascaris, A.S.; Schelly, C.; Burnham, L.; Pearce, J.M. Integrating solar energy with agriculture: Industry perspectives on the market, community, and socio-political dimensions of agrivoltaics. Energy Res. Soc. Sci. 2021, 75, 102023. [Google Scholar] [CrossRef]
- Schindele, S.; Trommsdorff, M.; Schlaak, A.; Obergfell, T.; Bopp, G.; Reise, C.; Braun, C.; Weselek, A.; Bauerle, A.; Högy, P.; et al. Implementation of agrophotovoltaics: Techno-economic analysis of the price-performance ratio and its policy implications. Appl. Energy 2020, 265, 114737. [Google Scholar] [CrossRef]
- Nakata, H.; Ogata, S. Integrating agrivoltaic systems into local industries: A case study and economic analysis of rural Japan. Agronomy 2023, 13, 513. [Google Scholar] [CrossRef]
- Cossu, M.; Yano, A.; Solinas, S.; Deligios, P.A.; Tiloca, M.T.; Cossu, A.; Ledda, L. Agricultural sustainability estimation of the European photovoltaic greenhouses. Eur. J. Agron. 2020, 118, 126074. [Google Scholar] [CrossRef]
- Ketzer, D.; Weinberger, N.; Rösch, C.; Seitz, S.B. Land use conflicts between biomass and power production–citizens’ participation in the technology development of Agrophotovoltaics. J. Responsible Innov. 2020, 7, 193–216. [Google Scholar] [CrossRef]
- Pascaris, A.S.; Schelly, C.; Pearce, J.M. A first investigation of agriculture sector perspectives on the opportunities and barriers for agrivoltaics. Agronomy 2020, 10, 1885. [Google Scholar] [CrossRef]
- Xia, Z.; Li, Y.; Guo, S.; Jia, N.; Pan, X.; Mu, H.; Chen, R.; Guo, M.; Du, P. Balancing photovoltaic development and cropland protection: Assessing agrivoltaic potential in China. Sustain. Prod. Consum. 2024, 50, 205–215. [Google Scholar] [CrossRef]
- Lu, S.M.; Amaducci, S.; Gorjian, S.; Haworth, M.; Hägglund, C.; Ma, T.; Zainali, S.; Campana, P.E. Wavelength-selective solar photovoltaic systems to enhance spectral sharing of sunlight in agrivoltaics. Joule 2024, 8, 2483–2522. [Google Scholar] [CrossRef]
- Vélez, S.; Valente, J.; Bretzel, T.; Trommsdorff, M. Assessing the impact of overhead agrivoltaic systems on GNSS signal performance for precision agriculture. Smart Agric. Technol. 2024, 9, 100664. [Google Scholar] [CrossRef]
- Campana, P.E.; Stridh, B.; Amaducci, S.; Colauzzi, M. Optimisation of vertically mounted agrivoltaic systems. J. Clean. Prod. 2021, 325, 129091. [Google Scholar] [CrossRef]
- Soto-Gomez, D. Integration of Crops, Livestock, and Solar Panels: A Review of Agrivoltaic Systems. Agronomy 2024, 14, 1824. [Google Scholar] [CrossRef]
- Zainali, S.; Lu, S.M.; Fernández-Solas, Á.; Cruz-Escabias, A.; Fernández, E.F.; Zidane, T.E.; Honningdalsnes, E.H.; Nygård, M.M.; Leloux, J.; Berwind, M.; et al. Modelling, simulation, and optimisation of agrivoltaic systems: A comprehensive review. Appl. Energy 2025, 386, 125558. [Google Scholar] [CrossRef]
- Suryawan, I.W.; Lim, J.W. Bioenergy’s role in the path to decarbonization. In Decarbonization Strategies and Drivers to Achieve Carbon Neutrality for Sustainability; Elsevier: Amsterdam, The Netherlands, 2024; pp. 3–26. [Google Scholar]
- Available online: https://www.europeanbiogas.eu/gasification-diversification-of-biomass-processing-and-waste-utilisation/ (accessed on 19 May 2025).
- IEA Bioenergy Task 33. Available online: https://task33.ieabioenergy.com (accessed on 19 May 2025).
- Biomass and Waste Gasification—Country Report ITALY, IEA Bioenergy Task 33 2018. Available online: https://task33.ieabioenergy.com/wp-content/uploads/sites/33/2022/06/ITALY2018.pdf (accessed on 19 May 2025).
- Menin, L.; Paolillo, A.; Piazzi, S.; Antolini, D.; Ravazzolo, F.; Baratieri, M. Biomass Derived Combined Heat and Power from Decentralized Small-Scale Gasification: Updated Cost Conditions for the Italian Mountain Context and Competitiveness in Future Energy Markets. Waste Biomass Valorization 2025, 16, 4009–4025. [Google Scholar] [CrossRef]
- Molino, A.; Larocca, V.; Chianese, S.; Musmarra, D. Biofuels Production by Biomass Gasification: A Review. Energies 2018, 11, 811. [Google Scholar] [CrossRef]
- Rubinsin, N.J.; Karim, N.A.; Timmiati, S.N.; Lim, K.L.; Isahak, W.N.; Pudukudy, M. An overview of the enhanced biomass gasification for hydrogen production. Int. J. Hydrogen Energy 2024, 49, 1139–1164. [Google Scholar] [CrossRef]
- Pizzuti, I.; Corsini, A.; Delibra, G.; Tajalli-Ardekani, E. Integration of photovoltaic panels and biomass-fuelled CHP in an Italian renewable energy community. Energy Convers. Manag. X 2024, 24, 100696. [Google Scholar] [CrossRef]
- Iazzolino, G.; Sorrentino, N.; Menniti, D.; Pinnarelli, A.; De Carolis, M.; Mendicino, L. Energy communities and key features emerged from business models review. Energy Policy 2022, 165, 112929. [Google Scholar] [CrossRef]
- EU Directive 2019/944 on Common Rules for the Internal Market for Electricity and Amending Directive 2012/27/EU; EUR-Lex: Luxembourg, 2012.
- Corsini, A.; Delibra, G.; Pizzuti, I.; Tajalli-Ardekani, E. Challenges of renewable energy communities on small Mediterranean islands: A case study on Ponza island. Renew. Energy 2023, 215, 118986. [Google Scholar] [CrossRef]
- Tiwary, A.; Spasova, S.; Williams, I.D. A community-scale hybrid energy system integrating biomass for localised solid waste and renewable energy solution: Evaluations in UK and Bulgaria. Renew. Energy 2019, 139, 960–967. [Google Scholar] [CrossRef]
- Di Silvestre, M.L.; Ippolito, M.G.; Sanseverino, E.R.; Sciumè, G.; Vasile, A. Energy self-consumers and renewable energy communities in Italy: New actors of the electric power systems. Renew. Sustain. Energy Rev. 2021, 151, 111565. [Google Scholar] [CrossRef]
- Ceglia, F.; Marrasso, E.; Roselli, C.; Sasso, M.; Coletta, G.; Pellegrino, L. Biomass-based renewable energy community: Economic analysis of a real case study. Energies 2022, 15, 5655. [Google Scholar] [CrossRef]
- Costa, M.; Del Papa, G.; Sgambato, D.; Palombo, A. Integrated optimization of agrivoltaic systems for the highest crop yield and energy production. In Proceedings of the 2025 SDEWES Conference, Dubrovnik, Croatia, 5–10 October 2025. submitted. [Google Scholar]
- Laub, M.; Pataczek, L.; Feuerbacher, A.; Zikeli, S.; Högy, P. Contrasting yield responses at varying levels of shade suggest different suitability of crops for dual land-use systems: A meta-analysis. Agron. Sustain. Dev. 2022, 42, 51. [Google Scholar] [CrossRef]
- Manjunatha, A.V.; Anik, A.R.; Speelman, S.; Nuppenau, E.A. Impact of land fragmentation, farm size, land ownership and crop diversity on profit and efficiency of irrigated farms in India. Land Use Policy 2013, 31, 397–405. [Google Scholar] [CrossRef]
- Gong, W.; Zhang, L.; Gong, J.; Geng, X.; Wang, L.; Deng, L.; Wu, C.; Bao, E. Regulatory effect of agriphotovoltaic systems with different panel heights on the thermal environment. Sci. Rep. 2025, 15, 11196. [Google Scholar] [CrossRef]
- Erbs, D.G.; Klein, S.A.; Duffie, J.A. Estimation of the diffuse radiation fraction for hourly, daily and monthly-average global radiation. Sol. Energy 1982, 28, 293–302. [Google Scholar] [CrossRef]
- Perez, R.; Ineichen, P.; Seals, R.; Michalsky, J.; Stewart, R. Modeling daylight availability and irradiance components from direct and global irradiance. Sol. Energy 1990, 44, 271–289. [Google Scholar] [CrossRef]
- Neupane Bhandari, S.; Schlüter, S.; Kuckshinrichs, W.; Schlör, H.; Adamou, R.; Bhandari, R. Economic Feasibility of Agrivoltaic Systems in Food-Energy Nexus Context: Modelling and a Case Study in Niger. Agronomy 2021, 11, 1906. [Google Scholar] [CrossRef]
- Enel. GHG Inventory 2020; Enel: Rome, Italy, 2020; Available online: https://www.enel.com/content/dam/enel-com/documenti/investitori/sostenibilita/ghg-inventory-2020.pdf (accessed on 26 May 2025).
- Canadian Solar. Product Catalog. Available online: https://www.canadiansolar.com/ (accessed on 26 May 2025).
- Technology and Support Centre in the Centre of Excellence for Renewable Resources. Agri-PV Report [Internet]; TFZ: Munich, Germany, 2022; Available online: https://www.tfz.bayern.de/mam/cms08/rohstoffpflanzen/dateien/tfz_bericht_73_agri-pv.pdf (accessed on 26 May 2025).
- Costa, M.; Buono, A.; Caputo, C.; Carotenuto, A.; Cirillo, D.; Costagliola, M.A.; Di Blasio, G.; La Villetta, M.; Macaluso, A.; Martoriello, G.; et al. The “INNOVARE” project: Innovative plants for distributed poly-generation by residual biomass. Energies 2020, 13, 4020. [Google Scholar] [CrossRef]
- The European House Ambrosetti. La Roadmap del Futuro per il Food&Beverage: Quali Evoluzioni e Quali Sfide per i Prossimi anni. Rapporto 2024. Available online: https://www.ambrosetti.eu/en/search/?search=food%26beverage (accessed on 26 May 2025).

| Value | Unit | |
|---|---|---|
| Location | Sant’ Arcangelo (PZ) | |
| Latitude | 40°15′24.16″ N | |
| Longitude | 16°15′34.06″ E | |
| Altitude | 388 | m a.s.l. |
| Climatic Characteristics * | ||
| Climate type | Continental Mediterranean | |
| Annual mean temperature | 13.5 | °C |
| Annual precipitation | 687 | mm |
| Solar radiation (annual) | ~1545 | kWh/m2 |
| Cultivated area | 782 | m2 |
| (a) | ||||||
| Consumption by time slot | kWh | % | ||||
| F1 | 8887.7 | 24 | ||||
| F2 | 10,369 | 28 | ||||
| F3 | 17,775.3 | 48 | ||||
| Total | 37,032 | |||||
| (b) | ||||||
| Qty | Machinery | kW | [h/day] | Period | months | |
| 1–2 | Dryers | 7.8 | 7 | July–October (at night) | 5 | |
| 1 | Dryer | 6.3 | 7 | November | 1 | |
| 2 | Storage cells | 1.5 | 24 | June–October | 5 | |
| 1 | Cured meat aging cell | 3 | 8 | 2 + 3 h over the year | 12 | |
| 1 | Steam cooking oven | 10 | 2 | Entire year (from 12 a.m. to 1 p.m.) | 12 | |
| External lighting | 0.3 | 10 | Night hours vary seasonally | ~7 | ||
| Estimated auxiliary services | 0.9–1.2 | 12 | January–December | 12 | ||
| Biomass Source | Annual Availability (Tonnes/Year) | Seasonal Availability | Calorific Value (MJ/kg) | Moisture Content (%) |
|---|---|---|---|---|
| Wheat straw | 320 | June–July | 14.5 | 10–15 |
| Bean residues | 85 | July–August | 13.2 | 20–30 |
| Potato crop residues | 65 | October–November | 12.0 | 30–40 |
| Olive prunings | 130 | January–March | 17.5 | 30–35 |
| Vineyard prunings | 95 | December–February | 16.8 | 25–35 |
| Forestry residues | 220 | Year-round (variable) | 18.5 | 20–40 |
| Crop | Lifecycle |
|---|---|
| Bean | June–July |
| Potato | August–October |
| Winter Wheat | November–May |
| Cost of Energy from the Grid | 2022/2023 [EUR/kWh] | 2025 [EUR/kWh] | Change |
|---|---|---|---|
| F1 (Mon–Fri 8:00–19:00) | 0.52100 | 0.27900 | −46.4% |
| F2 (Mon–Fri 7:00–8:00, 19:00–23:00; Sat 7:00–23:00) | 0.49200 | 0.26800 | −45.5% |
| F3 (Mon–Sat 23:00–7:00; Sun and holidays) | 0.49200 | 0.22400 | −54.5% |
| Profit from energy sold to the grid | 2022/2023 [EUR/kWh] | 2025 [EUR/kWh] | |
| F1 (Mon–Fri 8:00–19:00) | 0.04520 | 0.13050 | +188.7% |
| F2 Mon–Fri 7:00–8:00, 19:00–23:00; Sat 7:00–23:00) | 0.05306 | 0.13560 | +155.6% |
| F3 (Mon–Sat 23:00–7:00; Sun and holidays) | 0.03305 | 0.10590 | +220.4% |
| Profit from sales of vegetables [EUR/kg] | |||
| Bean | 1.10 | 1.85 | +68.2% |
| Wheat | 0.72 | 0.34 | −52.8% |
| Potato | 0.50 | 0.45 | −10% |
| Bifacial Module CS3W-440MB AG | ||
|---|---|---|
| Cell type | monocrystalline silicon | |
| Number of cells | 144 | |
| Efficiency [%] | 19.70 | |
| STC | NOCT | |
| Maximum Power Wp [W] | 440.00 | 329.00 |
| Maximum Voltage Vmp [V] | 40.40 | 37.50 |
| Maximum Current Imp [A] | 10.82 | 8.78 |
| Open Circuit Voltage Voc [V] | 48.70 | 45.40 |
| Shortcut Voltage Isc [A] | 11.48 | 9.30 |
| Inverter CSI-20KTL-GI-FL | ||
| Maximum efficiency [%] | 98.70 | |
| Vmax [V] | 1000.00 | |
| Imax MPPT [A] | 18.00 | |
| Icc MPPT [A] | 28.10 | |
| Starting Voltage [V] | 350.00 | |
| Operating temperatures | −25 °C60 °C | |
| Parameter | Unit | Vertical | Fixed | One-Axis Tracking |
|---|---|---|---|---|
| Module width | m | 0.99 | 0.99 | 0.99 |
| Module length | m | 2.08 | 2.08 | 2.08 |
| Number of modules | - | 24 | 24 | 24 |
| Total module area | m2 | 49.42 | 49.42 | 49.42 |
| Total system power | kW | 10.56 | 10.56 | 10.56 |
| System Layout | ||||
| Shed width | m | 1.98 | 11.88 | 1.98 |
| Shed length | l | 24.96 | 4.16 | 24.96 |
| Crop area | m2 | 782 | 782 | 782 |
| Height | m | 1.5 | 4 | 4 |
| Module-to-surface ratio | % | 6.32 | 6.32 | 6.32 |
| Panel Configuration | ||||
| Fixed tilt angle [°] | −90 | −30 | - | |
| Maximum tilt angle [°] | - | - | −30 | |
| Minimum tilt angle [°] | - | - | 80 | |
| Azimuth angle [°] | 0 | 0 | 0 |
| 2022–2023 Costs | 2025 Costs | Change | |
|---|---|---|---|
| 440 W Bifacial modules | 500 [EUR/kW] | 250 [EUR/kW] | −50% |
| Inverter | 4000 [EUR] | 2800 [EUR] | −30% |
| Storage | 950 [EUR/kWh] | 650 [EUR/kWh] | −31.6% |
| Vertical | 94 [EUR/kW] | 120 [EUR/kW] | +27.7% |
| Fixed | 300 [EUR/kW] | 220 [EUR/kW] | −26.7% |
| One-axis tracking | 730 [EUR/kW] | 480 [EUR/kW] | −34.2% |
| Administrative costs | 10,800 [EUR] | 8500 [EUR] | −21.3% |
| Micro-Cogeneration System Data Sheet | ||
|---|---|---|
| Electrical power | 20.00 | [kW] |
| Thermal power | 40.00 | [kW] |
| Electrical efficiency | 22.5 | [%] |
| Thermal efficiency | 56.2 | [%] |
| Biomass feeding | 24.00 | [kg/h] |
| (a) | |||||||||
| Yield [kg/m2] | Radiation Reduction | Vertical APV Δ Yield | Expected Yield [kg/year] | 2022–2023 Sale Price [EUR/kg] | 2022–2023 Farmer Earnings [EUR] | 2025 Sale Price [EUR/kg] | 2025 Farmer Earnings [EUR] | Variation | |
| Bean | 9.90 | 10.3% | 20.6% | 9332.74 | 1.10 | 3079.80 | 1.85 | 5179.67 | 68.2% |
| Wheat | 8.30 | 12.4% | −52.1% | 3112.24 | 0.72 | 672.24 | 0.34 | 317.45 | −52.8% |
| Potato | 59.40 | 12.6% | 23.1% | 57,162.35 | 0.50 | 8574.35 | 0.45 | 7716.92 | −10.0% |
| Total | 12,326.40 | 13,214.04 | 7.2% | ||||||
| Farmer Earnings no APV | 10,924.38 | 11,229.60 | 2.8% | ||||||
| Difference | 1402.02 | 1984.44 | 41.5% | ||||||
| (b) | |||||||||
| Yield [kg/m2] | Radiation Reduction | Vertical APV Δ Yield | Expected Yield [kg/year] | 2022–2023 Sale price [EUR/kg] | 2022–2023 Farmer Earnings [EUR] | 2025 Sale price [EUR/kg] | 2025 Farmer Earnings [EUR] | Variation | |
| Bean | 9.90 | 10.3% | 24.2% | 9618.39 | 1.10 | 3174.07 | 1.85 | 5338.21 | 68.2% |
| Wheat | 8.30 | 12.4% | −57.7% | 2746.53 | 0.72 | 593.25 | 0.34 | 280.15 | −52.8% |
| Potato | 59.40 | 12.6% | 24.6% | 57,893.48 | 0.50 | 8684.02 | 0.45 | 7815.62 | −10.0% |
| Total | 12,451.34 | 13,433.97 | 7.9% | ||||||
| Farmer Earnings no APV | 10,924.38 | 11,229.60 | 2.8% | ||||||
| Difference | 1526.96 | 2204.37 | 44.4% | ||||||
| (c) | |||||||||
| Yield [kg/m2] | Radiation Reduction | Vertical APVΔYield | Expected Yield [kg/year] | 2022–2023 Sale price [EUR/kg] | 2022–2023 Farmer Earnings [EUR] | 2025 Sale price [EUR/kg] | 2025 Farmer Earnings [EUR] | Variation | |
| Bean | 9.90 | 10.3% | 24.3% | 9626.02 | 1.10 | 3176.59 | 1.85 | 5342.44 | 68.2% |
| Wheat | 8.30 | 12.4% | −55.5% | 2889.93 | 0.72 | 624.22 | 0.34 | 294.77 | −52.8% |
| Potato | 59.40 | 12.6% | 24.2% | 57,687.60 | 0.50 | 8653.14 | 0.45 | 7787.83 | −10.0% |
| Total | 12,453.95 | 13,425.04 | 7.8% | ||||||
| Farmer Earnings no APV | 10,924.38 | 11,229.60 | 2.8% | ||||||
| Difference | 1529.57 | 2195.44 | 43.5% | ||||||
| (a) | ||||||
| Vertical APV | ||||||
| Battery Capacity [kWh] | Withdrawn Energy Cost [EUR/Year] | Earnings from Energy Sale [EUR/Year] | CAPEX [EUR] | Earnings from Crops [EUR/Year] | SPB | |
| 1 | 1.52 | 14,649.99 | 103.51 | 22,188.37 | 1402.02 | 4.16 |
| 2 | 6.10 | 14,235.92 | 63.92 | 26,533.48 | 1402.02 | 4.65 |
| 3 | 13.72 | 13,841.94 | 26.70 | 33,775.33 | 1402.02 | 5.57 |
| 4 | 24.39 | 13,671.20 | 8.49 | 43,913.92 | 1402.02 | 7.06 |
| 5 | 38.12 | 13,655.81 | 7.47 | 56,949.25 | 1402.02 | 9.14 |
| 6 | 54.89 | 13,673.38 | 7.48 | 72,881.32 | 1402.02 | 11.73 |
| 7 | 74.71 | 13,649.69 | 7.43 | 91,710.13 | 1402.02 | 14.70 |
| 8 | 97.57 | 13,634.24 | 7.42 | 113,435.68 | 1402.02 | 18.14 |
| 9 | 123.49 | 13,633.98 | 7.45 | 138,057.97 | 1402.02 | 22.08 |
| 10 | 152.46 | 13,625.09 | 7.46 | 165,577.00 | 1402.02 | 26.44 |
| (b) | ||||||
| Fixed APV | ||||||
| Battery capacity [kWh] | Withdrawn energy cost [EUR/year] | Earnings from energy sale [EUR/year] | CAPEX [EUR] | Earnings from crops [EUR/year] | SPB | |
| 1 | 1.52 | 12,648.17 | 215.50 | 27,248.37 | 1526.96 | 3.60 |
| 2 | 6.10 | 11,928.48 | 144.92 | 31,593.48 | 1526.96 | 3.84 |
| 3 | 13.72 | 11,115.33 | 66.60 | 38,835.33 | 1526.96 | 4.34 |
| 4 | 24.39 | 10,585.61 | 16.21 | 48,973.92 | 1526.96 | 5.19 |
| 5 | 38.12 | 10,565.42 | 9.43 | 62,009.25 | 1526.96 | 6.56 |
| 6 | 54.89 | 10,568.21 | 9.55 | 77,941.32 | 1526.96 | 8.25 |
| 7 | 74.71 | 10,552.38 | 9.56 | 96,770.13 | 1526.96 | 10.23 |
| 8 | 97.57 | 10,534.78 | 9.46 | 115,495.68 | 1526.96 | 12.18 |
| 9 | 123.49 | 10,525.55 | 9.49 | 140,117.97 | 1526.96 | 14.77 |
| 10 | 152.46 | 10,507.11 | 9.49 | 167,637.00 | 1526.96 | 17.63 |
| (c) | ||||||
| One-axis tracking APV | ||||||
| Battery capacity [kWh] | Withdrawn energy cost [EUR/year] | Earnings from energy sale [EUR/year] | CAPEX [EUR] | Earnings from crops [EUR/year] | SPB | |
| 1 | 1.52 | 12,118.90 | 316.63 | 28,548.37 | 1529.57 | 3.48 |
| 2 | 6.10 | 11,324.22 | 237.93 | 32,893.48 | 1529.57 | 3.69 |
| 3 | 13.72 | 10,275.69 | 134.66 | 40,135.33 | 1529.57 | 4.07 |
| 4 | 24.39 | 9469.82 | 52.41 | 50,273.92 | 1529.57 | 4.75 |
| 5 | 38.12 | 9340.64 | 39.57 | 63,309.25 | 1529.57 | 5.91 |
| 6 | 54.89 | 9323.55 | 35.13 | 79,241.32 | 1529.57 | 7.39 |
| 7 | 74.71 | 9263.54 | 29.86 | 98,070.13 | 1529.57 | 9.10 |
| 8 | 97.57 | 9189.03 | 24.77 | 119,795.68 | 1529.57 | 11.05 |
| 9 | 123.49 | 9123.67 | 21.37 | 144,417.97 | 1529.57 | 13.24 |
| 10 | 152.46 | 9093.17 | 19.72 | 171,937.00 | 1529.57 | 15.73 |
| Vertical | Fixed | One-Axis Tracking | ||||
|---|---|---|---|---|---|---|
| 2022–2023 | 2025 | 2022–2023 | 2025 | 2022–2023 | 2025 | |
| Battery capacity [kWh] | 13.72 | 13.72 | 38.12 | 38.12 | 38.12 | 38.12 |
| Self-consumed energy [%] | 25.24 | 25.25 | 40.40 | 40.40 | 45.83 | 45.83 |
| Withdrawn from the grid [%] | 74.33 | 74.33 | 59.35 | 59.35 | 51.56 | 51.56 |
| Given to the grid [%] | 6.60 | 6.60 | 1.52 | 1.52 | 2.60 | 2.60 |
| ∆MCO2 [%] | 23.54 | 23.54 | 42.65 | 42.65 | 49.60 | 49.60 |
| Investment cost [EUR] | 33,775.33 | 23,918.91 | 62,009.25 | 42,974.75 | 63,309.25 | 43,374.75 |
| Economic savings [EUR/year] | 6064.27 | 13,327.62 | 9448.46 | 15,019.97 | 10,705.99 | 15,673.31 |
| SPB [years] | 5.57 | 1.79 | 6.56 | 2.86 | 5.91 | 2.77 |
| Radiation reduction [%] (during bean lifecycle) | 10.32 | 13.84 | 10.32 | |||
| Radiation reduction [%] (during wheat lifecycle) | 12.41 | 15.04 | 12.41 | |||
| Radiation reduction [%] (during potato lifecycle) | 12.56 | 14.32 | 12.56 | |||
| Bean expected yield [kg/m2] | 20.55 | 24.24 | 24.34 | |||
| Wheat expected yield [kg/m2] | −52.05 | −57.68 | −55.48 | |||
| Potato expected yield [kg/m2] | 23.06 | 24.63 | 24.19 | |||
| LER | 1.4 | 1.6 | 1.7 | |||
| Parameter Variation | SPB | LER | Annual Savings [EUR] | Self-Consumption [%] |
|---|---|---|---|---|
| Base case (2025) | 2.77 | 1.7 | 15,673.31 | 45.83 |
| PV costs +20% | 3.08 | 1.7 | 15,673.31 | 45.83 |
| PV costs −20% | 2.46 | 1.7 | 15,673.31 | 45.83 |
| Electricity price +20% | 2.24 | 1.7 | 18,591.22 | 45.83 |
| Electricity price −20% | 3.52 | 1.7 | 12,755.40 | 45.83 |
| Crop prices +20% | 2.64 | 1.7 | 16,357.64 | 45.83 |
| Crop prices −20% | 2.90 | 1.7 | 14,988.98 | 45.83 |
| Self-Consumed Energy [%] | 22.06 |
|---|---|
| Energy taken from the grid [%] | 0 |
| Energy fed into the grid [%] | 77.94 |
| PPV | Load | FracCOG | fccalcolated | fcprocessed |
|---|---|---|---|---|
| 0.9361 | 11.2 | 10.2639 | 0.6 | 0.6 |
| 0.5681 | 1.2 | 0.6319 | 0.1 | 0.3 |
| 0.2068 | 1.2 | 0.9932 | 0.1 | 0.3 |
| 0.0498 | 1.2 | 1.1502 | 0.1 | 0.3 |
| 0 | 1.2 | 1.2 | 0.1 | 0.3 |
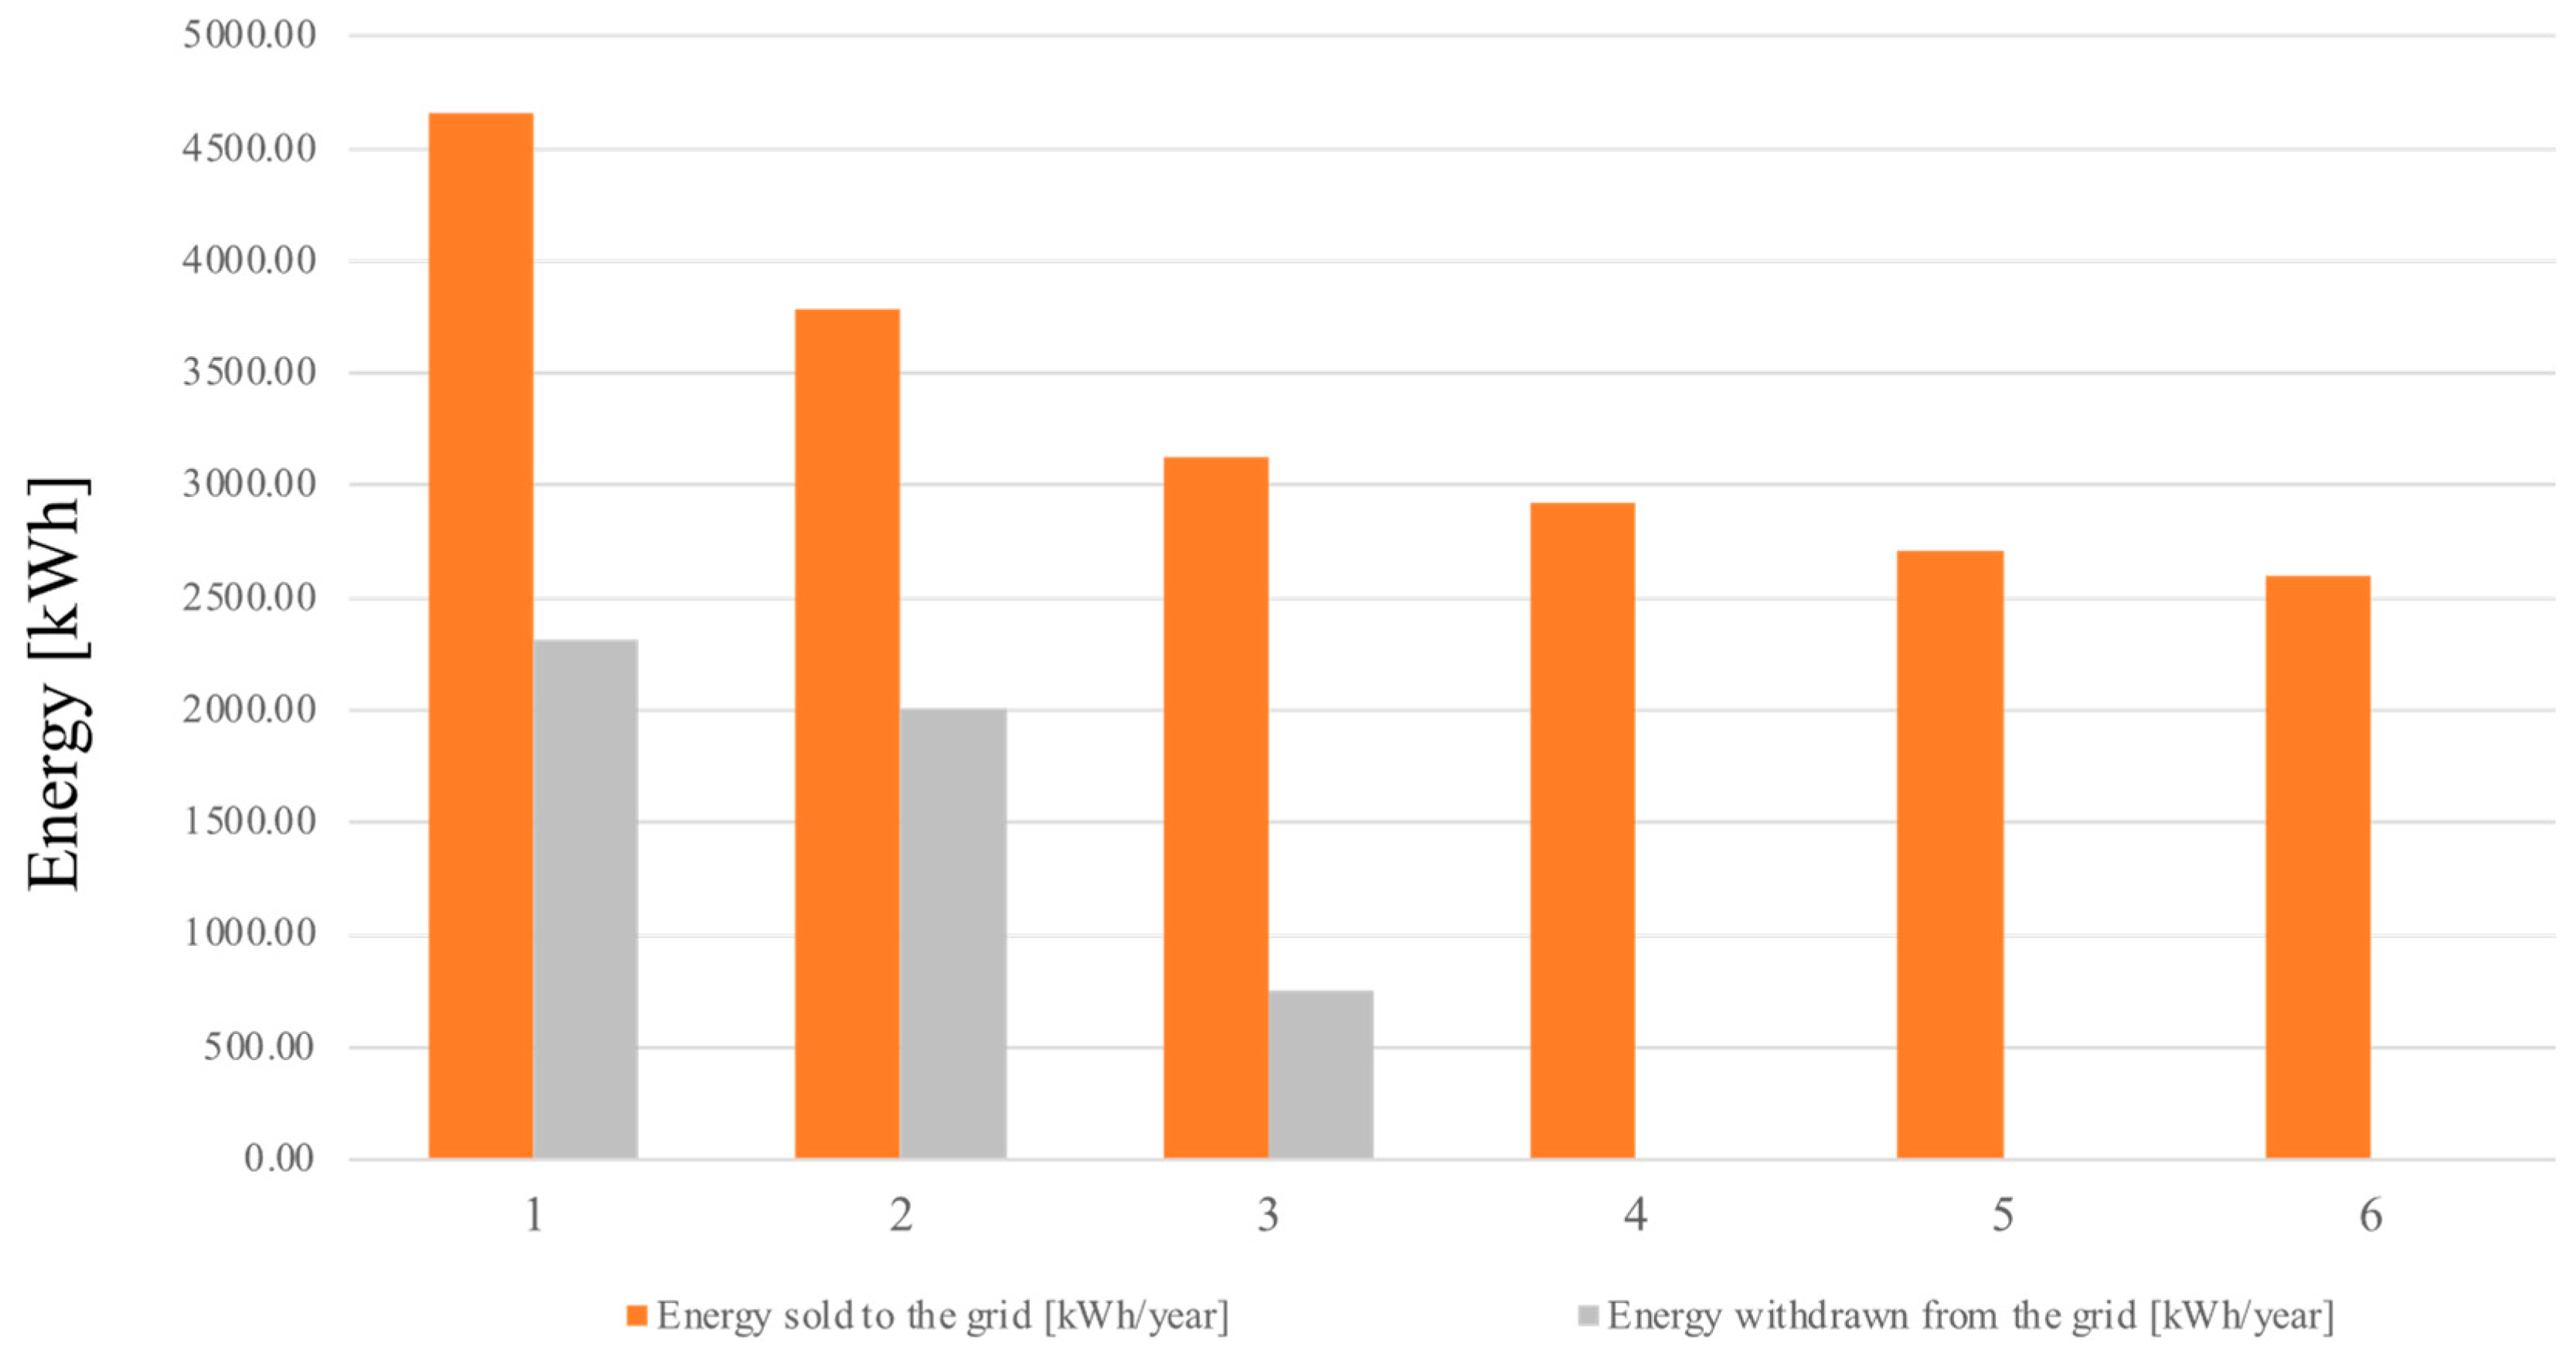
| Number of Cells in Series | Number of Cells in Parallel | Battery Capacity [kWh] | Energy Sold [kWh/Year] | Energy Withdrawn [kWh/Year] | Self-Consumed Energy [kWh/Year] |
|---|---|---|---|---|---|
| 30.00 | 35.00 | 38.12 | 4661.14 | 2314.65 | 40,430.35 |
| 36.00 | 42.00 | 54.89 | 3790.42 | 2012.41 | 40,732.59 |
| 42.00 | 49.00 | 74.71 | 3129.23 | 756.44 | 41,988.56 |
| 48.00 | 56.00 | 97.57 | 2923.59 | 0.00 | 42,745.00 |
| 54.00 | 63.00 | 123.49 | 2706.21 | 0.00 | 42,745.00 |
| 60.00 | 70.00 | 152.46 | 2600.97 | 0.00 | 42,745.00 |
| Battery Capacity [kWh] | Cost of Energy Withdrawn [EUR/year] | Cost of Energy Sold [EUR/Year] | Costo di Investimento [EUR] | Risparmio [EUR/Anno] | SPB [Years] |
|---|---|---|---|---|---|
| 38.12 | 1157.33 | 186.45 | 275,609.25 | 14,408.86 | 19.1 |
| 54.89 | 1006.21 | 151.62 | 291,541.32 | 14,374.03 | 20.3 |
| 74.71 | 378.22 | 125.17 | 310,370.13 | 14,347.58 | 21.6 |
| 97.57 | 0.00 | 116.94 | 332,095.68 | 14,339.35 | 23.2 |
| 123.49 | 0.00 | 108.25 | 356,717.97 | 14,330.66 | 24.9 |
| 152.46 | 0.00 | 104.04 | 384,237.00 | 14,326.45 | 26.8 |
| Performance Indicator | Units | Vertical APV | Fixed APV | One-Axis Tracking APV (OAT APV) | OAT APV + Biomass CHP |
|---|---|---|---|---|---|
| TECHNICAL PERFORMANCE | |||||
| System Size | kW | 10 | 10 | 10 | 30 (10 PV + 20 CHP) |
| Optimal Battery Capacity | kWh | 13.72 | 38.12 | 38.12 | 97.57 |
| Annual Energy Generation | kWh/year | 14,234 | 16,847 | 18,926 | 42,745 |
| Sel-Consumption Rate | % | 25.24 | 40.40 | 45.83 | 99.1 |
| Grid Withdrawal | % | 74.33 | 59.35 | 51.56 | 0 |
| Grid Supply | % | 6.60 | 1.52 | 2.60 | 0 |
| AGRICULTURAL PERFORMANCE | |||||
| Land Equivalence Ratio (LER) | - | 1.4 | 1.6 | 1.7 | 1.7 |
| Average Radiation Reduction | % | 11.76 | 14.40 | 11.76 | 11.76 |
| Bean Yield Change | % | +20.55 | +24.24 | +24.34 | +24.34 |
| Potato Yield Change | % | +23.06 | +24.63 | +24.19 | +24.19 |
| Wheat Yield Change | % | −52.05 | −57.68 | −55.48 | −55.48 |
| Total Agricultural Revenue | EUR/year | 13,213.99 | 13,609.80 | 13,633.46 | 13,633.46 |
| ECONOMIC PERFORMANCE (2025) | |||||
| Investment Cost | EUR | 23,918.91 | 42,974.75 | 43,374.75 | 332,095.68 |
| Annual Savings | EUR/year | 13,327.62 | 15,019.97 | 15,673.31 | 14,339.35 |
| Simple Payback Period | years | 1.79 | 2.86 | 2.77 | 23.2 |
| NPV (10 years, 5% discount) | EUR | 79,042 | 73,113 | 77,867 | −184,427 |
| ENVIRONMENTAL PERFORMANCE | |||||
| CO2 Emission Reduction | kg/year | 4.275 | 7.326 | 8.741 | 20,520 |
| CO2 Reduction Percentage | % | 23.54 | 42.65 | 49.60 | 100.0 |
| Water Use Reduction | m3/year | 71 | 83 | 94 | 94 |
| Water Savings | % | 18 | 18 | 18 | 18 |
| SYSTEM RESILIENCE | |||||
| Energy Independence | % | 25.24 | 40.40 | 45.83 | 99.1 |
| Biomass Requirement | t/year | - | - | - | 180 |
| Critical Resource Dependency | - | Grid Electricity | Grid Electricity | Grid Electricity | Local Biomass |
Disclaimer/Publisher’s Note: The statements, opinions and data contained in all publications are solely those of the individual author(s) and contributor(s) and not of MDPI and/or the editor(s). MDPI and/or the editor(s) disclaim responsibility for any injury to people or property resulting from any ideas, methods, instructions or products referred to in the content. |
© 2025 by the authors. Licensee MDPI, Basel, Switzerland. This article is an open access article distributed under the terms and conditions of the Creative Commons Attribution (CC BY) license (https://creativecommons.org/licenses/by/4.0/).
Share and Cite
Costa, M.; Barba, S. Enhancing Rural Energy Resilience Through Combined Agrivoltaic and Bioenergy Systems: A Case Study of a Real Small-Scale Farm in Southern Italy. Energies 2025, 18, 5139. https://doi.org/10.3390/en18195139
Costa M, Barba S. Enhancing Rural Energy Resilience Through Combined Agrivoltaic and Bioenergy Systems: A Case Study of a Real Small-Scale Farm in Southern Italy. Energies. 2025; 18(19):5139. https://doi.org/10.3390/en18195139
Chicago/Turabian StyleCosta, Michela, and Stefano Barba. 2025. "Enhancing Rural Energy Resilience Through Combined Agrivoltaic and Bioenergy Systems: A Case Study of a Real Small-Scale Farm in Southern Italy" Energies 18, no. 19: 5139. https://doi.org/10.3390/en18195139
APA StyleCosta, M., & Barba, S. (2025). Enhancing Rural Energy Resilience Through Combined Agrivoltaic and Bioenergy Systems: A Case Study of a Real Small-Scale Farm in Southern Italy. Energies, 18(19), 5139. https://doi.org/10.3390/en18195139


