Article

Analyzing the Transient Heat Transfer Characteristics of a Drain Water Heat Recovery Device

by
Ezra Ovadia
1,
Allan R. Willms
2 and
Mostafa H. Sharqawy
1,*
1
College of Engineering, University of Guelph, Guelph, ON N1G 2W1, Canada
2
College of Computational, Mathematical, and Physical Sciences, University of Guelph, Guelph, ON N1G 2W1, Canada
*
Author to whom correspondence should be addressed.
Energies 2025, 18(19), 5118; https://doi.org/10.3390/en18195118
Submission received: 26 May 2025 / Revised: 15 July 2025 / Accepted: 22 September 2025 / Published: 26 September 2025
(This article belongs to the Section J1: Heat and Mass Transfer)

Abstract

This paper investigates the transient behavior of a drain water heat recovery (DWHR) device, which recovers heat from warm grey water in buildings. Experimental and numerical investigations were conducted to study the thermal performance of the device under transient conditions. Thermal performance measurements were carried out, and a mathematical model was developed that considered the thermal inertia of the hot and cold-water streams as well as the device’s material. The experimental data were used to validate the model, and good agreement was observed between the two. Under transient operating conditions, the device’s performance was measured in terms of its effectiveness, and an actual effectiveness model was used to capture the transient effect on the system’s overall performance. The experimental results show that during short hot water usage, the actual device effectiveness is significantly reduced as it does not reach a steady state condition. An economic analysis indicates that considering the device’s transient performance leads to a 27.2% reduction in annual energy savings in a typical domestic installation with regular daily usage of hot water appliances. The presented model and analysis offer valuable insights for the development of improved DWHR devices with the potential to contribute to sustainable engineering and building practices.

1. Introduction

Environmental challenges, including global warming and climate change, are intensifying on a global scale. To mitigate further environmental harm, there is a pressing need for researchers and industry experts to prioritize advancements in renewable energy and energy management systems. Currently, 10% of global water usage occurs in households, with projections indicating a 20% rise over the next decade. In Canada, residents consume an average of 75 L of hot water daily, with water heating accounting for approximately 17.2% of household energy consumption [1]. These figures underscore the importance of adopting technologies such as drain water heat recovery (DWHR) to decrease energy use associated with water heating in homes.
A DWHR system is an effective solution for reducing energy consumption associated with water heating by enabling heat transfer between two fluid streams. In residential applications, these systems work by transferring thermal energy from warm greywater to incoming cold freshwater. Rather than being lost, the residual heat in the greywater is used to preheat the cold water supply before it reaches the water heater, benefiting various household uses such as showers and dishwashers. DWHR systems can differ in design, orientation, size, and installation location within a building. Studies indicate that vertically oriented units tend to recover more heat compared to horizontal configurations, though their implementation may be limited by spatial constraints [2]. Current vertical DWHR devices typically consist of either a single or multiple copper helical tubes wrapped around a central copper drainpipe. As warm greywater flows through the central pipe, it forms a thin film on its inner surface, facilitating heat transfer to the cold freshwater circulating through the outer helical coils. These vertical systems are often referred to as falling film or gravity film heat exchangers, as they operate passively without requiring additional energy input or ongoing maintenance after installation.
Extensive research has been carried out on DWHR systems operating under steady-state conditions, exploring various configurations and operational parameters. The general agreement among studies is that harnessing waste heat from drain water is a practical way to reduce energy consumption for water heating [3,4,5,6]. Findings indicate that such systems can cut energy use for water heating by up to 25% [7,8]. To evaluate the thermal performance of heat exchangers, the NTU-effectiveness method is commonly employed, as it calculates the ratio of actual heat transfer to the maximum possible under steady-state conditions [9]. Zaloum et al. [10] utilized this method to assess several residential DWHR units. After testing eight different devices, they identified that the most efficient design featured a quadruple helical pass for cold-water flow. In another study, Manouchehri and Collins [11] highlighted that the rated performance of a DWHR system may not accurately reflect its real-world performance once installed. They developed an empirical model to predict actual device performance more precisely and validated it through experimental testing. Beentjes et al. [12] discovered that in falling-film DWHR systems, there exists a critical flow rate below which effectiveness becomes unpredictable due to uneven wetting of the central copper pipe at low flow rates. Additionally, they observed an inverse relationship between effectiveness and flow rate. Expanding on this, Salama [13] and Salama and Sharqawy [14] noted that when a DWHR system operates under partially wet conditions, its effectiveness can drop by as much as 28.5%. For optimal performance, the inner surface of the drainpipe must maintain a consistent film of drain water.
The performance and heat transfer capability of a heat exchanger during the transition period before reaching steady state are critical factors. A heat exchanger operates in a transient state when disturbances occur in its inlet conditions, such as changes in temperature or flow rate, which subsequently affect outlet parameters. Until these variables stabilize, the system remains in a transient state. Research on the transient behavior of DWHR systems has been limited, with Zaloum et al. [10] reporting only minor differences between steady-state and transient data. However, other studies have extensively investigated counter-flow heat exchangers, offering insights applicable to DWHR systems. For instance, Askar et al. [15] examined the transient response of a cross-flow heat exchanger when subjected to changes in operating conditions, such as temperature and flow rate. Their experimental results revealed that the two fluid streams did not respond immediately or uniformly to a step change in mass flow rate. Additionally, they observed that larger step changes led to increased response times. Similar findings were reported in another study analyzing the transient thermal performance of cross-flow heat exchangers under disturbances in inlet mass flow rates [16]. This study highlighted that the delayed response of the fluids to inlet perturbations is due to energy storage in the heat exchanger walls. Furthermore, the authors noted that the size of the device plays a key role in determining response time, as it is directly linked to the residence time of the fluids. In related work, Silaipillayarputhur [17] demonstrated that higher mass flow rates reduce the time required to achieve steady-state conditions, as the temperature difference propagates through the heat exchanger more quickly.
Researchers have shown considerable interest in developing analytical models for heat exchangers operating under transient conditions, often employing similar methodologies that incorporate the initial and final fluid temperatures. Lachi et al. [18] investigated the time constant of a double-pipe heat exchanger under varying flow rates. Their model for the time constant relies on the initial and final bulk temperatures of the fluids, as well as the flow rates. Similarly, Yin and Jensen [19] formulated an analytical model to describe the transient response of counter-flow heat exchangers. They approximated the system’s behavior using an integral model that considers the initial and final temperature distributions to derive a time-dependent function. Their analysis involves two first-order ordinary differential equations to represent the time-varying temperatures of the fluid and tube wall. However, their work provides limited insight into how a step change in inlet conditions might influence the overall performance of the heat exchanger.
The Laplace transform has been widely employed in analyzing the transient performance of heat exchangers, owing to its effectiveness in solving problems within the frequency domain. Romie [20] determined the temperature response of a counter-flow heat exchanger by applying a finite difference method to solve the governing equations and utilizing the Laplace transform to calculate the fluid exit temperatures. Similarly, Yang et al. [21] developed an analytical model to evaluate the dynamic behavior of heat exchanger networks, relying on the Laplace transform to derive the system’s outlet temperature function in the Laplace domain. Later, Yang and Tran [22] refined their model to address convergence challenges and provided the outlet temperature in the time domain. However, this approach to constructing heat exchanger networks is not practical for DWHR systems due to their inherent complexity. Other researchers have also used the Laplace transform to derive equations for outlet temperature distributions in counter-flow and cross-flow heat exchangers, but no such application has been extended to model DWHR systems [23,24].
Although the DWHR device has been proven effective at reducing energy consumption for water heating, economic and life cycle analyses are crucial for the success of the device. Zaloum et al. [10] tested several DWHR-installed devices and found the best-performing device saved $154.32 worth of fuel for water heating in the first year. Their simulation showed the annual savings decreasing by an average of $5 per year for 30 years and a total savings of $2,177.83 over the lifetime of the device. For the device studied, the payback period was under six years [10]. Ravichandran et al. [25] studied the influence of climatic conditions on DWHR systems, and all scenarios showed that the implementation of a DWHR system is more sustainable than the baseline system. They showed the economic savings over the lifetime of a DWHR system range from $1960 in warm regions to $7160 in cold regions with an electric water heater.
The review of existing literature reveals a lack of significant research on the transient performance of residential DWHR systems. Most studies have focused on steady-state performance, a common approach in heat exchanger evaluations. However, due to the inherently dynamic nature of water usage in residential settings, heat recovery in these systems is far from static. To address this gap, this study investigates the dynamic behavior of a residential DWHR device through both experimental and numerical methods, considering the impact of transient operating periods on overall system performance. The time-dependent variations in hot and cold-water temperatures are measured and modeled under fluctuating heat input from the water heater. A mathematical model tailored to the DWHR device as a counter-flow heat exchanger is developed and solved numerically. The analysis provides insights into the system’s effectiveness and economic advantages during transient operation.
The remainder of the paper is organized as follows: Section 2 describes the experimental setup used for testing the DWHR system, the development and solution of the mathematical model, and the uncertainty analysis conducted to ensure result accuracy. Section 3 provides the results and discussion, including a technical performance analysis of the DWHR under transient conditions, followed by an economic analysis that demonstrates how transient performance influences energy savings and cost-effectiveness.

2. Materials and Methods

2.1. Experimental Setup

In order to accurately measure the performance of the drain water heat recovery device, the experimental setup includes an open water circuit designed to mimic a residential DWHR installation. Figure 1 shows a schematic of the experimental setup and photos of the experimental setup could be found in Salama [13]. The device tested consists of a central copper drainpipe of 3 inches nominal diameter and 740 mm length, where warm grey water flows down and forms a water film on its inner surface. Additionally, it has four copper helical coils wrapped around the central drainpipe, where the cold freshwater enters from the bottom and exits from the top. The device operates as a typical counter-flow heat exchanger, where heat from the grey, warm water is transferred to the cold, main water. Figure 2 shows the 2D CAD drawing of the tested DHWR device, and Table 1 shows the device’s dimensions.
The water circuit is composed of several components and devices for precise measurement and recording of flow rates, temperatures, and heat input. The flow circuit starts with cold water from the tap, which is filtered through an inline cartridge filter before entering a rotameter flow meter and the DWHR device inlet. The cold-water inlet temperature (Tc,in) is measured by a rugged pipe-plug thermocouple probe installed at the DWHR cold water inlet. As the cold-water travels through the helical coil of the DWHR device to the outlet, a second thermocouple is installed to measure the cold-water outlet temperature (Tc,out). The water continues to flow into a tankless electric water heater with two 3 kW heating elements used to induce a temperature increase in the water. The power input ranges between 1 and 6 kW, depending on the desired temperature and flow rate. The current and voltage inputs of the electric heater are measured by a digital ammeter and voltmeter, respectively. Afterward, the water moves to an upper tank that feeds the hot water inlet to the DWHR device. A partition in the upper tank was made to reduce turbulence in the tank and guarantee a steady laminar flow at its output. The hot water inlet temperature to the DWHR device (Th,in) is measured in the upper tank using an immersed-type thermocouple probe. The hot water then flows through a transparent PVC pipe, 40 cm in length and 3 inches in diameter, at the upper tank center, which allows for observation of the water flow as it travels downward by gravity to enter the DWHR device. A copper drainpipe leads to the hot water exit, where another thermocouple measures the outlet hot water temperature (Th,out). All the thermocouples used are of the K type and were connected to a temperature data logger (PicoLog-08) that records the temperature every second.
Before the data were recorded, the flow rate was adjusted to the desired rate, and the inlet cold water was allowed to flow for 15 min with the heater off to ensure the system was in thermal equilibrium with the cold-water temperature. Then, once the heater was switched on, the data started recording until the thermocouples read constant values and the system reached steady state. This procedure was repeated to test the device for three flow rates: 1.5 gpm (5.7 L/min), 2.0 gpm (7.6 L/min), and 2.5 gpm (9.5 L/min). The temperature-time data collected were used for the analysis and to create the transient response curve that includes all changes in temperature from the initial to the steady state values. In addition, the data were used to validate the mathematical model developed for the transient characteristics of the DWHR device.

2.2. Mathematical Model

The thermal performance of the DWHR device is analyzed using its effectiveness. The rates of heat transfer to and from the cold and hot water are calculated using energy balances as follows:
Q ˙ h = m ˙ c h T h , i n T h , o u t ,
Q ˙ c = m ˙ c c T c , o u t T c , i n .
It is important to emphasize that during the transient operation, Q ˙ h will be larger than Q ˙ c . Upon reaching steady state, Q ˙ h and Q ˙ c are equal. However, there might be some differences due to heat losses to the surroundings or instrument data fluctuation; therefore, an average value of the heat transfer rate is taken as the one transferred through the heat transfer surface after reaching steady state. The effectiveness (ε) of a heat exchanger is the ratio of the heat transfer to the maximum heat transfer that can occur, which is given by:
ε = Q ˙ Q ˙ m a x = Q ˙ m ˙ c m i n T h , i n T c , i n ,
where m ˙ c m i n is the lower value of the heat capacity rate for one of the two water streams (i.e., the hot and cold). For the current DWHR device, both streams have the same mass flow rate since they operate in an open circuit. However, the cold water has a slightly lower specific heat (c) than the hot water, because the specific heat value increases with temperature. Therefore, the cold water has the minimum heat capacity rate in this analysis, and hence the instantaneous effectiveness of the current DWHR device can be expressed as:
ε = T c , o u t T c , i n T h , i n T c , i n .
During the transient operating period, the effectiveness increases to approach the steady state value. The actual effectiveness considers the temperature variation since the beginning of the transient period and is therefore less than the instantaneous effectiveness. The actual effectiveness can be calculated by integrating the rate of heat transfer over the time since the start of the heat transfer process, as follows:
ε a c t u a l = 0 t T c , o u t T c , i n   d t 0 t T h , i n T c , i n   d t .
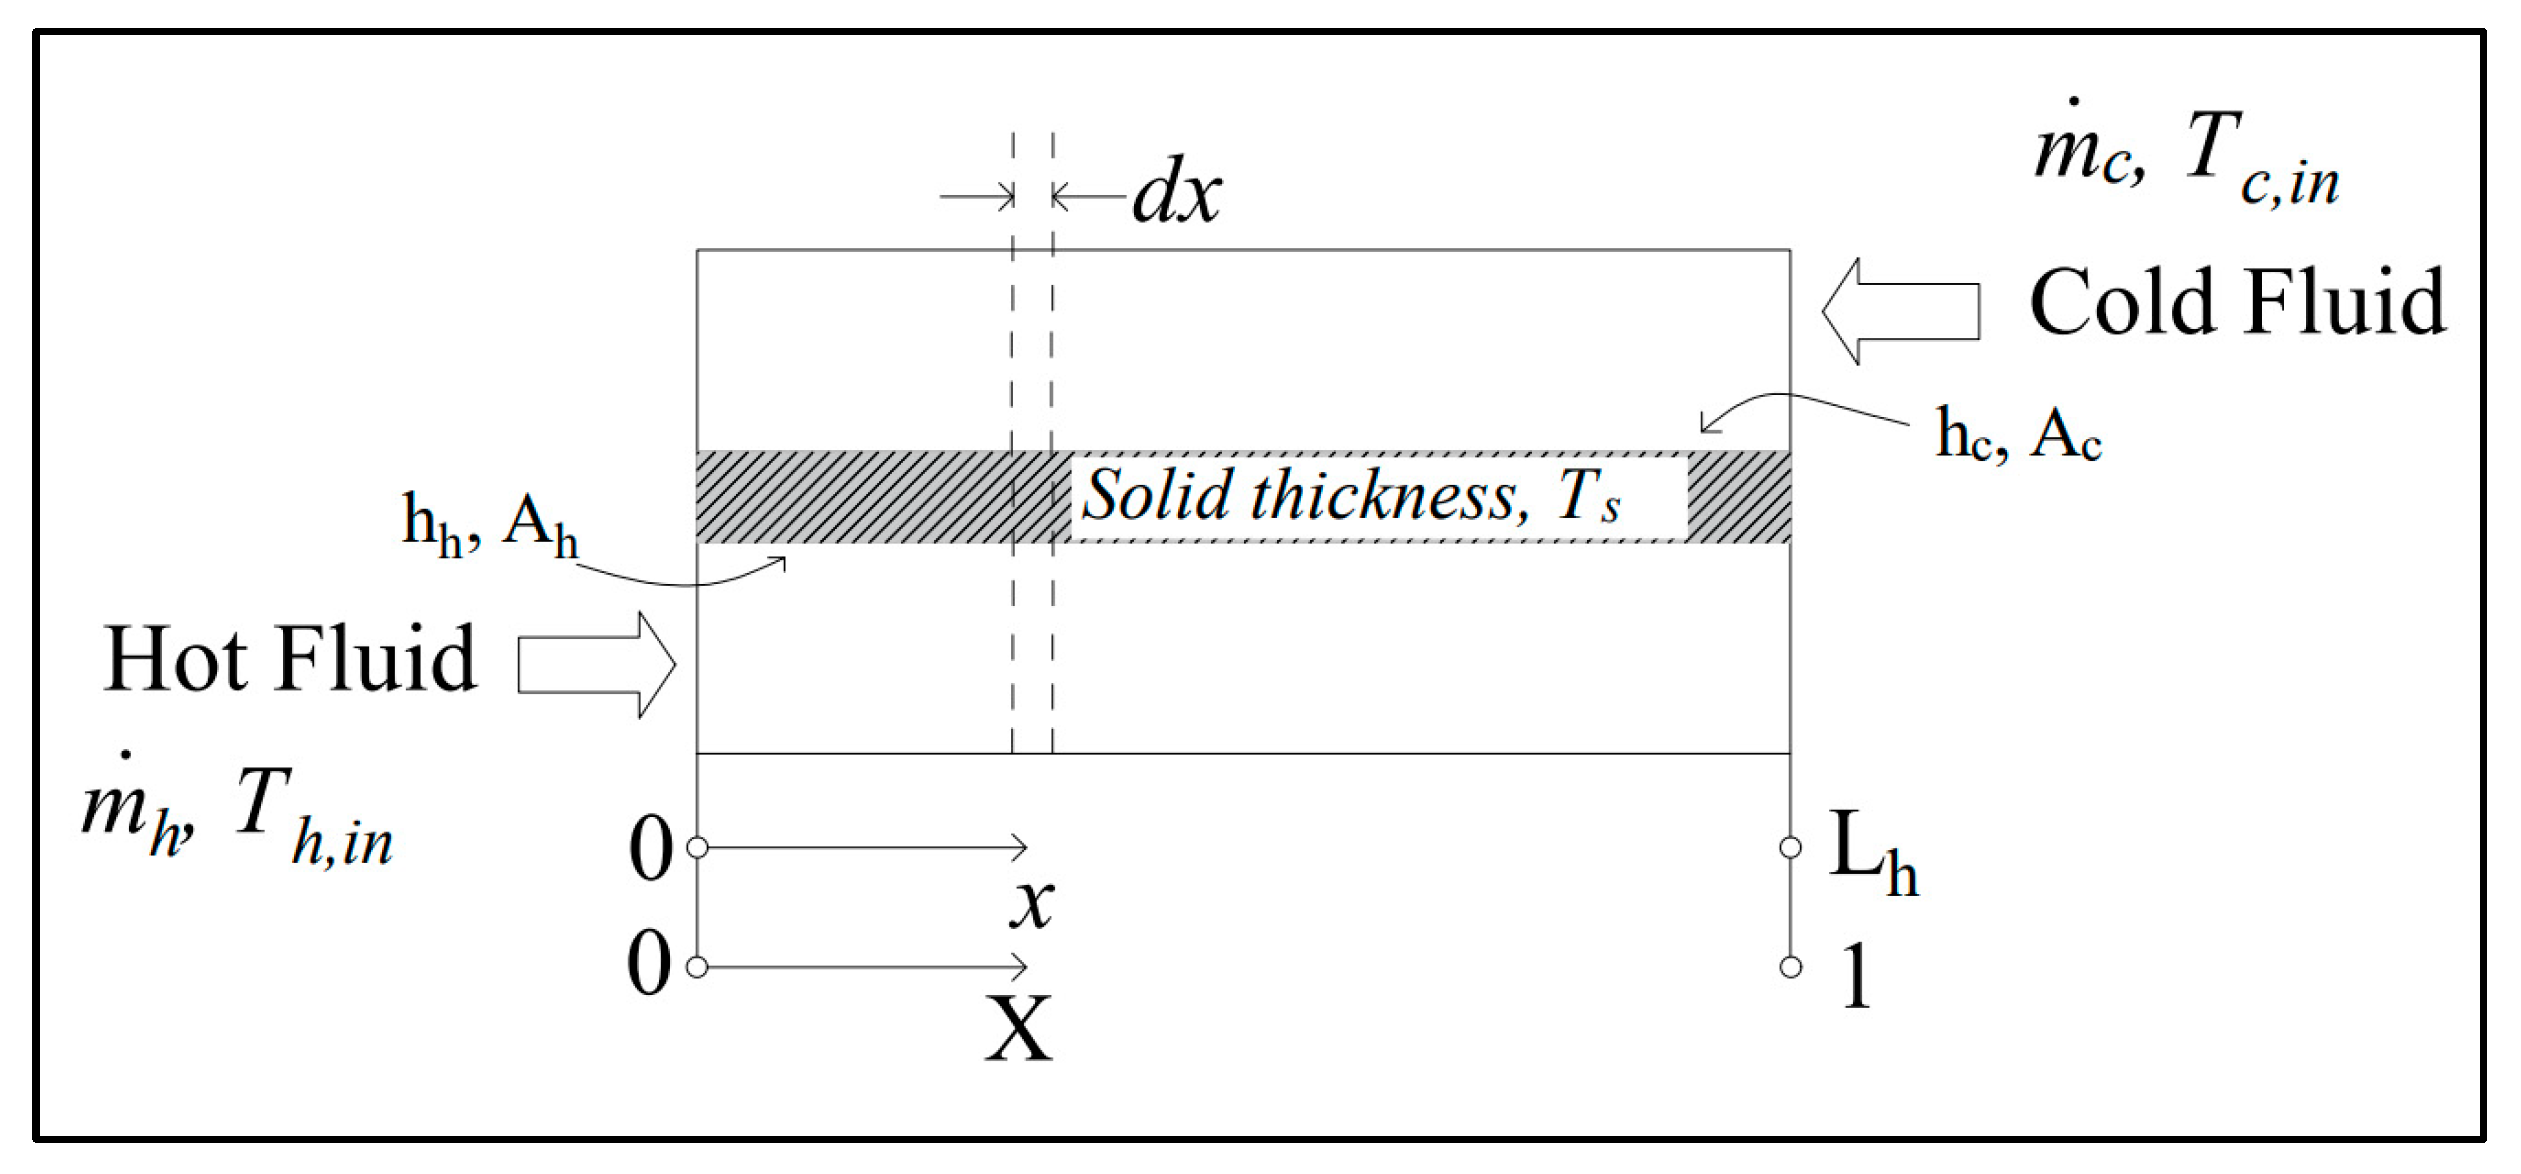
A detailed transient model of the DWHR device is discussed, focusing on the DWHR device itself as a counter-flow heat exchanger and considering the thermal inertia of the hot and cold-water streams as well as the solid copper pipes through which the heat is transferred. A finite control volume of the DWHR length is considered to apply transient energy balances. A schematic of this control volume is shown in Figure 3. The assumptions used in this model are as follows:
  • Heat transfer coefficients and thermophysical properties are independent of temperature, time, and position.
  • The flow rates are constant in each flow passage.
  • Axial conduction is neglected in both fluids and the solid pipes.
  • Heat losses to the surroundings are neglected.
  • Heat generation and viscous dissipation within the fluids are neglected.
An energy balance is applied to the solid pipes, hot-water, and cold-water masses within the control volume shown in Figure 3 to obtain three partial differential equations, respectively, as follows:
M s c s T s t = A h h T h T s A h c ( T s T c ) ,
m ˙ c h   L h T h x + 1 v h T h t = A h h T h T s ,
m ˙ c c   L c T c x + 1 v c T c t = A h c T s T c ,
where the mass of the solid copper drainpipe and helical coils (Ms) is 10 kg and the specific heat of the solid copper material (cs) is 386 J/kg K [13]. The boundary conditions are:
T h 0 ,   t = T h , i n t ,
T c L c ,   t = T c , i n ,
Using the following dimensionless parameters, Equations (6)–(8) can be normalized. A dimensionless temperature is defined as:
θ i x , t = T i x , t T m i n T m a x T m i n ,         i = h ,   c ,   s ,
where Tmin and Tmax are the minimum and maximum temperatures in the system, respectively. For the current DWHR device, the minimum temperature would be the cold-water inlet temperature (Tc,in) and the maximum temperature is the hot-water inlet temperature (Th,in).
The normalized length is defined as:
X = x L h
The non dimensional time is represented by:
F = t t *
where the characteristic time t* is given by:
t * = M s c s ( A h ) h + ( A h ) c
A heat capacity ratio is defined as:
ω = ( m ˙ c ) h ( m ˙ c ) c
Additionally, the following dimensionless parameters are defined:
K h = ( A h ) h ( A h ) h + ( A h ) c
K c = ( A h ) c ( A h ) h + ( A h ) c = 1 K h
C i = L i ( m ˙ c ) i c s M s 1 K i v i ,         i = h , c
Using the above-described dimensionless parameters, the system equations can be normalized to:
θ s F + θ s = K h θ h + K c θ c
C h θ h F + K c N T U h θ h X = θ s θ h
C c θ c F K h ω   N T U h θ c X = θ s θ c
where N T U h is the number of transfer units based on the hot fluid heat capacity, ignoring the conduction and contact resistances given by:
N T U h = A h h A h c [ A h h + ( A h ) c ] 1 ( m ˙ c ) h .
The dimensionless boundary conditions for the hot water inlet are given by Equation (24) for a ramp input, where F c u t   is the dimensionless time where the ramp ends. Equation (25) is the boundary condition for the cold water inlet, and Equation (26) is the initial condition for all temperatures.
θ h 0 ,   F = 1 F c u t F , F < F c u t 1 , F F c u t
θ c 1 ,   F = 0
θ h X ,   0 = θ s X ,   0 = θ c X , 0 = 0
The heat transfer coefficient for the hot water falling film ( h h ) is calculated using the correlation provided by Salama [13] as follows:
h h = 0.014 R e h 0.48 μ h 2 ρ h 2 k h 3 g 1 3
The convection heat transfer coefficient of the cold water inside the helical pipe ( h c ) is calculated using Manlapaz and Churchill’s correlation given in [26].
h c = k c d h d 4.364 + 4.636 x 1 3 + 1.816 D e c x 2 3 2 1 3
where x 1   and x 2 are functions of the Dean ( D e ) and Prandtl ( P r ) numbers, given as follows:
x 1 = 1 + 1342 D e c 2 P r c   2
x 2 = 1 + 1.15 P r c
The Dean number represents the Reynolds number for curved pipes or conduits and is given by Equation (30).
D e c = R e c d h d 2   R c
The coil radius of curvature is given by:
R c = d h c 2 1 + p π d h c 2  
The pitch of the helical coil ( p ) can be found in Table 1. Reynolds numbers for the hot and cold water are given by:
R e h = ρ v h d i μ h
R e c = ρ v c d h c μ c
The velocities are calculated as follows: where A c is the cross-sectional area of the flow,
v h = m ˙ h ( ρ A c ) h
v c = m ˙ c 4 ( ρ A c ) c
The detailed transient model equations given by Equations (20)–(22) and (24)–(27) are solved numerically using an in-house MATLAB R2022a code that discretizes the system of equations using finite difference method (FDM) over a grid and uses the method of characteristics. Details of the MATLAB code and discretization method are given in detail in [27]. The model requires dimensionless constants (i.e., N T U h , K h , K c , C h , C c , and ω ) and calculated parameters that are dependent on the flow rate and are given in Table 2.

2.3. Uncertainty Analysis

The uncertainty of the experimental results was determined by performing a detailed uncertainty analysis that accounts for the individual uncertainties of all measured variables, as specified by the instrument manufacturers. The thermocouples used in the setup have a temperature measurement uncertainty of ±0.1 °C, while the flowmeters used to measure the fluid flow rates have an uncertainty of ±2%. A Vernier caliper with a precision of 0.01 mm was used to measure the geometric dimensions of pipes and tubes, including wall thickness and diameter.
To propagate these individual uncertainties through the derived equations, the uncertainty analysis was performed using the Engineering Equation Solver (EES) software [28], based on the root-sum-square method outlined in Holman [29]. This method takes into account both systematic and random errors by combining the partial derivatives of the dependent variables with respect to each measured variable. The resulting propagated uncertainties provide a comprehensive estimate of the error in the calculated effectiveness values. According to the analysis, the effectiveness shows an average uncertainty of ±2.4% and a maximum uncertainty of ±7.5% over the range of operating conditions considered in this study.

3. Results & Discussions

3.1. Technical Analysis

The transient response of the DWHR device with a fixed heat input is determined using the collected temperature-time data and flow rate. The effectiveness was calculated using the collected data and the mathematical model discussed in the previous section. The thermal performance is represented by the experimental instantaneous effectiveness calculated from Equation (4). The instantaneous effectiveness increases until it reaches a steady state and is inversely related to the flow rate as more heat is transferred between the fluids at small flow rates. Table 3 shows the actual effectiveness at one- and five-minute intervals calculated with Equation (5).
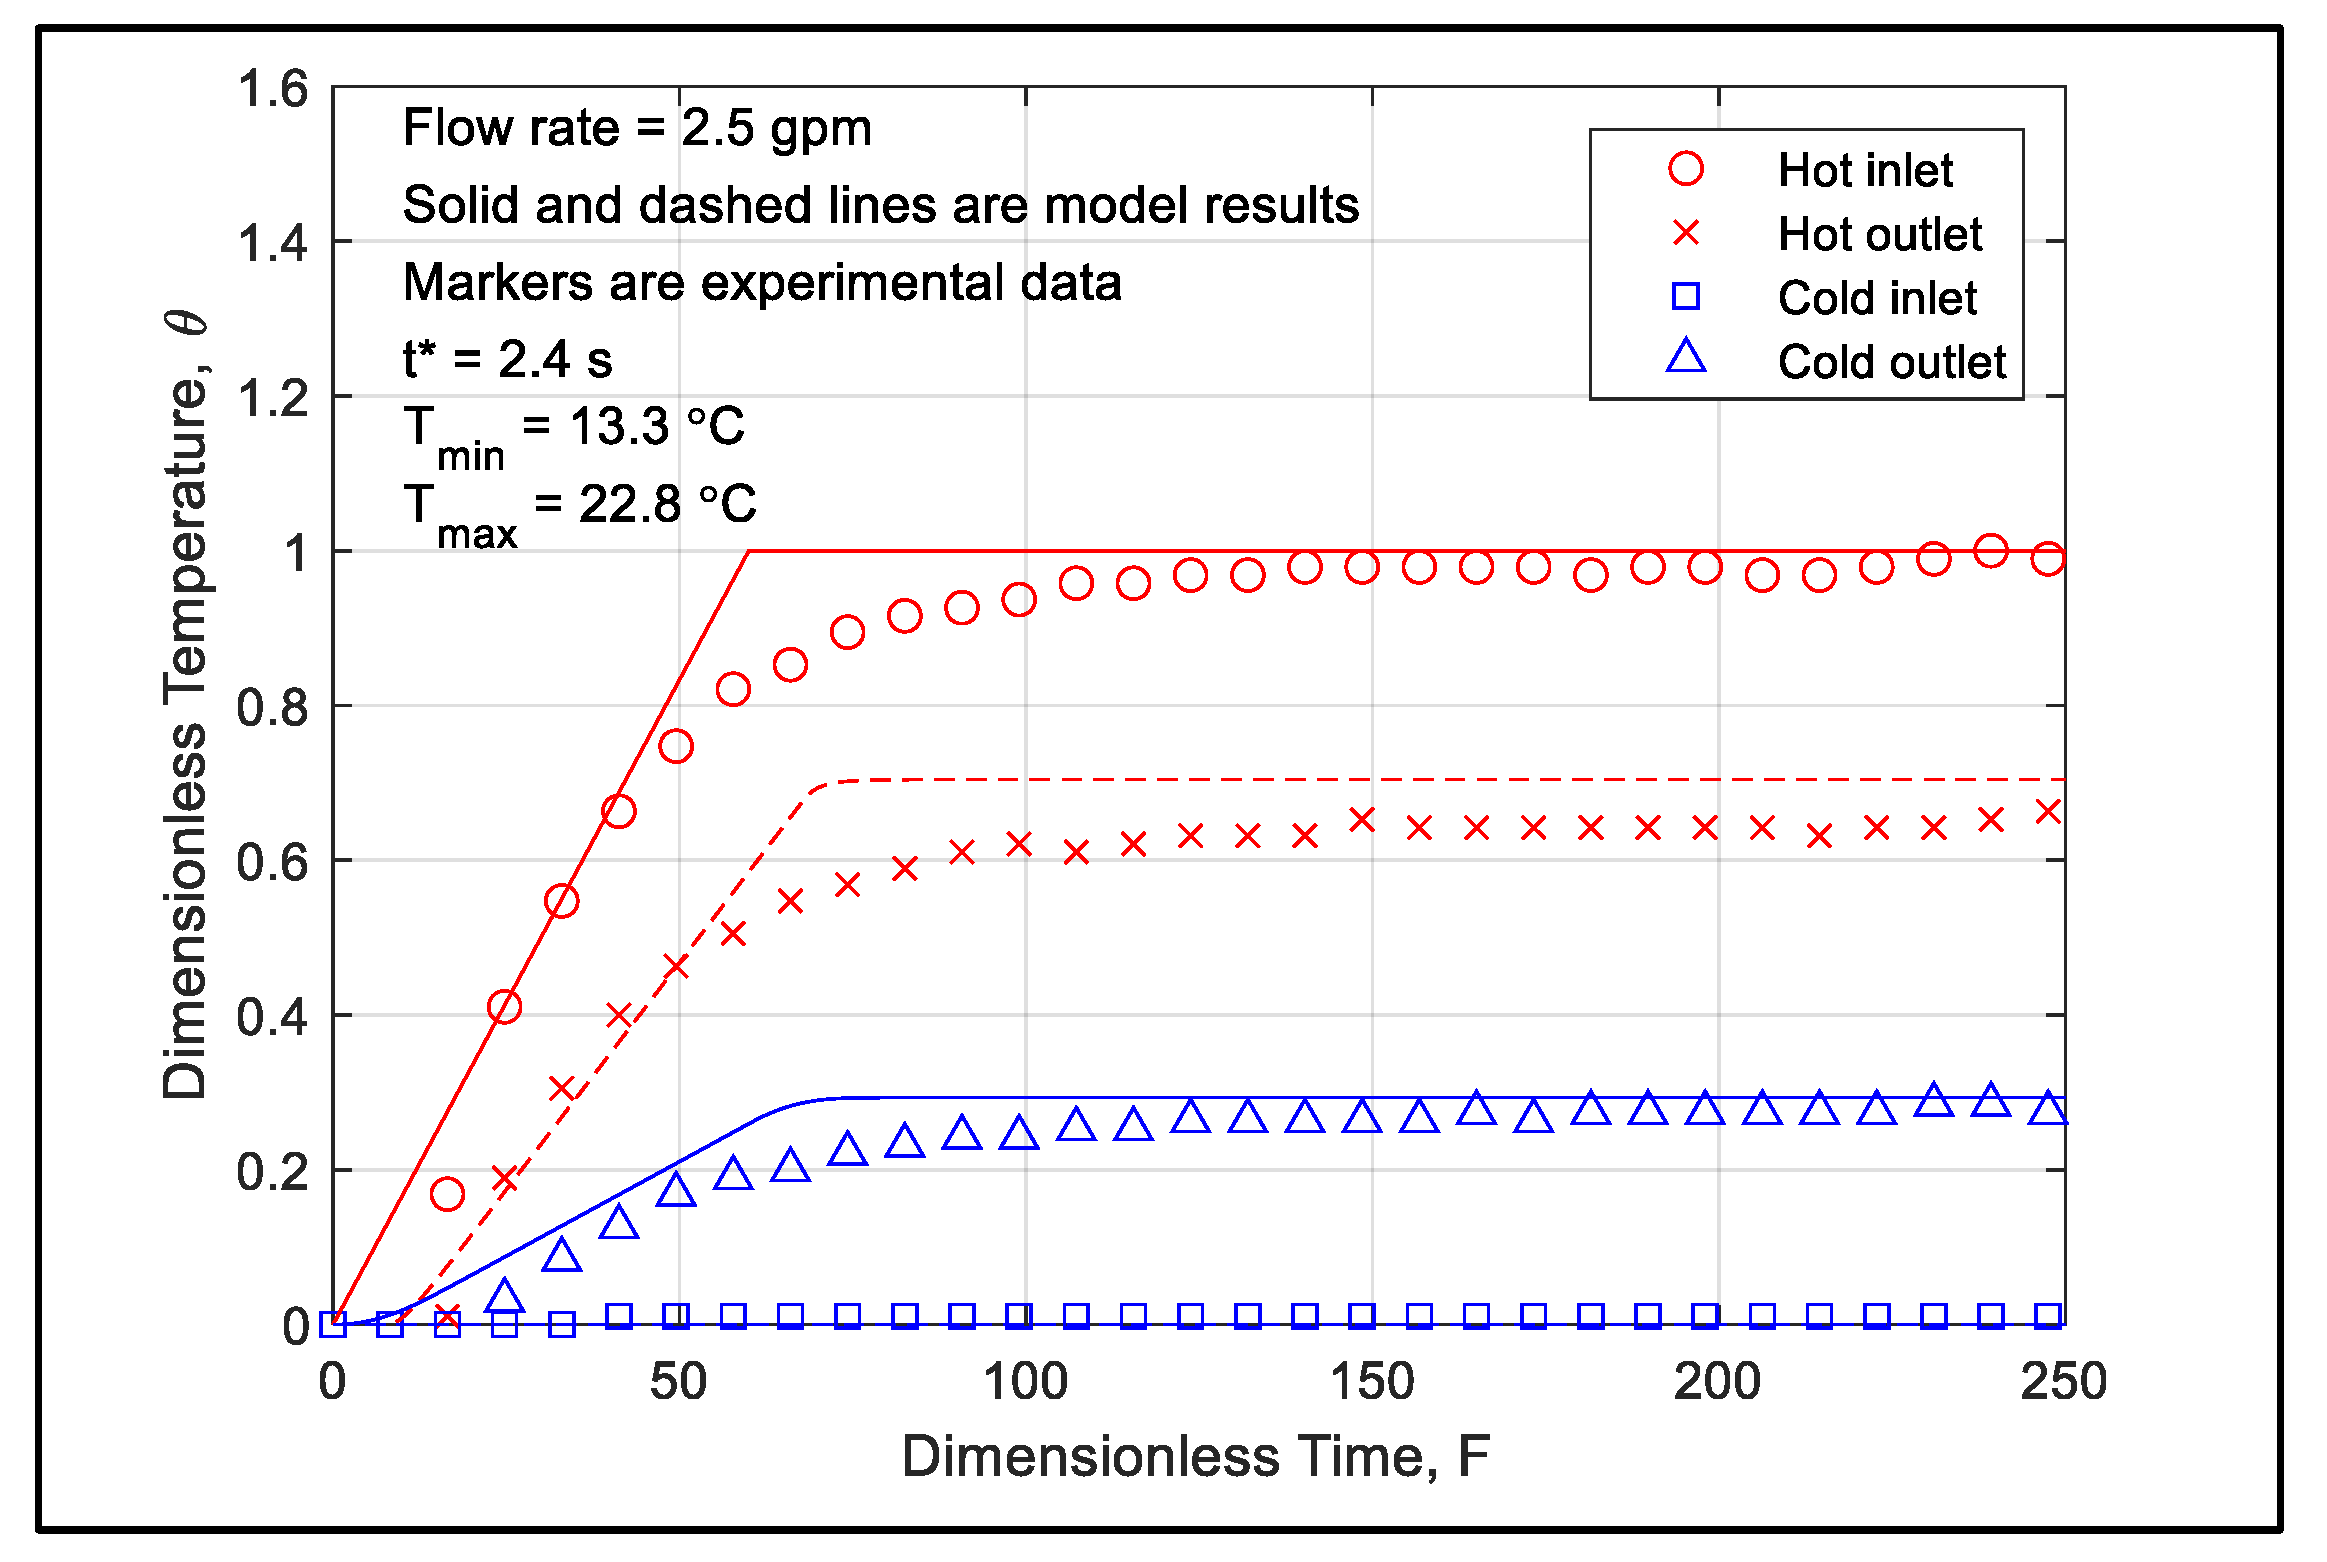
A comparison of the experimental results of the DWHR device and the mathematical model are presented here. This model predicts the hot and cold fluid temperatures and the effectiveness when the hot inlet fluid is perturbed. The model is validated using the experimental temperature data of the cold and hot water inlet and outlet temperatures. In this experiment, the cold-water inlet temperature is constant while the hot water inlet temperature increases due to the heat input from the water heater to reach its final value. Therefore, the presented transient response is due to a ramp input (perturbation) of the inlet hot water of the device. Figure 4, Figure 5 and Figure 6 illustrate the dimensionless terminal temperature variations with dimensionless time for both hot and cold water at various flow rates, comparing experimental data with model predictions. In these figures, the solid and dotted lines represent the model values, while the marker points indicate the experimental measurements. As shown, there is a good match between the model and experimental data, demonstrating the model’s ability to accurately predict the transient variation in the outlet cold water temperature across all flow rates. However, at a high flow rate of 2.5 gpm, the model slightly overpredicts the hot water outlet temperature. This discrepancy arises due to the model’s omission of heat loss, which becomes significant at higher flow rates due to an increased heat transfer coefficient.
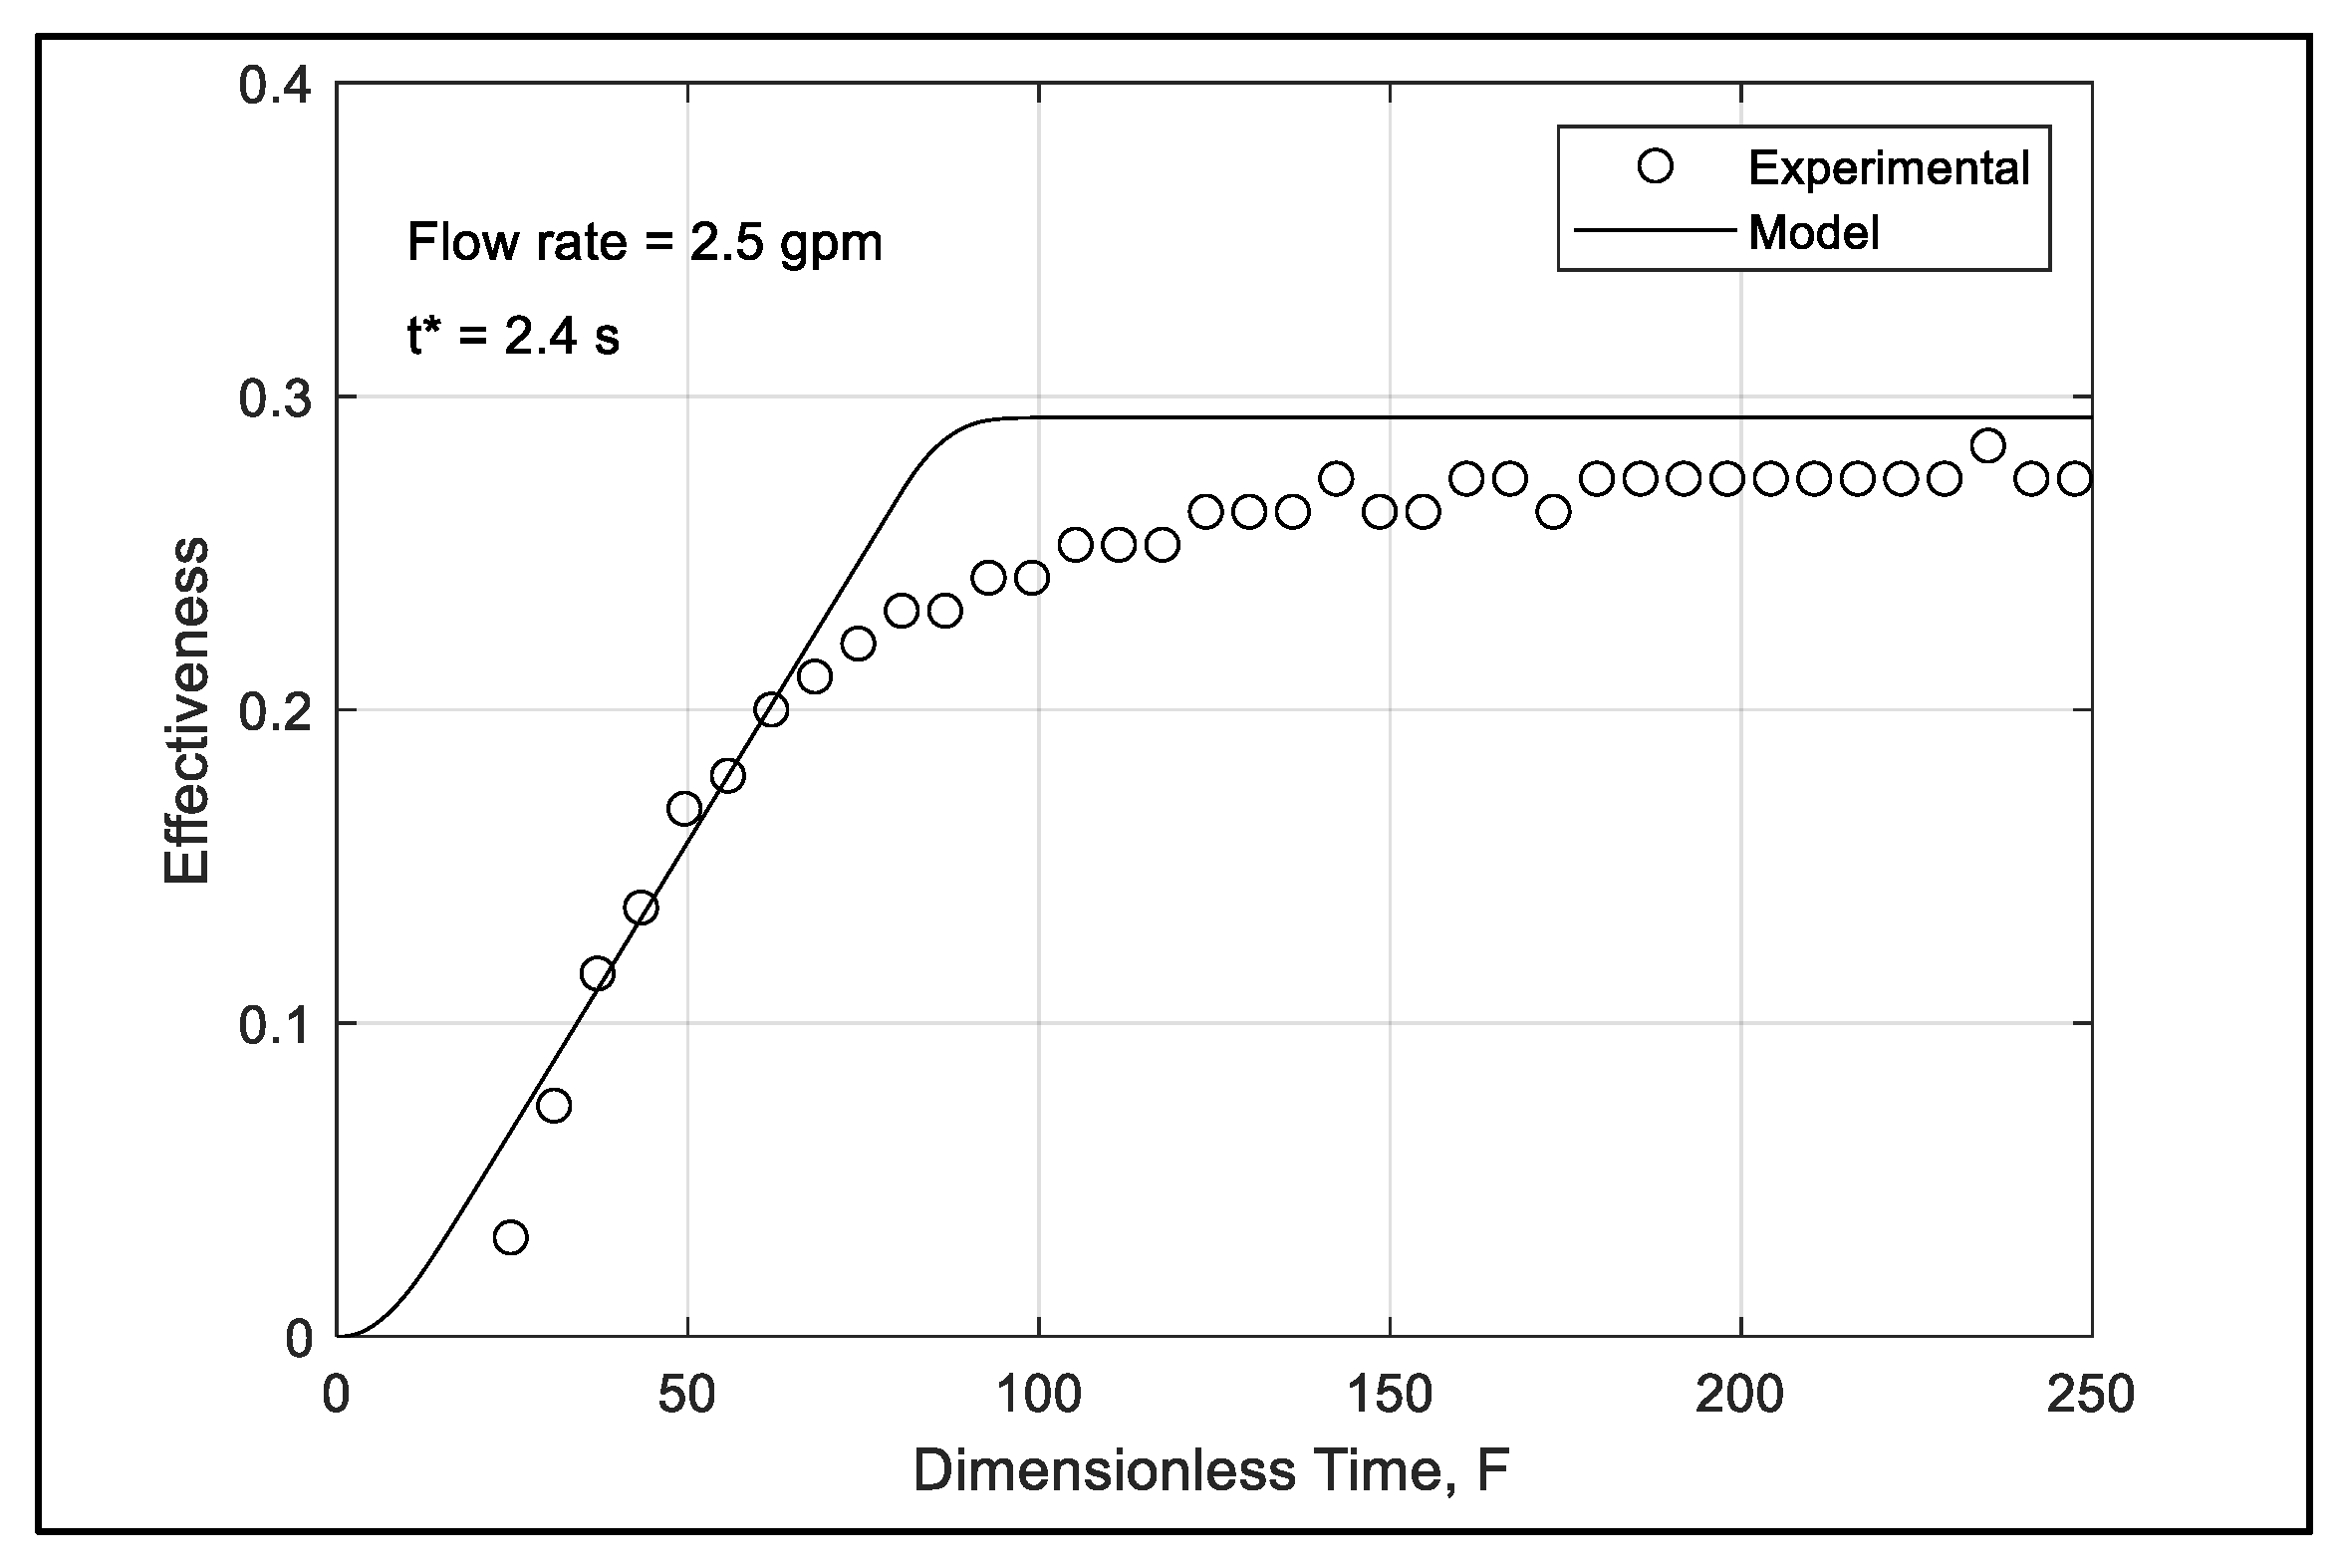
The detailed transient model of the DWHR device can also predict its transient effectiveness at any flow rate. For a given inlet hot water temperature, the output cold water temperature can be predicted by the model, thereby allowing the thermal effectiveness to be calculated. Figure 7, Figure 8 and Figure 9 present the experimental effectiveness alongside the model predictions at different flow rates, where the marker points represent the experimental data, and the lines correspond to the model predictions. These figures illustrate how the DWHR effectiveness varies with dimensionless time. The characteristic time t*, provided in each figure, can be used to convert the dimensionless time on the x-axis to actual time. These figures demonstrate excellent agreement between the model and experimental data for both transient and steady-state effectiveness. However, at higher flow rates, the model slightly overpredicts its effectiveness. This overprediction is due to the heat loss not accounted for in the model, which becomes more pronounced at higher flow rates as the heat transfer coefficient increases.

3.2. Economic Analysis

In this section, an economic analysis is conducted based on the average hot water use of a three-occupant house. The data used in this analysis were provided by the National Renewable Energy Laboratory [30] shown in Table 4. This analysis aims at providing an accurate estimation of the annual savings using the transient and steady state DWHR device performance for all hot water use in the home. This includes sinks, showers, clothes washers, dishwashers, and baths. Table 5 lists the assumptions that were used in this study.
According to Table 4, the shower, clothes washer, dishwasher, and bath all have a run time of at least five minutes, allowing the device to reach steady state conditions. This means that a portion of the device’s operation is in a steady state, and the full benefits of the DWHR device can be achieved. The sink is the only appliance that does not meet this condition, meaning it operates only in a transient state.
The annual savings can be found by calculating the heat recovered based on the steady state effectiveness and the actual (transient) effectiveness that considers the transient period of operation. These energy recovery values are calculated using:
Q ˙ s s = ε s s   m ˙ c c   T h , i n T c , i n
and
Q ˙ t r = ε t r   m ˙ c c   T h , i n T c , i n
Respectively, the annual energy savings of the DWHR device is then calculated as:
E n e r g y   S a v i n g s = Q ˙ s s   o r   t r × D u r a t i o n × F r e q u e n c y × 365   d a y s y e a r 3600   k J k W h
A n n u a l   s a v i n g s = E n e r g y   S a v i n g s × E n e r g y   c o s t
The cost of energy will vary depending on the type of water heater used (i.e., electric or natural gas). Table 6 shows the effectiveness, energy recovery rate, and annual savings from the DHWR device under steady-state and transient conditions. The results provided are for a three-occupant house, although the annual savings will increase as the number of occupants increases.
Figure 10 shows the steady state and transient energy recovered for each appliance. It shows the sink has the largest difference in its ability to recover energy when considering the transient state, due to its short use time. The other appliances do not limit the amount of heat recovered from the DWHR device as much due to a longer use time and higher flow rate. The figure also shows the most heat is recovered from the shower and the least heat recovered is from the bath.

4. Conclusions

In this study, we investigated the transient thermal performance of a Drain Water Heat Recovery (DWHR) device through both experimental and numerical approaches. We developed a robust transient mathematical model for the DWHR device, treating it as a counter-flow heat exchanger under transient conditions. This versatile model can predict the device’s effectiveness across varying flow rates, materials, and dimensions, making it valuable for optimizing performance when operating times are limited. The model’s predictions showed excellent agreement with experimental data for both transient and steady-state effectiveness. Key findings include:
  • Effectiveness reduction with short usage intervals: Frequent short bursts of hot water usage led to a significant drop in device effectiveness due to insufficient time for reaching steady-state.
  • Economic impact: Accounting for transient performance resulted in a 27.2% reduction in annual energy savings, emphasizing the need to address transient behavior for maximum energy-saving potential.
  • The sink was identified as the appliance that most limits heat recovery due to its shorter usage duration and lower flow rate.
  • The shower offered the highest heat recovery potential, while the bath contributed the least.
Overall, this study provides an adaptable transient model for DWHR devices and highlights the practical benefits of considering transient performance to enhance energy recovery, especially in scenarios with limited operation time.

Author Contributions

Conceptualization, M.H.S. and A.R.W.; methodology, M.H.S.; software, A.R.W.; validation, E.O.; formal analysis, E.O.; investigation, E.O.; data curation, E.O.; writing—original draft preparation, E.O.; writing—review and editing, M.H.S.; supervision, M.H.S. and A.R.W.; funding acquisition, M.H.S. All authors have read and agreed to the published version of the manuscript.

Funding

This research was funded by the Natural Sciences and Engineering Research Council of Canada (NSERC), grant number 401366.

Data Availability Statement

The original contributions presented in the study are included in the article, further inquiries can be directed to the corresponding author.

Acknowledgments

The authors would like to thank the Natural Sciences and Engineering Research Council of Canada (NSERC–Grant #401366) for the funding support provided for this research.

Conflicts of Interest

The authors declare no conflict of interest.

Nomenclature

alength of the helical coil tube cross-sectionalm
Asurface aream2
bwidth of the helical coil tube cross-sectionalm
Cdimensionless parameter defined by Equation (18) as heat capacity ratio-
c specific heat capacityJ kg−1 K−1
DeDean number-
d i drainpipe inner diameterm
d o drainpipe outer diameterm
d h c helical coil diameterm
d h d helical tube hydraulic diameterm
Fdimensionless time-
ggravitational acceleration constantm s−2
h convection heat transfer coefficientW m−2 K−1
Kdimensionless parameter defined by Equations (16) and (17) as convection heat transfer ratio-
kthermal conductivity W m−1 K−1
L heat exchanger lengthm
Mmasskg
m ˙ mass flow ratekg s−1
NTUnumber of transfer units-
ppitchm
PrPrandtl number-
Q ˙ heat transfer rate W
Rcradius of curvaturem
ReReynolds number-
T temperature°C
ttimes
t*characteristic times
vvelocity m s−1
Xdimensionless distance-
xdistancem
Greek symbols
ε effectiveness-
θdimensionless temperature-
μ dynamic viscosity kg m−1 s−1
ρ densitykg m−3
ωheat capacity ratio-
Subscripts
c cold water
hhot water
ininlet
maxmaximum
minminimum
o u t outlet
ssolid
sssteady state
trtransient

References

  1. Government of Canada. Water Heaters. Available online: https://natural-resources.canada.ca/energy-efficiency/energy-efficiency-regulations/heat-pump-water-heaters (accessed on 14 August 2023).
  2. McNabola, A.; Shields, K. Efficient drain water heat recovery in horizontal domestic shower drains. Energy Build. 2013, 59, 44–49. [Google Scholar] [CrossRef]
  3. De Paepe, M.; Theuns, E.; Lenaers, S.; Van Loon, J. Heat recovery system for dishwashers. Appl. Therm. Eng. 2003, 23, 743–756. [Google Scholar] [CrossRef]
  4. Hadengue, B.; Joshi, P.; Figueroa, A.; Larsen, T.A.; Blumensaat, F. In-building heat recovery mitigates adverse temperature effects on biological wastewater treatment: A network-scale analysis of thermal-hydraulics in sewers. Water Res. 2021, 204, 117552. [Google Scholar] [CrossRef] [PubMed]
  5. Nagpal, H.; Spriet, J.; Murali, M.K.; McNabola, A. Heat Recovery from Wastewater—A Review of Available Resources. Water 2021, 13, 1274. [Google Scholar] [CrossRef]
  6. Focus, T. Heat Recovery from Wastewater Using Gravity-Film Heat Exchanger; National Laboratory: Oak Ridge, TN, USA, 2001. [Google Scholar]
  7. Hydro, M. Drain Water Heat Recovery Systems. Available online: https://www.hydro.mb.ca/your_home/water_use/drain_water_heat_recovery/ (accessed on 22 September 2022).
  8. Wallin, J.; Claesson, J. Investigating the efficiency of a vertical inline drain water heat recovery heat exchanger in a system boosted with a heat pump. Energy Build. 2014, 80, 7–16. [Google Scholar] [CrossRef]
  9. Incropera, F.P.; Dewitt, D.P.; Bergman, T.L.; Lavine, A.S. Fundamentals of Heat and Mass Transfer, 6th ed.; John Wiley & Sons: Hoboken, NJ, USA, 2007. [Google Scholar]
  10. Zaloum, C.; Lafrance, M.; Gusdorf, J. Drain Water Heat Recovery Characterization and Modeling; Sustainable Buildings and Communities Natural Resources: Ottawa, ON, Canada, 2007. [Google Scholar]
  11. Manouchehri, R.; Collins, M.R. Modelling the Steady-State Performance of Coiled Falling-Film Drain Water Heat Recovery Systems Using Rated Data. Resources 2020, 9, 69. [Google Scholar] [CrossRef]
  12. Beentjes; Manouchehri, R.; Collins, M.R. An investigation of drain-side wetting on the performance of falling film drain water heat recovery systems. Energy Build. 2014, 82, 660–667. [Google Scholar] [CrossRef]
  13. Salama, M. Investigating the Performance of a Falling-Film Drain Water Heat Recovery System. Master’s Thesis, School of Engineering and Physical Sciences, University of Guelph, Guelph, ON, Canada, 2020. [Google Scholar]
  14. Salama, M.; Sharqawy, M.H. Experimental investigation of the performance of a falling-film drain water heat recovery system. Appl. Therm. Eng. 2020, 179, 115712. [Google Scholar] [CrossRef]
  15. Askar, S.; Fotowat, S.; Fartaj, A. Transient experimental investigation of airside heat transfer in a crossflow heat exchanger. Appl. Therm. Eng. 2021, 199, 117516. [Google Scholar] [CrossRef]
  16. Silaipillayarputhur, K.; Idem, S.A. Transient response of a Cross Flow Heat Exchanger Subjected to Temperature and Flow Perturbations. In Proceedings of the International Mechanical Engineering Congress and Exposition, Houston, TX, USA, 13–19 November 2015. [Google Scholar]
  17. Silaipillayarputhur, K. Transient Response of Cross Flow Heat Exchangers Subjected to Simultaneous Temperature and Flow Perturbations. Appl. Mech. Mater. 2015, 799–800, 665–670. [Google Scholar] [CrossRef]
  18. Lachi, M.; Wakil, N.E.; Padet, J. The time constant of double pipe and one pass shell-and-tube heat exchanger in the case of varying fluid flow rates. Int. J. Od. Heat Mass Transf. 1997, 40, 2067–2079. [Google Scholar] [CrossRef]
  19. Yin, J.; Jensen, M.K. Analytic model for transient heat exchanger response. Int. J. Heat Mass Transf. 2003, 46, 3255–3264. [Google Scholar] [CrossRef]
  20. Romie, F. Transient Response of the Counterflow Heat Exchanger. Trans. ASME 1984, 106, 620–626. [Google Scholar] [CrossRef]
  21. Yang, R.; Tran, T.C.; Zoughaib, A. An analytical model to study the dynamic response of heat exchanger network. Int. J. Heat Mass Transf. 2021, 176, 121461. [Google Scholar] [CrossRef]
  22. Yang, R.; Tran, C.T. An analytical heat exchanger model to study the dynamic behavior in the case of simultaneous inlet variations. Int. J. Therm. Sci. 2022, 174, 107452. [Google Scholar] [CrossRef]
  23. Gvozdenac, D.; Sad, N. Analytical solution for transient response of counter flow heat exchanger with finite wall capacitance. Warme-Und Stoffubertrag. 1993, 28, 351–356. [Google Scholar] [CrossRef]
  24. Rotzel, W.; Xuan, Y. Transient Response of Parallel and Counterflow Heat Exchangers. Trans. ASME 1992, 114, 510–512. [Google Scholar] [CrossRef]
  25. Ravichandran, A.; Diaz-Elsayed, N.; Thomas, S.; Zhang, Q. An assessment of the influence of local conditions on the economic and environmental sustainability of drain water heat recovery systems. J. Clean. Prod. 2021, 279, 123589. [Google Scholar] [CrossRef]
  26. Ghobadi, M.; Muzychka, Y.S. A Review of Heat Transfer and Pressure Drop Correlations for Laminar Flow in Curved Circular Ducts. Heat Transf. Eng. 2015, 37, 815–839. [Google Scholar] [CrossRef]
  27. Ovadia, E. Investigating the Transient Performance of Drain Water Heat Recovery Systems: A Comparative Study of Conventional and Novel Devices from Thermal and Economical Perspectives. Master’s Thesis, School of Engineering and Physical Sciences, University of Guelph, Guelph, ON, Canada, 2023. [Google Scholar]
  28. Engineering Equation Solver (EES) Software Version No. 10.834. f-Chart, 1 January 2022. Available online: https://fchartsoftware.com/ees/ (accessed on 1 August 2023).
  29. Holman, J.P. Experimental Method of Engineers, 8th ed.; McGraw-Hill Education: New York, NY, USA, 2012. [Google Scholar]
  30. Hendon, R.; Burch, J. Development of Standardized Domestic Hot Water Event Schedules for Residential Buildings. In Proceedings of the Energy Sustainability Conference, Long Beach, CA, USA, 27–30 June 2007. [Google Scholar]
  31. Natural Gas Knowledge. Available online: https://natural-resources.canada.ca/energy-sources/fossil-fuels/natural-gas-primer (accessed on 1 August 2023).
Figure 1. Schematic of the experimental setup.
Energies 18 05118 g001
Figure 2. DWHR device CAD drawing with cross-sectional views.
Energies 18 05118 g002
Figure 3. Schematic depicting parameters of the detailed DWHR device model.
Energies 18 05118 g003
Figure 4. Experimental and model terminal temperature variations at 1.5 gpm (5.678 L/min).
Energies 18 05118 g004
Figure 5. Experimental and model terminal temperature variations at 2.0 gpm (7.570 L/min).
Energies 18 05118 g005
Figure 6. Experimental and model terminal temperature variations at 2.5 gpm (9.463 L/min).
Energies 18 05118 g006
Figure 7. Experimental and model prediction effectiveness at 1.5 gpm (5.678 L/min).
Energies 18 05118 g007
Figure 8. Experimental and model prediction effectiveness at 2.0 gpm. (7.570 L/min).
Energies 18 05118 g008
Figure 9. Experimental and model prediction effectiveness at 2.5 gpm. (9.463 L/min).
Energies 18 05118 g009
Figure 10. Annual energy savings of each appliance in steady state and transient operation.
Energies 18 05118 g010
Table 1. DWHR device dimensions.
DimensionValue (mm)
Drainpipe length, L740
Drainpipe inner diameter, di76.96
Drainpipe outer diameter, do79.83
Helical coil center diameter (calculated), dhc88.39
Hydraulic diameter of cold-water passage (calculated), dhd10.15
Length of the coil tube cross-section, a12.46
Width of the coil tube cross-section, b8.56
Helical coil pitch, p62
Length of drainpipe in contact with the cold-water flow path, Lh640
Length of cold-water helical flow path (calculated), Lc2750
Table 2. Calculated constants used in the detailed transient model.
Cold Water Flow Rate(Ah)h, W/K(Ah)c, W/Kt* sNTUhKhKcChCc ω
1.5 gpm973271.83.1010.53760.78170.21834.3845.8261.0
2.0 gpm1117312.82.7000.46380.78120.21884.3865.8161.0
2.5 gpm1243349.12.4240.41380.78080.21924.3885.8031.0
Table 3. Actual effectiveness of the DWHR device at different time intervals Equation (5).
Cold Water Flow Rate (gpm)2 min3 min4 min5 min10 min15 min20 min25 min
1.50.210.250.270.290.330.340.350.35
2.00.180.230.250.270.300.310.310.32
2.50.160.200.230.230.250.260.270.27
Table 4. Domestic hot water event characteristics for a three-occupant house [30].
CharacteristicsSinkShowerClothes WasherDishwasherBath
Average usage duration1 min8 min10 min8 min5 min
Average flow rate0.7 gpm2.1 gpm1.4 gpm1.1 gpm4.2 gpm
Frequency (events/day)35.51.71.070.590.324
Table 5. Assumptions used for economic study.
ParameterValue
DWHR inlet cold water temperature, Tc,in13 °C
DWHR inlet hot water temperature, Th,in30 °C
Electricity cost0.130 $/kWh
Natural gas cost *0.304 $/m3
* Assume 1 m3 natural gas = 10.78 kWh leads to 0.028 $/kWh [31].
Table 6. DWHR effectiveness, energy recovery rate, and annual savings at steady state and transient conditions for a 3-occupant home.
SinkSteady StateTransient% Difference
Effectiveness0.400.2147.5
Daily average energy recovery rate1.3 kW0.62 kW52.3
Annual Energy saving271.3 kWh134.5 kWh50.4
Natural gas annual savings$7.60$3.7750.4
Electricity annual savings$35.27$17.4950.4
ShowerSteady StateTransient% Difference
Effectiveness0.320.299.4
Energy recovery rate3.1 kW2.6 kW16.1
Annual energy saving255.9 kWh218.1 kWh14.8
Natural gas annual savings$7.17$6.1114.8
Electricity annual savings$33.27$28.3514.8
Clothes WasherSteady StateTransient% Difference
Effectiveness0.370.3213.5
Energy recovery rate2.3 kW2.0 kW13.0
Annual energy saving150.6 kWh129.8 kWh13.8
Natural gas annual savings$4.22$3.6314.0
Electricity annual savings$19.58$16.8713.8
Dish WasherSteady StateTransient% Difference
Effectiveness0.370.3116.2
Energy recovery rate1.8 kW1.5 kW16.7
Annual energy saving52.2 kWh43.4 kWh16.9
Natural gas annual savings$1.46$1.2216.4
Electricity annual savings$6.79$5.6416.9
BathSteady StateTransient% Difference
Effectiveness0.250.2116
Energy recovery rate4.4 kW3.8 kW13.6
Annual energy saving43.4 kWh37.6 kWh13.4
Natural gas annual savings$1.22$1.0513.4
Electricity annual savings$5.64$4.8913.3
Total natural gas annual savings$21.67$15.7827.2
Total electricity annual savings$100.55$73.2427.2
Disclaimer/Publisher’s Note: The statements, opinions and data contained in all publications are solely those of the individual author(s) and contributor(s) and not of MDPI and/or the editor(s). MDPI and/or the editor(s) disclaim responsibility for any injury to people or property resulting from any ideas, methods, instructions or products referred to in the content.