Article

Capacity Optimization of Integrated Energy System for Hydrogen-Containing Parks Under Strong Perturbation Multi-Objective Control

1
College of Electrical and New Energy, China Three Gorges University, Yichang 443002, China
2
Hubei Provincial Engineering Research Center of Intelligent Energy Technology, Yichang 443002, China
*
Author to whom correspondence should be addressed.
Energies 2025, 18(19), 5101; https://doi.org/10.3390/en18195101
Submission received: 18 August 2025 / Revised: 16 September 2025 / Accepted: 23 September 2025 / Published: 25 September 2025

Abstract

To address the issue of significant perturbations caused by the limited flexibility of clean energy grid integration, along with the combined effects of electric vehicle charging demand and the uncertainty of high-penetration intermittent energy in the integrated energy system (IES), a capacity optimization method for the IES subsystem of a hydrogen-containing chemical park, accounting for strong perturbations, is proposed in the context of the park’s energy usage. Firstly, a typical scenario involving source-load disturbances is characterized using Latin hypercube sampling and Euclidean distance reduction techniques. An energy management strategy for subsystem coordination is then developed. Building on this, a capacity optimization model is established, with the objective of minimizing daily integrated costs, carbon emissions, and system load variance. The Pareto optimal solution set is derived using a non-dominated genetic algorithm, and the optimal allocation case is selected through a combination of ideal solution similarity ranking and a subjective–objective weighting method. The results demonstrate that the proposed approach effectively balances economic efficiency, carbon reduction, and system stability while managing strong perturbations. When compared to relying solely on external hydrogen procurement, the integration of hydrogen storage in chemical production can offset high investment costs and deliver substantial environmental benefits.

1. Introduction

Integrated Energy Systems (IESs) demonstrate significant advantages in terms of clean energy utilization efficiency, environmental benefits, and economic benefits [1], making them a key technological pathway for achieving energy transition and upgrading. They have already been implemented on a large scale in multiple countries and regions [2]. To enhance the integration of wind and solar power, newly developed renewable energy installations should be equipped with complementary energy storage systems or paired with energy-intensive industries to enable on-site utilization of intermittent generation. In accordance with policy mandates, industrial parks in regions abundant in renewable resources typically incorporate chemical production facilities [3]. Additionally, with the rapid adoption of electric vehicles (EVs), the combined effects of EV charging/discharging demands and the uncertainty of high-penetration intermittent energy sources create significant disturbances for IES, posing challenges for multi-objective control in industrial park IES.
Scholars have conducted extensive research on IES, and in recent years, research on IES based on the construction of an electricity–heat–hydrogen model has become mainstream. Literature [4,5,6,7] have explored the design of energy storage capacity configurations in IES through multi-energy complementary systems such as electricity–thermal–hydrogen storage or wind–solar–fossil fuel storage integration, aiming to maximize the utilization of intermittent clean energy. However, these studies have not considered the regulatory role of hydrogen energy storage, which can effectively accommodate intermittent renewable energy, in conjunction with electricity and thermal energy storage forms. This results in the system becoming overly reliant on external energy supply during prolonged periods of insufficient energy supply, which is one issue; the second issue is that the optimization of energy storage capacity configurations within the IES system has not been effectively addressed. Reference [8] proposed an integrated system that utilizes hydrogen-blended gas turbines for the absorption of renewable hydrogen. While this approach is effective, it is limited by a single absorption pathway, which restricts the flexibility and economic potential of hydrogen storage. Reference [9] employs FC for electrical load regulation; however, it fails to account for the recovery of waste heat generated by both the EL and FC, resulting in substantial energy losses and overlooking a key opportunity to enhance system efficiency. Furthermore, both studies primarily focus on the use of green hydrogen for power generation, which provides limited economic returns in relation to the significant investments required for hydrogen production and storage infrastructure. Although the studies in the literature [8,9] have developed hydrogen-based IES and performed capacity optimization configurations for the system, they do not consider the utilization of excess heat generated when the hydrogen energy storage system is engaged in energy regulation, nor do they explore the synergistic effects between different energy storage systems. Additionally, the high cost of hydrogen energy storage remains a significant barrier to its practical application [10]. Furthermore, a common limitation in existing studies, including those mentioned earlier, is the assumption of ideal communication conditions, which fails to account for the critical impact of network latency and packet loss on the stability and control performance of multi-entity IES [11]. Therefore, investigating the robustness of energy management strategies under non-ideal communication conditions represents a crucial direction for future research.
Additionally, as the number of EVs increases, EV loads have become a common load in IES [12]. Charging EVs with clean energy in IES can reduce indirect carbon emissions and enhance the economic efficiency and flexibility of system operations. However, the low-output periods of clean energy often overlap with the evening peak load periods in industrial parks and the peak charging periods for EVs. The combined effect of these three fluctuations creates a highly disruptive scenario that is extremely unfavorable for IES. Failing to consider EV charging loads during planning can lead to mismatches between actual demand and design capacity [13]. Furthermore, EV charging within IES systems can have multifaceted impacts on the system, yet few studies have comprehensively addressed the diverse planning requirements related to economic, environmental, and system stability considerations.
In response to the aforementioned issues, this paper constructs an IES model for industrial park energy use that integrates electricity, heat, and hydrogen. It proposes an energy management strategy that considers the participation of hydrogen storage systems in electricity and heat regulation. Based on this operational strategy, the paper establishes an IES capacity optimization model for chemical production coupled with hydrogen storage, fully considering the uncertainties of EV charging and load fluctuations within the IES radiation area. The optimization objectives are to minimize economic costs, carbon emissions, and system load variance. The model is optimized for capacity based on these objectives. By comparing the impact of different considerations on the optimization results, the paper verifies the economic and environmental benefits of the system, as well as the necessity of considering EV charging.

2. System Modeling and Scene Construction

2.1. Model of the System

The user-level industrial park IES constructed in this paper includes the energy supply side, energy conversion side, energy storage side, and load side. The energy supply side includes photovoltaic power generation (PV), wind turbines (WT), the upper-level power grid (PG), and the natural gas network (GAS); the energy conversion side includes electric boilers (EB), fuel cells (FC), electrolytic cell (EL), heat exchangers (HEX), and gas boilers (GB) for converting electricity, heat, and hydrogen into different types of energy; The energy storage side includes batteries (BAT), hydrogen storage tanks (HST), and thermal storage tanks (TST) for storing excess clean energy and residual heat generated during energy conversion, releasing it during periods of insufficient energy supply to achieve energy time-shifting; The load side includes the park’s daily conventional electricity and heat loads, hydrogen loads required for chemical production, and EV charging loads. Its basic structure is shown in Figure 1.

2.2. EV Charging Demand Model

This study considers EV charging within the radiation range when optimizing the capacity of IES within the park. The charging load demand is determined by factors such as scale, initial state of charge, charging duration, arrival time, and departure time. This paper takes private cars, which are more random, as the research object and models the charging time based on reference [14].
Based on the U.S. National Household Travel Survey (NHTS) data and existing research, the charging behavior of private electric vehicles typically commences immediately upon the completion of their final daily trip, and the ISOC upon arrival is effectively characterized by a normal distribution [14,15], the arrival time ISOC of a car follows a normal distribution ISOC ~N (0.5, 0.42) between [0.2, 0.95], and its probability distribution function is as follows.
f ( S c ) = 1 σ a r 2 π exp ( S c μ a r ) 2 2 σ a r 2
where μ S = 0 . 5 , σ a r = 0.4 , S c are the arrival times and the initial charge state of EV.
Based on EV charging dynamics, the start/end transients of charging exhibit negligible duration relative to the total charging cycle. This study therefore adopts a constant-power. The charging duration T i of the EV can be expressed as:
T i = ( 1 S c ) C e ν P c
where P c represents the constant power required for EV charging. C e ν is the rated capacity of EV batteries.
The park-level charging load is calculated using Monte Carlo simulation with 5000 iterations. In each iteration, a sample of N EVs is selected, and their hourly charging profiles are aggregated. Convergence of the simulation is achieved when the relative changes in both the daily peak charging power and the total daily charging energy fall below a threshold of 3%. The cumulative power demand at time t is expressed as:
P e v , t = i = 1 N P e v i
where P e v i is the charging power for the i t h EV, P e v , t is the total power charged by EV at time t .

2.3. Subsystem Mathematical Modeling

2.3.1. Electrical Subsystem Energy Model

The power supply in the system is primarily sourced from WT and PV, both of which are subject to inherent uncertainties. To effectively mitigate fluctuations in wind and solar power output, as well as short-term power surges caused by peak EV charging demands, the system incorporates BAT energy storage. This solution ensures a stable power supply to the park while minimizing grid power purchases. The BAT energy storage model is outlined as follows:
S O C t + 1 = S O C t + Δ t η b a t c h P b a t , t c h Δ t P b a t , t d i s η b a t d i s
where S O C is the amount of electricity stored in a BAT, η b a t c h and η b a t d i s are the charging efficiency and discharging efficiency of the BAT, respectively; P b a t , t c h and P b a t , t d i s are the charging and discharging power of the BAT at time t , respectively.

2.3.2. Thermal Subsystem Energy Model

Since the EL and FC installed in the park generate a large amount of heat during operation, this paper adopts a four-stage coordinated heating strategy involving waste heat, EB, TST, and GB to improve the utilization rate of clean energy and reduce operating costs. The waste heat generated during the operation of EL and FC is prioritized for recovery to supply the heat load within the park. The amount of waste heat recovered is shown below:
Q e l , t = P e l , t η h t , e l
Q f c , t = P f c , t η h t , f c
Q r , t = ( Q e l , t + Q f c , t ) η r
where Q e l , t and Q f c , t are the heat production of the EL and FC at time t ; Q r , t is the total heat recovered at time t ; P e l , t , P f c , t are the operating powers of the EL and FC at time t , respectively; η h t , e l , η h t , f c and η r represent the EL, FC thermal efficiency, and waste heat recovery efficiency, respectively.
After meeting the park’s heating demand during periods of peak clean energy output, the EB stores the excess energy as heat in a TST, enabling energy time-shifting. This process makes the EB the primary heat source for the system. The heat output of the EB can be calculated using the following formula [16]:
Q e b , t = η e b P e b , t
where Q e b , t is the heat output of the EB at time t ; η e b is the working efficiency of the EB; P e b , t is the operating power of the EB at time t .
To ensure continuous heating within the park, this study incorporates a GB as a backup heat source. However, due to the high carbon emissions associated with GB, they are utilized solely when clean heat sources are insufficient. The heat output of the GB can be calculated using the following formula:
Q g b , t = η g b V g b , t δ
where Q g b , t is the heat output of the GB at time t ; η g b is the heat production efficiency of GB; V g b , t is the volume of natural gas burned; δ is the calorific value of gas.
The TST stores excess heat energy generated by the EB and waste heat recovery, releasing it when required. The relationship between them is illustrated below:
Q S O T , t + 1 = Q S O T , t + η S O T [ Q e b , t + Q e l , t + Q f c , t + Q g b , t Q l o a d , t ] Δ t
where Q S O T , t , Q l o a d , t represent the heat stored in the TST and the heat load of the park at time t , respectively; η S O T is the working efficiency of the heat storage tank.

2.3.3. Hydrogen Energy Subsystem Model

Hydrogen energy storage has the advantage of long-term storage [17]. When there is a prolonged power shortage in the park, FC can be used to ensure a stable power supply for a long period of time, and hydrogen can also be used as raw material for chemical production. Due to the uncertainty of power sources and loads, hydrogen production by electrolysis is random. HST can be used to balance production fluctuations and ensure a stable supply of hydrogen for FC and chemical production. The relationship can be expressed as:
H e l , t = P e l , t η e l α
H f c , t = P f c , t η f c β
H S O H , t + 1 = H S O H , t + η S O H H e l , t H f c , t η S O H
where H e l , t , H f c , t and H S O H , t represent the amount of hydrogen produced by the EL, the amount of hydrogen consumed by the FC, and the amount of hydrogen stored in the storage tank at time t , respectively; η e l , η f c and η S O H represent, respectively, the hydrogen production efficiency of the EL, the hydrogen consumption efficiency of the FC, and the charging and discharging efficiency of the HST; α and β represent the hydrogen production per kilowatt-hour of the EL and the hydrogen consumption per kilowatt-hour of the FC, respectively.
Hydrogen for chemical production is predominantly procured externally to maintain stable operations. Hydrogen generated from clean energy serves as a flexible energy carrier, mitigating fluctuations in the electrical subsystem. Surplus hydrogen, stored after fulfilling power regulation requirements, is later used to replace externally sourced hydrogen in subsequent production cycles. This approach results in reductions in both operational costs and carbon emissions.

2.3.4. Analysis of the Impact of Strong Disturbances on IES

The operational uncertainty of IES is primarily influenced by the volatility of clean energy generation and load demand [17]. Additionally, EV charging behavior exhibits substantial randomness and uncertainty. The peak demand for EV charging often coincides with the system’s inherent load peaks, resulting in significant disturbances to the IES. The total electricity load of a facility that includes EV charging loads can be expressed as follows:
P t o t a l , t = P l o a d , t + P e v , t
where P l o a d , t , P e v , t and P t o t a l , t represent the conventional electrical load, EV charging load, and total electrical load of the park, respectively.
Taking the total electrical load of the park as an example, a typical day is divided into uniform intervals by time period, and the predicted and actual value sequences can be expressed as follows:
P ˜ t o t a l = P ˜ t o t a l , 1 , P ˜ total , 2 , , P ˜ total , t , P ˜ total , T P t o t a l = P total , 1 , P total , 2 , , P total , t , P total , T
where P ˜ t o t a l is the predicted total electrical load for the park during time period t .
The prediction error sequence is obtained by subtracting the predicted value from the actual value:
P t o t a l , t = P t o t a l , t P ˜ t o t a l , t
According to reference [18], this paper assumes that the prediction error follows a normal distribution, converting the uncertainty of the total electricity load of the park into the uncertainty of its prediction error.
P total , t = P ˜ total , t + P total , t P total , t N μ t o t , σ t o t 2
where μ t o t and σ t o t represent the predicted expected value and volatility, respectively.
This paper uses Latin Hypercube Sampling (LHS) to perform stratified sampling of prediction errors at each time point and generates the initial scenario through the probability density function and its inverse function [19]. The initial scenario is reduced using the Euclidean Distance Reductions (EDR) method, which removes low-probability scenarios until the corresponding typical probability scenarios are obtained [20], as expressed by the following equation:
d ( s i , s j ) = t = 1 24 L i , t L j , t 2
where s is the scene category; i and j are scene numbers; L i , t is the value of the random variable for the i scene at time t in the corresponding scene category.
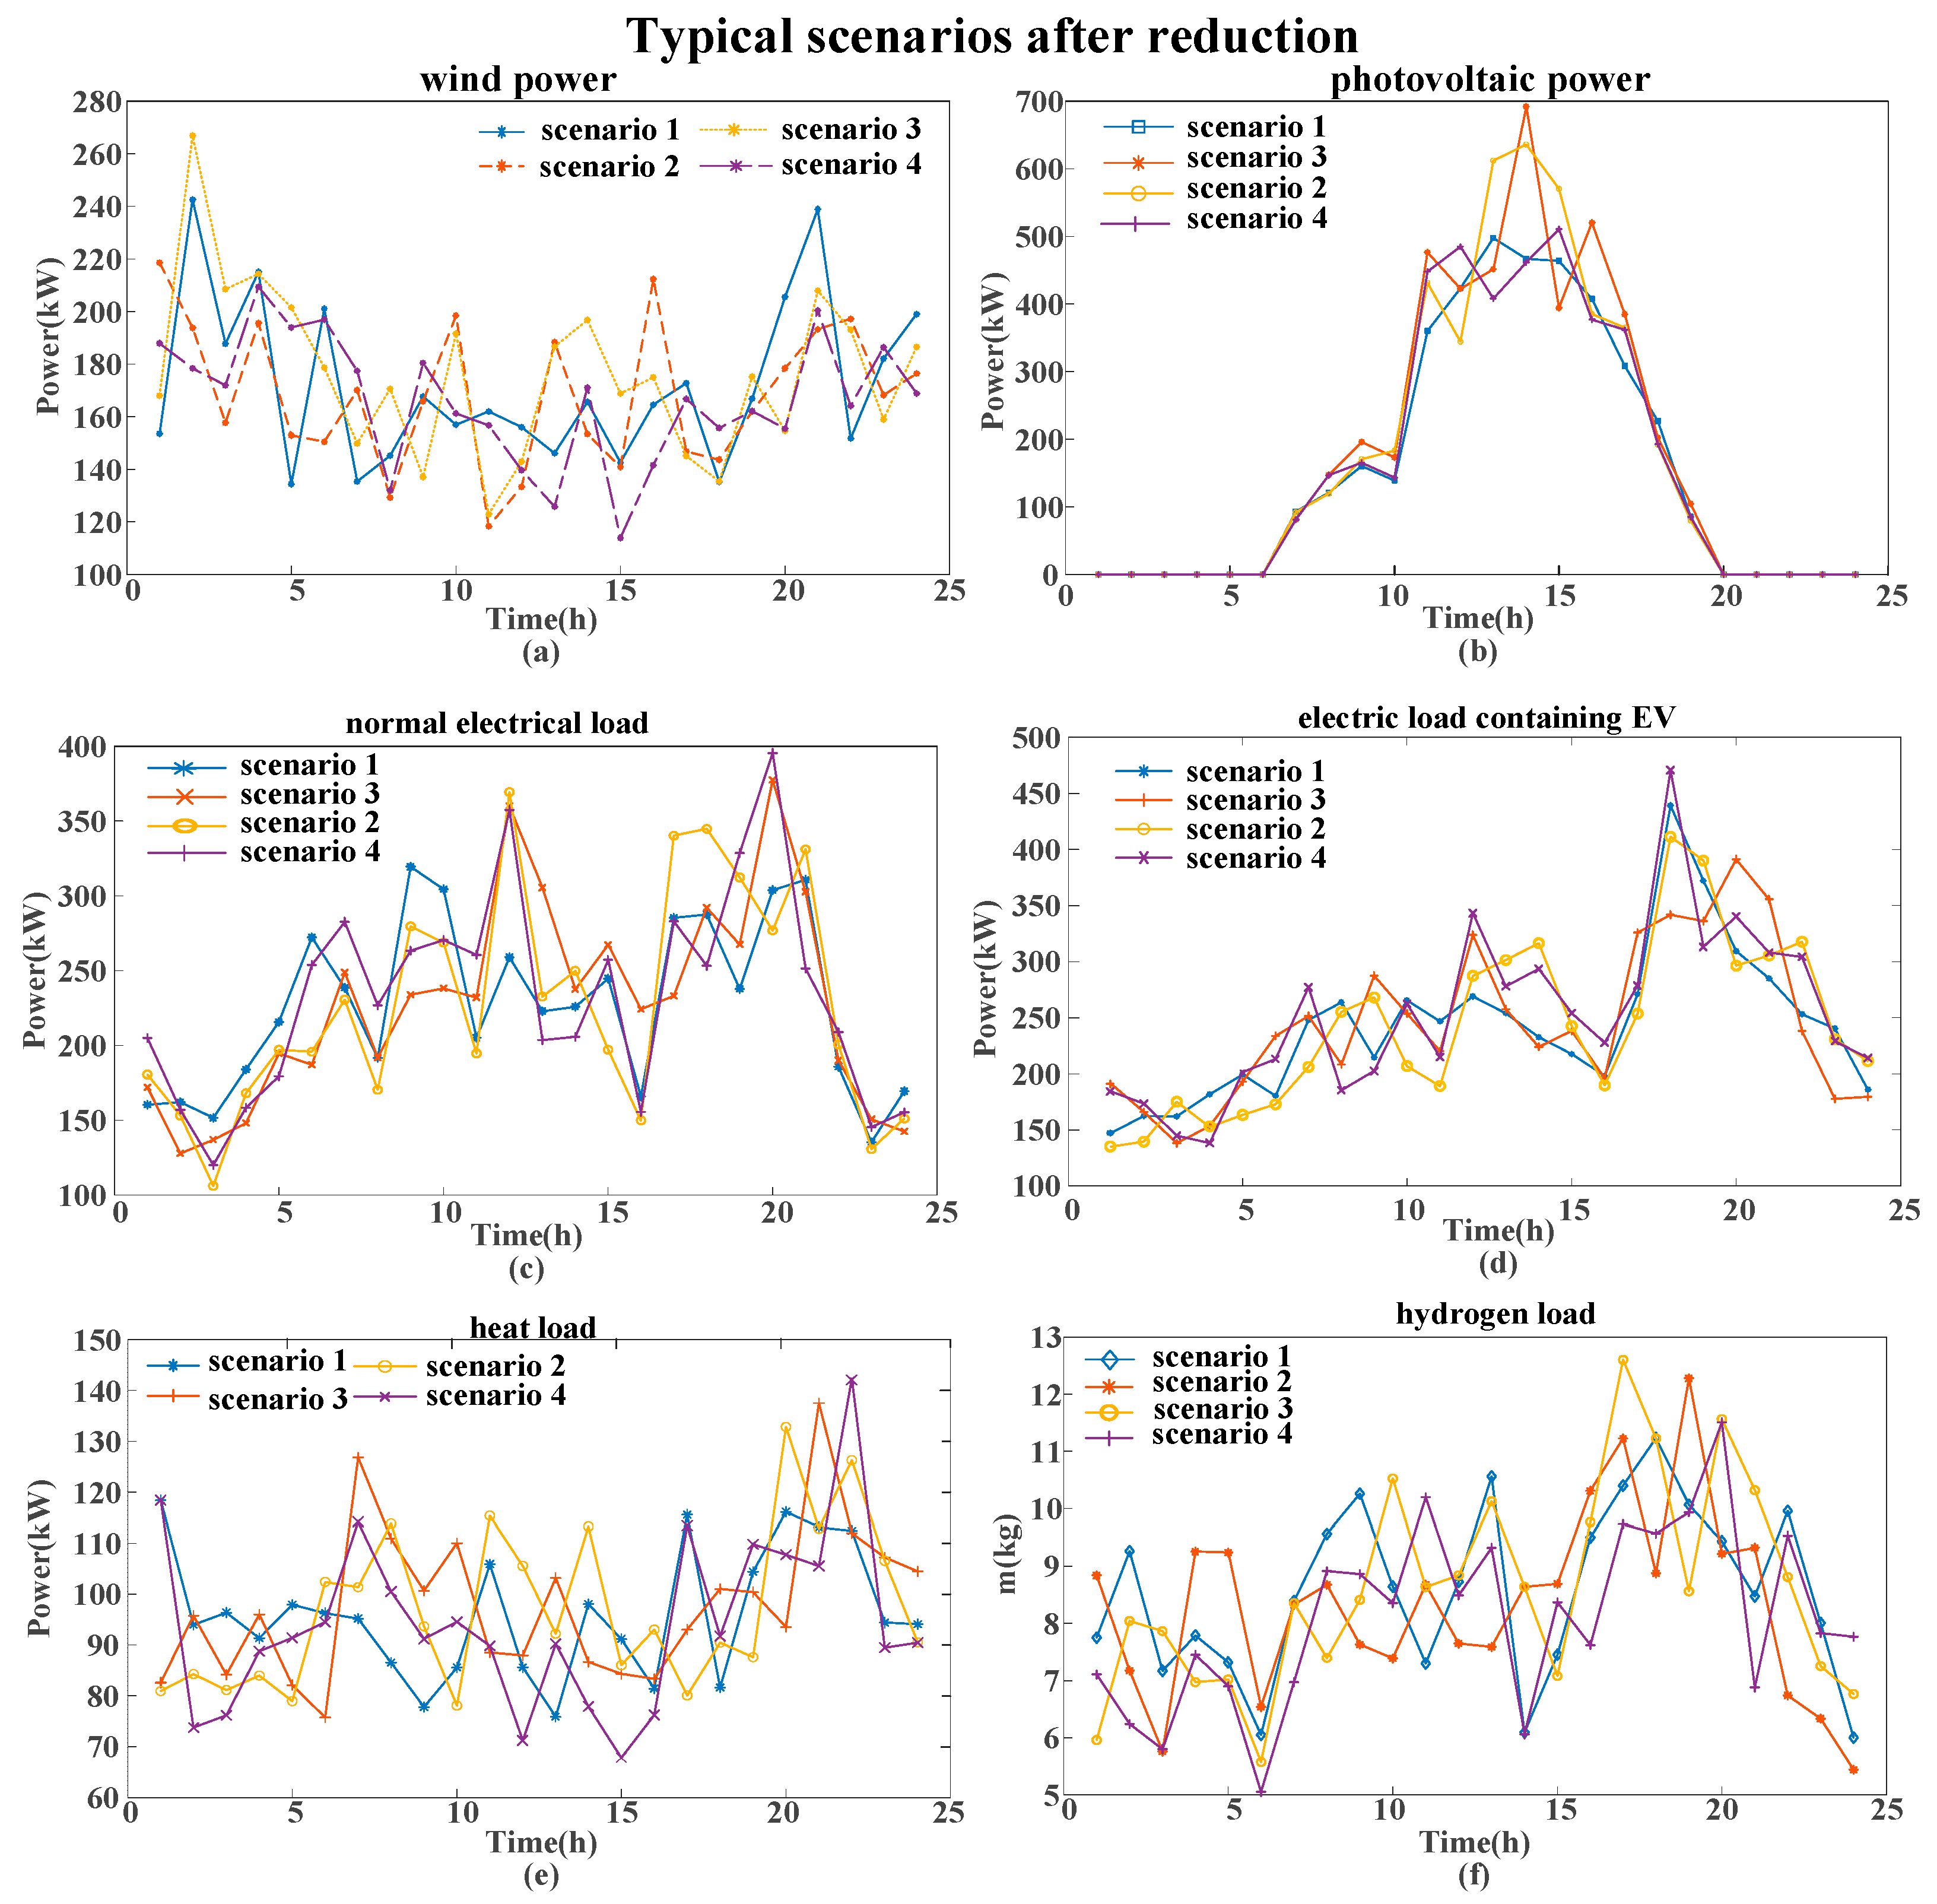
Similarly, typical probability scenarios for WT, PV, thermal load, and hydrogen load can be generated using the aforementioned method. These scenarios account for both typical operating conditions and extreme conditions arising from the combined fluctuations in wind and solar power output, as well as peak EV charging. The generated scenarios provide reliable data inputs for the planning and operation of IES [21]. After reduction, four typical probability scenarios are obtained, as presented in Table 1. Typical scenarios are shown in Figure 2.

3. Multi-Objective Capacity Optimization Model for IES in Industrial Parks

3.1. IES Multi-Objective Capacity Optimization Model Under Strong Disturbances

To mitigate the impact of significant disturbances on IES, this study incorporates the probability of typical scenarios into the objective function. A multi-objective optimization model is developed, with the goals of minimizing economic costs, carbon emissions, and system load variance.

3.1.1. Economic Objectives

In the IES optimization model, this study selects the minimum daily total cost as the objective function and converts the equipment purchase cost to a daily basis. The total daily cost comprises the equipment investment cost C i n t , operation and maintenance cost C o p , energy purchase cost C b u y , and energy waste cost C w a s t e . The energy waste cost refers to the additional cost incurred due to insufficient energy conversion between different types, capacity constraints of energy storage equipment, and imbalances between energy supply and demand [22]. The expression for the daily total cost is as follows:
min C = S = 1 S ω s [ C i n t + C o p + C b u y + C w a s t e ]
where C is the daily total cost of the system; S is the total number of typical scenarios generated after reduction; ω s is the probability of the corresponding typical scenario.
Where C i n t , C o p , C b u y , and C w a s t e can be expressed as follows:
C int = i = 1 N k i n t , i P s , k max r ( 1 + r ) n ( 1 + r ) n 1 C o p = i = 1 N k o p , i t = 1 T P i , t C b u y = C t E t = 1 T P g r i d ( t ) + C g a s t = 1 T V g a s ( t ) C w a s t e = k w ( P w + Q w + P H 2 w )
where P s , k max represents the capacity of FC, EL, BAT, GB, TST, and HST under scenario s ; N denotes the total number of devices; k i n t , i refers to the unit capacity investment cost for each device; the annual capital interest rate is represented by r ; n indicates the device lifecycle; k o p , i is the unit power maintenance cost for each device; P i , t represents the operating power of each device; C t E denotes the time-of-use electricity price from the grid; P g r i d is the power purchased from the grid at time t ; C g a s refers to the unit price of natural gas; V g a s is the volume of natural gas traded at time t ; k w represents the unit energy waste penalty cost; and P w , Q w , and P H 2 w correspond to the energy penalties for electricity, heat, and hydrogen, respectively.

3.1.2. Environmental Objectives

With the introduction of targets such as carbon peaking, carbon emissions have garnered significant societal attention. This study sets the minimization of daily carbon emissions as the secondary optimization objective, which includes both the direct carbon emissions from GB within the system and the indirect carbon emissions resulting from electricity purchases from the grid. This can be expressed as:
min C O 2 = S = 1 S ω s [ t = 1 T ( θ p P g r i d , t + θ g V g a s , t ) ]
where θ p and θ g are the equivalent emission coefficients for electricity and gas purchases, respectively.

3.1.3. System Load Variance

System load variance reflects the impact of electricity demand on the IES, as well as the safety and stability of its operation. A smaller system load variance indicates higher safety and stability of the system. In this paper, system load variance is defined as [14]:
min F = S = 1 S ω s [ 1 T t = 1 T ( P l o a d , t + P e v , t i = 1 N P i , t P av ) ]
P a ν = 1 T t = 1 T P l o a d , t + P e v , t i = 1 N P i , t
where F is the system load variance; P a ν is the average electrical load demand of the system.

3.2. IES Multi-Objective Capacity Optimization Model for Hydrogen Chemicals

Hydrogen production necessitates a stable hydrogen supply; therefore, the hydrogen generated by EL must be stored in a HST before it can be utilized in chemical production. Furthermore, to prevent the long-term accumulation of either a hydrogen surplus or deficit in the HST, the model imposes constraints on the initial and final hydrogen storage levels, ensuring that they remain consistent throughout each dispatch cycle. This constraint guarantees daily hydrogen balance. It serves as a boundary condition for the optimization model, facilitating the derivation of a sustainable daily operational plan. In the context of practical multi-day continuous operations, the target value for the initial storage level can be dynamically adjusted based on long-term forecasts. This flexibility allows the system to efficiently manage cross-cycle intermittent demand while still adhering to the constraint. The quantity of hydrogen purchased externally, as well as the associated cost for hydrogen purchase during the second cycle, can be expressed as follows:
H s , b u y = t = 1 T H s , l o a d , t ( S S O H , s , 24 0.5 ) H S O H , s , 24
C s , b h   =   H s , b u y C h
where H l o a d is the amount of hydrogen required for chemical production; C b h is the cost of purchasing hydrogen; and H b u y is the amount of hydrogen purchased; c h is the unit cost of hydrogen.
The coupling mechanism between clean energy-based hydrogen production and chemical production is characterized as “temporally decoupled.” In each cycle, the green hydrogen produced is primarily utilized for power regulation, with any surplus stored in the HST. This approach ensures that the HST begins each cycle from a consistent baseline. The stored hydrogen subsequently replaces externally procured hydrogen in the following cycle, leading to reductions in both operational costs and carbon emissions over time. This mechanism effectively addresses immediate flexibility requirements while supporting long-term sustainability goals.
Utilizing hydrogen produced from clean energy sources within the system for chemical production can reduce the amount of externally purchased hydrogen. This, in turn, decreases both the system’s operational costs and its indirect carbon emissions. The objective function under hydrogenation conditions is as follows:
min C = S = 1 S ω s [ C i n t + C o p + C b u y + C w a s t e + C b h ] min C O 2 = S = 1 S ω s [ t = 1 T ( θ p P g r i d , t + θ g V g a s , t ) + λ H b u y ] min F = S = 1 S ω s [ 1 T t = 1 T ( P l o a d , t   +   P e v , t i = 1 N P i , t P a ν ) 2 ]
where λ is the carbon emissions per unit of hydrogen purchased by the park.

3.3. Constraints

The constraints of the IES optimization model primarily include energy balance constraints, coupled equipment constraints, and energy storage equipment constraints, among others.

3.3.1. Energy Balance Constraints

IES energy balance constraints include electrical energy balance and thermal energy balance.
P t o t a l , s , t = P p v , s , t + P w t , s , t + P b a t , s , t d i s + P f c , s , t + P g r i d , s , t P e l , s , t P b a t , s , t c h P e b , s , t P W , s , t Q l o a d , s , t = Q e l , s , t + Q f c , s , t + Q g b , s , t + Q e b , s , t + Q t s t , s , t d i s Q t s t , s , t c h Q w , s , t

3.3.2. Coupled Equipment Constraints

0 P s , k , t P s , k max , k e l , f c , g b , e b
where P s , k , t is the operating power of device k at time t in scenario s ; P s , k max is the installed capacity of device k in scenario s .

3.3.3. Energy Storage Equipment Constraints

To ensure the long-term stable operation of the system, this study constrains the charging and discharging of energy storage equipment within a designated safe operating range:
0.5 P b a t , s max P b a t , s , t 0.5 P b a t , s max 0.25 P t , s max P t , s , t 0.25 P t , s max 0.25 P h , s max P h , s , t 0.25 P h , s max 0.2 S S O C , s , t 0.8 0.1 S S O T , s , t 0.9 0.1 S S O H , s , t 0.9
where P b a t , s , t , P t , s , t , and P h , s , t represent the operating power of the BAT, TST, and HST at time t under scenario s , respectively; P b a t , s max , P t , s max , and P h , s max represent the installed capacities of the BAT, TST, and HST, respectively, under the S scenario; S S O C , s , t , S S O T , s , t , and S S O H , s , t represent the storage states of the BAT, TST, and HST at time t under scenario s , respectively.

4. IES Energy Management Strategies and Solution Methods

4.1. Energy Management Strategy

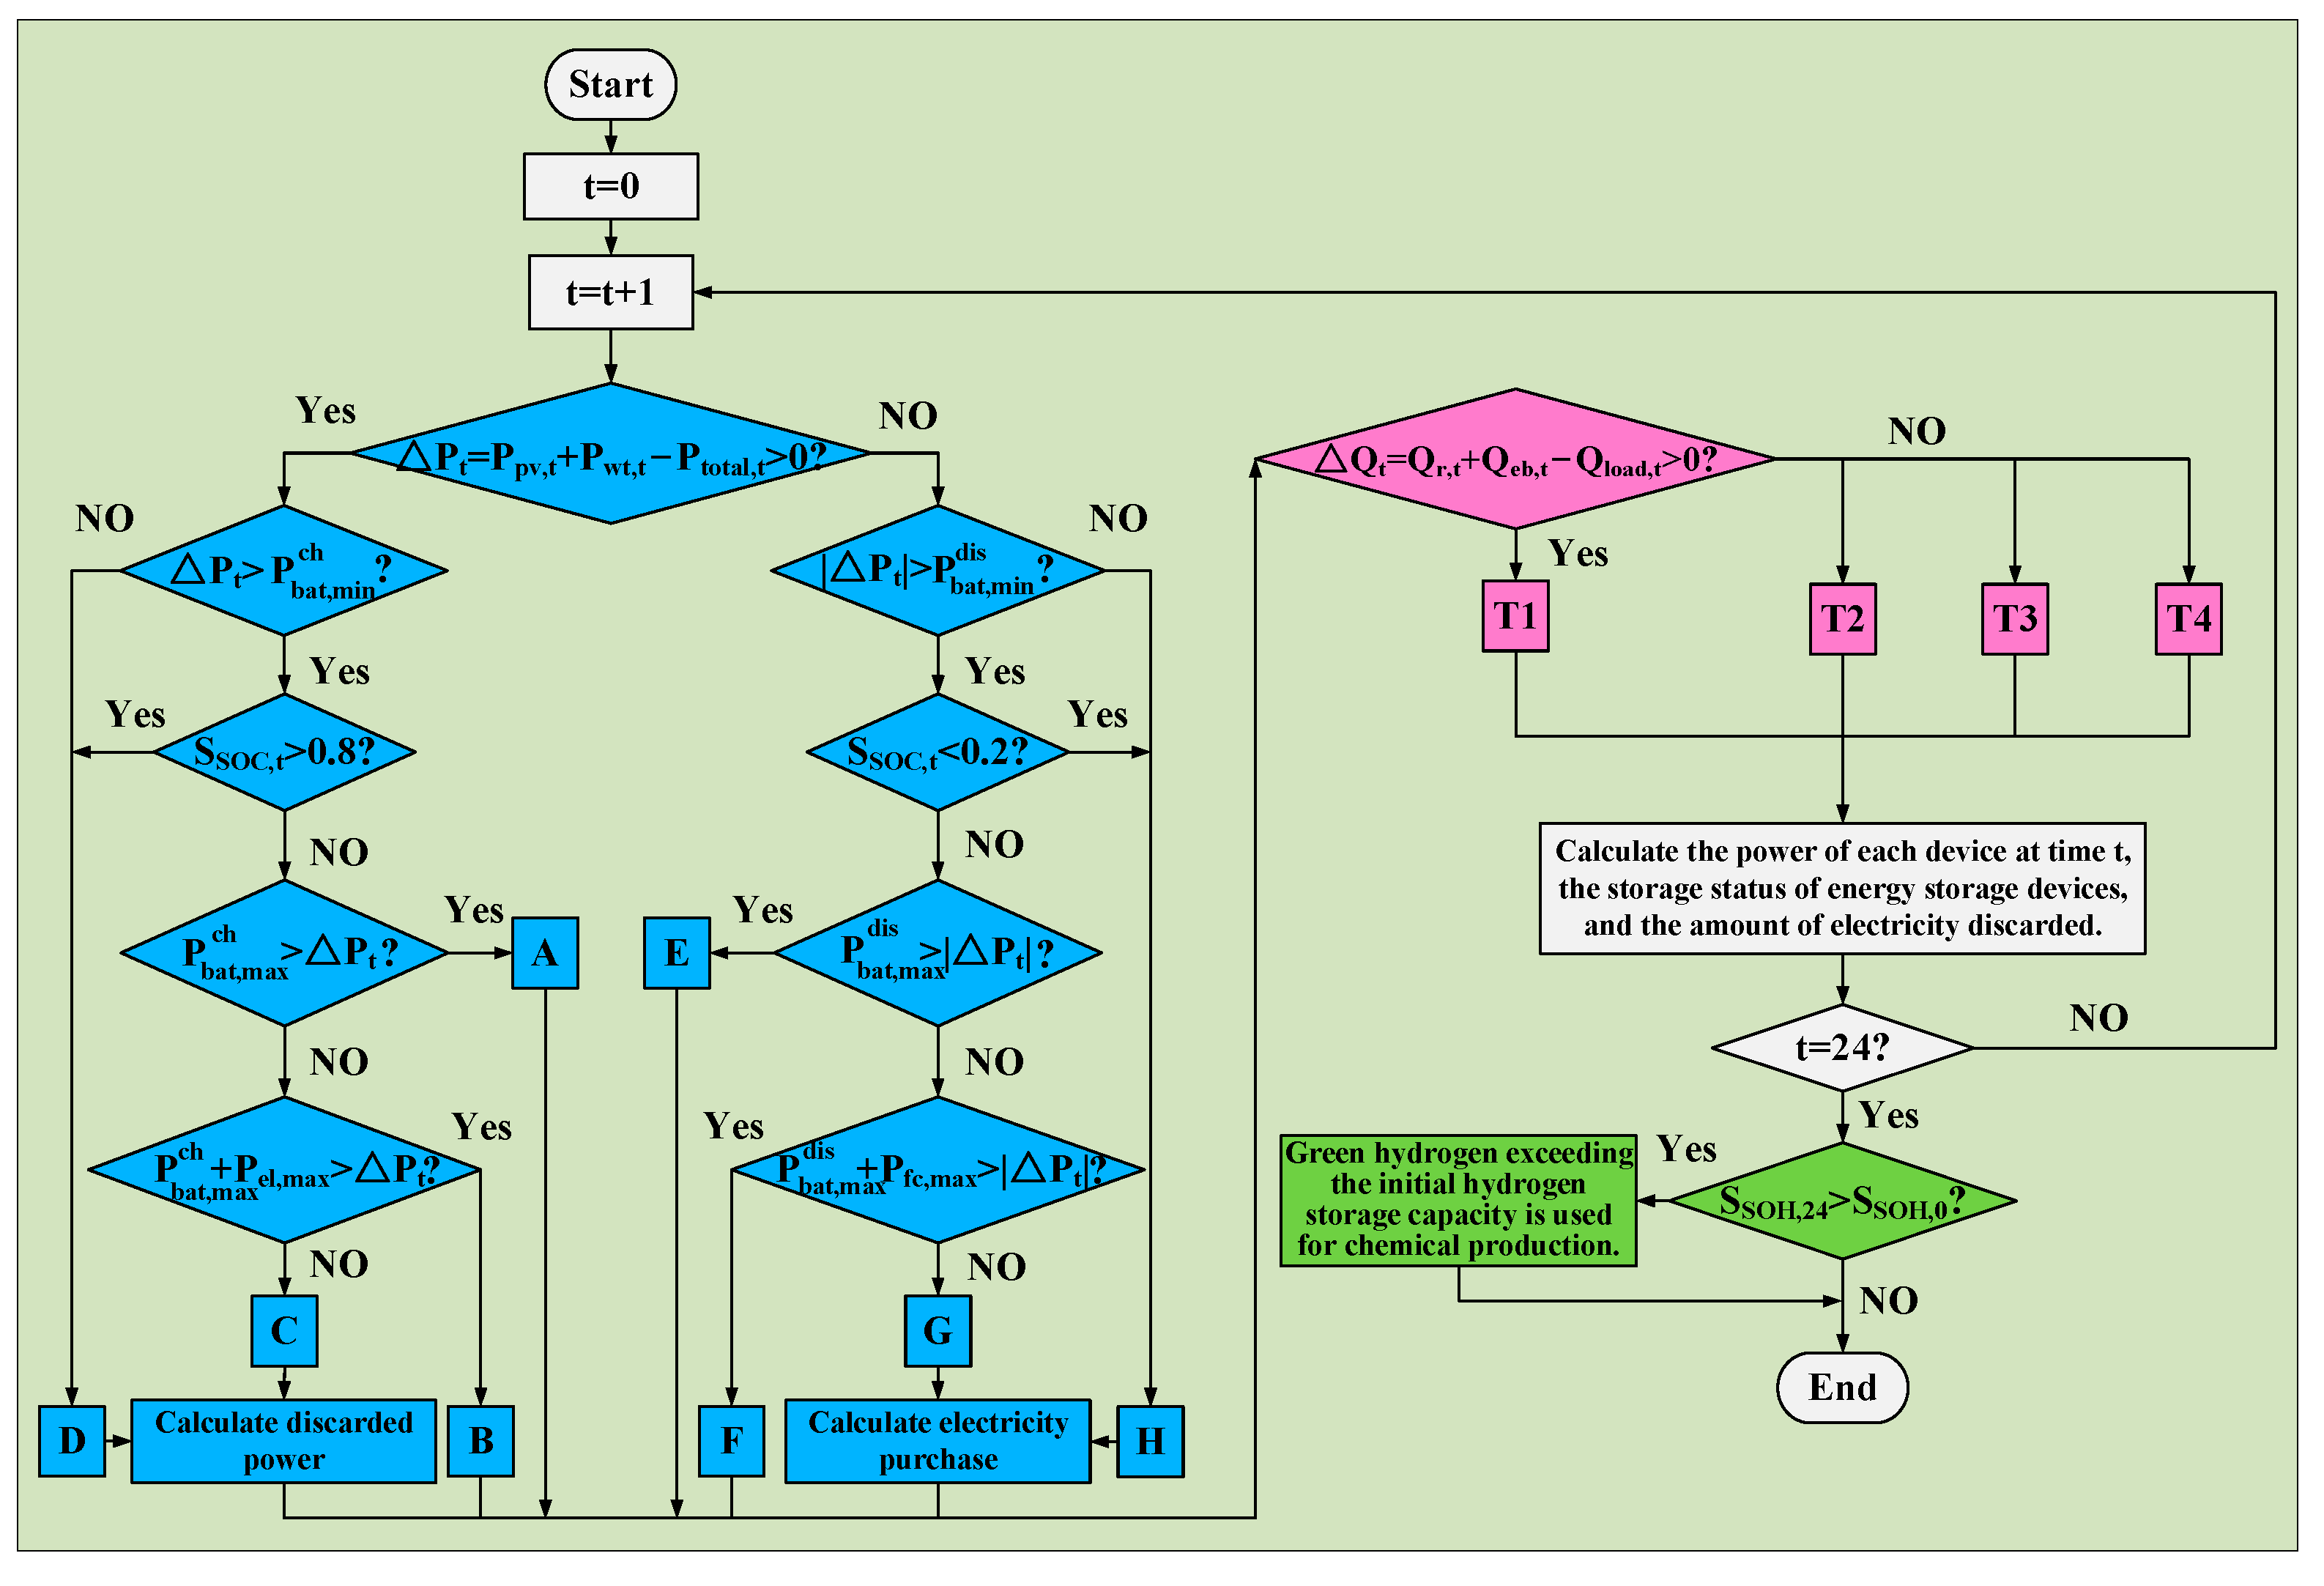
The energy management strategy of the system is crucial for the safe and stable operation of the equipment, as it directly influences the output sequence and operational status of each energy subsystem [23]. In formulating the energy management strategy, this paper takes into account the safety limits for the operation of energy storage equipment and the recovery of waste heat during the operation of the hydrogen energy subsystem equipment. The specific process of the strategy proposed in this paper is illustrated in Figure 3. A safe working range is defined for the energy storage equipment. While the figure presents the safety limit determination for BAT, the process for determining the safety limits of TST and HST follows a similar approach. For specific parameter settings, see Section 3.
The operating status corresponding to the strategy shown in the figure is as follows:
  • A: All remaining power is used to charge the BAT.
  • B: The BAT is charged at maximum power, and the remaining power is stored by producing hydrogen through an EL.
  • C: The BAT is charged at maximum power until it reaches the safety limit, the EL produces hydrogen at full power for storage, and the remainder is used to heat the EB.
  • D: If the storage BAT cannot start, the remaining power is used to produce hydrogen through the EL. If the EL cannot work, the EB is started.
  • E: BAT replenishment system total power deficit.
  • F: The BAT discharges at maximum power until it reaches the minimum safety limit, and the FC supplements the remaining power as needed.
  • G: Both the storage BAT and FC generate electricity at maximum power to supplement the power deficit. If there is still a deficit, electricity is purchased from the grid.
  • H: If the BAT cannot start, the FC generates electricity to supplement the power shortage. If there is still a shortage, electricity is purchased from the grid.
  • T1: After the waste heat and EB meet the heat load, they charge the heat storage tank.
  • T2: Waste heat, EB, and TST jointly supply the heat load.
  • T3: Waste heat, EB, TST, and GB jointly supply the heat load.
  • T4: The TST cannot be started, and the residual heat, EB, and GB jointly supply the heat load.
For real-time implementation, the proposed rule-based strategy is designed to be deployed within an Energy Management System. The system would execute the logic outlined in Figure 3 at a high frequency. It would collect real-time measurements of renewable generation, load demand, and storage states, calculate the setpoints for each controllable unit based on the strategy’s rules, and dispatch these setpoints to the local controllers. This closed-loop operation enables the system to maintain balance and effectively mitigate forecast errors and intra-hour fluctuations.

4.2. Solution Method

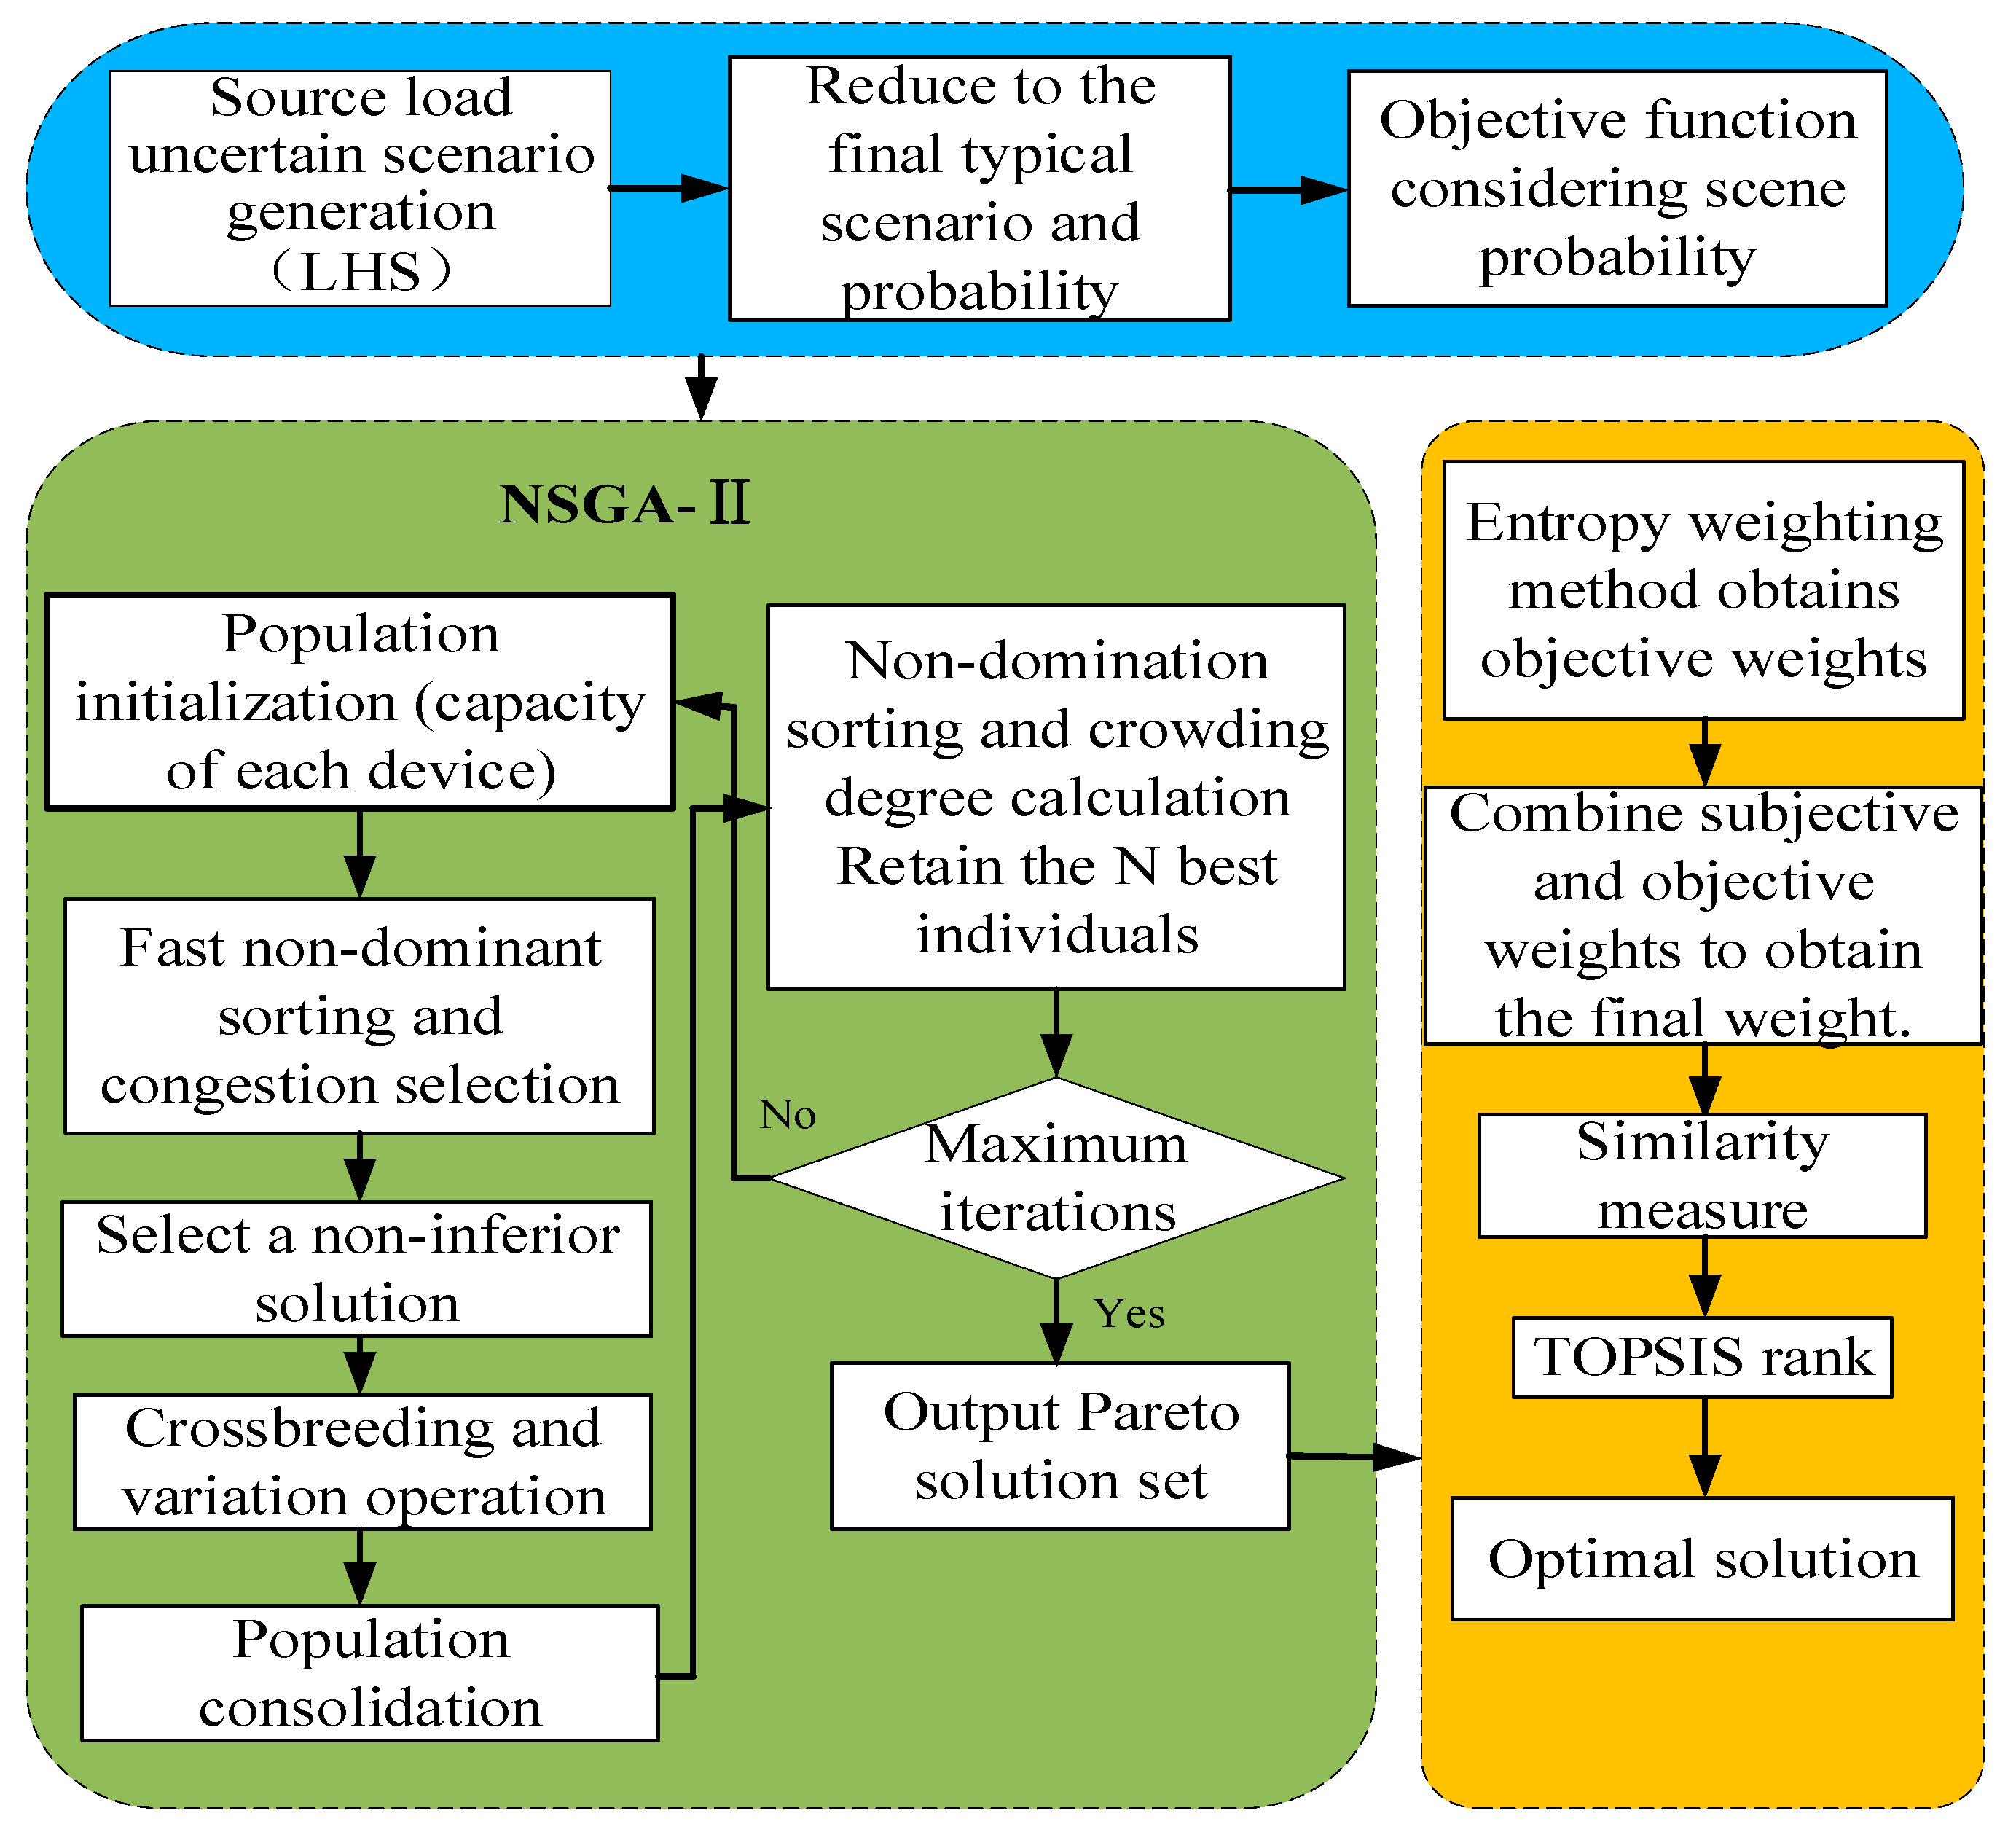
The decision variables in this multi-objective optimization model include the installed capacities of BAT, EB, GB, TST, FC, EL, and HST. Given that the problem addressed in this study involves multiple conflicting objectives [24], the Non-Dominated Sorting Genetic Algorithm II (NSGA-II) was employed to obtain the Pareto optimal solution set. Subsequently, the Technique for Order of Preference by Similarity to Ideal Solution (TOPSIS) and the Subjective–Objective Weighting Method were utilized to identify the optimal solution from the Pareto set.
The simulations were performed using MATLAB (2022a, The MathWorks, Inc., Natick, MA, USA) on a computer equipped with an Intel Core i7-13700H processor (14 cores, 20 threads, with a maximum clock speed of 5.0 GHz), an NVIDIA GeForce RTX 4060 GPU (with a power consumption of up to 140 W), 16 GB of RAM, and a 1 TB PCIe SSD, running the Windows 11 operating system.
The parameter settings are as follows: seven decision variables, three optimization objectives, a population size of 100, 300 iterations, a crossover probability of 0.9, a mutation probability of 0.1, and crossover and mutation distribution indices of 20. The simulation was conducted over 20 independent repetitions to ensure the stability of the results, with each run taking approximately 3 to 5 min on the specified computational platform. To mitigate the significant subjectivity associated with using only subjective weights to identify the optimal solution, the entropy weight method is employed to determine the objective weights of each of the three objectives, based on the variations in their respective data [25]. In alignment with the preferences of the park decision-makers and existing literature, the subjective weights for the three objectives are allocated as 0.5, 0.2, and 0.3, respectively [15]. The final weight is calculated as the average of the subjective and objective weights. The algorithm flow is shown in Figure 4:

5. Simulation Analysis

5.1. Example Scenarios and Parameter Settings

The capacity optimization analysis in this study is based on forecasted data for PV generation, wind WT generation, and electrical/thermal loads for a typical day in 2024. These data were sourced from a hydrogen-integrated demonstration project in Jiangsu Province, China. It is important to acknowledge that the use of forecasted data, as opposed to measured operational data, represents a limitation of this study. Future research will focus on validating the model with actual historical operational data from this and similar projects as such data becomes available. First, the source load forecast data is processed using LHS and EDR. The initial number of generated scenarios is set to 1000, with four typical scenarios selected. Second, the parameters for each device within the system are provided in Table 2 [16,26].
This study assumes that 15 EV charging sessions occur daily within the park’s coverage area. Each session is characterized by a charging power of 7 kW and a battery capacity of 40 kWh, which corresponds to the typical capabilities of mainstream private electric vehicles and is supported by charging behavior studies [27]. A charging service fee of 0.8 yuan per kWh is applied, and the total charging revenue is derived from both this service fee and time-of-use electricity rates. For hydrogen sourced from outside the park, coal gasification-based hydrogen production is used as a reference. The associated carbon emissions are estimated to be approximately 19 kg CO2 per kilogram of hydrogen produced, which aligns with lifecycle assessment findings in the literature [14,28]. The total unit cost of hydrogen, including production and transportation fees, is estimated at approximately 17.02 yuan per kilogram, based on comprehensive cost analyses of the hydrogen industry chain [29]. To validate the effectiveness of the research presented in this paper, four case were designed for the system. The specific factors considered in each case are outlined in Table 3.

5.2. System Capacity Configuration Results and Operational Analysis

The capacity allocation results for the four scenarios, calculated based on the objective function and constraints outlined earlier, are presented in Table 4.
These capacity scales fall entirely within the commercially available range for industrial applications. EL and FC of this scale are widely supplied by numerous global manufacturers, including Cummins, Siemens, and Huawei. HST with capacities in the hundreds of kilograms are standard components in industrial gas supply systems, posing no significant technical challenges. With ongoing breakthroughs and advancements in hydrogen-related technologies, the economic viability of IES equipped with hydrogen storage is expected to improve substantially in the future.
The system performance indicators obtained from testing with the configurations outlined above are presented in Table 5.
Compared to relying exclusively on purchased hydrogen, integrating hydrogen production from clean energy sources within the system effectively manages both costs and carbon emissions. A detailed comparison of the results is presented in Table 6.
Analysis of Table 5 and Table 6 indicates that the cost of purchasing hydrogen from external sources represents a significant proportion of the daily total cost, and the production of externally sourced hydrogen results in substantial carbon emissions. Compared to a system that relies solely on purchased hydrogen, integrating clean energy into the system for chemical production reduces the quantity of hydrogen purchased by 9.8%.
A sensitivity analysis was conducted to evaluate the robustness of the optimization results with respect to the number of typical scenarios. The complete model (Case 4) was re-optimized using 3 and 5 typical scenarios, respectively. The results were then compared with those obtained from the base case, which used 4 scenarios. The key findings are summarized in Table 7.
The analysis indicates that using three scenarios leads to significant errors in capacity estimation: the EL capacity is overestimated by 36.8%, while the FC and EB capacities are underestimated by 23.5% and 25.0%, respectively. This suggests that three scenarios are insufficient to capture the source-load uncertainty adequately. In contrast, using five scenarios results in only minor deviations, with all equipment capacities differing by less than 5% from the base case, and key devices such as EL and FC varying by less than 3%. These findings suggest that four scenarios provide an optimal balance between modeling accuracy and computational efficiency.
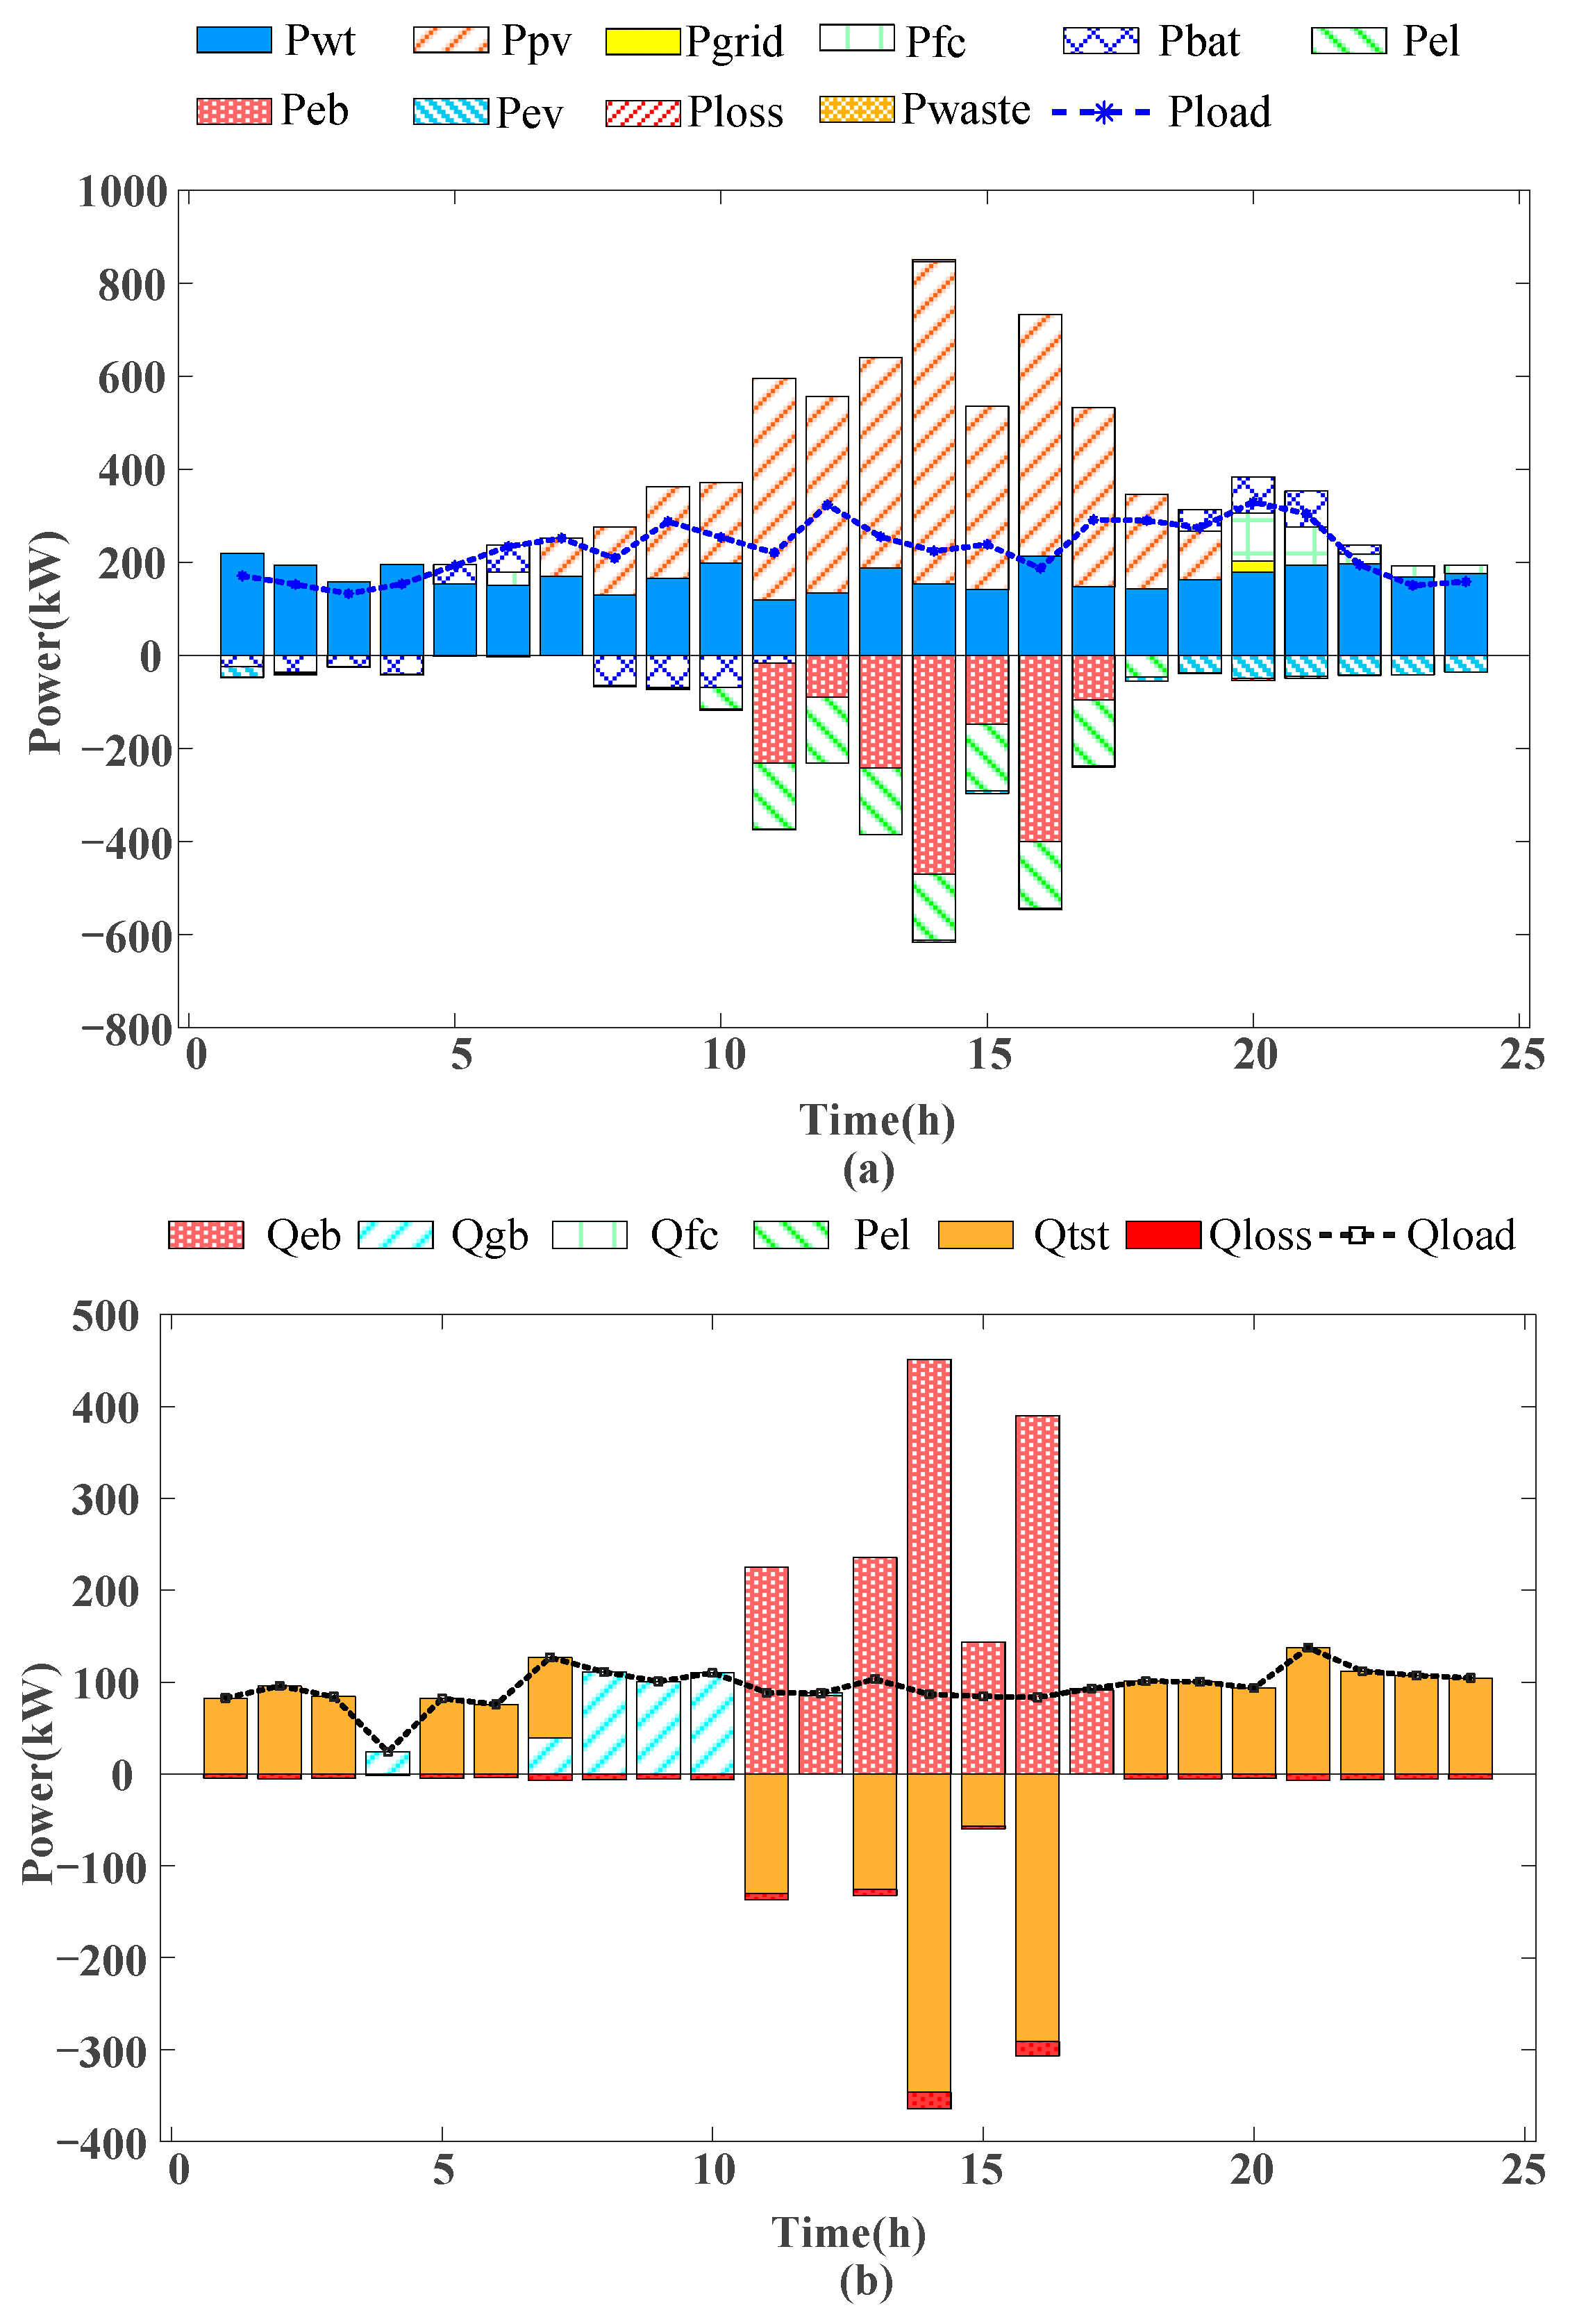
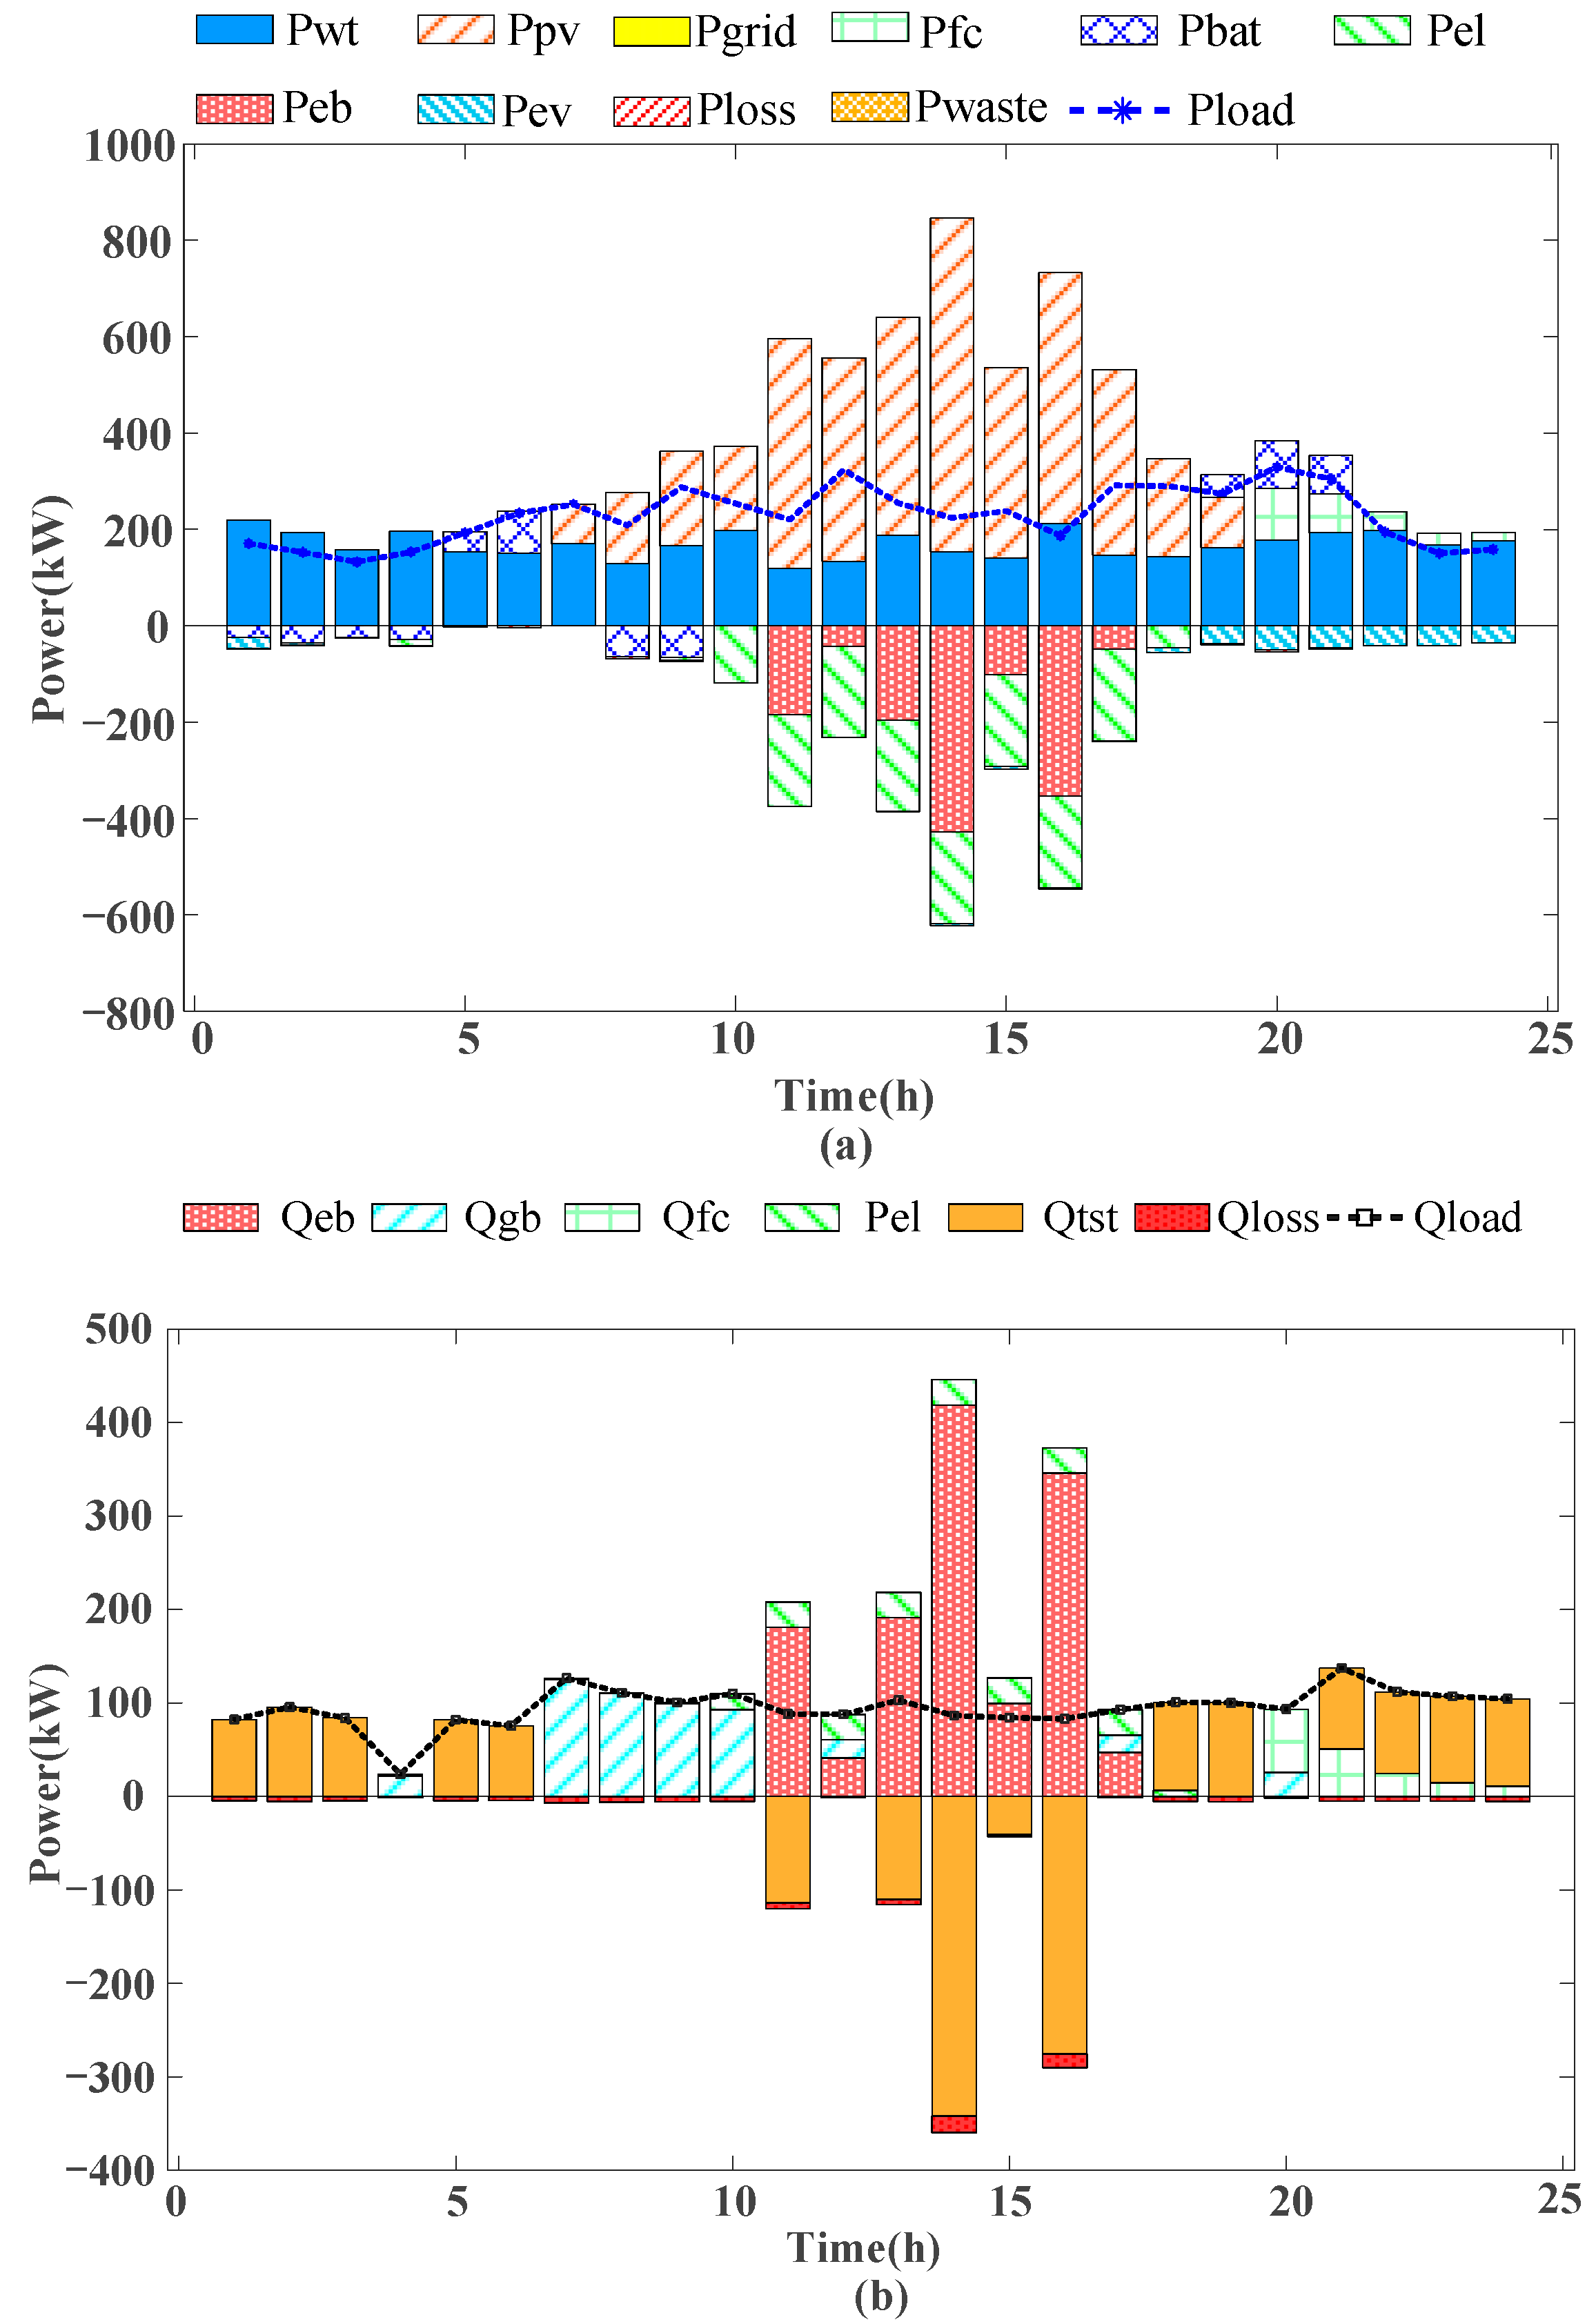
To further assess the effectiveness of case 4, this study performed system test runs for all four cases, utilizing the configuration results described above along with the system’s recent load forecast data. The results of these simulations are presented in Figure 5.
Based on the planning and operational results presented in Table 4 and Figure 5, it is evident that Case 1 does not incorporate the utilization of waste heat from the hydrogen energy subsystem. As a result, the system relies entirely on EB, TST, and GB for heating. Between 1:00 AM and 7:00 AM, the system faces a thermal energy shortage, and the clean energy available is insufficient to activate the EB. Consequently, the system prioritizes the activation of the TST for heating. At 4:00 AM, the TST has not yet reached its safe operating lower limit, preventing its activation; therefore, the system resorts to starting the GB for heating. By 7:00 AM, the TST has fully discharged to its energy storage lower limit, and the GB supplements the remaining heat load.
Between 10:00 AM and 5:00 PM, the PV system operates, reaching its peak clean energy output. Once the BAT is fully charged, the system prioritizes activating the EL for hydrogen production. Any remaining surplus power is directed to the EB for heating. After fulfilling the thermal load demand, the excess heat is stored in the TST.
Between 8:00 PM and 10:00 PM, the evening peak and EV charging peak overlap. Despite the BAT discharging at maximum capacity, it is insufficient to meet the electrical load demand, prompting the system to activate the FC to compensate for the power deficit. However, Case 1 does not account for significant disturbances, leading to the need for additional power purchase from the grid at 8:00 PM. Since the TST was charged during the day, it is able to meet the thermal load demand of the industrial park during the night.
The analysis of Case 4, in conjunction with Table 4 and Figure 6, reveals several key insights into the system’s energy management. From an electrical energy perspective, Case 4 utilizes larger-capacity EL, enabling the storage of more energy as hydrogen during periods of peak clean energy output. This design increases the system’s energy storage capacity and facilitates more efficient utilization of renewable energy.
In terms of thermal energy, Case 4 incorporates the use of waste heat from the hydrogen energy subsystem. Specifically, from 10:00 to 17:00, the thermal load is supplied by both the EL and the EB. From 20:00 to 24:00, when clean energy and BAT are insufficient to meet the electrical load demand, the FC is activated. This ensures the regulation of the electricity supply and facilitates the recovery of waste heat for system heating, thereby enhancing overall energy efficiency.

5.3. System Configuration and Performance Analysis Under Different Cases

We analyzed the system configuration results in conjunction with Table 3, Table 4, Table 5 and Table 6. Compared to Case 1, Case 2 incorporates waste heat recovery from the hydrogen energy subsystem and increases the capacity of the existing FC for electrothermal regulation. The expanded capacity of the FC leads to a higher consumption of hydrogen, which in turn reduces the available capacity for hydrogen energy storage. Moreover, the use of hydrogen energy storage for thermal regulation significantly decreases the required capacity of TST and GB, effectively controlling costs and reducing the system’s daily overall cost by 9.74%. Additionally, by prioritizing waste heat for heating, the system reduces its dependence on gas-fired heating, resulting in a 6.98% reduction in carbon emissions. The increased FC capacity also contributes to a reduction in the system’s load variance by 58.6%.
Case 3 considers the inclusion of EV charging access based on Case 2. However, the random nature of EV charging will affect the system’s original load. As a result, the system requires enhanced disturbance resistance, leading to a significant increase in the equipment capacity of the hydrogen energy subsystem. With this configuration, the system largely eliminates the need to purchase electricity from the grid, while the flexible adjustment capabilities of the hydrogen energy subsystem further reduce the system’s load variance. Nevertheless, the high cost of hydrogen energy storage increases both procurement and maintenance expenses, indicating that the economic efficiency of this system requires further optimization.
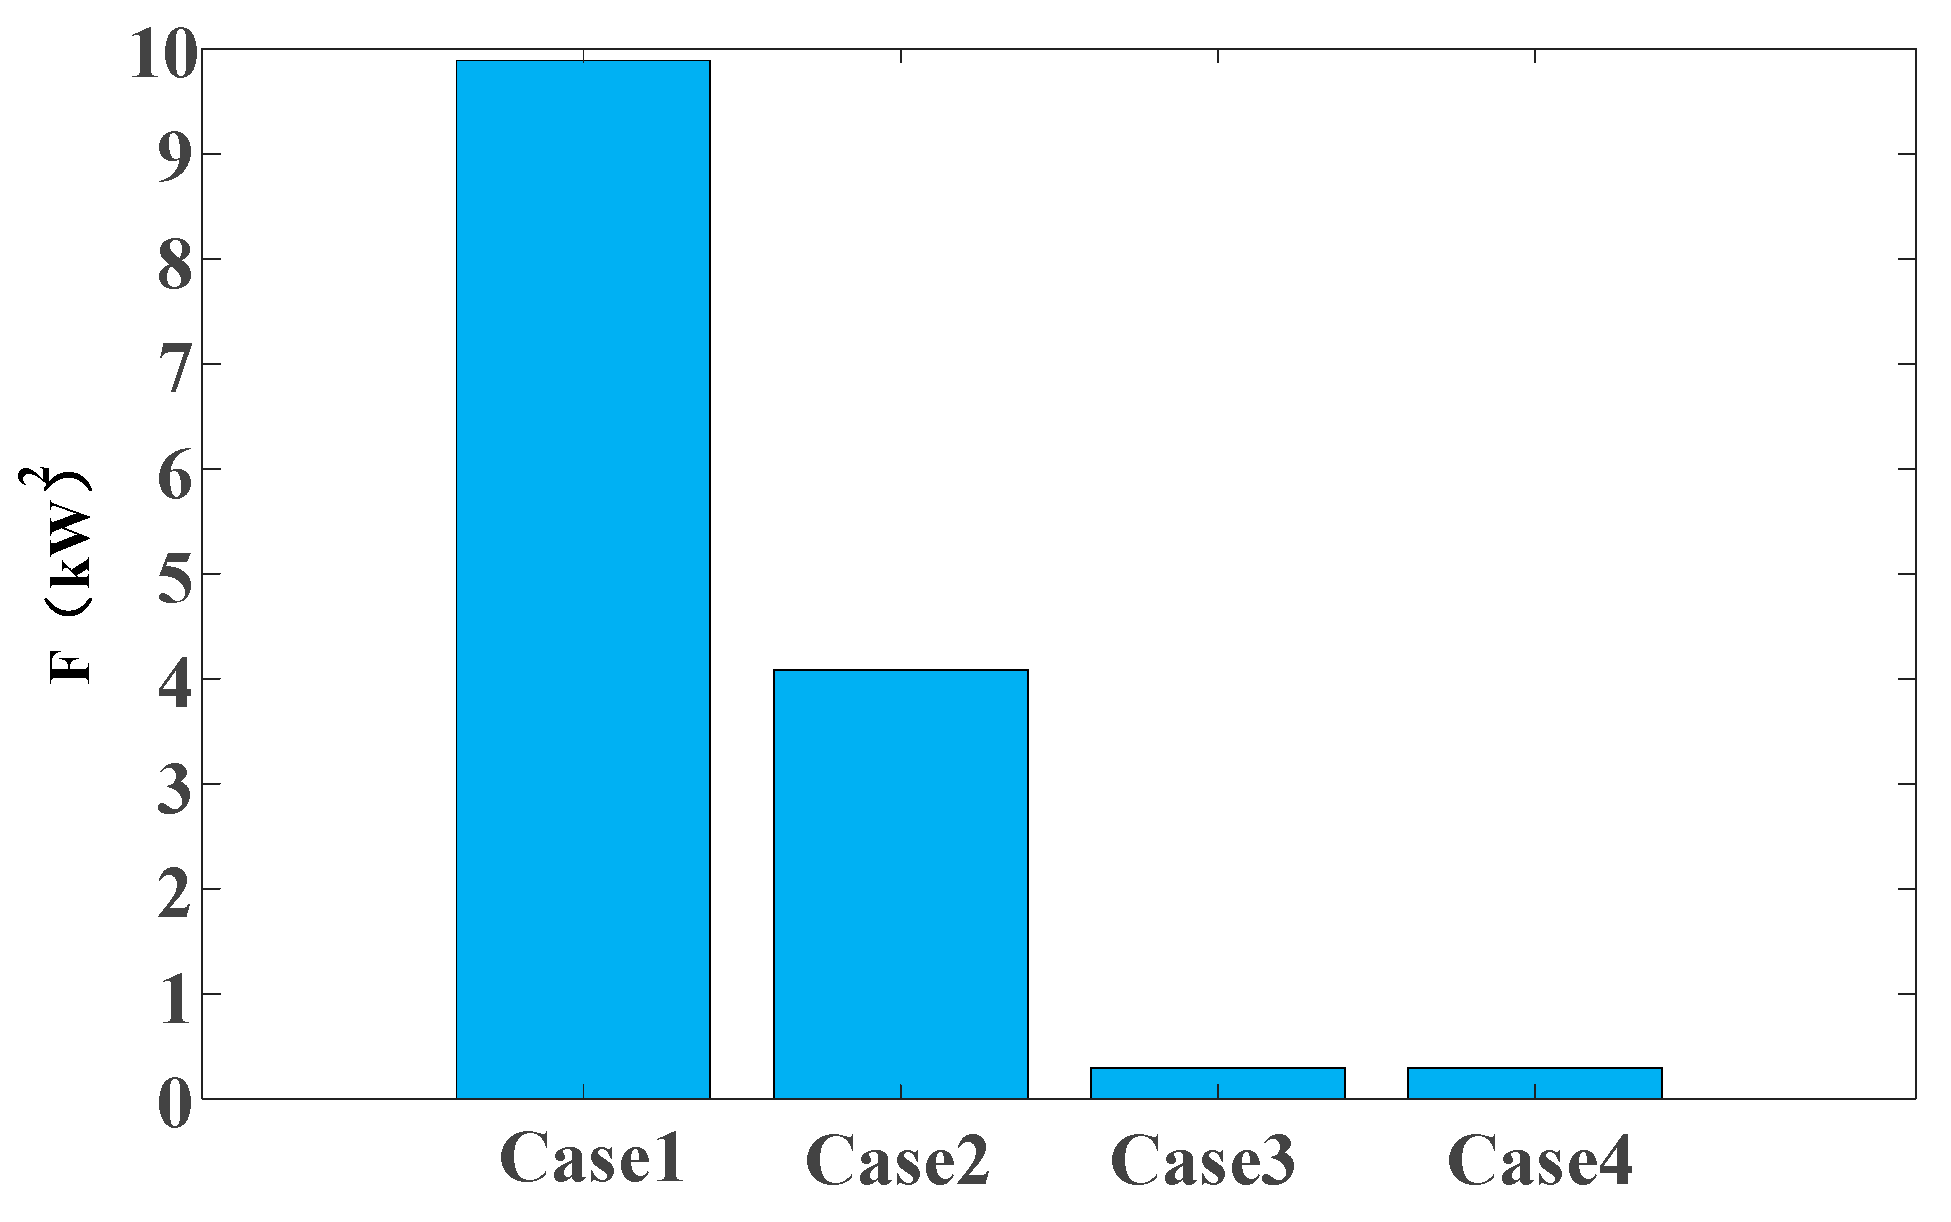
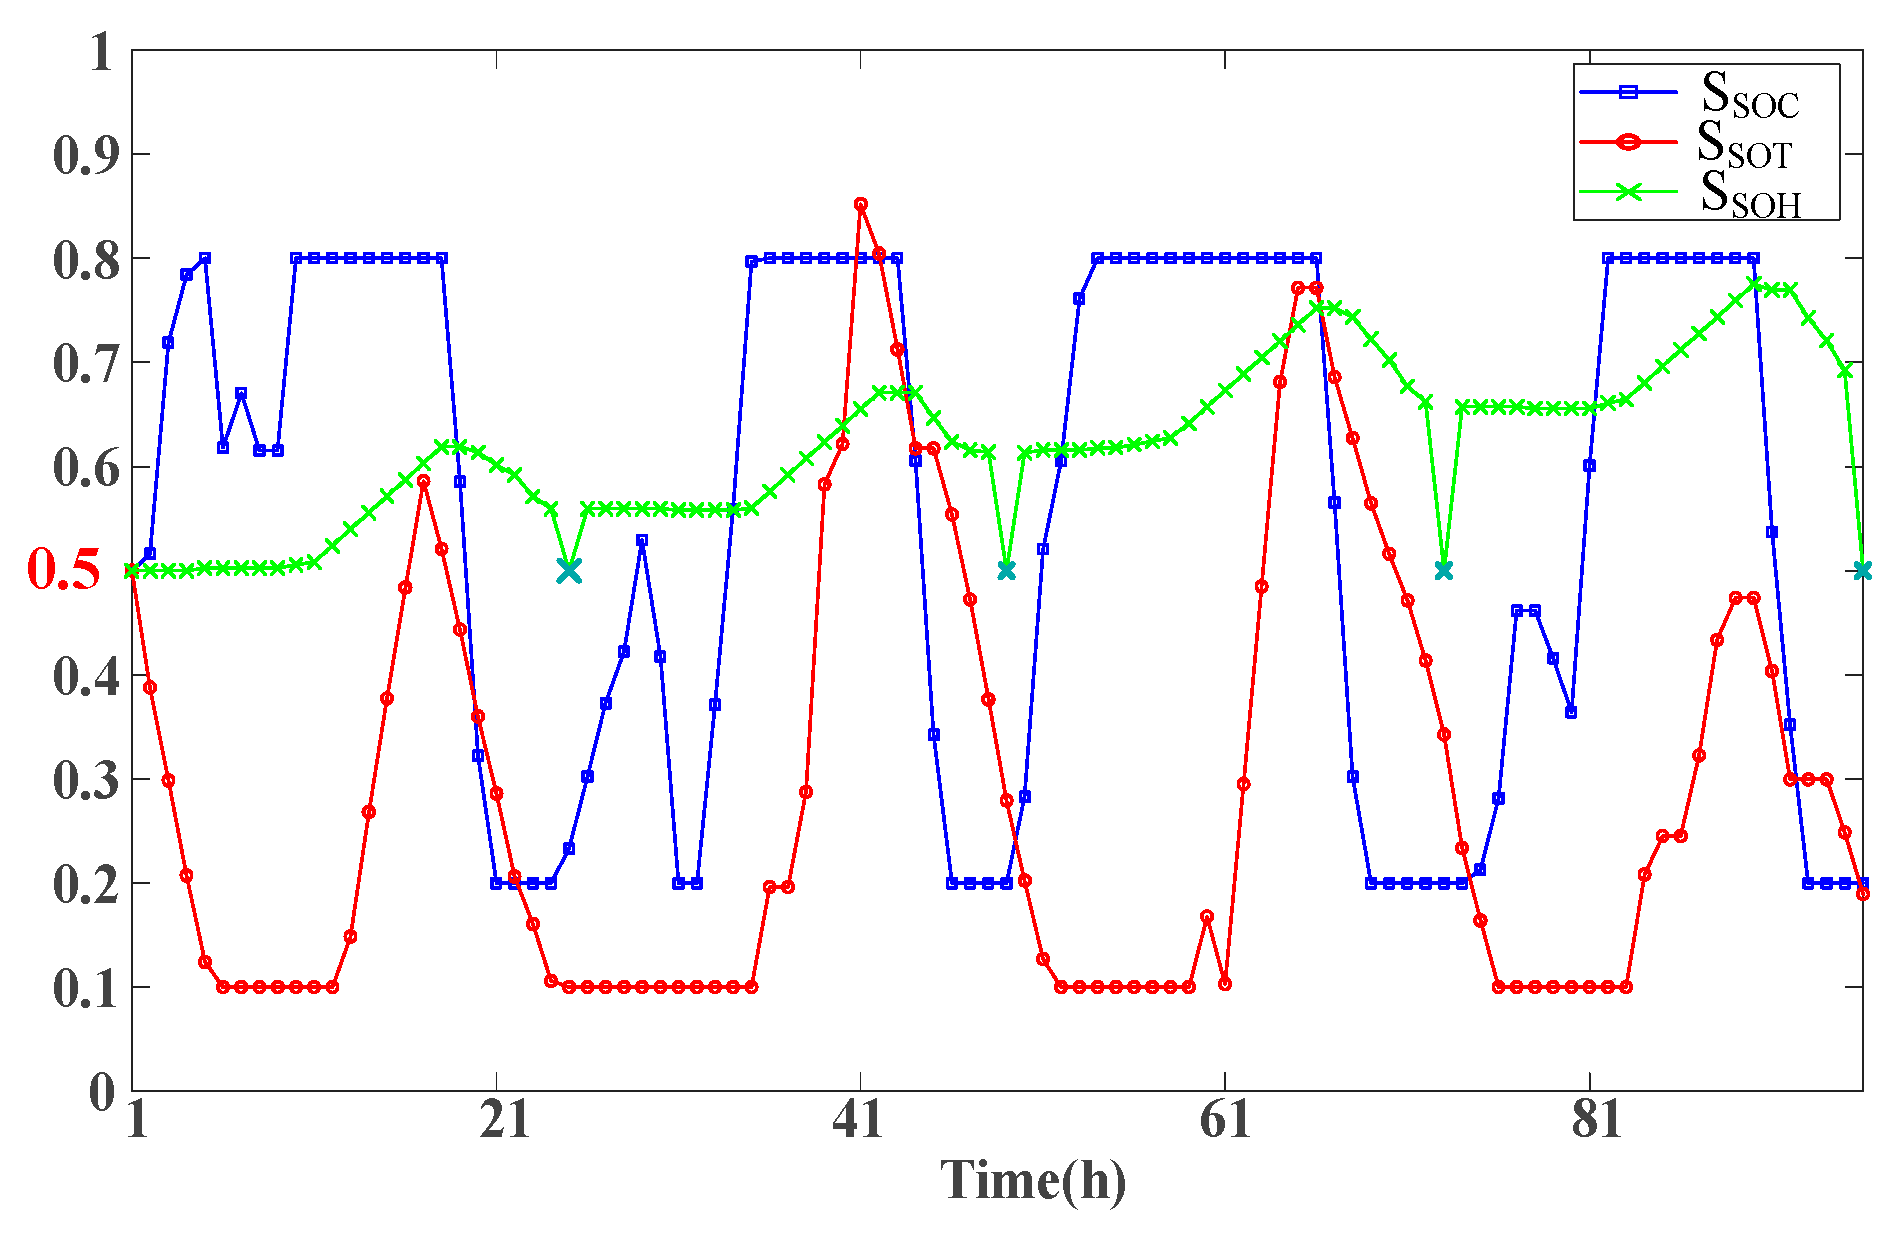
Case 4 builds upon Case 3 by utilizing hydrogen produced from clean energy within the system for chemical production in the industrial park. In contrast to a system that relies entirely on externally purchased hydrogen, this approach diversifies the consumption channels for hydrogen storage, thereby enhancing the flexibility of hydrogen storage regulation. The system is equipped with higher-capacity EL, while the HSTs are smaller, further reducing both procurement and operational costs. Through the energy management strategies outlined in this paper, it is ensured that the electric heat storage system achieves full charging and discharging within a day, while the hydrogen storage system maintains a specified storage level to ensure that the initial and final states are equal throughout the cycle. This configuration is advantageous for the long-term, stable operation of the system. Figure 7 shows the load variance under different cases. Figure 8 shows the storage status of energy storage equipment under case 4.

5.4. Consideration of the Cost–Benefit Analysis of Hydrogenation Production

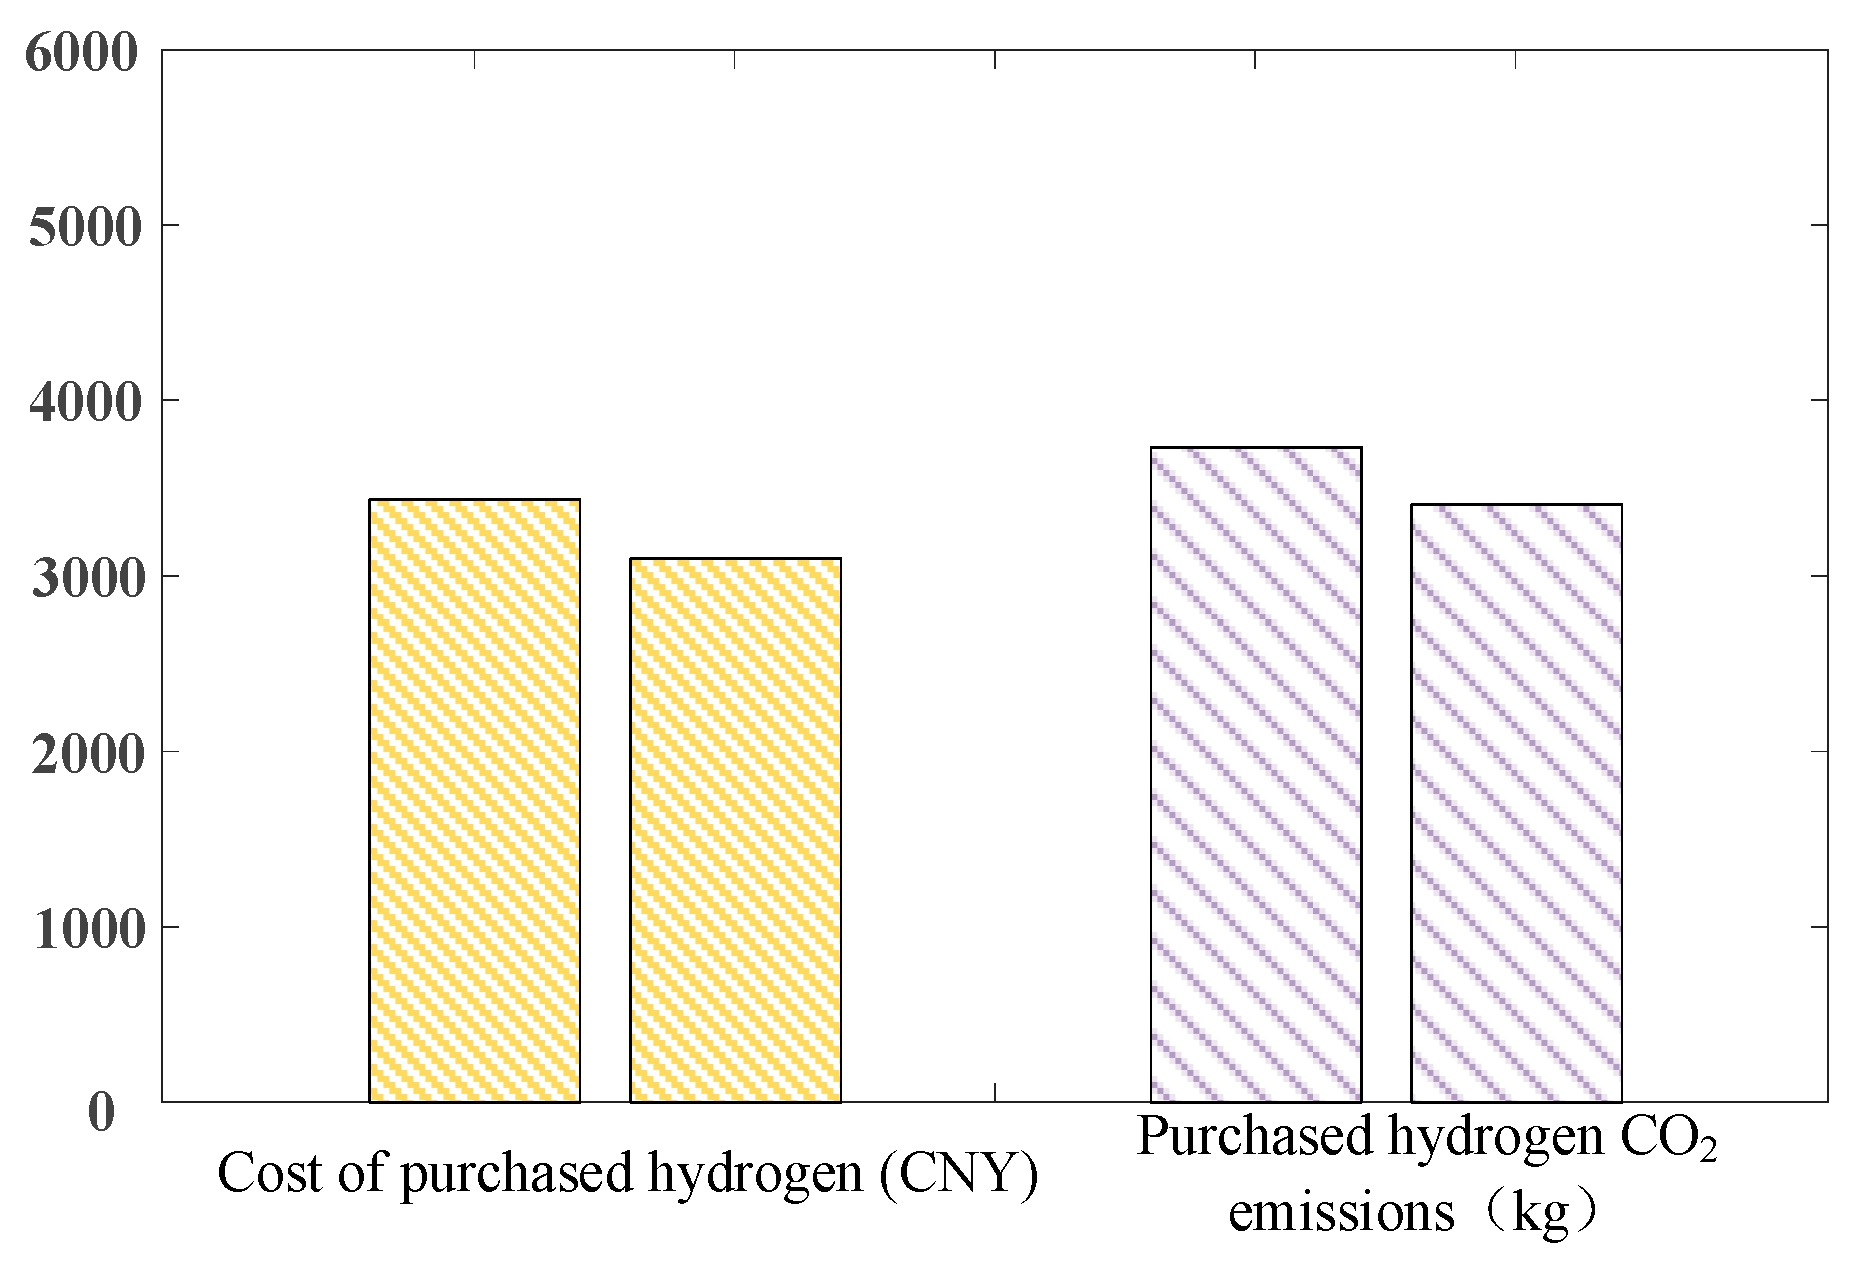
As presented in Table 6, the cost of purchased hydrogen for chemical production in the industrial park constitutes a significant portion of the total cost. Utilizing surplus hydrogen from the HST at the end of the cycle for chemical production can reduce the reliance on externally purchased hydrogen. In comparison to Case 3, which solely depends on externally sourced hydrogen, the reduced capacity of the hydrogen energy subsystem has led to a 9.72% reduction in procurement and maintenance costs. The internal utilization of surplus hydrogen has also resulted in a 9.8% decrease in external hydrogen procurement costs. However, since excess clean energy is primarily stored as hydrogen, the heat output of the EB is diminished, and the system’s thermal load is increasingly met by the GB. This shift results in higher carbon emissions during operation. Despite this, when accounting for the total carbon emissions associated with the production of externally purchased hydrogen, the overall carbon emissions are still reduced by 6.93%. A comparison of the costs and carbon emissions associated with relying solely on externally purchased hydrogen is presented in Figure 9.
A comparison with recent international studies on hydrogen-based IES highlights a significant advancement in our work. While many studies focus on the use of hydrogen for renewable energy storage and grid balancing [30,31], our model explicitly incorporates the carbon emissions associated with hydrogen production. This enables a more comprehensive environmental assessment and reveals that the primary benefit of on-site green hydrogen production lies not only in energy storage but also in the displacement of high-carbon, externally sourced hydrogen. This finding underscores the pivotal role of hydrogen-based IES in driving deep decarbonization and in reducing the carbon intensity of industrial feedstocks.
However, the realization of decarbonization potential currently faces economic challenges due to the high upfront costs of EL and the relatively low cost of carbon-intensive alternatives. Supportive policies could significantly improve both the economic feasibility and environmental impact of the proposed integrated system. For example, a carbon emissions trading scheme would increase the operational costs of grid power and natural gas, thereby enhancing the economic advantages of clean energy, waste heat recovery, and on-site green hydrogen production. Higher carbon prices, in particular, would substantially improve the return on investment for EL and FC systems. Additionally, subsidies for green hydrogen production—whether in the form of investment or production subsidies—could shorten payback periods and mitigate initial capital risks, helping to close the cost gap and facilitating large-scale deployment. These policy mechanisms are critical for achieving deep decarbonization within the industrial sector.

6. Conclusions

This paper presents an energy management strategy that incorporates the recovery of waste heat from the hydrogen energy subsystem, addressing the challenges posed by uncertainties in EV charging and clean energy supply, which result in significant disturbances to the industrial park’s IES. Building on this strategy and the scenario outcomes, a multi-objective planning approach is employed to optimize the capacity configuration of the electricity–heat–hydrogen IES, which is integrated with hydrogen-based chemical production. The analysis of the results leads to the following conclusions:
  • The proposed energy management strategy accounts for both hydrogen energy storage waste heat recovery and safe operating intervals. By integrating multiple energy forms, such as electricity, heat, and hydrogen, the strategy capitalizes on the synergistic effects of these subsystems, thereby enhancing the flexibility of system operations.
  • By combining LHS and EDR methods for scenario generation, typical probabilistic scenarios are developed that balance both normal and extreme operational conditions. This approach effectively addresses the quantification of spatiotemporal uncertainty in source-load systems, providing reliable input for capacity optimization under disruptive conditions.
  • The capacity optimization process incorporates a multi-objective planning approach that holistically considers economic, environmental, and load variance factors. This approach ensures that diverse planning objectives can be met effectively.
  • The utilization of clean energy within the industrial park for hydrogen production significantly reduces the volume of externally sourced hydrogen and lowers overall system costs. Furthermore, this strategy provides substantial environmental benefits.
Future research will focus on validating the model using historical operational data from existing industrial parks. Additionally, the environmental assessment will be expanded to include a comprehensive lifecycle analysis, incorporating supplementary indicators such as NOx and SOx emissions. A more detailed examination of hydrogen subsidies and carbon pricing mechanisms will also be conducted to develop actionable policy recommendations. Furthermore, the impact of external hydrogen price volatility and long-term market trends on system configuration and economics will be systematically evaluated, enhancing the model’s robustness in addressing real-world market uncertainties.

Author Contributions

Conceptualization, J.W.; methodology, Q.W.; software, J.W.; validation, J.W. and Y.Y.; formal analysis, J.W.; investigation, J.W.; resources, Q.W.; data curation, J.W.; writing—original draft preparation, J.W.; writing—review and editing, J.W.; visualization, Q.W.; supervision, Q.W.; project administration, Y.Y.; funding acquisition, Q.W. All authors have read and agreed to the published version of the manuscript.

Funding

This work was supported by the National Natural Science Foundation of China, grant number 52277012.

Data Availability Statement

The original contributions presented in the study are included in the article, further inquiries can be directed to the corresponding author.

Conflicts of Interest

The authors declare no conflicts of interest.

Abbreviations

SymbolDescription
η b a t c h BAT charging efficiency
η b a t d i s BAT discharge efficiency
η e l EL hydrogen production efficiency
η h t , e l EL thermal efficiency
η f c FC hydrogen consumption efficiency
η h t , f c FC thermal efficiency
η r Waste heat recovery efficiency
η e b EB heating efficiency
η g b GB heating efficiency
δ Calorific value of gas
α EL hydrogen production/kW
β FC hydrogen consumption/kW
k w Penalty cost per unit of energy wasted
θ p Electricity purchase carbon emission factor
θ g Gas carbon emission factor
c h Unit hydrogen purchase cost
λ Carbon emissions per unit of hydrogen purchased

References

  1. Wang, S.; Kong, L.; Cai, G.; Yan, H.; Han, Z.; Liu, C.; Wan, Y.; Yang, S.; Wang, X. Current Status, Challenges and Prospects of Key Application Technologies for Hydrogen Storage in Power System. Proc. CSEE 2023, 43, 6660–6680. [Google Scholar] [CrossRef]
  2. Wu, Z.; Zhou, M.; Wang, J.; Tang, W.; Yuan, B.; Li, G. Review on Market Mechanism to Enhance the Flexibility of Power System Under the Dual-Carbon Target. Proc. CSEE 2022, 42, 7746–7764. [Google Scholar] [CrossRef]
  3. Shi, Z.; Wang, W.; Huang, Y.; Li, P.; Dong, L.; Fan, Y. Hierarchical Optimization Planning for Electrical and Heat Storage Capacity in Multi-Energy Complementary Generation System. Power Syst. Technol. 2020, 44, 3263–3271. [Google Scholar] [CrossRef]
  4. Cui, Y.; Yu, S.; Wang, X.; Fu, G.; Wang, M. Optimal Configuration of Heat Storage Capacity Considering the Balance Between System Peak Shaving Demand and Concentrating Solar Power Plant Revenue. Proc. CSEE 2023, 43, 8745–8757. [Google Scholar] [CrossRef]
  5. Wang, Q.; Nie, Z.; Liu, H. Low Carbon Scheduling of Integrated Energy Systems Considering Flexible Operation of Carbon Capture Co-Generation and Green Certification Carbon Integration Mechanisms. J. China Three Gorges Univ. (Nat. Sci.) 2024, 46, 87–96. [Google Scholar] [CrossRef]
  6. Zhu, Q.; Zeng, L.; Kou, F.; Yang, G. Research on Optimal Allocation Method of Wind, Photovoltaic, Gas Turbine and Energy Storage in Industrial Parks Considering Energy Storage’s Grid-Connected Operation Modes. Power Syst. Prot. Control 2019, 47, 23–31. [Google Scholar] [CrossRef]
  7. Ren, F.; Wang, J.; Zhu, S.; Chen, Y. Multi-Objective Optimization of Combined Cooling, Heating and Power System Integrated with Solar and Geothermal Energies. Energy Convers. Manag. 2019, 197, 111866. [Google Scholar] [CrossRef]
  8. Li, Y.; Wang, Z.; Zhang, L.; Lei, T.; Liang, Y.; Zhang, G.; Xu, C. Capacity Allocation Optimization of Integrated Hydrogen-Electric Coupling System of Wind-Solar-Hydrogen-Gas Turbine. Proc. CSEE 2025, 45, 489–502. [Google Scholar] [CrossRef]
  9. Li, Q.; Zhao, S.; Pu, Y.; Chen, W.; Yu, J. Capacity Optimization of Hybrid Energy Storage Microgrid Considering Electricity-Hydrogen Coupling. Trans. China Electrotech. Soc. 2021, 36, 486–495. [Google Scholar] [CrossRef]
  10. Zhao, D.; Xu, C.; Tao, R.; Zheng, Y. Review on Flexible Regulation of Multiple Distributed Energy Storage in Distribution Side of New Power System. Proc. CSEE 2023, 43, 1776–1799. [Google Scholar] [CrossRef]
  11. Zhang, S.; Zhang, X.; Zhang, R.; Gu, W.; Cao, G. N-1 Evaluation of Integrated Electricity and Gas System Considering Cyber-Physical Interdependence. IEEE Trans. Smart Grid 2025, 16, 3728–3742. [Google Scholar] [CrossRef]
  12. Wang, Q.; Bi, Y.; Gao, C.; Song, D. Prediction of Spatiotemporal Distribution of Electric Vehicle Charging Load Based on Multi-Source Information. Electr. Power Constr. 2025, 46, 24–37. [Google Scholar] [CrossRef]
  13. Zhou, J.; Wu, Y.; Dong, H.; He, J.; Xu, C.; Gao, J. Optimal Planning of Wind-Photovoltaic-Hydrogen Integrated Energy System Considering Random Charging of Electric Vehicles. Autom. Electr. Power Syst. 2021, 45, 30–40. [Google Scholar] [CrossRef]
  14. Yang, Y.; Li, Q.; Pu, Y.; Chen, X.; Chen, W. Optimal Configuration of CHHP Island Integrated Energy System Considering Different Charging Modes of Electric Vehicles. Power Syst. Technol. 2022, 46, 3869–3880. [Google Scholar] [CrossRef]
  15. Wang, J.; Cui, Y.; Liu, Z.; Zeng, L.; Yue, C.; Agbodjan, Y.S. Multi-Energy Complementary Integrated Energy System Optimization with Electric Vehicle Participation Considering Uncertainties. Energy 2024, 309, 133109. [Google Scholar] [CrossRef]
  16. Li, J.; Sun, H.; Liang, Z.; Jiang, X. Optimal Capacity Allocation of Integrated Energy Systems Under Multi-Energy Demand Scenarios. High Volt. Eng. 2025, 51, 2114–2124. [Google Scholar] [CrossRef]
  17. Liu, Z.; Cui, Y.; Wang, J.; Yue, C.; Agbodjan, Y.S.; Yang, Y. Multi-Objective Optimization of Multi-Energy Complementary Integrated Energy Systems Considering Load Prediction and Renewable Energy Production Uncertainties. Energy 2022, 254, 124399. [Google Scholar] [CrossRef]
  18. Pan, G.; Gu, W.; Zhang, H.; Qiu, Y. Electricity and Hydrogen Energy System Towards Accommodation of High Proportion of Renewable Energy. Autom. Electr. Power Syst. 2020, 44, 1–10. [Google Scholar] [CrossRef]
  19. Bazmohammadi, N.; Tahsiri, A.; Anvari-Moghaddam, A.; Guerrero, J.M. A Hierarchical Energy Management Strategy for Interconnected Microgrids Considering Uncertainty. Power Energy Syst. 2019, 109, 597–608. [Google Scholar] [CrossRef]
  20. Guo, Y.; Zhou, M.; Han, B. Low-Carbon Economic Optimal Scheduling of Integrated Port Energy System Considering Utilization of Hydrogen Energy. Proc. CSU-EPSA 2025, 37, 91–100. [Google Scholar] [CrossRef]
  21. Zhang, C.; Kuang, Y.; Zou, F.; Liu, J.; Li, C. Low-Carbon Economic Dispatch of Integrated Energy System Considering Wind and Solar Uncertainty and Electric Vehicles. Electr. Power Autom. Equip. 2022, 42, 236–244. [Google Scholar] [CrossRef]
  22. Hou, H.; Liu, P.; Huang, L.; Xie, C.; Zhang, R. Planning of Electricity-Heat-Hydrogen Integrated Energy System Considering Uncertainties. Trans. China Electrotech. Soc. 2021, 36, 133–144. [Google Scholar] [CrossRef]
  23. Elkadeem, M.R.; Abd Elaziz, M.; Ullah, Z.; Wang, S.; Sharshir, S.W. Optimal Planning of Renewable Energy Integrated Distribution System Considering Uncertainties. IEEE Access 2019, 7, 164887–164907. [Google Scholar] [CrossRef]
  24. Zheng, D.; Cui, S.; Fan, X.; Zhao, L. Multi-Objective Distributionally Robust Optimization Scheduling for Integrated Energy System Considering Wind Power Uncertainty. Smart Power 2024, 52, 1–8, 18. [Google Scholar] [CrossRef]
  25. Zhao, C.; Ye, J.; He, P.; Li, Q.; Wang, S. A PIES Optimization Strategy Considering Multiple Uncertainties in Source and Load. Power Syst. Prot. Control 2025, 53, 148–164. [Google Scholar] [CrossRef]
  26. Li, G.; Sun, L.; Luo, R.; Jin, B.; Wu, C. Multi-Objective Optimization of Wind-Hydrogen Integrated Energy Systems with Energy Cascade Utilization. Electr. Power Constr. 2024, 45, 1–12. [Google Scholar] [CrossRef]
  27. Sorensen, A.; Sartori, I.; Lindberg, K.; Andresen, I. A Method for Generating Complete EV Charging Datasets and Analysis of Residential Charging Behaviour in a Large Norwegian Case Study. Sustain. Energy Grids Netw. 2023, 36, 101195. [Google Scholar] [CrossRef]
  28. Shi, L.; Sun, J. Study on the Methods of Assessment for Low-Carbon Development of Chinese Cities. Acta Ecol. Sin. 2018, 38, 5461–5472. [Google Scholar] [CrossRef]
  29. Shan, T.; Song, P.; Li, Y.; Hou, J.; Wang, X.; Zhang, D. Cost Analysis of Hydrogen from the Perspective of the Whole Industrial Chain of Production, Storage, Transportation and Refueling. Nat. Gas Chem. Ind.—C1 Chem. Chem. Eng. 2020, 45, 85–90, 96. [Google Scholar] [CrossRef]
  30. Li, J.; Chen, H.; Li, J.; Zhang, Y.; Pan, P.; Bian, J.; Yu, Z. Bi-Level Optimization Model of Hydrogen-Blended Gas Units and Multi-Type Energy Storage System Considering Low-Carbon Operation. Energy 2025, 314, 134162. [Google Scholar] [CrossRef]
  31. Abu Reza, K.; Ting, D.; Carriveau, R. Wind-Coupled Hydrogen Integration for Commercial Greenhouse Food and Power Production: A Case Study. Energy Convers. Manag. 2024, 322, 119182. [Google Scholar] [CrossRef]
Figure 1. Hydrogen chemical industrial park IES topology map and energy flow.
Energies 18 05101 g001
Figure 2. Typical source-load scenarios after reduction. (a) Wind power scenarios; (b) Photovoltaic power scenarios; (c) normal electrical load scenarios; (d) electric load containing EV scenarios; (e) heat load scenarios; (f) hydrogen load scenarios.
Energies 18 05101 g002
Figure 3. System Operation Strategy Flowchart.
Energies 18 05101 g003
Figure 4. Solution process for multi-objective optimization models.
Energies 18 05101 g004
Figure 5. Operational scheduling results for Case 1. (a) Electric power response in Case 1; (b) Thermal response in Case 1.
Energies 18 05101 g005
Figure 6. Operational scheduling results for Case 4. (a) Electric power response in Case 4; (b) Thermal response in Case 4.
Energies 18 05101 g006
Figure 7. System load variance under different cases.
Energies 18 05101 g007
Figure 8. Consider the energy storage state of the system’s storage devices in Case 4.
Energies 18 05101 g008
Figure 9. Comparison with the situation where hydrogen is solely sourced from external purchases.
Energies 18 05101 g009
Table 1. Typical scenario probability.
ScenarioProbability
136.7%
231.6%
314.3%
417.4%
Table 2. Equipment parameters.
EquipmentInvestment Cost (CNY/kW)Operating Costs (CNY/kW)Efficiency/%Life/Years
WT94550.03-25
PV48100.01-25
BAT10080.019510
EB12900.029815
GB9030.029510
TST8510.029525
FC50480.06605
EL28660.048530
HST31110.039835
Table 3. Scenario and considerations.
CaseConsiderations
Waste Heat RecoveryStrong DisturbanceSupplying Hydrogen to the Park
1
2
3
4
Table 4. Configuration Results Under Different Scenarios.
EquipmentCase 1Case 2Case 3Case 4
BAT/kW375375382375
EB/kW450455465440
GB/kW190145130130
TST/kW1336110011001110
HST/kg245210250201
FC/kW125136172171
EL/kW151152160190
Table 5. Performance indicators of different cases.
CaseDaily Total Cost/CNYvs. Case1CO2 Emissions/kgvs. Case1Load Variance/kW2
112,157.3 4739.2 9.89
210,973.3−9.73%4408.4−6.98%4.09
311,803.9−2.91%4367.3−7.85%0.29
410,654.1−12.36%4064.5−14.24%0.29
Table 6. Compared with the results of relying solely on purchased hydrogen systems.
CaseDaily Total Cost/CNYCO2 Emissions/kg
System Acquisition and Operating CostsCost of Purchased HydrogenSystem CO2 EmissionsIndirect Carbon Emissions from Purchased Hydrogen
18730.8 3426.4914.2 3825
27546.8−13.56%583.4−36.18%
38377.5−4.04%542.3−40.68%
47563.5−13.37%3090.5614.5−32.78%3450
Table 7. Variation in equipment capacity with number of scenarios.
Equipment3 Scenarios4 Scenarios5 Scenarios
BAT/kW−1.3%3750.0%
EB/kW−25.0%440−2.7%
GB/kW+1.3%130+3.7%
TST/kW+5.6%1110+3.8%
HST/kg+20.0%201+4.6%
FC/kW−23.5%171−2.9%
EL/kW+36.8%190+1.6%
Disclaimer/Publisher’s Note: The statements, opinions and data contained in all publications are solely those of the individual author(s) and contributor(s) and not of MDPI and/or the editor(s). MDPI and/or the editor(s) disclaim responsibility for any injury to people or property resulting from any ideas, methods, instructions or products referred to in the content.