Abstract
Among various failure causes, lightning overvoltage represents the most significant threat to overhead distribution lines, which serve as critical components in power systems. This study uses the hybrid partial element equivalent circuit (PEEC) multi-conductor transmission line (MTL) method to perform overvoltage simulations and investigate lightning risk distribution along distribution lines developed from a real 10 kV distribution networks in Guizhou, China. The results of the rocket-triggered lightning observation verify the accuracy of the hybrid method for direct lightning simulation. Combining the Monte Carlo method with the electro-geometric model (EGM), the impact of differential protection configurations on annual lightning flashover rates is analyzed. The results demonstrate that lightning strikes on phase wires generate high-magnitude overvoltages but with limited spatial influence, resulting in fewer pole flashovers. Conversely, strikes on poles produce lower overvoltage peaks but affect wider areas, leading to significantly more flashovers. Using annual flashover rates as the risk evaluation metric, the line topologies into high-risk, medium-risk, and other low-risk areas are classified. Targeting an annual flashover rate below 0.4 as the design objective, the configuration schemes of the arresters are progressively optimized. This risk-based approach provides an effective reference framework for differential protection design of distribution line safeguards.
1. Introduction
Distribution lines serve as critical links in power systems, delivering electrical energy to end-users while ensuring reliable power supply, maintaining grid stability, and safeguarding electrical safety [1]. Among various failure causes, lightning overvoltage represents the most significant threat to distribution lines. Statistical data indicates that induced lightning strikes account for a larger proportion of lightning-related faults than direct strikes [2]. However, while the commonly used surge arresters [3,4] can effectively reduce the induced overvoltages from the indirect lightning strikes, they often struggle to suppress the overvoltages caused by direct lightning strikes, which are characterized by significantly higher amplitudes and more pronounced transfer effects [5,6], given the generally adopted sparse arrester configuration on distribution lines. Consequently, the protection against direct lightning strikes demands more focus in distribution line design and maintenance.
The lightning protection of distribution lines remains a significant challenge in power systems due to their structural complexity in real-world applications. Current research approaches primarily involve experimental observation and simulation methods. However, given the higher costs and lower efficiency associated with experimental methods, simulation methods have emerged as the predominant research methodology in this field. The primarily used methods are numerical simulation methods and simulation software. Numerical calculation methods for lightning analysis are predominantly based on the long line coupling formula derived from Maxwell’s equations [7], where lightning is typically represented as an ideal current source in parallel with an equivalent impedance. Among these approaches, the MTL [8,9] model has gained widespread adoption due to its modeling simplicity and computational efficiency. This methodology has been implemented in established simulation platforms such as EMTP-LIOV [10] and PSCAD [11], as well as in various hybrid models developed by research teams [12]. Recent studies [13,14] have highlighted the importance of considering the lightning electromagnetic pulse (LEMP) coupling effect on conductor systems when calculating line overvoltages. Research demonstrates that neglecting LEMP effects can lead to significant deviations in calculations of surge current distribution coefficients and insulation withstand voltage characteristics. In this study, we incorporate LEMP effects in our direct lightning strike calculations to improve accuracy.
Based on the research of lightning overvoltage, combined with the randomness of lightning activity, this paper studies the risk distribution of lightning along the line. The Monte Carlo algorithm and the electro-geometric model (EGM) have undergone a series of developments. The Monte Carlo probabilistic approach [15] constructs distribution samples from historical data, generating random simulations that converge to true values as the number of trials increase. The EGM is used to determine the type of lightning strike. Young advanced this model, followed by refinements [16,17,18] addressing traditional EGM’s observational discrepancies.
Current research on lightning risk assessment for distribution lines predominantly focuses on simplified uniform periodic line models with equidistant spans, with limited attention to modeling complex span-varying configurations. However, real-world distribution networks exhibit significantly more complex configurations. Whether the direct lightning overvoltage characteristics of such complex networks align with the calculation results derived from the uniform periodic models remains unclear.
To address this gap, this study employs the hybrid MTL-PEEC algorithm, first validating the model using field data from a double-circuit test line in Guangzhou. Subsequently, the verified algorithm is applied to model and analyze a 10 kV distribution line section in Guizhou Province. Leveraging actual line structures and regional lightning data, we integrate Monte Carlo simulation with the EGM to investigate lightning overvoltage characteristics, risk distribution, and the difference under different influencing factors. The analysis evaluates how differentiated protection measures affect flashover rates, providing theoretical guidance for distribution network protection design. The organizational structure of the paper is as follows: Section 2 introduces the MTL-PEEC algorithm. Section 3 verifies the algorithm according to the measured data. Section 4 presents the line model in Guizhou and the overvoltage characteristics under typical lightning location conditions. Section 5 gives the calculation method and the influencing factor analysis of the annual flashover rate of each pole of the line. Section 6 gives the gradually optimized lightning protection configuration of the differential arresters. Section 7 is the conclusion.
2. Computational Modeling Methods
2.1. Hybrid PEEC-MTL Methods
This paper proposes a method combining the partial element equivalent circuit and the multi-conductor transmission line (PEEC-MTL) [13,19] to enable detailed modeling and numerical simulations of complex overhead distribution line systems. The PEEC model converts electromagnetic field coupling between conductors into the derivation of mutual coupling parameters and the solution of equivalent circuit matrices. Its flexibility makes it particularly well-suited for modeling short conductors within complex distribution systems, such as poles, insulators, metal cross-arms, arresters, grounding electrodes, and other similar components. The MTL [20] theory is employed for modeling and analyzing parallel long conductors in distribution networks, such as three-phase lines and shield wires. Furthermore, by deriving the mixed potential integral equation (MPIE) [21,22] for both long and short conductors, we obtain the mutual coupling coefficient matrix between long and short conductors based on PEEC parameters. This enables optimized numerical solutions of mutual coupling effects across multi-scale conductor systems in complex overhead and underground distribution networks.
Based on the above modeling ideas, the time-domain equation of the hybrid MTL-PEEC equivalent circuit matrix is established as shown in Equation (1):
The topological coefficient matrix Asw in the leftmost integrated matrix describes the network topology of the conductor system, while the inductance coefficient matrix Lsw(x) and the potential coefficient matrix Psw(x) describe the mutual coupling coefficient matrix of the short conductor part in the distribution line network. To ensure calculation accuracy for non-ideal grounding scenarios, a simplified time-domain PEEC parameter calculation method with frequency independence and direct solvability is adopted. Compared with the traditional Sommerfeld integral frequency-domain solution method, we find it maintains high computational consistency when solving transient problems with frequency components of 10 MHz and below [22]. The subscript ‘d’ distinguishing the coefficient matrices Lsw,o and Lsw,d and Psw,o and Psw,d represents consideration of the delay effect. The parameter Rsw is the conductor resistance parameter matrix. The inductance parameter Llw and the capacitance parameter Clw describe the long line conductor parameter matrix derived from the MTL model. The parameter matrices Lm and Pm describe the mutual coupling effect between long and short conductors.
In the right matrix of Equation (1), Usw,s, and Isw respectively represent the equivalent voltage source induced by the incident electromagnetic field and the external current source parameter matrix injected at the nodes, corresponding to the LEMP effect and the direct lightning current injection effect considered in this study. The parameter τ denotes the delay parameter of conductor electromagnetic coupling. System-wide voltages and currents can be computed simultaneously through iterative calculation. By using the convolution integral expression for transient grounding impedance ξ(t) [23], we incorporated the frequency-dependent attenuation effect of non-ideal ground on surge propagation in conductors of the conventional MTL theory. The parameters Vlw, Vsw, Ilw, and Isw are the node voltages and branch currents for long line conductors and short line conductor segments, respectively. Time-domain numerical computation is implemented via the backward Euler method.
2.2. Lightning Current and Component Model
For modeling direct lightning current, this study uses the Heidler equation, recommended by the IEEE standard [24], as shown in Equation (2) [25].
where I0 is the peak current, taking 29.3 kA; η is the correction factor of lightning current amplitude, calculated by the formula , where n is the lightning current steepness parameter, taking 2; τ1 is the time constant that determines the rise time of the current, which is 1.44 μs; and τ2 is the time constant that determines the decay time of the current, taking 91.8 μs.
The arrester modeling in the distribution line system adopts the frequency-dependent equivalent circuit model recommended by IEEE [26]. The equivalent circuit of the model is shown in Figure 1a, and the V-I characteristic curve of the nonlinear resistance in the circuit is shown in Figure 1b [27]. The model parameters in the circuit of Figure 1a were calculated by estimated formulas [28], where V10 is the discharge voltage for a 10 kA, 8/20 s current (in kilovolts).

Figure 1.
Lightning surge arrester model recommended by the IEEE workgroup for 10 kV distribution line system. (a) Frequency variation equivalent circuit; (b) V-I characteristic curve of nonlinear resistance (data is provided in [27]).
The equivalent capacitance of the distribution transformer with arrester (SADT) is 50 nF [28]. Whether the insulator has a flashover is determined by the destructive effect (DE) model [29]. The insulator voltage integral D is expressed as Equation (3):
where Vins(t) is the insulator overvoltage, V0 is the starting voltage of the breakdown effect integral, t0 is the time when Vins (t) reaches V0, and k is the empirical constant of 1.0. The key parameters V0 and DEmax that determine the flashover characteristics of the model are fitted based on the test results of the insulation flashover V-I characteristic curve, which are set to 175 kV and 145 kV·μs. The insulator flashover is judged when D(t) ≥ DEmax.
3. Method Validation
The artificial rocket-triggered lightning experiment enables effective lightning generation, thus playing a vital role in lightning physics research. Studies employing this technology in distribution lines primarily focus on current distribution along conductors and overvoltage measurement on power lines.
3.1. The Equipment of the Rocket-Triggered Lightning Experiment
A double-circuit 10 kV test line was established in 2018 in Conghua, Guangdong, a thunderstorm-prone mountainous–plain transition area. There are 22 poles on the line, with 70 m pole spacings. Poles 1–17 (1122 m) form a double-circuit structure, while Poles 18–22 (391 m) are single-circuit, as shown in Figure 2 [30]. Due to terrain constraints, Circuit I follows an L-shaped route (Pole 1–22), while Circuit II terminates at Pole 17. The circuits maintain a 2.5 m horizontal separation with a vertical phase arrangement: Phase C (bottom conductor) at 10 m height and 0.9 m phase spacing. Key parameters include the following:

Figure 2.
The topology of the test line diagram.
- Soil resistivity: 180–200 Ω·m;
- Pole grounding resistance: 8–26 Ω;
- No shielded wires installed.
Circuit I terminates with transformer-arrester grounding, while Circuit II has arresters at every pole. Lightning current injection occurs at the C-phase between Poles 14 and 15 using rocket-triggered lightning. Overvoltage monitoring stations (S1, S5, S12) at Poles 2, 10, and 21 record three-phase conductor voltages.
3.2. Experimental and Simulation Waveforms
On 30 June 2019, two direct lightning strikes were injected into Phase C at 17:13 (Event F1906301713) and 17:15 (Event F1906301715). F1906301713 produced nine return strokes, F1906301715 generated five. Both events were recorded at S1 (Pole 2) and S5 (Pole 10), but S12 (Pole 21) missed Event F1906301713:
- First stroke in F1906301713;
- First two strokes in F1906301715;
- The nine strokes from F1906301713 were simulated using the hybrid MTL-PEEC method.
3.2.1. Tested Lightning Current Waveform
Figure 3 displays the return stroke current waveform measured with a coaxial shunt during Event F1906301715. Table 1 summarizes current waveform parameters for 14 strokes across both lightning events, defining:

Figure 3.
Lightning current waveform of Pole 10 in Event F1906301715.

Table 1.
Lightning current waveform parameters.
- Wavefront time: Duration from 10% to 90% of peak current
- Time-to-half-peak: Interval from 50% pre-peak to 50% post-peak
Measured peak currents ranged from 9.57 kA (RS2 in F1906301715) to 35.65 kA (RS1 in F1906301713). The colors in Figure 3 have distinguished the current pulses of the multiple return-stroke discharge process. Parameter intervals were quantified as follows: the Front Time is between 0.42 and 0.63 μs; the Time-to-half-peak is between 0.91 and 26.14 μs; and the Adjacent Return Time Interval is between 3.31 and 100.85 ms.
3.2.2. Hybrid MTL-PEEC Method Verification
Figure 4 compares simulated and measured overvoltage waveforms for Phase C at Pole 10, with corresponding waveform parameters quantitatively analyzed in Table 2. The displayed waveforms are arranged vertically in ascending order of lightning current amplitude, where sequential waveform traces are offset by 150 kV for better visual distinction. Table 2 provides direct comparisons of test versus simulation data for all nine return strokes, reporting voltage amplitude, wavefront time (t10/90), and time-to-half-peak (t50/50) parameters to validate the accuracy of the model.
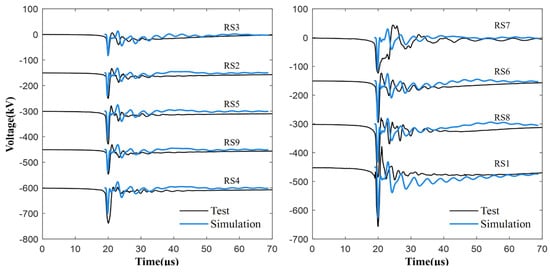
Figure 4.
Comparisons between the simulated and measured overvoltage waveforms for Phase C at Pole 10 of the test line system.

Table 2.
Comparison of test and simulation overvoltage parameters for Phase C of Pole 10.
Data in Table 2 indicate that the hybrid PEEC-MTL method yields a mean amplitude error of −9.8% for overvoltages at Pole 10, with mean deviations of −0.98 μs for t10/90 and 0.11 μs for t50/50 between simulated and measured values. This demonstrates strong agreement in waveform amplitude and oscillation characteristics with experimental results. The method proves particularly effective for simulating lightning currents featuring short wavefront times (characteristic of rocket-triggered lightning events), though the channel model fails to capture the initial reverse polarity pulse preceding the first voltage peak, which is a phenomenon associated with lightning leader development during channel formation.
4. Distribution Characteristics of Lightning Overvoltage
This section analyzes lightning overvoltage distribution characteristics in a Guizhou distribution line and its network at typical lightning strike points.
4.1. Line Configuration and Calculation Conditions
This section analyzes single-phase direct lightning overvoltage risk distribution in complex distribution networks. The study focuses on a Guizhou distribution line segment (Figure 5) terminating at a 10 kV/380 V transformer with arrester protection. The locations of the poles, the terminal transformers, and the matched impedance added in the simulation model have been shown with different labels. The numbers shown in Figure 5 represent the pole index. Without additional protection measures (conventional configuration), four lightning strike points are positioned at Poles 3, 6, 19, and 22, with strikes targeting both pole tops and phase wires. Simulation parameters include the first return-stroke current waveform, 10 Ω grounding resistance, and 0.01 S/m soil conductivity.
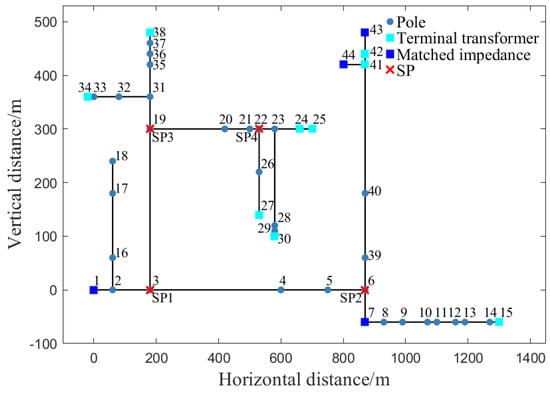
Figure 5.
Complex distribution network topology and calculation condition diagram.
4.2. Overvoltage Analysis of Typical Lightning Strike Points
Figure 6a,b displays the peak voltage distributions at four strike points, where lightning strikes phase wires or poles, respectively. Notably, the case of striking phase wires generates significantly higher voltage peaks at impacted poles than that of striking poles and has a different porosity of the insulator overvoltage. The insulator voltage is defined as the difference between the phase wire potential and the pole potential. When lightning strikes the phase wire, the overvoltage on the phase wire is negative, and the pole side is 0, so the insulator voltage is negative. Conversely, when lightning strikes the pole, the overvoltage on the phase wire is 0, and the pole side is negative, so the insulator voltage is positive. This difference stems from distinct energy injection paths: when lightning strikes the phase wire directly, energy is injected directly into the power line. The resulting overvoltage amplitude is determined by the magnitude of the lightning current and the conductor’s surge impedance. The typical range of the conductor’s surge impedance is from 400 to 500 Ω. Pole strikes discharge through grounding systems, with the overvoltage determined primarily by the grounding resistance and inductive voltage drop.
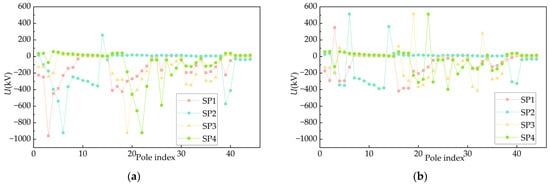
Figure 6.
Influence of lightning strike point on overvoltage amplitude of insulator: (a) lightning strike on wire; (b) lightning strike on pole.
Table 3 shows similar insulator flashover counts at SP1, SP2, and SP4 for both pole and phase wire strikes, but the counts at SP2 (Pole 6) differ. Flashover counts for pole strikes are significantly higher than those for phase wire strikes.

Table 3.
Statistics of the number of flashover poles at different lightning strike points.
5. Risk Distribution of Distribution Lines
5.1. Monte Carlo Algorithm and EGM
Due to the randomness of lightning strike events, distribution line topology significantly affects lightning distribution. The Monte Carlo method simulates a large number of lightning strikes, enabling a comprehensive examination of multiple factors and statistical analysis of the line’s lightning performance.
A large number of lightning strike events are generated within a given range. The simulation parameters include four key lightning parameters: strike location P(x, y), current wavefront time tr, peak current Imax, and current half-peak time td. Downward leader locations follow a uniform distribution across the calculation area, while other parameters follow lognormal distributions as governed by the probability function in Equation (4).
where M is the median value of the parameter x, and β is the logarithmic standard deviation. The value is shown in Table 4.

Table 4.
Monte Carlo probability function parameters.
The Monte Carlo method generates numerous random lightning strike events. The EGM classifies each event’s strike type. Only direct strikes are processed, and the annual flashover rate per pole is derived by synthesizing all direct strike events.
As shown in Figure 7, the EGM is used to divide lightning into direct lightning and induced lightning. The striking distance rc of the overhead conductor and the striking distance rg of the ground are calculated as shown in Equation (5) [24]:
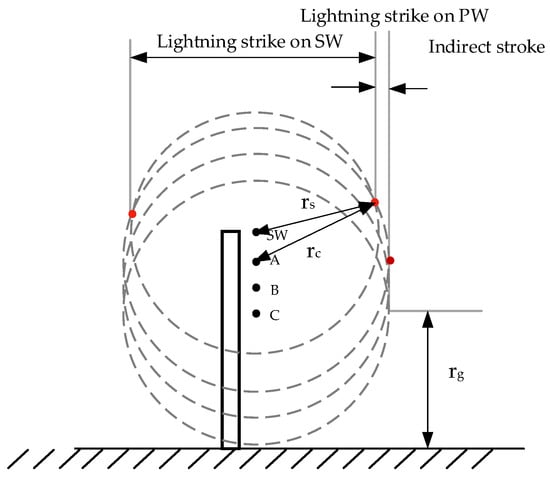
Figure 7.
Illustration of the EGM applied to a distribution line with shielded wires.
Based on a large number of random lightning strike events generated by the Monte Carlo method and the EGM, the type of lightning strike is determined, and direct lightning strike events are simulated, and the calculation formula of the annual flashover rate of the poles is given by Equation (6) [31].
where np_f is the number of lightning events that cause the flashover of Pole p, and Ntotal is the total number of generated events, which is 30,000 in this chapter; Ng is the annual lightning density of concern, and the fixed value of 5.0 is used in this paper. The area of the lightning strike is A.
5.2. Lightning Risk Distribution of Lines Under Typical Working Conditions
The line configuration matches Section 4.1. Figure 8 and Figure 9 show lightning strike distributions and annual direct lightning flashover rates. Figure 8 indicates the terminal line has the highest probability of direct strikes. In Figure 9, Poles 16 to 18, Poles 1 to 6, and Poles 19 to 21 exhibit higher annual flashover rates than others due to their topology and arrester configuration. Poles 17 and 18 (without nearby arresters near the terminal) show the highest rates, while other high-flashover poles are due to a greater distance to the terminal transformer.
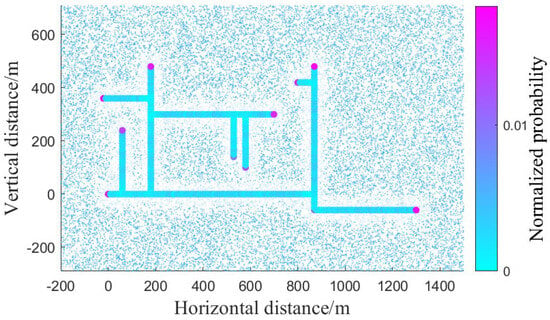
Figure 8.
The normalized probability of randomly generated induced lightning (red point) location and direct lightning location along the distribution network.
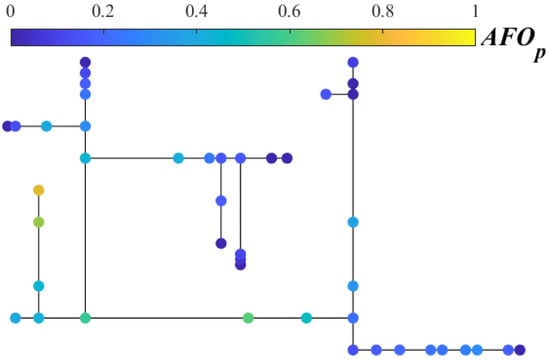
Figure 9.
Distribution line conventional configuration lightning risk distribution.
5.3. Influence of Grounding Resistance
This part studys the effects of grounding resistance on lightning risk distribution in complex distribution network topologies and annual flashover rates (AFOp). The soil conductivity remains constant at 0.01 S/m, with grounding resistance set to 10 Ω, 20 Ω, and 50 Ω.
Figure 10 compares the annual flashover rate of poles under different grounding resistances. As shown, a higher grounding resistance increases the AFOp for all poles in the line. At 20 Ω, the average AFOp across poles in the local topology is 0.2963, compared with 0.2568 at 10 Ω, with a relative increase of 0.1537. This demonstrates the significant impact of grounding resistance on the annual flashover performance of poles.
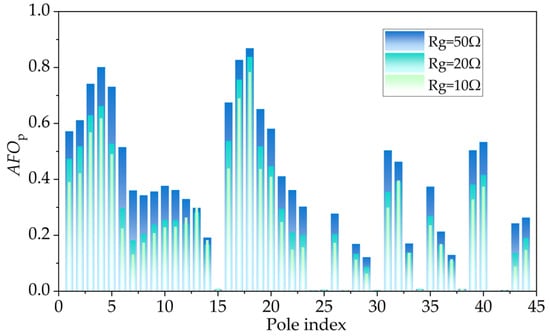
Figure 10.
Statistical chart of the annual flashover rate of the pole under different grounding resistances.
5.4. Influence of Electrical Conductivity
This section studies the influence of soil conductivity on the AFOp. The grounding resistance remains 10 Ω, with soil conductivity values of 0.005 S/m, 0.01 S/m, 0.02 S/m, and 0.05 S/m. Comparing Figure 9 and Figure 11, the poles with higher AFOp are No. 18, No. 19, No. 3, and No. 4 poles, and their nearby poles.
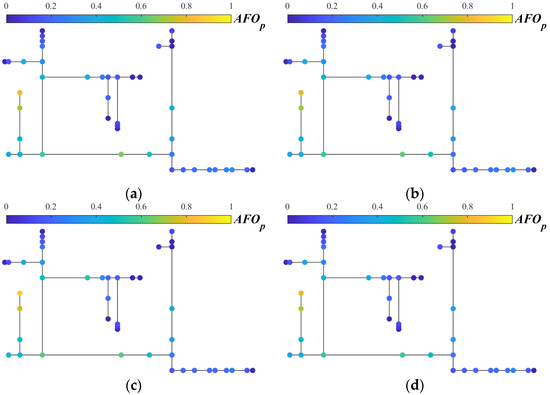
Figure 11.
Comparison of annual flashover rate of single pole under different soil conductivity: (a) σ = 0.005 S/m; (b) σ = 0.01 S/m; (c) σ = 0.02 S/m; (d) σ = 0.05 S/m.
Figure 12 compares the AFOp of poles under different soil conductivity conditions. Since data for 0.01 S/m and 0.02 S/m are similar, the 0.02 S/m results are not visible in the histogram. Figure 12 shows that higher soil conductivity reduces the AFOp. Comparing Figure 10 and Figure 12, grounding resistance changes affect the AFOp more significantly than changes in soil conductivity. This occurs because ground resistance primarily impacts lightning-injected overvoltages, while soil conductivity mainly influences LEMP-induced voltages, which are inherently lower.
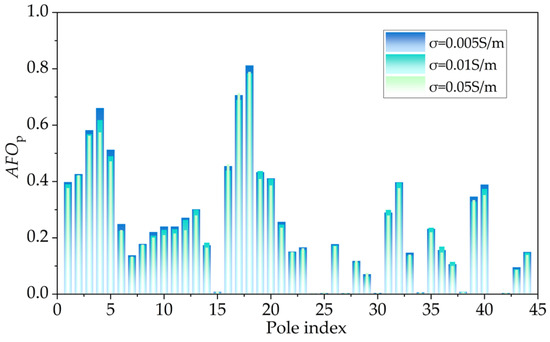
Figure 12.
Statistical chart of the annual flashover rate of the pole under different soil conductivity.
6. Differential Protection Measures
6.1. Lightning Arrester Configuration
This section examines how different arrester configurations affect direct lightning annual flashover performance in complex distribution networks. Grounding resistance is uniformly set to 10 Ω, with soil conductivity at 0.01 S/m. Given differential arrester installation between high-risk branches and medium-risk sections, we limit the number of arresters at branch points and progressively optimize protection based on effectiveness. Arrester locations and quantities for each configuration appear in Table 5 and Figure 13.

Table 5.
Lightning arrester configuration of each scheme.
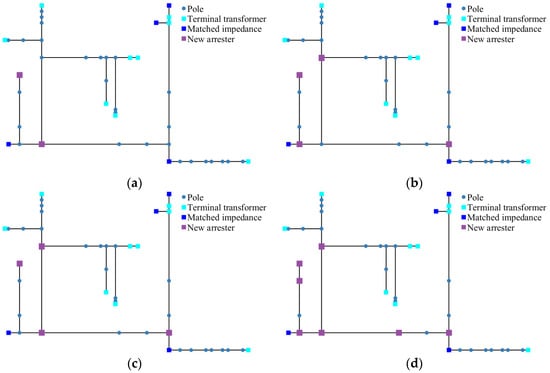
Figure 13.
Four kinds of configuration lightning arrester installation positions: (a) Configuration 1; (b) Configuration 2; (c) Configuration 3; (d) Configuration 4.
6.2. Comparison of Protective Effects of Different Configurations
Configuration 1: This configuration installs arresters on Poles 3 and 18. As Figure 6 indicates, Poles 17 and 18, as well as Poles 3 and 4 initially exhibit the highest AFO. Comparing Figure 9 and Figure 14a, it can be seen that significant reductions in the AFO occur for high-risk poles. All poles’ AFO are limited below 0.6; Poles 4, 5, and 19–21 show little change.
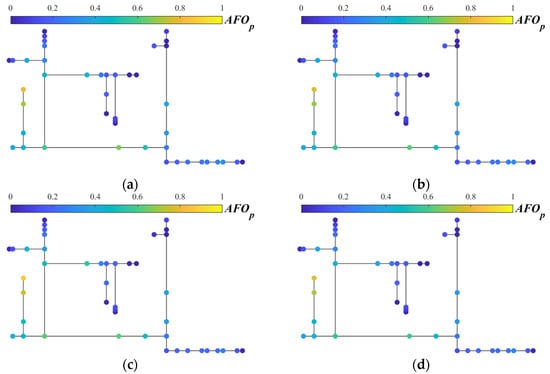
Figure 14.
Distribution of annual lightning flashover rate of pole, under different configurations of SA: (a) Configuration 1; (b) Configuration 2; (c) Configuration 3; (d) Configuration 4.
Configuration 2: Compared with Configuration 1, Configuration 2 moves an arrester from Pole 3 to Pole 2 and adds arresters at Poles 6 and 19. Comparing Figure 14b with Figure 14a shows that flashover rates for Poles 19 and 21 fall below 0.4. However, Poles 3 to 5 exhibit rate increases above 0.1 versus Configuration 1, with Pole 4 exceeding 0.6, not to expectations.
Configuration 3: Compared with Configuration 2, Configuration 3 moves an arrester back from Pole 2 to Pole 3. Figure 14c shows limited improvement: moving the arrester elevates annual flashover rates at Poles 2, 16, and 17, necessitating additional arresters.
Configuration 4: Compared with Configuration 3, Configuration 4 adds arresters at Poles 2, 4, and 17. Comparing Figure 14c,d shows that Configuration 4 effectively resolves the limitations identified in Configuration 3. All poles’ AFOs now achieve below 0.4, indicating effective control over both high-risk and medium-risk areas.
The protective effects of the four configurations are shown in Figure 15, serving as a reference for subsequent protection design. Practical implementation should also consider budgetary constraints.
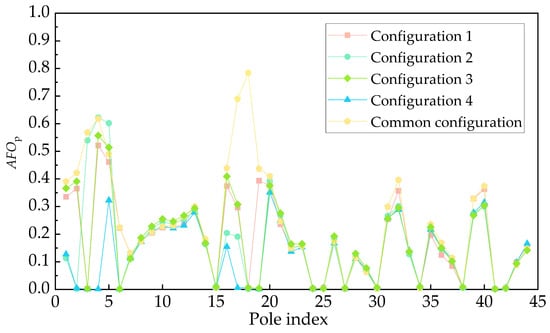
Figure 15.
Comparison of the effects of four arrester configuration methods.
It is worth noting that this study primarily introduces overvoltage simulation methods considering the lightning electromagnets effect (LEMP) in direct lightning stroke transient processes, and a differentiated lightning protection evaluation approach. To obtain quantitative results based on the actual protective performance of the products, the equivalent model of surge arresters, tailored to the active protective properties of specific arresters, along with the impact of line operating voltage and harmonics, must be considered in practical lightning protection assessments.
7. Conclusions
In this study, a numerical MTL-PEEC hybrid method proposed in our previous studies is validated by the rocket-triggered lightning experimental results for calculating direct lightning overvoltage. Then, this paper models a Guizhou distribution network using the MTL-PEEC method and analyses the direct lightning overvoltage, flashovers at typical lightning strike points, annual flashover rate risk distribution, and mitigation strategies. The conclusions are as follows:
Comparing lightning strikes on poles and phase wires shows that striking on the wires generates higher overvoltages but causes localized pole flashovers, while striking poles produces lower overvoltages with broader flashover ranges.
Arrester placement directly influences lightning risk distribution, where unprotected branch-end poles exhibit the highest AFOp (high-risk branches), areas distant from terminal arresters show medium risk, and the remaining zones constitute low-risk areas. Higher grounding resistance and lower soil conductivity increase AFOp, with grounding resistance exerting greater influence than soil conductivity.
Through risk-based arrester placement and progressive optimization, a target AFOp of below 0.4 is achieved for all poles by using seven additional arresters, though significant cost implications require budgetary consideration.
Author Contributions
Conceptualization, S.Z., X.X., L.J. and L.Q.; validation, S.Z., H.C. and Y.D. (Yuxuan Ding); writing—original draft preparation, S.Z., X.X., L.J. and C.Y.; writing—review and editing, H.C. and Y.D. (Yaping Du); visualization, S.Z.; supervision, H.C. All authors have read and agreed to the published version of the manuscript.
Funding
This work was supported by the China Southern Power Grid under project “Development of a Simulation Platform for the Transient Process of Strong Electromagnetic Pulse Coupling in New Energy Distribution Systems (Phase One)—Sub-project 1: Research on Spatio-Temporal Multi-Scale Simulation Technology for New Energy Distribution Networks Considering Probabilistic Risks of Strong Electromagnetic Pulses” (NO.GZKJXM20222352).
Data Availability Statement
The original contributions presented in the study are included in the article, further inquiries can be directed to the corresponding authors.
Conflicts of Interest
Authors Song Zhang, Xiaobin Xiao, Lei Jia, Huaifei Chen and Lu Qu were employed by the company China Southern Power Grid. The authors declare that this study received funding from China Southern Power Grid. The funder was not involved in the study design, collection, analysis, interpretation of data, the writing of this article or the decision to submit it for publication. The remaining authors declare that the research was conducted in the absence of any commercial or financial relationships that could be construed as a potential conflict of interest.
Abbreviations
The following abbreviations are used in this manuscript:
| EGM | Electro-geometric Model |
| LEMP | Lightning Electromagnetic Pulse |
| AFO | Annual Flashover Rate |
| PEEC | Partial Element Equivalent Circuit |
| MTL | Multi-conductor Transmission Line |
| MPIE | Mixed Potential Integral Equation |
References
- Takami, J.; Tsuboi, T.; Yamamoto, K.; Okabe, S.; Baba, Y. Lightning surge characteristics on inclined incoming line to substation based on reduced scale model experiment. IEEE Trans. Dielectr. Electr. Insul. 2013, 20, 739–746. [Google Scholar] [CrossRef]
- Miyazaki, T.; Okabe, S.; Aiba, K.; Hirai, T. Observation results of lightning performance in distribution lines. IEEJ Trans. Power Energy 2007, 127, 1293–1298. [Google Scholar] [CrossRef]
- IEEE Std C62.11-2018; IEEE Standard for Metal-Oxide Surge Arresters for AC Power Circuits (>1 kV) (Revision of IEEE Std C62.11-2012). IEEE: Piscataway, NJ, USA, 2018.
- GB/T 11032-2020; Metal-Oxide Surge Arresters without Gaps for A.C. Systems. China Standard Press: Beijing, China, 2020.
- Miyazaki, T.; Okabe, S. Experimental investigation to calculate the lightning outage rate of a distribution system. IEEE Trans. Power Deliv. 2010, 25, 2913–2922. [Google Scholar] [CrossRef]
- Cao, J.; Du, Y.; Ding, Y.; Qi, R.; Li, B.; Chen, M.; Li, Z. Comprehensive Assessment of Lightning Protection Schemes for 10 kV Overhead istribution Lines. IEEE Trans. Power Deliv. 2022, 37, 2326–2336. [Google Scholar] [CrossRef]
- Agrawal, A.K.; Price, H.J.; Gurbaxani, S.H. Transient response of multiconductor transmission lines excited by a nonuniform electromagnetic field. IEEE Trans. Electromagn. Compat. 2007, EMC-29, 119–129. [Google Scholar]
- Stracqualursi, E.; Araneo, R.; Faria, J.B.; Andreotti, A. Application of the transfer matrix approach to direct lightning studies of overhead power lines with underbuilt shield wires—Part I: Theory. IEEE Trans. Power Deliv. 2021, 37, 1226–1233. [Google Scholar] [CrossRef]
- Stracqualursi, E.; Araneo, R.; Faria, J.B.; Andreotti, A. Application of the transfer matrix approach to direct lightning studies of overhead power lines with underbuilt shield wires—Part II: Simulation results. IEEE Trans. Power Deliv. 2021, 37, 1234–1241. [Google Scholar] [CrossRef]
- Yamanaka, A.; Ishimoto, K.; Tatematsu, A. Direct Lightning Surge Analysis of Distribution Lines Considering LEMPs From Lightning Channel and Struck Pole in EMT Simulation. IEEE Trans. Electromagn. Compat. 2023, 65, 1340–1350. [Google Scholar] [CrossRef]
- Brignone, M.; Delfino, F.; Procopio, R.; Rossi, M.; Rachidi, F. Evaluation of power system lightning performance, Part I: Model and numerical solution using the PSCAD-EMTDC platform. IEEE Trans. Electromagn. Compat. 2017, 59, 137–145. [Google Scholar] [CrossRef]
- Yin, K.; Ghomi, M.; Zhang, H.; da Silva, F.F.; Bak, C.L.; Wang, Q.; Skouboe, H. The design and optimization of the down-lead system for a novel 400 kV composite pylon. IEEE Trans. Power Deliv. 2022, 38, 420–431. [Google Scholar] [CrossRef]
- Cao, J.; Du, Y.; Ding, Y.; Li, B.; Qi, R.; Zhang, Y.; Li, Z. Lightning surge analysis of transmission line towers with a hybrid FDTD-PEEC method. IEEE Trans. Power Deliv. 2021, 37, 1275–1284. [Google Scholar] [CrossRef]
- Ishimoto, K.; Tossani, F.; Napolitano, F.; Borghetti, A.; Nucci, C.A. Direct lightning performance of distribution lines with shield wire considering LEMP effect. IEEE Trans. Power Deliv. 2021, 37, 76–84. [Google Scholar] [CrossRef]
- Wang, X.T. Research on Upward Leader Initiation Criterion and Trip Warning Fusion Algorithm for Transmission Lines Under Lightning Strike. Ph.D. Thesis, Chongqing University, Chongqing, China, 2022. [Google Scholar]
- Matsuo, N.M.; Zanetta, L.C. Frequency of occurrence of lightning overvoltages on distribution lines. IEEE Trans. Power Deliv. 1997, 12, 845–852. [Google Scholar]
- Mikropoulos, P.N.; Tsovilis, T.E.; Pori, A.S. Evaluation of lightning attachment and coupling models for the estimation of the lightning performance of overhead distribution lines. In Proceedings of the 2014 International Conference on Lightning Protection (ICLP), Shanghai, China, 11–18 October 2014; pp. 1212–1216. [Google Scholar]
- Lei, T.; Shen, H.; Zhao, X.; Lu, T. A Simple Calculation Method for Lightning Stroke Flashover Rate of 10 kV Distribution Overhead Lines. In Proceedings of the 2022 IEEE 5th International Electrical and Energy Conference (CIEEC), Nanjing, China, 27–29 May 2022; pp. 4394–4397. [Google Scholar]
- Cao, J.; Du, Y.; Ding, Y.; Qi, R.; Li, B.; Chen, M.; Li, Z. Practical schemes on lightning energy suppression in arresters for transformers on 10 kV overhead distribution lines. IEEE Trans. Power Deliv. 2022, 37, 4272–4281. [Google Scholar] [CrossRef]
- Paul, C.R. Analysis of Multiconductor Transmission Lines, 2nd ed.; Wiley-IEEE Press: Hoboken, NJ, USA, 2007. [Google Scholar]
- Yeung, C.; Ding, Y.; Zhou, Q.; Du, Y.; Zhang, S.; Qi, R.; Jia, L. An Accelerated Multi-Time-Scale Solution of Power Systems Under Multiple Lightning Strokes Events. IEEE Trans. Power Deliv. 2025, 40, 1889–1898. [Google Scholar] [CrossRef]
- Ding, Y.; Du, Y.P.; Chen, M. Lightning surge propagation on a grounded vertical conductor. IEEE Trans. Electromagn. Compat. 2017, 60, 276–279. [Google Scholar] [CrossRef]
- Rachidi, F.; Loyka, S.L.; Nucci, C.A.; Ianoz, M. A new expression for the ground transient resistance matrix elements of multi-conductor overhead transmission lines. Electr. Power Syst. Res. 2003, 65, 41–46. [Google Scholar] [CrossRef]
- IEEE Std 1410-2010; IEEE Guide for Improving the Lightning Performance of Electric Power Overhead Distribution Lines. IEEE: Piscataway, NJ, USA, 2010.
- Tossani, F.; Napolitano, F.; Borghetti, A.; Nucci, C.; Piantini, A.; Kim, Y.-S.; Choi, S.-K. Influence of the presence of grounded wires on the lightning performance of a medium-voltage line. Electr. Power Syst. Res. 2021, 196, 107206. [Google Scholar] [CrossRef]
- IEEE Working Group. Modeling of metal oxide surge arresters. IEEE Trans. Power Deliv. 1992, 7, 302–309. [Google Scholar] [CrossRef]
- Martinez, J.A.; Durbak, D.W. Parameter determination for modeling systems transients-Part V: Surge arresters. IEEE Trans. Power Deliv. 2005, 20, 2073–2078. [Google Scholar] [CrossRef]
- Cao, J.; Du, Y.; Ding, Y.; Qi, R.; Chen, M.; Li, Z.; Zhao, X.; Andreotti, A. Lightning protection with a differentiated configuration of arresters in a distribution network. IEEE Trans. Power Deliv. 2022, 38, 409–419. [Google Scholar] [CrossRef]
- Darveniza, M. The generalized integration method for predicting impulse volt-time characteristics for non-standard wave shapes-a theoretical basis. IEEE Trans. Electr. Insul. 1988, 23, 373–381. [Google Scholar] [CrossRef]
- Wang, J.; Wang, S.; Cai, L.; Lu, D.; Li, Q.; Zhou, M.; Fan, Y. Observation of Induced Voltage at the Terminal of 10 kV Distribution Line by Nearby Triggered Lightning. IEEE Trans. Power Deliv. 2020, 35, 1968–1976. [Google Scholar] [CrossRef]
- Cao, J.; Wang, J.; Du, Y.; Andreotti, A.; Ding, Y.; Cai, L.; Fan, Y.; Zhou, M. Performance of Annual Flashover Rate at Individual Poles in a Distribution Network Due to Indirect Lightning. In Proceedings of the International Symposium on Insulation and Discharge Computation for Power Equipment, Wuhan, China, 27–28 May 2023; Springer Nature: Singapore, 2023; pp. 515–524. [Google Scholar]
Disclaimer/Publisher’s Note: The statements, opinions and data contained in all publications are solely those of the individual author(s) and contributor(s) and not of MDPI and/or the editor(s). MDPI and/or the editor(s) disclaim responsibility for any injury to people or property resulting from any ideas, methods, instructions or products referred to in the content. |
© 2025 by the authors. Licensee MDPI, Basel, Switzerland. This article is an open access article distributed under the terms and conditions of the Creative Commons Attribution (CC BY) license (https://creativecommons.org/licenses/by/4.0/).