Abstract
Flow field design in proton exchange membrane fuel cells (PEMFCs) is a critical issue, as it plays an important role in governing reactant transport dynamics and cell performance. In this work, numerical studies of a single Tesla-valve flow field were conducted. The influence of loop radius, channel angle, and channel height on the performance of PEMFCs were fully explored. Then, aiming to maximize the output current density, this study optimized the Tesla-valve flow field configuration through a framework that integrates Gaussian process modeling with a Genetic Algorithm (GA). The approach efficiently identifies the optimal geometric parameters, highlighting effective synergy between the surrogate model and intelligent evolutionary optimization for enhanced performance. Simulation results show that the current density at 0.4 V and the highest power density have been improved by more than 10% compared to the baseline design for both forward and reverse flow. The optimized Tesla valve design has been compared with conventional parallel and serpentine flow fields of the same flow area. Results show that, despite the larger pressure drop for the single channel case—which is due to the insufficient length of the serpentine channel—the Tesla-valve flow field demonstrated superior performance in other metrics, including current and power density, under both flow directions.
1. Introduction
With the growing global emphasis on environmental protection, hydrogen energy is drawing increasing attention. The proton exchange membrane fuel cell (PEMFC), which employs hydrogen as its primary fuel source to convert chemical energy into electrical energy, is of high converting efficiency and causes zero pollutant emissions [1,2,3,4]. Recognized as a promising energy conversion technology, the PEMFC has attracted considerable research interest dedicated to performance enhancement.
Extensive research has been conducted on the critical components of the PEMFCs, including the membrane [5,6], catalyst layer (CL) [7], gas diffusion layer (GDL) [8], and bipolar plates (BPs) [9,10,11,12]. Among these components, much attention has been devoted to the investigation of bipolar plates, particularly their flow field design [13,14,15,16,17]. The large-scale commercialization of PEMFCs requires higher power and current densities, and a well-designed flow field configuration can provide uniform distribution of the reactant gases, facilitate effective water management, and improve reactant utilization efficiency, thereby increasing the output power and lifespan of the cell. For example, at high-operating current densities, the massive accumulation of liquid water will lead to flooding and impede the gas diffusion, resulting in rapid degradation of cell performance. Accordingly, improving the water management ability of the flow field is imperative for pursuing better cell output performance [18]. The flow fields can be categorized into two types: two- and three-dimensional channels.
The conventional parallel (CPFF) and serpentine (CSFF) flow fields are two widely used 2D benchmarks in PEMFC studies [19,20]. CPFF offers a low pressure drop but suffers from nonuniform reactant distribution [21], whereas CSFF ensures better distribution at the expense of a higher pressure drop [22]. Based on these two flow fields, researchers have pursued various strategies to enhance PEMFC performance through flow-field optimization. Lim et al. [23] developed an improved parallel flow field inspired by bifurcation manifold principles. Kumar et al. [24] showed that flow fields with triangular and semi-circular cross-sections could improve the hydrogen consumption of the fuel cell. He et al. [25] investigated the performance of the interdigitated flow field and indicated that the design could distribute the reactants uniformly and reduce the electrode flooding. Another way to improve the traditional 2D flow fields is to add obstacles into the channels to create a localized 3D flow pattern [26]. Effects of baffle height and location on the performance of the fuel cells are studied in [27]. Fan et al. [28] proposed a multi-plate structure channel and an integrated structure channel, and found that the plate angle played the major role in affecting the performance of PEMFCs.
Researchers have also explored bio-mimetic 2D flow fields that imitate natural flow and diffusion mechanisms. Ruan et al. [29] proposed a Murray’s law-based design, which outperformed conventional fields with more uniform reactant distribution and improved water management. Iranzoa [30] explored the application of bio-mimetic flow fields inspired by structures such as fractals, leaves, and lungs, and compared their performances.
Three-dimensional flow field designs have emerged as a promising approach to enhance the performance of PEMFCs, but are usually accompanied by an increased pressure drop [31]. In [32], a novel 3D flow field was developed and analyzed. It was revealed that increasing the porosity of the 3D fine-mesh structure will promote the PEMFC output performance as the mass velocity is increased and the pressure drop is reduced. A 3D-wave parallel flow field (WPFF) was proposed in [33], which was proven to facilitate the oxygen transfer to GDL and CL, and to benefit the water management. Toyota Mirai successfully employed the hydrogen fuel cell of a 3D flow field in application [34], and has an enhanced current density compared with other fuel-cell vehicles of the same year. Although 3D flow fields may exhibit better performances, their practical applications are significantly constrained by the highly challenging manufacturing difficulty and cost [35].
In recent years, Tesla-valve flow fields (TVFF) have also gained attention. The Tesla valve is a check valve without any moving parts, and it generates significantly different flow resistance and vortex structures between the forward and reverse flow directions through its static geometry, thereby enabling directional control of mass transfer and impedance regulation. The Tesla valve has shown promising applications in both macro- and micro-fluidic systems. Wang et al. investigated the diodicity enhancement mechanism in multi-stage Tesla valves through numerical simulations and experiments, and it was shown that increasing the number of valve units significantly improves diodicity, although this effect gradually saturates with further stages [36]. Ni et al. significantly enhanced the thermal performance and temperature uniformity of liquid cooling plates by incorporating Tesla-valve structures into capillary flow channels. By optimizing the aspect ratio between the valve and branch structures, an excellent balance was achieved between thermal dissipation efficiency and pressure drop [37]. Qian et al. focused on multi-stage Tesla valves in high-pressure hydrogen decompression, which revealed that, under compressible flow conditions, increasing the number of valve stages reduces the maximum Mach number, thereby lowering the risk of aerodynamic noise at the cost of increased exergy loss. Furthermore, an empirical correlation between the number of valve stages, pressure ratio, and maximum Mach number was established, providing a theoretical basis for the design of Tesla valves in hydrogen energy systems [38]. In [39], the Tesla valve with a symmetric structure was proposed. It was shown that a better symmetry led to better one-direction flow characteristics, and the scaling law between the pressure drop and parameters of the Tesla valve was obtained. Forward and reverse flow in the Tesla valve exhibit different flow characteristics, and it is a promising fuel cell channel design. Gong et al. [40] conducted both numerical and experimental studies on the performance of multi-stage Tesla-valve (MSTV) flow fields. It was shown that the net power density of the reverse MSTV flow field was higher than that of CPFF and CSFF. Through the inlet commutation strategy between the forward and reverse flow, the net power could be further improved under all working conditions. Guo et al. [41] conducted a numerical study on both symmetric and asymmetric Tesla-valve flow fields (TVFF) without islands. Results showed that TVFF had a more uniform distribution of velocity, pressure, and mass fraction of oxygen and water, resulting in a better output performance than the straight channel. The influence of flow rate on the output voltage and pressure drop of PEMFC was also explored.
In addition to operation conditions, the geometric parameters also have a major effect on the performance of the Tesla valve. The effects of how the angles may affect the Tesla valve were studied in [42]. Hu et al. [43] designed a Tesla valve with a novel tapering/widening structure and investigated the influence of multiple factors, including geometry parameters and operation conditions on the flow characteristics of the Tesla valve. A parametric study in terms of cross-section, inner curve radius, and valve angle of a single Tesla valve on the pressure drop and velocity of hydrogen decompression was studied in [44]. Guo et al. [45] studied five sets of Tesla valves with different valve angles and channel radius, as well as the existence of an island, and compared the polarization curves, flow field characteristics, and reactant distribution. However, how the geometry parameters of the Tesla value may affect the performance of PEMFC is not fully explored, and how to optimize the parameters simultaneously is not studied.
In this study, the individual impact of three geometry parameters of the Tesla valve, i.e., the angle between the straight channel and the loop channel, the radius of the loop, and the height of the channel, on the performance of PEMFC was investigated. A surrogate model that incorporates the three parameters as the inputs and the current density at 0.4 V as the output was developed for optimization, and the best combination of the parameters is searched.
The remainder of this paper is organized as follows. Section 2 introduces the numerical model employed in this study. Section 3 discusses the individual effects of the three geometric parameters on PEMFC performance. The optimal configuration is derived and presented in Section 4. Section 5 provides a comparative analysis with CPFF and CSFF. Finally, Section 6 concludes this article.
2. Numerical Simulation
2.1. Flow Field Model
The geometric configuration of the Tesla valve is illustrated in the upper-left corner of Figure 1. There are straight channels and a loop channel. The schematic also demonstrates both reverse flow (TV-R: Tesla valve-Reverse) and forward flow (TV-F: Tesla valve-Forward). The channel angle (β) and the radius of the loop channel (loop radius R) are two critical parameters that may affect the characteristics of a Tesla-valve flow field. The cross-sectional area, determined by the channel height (H) when maintaining a constant channel width (W), is also a critical parameter.
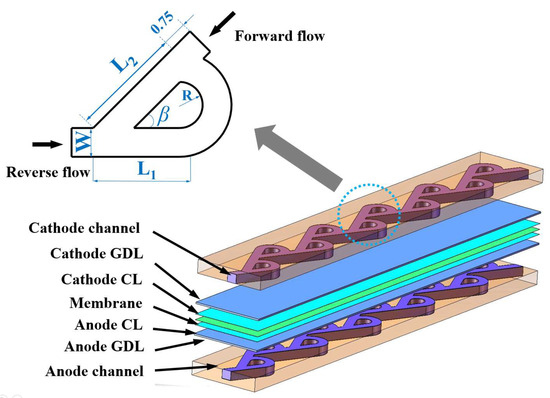
Figure 1.
Geometric model of a Tesla valve and a Tesla-valve flow field channel.
As depicted in Figure 1, a serial connection of multiple Tesla valve units results in a Tesla-valve flow field. It is noted that the same flow field configuration for both the anode and cathode is employed in this study to facilitate a thorough investigation of the Tesla-valve flow field characteristics. To save computation time, a single flow field with ten Tesla valve stages was established. The model is composed of the membrane as well as the CLs, GDLs, and flow channels of the anode and cathode, respectively. Detailed geometric specifications of the flow field are listed in Table 1.

Table 1.
Geometric parameters of the model.
2.2. Numerical Model
The three-dimensional Tesla valve PEMFC model was evaluated using the FEM method, and the key governing equations are presented below [46,47].
2.2.1. Mass and Momentum Conservation Equation
The mass conservation equation is shown by the following:
where ε is the porosity of porous media, ρ is the density of the fluid, is the velocity vector of the fluid, and Sm is the source term. The momentum conservation equation is as follows:
where p is the fluid pressure, u is the kinetic viscosity, and Su is the momentum source term.
2.2.2. Energy Conservation Equation
The energy conversion equation is as follows:
where cp is the specific heat capacity, T is the temperature, ST is the source term, and Keff is the effective thermal conductivity.
2.2.3. Gas Species Conservation Equation
To describe the convection–diffusion–reaction process of gases in porous media and develop a unified, multiphysics-coupled mathematical model, the gas species conservation equation is introduced. For gas K in porous media, its conservation can be expressed as follows:
where Ck is the volume fraction, Sk is the source term, and Deff is the effective diffusion coefficient.
2.2.4. Maxwell–Stefan Multi-Component Diffusion Equations
To predict multi-component diffusion phenomena, the Maxwell–Stefan equation is applied:
where ω is the mass fraction of component j/k, Djk is the diffusion coefficient describing the diffusion capability between components j and k, and xk is the mole fractions of component k.
2.2.5. Butler–Volmer Equation
The electrochemical reactions are solved by the Butler–Volmer equation:
where i is the current density, i0 is the exchange current density, αc is the cathode charge transfer coefficient, αa is the anode charge transfer coefficient, z is the number of electrons transferred in the electrochemical reaction, F is the Faraday’s constant (96,485 C/mol), η is the activation over-potential (defined as η = E − Eeq, where E is the Electrode Potential, and Eeq is the Equilibrium Potential), and R is the universal gas constant (8.314 J/(mol∙K)).
2.2.6. Current Conservation Equation
The current conservation equation is as follows:
where σ is the electrical conductivity of solid phase (sol) and electrolyte phase (mem), and Φ is the potential.
2.2.7. Gas–Liquid Pressure Equation
To accurately describe the transport of liquid water within the porous electrodes of PEMFC, a porous media model based on Darcy’s law is employed to formulate the liquid-phase mass conservation equation:
where s is the saturation of liquid water, K is the absolute permeability, Kr is relative permeability, μl is the dynamic viscosity of liquid water, pp is the gas-phase pressure, pc is the capillary pressure, and S is the source term for gas-phase condensation (gl) and liquid-phase evaporation (ld), respectively.
The source terms for all the equations are listed in Table 2.

Table 2.
Source terms of the governing equations.
It should also be noted that employing advanced parameter identification methods can significantly improve the reliability of channel simulation parameters and improve model accuracy, as demonstrated in [48] for fuel cell voltage models.
2.3. Boundary Conditions
The anode feed is a mixture of hydrogen and water vapor, while the cathode feed is a mixture of air and water vapor, all considered as ideal gases. At the channel inlet, the mass velocity, relative humidity, and temperature are specified. The pressure condition is applied at the channel outlet. No-slip and zero-flux conditions are imposed on all the external boundaries.
The working conditions are listed in Table 3.

Table 3.
Operating conditions of PEMFC.
2.4. Grid Independence Verification
To balance between model accuracy and computation efficiency with regard to the mesh density, three numerical simulations of different grid sizes were conducted, as shown in Table 4. The maximum grid sizes are listed, and it should be noted that in regions with pronounced curvature or bending, the mesh undergoes a reduction in grid size. The output current density at a voltage of 0.4 V was compared. The choice of 0.4 V was based on the following considerations: (1) maximizing the current density at a low voltage generally corresponds to an overall upward shift in the entire polarization curve; and (2) operating at a low voltage allows for a better distinction among output current density responses which facilitates the construction of a more accurate surrogate model. The relative error between case 2 and case 3 is only 0.21%. As case 2 presents a good trade-off of model accuracy and computation efficiency, it was selected in the subsequent simulations.

Table 4.
Grid independence verification.
2.5. Model Validation
To ensure the reliability of the numerical model and parameter settings, a CPFF numerical model was established and compared with results from the experimental data in [49]. The operating conditions applied in the model are summarized in Table 3. As shown in Figure 2, the two polarization curves demonstrate close agreement, confirming the accuracy and credibility of the numerical model and parameter settings employed in this study.
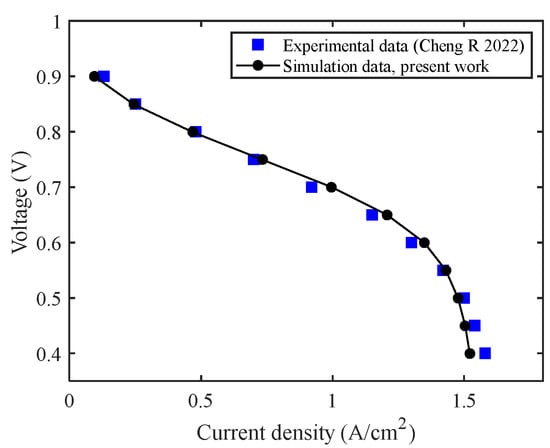
Figure 2.
Comparison of simulation result with experiment data from [49].
3. Influence of Geometry Parameters on PEMFC Performance
In this section, the influences of three critical geometry parameters, namely, the loop radius (R), channel angle (β), and channel height (H), on the performance of PEMFC are analyzed under reverse flow (TV-R) conditions. The analysis focuses on transport characteristics, including velocity fields, pressure distributions, and transport of oxygen and water, and the results are based on a voltage of 0.4 V.
3.1. Influence of Loop Radius
To investigate the influence of loop radius R on the performance of PEMFC, four cases are considered: R [0.5, 0.6, 0.7, 0.8] mm. It is noted that the parameter ranges are determined based on two key considerations: (1) to capture how minor dimensional variations may affect PEMFC performance, particularly in loop radius, accounting for potential material surface wear during high-cycle operation; and (2) for convenience of optimization, as broad parameter ranges could compromise model sensitivity, precision, and optimization results. The channel height H is fixed at 1 mm, and the channel angle β is fixed at 45°.
The polarization curves shown in Figure 3 indicate performance discrepancies within the low-voltage range of [0.4, 0.6] V as the loop radius varies. Under the fixed configurations of channel angle and channel height, an increase in loop radius will result in a higher current density.
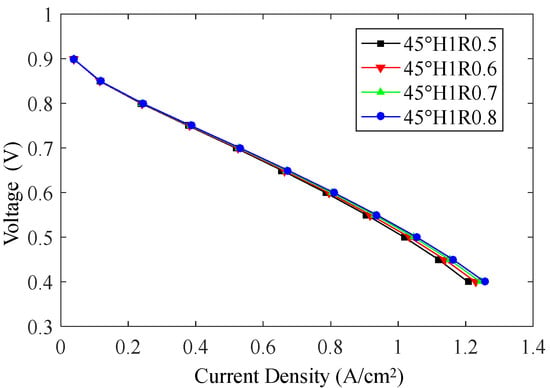
Figure 3.
Polarization curves with variation in loop radius.
The velocity contours in Figure 4a demonstrate that as the loop radius increases, both the maximum velocity and the area of high-velocity regions within the flow channels are decreased. The high-velocity regions are predominantly located in the loop channels, particularly at the inlet straight channels of each Tesla valve, whereas the low-velocity regions appear mainly in the straight channels, especially near the bifurcation and confluence zones.
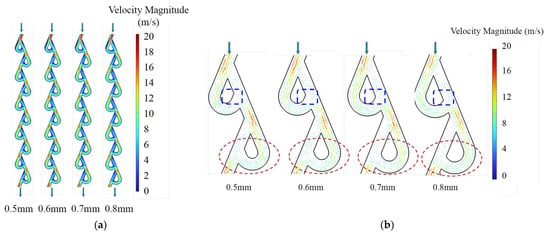
Figure 4.
(a) Velocity contours and (b) velocity vector distribution at the middle plane of the cathode channel with different channel radius. The downward arrows indicate the gas flow direction.
The velocity vector of the third and fourth Tesla valve stages is shown in Figure 4b. It was revealed that when the radius is small, the gas in the loop channel undergoes abrupt changes in the flow direction, resulting in discontinuous velocity streamlines, as highlighted by regions with elliptical enclosures. As the radius increases, the gas flow within the loop channel becomes more stable, leading to smoother and more continuous velocity field streamlines. Additionally, at the confluence of the flows from the straight channel and loop channel, a stagnation zone appears. The area of the stagnation zone decreases with the increase in channel radius, as illustrated by the regions enclosed with rectangular outlines.
To demonstrate the mass transport performance of the flow channel, that is, the delivery of oxygen from the channel through the GDL to the catalyst layer, and the concurrent removal of water in the opposite direction, the total oxygen and water flux at the GDL/CL interface are presented in Figure 5. Both parameters exhibit a decreasing trend along the flow direction, with no significant variation in mass transport performance observed across different radii. Notably, higher flux densities of both oxygen and water are localized within the loop channels, demonstrating superior reactant transport performance compared to the straight channels.
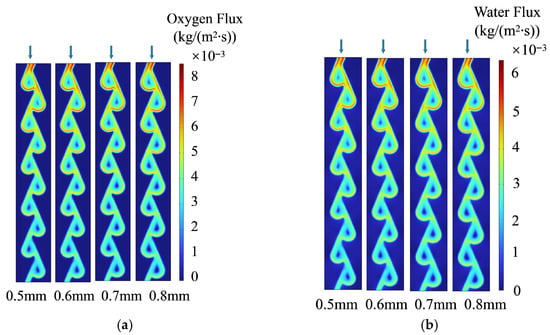
Figure 5.
Total flux of (a) oxygen and (b) water at the interface of CL and GDL with different loop radius. The downward arrows indicate the gas flow direction.
3.2. Influence of Channel Angle
Four sets of channel angles β [35°, 40°, 45°, 50°] are compared with the loop radius set as 0.8 mm and the channel height set as 1 mm. Figure 6 shows that variation in channel angles causes distinct variations in the polarization curves across a broad voltage range. The current density exhibits an initial decrease when the channel angle is increased from 35° to 40°, followed by a subsequent improvement as the angle is further augmented to 50°.
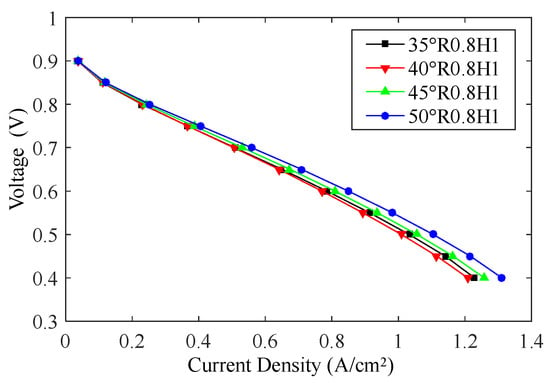
Figure 6.
Polarization curves with variation in channel angle.
The velocity contours in Figure 7a reveal that the channel angle of 35° is characterized by a more concentrated gas flow within the loop channels, resulting in the most extensive high-velocity regions. For the remaining three cases, both the peak velocity and area of high-velocity regions are enhanced with the increase in channel angle.
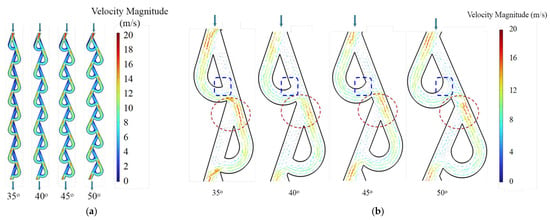
Figure 7.
(a) Velocity contours and (b) velocity vector distribution at the middle plane of the cathode channel with different channel angles. The downward arrows indicate the gas flow direction.
The velocity vector of the third and fourth Tesla valve stages is shown in Figure 7b. It was revealed that the velocity field streamlines are continuous across all cases. Nonetheless, as highlighted by the elliptical enclosure, a smaller channel angle tends to facilitate the formation of stagnation zones at the bifurcation zones. In contrast, a larger channel angle promotes the development of stagnation zones near the confluence zones, as highlighted by the rectangular enclosures.
The total flux of oxygen and water at the interface of GDL and CL is presented in Figure 8. It demonstrates that a smaller channel angle leads to a more uniform distribution of oxygen and water in the upstream of the flow channel.
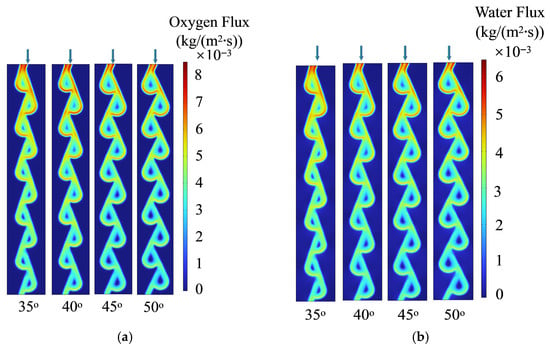
Figure 8.
Total flux of (a) oxygen and (b) water at the interface of CL and GDL with different channel angles. The arrows indicate the gas flow direction.
Notably, an increase in the loop radius and channel angle inherently leads to an increase in the gas–channel contact area. In Figure 9, the current density and average flux of oxygen and water in relation to the gas–channel contact area (also loop radius and channel angle) are presented. It reveals that the increase in loop radius and the channel angle beyond 40° both lead to a rise in the average flux of oxygen, and, consequently, lead to a higher current density. The average water flux follows a similar trend. Although it exhibits a positive correlation between current density (and oxygen flux) and gas–channel contact area, except for the case of channel angle of 35°, the substantial influence of loop radius and channel angle on the velocity profiles within the flow channels cannot be neglected, as these parameters critically affect the mass transport characteristics and overall fuel-cell performance.
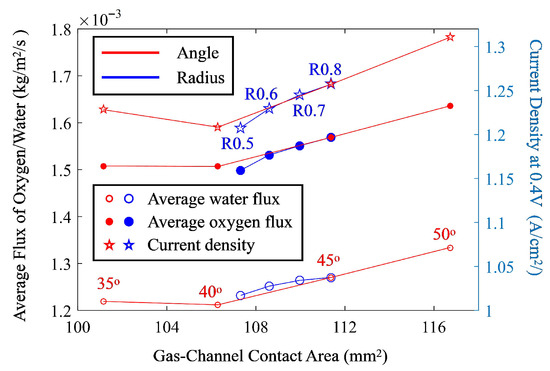
Figure 9.
Average flux of oxygen and water and current density at the interface of CL and GDL.
3.3. Influence of Channel Height
Four channel heights are compared: H [0.4, 0.6, 0.8, 1] mm, while the loop radius R is set as 0.8 mm and the channel angle β is set as 45°. The polarization curves in Figure 10 also indicate performance variations in the low-voltage area. Specifically, the channel height of 0.6 mm and 0.8 mm shows comparable performances, both outperform the other two cases, whereas a channel height of 0.4 mm shows the lowest output current density.
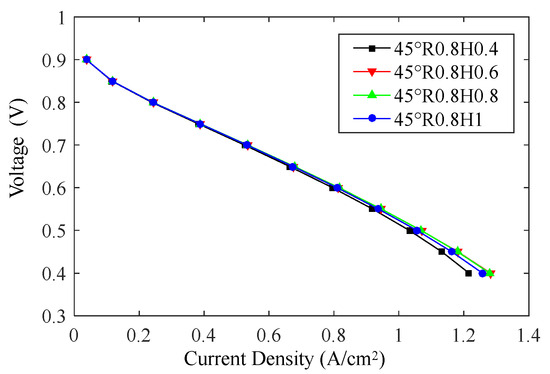
Figure 10.
Polarization curves with variation in channel height.
An increased channel height corresponds to a larger cross-sectional area, which directly reduces the flow velocity as evidenced by Figure 11. Figure 11a shows that a smaller channel height results in a larger area of high-velocity zones and also a higher velocity in the straight channels. The velocity vector presented in Figure 11b provides further insight into the flow characteristics, indicating that while channel height variations minimally affect the continuity of velocity streamlines, they substantially influence streamline density.
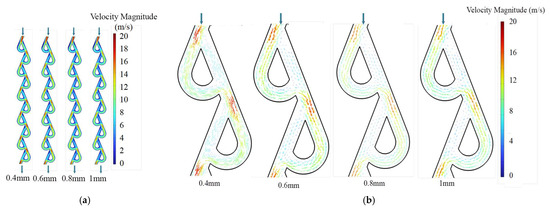
Figure 11.
(a) Velocity contour and (b) velocity vector distribution at the middle plane of the cathode channel with different channel heights. The downward arrows indicate the gas flow direction.
A decrease in channel height increases the flow resistance and exacerbates the non-uniform distribution of oxygen and water, as shown in Figure 12. The total flux of oxygen and water at the downstream for the channel height of 0.4 mm is smaller than in the other cases, and the mass transport limitation consequently leads to a decreased output current density. The average oxygen and water flux for the different channel heights are [1.514, 1.606, 1.602, 1.569] × 10−3 and [1.269, 1.313, 1.300, 1.270] × 10−3 kg/(m2s), respectively.
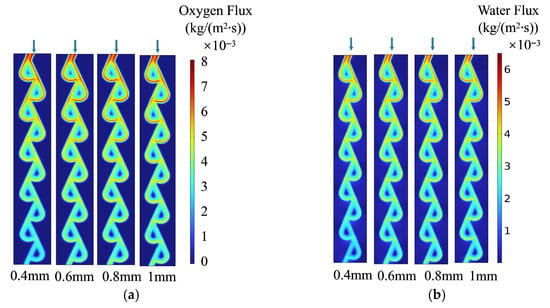
Figure 12.
Total flux of (a) oxygen and (b) water at the interface of CL and GDL with different channel heights. The downward arrows indicate the gas flow direction.
The pressure distribution with variation in three parameters is demonstrated in Figure 13. It shows that the current density has a positive correlation with pressure drop as channel angle and channel height (except for 0.4 mm) vary, while it has a negative correlation with pressure drop as loop radius varies. This underscores the necessity of considering the couplings among geometric parameters for evaluating their impact on fuel-cell performance and optimizing fuel-cell performance.
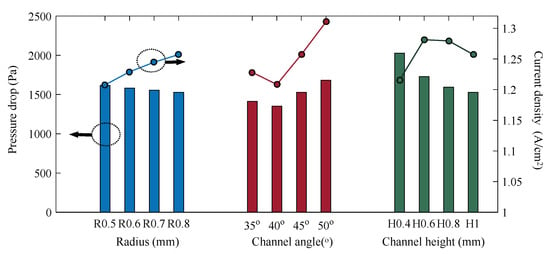
Figure 13.
Pressure distribution.
4. Design Optimization of Geometry Parameters
While the preceding single-factor analysis provides valuable insights into individual parameter effects on the performance of PEMFCs, it did not account for the couplings among the three geometric parameters, which restricts the ability to determine the optimal configuration of the Tesla valve. To address this issue, a systematic multi-parameter optimization framework was implemented. First, a surrogate model was established to compute the nonlinear relationships between input geometric parameters and output current density, and then the Genetic Algorithm (GA) was employed to obtain the optimal design.
4.1. Surrogate Model
A surrogate model serves as an approximation of the high-fidelity numerical model, allowing for more efficient analysis and optimization while maintaining an acceptable level of accuracy. The surrogate model takes the three previously discussed geometric parameters as inputs and the current density at 0.4 V as the output. To improve the generalization ability of the surrogate model, the diversity of the training data needs to be ensured. A comprehensive dataset comprising 43 (four levels for each input) samples generated from the numerical model is utilized to train the surrogate model.
A Gaussian process (GP) is a non-parametric Bayesian approach used for regression and function approximation, and is highly flexible and capable of capturing complex patterns in data. In this work, a GP-based surrogate model is implemented, represented as y = f(x), where x = [R, β, H] is the vector of parameters to be optimized and y is the output current density that should be maximized. The resulting standard deviation (std) for the training data is 0.0028, indicating a sufficiently small training error to ensure the accuracy of the model.
4.2. Parameter Optimization and Results
Based on the surrogate model f(x), a constrained optimization problem is formulated as follows:
where lb = [0.5 mm, 35°, 0.4 mm] and ub = [0.8 mm, 50°, 1 mm] are the lower and upper bounds for each parameter, and they define the feasible searching space of the optimization problem. The objective function is formulated as the minimization of −f(x) such that the output current density is maximized.
GA is adopted to solve the defined optimization problem. The optimal solution converged to x = [0.6999 mm, 49.999°, 0.6000 mm], which can be rounded to x = [0.7 mm, 50°, 0.6 mm]. The optimal solution shows that coupling exists among the loop radius and channel angle, as the optimal radius does not align with its individual optima when the channel angle is 45°, as discussed in Section 3. The corresponding output current density is 1.4291 A/cm2. Based on the optimal solution, a numerical model is constructed, and the output is 1.4293 A/cm2, which demonstrates excellent agreement with the prediction of the GP surrogate model.
The polarization curve and power density for TV-F and TV-R, both before and after optimization, are compared and presented in Figure 14. It is shown that the performance of both TV-F and TV-R has been improved after optimization, and TV-R performs better than TV-F. Specifically, for TV-R, the maximum current density and power density are 1.4293 A/cm2 and 0.6148 W/cm2 after optimization, which have been improved by 13.69% and 16.43%, respectively. For TV-F, the maximum current density and power density are 1.4120 A/cm2 and 0.6030 W/cm2, which have been improved by 16.50% and 19.16%, respectively.
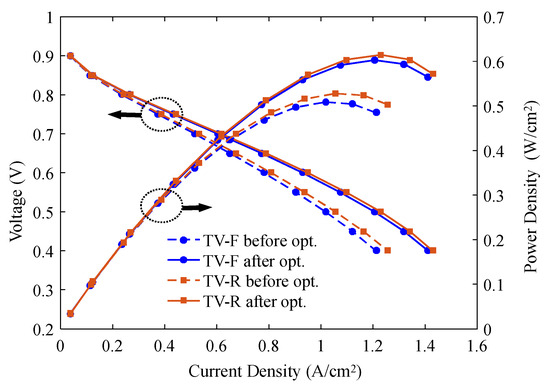
Figure 14.
Comparison of polarization curve and power density before and after optimization.
These results validate the effectiveness of the optimization framework and also demonstrate the performance advantages of TV-R in fuel cell applications.
4.3. Analysis of Net Power
To provide a comprehensive evaluation of the system-level performance benefit resulting from Tesla-valve flow field optimization, the net power output is further analyzed. Since pressure drop losses lead to increased energy consumption, the parasitic power is computed to quantitatively assess the impact of pressure drop on the net output of the fuel cell, as given in Equations (11) and (12):
where Wnet is the net power, WFC is the fuel cell output power, WP is the parasitic power, Δp is the pressure drop between the cathode channel inlet and outlet, uin is the cathode inlet velocity, Ach is the cathode inlet cross-sectional area, and ξ denotes the compressor efficiency.
The pressure drop, the parasitic power, and net power density before and after optimization are compared in Table 5 to assess the trade-off between pressure loss and output power. Results show that for TV-R, although there is an increase in approximately 25.4% of pressure drop, there is a reduction in parasitic power due to the decreased inlet cross-sectional area, and also an increase in net power. For TV-F, although there is a 37.8% increase in pressure drop, the parasitic power is also decreased due to the change in inlet cross-sectional area, and the net power is increased by 17.2%.

Table 5.
Comparison of parasitic power and net power density before and after optimization.
5. Comparison with Conventional Flow Fields
To comprehensively evaluate the performance of the optimized Tesla-valve flow field, a comparative analysis was conducted with CPFF and CSFF. To ensure a fair comparison, the membrane area, flow area, and channel height, as well as the operating conditions, are the same for each flow field. The anode flow field shares the same configuration as that of the cathode. However, the parameter channel-to-land ratio (C/L) could not be identical across all flow fields, as there is only one Tesla-valve flow field, and C/L is applicable only to CFPP and CSFF designs.
The comparison results are presented in Figure 15. The polarization curve in Figure 15a shows that in the high voltage area, TV-R and TV-F perform better than CSFF and CPFF. Disparity of power density also appears in the high power density area, with TV-R performing the best. CPFF and CSFF exhibit comparable performances, which is due to the reason that the total length of the flow field is short, and the advantage of CSFF over CPFF is not fully demonstrated. The pressure distributions in Figure 15b demonstrate a larger pressure drop for TVFF of both flow directions. However, if multiple Tesla-valve flow fields are parallel and the length of CSFF is also increased, the pressure drop of TVFF will have a marginal increase while CSFF will have a rapid growth of pressure drop.
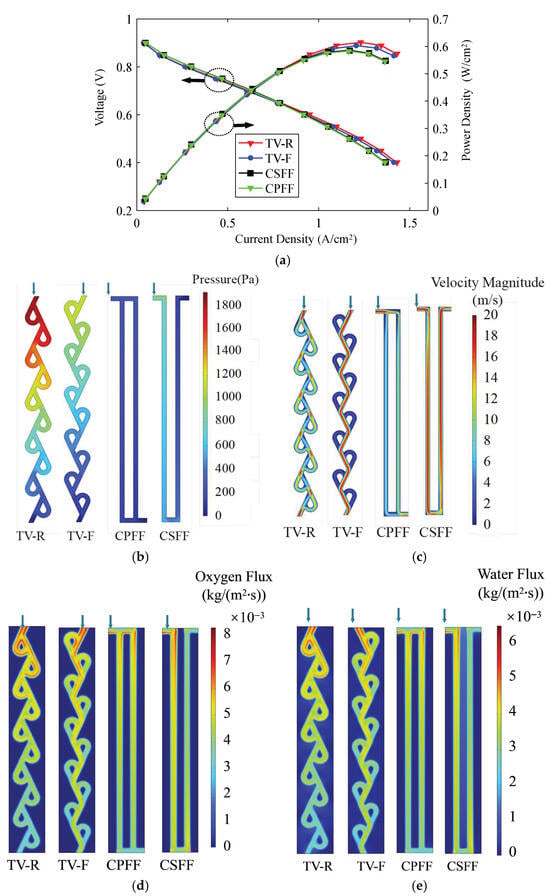
Figure 15.
Comparison of (a) Polarization curves, (b) Pressure distribution, (c) Velocity contour, (d) Total oxygen flux, and (e) Total water flux. The downward arrows indicate the gas flow direction.
The velocity contour at the middle plane of each cathode flow field is presented in Figure 15c. Except for high velocity regions at the inlet straight channel of each Tesla valve, TV-R shows a uniform velocity distribution both in the straight channels and loop channels. For TV-F, the mass flow is concentrated in the straight channels, showing a triangular wave shape, and has a low mass velocity in the loop channels. CSFF also presents a uniform distribution of a much higher mass velocity, while CPFF shows a velocity difference between the adjacent channels.
The total flux of oxygen and water is also compared. Within each Tesla valve stage, TV-R shows a uniform distribution of mass flux and TV-F shows a more concentrated mass flux in the straight channel. For all flow field configurations, there is a progressive reduction in mass flux along the downstream direction. It should also be noted that the mass flux of optimized TV-R in Figure 15 is more uniformly distributed than all the cases discussed in Section 3, demonstrating its enhanced mass transport capabilities.
Although the optimized Tesla-valve flow field significantly improves current and power density, its long-term stability under realistic operating conditions (e.g., reversible voltage loss and degradation mechanisms) requires further investigation. Recent studies on fuel-cell life prediction could provide methodologies to evaluate the lifespan benefits of such novel flow field designs [50].
6. Conclusions
In this work, the individual effects of the geometric parameters, namely, the loop radius, the channel angle, and the channel height, on the performance of the Tesla valve are studied. Then, based on simulation data from the numerical model, a Gaussian process-based surrogate model was established, and a constrained optimization problem was formulated. The optimal geometric configuration was determined by a Genetic Algorithm. The optimized Tesla valve designs of TV-R and TV-F were also compared with CPFF and CSFF in terms of polarization curves, power density, pressure distribution, and oxygen flux. The following conclusions were given:
- (1)
- A moderate increase in the loop radius (within 0.5–0.7 mm) and channel angle (40–50°) brings an increase in the current density and oxygen flux, while either a small or a large channel height leads to a decrease in current density and oxygen flux.
- (2)
- A smaller loop radius results in an abrupt flow direction change in the loop channel, and a smaller channel angle leads to a more concentrated flow in the loop channels. Variation in channel angle also affects the formation of stagnation zones in the flow channel. Channel height has a major effect on the velocity streamline density and pressure distribution.
- (3)
- Optimization results confirm that an optimal combination of loop radius and channel angle exists that could improve the output current density, power density, and distribution of oxygen flux.
- (4)
- The optimized TV-R and TV-F exhibit a better performance in terms of current density and total oxygen flux compared with CPFF and CSFF, albeit with a larger pressure drop due to the single-channel comparison. The parallel flow field implementation is expected to make the optimized Tesla valves more advantageous for practical engineering applications.
Author Contributions
J.Z.: Conceptualization, methodology, and writing—original draft. F.H.: Investigation, software, and data curation. W.W.: Investigation and validation. J.Y.: Investigation and review. G.R.: writing—review and editing, and supervision. All authors have read and agreed to the published version of the manuscript.
Funding
This research received no external funding.
Data Availability Statement
The original contributions presented in this study are included in the article. Further inquiries can be directed to the corresponding author.
Conflicts of Interest
Authors Wenjun Wang and Jianbo Yang were employed by the Shanghai Electric Group Co., Ltd. The remaining authors declare that the research was conducted in the absence of any commercial or financial relationships that could be construed as a potential conflict of interest.
Nomenclature
| Dgl | gas–liquid interfacial area per unit volume, 1/m | s | saturation of liquid water |
| P | pressure, Pa | hreaction | explicit reaction enthalpy heat, W/m−3 |
| F | Faraday’s constant, 96,485 C/mol | psat | Saturation vapor pressure, Pa |
| R | universal gas constant, 8.314 J/(mol·K) | pwv | vapor partial pressure, Pa |
| EW | equivalent weight, kg/mol | pp | gas-phase pressure, Pa |
| K | absolute permeability, m2 | pc | capillary pressure, Pa |
| Kr | relative permeability | μl | dynamic viscosity of liquid water, Pa/s |
| Keff | effective thermal conductivity, J/(K·m·s) | velocity, m/s | |
| Ck | volume fraction | gravitational acceleration vector, m/s2 | |
| Deff | effective diffusion coefficient, m2/s | Δp | pressure drop, Pa |
| Djk | binary diffusivity of components j and k, m2/s | cp | specific heat capacity, J/(kg·K) |
| Wnet | net power, W | z | number of electrons |
| Wp | parasitic power, W | uin | inlet velocity, m/s |
| Ach | cathode inlet cross-sectional area, m2 | xj | mole fractions of component j |
| Sm | Mass source term | i | current density, A/cm2 |
| Su | Momentum source term | i0 | exchange current density, A/cm2 |
| ST | Energy source term | αc, αa | Cathode/anode charge transfer coefficient |
| Sk | Species source term | η | over-potential, V |
| Sgl | Gas–liquid pressure source term | σ | Conductivity, S/m |
| Sld | Gas–liquid pressure source term | Φ | Potential, V |
| molar mass of hydrogen, kg/mol−1 | λ | membrane water content | |
| molar mass of oxygen, kg/mol | condensation coefficient, 1/s | ||
| molar mass of water, kg/mol | evaporation coefficient, 1/s | ||
| Rohm | Ohmic resistivity, Ω | ξ | compression efficiency |
| Ran | anode reaction rate | ε | porosity |
| Rca | cathode reaction rate | ρ | density, kg/m3 |
| T | temperature, K | ω | mass fraction |
References
- Lim, B.-H.; Majlan, E.-H.; Daud, W.R.W.; Rosli, M.; Husaini, T. Three-dimensional study of stack on the performance of the proton exchange membrane fuel cell. Energy 2019, 169, 338–343. [Google Scholar] [CrossRef]
- Yang, B.; Li, D.; Zeng, C.; Chen, Y.; Guo, Z.; Wang, J.; Shu, H.; Yu, T.; Zhu, J. Parameter extraction of PEMFC via Bayesian regularization neural network based meta-heuristic algorithms. Energy 2021, 228, 120592. [Google Scholar] [CrossRef]
- Deng, B.; Huang, W.; Jian, Q. An open-cathode PEMFC efficiency optimization strategy based on exergy analysis and data-driven modeling. Energy 2023, 264, 126148. [Google Scholar] [CrossRef]
- Kandidayeni, M.; Macias, A.; Khalatbarisoltani, A.; Boulon, L.; Kelouwani, S. Benchmark of proton exchange membrane fuel cell parameters extraction with metaheuristic optimization algorithms. Energy 2019, 183, 912–925. [Google Scholar] [CrossRef]
- Zhang, Y.; Wang, J.; Yao, Z. Recent development of fuel cell core components and key materials: A review. Energies 2023, 16, 2099. [Google Scholar] [CrossRef]
- Tawalbeh, M.; Alarab, S.; Al-Othman, A.; Javed, R.M.N. The operating parameters, structural composition, and fuel sustainability aspects of PEM fuel cells: A mini review. Fuels 2022, 3, 449–474. [Google Scholar] [CrossRef]
- Chen, Y.; Liu, Y.; Xu, Y.; Guo, X.; Cao, Y.; Ming, W. Modeling and simulation of membrane Electrode material structure for proton exchange membrane fuel cells. Coatings 2022, 12, 1145. [Google Scholar] [CrossRef]
- Okonkwo, P.C.; Otor, C. A review of gas diffusion layer properties and water management in proton exchange membrane fuel cell system. Int. J. Energy Res. 2021, 45, 3780–3800. [Google Scholar] [CrossRef]
- Chen, C.-Y.; Su, S.-C. Development and performance evaluation of a high temperature proton exchange membrane fuel cell with stamped 304 stainless steel bipolar plates. Int. J. Hydrogen Energy 2018, 43, 13430–13439. [Google Scholar] [CrossRef]
- Zhang, P.; Hao, C.; Han, Y.; Du, F.; Wang, H.; Wang, X.; Sun, J. Electrochemical behavior and surface conductivity of NbC modified Ti bipolar plate for proton exchange membrane fuel cell. Surf. Coat. Technol. 2020, 397, 126064. [Google Scholar] [CrossRef]
- Kim, M.; Lee, D.-G. Development of the anode bipolar plate/membrane assembly unit for air breathing PEMFC stack using silicone adhesive bonding. J. Power Sources 2016, 315, 86–95. [Google Scholar] [CrossRef]
- Shi, J.; Zhang, P.; Han, Y.; Wang, H.; Wang, X.; Yu, Y.; Sun, J. Investigation on electrochemical behavior and surface conductivity of titanium carbide modified Ti bipolar plate of PEMFC. Int. J. Hydrogen Energy 2020, 45, 10050–10058. [Google Scholar] [CrossRef]
- Liu, J.; Luo, Z.; Hu, J.; Cai, Y. Study on a novel self-adaptive cathode flow field with deformable baffles for proton exchange membrane fuel cell. Appl. Energy 2025, 377, 124395. [Google Scholar] [CrossRef]
- Shen, J.; Tu, Z.; Chan, S.H. Evaluation criterion of different flow field patterns in a proton exchange membrane fuel cell. Energy Convers. Manag. 2020, 213, 112841. [Google Scholar] [CrossRef]
- Zhou, Y.; Meng, K.; Chen, W.; Deng, Q.; Chen, B. Experimental performance of proton exchange membrane fuel cell with novel flow fields and numerical investigation of water-gas transport enhancement. Energy Convers. Manag. 2023, 281, 116865. [Google Scholar] [CrossRef]
- Anyanwu, I.S.; Xie, X.; Liu, Z.; Jiao, K. Experimental investigation and optimization of proton exchange membrane fuel cell using different flow fields. Energy 2021, 217, 119313. [Google Scholar] [CrossRef]
- Marappan, M.; Palaniswamy, K.; Velumani, T.; Chul, K.B.; Velayutham, R.; Shivakumar, P.; Sundaram, S. Performance studies of proton exchange membrane fuel cells with different flow field designs–review. Chem. Rec. 2021, 21, 663–714. [Google Scholar] [CrossRef]
- Yan, S.; Yang, M.; Sun, C.; Xu, S. Liquid water characteristics in the compressed gradient porosity gas diffusion layer of proton exchange membrane fuel cells using the Lattice Boltzmann Method. Energies 2023, 16, 6010. [Google Scholar] [CrossRef]
- Chen, X.; Chen, Y.; Liu, Q.; Xu, J.; Liu, Q.; Li, W.; Zhang, Y.; Wan, Z.; Wang, X. Performance study on a stepped flow field design for bipolar plate in PEMFC. Energy Rep. 2021, 7, 336–347. [Google Scholar] [CrossRef]
- Yang, C.; Wan, Z.; Chen, X.; Kong, X.; Zhang, J.; Huang, T.; Wang, X. Geometry optimization of a novel M-like flow field in a proton exchange membrane fuel cell. Energy Convers. Manag. 2021, 228, 113651. [Google Scholar] [CrossRef]
- Friess, B.-R.; Hoorfar, M. Development of a novel radial cathode flow field for PEMFC. Int. J. Hydrogen Energy 2012, 37, 7719–7729. [Google Scholar] [CrossRef]
- Jeon, D.H.; Greenway, S.; Shimpalee, S.; Van Zee, J.W. The effect of serpentine flow-field designs on PEM fuel cell performance. Int. J. Hydrogen Energy 2008, 33, 1052–1066. [Google Scholar] [CrossRef]
- Lim, B.-H.; Majlan, E.-H.; Daud, W.R.W.; Rosli, M.; Husaini, T. Numerical analysis of modified parallel flow field designs for fuel cells. Int. J. Hydrogen Energy 2017, 42, 9210–9218. [Google Scholar] [CrossRef]
- Kumar, A.; Reddy, R.G. Effect of channel dimensions and shape in the flow-field distributor on the performance of polymer electrolyte membrane fuel cells. J. Power Sources 2003, 113, 11–18. [Google Scholar] [CrossRef]
- He, W.; Yi, J.S.; Van Nguyen, T. Two-phase flow model of the cathode of PEM fuel cells using interdigitated flow fields. AIChE J. 2000, 46, 2053–2064. [Google Scholar] [CrossRef]
- Wang, Y.; Sun, Z.-Y.; Yang, L. Enhancement effects of the obstacle arrangement and gradient height distribution in serpentine flow-field on the performances of a PEMFC. Energy Convers. Manag. 2022, 252, 115077. [Google Scholar] [CrossRef]
- Chen, H.; Guo, H.; Ye, F.; Ma, C.F. A numerical study of baffle height and location effects on mass transfer of proton exchange membrane fuel cells with orientated-type flow channels. Int. J. Hydrogen Energy 2021, 46, 7528–7545. [Google Scholar] [CrossRef]
- Fan, L.; Niu, Z.; Zhang, G.; Jiao, K. Optimization design of the cathode flow channel for proton exchange membrane fuel cells. Energy Convers. Manag. 2018, 171, 1813–1821. [Google Scholar] [CrossRef]
- Ruan, H.; Wu, C.; Liu, S.; Chen, T. Design and simulation of novel flow field plate geometry for proton exchange membrane fuel cells. Heat Mass Transf. 2016, 52, 2167–2176. [Google Scholar] [CrossRef]
- Iranzo, A.; Arredondo, C.H.; Kannan, A.M.; Rosa, F. Biomimetic flow fields for proton exchange membrane fuel cells: A review of design trends. Energy 2020, 190, 116435. [Google Scholar] [CrossRef]
- Sun, Y.; Lin, Y.; Wang, Q.; Yang, C.; Yin, W.; Wan, Z.; Qiu, T. Novel design and numerical investigation of a windward bend flow field for proton exchange membrane fuel cell. Energy 2024, 290, 130142. [Google Scholar] [CrossRef]
- Sun, F.; Su, D.; Li, P.; Dong, X. A novel 3D fine-mesh flow field design and performance analysis for proton exchange membrane fuel cells. J. Power Sources 2023, 584, 233572. [Google Scholar] [CrossRef]
- Li, Z.; Wang, S.; Yao, S.; Wang, X.; Li, W.; Zhu, T.; Xie, X. Experimental and numerical study on improvement performance by wave parallel flow field in a proton exchange membrane fuel cell. Chin. J. Chem. Eng. 2022, 45, 90–102. [Google Scholar] [CrossRef]
- Yoshida, T.; Kojima, K. Toyota MIRAI fuel cell vehicle and progress toward a future hydrogen society. Electrochem. Soc. Interface 2015, 24, 45. [Google Scholar] [CrossRef]
- Cai, Y.; Fang, Z.; Chen, B.; Yang, T.; Tu, Z. Numerical study on a novel 3D cathode flow field and evaluation criteria for the PEM fuel cell design. Energy 2018, 161, 28–37. [Google Scholar] [CrossRef]
- Wang, P.; Hu, P.; Liu, L.; Xu, Z.; Wang, W.; Scheid, B. On the diodicity enhancement of multistage Tesla valves. Phys. Fluids 2023, 35, 052010. [Google Scholar] [CrossRef]
- Ni, T.; Si, J.; Li, F.; Pan, C.; Li, D.; Pan, M.; Guan, W. Performance analysis on the liquid cooling plate with the new Tesla valve capillary channel based on the fluid solid coupling simulation. Appl. Therm. Eng. 2023, 232, 120977. [Google Scholar] [CrossRef]
- Qian, J.; Chen, M.; Gao, Z.; Jin, Z.-J. Mach number and energy loss analysis inside multi-stage Tesla valves for hydrogen decompression. Energy 2019, 179, 647–654. [Google Scholar] [CrossRef]
- Liu, Z.; Shao, W.-Q.; Sun, Y.; Sun, B.-H. Scaling law of the one-direction flow characteristics of symmetric Tesla valve. Eng. Appl. Comput. Fluid Mech. 2022, 16, 441–452. [Google Scholar] [CrossRef]
- Gong, F.; Yang, X.; Zhang, X.; Mao, Z.; Gao, W.; Wang, C. The study of Tesla valve flow field on the net power of proton exchange membrane fuel cell. Appl. Energy 2023, 329, 120276. [Google Scholar] [CrossRef]
- Guo, H.; Tian, S.; Wang, L.; Xiao, C.; Yang, S. Numerical study of Tesla valve flow field on proton exchange membrane fuel cell performance. Int. J. Hydrogen Energy 2024, 50, 1573–1583. [Google Scholar] [CrossRef]
- Zhang, Y.; He, S.; Jiang, X.; Wang, Z.; Wang, Y.; Gu, M.; Yang, X.; Zhang, S.; Cao, J.; Fang, H.; et al. Performance and configuration optimization of proton exchange membrane fuel cell considering dual symmetric Tesla valve flow field. Energy 2024, 288, 129791. [Google Scholar] [CrossRef]
- Hu, P.; Wang, P.; Liu, L.; Ruan, X.; Zhang, L.; Xu, Z. Numerical investigation of Tesla valves with a variable angle. Phys. Fluids 2022, 34, 033603. [Google Scholar] [CrossRef]
- Bao, Y.; Wang, H. Numerical study on flow and heat transfer characteristics of a novel Tesla valve with improved evaluation method. Int. J. Hydrogen Energy 2022, 187, 122540. [Google Scholar] [CrossRef]
- Guo, H.; Tian, S.; Wang, L.; Xiao, C.; Pan, Y.; Xie, W.; Yang, S. Influence of Structural Parameters of Tesla Valve Flow Field on Performance of Fuel Cells. Energies 2024, 17, 4442. [Google Scholar] [CrossRef]
- Le, A.-D.; Zhou, B. A general model of proton exchange membrane fuel cell. J. Power Sources 2008, 182, 197–222. [Google Scholar] [CrossRef]
- Lobato, J.; Cañizares, P.; Rodrigo, M.A.; Pinar, F.J.; Mena, E.; Úbeda, D. Three-dimensional model of a 50 cm2 high temperature PEM fuel cell. Study of the flow channel geometry influence. Int. J. Hydrogen Energy 2010, 35, 5510–5520. [Google Scholar] [CrossRef]
- Mei, J.; Meng, X.; Tang, X.; Li, H.; Hasanien, H.; Alharbi, M.; Dong, Z.; Shen, J.; Sun, C.; Fan, F.; et al. An accurate parameter estimation method of the voltage model for proton exchange membrane fuel cells. Energies 2024, 17, 2917. [Google Scholar] [CrossRef]
- Cheng, R. Design and Optimization of Harp-Shaped Flow Field Structure for Proton Exchange Membrane Hydrogen Fuel Cell Bipolar Plates. Master’s Thesis, Northeast Agricultural University, Harbin, China, 2022. [Google Scholar]
- Meng, X.; Sun, C.; Mei, J.; Tang, X.; Hasanien, H.M.; Jiang, J.; Fan, F.; Song, K. Fuel cell life prediction considering the recovery phenomenon of reversible voltage loss. J. Power Sources 2025, 625, 235634. [Google Scholar] [CrossRef]
Disclaimer/Publisher’s Note: The statements, opinions and data contained in all publications are solely those of the individual author(s) and contributor(s) and not of MDPI and/or the editor(s). MDPI and/or the editor(s) disclaim responsibility for any injury to people or property resulting from any ideas, methods, instructions or products referred to in the content. |
© 2025 by the authors. Licensee MDPI, Basel, Switzerland. This article is an open access article distributed under the terms and conditions of the Creative Commons Attribution (CC BY) license (https://creativecommons.org/licenses/by/4.0/).