Article

Polarization and Depolarization Current Characteristics of Cables at Different Water Immersion Stages

1
State Grid Beijing Electric Power Company Limited, Beijing 100015, China
2
School of Electrical Engineering, Xi’an Jiaotong University, Xi’an 710049, China
*
Authors to whom correspondence should be addressed.
Energies 2025, 18(19), 5094; https://doi.org/10.3390/en18195094
Submission received: 28 July 2025 / Revised: 4 September 2025 / Accepted: 22 September 2025 / Published: 25 September 2025

Abstract

To address the insulation degradation caused by moisture intrusion due to damage to the outer sheath of power cables, this study systematically analyzed the charge transport characteristics of XLPE cables at different water immersion stages using polarization/depolarization current (PDC) measurements. An evaluation method for assessing water immersion levels was proposed based on conductivity, charge density, and charge mobility. Experiments were conducted on commercial 10 kV XLPE cable samples subjected to accelerated water immersion for durations ranging from 0 to 30 days. PDC data were collected via a custom-built three-electrode measurement platform. The results indicated that with increasing immersion time, the decay rate of polarization/depolarization currents slowed, the steady-state current amplitude rose significantly, and the DC conductivity increased from 1.86 × 10⁻¹⁷ S/m to 2.70 × 10⁻¹⁵ S/m—a nearly two-order-of-magnitude increase. The Pearson correlation coefficient between charge mobility and immersion time reached 0.96, indicating a strong positive correlation. Additional tests on XLPE insulation slices showed a rapid rise in conductivity during early immersion, a decrease in breakdown voltage from 93.64 kV to 66.70 kV, and enhanced space charge accumulation under prolonged immersion and higher electric fields. The proposed dual-parameter criterion (conductivity and charge mobility) effectively distinguishes between early and advanced stages of cable water immersion, offering a practical approach for non-destructive assessment of insulation conditions and early detection of moisture intrusion, with significant potential for application in predictive maintenance and insulation diagnostics.

1. Introduction

Power cables are important equipment for electrical energy transmission in modern power systems. Their insulation performances directly influence the reliability and safety of grid operation. Cross-linked polyethylene (XLPE) cables are widely used in medium- and high-voltage power transmission and distribution networks due to their excellent electrical properties, mechanical strength, and heat resistance [1,2,3]. XLPE is a non-polar polymer with a three-dimensional cross-linked network. The inherent interfaces, defects, and impurities introduced by processing within this structure determine its behavior of charge transport, polarization, and accumulation. However, during long-term operation, the cable outer sheath is susceptible to damage caused by mechanical stress, chemical corrosion, or environmental factors, leading to moisture ingress into the insulation layer. Although the demand of XLPE as an insulator material remains high, the lifetime of cables is significantly reduced by the presence of water trees in the insulator [4]. Moisture penetration not only accelerates the aging of insulating materials but may also trigger partial discharges, electrical tree growth, or even insulation breakdown, posing a serious threat to the stable operation of power systems [5].
Currently, non-destructive testing techniques for cable insulation condition mainly include partial discharge (PD) detection, dielectric loss tangent (tanδ) measurement, and time-domain dielectric response (TDR) methods. In the field of cable moisture content and water tree aging detection, multiple research groups worldwide have conducted in-depth studies based on various technical approaches [6]. Scholars have developed multiple techniques to evaluate water-induced insulation degradation: Dielectric spectroscopy: Measures the frequency-dependent dielectric response to identify moisture content, but it is susceptible to external electromagnetic interference in field tests. Polarization/Depolarization Current (PDC) analysis: Characterizes insulation conductivity and charge accumulation by analyzing transient current curves, with advantages of non-destructiveness and high sensitivity. Space charge analysis: Observes charge distribution in insulation to reflect water-induced defect evolution, but it requires complex testing equipment and is mainly used in laboratory settings.
Heizmann and S. Zaengl observed that the depolarization current of aged cables exhibits obvious nonlinearity; specifically, when the test voltage is increased, the depolarization current increases by a multiple far exceeding the voltage rise ratio. Through cable slice observations, the presence of water trees was confirmed, which was considered to cause this nonlinear characteristic [7]. M. Kuschel found through PDC testing that severely water-infiltrated cables show significantly increased depolarization currents [8]. B. Oyegoke applied the PDC method on power cables in operation for many years and, by applying different voltages, used DC conductivity and nonlinearity coefficients as characteristic parameters to effectively distinguish between water tree defects in the cable core and defects at intermediate joints [9]. The team led by Zhou Kai accelerated water tree aging in cable samples using a high-frequency high-voltage water needle electrode method, finding that the DC conductivity of water tree-aged cables significantly increased with the number of pressurized tests, and the increase correlated positively with the average water tree length, whereas cables without water trees maintained stable conductivity. This phenomenon was attributed to microstructural changes in the water tree region and altered charge migration characteristics; therefore, DC conductivity and nonlinearity coefficients can serve as effective diagnostic indicators for water tree aging [10,11]. Yang Fan et al. comparatively analyzed PDC test results from cables with different aging levels and found that aged samples exhibited faster attenuation of depolarization current in the low-frequency range and higher steady-state current amplitudes, proposing the slope ratio as a quantitative aging indicator [12]. The team led by Cai Gang proposed a dual-parameter diagnostic method based on DC conductivity and nonlinearity coefficient, pointing out that water tree-aged cables show an increase in DC conductivity by two orders of magnitude and a significant rise in nonlinearity coefficient, which can be used for rapid screening of cable water tree defects [13,14].
The polarization and depolarization current (PDC) method can be used to detect moisture ingress and aging status of cable insulation, with conductivity and nonlinearity coefficient during the polarization stage commonly used as criteria [15,16]. Researchers have also conducted assessments and research on the growth of water trees [17]. Previous studies have mostly focused on situations where cables are severely immersed in water, such as water branches, and there is often less research on the early stages of cable immersion [18,19]. This article studies the polarization/depolarization current characteristics of cables and their insulation slices under different immersion states. Based on the results of space charge testing, an immersion state evaluation method using conductivity, charge density, and charge mobility as criteria is proposed. The law and mechanism of moisture affecting the internal charge transport of XLPE cables are revealed, adding new criteria for PDC evaluation of immersed cables. The proposed dual-parameter criterion (conductivity and charge mobility) demonstrates a notable breakthrough in the early detection of water immersion. This combination of parameters is notably sensitive to initial moisture intrusion—a phase that has been previously underexplored in related research. Its strong correlation with immersion time and ability to differentiate early from advanced stages of water ingress provide a reliable, non-destructive means for assessing insulation conditions, offering significant potential for early warning in power cable maintenance.

2. Sample Preparation and Platform Setup

2.1. Test Specimen Preparation

The cable samples selected in this study are commercial 10 kV XLPE insulated cables, with an insulation layer thickness of 12 mm. Initially, standard cable segments with a length of 0.6 m were cut. Prior to PDC testing, specialized stripping tools were used to sequentially remove the cable’s outer sheath, armor, insulation sheath, and shielding layer, retaining the three-layer structure composed of the semiconductor layer, insulation layer, and copper conductor core. At both ends of the cable segment, the insulation layer was stripped for 4 cm to expose the copper conductor core, and the semiconductor layer was stripped for 3 cm. A layer of copper foil was wrapped around the exposed outer semiconductor layer to serve as the measuring electrode. Then, portions of the outer semiconductor layer on both sides of the cable were further stripped to expose the insulation layer. Two copper shielding rings were installed at both ends of the insulation layer and grounded as guard electrodes to prevent surface leakage currents from affecting the insulation measurement. Finally, the exposed copper conductor core was used as the high-voltage electrode. The entire cable segment preparation process is illustrated in Figure 1.
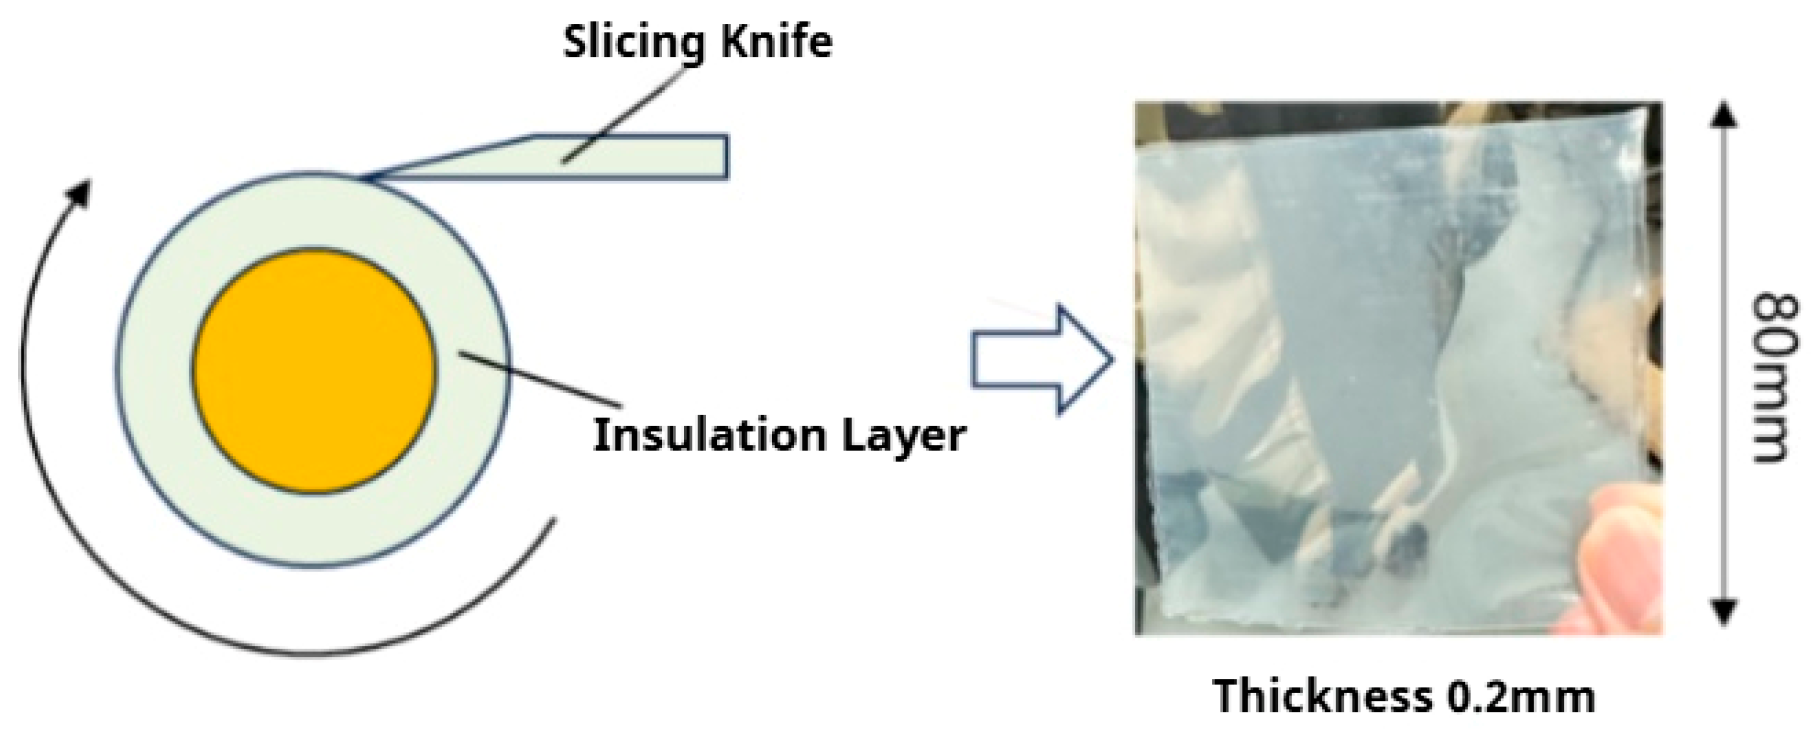
A ring section was taken from the middle portion of the unaged cable insulation layer to obtain the cable insulation slice specimen shown in Figure 2, with a thickness of 0.2 mm. The ring-cut cable slice exhibited uneven bending and cutting scratches, which are detrimental to the accuracy of experimental measurements. To avoid uneven bending or scratches on the sample surface (which could cause localized electric field distortion and inaccurate current measurement), a 5 kg flat pressure plate was applied to the sample during testing. This pressing operation ensures close contact between the sample and the electrode, eliminates air gaps, and thus enhances the reliability of PDC signal measurement. To obtain a transparent and flat slice specimen, the cable slice was placed into a 0.2 mm thick stainless steel mold. PET films coated with a silicone oil layer were placed above and below the specimen to prevent adhesion. The mold was then placed in a hot press vulcanizing machine heated to 120 °C. Under a pressure of 15 MPa, the specimen was pressed for 40 s. After pressing, the sample was removed and clamped between water-cooled plates for cooling.

2.2. Water Immersion Test Design

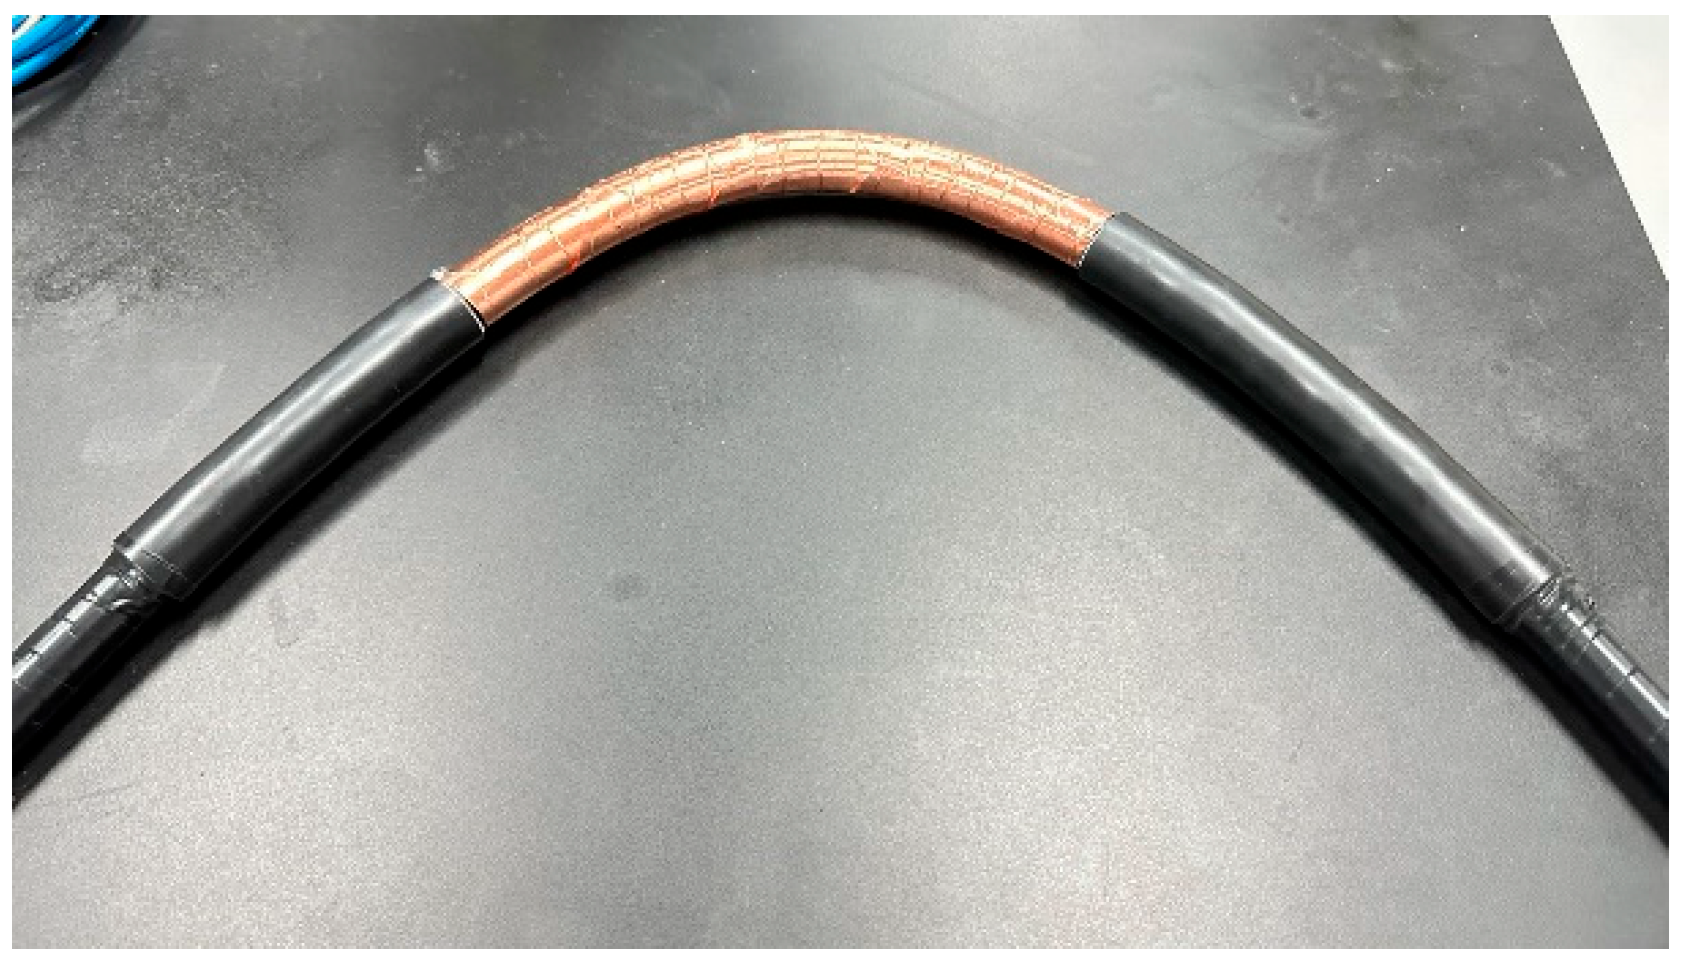
To simulate water ingress defects of cables operating in a humid environment, 0.2 m lengths of the outer sheath were stripped off from both ends extending from the middle section of the cable where the outer sheath was first removed, exposing the copper shielding layer in the middle section. The two ends of the cable were then completely wrapped with sealing tape to prevent moisture from entering or exiting the cable and affecting the experimental results. The cable treatment process is illustrated in Figure 3.
The exposed section of the cable where the outer sheath was removed was fully submerged in water. The water temperature was controlled at 60 °C using a thermostatic heating rod to simulate the actual operating temperature of the cable. The pressed cable sheet samples were also immersed in the water together. The maximum immersion time for the cable was 30 days. After the test of water content of the samples from the cable, it was confirmed that the cable had absorbed obvious moisture with water content of about 0.16% in the insulation. The immersion test environment for cables with damaged outer sheaths and the cable samples after immersion are shown in Figure 4.

2.3. Polarization and Depolarization Current Measurement Platform

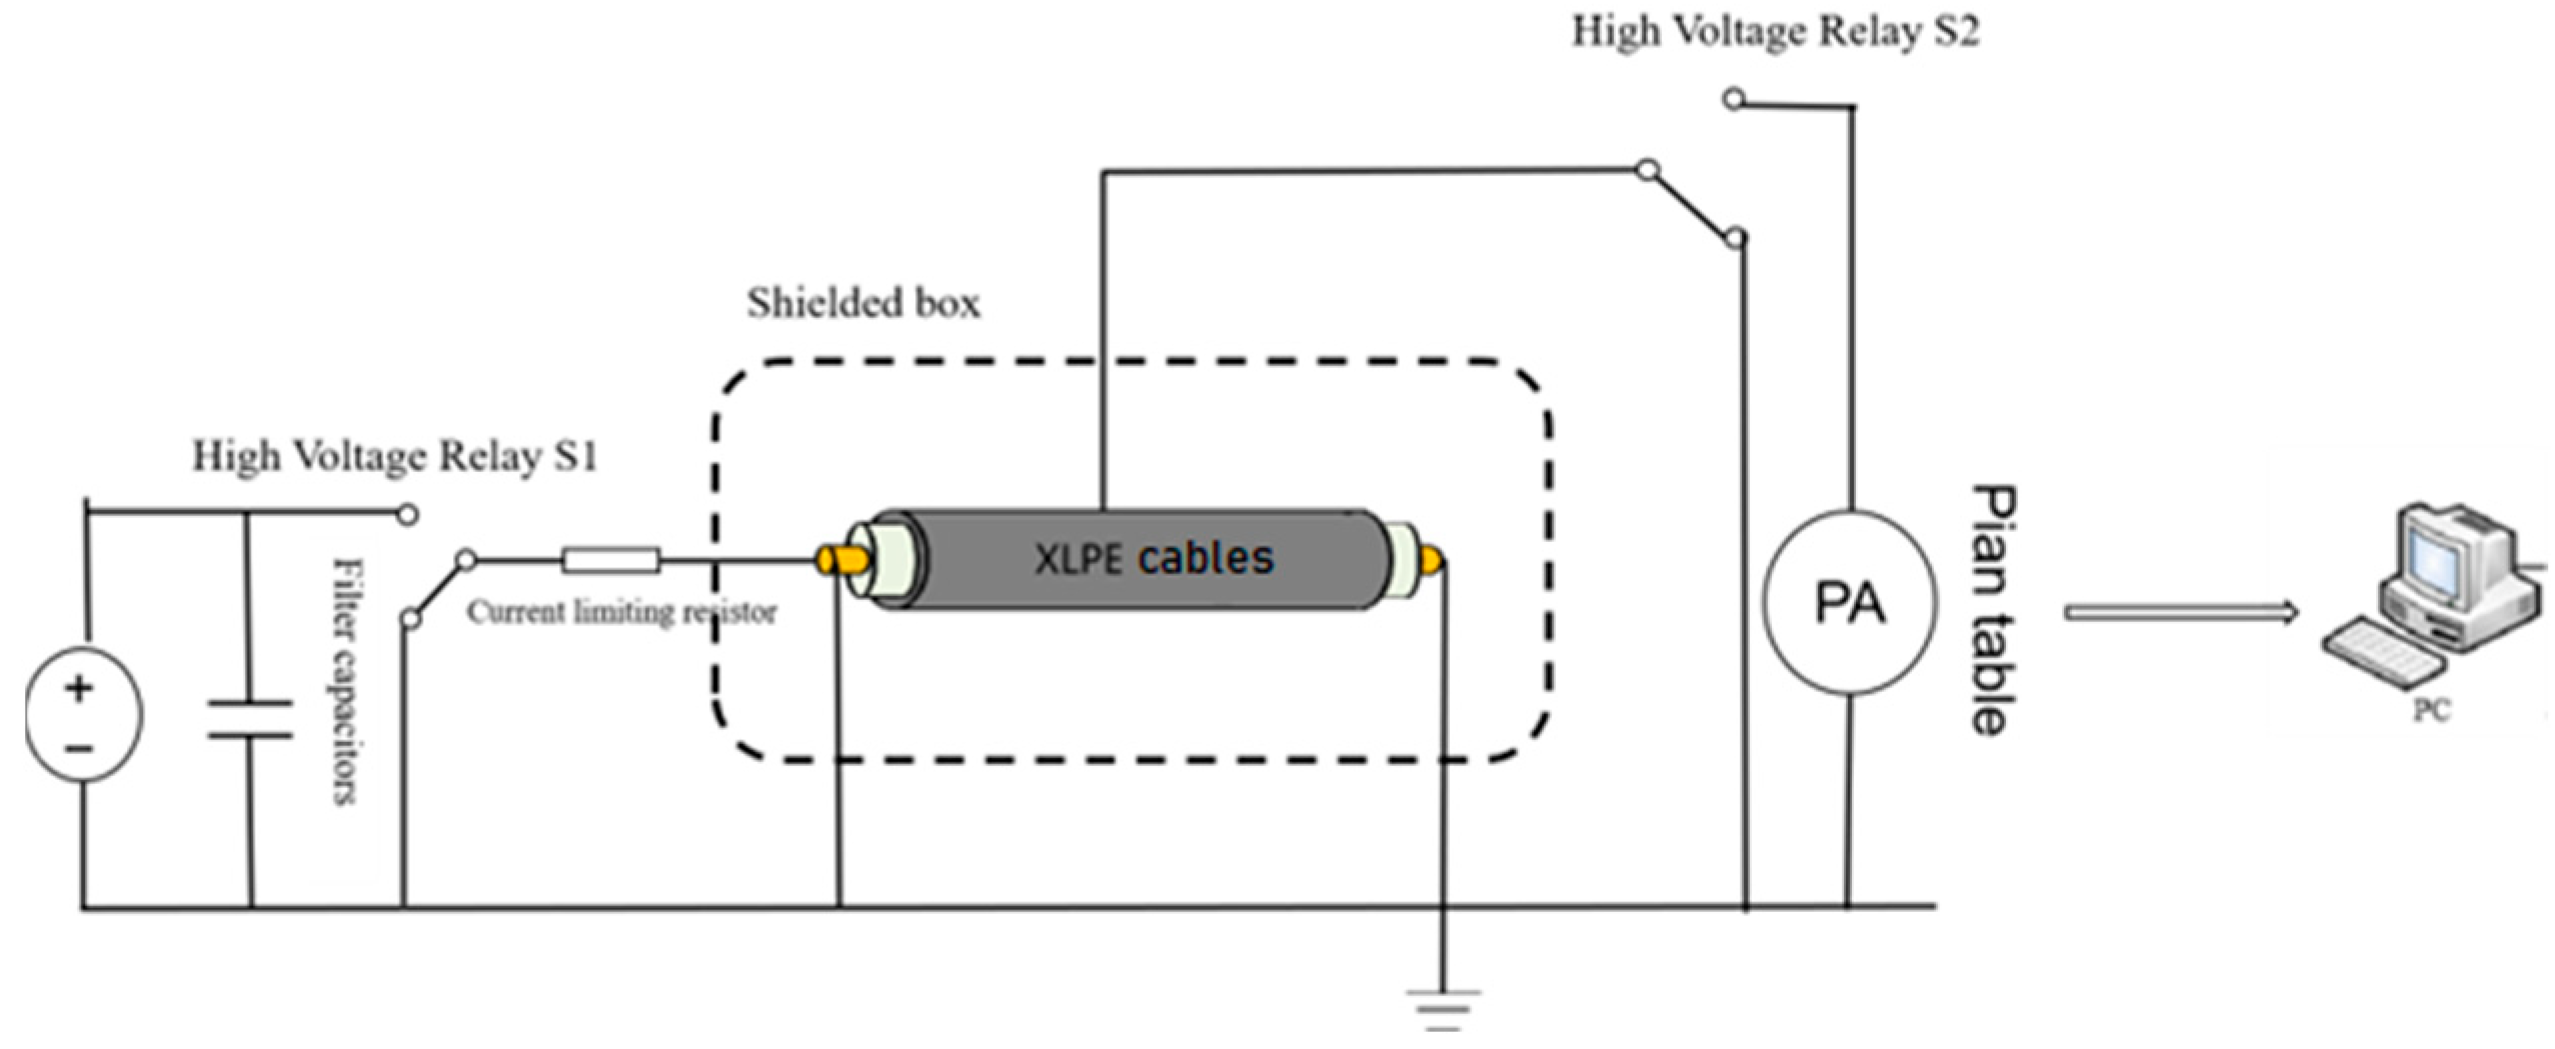
According to the experimental requirements, a dedicated polarization/depolarization current (PDC) measurement platform was designed and constructed specifically for high-voltage cable testing. Its primary function is to accurately capture weak polarization and depolarization currents under various DC voltage levels while minimizing external interference. As illustrated in Figure 5, the platform consists of several core components, each serving a distinct functional role: a high-voltage DC power supply for applying stable polarization voltages; high-voltage relays for precise switching between polarization and depolarization phases; a protection circuit to suppress inrush current and protect sensitive measuring instruments; a pico-ammeter for high-resolution current measurement; a shielding enclosure to eliminate external electromagnetic interference; and a controller along with a signal acquisition and storage module for automated control, real-time data recording, and subsequent analysis.
Considering that moisture contained in the cable’s outer semiconductor layer can easily evaporate in outdoor drying environments, which may affect the accuracy of the test results, the surface water on the cable was immediately wiped off after the cable being taken out of the water bath, and place it in the measurement system for 5 min before starting the measurement.
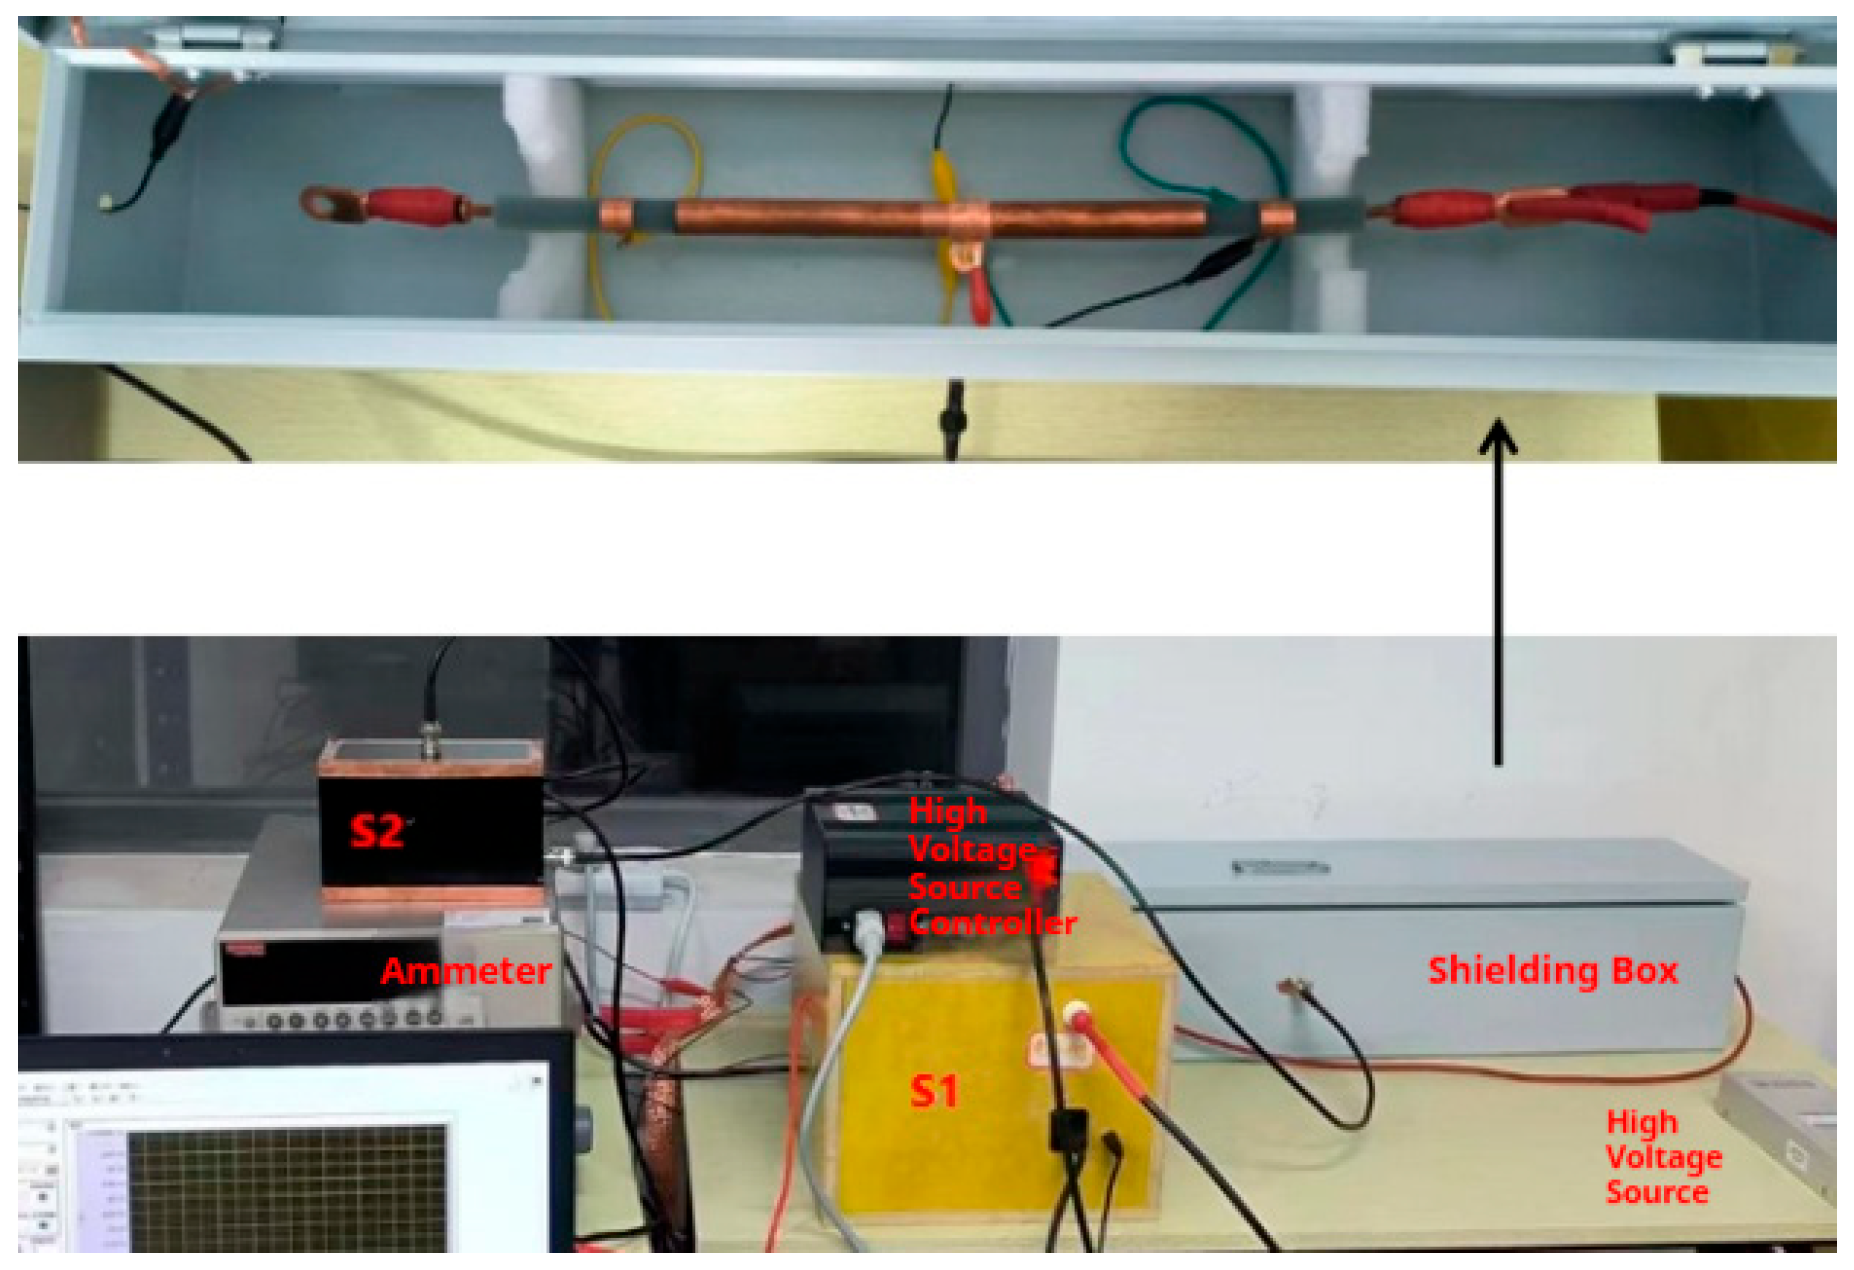
Before the experiment starts, the high-voltage relays S1 and S2 are initially in the open state, and the cable conductor and the outer semiconductor layer are grounded. At the beginning of the measurement, the high-voltage DC power supply first charges the filter capacitor. Then, relay S1 is closed to apply the polarization voltage to the cable. To prevent the initial surge current during polarization from damaging the pico-ammeter and affecting the measurement results, relay S2 is closed 1 s after S1 closure to start measuring the cable’s polarization current. After the polarization current test is completed, relay S1 is opened to ground the cable conductor, and the cable’s depolarization current is measured. The physical setup of the cable PDC measurement is shown in Figure 6.

3. Research on Immersion State Assessment Method Based on Polarization/Depolarization Current

3.1. The Influence of Test Voltage and Immersion Time on PDC Testing

To investigate the effect of moisture ingress on the insulation performance of cables, polarization/depolarization current (PDC) tests were conducted on cable samples under different water immersion conditions. The test samples included new cables without immersion, cables immersed for 14 days, and cables immersed for 30 days. All samples were pretreated according to the method described in Section 2 and prepared into a standard three-electrode test system.
The PDC tests were carried out at room temperature (25 °C) with applied voltages of 1 kV, 3 kV, and 5 kV. The polarization and depolarization times were both set to 20 min under each voltage level to obtain complete polarization/depolarization current curves. Due to the potential influence of switch transitions on the PDC measurements, the polarization current of the XLPE cable fluctuated significantly within the first 5 s after voltage application. To reduce errors in analyzing the cable polarization current, the current measured after the first 5 s of polarization was selected as the test result.
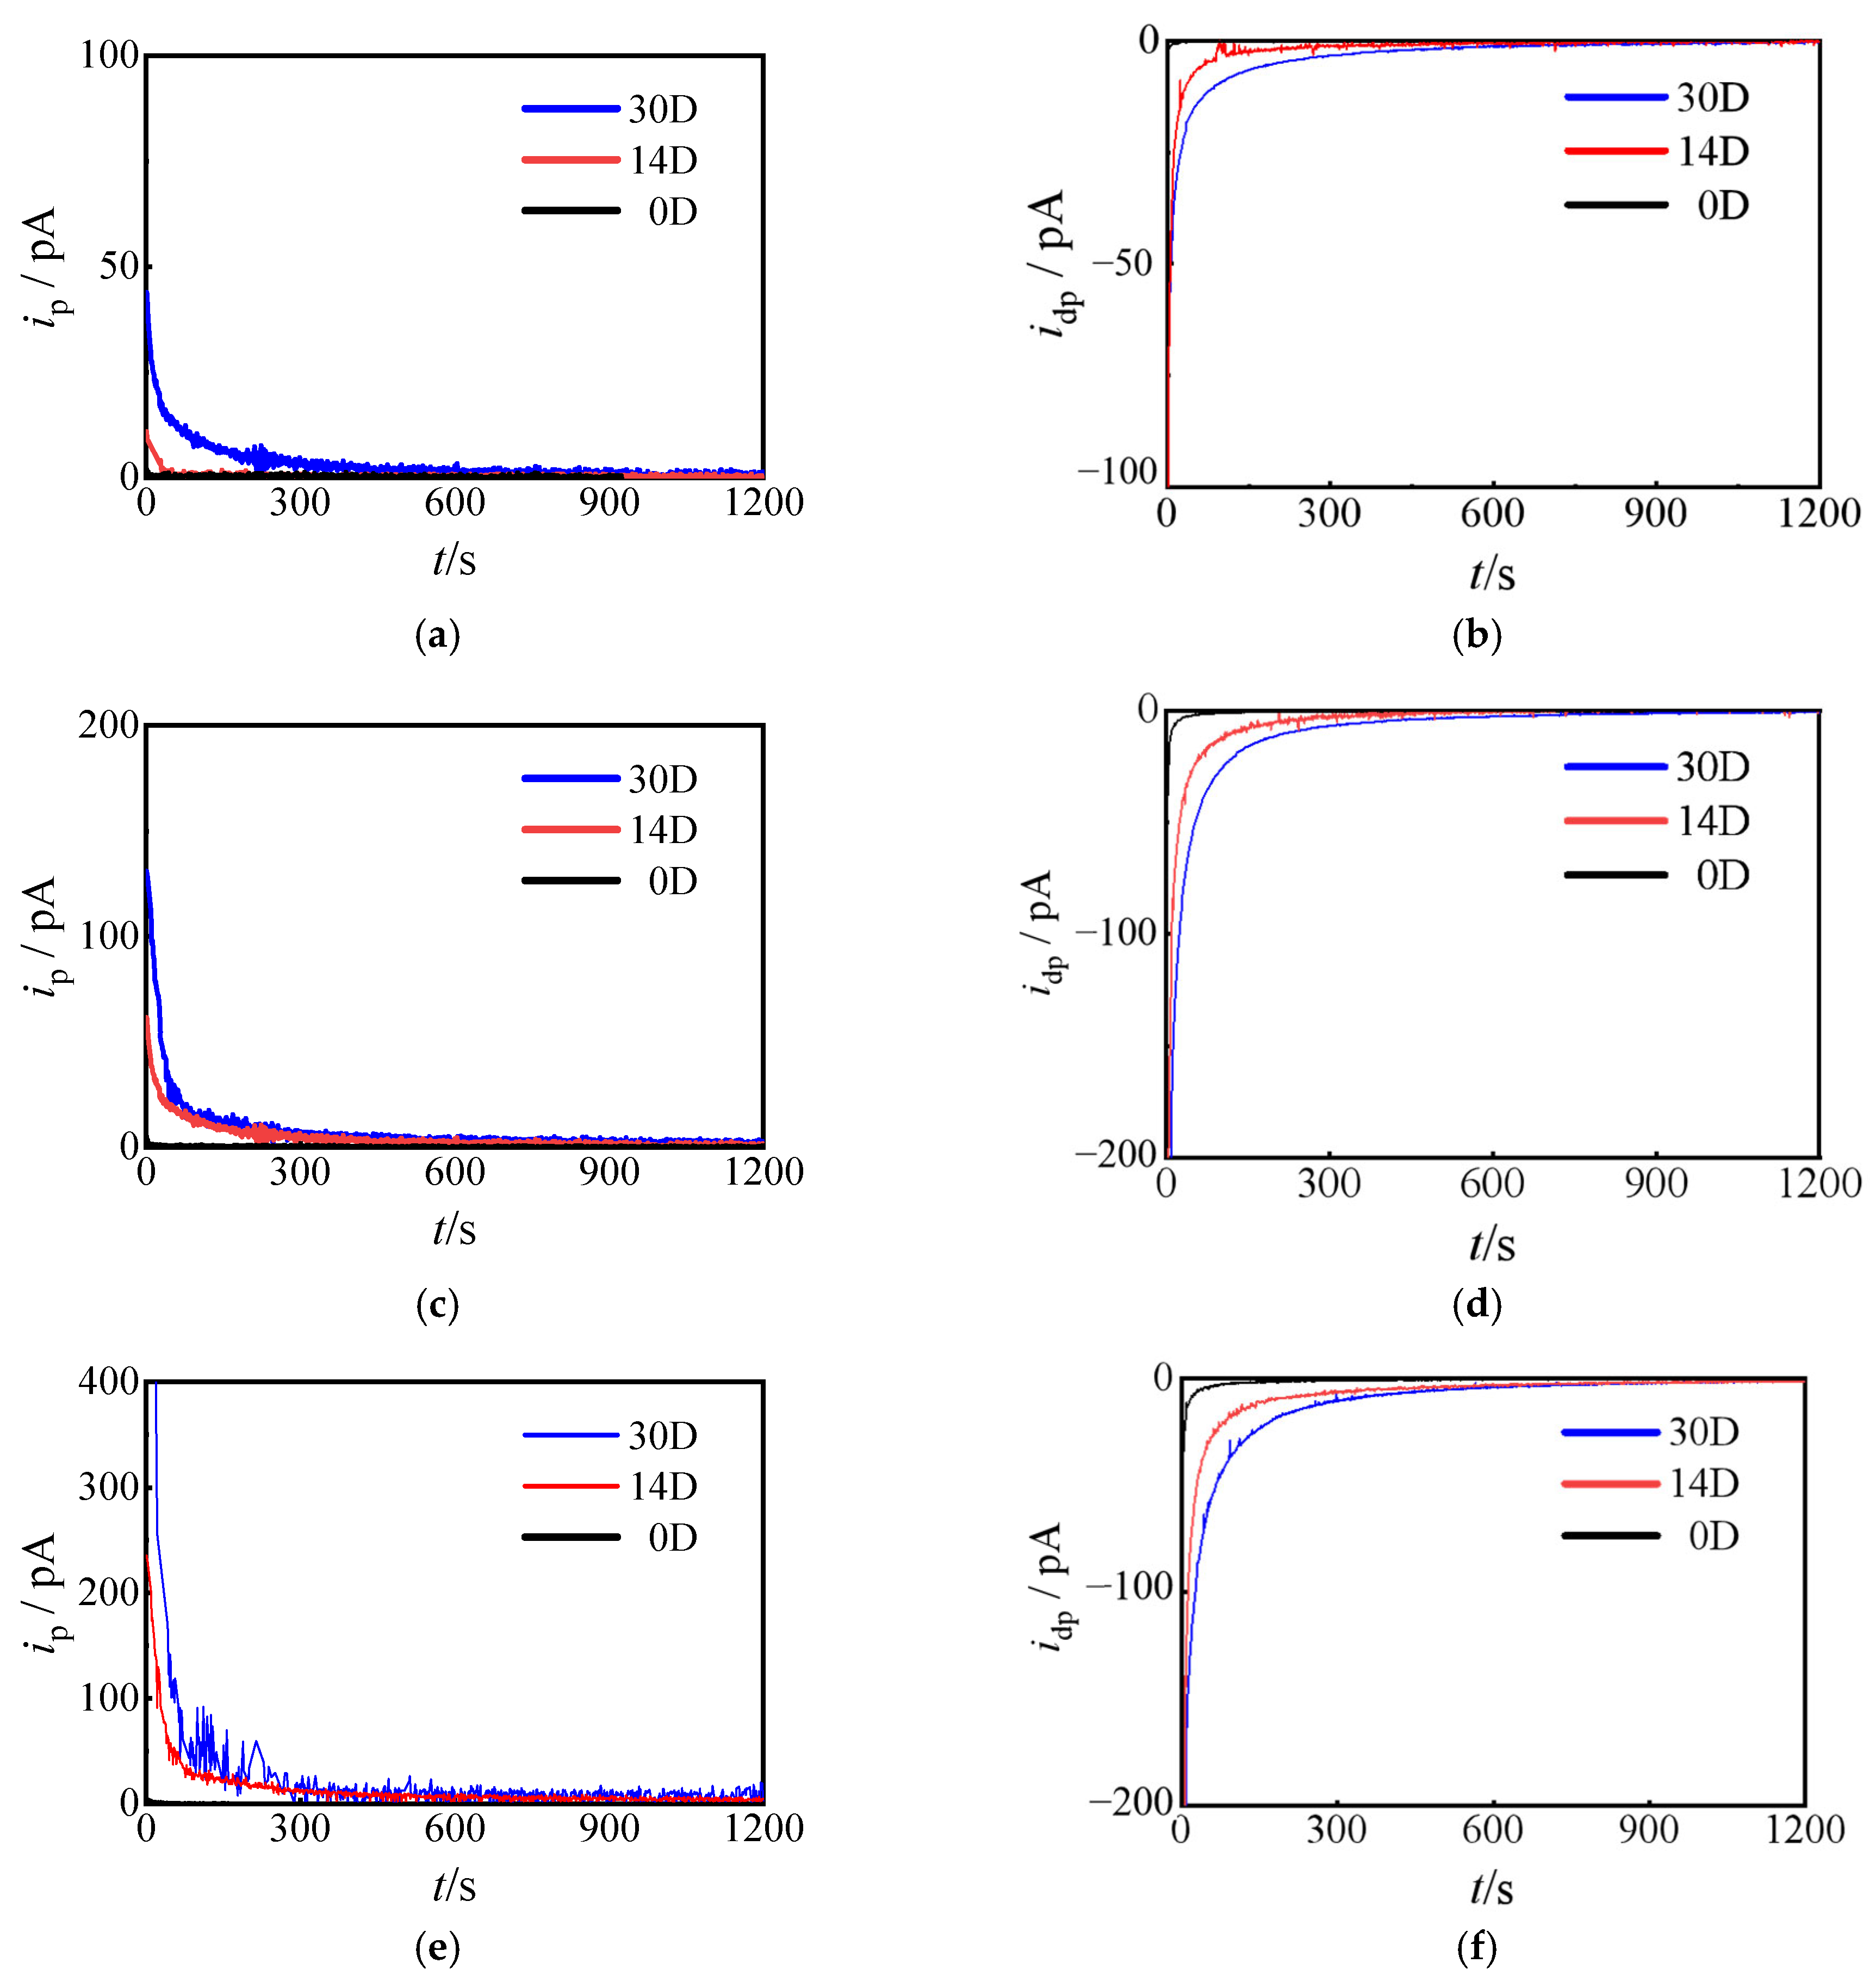
During the tests, a high-precision pico-ammeter was used to monitor the current changes in real time, and the current values at different time points were automatically recorded and stored using LabVIEW2018 data acquisition software. The testing system was enclosed in a shielded box to minimize interference. The polarization/depolarization current test results of the immersed cables under different polarization voltages are shown in Figure 7.
From Figure 7, it is evident that the decay processes of both polarization current and depolarization current show a delayed trend. The decay rates of both currents gradually decrease as the voltage increases. At the same time, the initial values of polarization/depolarization currents increase significantly with the applied voltage. The initial polarization current increases linearly with voltage, and the stable final value also rises with increasing voltage.
This phenomenon arises because the increase in applied voltage reduces the energy barrier for charge migration, thereby promoting the participation of more charge carriers—such as ions introduced by moisture—in the polarization process. The penetration of water not only enhances ionic conduction but also strengthens interfacial polarization at the boundaries between different insulation phases. Under elevated electric fields, these effects lead to intensified charge separation and accumulation, contributing to a non-linear increase in current. Furthermore, the reduction in current decay rate is attributed to the lengthening of the initial relaxation time and a broader distribution of relaxation times, resulting from the complex interactions between moisture-induced charge carriers and the polymer matrix.
For cables immersed for 30 days, as the polarization voltage increased from 1 kV to 3 kV, the initial polarization current rose approximately threefold. Meanwhile, the initial depolarization current increased by about 2.5 times. When the voltage was further elevated from 3 kV to 5 kV, the initial polarization current increased roughly 3.5 times, and the initial depolarization current rose nearly fourfold. These results indicate that with increasing polarization voltage, the current amplitudes of water-immersed cables exhibit a distinct nonlinear growth trend.
This nonlinear increase is likely related to the presence of moisture within the cable insulation. At low electric field intensities, moisture has a relatively limited effect on the polarization process; however, as the polarization voltage rises and the electric field strength increases, the polarization effect of moisture at the insulation interfaces is enhanced, leading to intensified charge separation and accumulation. Consequently, both the polarization and depolarization current amplitudes increase non-linearly. This phenomenon indicates that moisture ingress significantly alters the dielectric response characteristics of cable insulation materials, especially under high electric field conditions, where its influence becomes more pronounced.
For cables without water immersion, the polarization current decays rapidly after voltage application, reaching a stable value within 10 s. As the immersion duration increases, the polarization current of cables immersed for 14 days stabilizes after approximately 300 s of voltage application, while that of cables immersed for 30 days stabilizes only after about 600 s. The relaxation time increases in seconds, the moisture in the 30-day immersed cables has fully penetrated both the semiconductor layer and the insulation layer, and the moisture-induced interfacial polarization effect prolongs the charge relaxation time, which occurs between the semiconducting layer and the insulating layer, the crystalline and amorphous regions inside the insulation, the water tree and XLPE, and the defect and XLPE.
The decay pattern of the depolarization current is similar to that of the polarization current. With increasing immersion time, the decay rate of the depolarization current gradually decreases, and the time required for the depolarization current of the 30-day immersed cable to reach a stable value is the longest. This is attributed to the ionic conduction introduced by the penetrated moisture. On one hand, water molecules form additional polarization centers within the insulation material, enhancing interfacial polarization effects; on the other hand, soluble ions in the moisture increase the material’s conductivity, resulting in a larger conductive current component. Notably, the 30-day immersed samples, due to complete moisture penetration into both the semiconductor and insulation layers, exhibit the most significant changes in current characteristics. This phenomenon is also mentioned in the literature and used as a criterion to determine the type of cable aging [20].

3.2. The Conductivity and Charge Mobility of Water-Immersed Cables

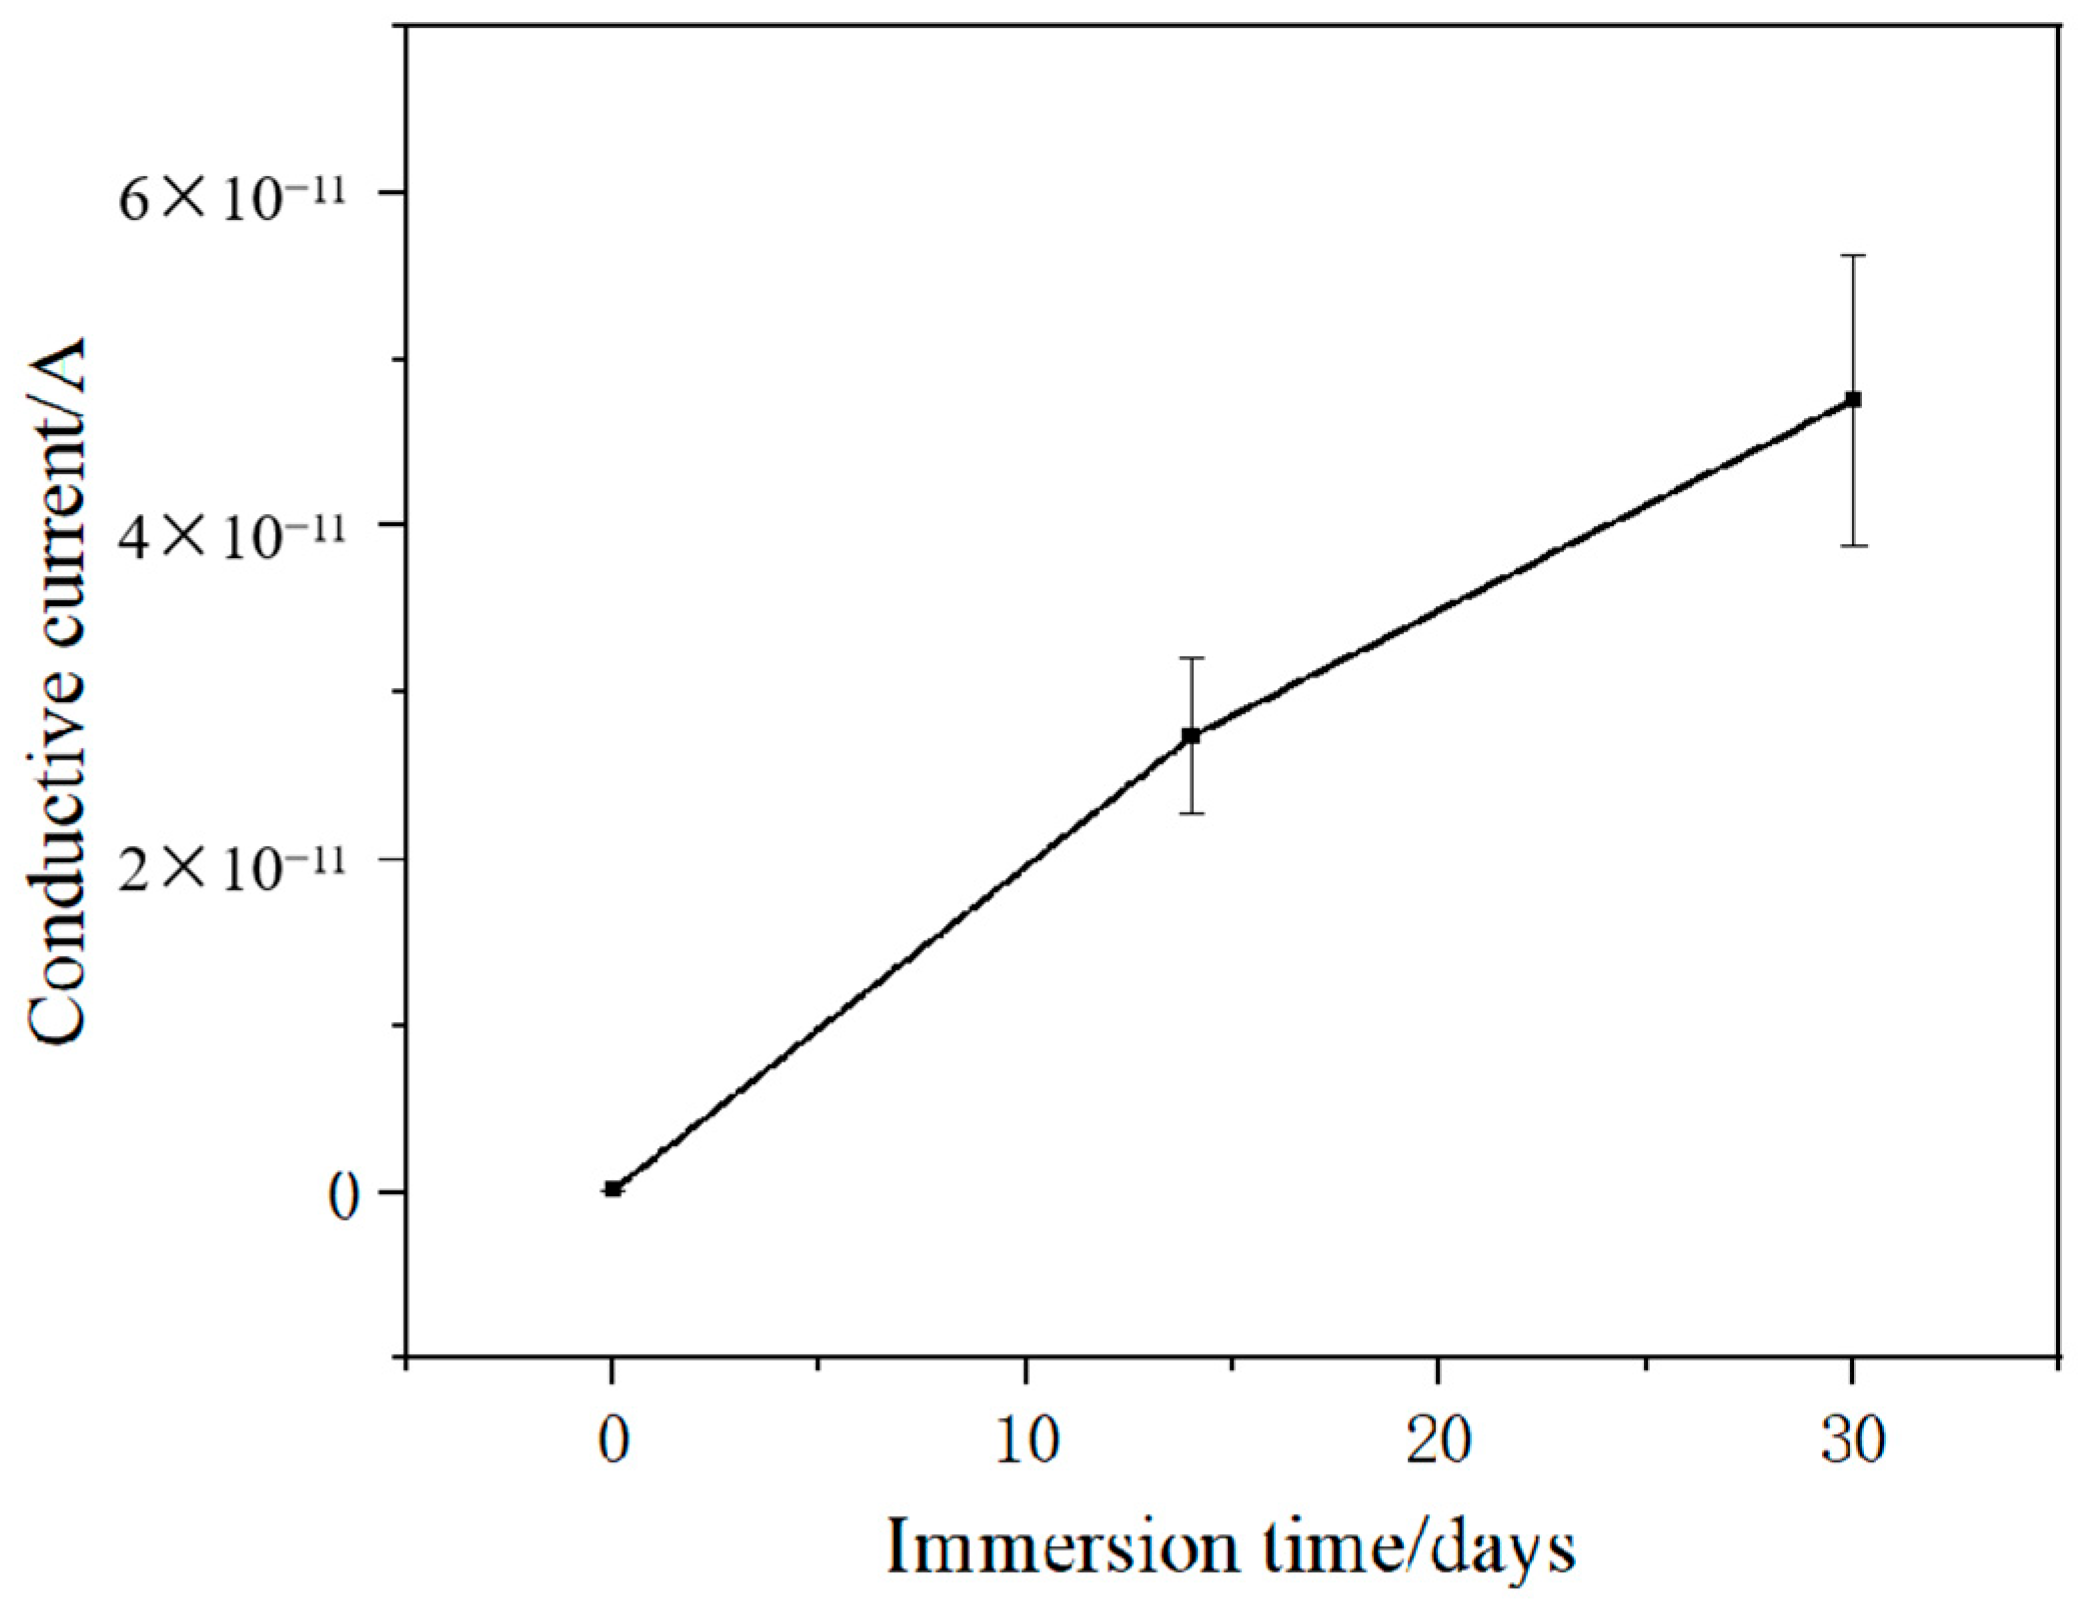
The DC conductivity of XLPE cable insulation can be derived from the polarization and depolarization currents. In this study, the steady-state value of the polarization current under a 5 kV applied voltage was employed to approximate the DC conductivity of cables with different degrees of water immersion. The measurement time is 20 min. And the average current over the last 100 s of the stabilized polarization current was taken as the conductive current value. The corresponding current values for each water immersion condition are presented in Table 1. The conductive current values of cables under different water immersion states are shown in Figure 8.
To analyze the variation pattern of the DC conductivity of XLPE cables with immersion time, the conductive current values of non-immersed cables, cables immersed for 14 days, and cables immersed for 30 days were substituted into the corresponding formula. Defined the average conductivity of cable insulation as below [21]:
σ 0 = ε 0 C 0 U 0 [ i p + i d p ]
where ε 0 is the vacuum dielectric constant, i p is the polarization current, i d p is the depolarization current, C 0 is the geometric capacitance of the cable, and U 0 is the applied voltage.
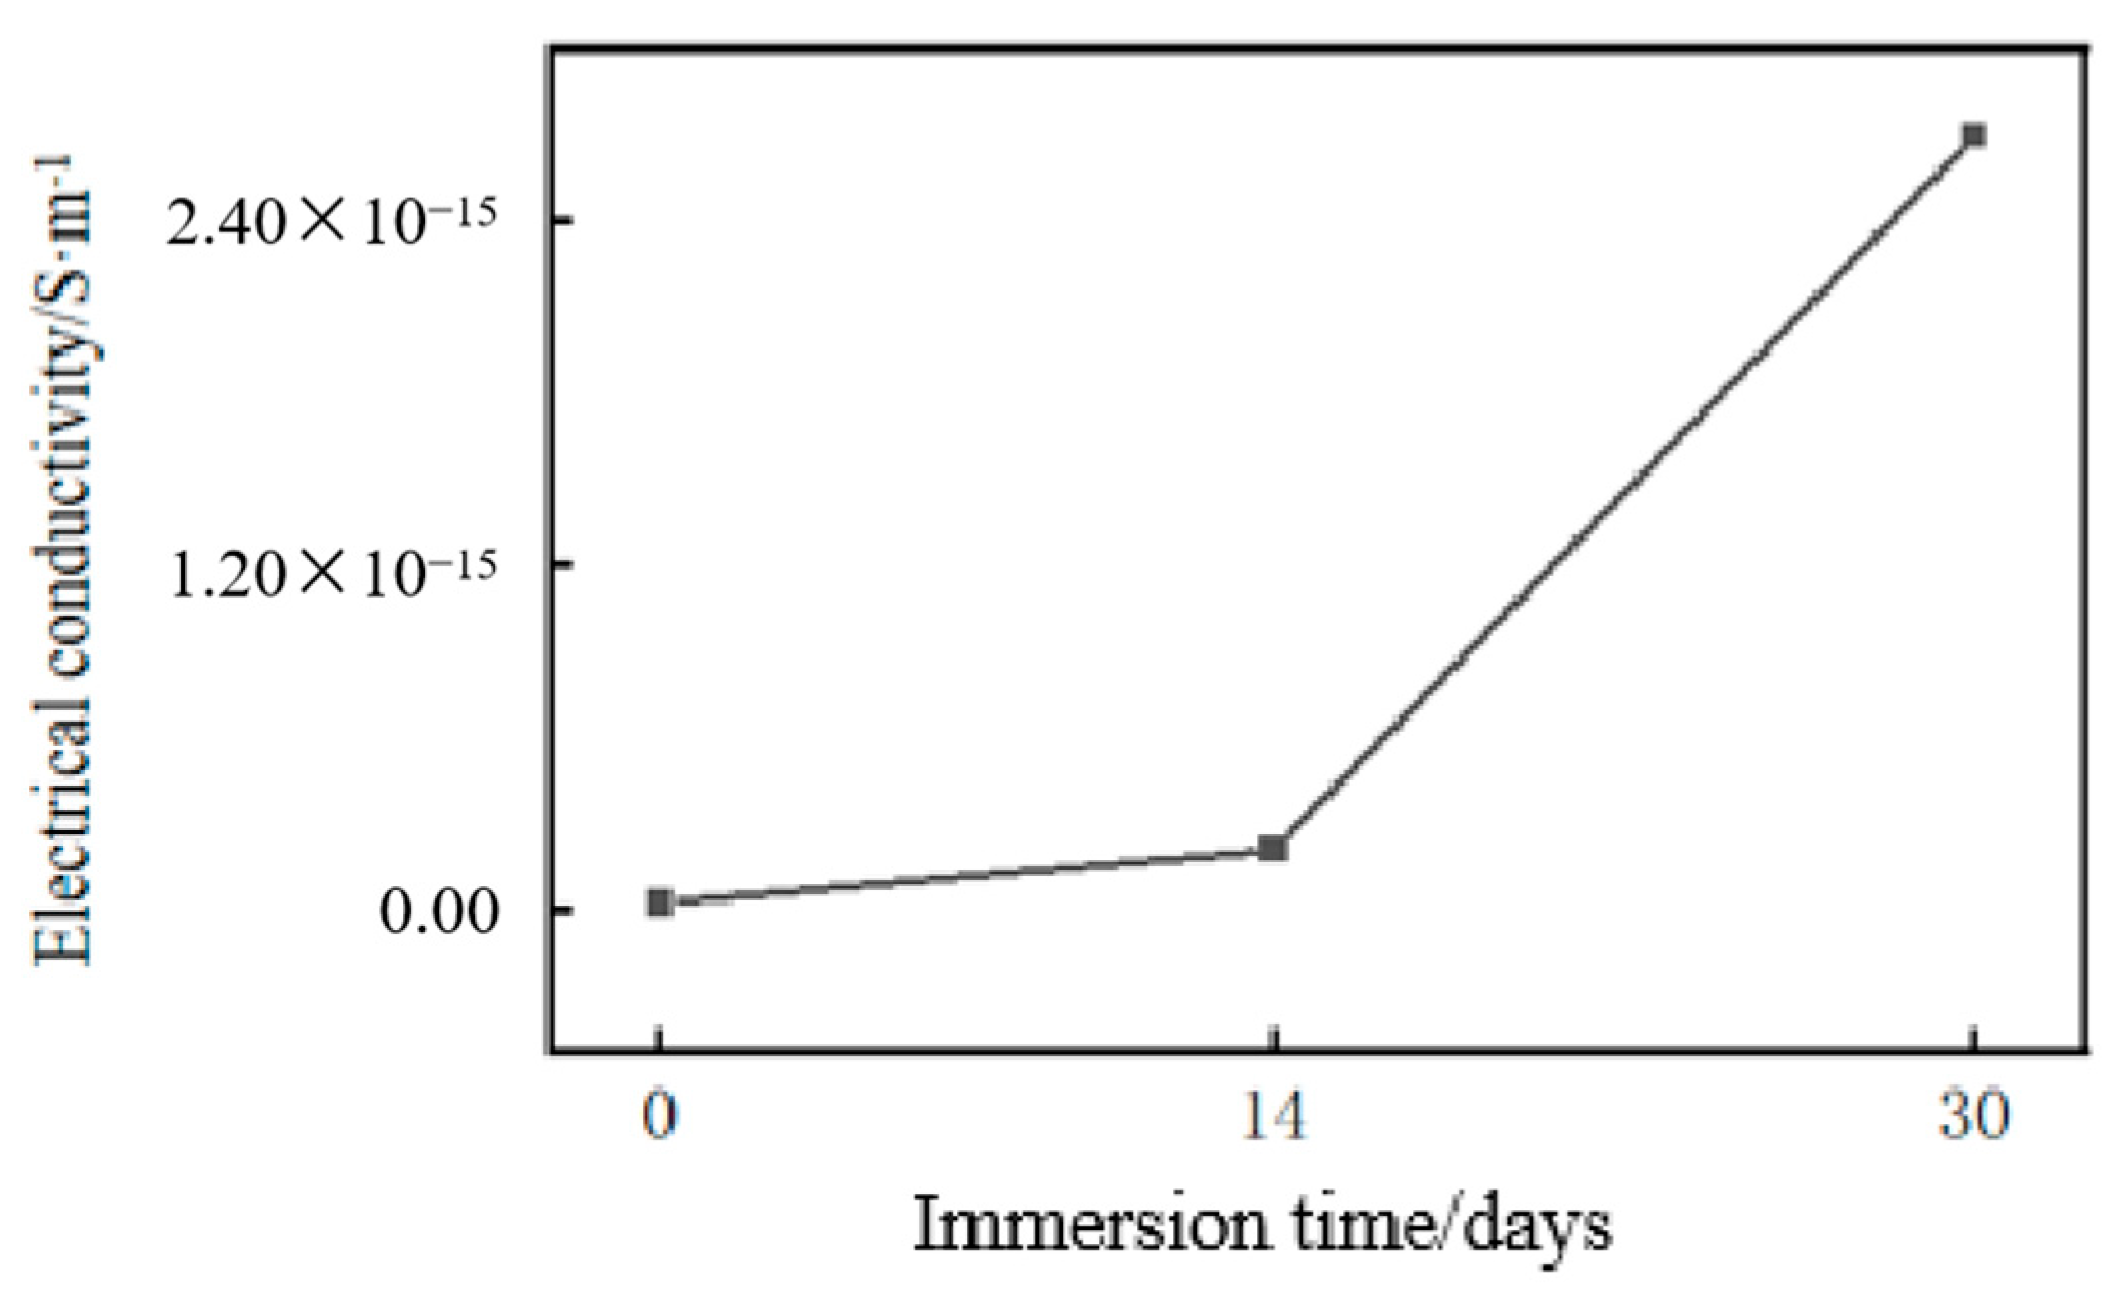
It is observed that the conductivity increases by nearly two orders of magnitude after 30 days of immersion, reaching a level on the order of 10−15 S·m−1. This range is widely recognized in literature as indicative of critical moisture saturation and serves as a key threshold associated with the severe degradation of XLPE insulation performance. Such a pronounced rise in conductivity correlates strongly with the accumulation of moisture and ions within the material, highlighting its value as a diagnostic marker for insulation failure.
The calculated conductivity is shown in Table 2.
The change of DC conductivity of cables with water immersion times is showen in Figure 9. The DC conductivity of the cable insulation exhibits a clear increasing trend with prolonged water immersion time. After 30 days of immersion, the conductivity reaches 2.70 × 10⁻¹⁵ S·m−1, representing an increase of nearly two orders of magnitude compared to the non-immersed sample (1.86 × 10⁻¹⁷ S·m−1). This significant enhancement in conductivity is attributed to the ingress of moisture, which introduces ionic species and facilitates the formation of conductive pathways within the insulation material, thereby deteriorating its dielectric performance.
With the increase in immersion time, moisture gradually diffuses from the damaged area of the cable outer sheath to the entire semiconductor layer. The ions present in the water enhance the conductivity, resulting in an increase in the amplitude of both polarization and depolarization currents. Consequently, the cable’s conductivity significantly increases with the degree of water ingress. For cables immersed for 30 days, the conductivity rises by two orders of magnitude compared to intact, non-immersed cables, reaching the level of approximately 10−15 S·m−1. At this stage, moisture has diffused to the insulation surface, causing severe degradation of the cable insulation performance. This indicates that conductivity can be used to a certain extent as a diagnostic indicator of internal water absorption and moisture condition in cables.
The carriers injected into the electrode and some ions generated by ionization are captured by traps, causing the accumulation of space charges inside the sample, and the remaining carriers form a conduction current. The total amount of space charge dissipated during the depolarization phase can be obtained by integrating the depolarization current [12], reflecting the accumulation of charges within the specimen during the polarization phase, and thereby indicating the aging degree of the specimen. The formula for calculating the total charge is as follows:
Q = 0 t d i d p ( t ) d t
In the equation, Q is the total charge (C), t d is the total duration of the depolarization phase(s) and i d p ( t ) is the depolarization current (A).
The charge density of a cable is the amount of charge per unit volume, which can be calculated by dividing the total charge of the cable by the volume of the cable’s insulation layer. The specific formula is
ρ = Q π ( r 2 2 r 1 2 ) L
In the equation, ρ is the charge density(C·m−3).
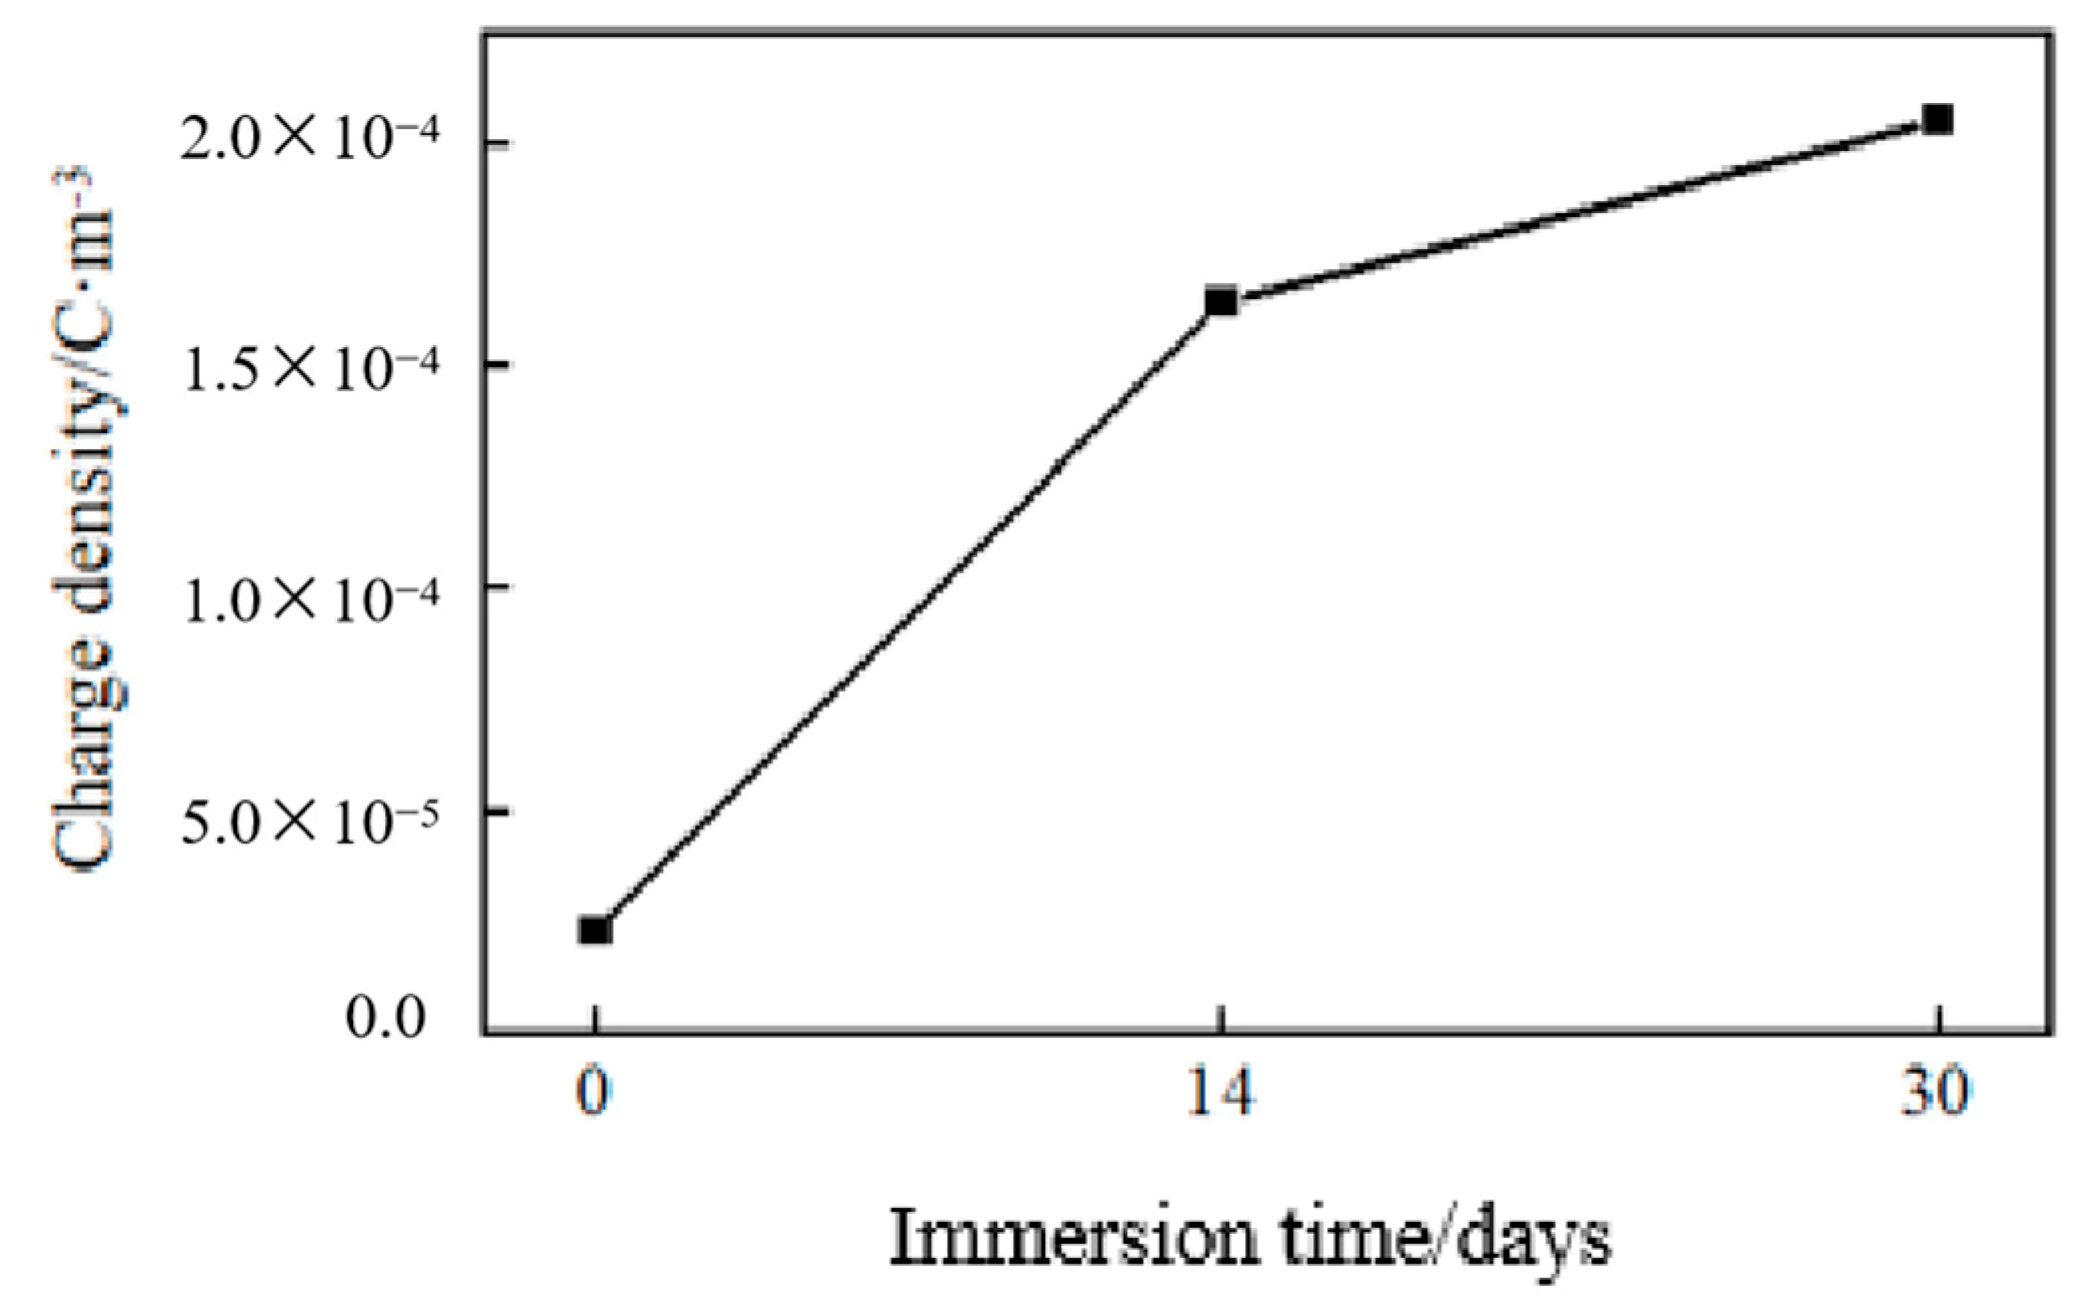
The variation pattern of the charge density of the cable with immersion time is shown in Figure 10:
Currently, there is no experimental method to directly measure charge mobility; it is typically estimated by deriving it from conductivity. The relationship between conductivity and charge mobility is expressed as follows:
μ = σ ρ
In the equation, μ is the charge mobility(m2·(V·s)−1).
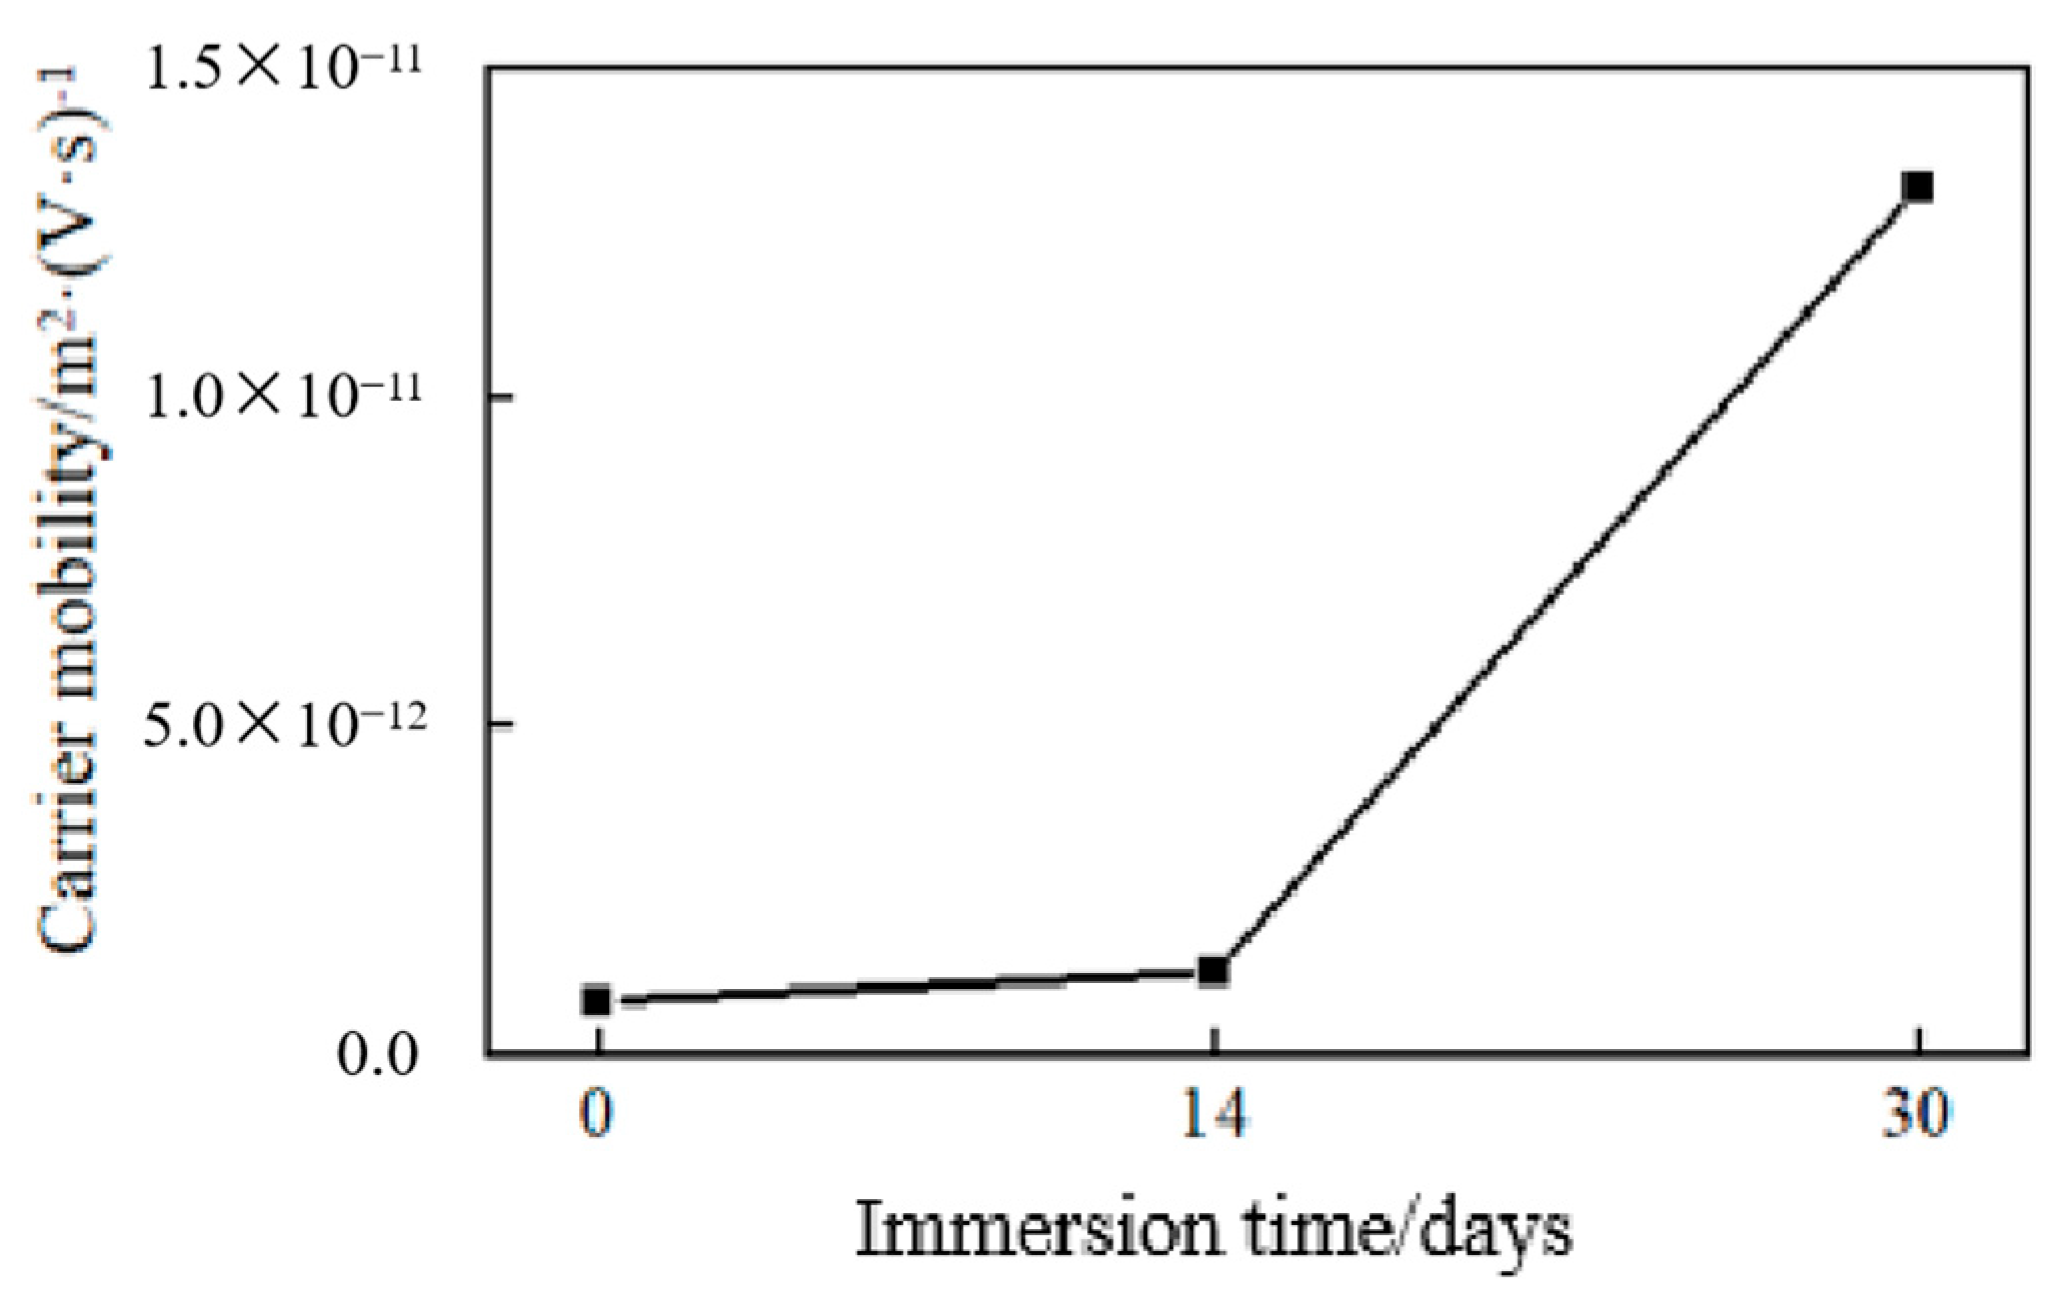
The charge mobility of cables with different immersion durations are shown in Table 3.
Under a test voltage of 5 kV, the depolarization currents of cable samples with different aging durations were integrated to calculate the total charge and charge mobility of the cables according to Equations (2)–(4), as shown in Figure 10 and Figure 11. From Figure 9, Figure 10 and Figure 11, it can be observed that both the total charge and charge mobility increase with the extension of aging time, consistent with the variation trend of conductivity.

3.3. Analysis of the Correlation Between Submerged Cable Parameters and Immersion Time

In order to establish the correlation between the degree of water ingress in XLPE cables and the macroscopic parameters obtained from PDC (Polarization and Depolarization Current) testing, this study conducted a correlation analysis between immersion time and three evaluation indices derived from cable PDC measurements: DC conductivity, charge density, and charge mobility.
We used the Pearson correlation coefficient to quantify the association between datasets, with its calculation formula defined for variables x and y .
r = n x i y i x i y i n x i 2 ( x i ) 2 · n y i 2 ( y i ) 2
In the equation: r is the Pearson correlation coefficient; n is the number of samples in the array x and y . The coefficient r ranges from [−1, 1]: positive values indicate a positive correlation, negative values a negative correlation, and absolute values closer to 1 signify a stronger correlation.
To avoid spurious correlations, we considered the significance level (quantifying the probability of no true correlation). Only when this probability is below a threshold is the correlation statistically valid; in this study, the threshold was set to 0.05.
The correlation analysis results between immersion time and the cable PDC parameters (DC conductivity, charge density, and charge mobility) are presented in Table 4.
As shown in Table 4, the significance levels of DC conductivity and charge mobility are both below 0.05, while the significance level for charge density exceeds 0.05. This indicates that DC conductivity and charge mobility exhibit a statistically significant linear correlation with immersion time. Among these, charge mobility has the highest correlation coefficient of 0.96, followed by DC conductivity with 0.91. Both coefficients fall within the range of 0.8 to 1.0, indicating a very strong correlation.

4. Study on Water Immersion Characteristics of XLPE Cable Insulation Slices

To investigate the influence of moisture on the cable insulation layer, this study employed an accelerated moisture penetration experiment. XLPE cable insulation slices were soaked in tap water at 60 °C for varying durations (0–240 h) to examine the effect of moisture ingress on the dielectric properties of the material. All tests are conducted at room temperature. Compared with conventional cable bulk immersion tests, the use of thin slices (0.2 mm thickness) significantly shortens the moisture diffusion path and eliminates interference from the cable’s multi-layer composite structure, allowing for an isolated study of the water absorption characteristics of the XLPE insulation layer. Furthermore, the slice experiments ensure consistency of samples used for weight, conductivity, and breakdown strength testing.

4.1. The Variation Pattern of Water Absorption in Submerged XLPE Samples

Prior to immersion, the weight of each cable slice was measured using an electronic balance. After soaking for the specified time intervals, samples were removed, surface moisture was wiped off, and the post-immersion weight was recorded. The moisture uptake and relative moisture uptake of the XLPE cable slices at different immersion durations are summarized in Table 5.
From Table 5, it can be observed that the overall moisture uptake of the XLPE cable slices increases with immersion time, though the rate of absorption is not uniform. Within the first 24 h of immersion, the surface and internal pores of the XLPE insulation rapidly absorb water upon contact, leading to a sharp increase in moisture uptake; the relative moisture uptake rises quickly from 0.01% to 0.11%. After 24 h, as the absorbed water fills the material’s internal voids, further moisture penetration is impeded, resulting in a significant slowdown in the moisture uptake rate. After approximately 96 h, the material approaches saturation, moisture diffusion efficiency decreases, and the moisture uptake stabilizes at around 0.16%.

4.2. The Variation Pattern of Conductivity in Water-Immersed XLPE Samples

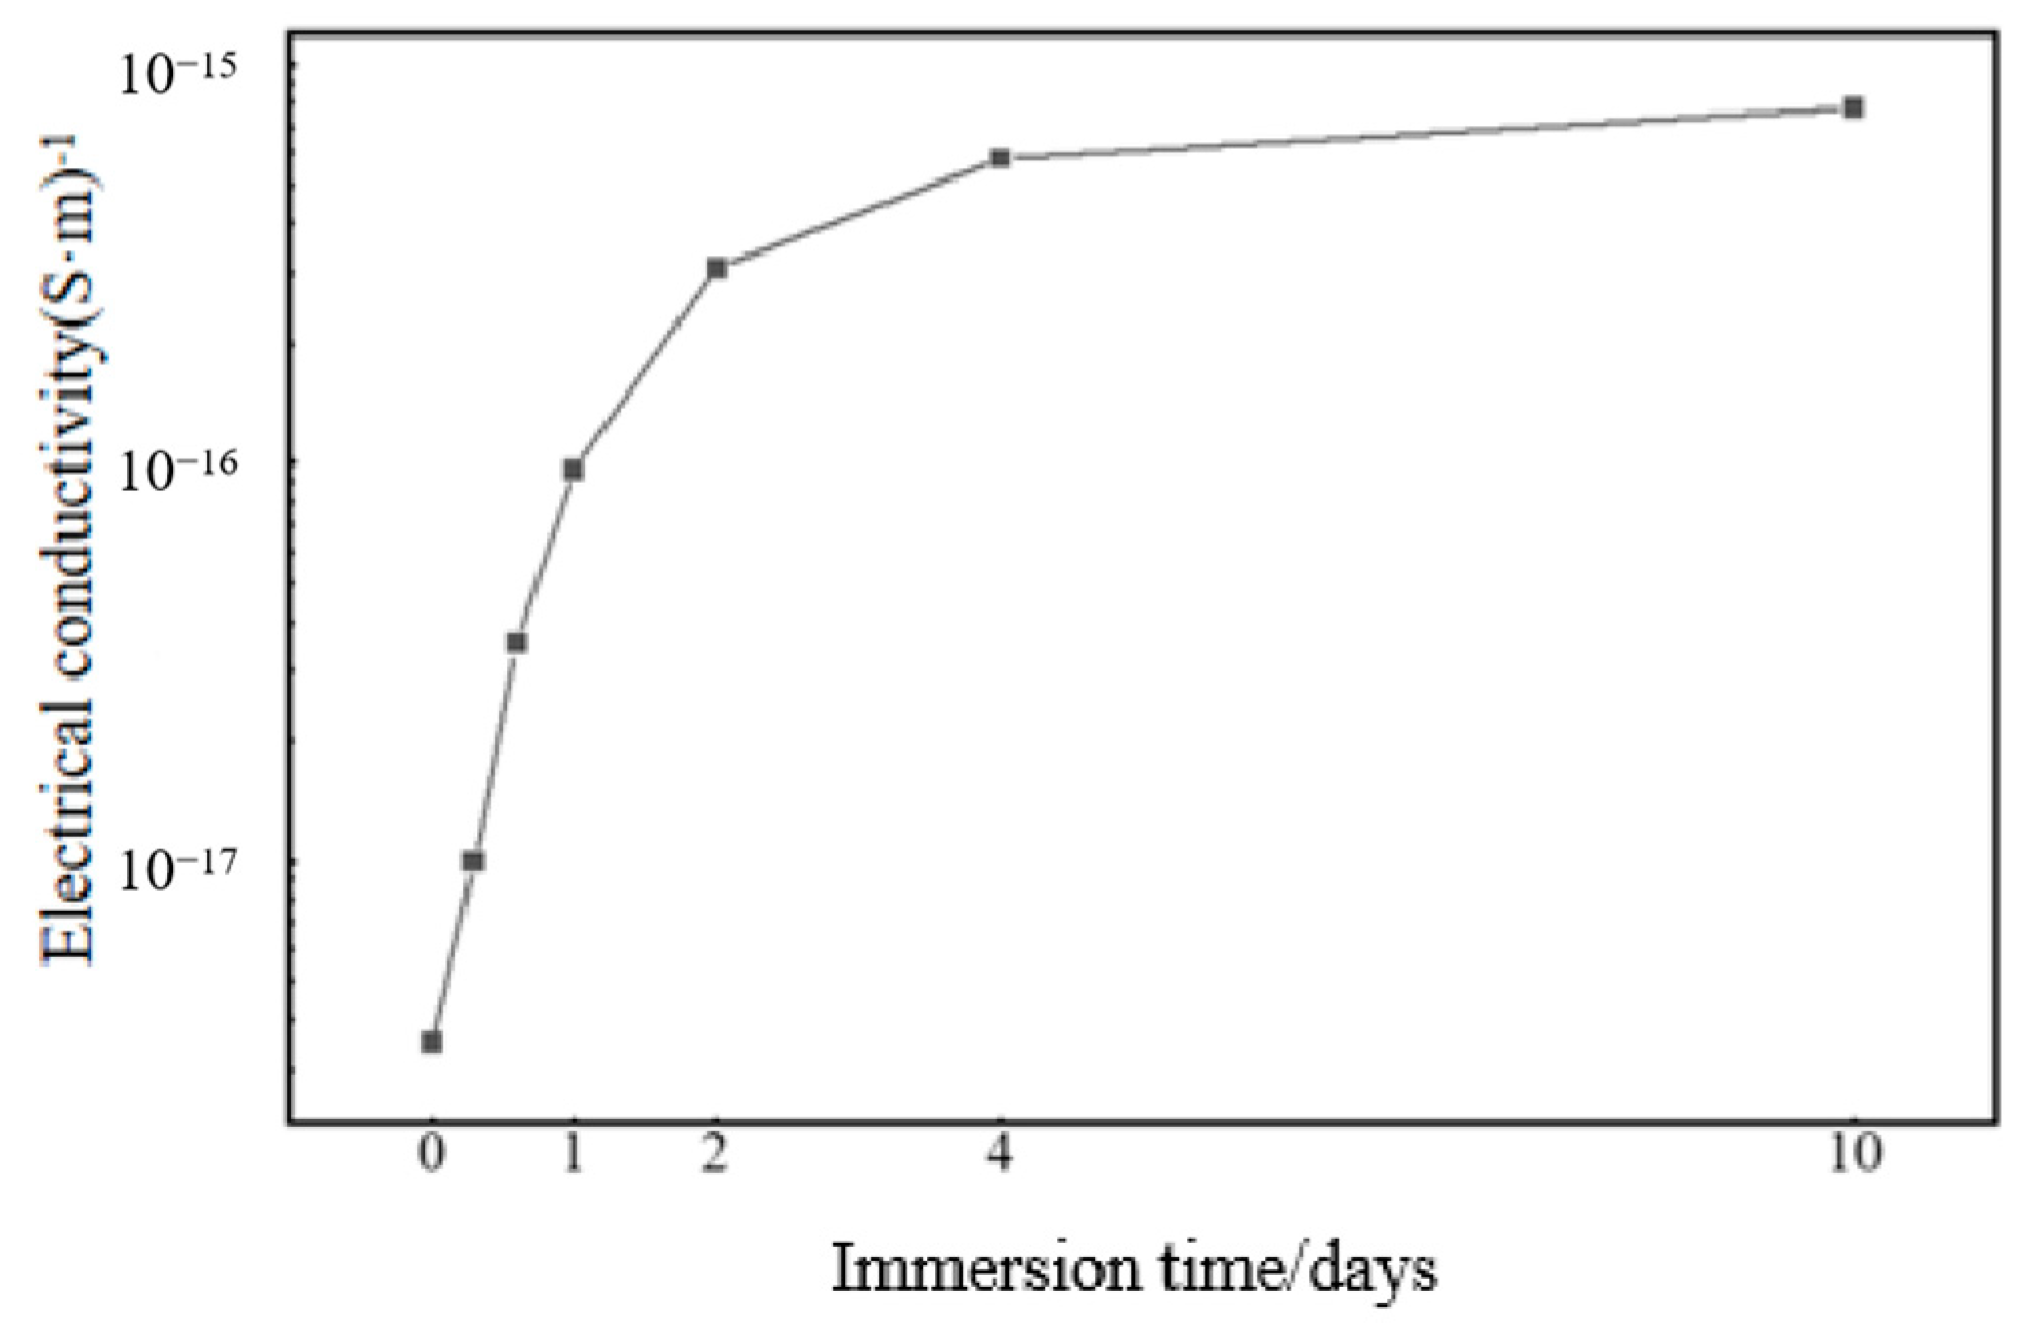
The DC conductivity of XLPE sheet samples with different immersion durations was measured under a DC electric field of 10 kV/mm, and the variation in conductivity with immersion time is shown in Figure 12.
As shown in Figure 12, the DC conductivity of XLPE cable specimens increases significantly with prolonged water immersion time, exhibiting an overall enhancement of two orders of magnitude. In the early stage of immersion, moisture penetrates the insulation material, forming conductive pathways that cause a rapid rise in conductivity. Once moisture accumulates beyond a certain threshold, conductivity undergoes a sharp increase and correlates positively with the amount of absorbed water. The presence of moisture introduces ions and establishes conductive channels, substantially degrading the insulation performance of the material. After 48 h of immersion, the specimens gradually approach saturation, and the rate of conductivity increase slows down. Initially, the cable material absorbs water quickly, but moisture uptake tends to stabilize over time. The variation law of conductivity with immersion time is similar to that in the literature [20], both of which increase rapidly first and then slowly with time. The difference in structure between the sheet sample and the cable sample results in differences in the order of magnitude and change threshold of the results.

4.3. The Variation Pattern of Breakdown Voltage in Water-Immersed XLPE Samples

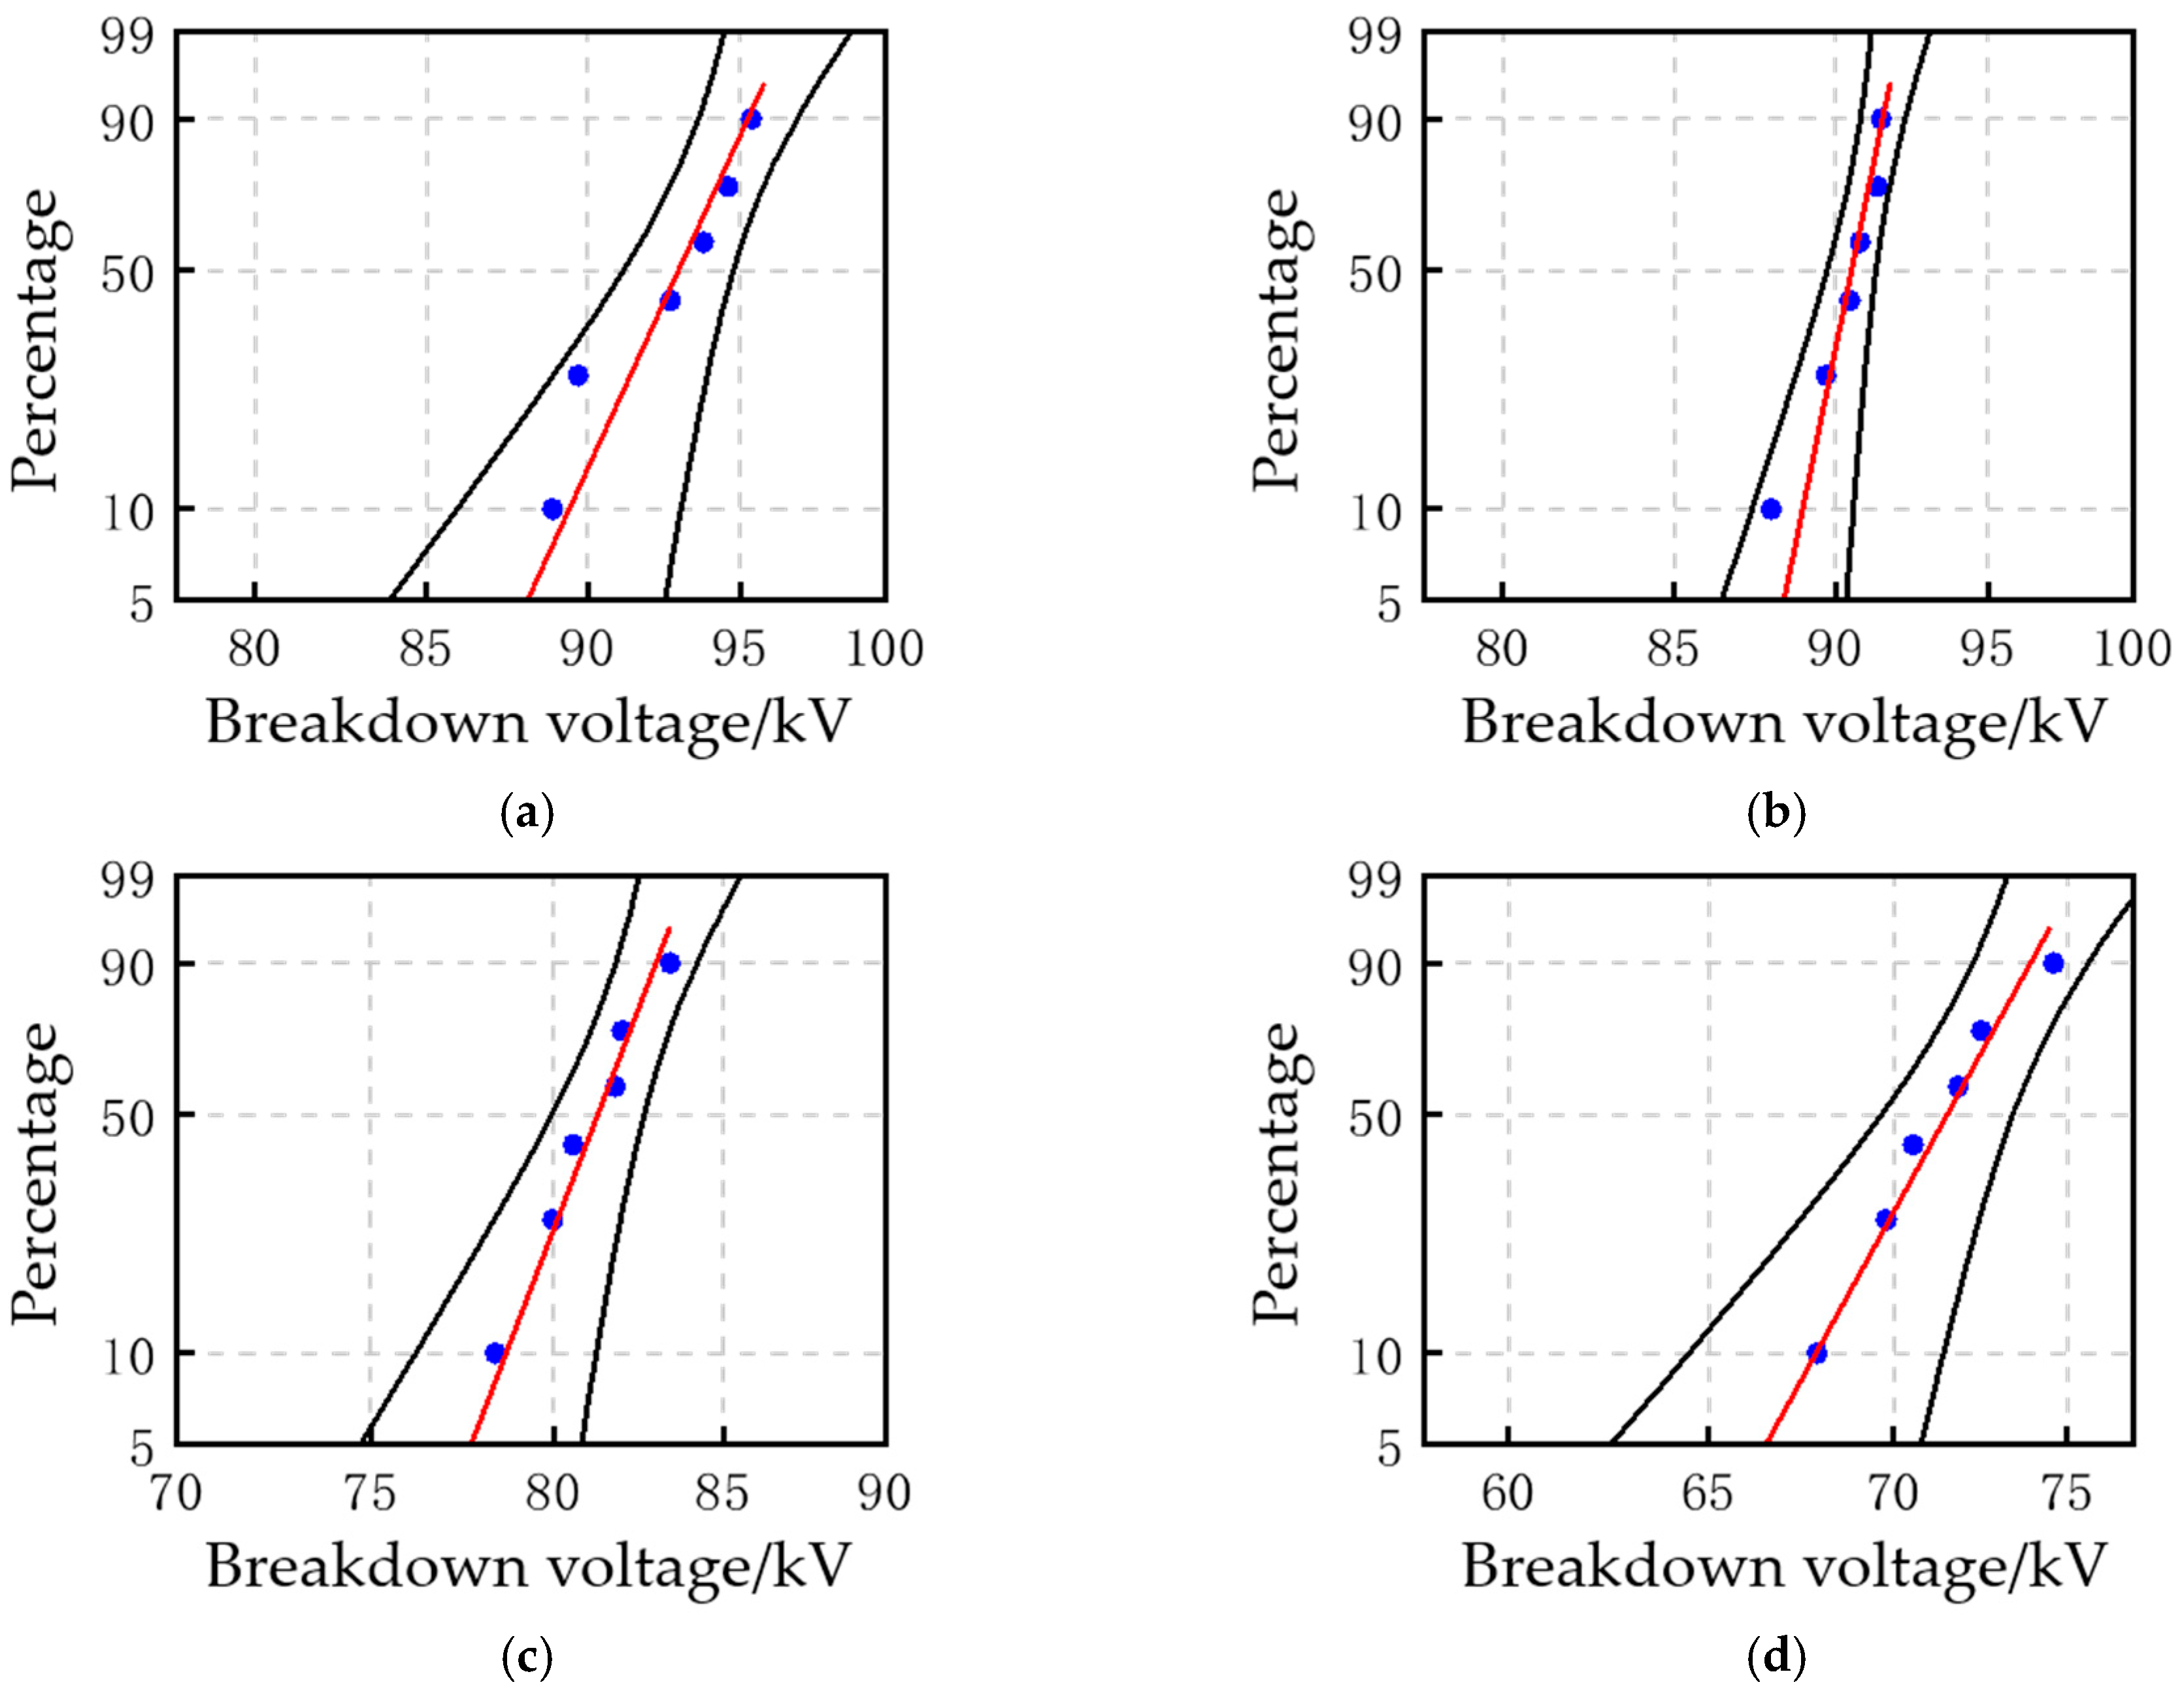
Breakdown voltage tests were conducted on slice samples subjected to different immersion durations. The DC breakdown test in this article uses a column electrode structure with a diameter of 25 mm and chamfered edges with a radius of 2 mm. The electrode and sample are immersed in mineral oil No. 25 to ensure that the entire electrode is immersed in the oil to prevent discharge. For each immersion stage, six tests were performed, and the results were analyzed using the Weibull distribution to determine the characteristic breakdown voltage, which was taken as the final breakdown voltage value. The Weibull distribution of breakdown voltage at 0, 24, 96 and 240 h of immersion is shown in Figure 13.
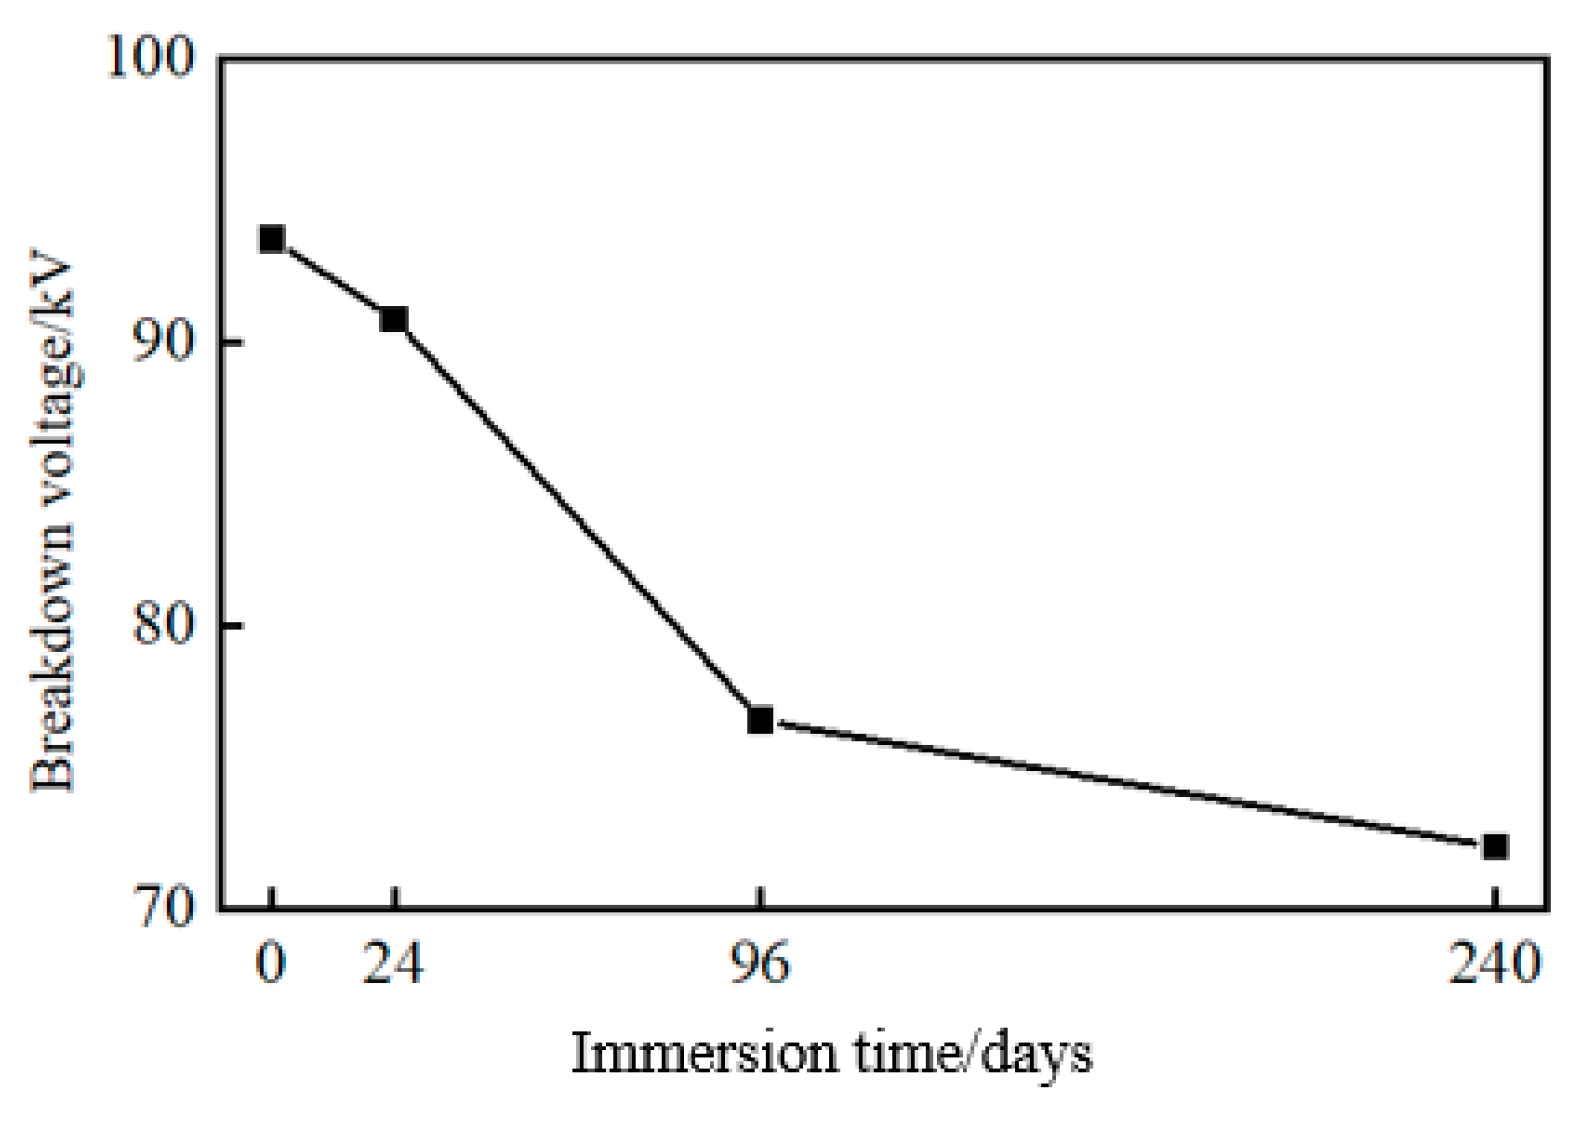
The variation in breakdown voltage with immersion time at 0 h, 24 h, 96 h, and 240 h is illustrated in Figure 14.
The characteristic breakdown voltage of the XLPE cable slices before immersion was 93.64 kV. As immersion time increased from 24 h to 240 h, the breakdown voltage progressively decreased to 66.70 kV. In the initial immersion period, the breakdown voltage exhibited a slight decrease, indicating that moisture had not deeply penetrated the insulation layer and only surface absorption caused localized performance degradation. With prolonged immersion, the breakdown voltage dropped rapidly, corresponding to moisture diffusion into the insulation interior, triggering significant deterioration such as interfacial polarization. After long-term immersion, moisture ingress into the XLPE forms multi-phase interfaces between water and XLPE, resulting in dielectric constant mismatches that lead to interfacial charge accumulation. Concurrently, ions in the water migrate under the applied electric field, generating ionic conduction and increasing conduction current. The combined effects of interfacial polarization and ionic conduction cause a decline in XLPE insulation performance, leading to reductions in both breakdown voltage and breakdown field strength.
Correlation analyses between immersion time and the cable PDC parameters (DC conductivity and breakdown voltage) were performed, with results shown in Table 6.
From Table 6, it is evident that the significance level between cable specimen immersion time and DC conductivity is below 0.05, whereas the significance level between immersion time and breakdown voltage is slightly above 0.05. Considering measurement uncertainties and the limited number of data points, it can be concluded that linear correlations exist between immersion time and both DC conductivity and breakdown voltage. The correlation coefficient between immersion time and breakdown voltage is −0.92, indicating a strong negative correlation. The absolute values of correlation coefficients for DC conductivity and breakdown voltage both fall within the range of 0.8 to 1.0, indicating very strong correlations.
At present, most of the research focuses on the dielectric properties of cable samples, and there are few studies on the breakdown characteristics of sliced samples. There are also few reports on its correlation with immersion time. This article studies it from multiple perspectives to analyze the influence of immersion state on insulation properties.

4.4. The Variation Pattern of Space Charge in Water-Immersed XLPE Samples

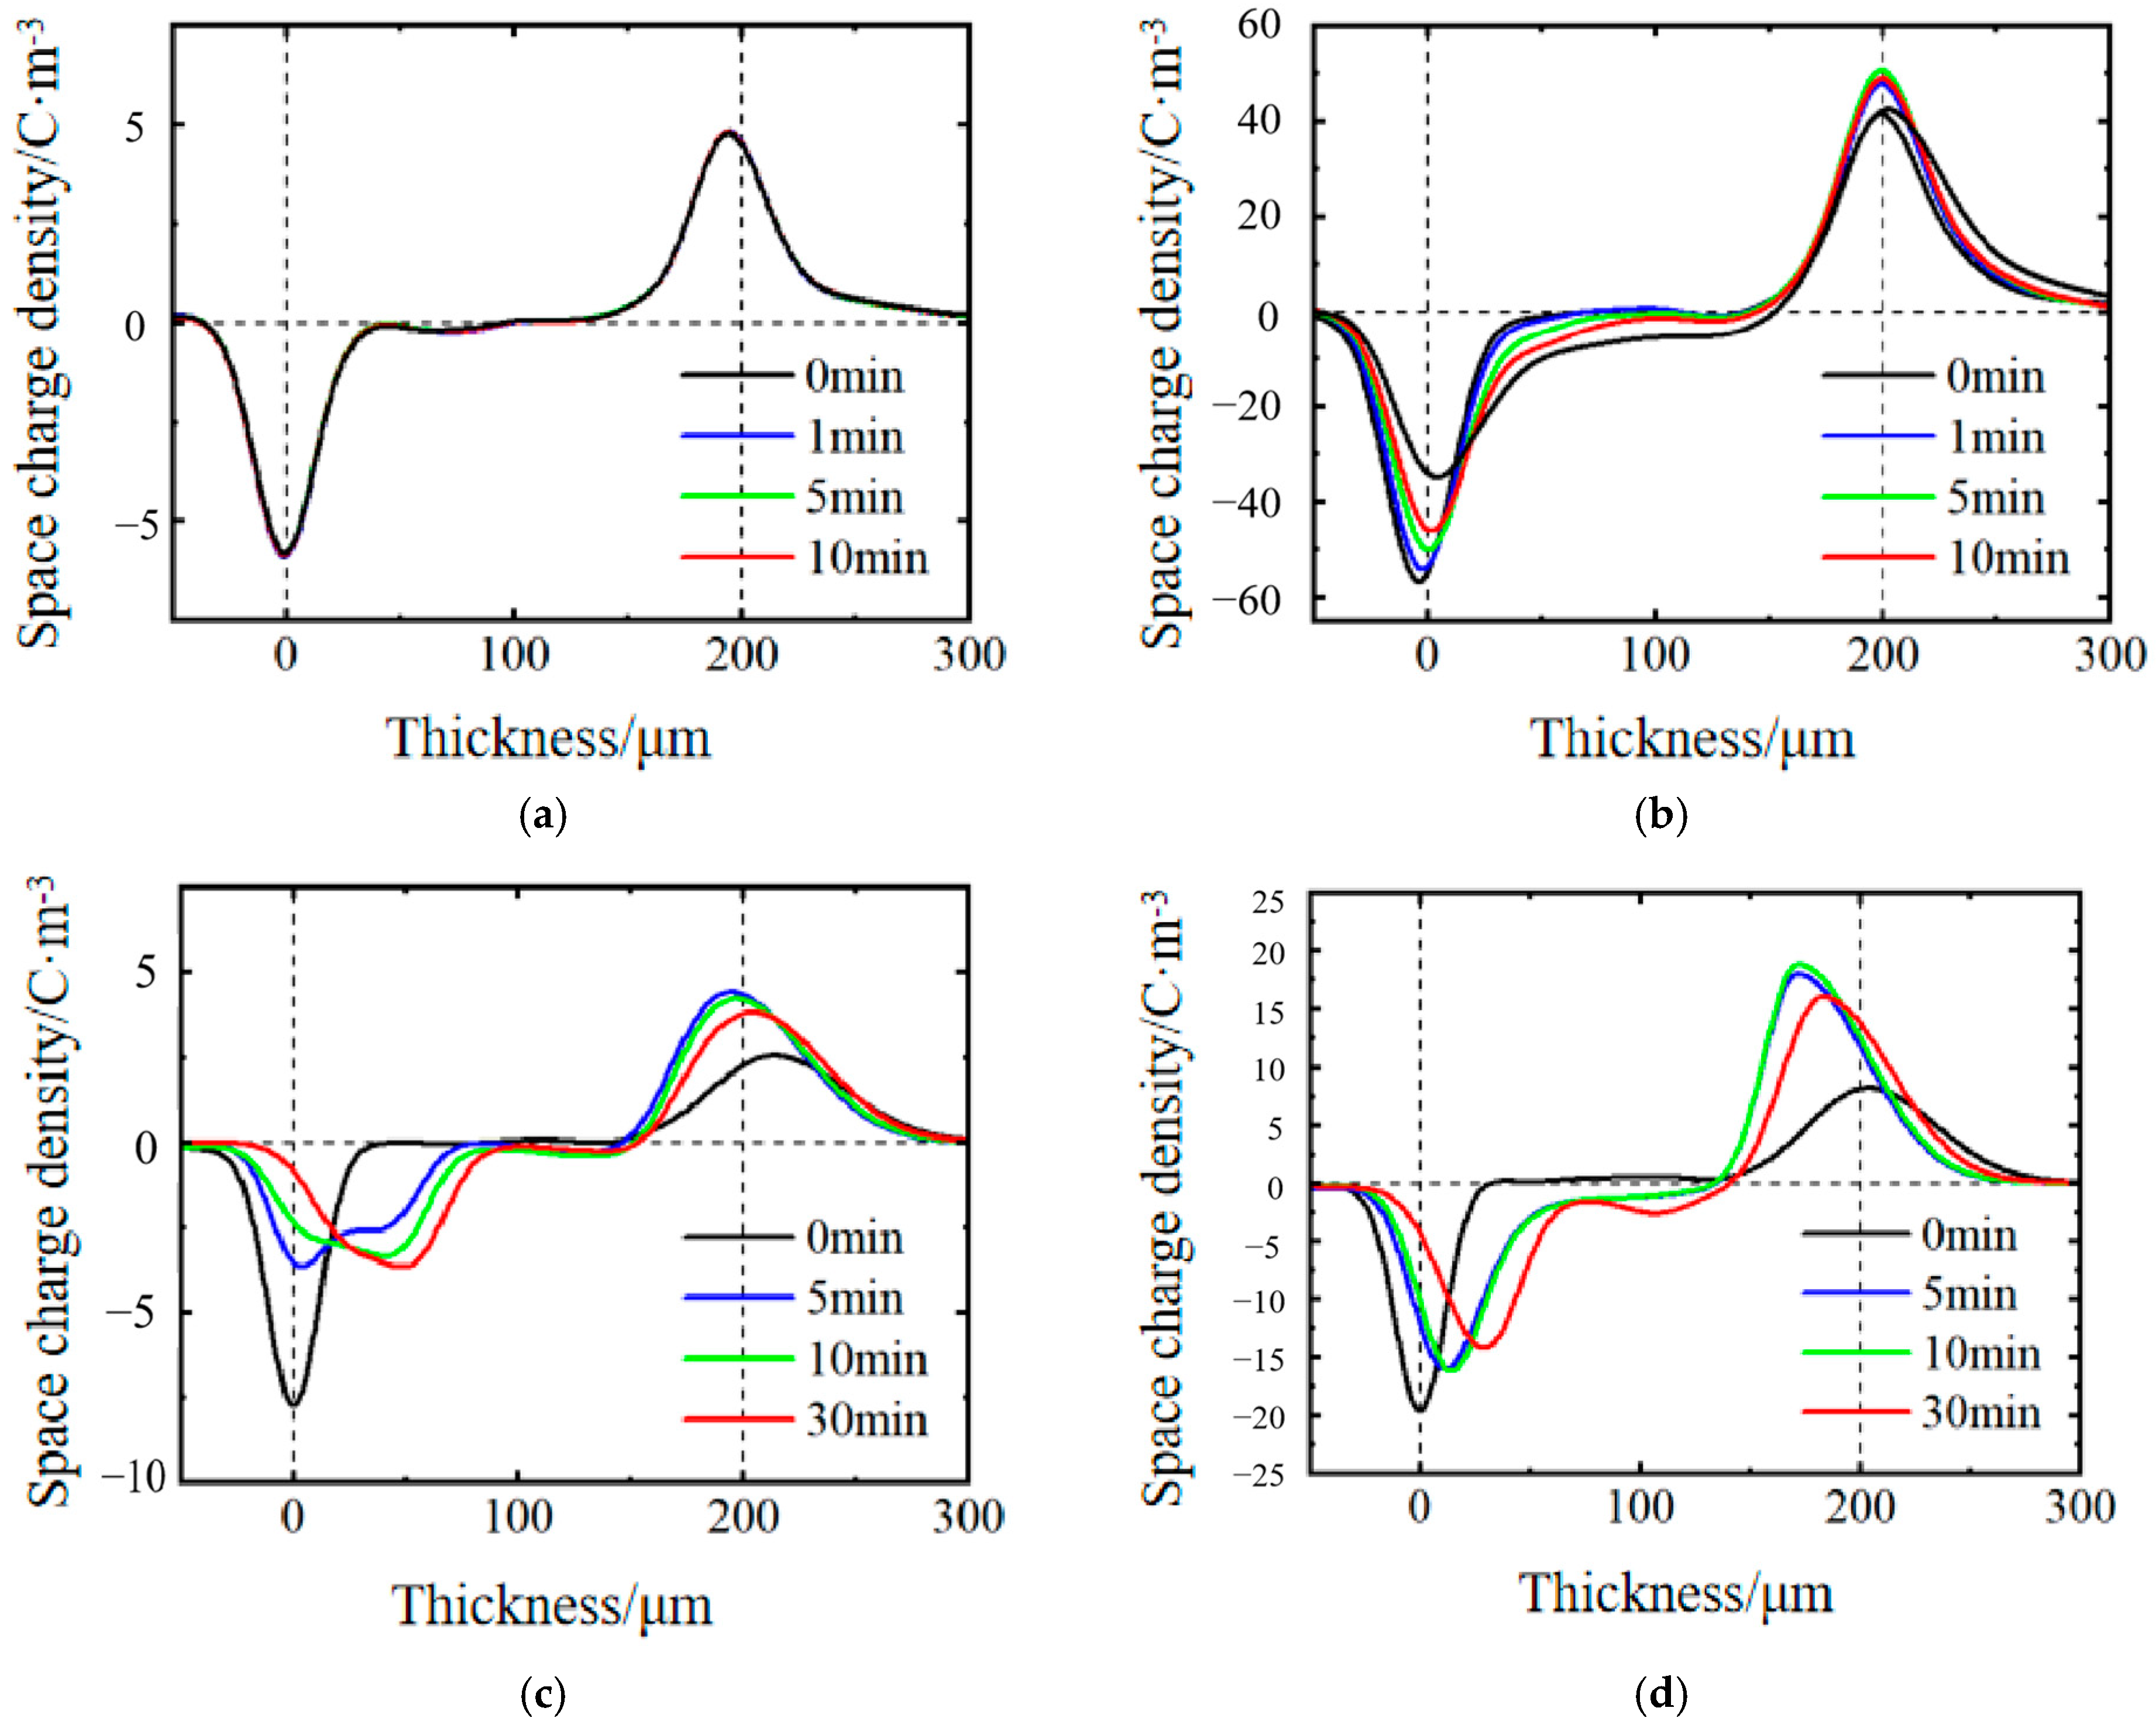
Spatial charge characteristics tests were conducted on cable specimens at immersion durations of 0, 1, 4, and 10 days. The measurement of space charge is carried out using the electroacoustic pulse method at room temperature under a 30 kV/mm DC electric field enable an in-depth analysis of the synergistic effects of moisture penetration and electric field on charge injection, migration, and accumulation. The test results are presented in Figure 15. The space charge results were measured using the electroacoustic pulse method, and the thickness corresponding to the horizontal axis changed. This indicates that moisture has infiltrated the insulation layer, causing the sound velocity in the insulation to continuously change under pressure.
According to Figure 15, the non-immersed specimen exhibits a relatively uniform space charge distribution with low charge density, indicating no influence from moisture and demonstrating the XLPE insulation material’s effective charge suppression capability. After 24 h of immersion, the amount of charge injection increases, but the charge dissipation ability remains largely intact, and charge accumulation is not yet pronounced. As immersion time extends to 96 h, moisture further penetrates the material, exacerbating spatial non-uniformity in charge distribution and causing significant charge accumulation under high electric fields. Following 240 h of immersion, with the material reaching water saturation, insulation performance deteriorates markedly. The synergistic effect of moisture and electric field likely enhances ion migration, resulting in a substantial increase in charge density, especially under 30 kV/mm where marked space charge accumulation may be observed. Moisture, acting as a polar medium, may facilitate ion dissociation and migration, forming conductive pathways, reducing material resistivity, and thereby amplifying charge injection and accumulation. Related studies have shown that there is a strong correlation between the amount of space charge inside XLPE and the depolarization current, thus the space charge characteristics also reflect the dielectric properties to a certain extent [22].

5. Conclusions

This study evaluated the insulation performance of cables subjected to different water immersion durations and investigated the impact of moisture content on cable insulation properties, yielding the following conclusions:
  • From the sliced sample experiment, it can be seen that during the initial immersion period (within 24 h), water rapidly penetrates through the surface pores, and conductivity increases by nearly an order of magnitude. After immersion for 96 h, it approaches saturation and the increase in conductivity slows down. The decay rate of polarization/depolarization currents in water-immersed cables significantly decreases with increasing immersion time, approaching saturation after 96 h of immersion.
  • DC conductivity of the cable insulation increases markedly with rising moisture content. Both the insulation conductivity and charge mobility exhibit a strong positive correlation with immersion time, serving as key indicators for assessing the degree of water ingress.
  • With prolonged immersion, the amount of accumulated space charge within the cable insulation increases, accompanied by heightened electric field distortion and a significant reduction in breakdown voltage. This phenomenon is likely attributable to moisture substantially enhancing charge mobility inside the insulation, thereby accelerating the likelihood of insulation degradation and failure.
Practical applications of the proposed dual-parameter approach: The PDC testing platform can be miniaturized and integrated into portable cable condition monitoring devices, enabling on-site non-destructive testing of underground or overhead cables. By establishing a baseline of conductivity and charge mobility for new cables, the approach can be used to periodically assess the degree of water ingress in in-service cables, triggering maintenance before degradation reaches a critical level. Combining the dual-parameter data with long-term aging models, it is possible to estimate the remaining service life of cables affected by water ingress.
It is worth noting that the proposed dual-parameter criterion (conductivity and charge mobility) demonstrates potential for application in non-destructive diagnosis of cable insulation moisture ingress. However, the current study was conducted under controlled laboratory conditions with a maximum immersion period of 30 days. Further validation under real operational environments—particularly long-term field monitoring considering varying environmental factors, cable loading conditions, and sheath damage modes—is necessary to confirm its practicality and robustness for in-service cable condition assessment.

Author Contributions

Conceptualization, Y.J. and Y.S.; Methodology, Y.J., J.Q., Y.S., J.M., J.C. and J.X.; Formal analysis, Z.L.; Investigation, J.Q., J.M., J.C. and J.X.; Data curation, J.M., J.C. and J.X.; Writing—original draft, J.M. and J.C.; Writing—review & editing, Z.L.; Supervision, Z.L.; Funding acquisition, Y.J. and Y.S. All authors have read and agreed to the published version of the manuscript.

Funding

This paper is funded by the Science and Technology Project of Beijing Prominent Electric Power Construction Co., Ltd. The project name is “Research on Detection and Assessment Technologies for Long-Term Reliability of Cables in Tunnel Environments Subjected to Prolonged Dampness and Water Immersion,” with Contract No. ZYKCJS [2024]014.

Data Availability Statement

The original contributions presented in the study are included in the article, further inquiries can be directed to the corresponding author.

Conflicts of Interest

Authors Yuyang Jiao, Jingjiang Qu, Yingqiang Shang, and Jun Xiong were employed by the company State Grid Beijing Electric Power Company Limited. The authors declare that this study received funding from Science and Technology Project of Beijing Prominent Electric Power Construction Co., Ltd. The funder was not involved in the study design, collection, analysis, interpretation of data, the writing of this article or the decision to submit it for publication. The remaining authors declare that the research was conducted in the absence of any commercial or financial relationships that could be construed as a potential conflict of interest.

References

  1. Zhou, Y.; Zhao, J.; Liu, R.; Chen, Z.; Zhang, Y. Key technologies analysis and prospects of HV/EHV power cables. High Volt. Eng. 2014, 40, 2593–2612. [Google Scholar]
  2. Raman, V.; Drissi-Habti, M. Numerical simulation analysis as a tool to identify areas of weakness in a turbine wind-blade and solutions for their reinforcement. Comp. Part B Eng. 2016, 103, 23–39. [Google Scholar] [CrossRef]
  3. Drissi-Habti, R.M. Numerical simulation of a resistant structural bonding in wind-turbine blade through the use of composite cord stitching. Comp. Part B Eng. 2019, 176, 107094. [Google Scholar]
  4. Drissi-Habti, M.; Raj-Jiyoti, D.; Vijayaraghavan, S.; Fouad, E.-C. Numerical Simulation for Void Coalescence (Water Treeing) in XLPE Insulation of Submarine Composite Power Cables. Energies 2020, 13, 5472. [Google Scholar] [CrossRef]
  5. Nie, Y.; Zhao, X.; Li, S. Research progress on condition monitoring and insulation diagnosis of XLPE cables. High Volt. Eng. 2020, 46, 1361–1371. [Google Scholar]
  6. Ye, D. Initiation Characteristics of Electrical Trees and Partial Discharge Analysis of XLPE Cables. Ph.D. Thesis, Chongqing University, Chong Qing, China, 2009. [Google Scholar]
  7. Heizmarm, T.; Zaengl, W.S. A novel diagnostic method for buriedpolymer-insulated medium-voltage cables. In Proceedings of the 8th International Symposium on High Voltage Engineering (ISH), Yokohama, Japan, 23–27 August 1993. [Google Scholar]
  8. Kuschel, M.; Kalkner, W. Relevance of the charging period to the dielectricresponse based diagnosis ofPE/XLPE cables. In Proceedings of the 1999 Eleventh International Symposium on High Voltage Engineering, London, UK, 23–27 August 1999; Volume 5, pp. 94–97. [Google Scholar] [CrossRef]
  9. Oyegoke, B.; Lyall, D.B.J. Condition assessment of XLPE cableinsulation using short-time polarisation and depolarisation current measurements. IET Sci. Meas. Technol. 2008, 2, 25–31. [Google Scholar] [CrossRef]
  10. Zhou, K.; Chen, Z.; Yin, Y.; Li, T. Research progress on water tree aging and diagnostic techniques of XLPE cables. Insul. Mater. 2019, 52, 7–14. [Google Scholar]
  11. Zhang, F.; Zhou, K.; Xie, M.; Zhao, S.; Huang, M.; He, M. Study on nonlinear dielectric response of water-treed XLPE cables. Insul. Mater. 2018, 51, 51–56. [Google Scholar]
  12. Yang, F.; Shen, Y.; Wang, Y.; Zhao, A.; Zhang, X.; Deng, J.; Zhang, G. Determination of thermal aging degree of XLPE cables based on polarization and depolarization current method. High Volt. Eng. 2016, 42, 496–503. [Google Scholar]
  13. Cai, G.; Liu, X.; Pu, J.; Zhou, K.; Huang, M. Insulation diagnosis of water tree aged cables based on PDC method. Insul. Mater. 2016, 49, 61–64, 71. [Google Scholar]
  14. Lei, Y.; Jiang, S.; Zhou, K.; Huang, H.; Li, C. Non-destructive detection of cross-linked polyethylene cable insulation based on polarization-depolarization current method. High Volt. Eng. 2015, 41, 2643–2649. [Google Scholar]
  15. Ye, G. Study on Time-Frequency Domain Dielectric Characteristics of Water Tree Aging in XLPE Cable Insulation. Ph.D. Thesis, Harbin University of Science and Technology, Harbin, China, 2016. [Google Scholar]
  16. Werelius, P. Development and Application of High Voltage Dielectric Spectroscopy for Diagnosis of Medium Voltage XLPE Cables. Ph.D. Thesis, Royal Institute of Technology, Stockholm, Sweden, 2001. [Google Scholar]
  17. Ringsberg, J.W.; Li, Z.; McCormick, R.; Fagan, N.; Stewart, G.; Marwood, T. Structural Integrity Analysis of Marine Dynamic Cables: Water Trees and Fatigue. J. Offshore Mech. Arct. Eng. 2025, 147, 1–13. [Google Scholar] [CrossRef]
  18. Jiang, Y.; Zhou, Y.J. Application of distributed partial discharge online monitoring technology in 500 kV XLPE power cable lines in Shanghai. High Volt. Eng. 2015, 41, 1249–1256. [Google Scholar]
  19. Rao, X.; Zhou, K.; Li, M.; Xie, M.; Chen, Z.; Liu, L. Parameter identification of extended Debye equivalent circuit based on depolarization current of power cable insulation. High Volt. Eng. 2020, 46, 1037–1043. [Google Scholar]
  20. Li, K.; Huo, W.; Wang, J.; Zhang, Y.; Zhou, K.; Zhu, L. Diagnosis method for local aging types of cables based on time-varying characteristics of PDC branch parameters. High Volt. Eng. 2025, 51, 1–10. [Google Scholar]
  21. Wang, W.; Chen, M.; Yin, H.; Li, Y. Comprehensive evaluation for ageing condition of XLPE cable based on radar chart of multidimensional dielectric parameters. Insul. Mater. 2024, 57, 72–79. [Google Scholar]
  22. Zhou, H.; Jiang, Y.; Kang, H.; Sun, L.; Xia, W.; Zhang, H.; Xiong, J.; Lv, Z. Combined analysis of space charge and current in different ageing stages of XLPE. Insul. Mater. 2025, 58, 87–98. [Google Scholar]
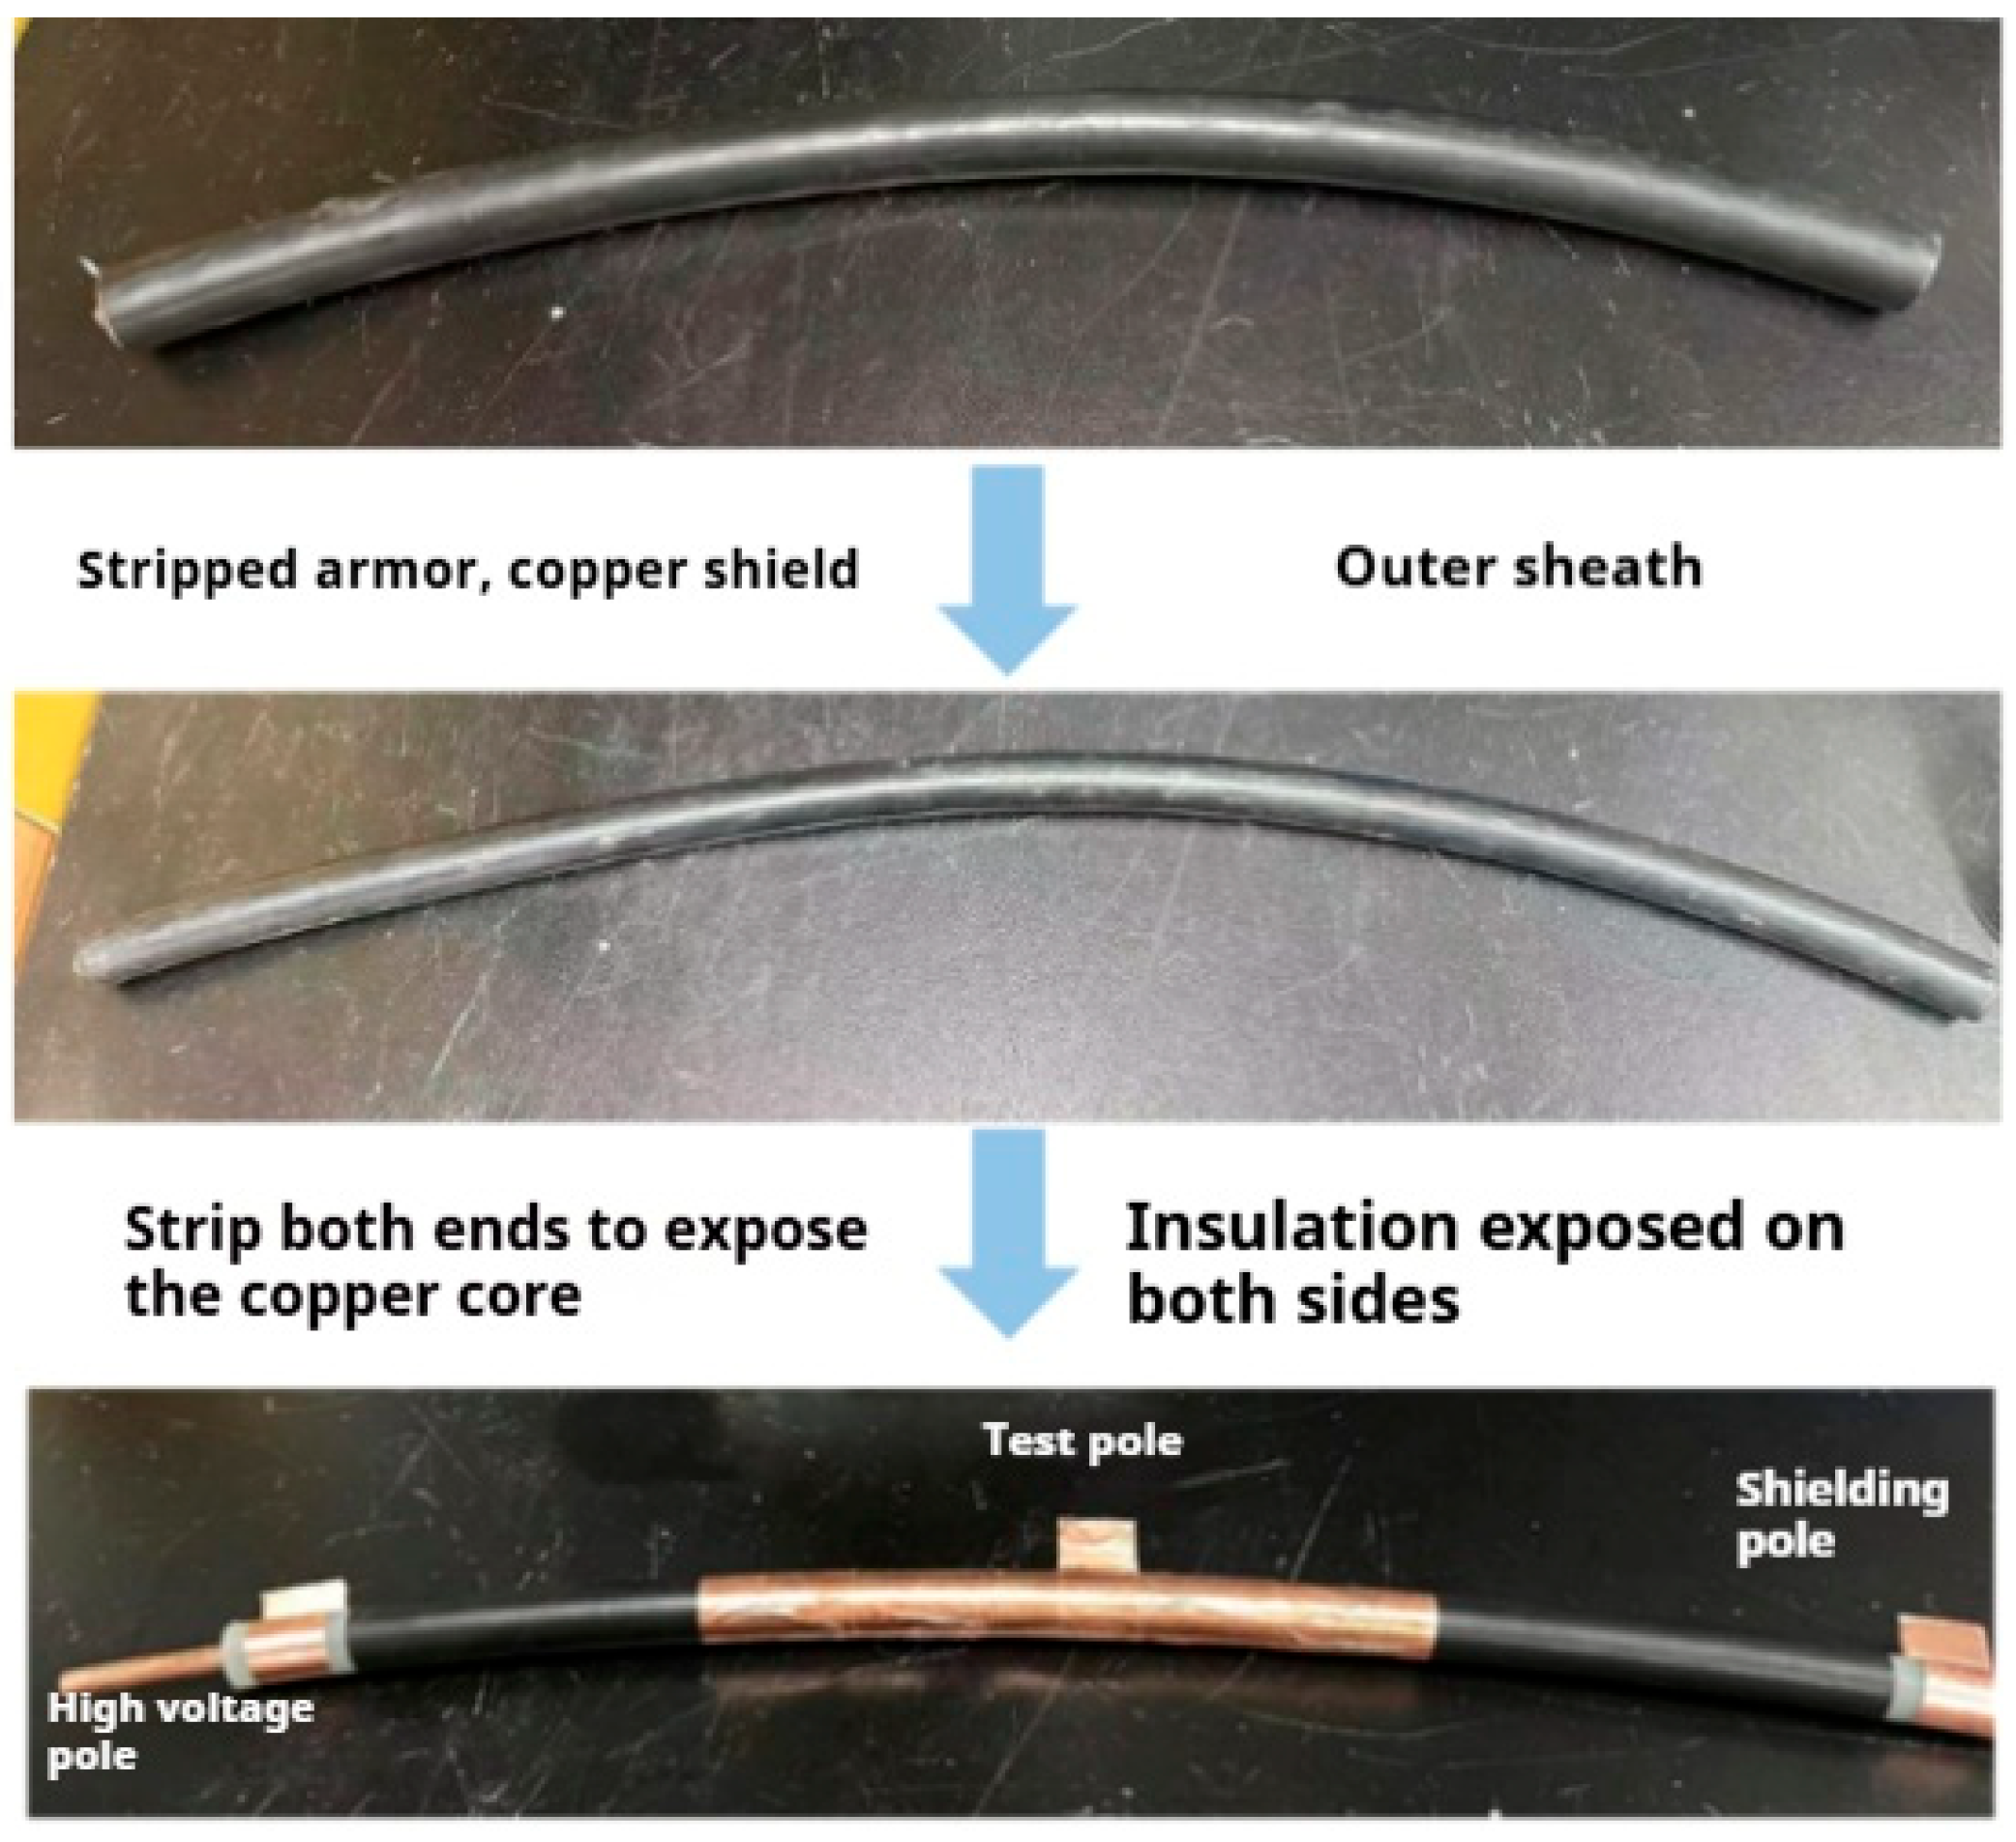
Figure 1. Cable sample preparation process and physical diagram.
Energies 18 05094 g001
Figure 2. Preparation method and physical diagram of cable insulation sheet specimens.
Energies 18 05094 g002
Figure 3. Cable specimen with exposed outer sheath.
Energies 18 05094 g003
Figure 4. Water immersion test of a cable with damaged outer sheath.
Energies 18 05094 g004
Figure 5. Schematic diagram of the cable PDC.
Energies 18 05094 g005
Figure 6. Physical diagram of the PDC test platform for cables.
Energies 18 05094 g006
Figure 7. Polarization and depolarization currents under different voltages at various water immersion durations. (a) Polarization current at 1 kV; (b) depolarization current at 1 kV; (c) polarization current at 3 kV; (d) depolarization current at 3 kV; (e) polarization current at 5 kV; (f) depolarization current at 5 kV.
Energies 18 05094 g007
Figure 8. Conductive current values of cables under different water immersion states.
Energies 18 05094 g008
Figure 9. DC Conductivity of Cables under Different Water Immersion States.
Energies 18 05094 g009
Figure 10. Charge density of cables under different immersion durations.
Energies 18 05094 g010
Figure 11. Conductivity of Cables under Different Immersion durations.
Energies 18 05094 g011
Figure 12. Electrical conductivity of XLPE sheet specimens under varying degrees of water immersion.
Energies 18 05094 g012
Figure 13. Weibull distribution of breakdown voltage of XLPE sheet specimen. (a) Non-immersed cable; (b) Cable immersed in water for 24 h; (c) Cable immersed in water for 96 h; (d) Cable immersed in water for 240 h. The blue dots, red lines, and black lines represent the original data points, the fitted Weibull function, and the boundary of the 95% confidence interval, respectively.
Energies 18 05094 g013
Figure 14. Breakdown voltage of XLPE sheet specimen.
Energies 18 05094 g014
Figure 15. Space charge test results of XLPE sheet specimens. (a) Non-immersed; (b) Immersion for 24 h; (c) Immersion for 96 h; (d) Immersion for 240 h.
Energies 18 05094 g015
Table 1. Conductive Current Values of Cables Under Different Water Immersion States.
Immersion Time/Days01430
Conductive current value/A1.45 × 10−132.74 × 10−114.76 × 10⁻¹¹
Table 2. DC Conductivity of Cables under Different Degrees of Water Immersion.
Immersion Time/Days01430
DC Conductivity/S·m−11.86 × 10−172.04 × 10−162.70 × 10⁻¹⁵
Table 3. Charge Mobility of Cables with Different Immersion durations.
Immersion Time/Days01430
Charge mobility/m2·(V·s)−18.19 × 10−135.59 × 10−122.18 × 10⁻¹¹
Table 4. Correlation Analysis of Water Immersion Criterion Parameters.
Pearson Correlation Coefficient (r)p-ValueSignificance Judgment
Conductivity0.910.027Significant
Charge density0.940.11not significant
Charge mobility0.960.017Significant
Table 5. Water absorption measurement results of XLPE cable slices.
Immersion Time/hWeight Before Immersion/gWeight After Immersion/gWater Absorption/gRelative Water Absorption
40.92060.92070.00010.01%
80.99770.99830.00060.06%
120.92040.92140.0010.11%
241.01231.01340.00110.11%
480.89340.89460.00120.13%
960.9420.94340.00140.15%
2401.06481.06660.00170.16%
Table 6. Correlation Analysis of Immersion Criterion Parameters.
Pearson Correlation Coefficient (r)p-ValueSignificance Judgment
Conductivity0.870.06Significant
Breakdown voltage−0.920.035Significant
Disclaimer/Publisher’s Note: The statements, opinions and data contained in all publications are solely those of the individual author(s) and contributor(s) and not of MDPI and/or the editor(s). MDPI and/or the editor(s) disclaim responsibility for any injury to people or property resulting from any ideas, methods, instructions or products referred to in the content.