Abstract
Snow accumulation on photovoltaic (PV) panels can cause significant energy losses in cold climates. While drone-based monitoring offers a scalable solution, real-world challenges like varying illumination can hinder accurate snow detection. We previously developed a YOLO-based drone system for snow coverage detection using a Fixed Thresholding segmentation method to discriminate snow from the solar panel; however, it struggled in challenging lighting conditions. This work addresses those limitations by presenting a reliable drone-based system to accurately estimate the Snow Coverage Percentage (SCP) over PV panels. The system combines a lightweight YOLOv11n-seg deep learning model for panel detection with an adaptive image processing algorithm for snow segmentation. We benchmarked several segmentation models, including MASK R-CNN and the state-of-the-art SAM2 segmentation model. YOLOv11n-seg was selected for its optimal balance of speed and accuracy, achieving 0.99 precision and 0.80 recall. To overcome the unreliability of static thresholding under changing lighting, various dynamic methods were evaluated. Otsu’s algorithm proved most effective, reducing the absolute error of the mean in SCP estimation to just 1.1%, a significant improvement over the 13.78% error from the previous fixed-thresholding approach. The integrated system was successfully validated for real-time performance on live drone video streams, demonstrating a highly accurate and scalable solution for autonomous snow monitoring on PV systems.
1. Introduction
The global shift toward sustainable energy systems is paramount for mitigating climate change and promoting long-term economic development. Renewable energy sources are playing a central role in this transition [1]. Among the renewable energy sources, solar photovoltaic (PV) technology has become a central component of the modern energy landscape due to its significant cost reductions and rapid technological progress [2]. As a result, PV systems are deployed at an accelerating pace across diverse geographical regions, including those characterized by significant snowfall and prolonged winter conditions.
In such climates, snow accumulation on the surfaces of PV panels presents a major operational challenge. Snow acts as an opaque physical barrier, obstructing incident sunlight and preventing photons from reaching the active photovoltaic material, thereby significantly curtailing or completely halting electricity generation. The magnitude of these snow-induced energy losses can be substantial. Studies indicate that energy losses can reach 34% due to snow removal delays [3]. The fully snow-covered modules are experiencing power reductions ranging from 38.9% to 93.2%, depending on the depth of the snow [1]. The economic impact of these energy shortages is substantial, with estimates that indicate annual losses exceeding USD 313 million in the utility and residential solar sectors in the United States alone [4].
Given these risks, accurately monitoring and estimating snow coverage in PV panels is critical to enable timely snow removal and minimize energy losses. Traditional approaches to monitoring snow on PV panels, such as manual visual inspections and fixed-camera systems [5,6,7], are recognized as inadequate for modern solar installations. Although manual inspections provide direct assessments, they are inherently inefficient, labor-intensive, and time-consuming, and pose significant safety risks to personnel, especially in harsh winter conditions and at expansive or difficult-to-access sites. While fixed-camera systems with automated snow detection have shown effectiveness for monitoring limited sections of PV panels, they face significant scalability challenges when applied to large-scale solar farms. Their stationary viewpoints may fail to capture all relevant angles or snow accumulation patterns, and they often rely on reference images for comparison, which are not always practical or readily available. While recent reviews highlight the potential of machine learning for creating more intelligent and scalable solutions [8], current applications using fixed-camera data still face some problems [4]. For instance, Araji et al. (2024) [9] developed a CNN-based model that achieves 81% accuracy for snow detection using fixed-camera data, but this approach inherently faces scalability issues for large solar farms and requires a reference no-snow image for loss estimation. Similarly, Al-Dulaimi et al. (2023) [10] utilized fixed-camera systems and deep learning models to classify snow on panels into categories such as “all_snow”, “no_snow”, and “partial”. While their proposed model is helpful for general assessment, it does not provide the precise percentage of snow coverage required for optimized operational decisions. To overcome these constraints, drone-based monitoring has emerged as a promising direction. Unmanned Aerial Vehicles (UAVs) provide flexible mobility, capture high-resolution imagery from multiple viewpoints, and can rapidly cover extensive solar farms without additional fixed infrastructure [11]. These capabilities position UAVs as a natural progression from fixed-camera solutions and establish the foundation for the research presented in this paper. This approach aligns with trends in other structural health monitoring fields, where instance segmentation models like YOLO and Mask R-CNN are being successfully deployed via drones to detect damage, such as cracks and spalls in concrete infrastructure [12,13].
Despite the promise of drone-based AI systems, real-time snow detection on PV panels from aerial imagery faces a unique set of challenges. Foremost among them is the need for immediate data processing. Real-time analysis is essential to benefit from drone inspections fully, as it enables rapid operator response, minimizes downtime, and ensures optimal energy performance during winter operations. Relying on workflows that involve post-processing introduces delays that undermine the benefit of timely inspections. An effective system must therefore provide immediate, actionable insights in the field to inform operational decisions, such as snow removal schedules. Another primary challenge is the significant variability in lighting, which occurs due to factors such as time of day, weather, shadows, and glint. It impacts both image quality and algorithm performance. Further complicating factors include perspective distortions from diverse aerial viewpoints, scale variations from changing flight altitudes, and the difficulty of distinguishing snow on panels from complex snowy backgrounds. These combined challenges can undermine the efficacy of traditional image processing methods and even some deep learning approaches. Our previous work [14] introduced a lightweight deep learning framework using the YOLOv11n model for snow detection and Snow Coverage Percentage (SCP) estimation from drone imagery. The proposed model achieved a precision of 0.93 and a recall of 0.75. While the proposed approach marked an improvement over fixed-camera systems by providing greater scalability and enhanced detection accuracy, it still has notable limitations. Specifically, it relies on a static pixel intensity threshold to distinguish between solar panels and snow, which makes it susceptible to errors under low-light or uneven illumination conditions. Moreover, the dataset used in our previous work exhibited a limited viewpoint, which affected the model’s generalization to a broader range of aerial perspectives. As a result, SCP predictions are sometimes unreliable during dawn, dusk, or overcast weather, leading to potential misclassification. We explored the sensitivity of snow detection models to varying lighting conditions using dynamic thresholding techniques in our recent work [15].
In this paper, we significantly expand upon that foundation by addressing two major limitations of the original work. First, we tackle the issue of model bias toward specific drone viewpoints through targeted data augmentation strategies. Second, we conduct a broader evaluation of the impact of dynamic thresholding by comparing multiple segmentation models, including Mask R-CNN and the state-of-the-art SAM-2 model, rather than relying solely on YOLO as in the previous study. Furthermore, we evaluate the system’s performance on real-time drone-recorded video streams under diverse aerial perspectives and illumination conditions to assess its practical feasibility for deployment. The experimental results demonstrate substantial improvements over our prior work. The enhanced YOLOv11n-seg model achieved a panel detection precision of 0.998 and a recall of 0.798, surpassing the 0.93 precision and 0.75 recall reported previously [14]. Furthermore, the proposed dynamic thresholding method proved highly effective, reducing the SCP estimation error to 1.1% compared to the 13.78% error observed with the previous fixed-threshold approach. These enhancements provide deeper insights and significantly extend the scope and contribution of the earlier work.
2. Materials and Methods
This work aims to develop a robust, real-time system for snow detection on photovoltaic (PV) panels using drone imagery. It builds upon our previously developed framework [14,15], introducing substantial improvements in data augmentation, model benchmarking, and snow segmentation methods. These enhancements specifically address the limitations of the prior approach, which relied on static thresholding and exhibited sensitivity to variations in lighting conditions when distinguishing between snow and solar panels. The overall workflow involves data acquisition and preparation, training and evaluation of multiple deep learning models for panel detection, and a comparative analysis of dynamic thresholding algorithms and segmentation models for accurate estimation of Snow Coverage Percentage (SCP).
2.1. Dataset Augmentation
In our prior work [14], 246 high-resolution aerial images of solar panels were collected using a Parrot Anafi Gov drone [16], which is equipped with a 21 MP RGB camera featuring an 84° field of view, 4K video resolution, and 32x digital zoom. The original dataset was manually annotated using polygon segmentation to define two classes: solar panel (SP) and uncovered solar panel (USP). In our previous work, we proposed two models—one that directly leveraged the two-class annotations, and another that detected solar panels as a single class and subsequently applied a static color intensity threshold to differentiate snow-covered regions from exposed panel surfaces.
To enhance model robustness and mitigate viewpoint bias in the collected dataset, we implemented a data augmentation strategy. This included orthogonal rotations (90° clockwise and counter-clockwise) and fine-grained rotations (random values from −15° to +15°) as shown in Figure 1. After the augmentation process, the total number of images was expanded to 588. The complete dataset was then split into training (70%), validation (10%), and testing (20%) sets, ensuring that images from each set were captured under different conditions to promote model generalization.
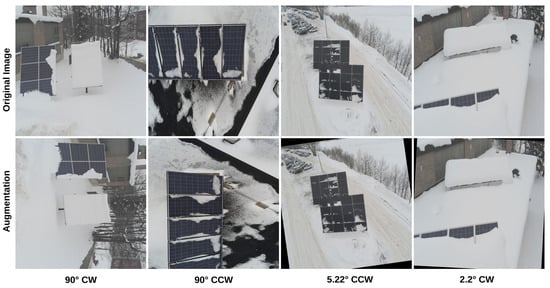
Figure 1.
Sample images from the augmented dataset with orthogonal and fine-grained rotations.
This work consists of two main stages. In the first stage, the region of interest (ROI) is extracted by detecting all solar panels in the image using either YOLO or Mask R-CNN-based models. In the second stage, the extracted ROIs are processed to distinguish snow-covered areas from exposed panel surfaces, enabling the calculation of the Snow Coverage Percentage (SCP) using either a dynamic thresholding method or the state-of-the-art SAM2 model.
2.2. Solar Panel Detection Models
2.2.1. Model Selection
To identify the optimal model that balances accuracy with real-time performance, we trained and benchmarked several state-of-the-art instance segmentation models.
- YOLOv11 Models: We evaluated YOLOv11n-seg (nano), YOLOv11m-seg (medium), and YOLOv11x-seg (extra large) [17,18]. These models were chosen to represent a spectrum of architectural complexity, enabling assessment across lightweight to high-capacity segmentation networks. Each model was initialized with COCO-pretrained weights.
- Mask R-CNN (Baseline): We also tested two Mask R-CNN models with ResNet-50 and ResNet-101 backbones [19], trained using the Detectron2 framework [20].
2.2.2. Training Process
All models were trained on the augmented dataset described in Section 2.1.
- YOLOv11 models (n, m, x) were trained for 100 epochs with input size and a batch size of 8, optimized using Ultralytics default settings (SGD with momentum = 0.937 and weight decay = ).
- Mask R-CNN models (ResNet-50-FPN and ResNet-101-FPN) were trained using Detectron2 with the standard 3× schedule (3000 iterations, base learning rate = 0.00025, momentum = 0.9).
Training and evaluation were conducted on an NVIDIA RTX 4070 GPU with PyTorch 2.2 and CUDA 12.2.
2.2.3. Hyperparameter Settings
Table 1 summarizes the hyperparameters used across different YOLO and Mask R-CNN model architectures.

Table 1.
Hyperparameter configuration for model training.
2.3. Snow Coverage Percentage (SCP) Estimation
2.3.1. Motivation and Challenges
Snow accumulation often appears as scattered snowflakes or thin, irregular patches, which presents challenges for segmentation. Annotating these fine-grained regions is time-consuming and imprecise, while training an instance segmentation model to capture every subtle variation would be computationally intensive and error-prone.
2.3.2. Two-Stage Estimation Approach
To address these challenges, we adopt a two-stage approach: (i) A segmentation model detects and isolates the solar panel, defining a precise region of interest (ROI). (ii) Within this ROI, a dynamic intensity threshold is applied to generate a binary mask, where white pixels represent snow-covered areas and black pixels indicate exposed panel regions.
2.3.3. Snow Coverage Percentage Calculation
The Snow Coverage Percentage (SCP) for each detected panel j in image i is then calculated as follows:
where is the Snow Coverage Percentage of panel j in image i, is the number of snow-covered pixels, and is the total number of pixels in the panel’s segmented area.
2.4. Dynamic Thresholding for Generating Binary Masks
In our previous work [14], we employed a fixed intensity threshold to generate the binary masks to discriminate the snow from the panel surface. However, this method proved to be unreliable, as its performance degraded significantly under the diverse and challenging lighting conditions encountered during drone flights, such as at dawn, dusk, or on overcast days. A single fixed threshold is not sufficient to handle such variability, and this limitation is a known challenge in other complex image analysis applications [21,22,23]. To overcome this limitation, this work investigates the use of dynamic thresholding techniques that can adapt to changing illumination and shadow presence. Specifically, we implemented and compared three distinct methods:
- Otsu’s Method: Otsu’s method is a global thresholding technique that automatically determines the optimal value to separate pixels into two classes (in our work, white and black pixels) by analyzing the image’s histogram. The core principle of the method is to find the threshold that minimizes the weighted intra-class variance, which is equivalent to maximizing the inter-class variance [24].
- Adaptive Thresholding [25]: Unlike Otsu’s method, which computes a single global threshold for the entire image, Adaptive Thresholding calculates a unique threshold for smaller regions of the image. This makes it particularly well suited for images with non-uniform illumination, where a single threshold would fail to capture the variations in brightness across the scene.
- HSV-based Thresholding [26]: In the HSV colorspace, each pixel is described by three intuitive attributes: hue, saturation, and value. The hue specifies the main wavelength of the color as an angle of 0° to 360°. The saturation indicates how pure or vivid that color appears on a 0–1 scale. The value measures brightness, also ranging from 0 (black) to 1 (full brightness). Unlike RGB, where red, green, and blue channels each mix both color and intensity, HSV cleanly isolates chromatic information (hue and saturation) from luminance (value). Because hue and saturation are largely invariant to lighting intensity, HSV thresholding often yields more robust, color-specific segmentation than simple grayscale or RGB thresholding, especially under variable illumination.
To establish a reliable benchmark for comparing these methods, a ground truth for the SCP was required. We created this ground truth by carefully and manually adjusting an intensity threshold for each image in our validation set. This tuning was performed to achieve the most visually accurate separation of snow and panel based on human perception, providing a pixel-perfect ground truth against which the automated methods could be fairly and accurately evaluated. The performance of each dynamic thresholding technique compared to this ground truth is detailed in the Section 3. In addition to classical thresholding techniques, we assessed the performance of a state-of-the-art, pre-trained foundation model, the Segment Anything Model 2 (SAM2) [27], for snow segmentation.
2.5. SAM2-Based Segmentation
SAM2 [27] is a unified model designed to solve promptable visual segmentation in both images and videos, extending the capabilities of its predecessor, SAM. SAM2’s architecture features a streaming transformer equipped with a memory bank, which allows it to store information about a target object and previous user interactions. Unlike the other methods, SAM2 does not require custom training on our dataset. For this evaluation, we utilized its automatic mask generation capability to segment all potential objects within the ROI of the panel, generated by the YOLO model, using the hyperparameters listed in Table 2.
Table 2.
Hyperparameter configuration for SAM2 automatic mask generation.
The SAM2 workflow in this work begins by using the YOLOv11-n annotations to extract the ROI, which is then fed into the SAM2 Automatic Mask Generator. Each mask generated by SAM2 within the ROI was then classified as “snow” if its mean grayscale intensity exceeded a fixed whiteness threshold. A final binary snow mask was created by combining all individual masks classified as snow, as shown in Figure 2. It is noteworthy that this classification strategy is fundamentally different from and more robust than the fixed-thresholding method used previously. While the fixed-threshold approach applies a single intensity value to every pixel across the entire panel to perform segmentation, this new method first leverages SAM2 to identify coherent segments. The collective intensity of its pixels then determines the classification of each segment. This makes the decision less sensitive to isolated pixel variations or minor glints, as it is based on the nature of the entire segmented region. This overall approach allowed us to assess if a powerful, general-purpose segmentation model could effectively replace traditional, pixel-based methods for this specific task without the need for model fine-tuning.
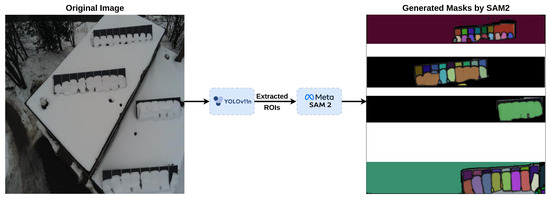
Figure 2.
Illustration of the SAM2-based segmentation process. The left panel shows the original drone image. The center indicates that the ROI extracted using the YOLOv11n-seg model is input into the SAM2 model. The right panel displays the multiple segmentation masks generated by SAM2 within the panel’s ROI. These masks are then classified as either snow or uncovered panels to calculate the SCP.
3. Results
This section presents the results of a comprehensive evaluation of the proposed snow coverage estimation method over solar panels. Segmenting the snow and calculating the SCP is handled by either the tested three dynamic thresholding methods or SAM2. Section 3.1 compares the performance of different deep learning models for detecting solar panels. Then, Section 3.2 presents an evaluation of the performance of the three dynamic thresholding methods for the estimation of the SCP. Finally, Section 3.3 demonstrates the practical usage and performance of the integrated system in live drone video streams.
3.1. Performance of Solar Panel Detection Models
To identify the most effective model for real-time solar panel detection, we benchmarked five different instance segmentation models: three variants of YOLOv11 (n-seg, m-seg, and x-seg) and two Mask R-CNN models with different backbones (ResNet-50 and ResNet-101). The quantitative performance of these models on our test dataset is summarized in Table 3. The evaluation is based on precision, recall, Mean Average Precision at an IoU threshold of 0.5 (mAP50) [28], and inference time.
Table 3.
Performance comparison of snow detection models.
- Precision: This measures the accuracy of the positive predictions, indicating the proportion of correctly identified solar panels out of all detections made by the model. It is calculated as follows:where (True Positive) is the number of correctly detected panels, and (False Positive) is the number of incorrect detections.
- Recall: This measures the model’s ability to identify all actual solar panels, representing the proportion of ground truth panels that were correctly detected. It is defined as follows:where (False Negative) is the number of actual solar panels that the model failed to detect.
- Mean Average Precision (mAP): This is a widely used evaluation metric in object detection that measures how well a model identifies and localizes objects. It is computed by averaging the Average Precision (AP) scores across all object classes. The mAP represents the area under the precision–recall curve, as illustrated in the following equations.wherewhere denotes the average precision for the k-th class, N is the total number of object classes, and indicates the precision as a function of recall.
As summarized in Table 3, the YOLOv11 models consistently outperformed the Mask R-CNN baselines across all quantitative metrics, confirming the advantage of modern transformer-enhanced architectures over traditional two-stage detectors. Among the YOLOv11 variants, the nano version (YOLOv11n-seg) emerged as the most suitable choice for our application. Architecturally, it is the smallest and most lightweight of the YOLOv11 family, which translates into lower computational cost and faster inference. Despite its compact design, YOLOv11n-seg achieved the highest precision (0.99), a strong recall (0.80), and an mAP50 of 0.86, all while delivering the fastest inference time (6.04 ms). In contrast, the larger YOLOv11m-seg and YOLOv11x-seg models offered less performance but required substantially longer inference times (14.05 ms and 36.25 ms, respectively), which undermines their practicality for real-time deployment. The Mask R-CNN models, while widely used in segmentation tasks, were both slower (85–94 ms) and less accurate, further confirming their unsuitability for this scenario. Taken together, these results justify our selection of YOLOv11n-seg, as it provides the best trade-off between model architecture efficiency, detection accuracy, and computational feasibility for real-time operation on edge devices such as drones’ companion computers.
The qualitative results, visualized in Figure 3, are consistent with the quantitative findings. The samples in this figure were specifically chosen because they contain multiple solar panels of varying sizes and rotations, captured from different viewpoints to test the robustness of each model. These images are the same images used in our previous work to provide a direct comparison of performance improvements.
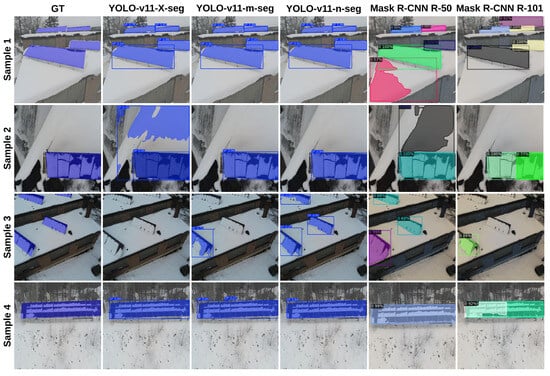
Figure 3.
Qualitative comparison of solar-panel segmentation produced by five solar panel detection models.
A close examination of Figure 3 highlights the superior performance of the YOLOv11 models compared to the Mask R-CNN models across several challenging scenarios. In Sample 1, all YOLOv11 variants produce precise segmentation masks that closely match the ground truth, effectively handling angled perspectives where the Mask R-CNN models generate inaccurate masks and fail to distinguish between the object and the surrounding background. This high performance from the YOLOv11 models continues in Sample 2, where they almost cleanly segment the panel despite challenging lighting conditions. In the same sample, the Mask R-CNN R-50 and YOLOv11-X-seg models incorrectly include background elements in their detection, and the R-101 model creates multiple overlapping masks for the single panel.
The complex scene in Sample 3 further highlights these performance gaps. Here, the YOLOv11-n-seg successfully identified all three main panels, while the larger YOLOv11-X-seg model completely failed to make any detections, and the YOLOv11-m-seg model and the Mask R-CNN R-101 detect only one of the three panels. It is also noteworthy that all models failed to detect a fourth panel that is only partially visible at the edge of the image in Sample 3. Based on this comprehensive evaluation, the YOLOv11n-seg model was selected for the subsequent task of SCP estimation.
3.2. Accuracy of SCP Estimation
Following the successful detection and segmentation of solar panels using the YOLOv11n-seg model, the next crucial step was to accurately quantify the snow coverage. To establish a robust benchmark, we first created a ground truth (GT) dataset by manually adjusting an intensity threshold for each image in the test dataset to generate the most visually accurate snow mask possible. We then compared five different methods for automatically generating the binary snow mask within each detected panel region: our previous Fixed Thresholding method, Adaptive Thresholding [14], HSV-based Thresholding, Otsu’s method, and the SAM2 segmentation model. For each method, the evaluation process followed these steps:
- For each image i containing panels, the Snow Coverage Percentage () was calculated for each individual panel j using Equation (1).
- The SCP values for all panels in image i were averaged to produce a single mean SCP for that image (), as shown in Equation (6).
- Finally, the mean SCP values from all M images in the test set were averaged to compute the overall estimated SCP ( for the given method, as described in Equation (7)).
For Fixed Thresholding, we used a global threshold value of 130 that was selected based on different empirical tests. For Adaptive Thresholding, we used Gaussian Adaptive Thresholding with a blockSize of 11 and a fine-tuning constant C set to 2. For HSV-based thresholding, snow was segmented using a lower bound of and an upper bound of . This combination of a high value, low saturation, and any hue level selection is a precise way to define “white” in the HSV color space, allowing for effective segmentation of snow from the rest of the image. The SAM2 hyperparameters are presented in Table 2, and Otsu’s method is parameter-free, as it automatically calculates the optimal threshold value. To ensure a fair comparison of different methods for estimating SCP without the results being influenced by the performance of object detection models, we use ground truth polygon labels to extract the ROIs and then apply the methods to these extracted regions.
The performance of these methods was evaluated against the ground truth, and the results are presented in Table 4. The absolute error of the mean (AEM) can be calculated using the Equation (8).
where represents the average ground truth SCP, obtained by manually applying thresholding to the images in the test dataset.
Table 4.
Performance comparison of snow coverage estimation methods.
Our previous Fixed Thresholding approach [14] had a substantial absolute error of the mean (AEM) of 13.78%. The other dynamic methods, Adaptive Thresholding and HSV-based thresholding, performed poorly, with AEMs of 12.22% and 42.45%, respectively. These methods struggled to differentiate between snow and other bright areas, such as glint and reflections on the panel surface. The analysis reveals a dramatic improvement when using a dynamic thresholding technique, with Otsu’s method standing out as the most accurate and reliable based on AEM. It achieved an error of just 1.1% with an estimated SCP of 62.80% compared to the ground truth SCP of 61.70% across the testing dataset. We also evaluated a cutting-edge segmentation model, SAM2, which achieved an estimation error of 2.68%. While SAM2’s performance outperforms our previous Fixed Thresholding, Adaptive Thresholding, and HSV methods, it was notably less accurate than Otsu’s method.
Figure 4 provides a visual comparison of the different thresholding techniques. These images were selected from our dataset due to the presence of shadows that hinder accurate SCP calculation (sample 1), challenging lighting conditions (samples 2 and 3), or the existence of fine-grained, sparse snow patches that make segmentation more challenging (sample 4).
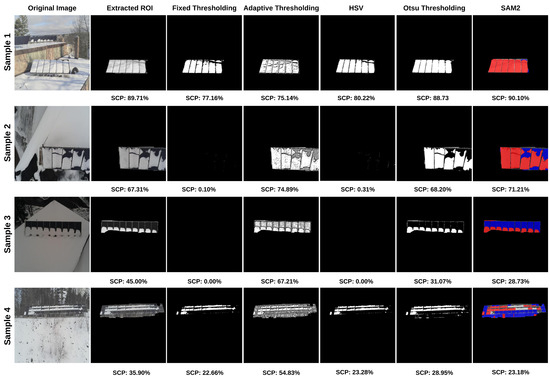
Figure 4.
Qualitative comparison of snow coverage estimation methods on four sample images. For each sample, the original image is shown, followed by the extracted ROI with its ground truth SCP. The subsequent columns display the results from five different segmentation methods: the binary snow masks generated by Fixed, Adaptive, HSV, and Otsu’s thresholding, and the segmented masks from the SAM2 model.
3.3. Real-Time Performance and Field Validation
To validate the practical applicability of our proposed framework, we evaluated the real-time performance of the YOLOv11n-seg model combined with the Otsu thresholding method. The system was tested on live video streams captured using the drone. The lightweight nature of the YOLOv11n-seg model, with an inference time of just 6.04 ms, allows real-time detection of solar panels in the video feed [29]. Subsequently, the Otsu thresholding method is applied to each detected panel’s ROI to segment the snow coverage and calculate the SCP. This entire process, from panel detection to SCP calculation, operates efficiently, enabling on-the-fly analysis directly in the field.
Figure 5 demonstrates this real-time capability, showing several snapshots from a drone’s video feed. In these images, the system first successfully detects the solar panels, outlining them with bounding boxes. The integrated Otsu method then segments the snow on each detected panel, providing a clear visual representation and the calculated SCP. This confirms the model’s ability to perform effectively in a real-world operational scenario. This work can be used to provide immediate feedback for snow removal and maintenance decisions. In addition to GPU testing, we deployed the lightweight model on a Raspberry Pi 4, where inference time was approximately 300–400 ms per frame. Although this latency is relatively high, it demonstrates feasibility on embedded hardware, and we anticipate that using more powerful edge devices such as NVIDIA Jetson boards would substantially reduce runtime and better support real-time deployment.
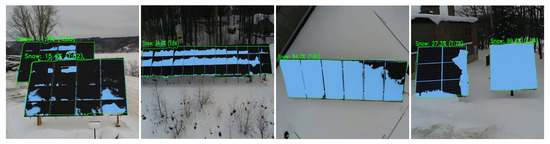
Figure 5.
Snapshots demonstrating the real-time performance of the integrated YOLOv11n-seg and Otsu thresholding system on a live drone video feed. The images show the successful detection of solar panels and the simultaneous segmentation of snow coverage along with the SCP estimation and real-time Otsu threshold value, validating the framework’s effectiveness for in-field applications.
4. Discussion
The findings of this study represent a significant advancement in the automated monitoring of PV systems in winter conditions, providing a robust, real-time, drone-based system for snow coverage detection. The growing scale of solar farms, especially in northern climates, necessitates scalable and efficient monitoring solutions to mitigate the significant energy losses caused by snow accumulation, which can reach up to 34% [3]. Our work addresses the critical need for a system that can provide accurate and timely data to inform operational decisions, such as snow removal schedules. By using high-resolution drone imagery, this framework overcomes the inherent limitations of manual inspections and fixed camera systems, which are often impractical and uneconomical for large-scale installations. Developing a real-time system is crucial, as it enables operators to react quickly to changing conditions, minimize downtime, and maximize energy efficiency during the challenging winter months. Although the framework could technically be applied to ground-captured images, our focus on UAV-based monitoring is intentional, as drones overcome the limited coverage, scalability issues, and safety concerns inherent to handheld inspections and fixed-camera systems.
This research builds directly on our previous work [14], which first developed a deep learning framework based on UAVs for estimating SCP. While that initial study demonstrated the feasibility of using UAVs for this task, it also revealed a significant shortcoming: the viewpoint bias and the reliance on a fixed pixel intensity threshold to separate snow from the panel surface. This fixed threshold method was prone to inaccuracy due to the variable light conditions inherent in real-world UAV operations and the presence of shadows. We investigated the use of dynamic thresholding methods in our recent work [15] to address the model’s sensitivity to the variable light conditions. This work successfully addresses the drone viewpoint bias by implementing an augmentation strategy on our dataset and systematically and comprehensively evaluating and implementing various dynamic thresholding techniques. We have significantly increased the robustness and reliability of snow cover estimation.
Our results confirm the effectiveness of the methodological improvements. Initial benchmarking of the panel detection models showed that the YOLOv11n-seg model offers an optimal trade-off between accuracy and computational efficiency. The model achieved an accuracy of 0.99 and an mAP@50 of 0.86, with an inference time of only 6.04 ms, outperforming the heavier and slower Mask R-CNN architectures for this application. This high performance is essential for the system’s real-time capabilities. Additionally, a benchmark of various dynamic thresholding methods was implemented. The Otsu method, which dynamically calculates an optimal threshold for each region of interest in the panel, was remarkably effective, reducing the absolute error of the mean in SCP estimation to only 1.1%. This represents a significant improvement over the 13.78% error observed with the fixed threshold approach from our previous work. As visually confirmed in our results, the adaptability of Otsu’s method allows it to accurately segment snow even in challenging scenarios with shadows and non-uniform illumination, directly addressing a key limitation of the previous system. Another key finding of this work was the comparison between the classical Otsu’s method and the state-of-the-art SAM2 foundation model. While SAM2 offered a major advantage in that it required no specific training, its performance (2.68% AEM) did not match the accuracy of the simpler Otsu algorithm (1.1% AEM).
The successful integration of the YOLOv11n-seg lightweight model with the robust Otsu thresholding method resulted in a system that has been validated for real-time performance on live UAV video streams. This confirms the feasibility of the framework as a tool for analysis during field inspections, providing operators with immediate and actionable information.
5. Conclusions
This study developed and validated a real-time drone-based framework for estimating snow coverage on photovoltaic panels. By combining YOLOv11n-seg for rapid panel detection with Otsu’s dynamic thresholding, the system achieved high accuracy and robustness to variable illumination, outperforming both fixed-threshold methods and the more complex SAM2 model. The proposed framework demonstrated a significant improvement in accuracy, reducing the absolute error of the mean in snow coverage estimation to just 1.1% using the Otsu method, compared to the 13.78% error from our previous fixed-thresholding work. We also assessed the state-of-the-art SAM2 segmentation model, which, despite its power, was less accurate (2.68% error) and computationally heavier than the simpler and more effective Otsu’s method for this task. The successful field validation on live drone video streams confirms the system’s practical applicability, offering a scalable and autonomous solution for solar farm operators to mitigate energy losses and optimize maintenance schedules in snow conditions.
The approach offers several advantages, including scalability across large solar farms without fixed infrastructure, resilience to changing light conditions, and cost-effective deployment using off-the-shelf UAVs. However, it is also subject to limitations: UAV operations are constrained by weather and flight endurance, and additional validation is needed to ensure generalization across diverse PV panel types and tracker systems. Future work will focus on integrating autonomous flight for standardized inspections, extending applicability to rotating single-axis trackers, and advancing from two-dimensional coverage to three-dimensional snow thickness estimation. Ultimately, this framework can be integrated into solar plant O&M workflows, providing real-time data to optimize snow removal and minimize energy losses in snowy regions. Additionally, future work will investigate generating synthetic drone imagery of snow-covered panels using inpainting techniques, as no publicly available datasets currently exist for this task. This synthetic augmentation will help increase dataset diversity and improve the robustness and generalization of the proposed framework. We also plan to extend the proposed system from frame-level panel detection to farm-level snow coverage estimation by aggregating results across frames, handling duplicate panel detections, and incorporating farm-scale data when available. Regarding the tested algorithms, we plan to consider fine-tuning the parameters of SAM2 to achieve the optimal configuration.
Author Contributions
Conceptualization, A.M.; methodology, A.M., A.S., K.Y. and A.D.; software, A.M. and K.Y.; validation, K.Y. and A.M.; formal analysis, A.M., K.Y. and A.S.; investigation, A.M.; resources, A.S. and A.D.; data curation, A.M. and K.Y.; writing—original draft preparation, A.M. and K.Y.; writing—review and editing, A.S. and A.D.; visualization, A.M. and K.Y.; supervision, A.M. All authors have read and agreed to the published version of the manuscript.
Funding
This research received no external funding.
Data Availability Statement
The full annotated dataset can be found at: https://github.com/RSSL-MTU/RSSL-MTU-Solar-Panel-Snow-Coverage, accessed on 10 September 2025.
Conflicts of Interest
The authors declare no conflicts of interest.
References
- Mohammadi, E.; Moschopoulos, G.; Chen, A. Boosting Solar Sustainability: Performance Assessment of Roof-Mounted PV Arrays Under Snow Considering Various Module Interconnection Schemes. Sustainability 2025, 17, 329. [Google Scholar] [CrossRef]
- International Renewable Energy Agency (IRENA). Global Energy Transformation: A Roadmap to 2050; IRENA: Abu Dhabi, United Arab Emirates, 2018. [Google Scholar]
- Pawluk, R.E.; Chen, Y.; She, Y. Photovoltaic electricity generation loss due to snow—A literature review on influence factors, estimation, and mitigation. Renew. Sustain. Energy Rev. 2019, 107, 171–182. [Google Scholar] [CrossRef]
- Abou Yassine, A.H.; Khoshbakhtnejad, E.; Sojoudi, H. Economics of snow accumulation on photovoltaic modules. Energies 2024, 17, 2962. [Google Scholar] [CrossRef]
- Zhang, X.; Araji, M.T. Snow loss modeling for solar modules using image processing and deep learning. Sustain. Energy Grids Netw. 2023, 34, 101036. [Google Scholar] [CrossRef]
- Braid, J.L.; Riley, D.; Pearce, J.M.; Burnham, L. Image analysis method for quantifying snow losses on PV systems. In Proceedings of the 2020 47th IEEE Photovoltaic Specialists Conference (PVSC), Virtual, 15 June–21 August 2020; pp. 1510–1516. [Google Scholar]
- Ozturk, O.; Hangun, B.; Eyecioglu, O. Detecting snow layer on solar panels using deep learning. In Proceedings of the 2021 10th International Conference on Renewable Energy Research and Application (ICRERA), Istanbul, Turkey, 26–29 September 2021; pp. 434–438. [Google Scholar]
- Sohani, A.; Sayyaadi, H.; Cornaro, C.; Shahverdian, M.H.; Pierro, M.; Moser, D.; Karimi, N.; Doranehgard, M.H.; Li, L.K.B. Using machine learning in photovoltaics to create smarter and cleaner energy generation systems: A comprehensive review. J. Clean. Prod. 2022, 364, 132701. [Google Scholar] [CrossRef]
- Araji, M.T.; Waqas, A.; Ali, R. Utilizing deep learning towards real-time snow cover detection and energy loss estimation for solar modules. Appl. Energy 2024, 375, 124201. [Google Scholar] [CrossRef]
- Al-Dulaimi, A.A.; Guneser, M.T.; Hameed, A.A.; Márquez, F.P.G.; Fitriyani, N.L.; Syafrudin, M. Performance analysis of classification and detection for PV panel motion blur images based on deblurring and deep learning techniques. Sustainability 2023, 15, 1150. [Google Scholar] [CrossRef]
- Parsaeifar, R.; Valinejadshoubi, M.; Le Guen, A.; Valdivieso, F. AI-Based Solar Panel Detection and Monitoring Using High-Resolution Drone Imagery. J. Soft Comput. Civ. Eng. 2025, 9, 41–59. [Google Scholar]
- Ataei, S.; Adibnazari, S.; Ataei, S.T. Data-driven detection and evaluation of damages in concrete structures: Using deep learning and computer vision. arXiv 2025, arXiv:2501.11836. [Google Scholar]
- Kim, B.; Cho, S. Automated multiple concrete damage detection using instance segmentation deep learning model. Appl. Sci. 2020, 10, 8008. [Google Scholar] [CrossRef]
- Saleem, A.; Awad, A.; Mazen, A.; Mazurkiewicz, Z.; Dyreson, A. Estimating Snow Coverage Percentage on Solar Panels Using Drone Imagery and Machine Learning for Enhanced Energy Efficiency. Energies 2025, 18, 1729. [Google Scholar] [CrossRef]
- Mazen, A.; Saleem, A.; Yazdipaz, K.; Dyreson, A. Real-Time Drone-Based Snow Detection for PV Systems Using Robust Lightweight Deep Learning Models. In Proceedings of the 2025 IEEE 53rd Photovoltaic Specialists Conference (PVSC), Montreal, QC, Canada, 8–13 June 2025; pp. 1636–1638. [Google Scholar]
- Florida Drone Supply. Parrot Anafi USA Gov Edition; Florida Drone Supply: Fort Myers, FL, USA, 2025. [Google Scholar]
- Khanam, R.; Hussain, M. YOLOv11: An Overview of the Key Architectural Enhancements. arXiv 2024, arXiv:2410.17725. [Google Scholar] [CrossRef]
- Ultralytics. Available online: https://github.com/ultralytics/ultralytics (accessed on 10 July 2025).
- He, K.; Gkioxari, G.; Dollár, P.; Girshick, R. Mask R-CNN. In Proceedings of the IEEE International Conference on Computer Vision (ICCV), Venice, Italy, 22–29 October 2017; pp. 2961–2969. [Google Scholar]
- Wu, Y.; Kirillov, A.; Massa, F.; Lo, W.Y.; Girshick, R. Detectron2. Available online: https://github.com/facebookresearch/detectron2 (accessed on 10 July 2025).
- Hu, P.; Han, Y.; Zhang, Z.; Chu, S.-C.; Pan, J.-S. A Multi-Level Thresholding Image Segmentation Algorithm Based on Equilibrium Optimizer. Sci. Rep. 2024, 14, 29728. [Google Scholar] [CrossRef] [PubMed]
- Al-Amri, S.S.; Kalyankar, N.V.; Khamitkar, S.D. Image Segmentation by Using Threshold Techniques. J. Comput. 2010, 2, 83–86. [Google Scholar]
- Ariyanfar, A.; Klein, K.; von Rechenberg, B.; Darwiche, S.; Dailey, H.L. Adaptive Image Segmentation Reveals Substantial Cortical Bone Remodelling During Early Fracture Repair. Comput. Methods Biomech. Biomed. Eng. Imaging Vis. 2024, 12, 2345165. [Google Scholar] [CrossRef] [PubMed]
- Otsu, N. A Threshold Selection Method from Gray-Level Histograms. IEEE Trans. Syst. Man Cybern. 1979, 9, 62–66. [Google Scholar] [CrossRef]
- Bradley, D.; Roth, G. Adaptive Thresholding Using the Integral Image. J. Graph. Tools 2007, 12, 13–21. [Google Scholar] [CrossRef]
- Hema, D.; Kannan, D.S. Interactive Color Image Segmentation Using HSV Color Space. Sci. Technol. J. 2019, 7, 37–41. [Google Scholar] [CrossRef]
- Ravi, N.; Gabeur, V.; Hu, Y.T.; Hu, R.; Ryali, C.; Ma, T.; Khedr, H.; Rädle, R.; Rolland, C.; Gustafson, L.; et al. SAM 2: Segment Anything in Images and Videos. arXiv 2024, arXiv:2408.00714. [Google Scholar]
- Sokolova, M.; Lapalme, G. A Systematic Analysis of Performance Measures for Classification Tasks. Inf. Process. Manag. 2009, 45, 427–437. [Google Scholar] [CrossRef]
- RSSL-MTU. RSSL-MTU-Solar-Panel-Snow-Coverage. GitHub Repository 2023. Available online: https://github.com/RSSL-MTU/RSSL-MTU-Solar-Panel-Snow-Coverage (accessed on 18 July 2025).
Disclaimer/Publisher’s Note: The statements, opinions and data contained in all publications are solely those of the individual author(s) and contributor(s) and not of MDPI and/or the editor(s). MDPI and/or the editor(s) disclaim responsibility for any injury to people or property resulting from any ideas, methods, instructions or products referred to in the content. |
© 2025 by the authors. Licensee MDPI, Basel, Switzerland. This article is an open access article distributed under the terms and conditions of the Creative Commons Attribution (CC BY) license (https://creativecommons.org/licenses/by/4.0/).