Abstract
Anaerobic digestion (AD) plays a crucial role in renewable energy production and waste management by converting organic waste into biogas and reduces greenhouse gas emissions. Optimized bioreactor performance depends on two main categories of factors: (1) reactor and geometric factors of agitator geometry, blade configuration, rotational speed, torque, power consumption, and the impeller-to-tank ration (d/D), and (2) fluid property factors of viscosity and flow characteristics, which relates turbulence, circulation patters, and stratification. Impeller power strongly influences nutrient distribution, gas exchange, and temperature uniformity within the reactor. While higher power inputs improve turbulence and prevent stratification, they also increase energy demand. This study evaluated fifteen blade configurations to determine the optimal fluid circulation using ANSYS 2024 R1 Fluent simulations. The bioreactor tank, with a diameter of 0.130 m and a height of 0.225 m, was tested at speeds ranging from 40 to 150 RPM. Among the single-blade configurations, the curved blade achieved the highest velocity at 0.521 m/s, generating localized circulations. The Rushton blade produced strong radial flows with a velocity of 0.364 m/s, while the propeller blade reached 0.254 m/s, supporting axial flow. In double-blade arrangements, the curved-propeller combination exhibited velocities between 0.261 and 0.342 m/s, enhancing fluid motion. The three-blade configurations resulted in the highest power consumption, ranging from 1.94 W to 1.99 W, with power increasing at higher RPMs and larger impeller sizes. However, torque values decreased over time. The most efficient mixing was achieved at moderate RPMs (80–120) and an impeller-to-tank diameter ratio (d/D) of approximately 0.75. These findings highlight the significance of blade selection in balancing mixing efficiency and energy consumption for scalable AD systems.
1. Introduction
Renewable energy is to reduce emissions and greenhouse effects while consuming fossil fuels bring greenhouse effects. The Short-Term Energy Outlook reports that renewable energy will drive growth in U.S. energy output. With new solar energy projects become operational, U.S. renewable energy power production is forecasted to increase by 75%, rising from 163 billion kilowatt-hours (kWh) in 2023 to 286 billion kWh in 2025. Wind power generation is expected to grow by 11% over the same period, from 430 billion kWh in 2023 to 476 billion kWh in 2025. According to the U.S. Energy Information Administration, renewables are forecasted to make up 23% of U.S. electricity production in 2024 and will likely grow to 25% by 2025. Biomass, which represented 2.44% of renewable electricity generation last year, is predicted to contribute 2.22% in 2024 and drop to 2.03% by 2025 [1]. Texas, in particular, has abundant renewable energy resources, including both wind and solar power [2].
Bioenergy is produced from biomass, organic material from plants and biological sources that absorb atmospheric carbon dioxide [3]. During growth, biomass sequesters carbon, reducing emissions when used as fuel [4,5]. As a renewable energy source, bioenergy supports electricity, heating, and transportation needs, offering a versatile, lower-emission alternative to fossil fuels. Energy from biomass is harnessed through combustion, microbial activity, or conversion into gaseous or liquid fuels. Biofuel production relies on diverse biomass feedstocks [6], which include agricultural residues like corn stover [7], consisting of stalks, leaves, husks, and cobs left after harvesting. Additionally, municipal solid waste, such as food scraps, yard trimmings, and paper waste, serves as a valuable feedstock [8]. These materials undergo anaerobic digestion, fermentation, and thermochemical or biological conversion [9]. By utilizing these renewable sources, bioenergy reduces fossil fuel dependence while efficiently managing waste, contributing to a more sustainable energy system. Effective anaerobic digestion design is essential in bioreactors, where mixing is optimized through computational fluid dynamics (CFD) to improve performance and efficiency by accounting for geometry and fluid properties [10,11,12,13]. The design and mixing of AD reactors directly influence biogas yield and quality, which depend on the characteristics of the organic matter [14,15,16].
This study investigates optimizing a scale down anaerobic digestion (AD) bioreactor through CFD analysis of agitator design, which includes multiple agitator arrangements, to establish optimal operational conditions for high-quality biogas production. AD supports clean renewable energy while mitigating greenhouse gas emissions such as methane and carbon dioxide. Bioreactor power consumption is influenced by viscosity, torque, agitator geometry, and rotational speed, with uniform mixing being essential for scalability. Efficient mixing enhances microbial activity by improving access to nutrients, gas distribution, and maintaining optimal pH and temperature conditions. To minimize energy input while maximizing bioreactor performance, agitator design must be optimized in relation to bioreactor size, rotational speed, and energy dissipation patterns. CFD simulations assesses the power requirements and mixing efficiency of different impeller blade types. Rushton blades, with a power number ranging from 4 to 6, require high power input to generate turbulence in viscous fluids, ensuring intense shear and effective layer breakup. Pitch-curved blades, with a power number between 1 and 2, provide a moderate power requirement, balancing energy efficiency and effective mixing across varying viscosities. Propeller blades, with a power number between 0.3 and 0.7, generate axial flow with lower energy input, making them more efficient for low-viscosity fluids and large-scale systems. The arrangement of these impellers is evaluated using CFD to determine their impact on mixing uniformity, power consumption, and scalability. High-shear Rushton blades are analyzed for energy-intensive mixing, while pitch-curved blades will be assessed for their efficiency across diverse fluid properties. Propeller blades are explored for their low-energy mixing capabilities in large-scale applications.
This study aims to evaluate the mixing performance of three agitator blade types of Rushton, curved-pitch, and propeller under different arrangements within a simulated three-liter fluid container using ANSYS Fluent. The analysis investigates single, double, and triple blade configurations with a color-coded volume division to visualize mixing behavior. The objective is to identify the optimal blade arrangement for improving mixing uniformity, minimizing vortex formation, and enhancing fluid circulation, with potential applications in bioreactor scale-up. By examining hydrodynamic characteristics at varying rotational speeds, diameters, and geometric ratios, the study intends to determine the most effective configuration for bioreactor applications. It assesses the impact of these configurations on velocity distribution, volume fraction, turbulent kinetic energy, and power consumption to develop an energy-efficient and effective mixing strategy for biological processes. The novelty of this study provides its systematic evaluation of multi-blade configurations by analyzing single, double, and triple arrangements of Rushton, curved-pitch, and propeller designs, which is rarely explored in published works. Unlike conventional studies that focus on single variables, it integrates variations in rotational speed, impeller diameter, and geometric ratios to provide a broader parametric understanding of mixing behavior. The application of color-coded volume division introduces a visualization-driven approach to assess mixing uniformity and vortex formation more intuitively than standard CFD evaluations. Furthermore, the study offers a comprehensive hydrodynamic assessment by simultaneously considering velocity distribution, volume fraction, turbulent kinetic energy, and power consumption, thereby extending beyond traditional power number or velocity-based analyses. Most importantly, it directly links these findings to bioreactor scale-up and contributes energy-efficient impeller configurations tailored for biological processes rather than remaining purely theoretical.
2. Materials and Methods
The design requirements of a bioreactor can vary depending on the specific application and the biological system being cultivated [17]. However, there are several common design considerations that need to be considered when developing a bioreactor. The design requirements ensure the bioreactor provides an environment conducive to the growth, productivity, and control of the biological system being cultivated, while also addressing considerations related to process efficiency, scalability, and safety. Stirred-tank bioreactors consider key factors for efficient bioprocessing. Oxygen transfer and shear stress highlight the importance of impeller design and sparging strategies for optimal cell culture. CFD analyses provide insights into mixing and oxygen transfer, guiding impeller selection for large-scale systems [18,19]. Advances in sensors and automation allow real-time monitoring and control, ensuring consistent product quality [20]. Scale-up challenges focus on maintaining oxygen transfer and process consistency, while innovations like single-use systems and advanced controls enhance efficiency, sustainability, and adaptability in bioprocessing [21,22]. Figure 1 illustrates how biomass resources are converted into biomass energy via a bioreactor, based on an engineering model used to analyze the bioreactor’s performance through CFD simulations [23,24,25,26].
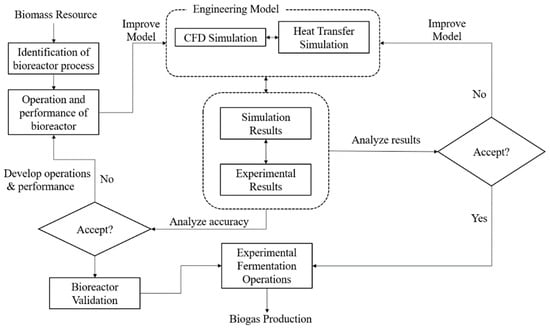
Figure 1.
Model-based development of bioreactors and biological processes.
2.1. Technical Specification for Prototype-Scale Bioreactor Design
The BR140 bioreactor has been developed specifically for cost-effective research into anaerobic digestion (AD) and biogas production. Achieving efficient AD depends on meeting five critical requirements: first, maintaining a secure, airtight seal to sustain anaerobic conditions; second, monitoring the system to detect any potential leaks; third, regulating feedstock temperature to 37 °C to optimize bacterial performance; fourth, ensuring even mixing through agitation; and finally, incorporating a pH probe coupled with a solution injection system to maintain optimal pH levels [27]. These integrated features enhance both biogas yield and AD reliability. Figure 2 shows the complete design layout, including biosensor placements.
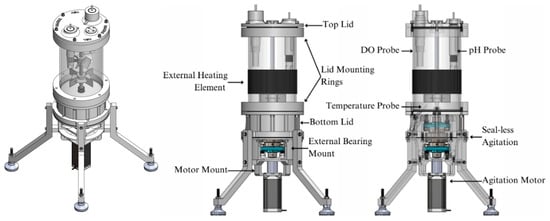
Figure 2.
Designed configurations of assembled Bioreactor (BR140) with biosensor placement [28].
The BR140 bioreactor is made of borosilicate glass, chosen for its transparency and resistance to chemicals like hydrochloric acid, hydrogen sulfide, and sodium hydroxide [29]. Its PETG 3D-printed lids provide durability and integration with other components [30]. Table 1 shows the thermal properties of the materials [31].

Table 1.
Thermal Properties of Materials in Bioreactor.
Thermal control is vital for microbial viability and productivity. Optimized heat management supports enzyme function, enhances metabolite production, and ensures efficient bioreactor operation by minimizing energy waste and maintaining stable reaction conditions [29,30,31,32].
2.2. Governing Equations in Computation Fluid Dynamics (CFD)
CFD is applied to simulate bioreactor hydrodynamics [33,34]. The system volume is discretized into multiple control volumes, where momentum equations are numerically solved. Several operating parameters influence mass transfer in a bioreactor, which take into rotational speed, gas supply rate, and gas fraction. Understanding and modeling the complex interactions between biological reactions and hydrodynamics is essential for fermentation broth bioprocesses. CFD supports the study of hydrodynamic behavior in bioreactors of various sizes and its interaction with biological reactions. Due to computational intensity, compartment or multizone models minimize processing time. CFD simulations demonstrate that variations in bioreactor mixing affect biomass concentration. Contour plots show decreased fluid viscosity in areas of high shear stress, while temperature and biomass concentration have a direct impact on the apparent viscosity of the fermentation broth.
Multiphase flows with gas, liquid, and solid interactions are categorized into separated and mixed flows, essential for analyzing fluid dynamics. A multiphase framework was employed using a hybrid Eulerian inhomogeneous model with multi-fluid partitions. This approach was selected to evaluate the overall mixing performance of the rotating impellers by subdividing the total fluid domain into two equal segments. For the purposes of the simulation, it was assumed that manure particles were already uniformly dispersed within the liquid phase; therefore, the solids were not tracked as a separate phase but rather incorporated into the bulk rheology through the effective viscosity of the continuous fluid. The Reynolds-averaged mass balance for a multiphase Eulerian model in a bioreactor system with two phases accounts for the averaged behavior of each phase over time [35,36,37,38,39,40,41]. The mass balance equation can be expressed as Equation (1):
Equation (1) explains the conservation of mass for each phase in a multiphase system, where ρi is the density, αi is the volume fraction, and Ui is the velocity vector of phase , t is time, and ∇ is the divergence operator describing the net outflow of the phase.
The momentum balance equation for each phase can be expressed as Equation (2):
where the Coriolis and centrifugal force vector are given by Equation (3):
Equations (2) and (3) show the momentum conservation for phase in a multiphase system. It accounts for the time-dependent change in momentum and the convective transport . The force term relates the effects of rotation on phase : the first term is the Coriolis force due to the rotating reference frame and the second term is the centrifugal force, depending on the position vector r and angular velocity N of the frame. It should be emphasized that in this study all CFD simulations are carried in an inertial reference frame, so Equation (3) is not included in the numerical solutions.
The effective stress tensor is defined as Equation (4):
Equation (4) represents the contributions of viscous and turbulent stresses, incorporating the laminar () and turbulent viscosities () as well as the turbulent kinetic energy of each phase (). These terms quantify how both laminar and turbulent stresses influence the momentum transfer and flow behavior in each phase. is the symmetric strain-rate tensor representing shear and deformation effects. The term of represents the contribution of turbulent kinetic energy to the normal stresses, and reflect the effect of isotropic turbulence on momentum transfer within the phase.
Turbulent viscosity for the liquid phase is modeled as Equation (5):
Equation (5) calculates the turbulent viscosity of the liquid phase with turbulent viscosity (), density of the liquid phase (), turbulent kinetic energy (), turbulence dissipation rate () and model constant ().
The reliable k–ε turbulence model is used for multiphase CFD simulations in ANSYS Fluent. In this study, the model is formulated using the unsteady Reynolds-Averaged Navier–Stokes (RANS) equations to simulate turbulent flow in the liquid phase. The transport equations for the turbulent kinetic energy () and the turbulence rate () are presented in Equations (6) and (7).
is the turbulent kinetic energy (), and is turbulence production (), defined as , which is the velocity vector of the liquid phase. is the turbulent Prandtl number for , which is dimensionless and typically 1.0. is the turbulence dissipation rate (). and = 1.92 are dimensionless constants in the realizable k-ε model. is the turbulent Prandtl number for , which is also dimensionless and typically 1.2. is kinematic viscosity (), and is magnitude of the mean strain rate tensor. Interfacial force components in multiphase bioreactors can be provided by Equation (8):
Momentum exchange between phases follows as Equation (9):
where .
Turbulent dispersion force influences fluid distribution and transport in turbulent flow within multiphase systems, which can be shown as Equation (10):
Equations (8)–(10) present the interfacial forces in a multiphase system for momentum transfer and phase interaction, where combines the drag force between phases of and the turbulent dispersion force of , which describe how turbulence and interphase dynamics influence mixing and phase distribution.
The analysis of the Reynolds averaged mass and momentum balance equations in a multiphase Eulerian application describes the complex interactions between liquid and gas phases in a bioreactor system.
The manure-water slurry is generally considered a non-Newtonian fluid. The complex mixture of suspended solids (fibers, undigested feeds, microbial biomass, etc.) and liquid water can cause non-Newtonian behaviors such as Shear-thinning, changes in yield stress, and if the numerical value of viscosity is high enough, trapped gas bubbles. The shear stress applied to the fluid can utilize several models. First the Bingham plastic model, Equation (11). In this model, fluids behave like solids until a predetermined shear stress is achieved. Only after does the fluid flow linearly like a Newtonian fluid. The second model is the Power Law model shown in Equation (12) and is used for partially digested manure slurries.
The rheological model best used for anaerobic digestion would be the Herschel–Bulkley Model, Equation (13). This general, often best fit, combines the two previous models to model both Bingham plastic and power law behaviors.
The CFD simulation utilized discretization schemes for the main parameters, pressure and momentum. The pressure scheme utilizes a second order method to approximate the continuous partial differential equations. The momentum, turbulence, and energy schemes use second order upwind methods to calculate weighted average values of adjacent cells, resulting in smooth gradients. The CFD analysis is transient to account for time-based biomass stirring. The total number of time steps is 1800 with each step being two seconds long and containing 15 iterations per step. Convergence criteria included a residual cutoff of 1 × 10⁻⁴ with torque and velocity being the main measured components. The k-omega SST is used for the vicious model. Lastly the solver configuration relied on a pressure-based type setup. Gravity was enabled during the simulations. Multiphase settings included the hybrid Eulerian inhomogeneous model involving multi-fluid volume fraction (VOF) with two implicit Eulerian phases. Each phase included half of the VOF.
2.3. Power Consumption and Mixing Characteristics: Agitator Designs and Rotary Shaft
To design process equipment across various scales, it is essential to focus on and analyze the relationship between design variables and scale-related factors. This relationship is developed by collecting data from different scales and operating conditions, which are then plotted together. Using a variety of experimental conditions, the collected data support distinct correlations, which can be grouped according to comparable conditions. Experimental results become applicable across different scales and operating conditions, with the dimensionless variables derived from the measured parameters [38]. This relationship is set by collecting data from different scales and operating conditions. In the design, the system takes into account fluid flow and the friction factor , as both are related to Reynolds number (Re) [37]. This correlation is observed in both pipe flow and long-distance crude oil transport, which shows a linear decrease in friction factor at low Re (laminar flow) and a nearly constant value at high Re (turbulent flow), a trend also seen in stirred-tank reactor power consumption using the impeller Reynolds number, . The dimensionless number for power consumption by the impeller is the power number, Np. The Reynolds number can be expressed as Equation (14):
where is fluid’s dynamic viscosity, is the agitator’s rotational speed, and is the impeller diameter. For , turbulence indicates a constant , while in laminar flow at lower , can change significantly. This Reynolds number presents the mixing system and characterizes the flow regime in the stirred tank. The term of explains a characteristic velocity of the impeller tip. Power number () is given by Equation (15):
where P is power consumption, the power input per unit volume, which is critical for maintaining mixing efficiency [39]. This dimensionless power number relates the impeller power consumption to the fluid properties and impeller geometry. The term indicates a characteristics power scale for stirred systems, so how efficiently the impeller converts input energy into fluid motion. It depends only on the impeller type and flow regime. Figure 3 shows the configuration of the dynamic agitator, including dimensions related to the height of the working volume, the diameter of the agitator, and the diameter of the vessel, while considering rotational speeds (RPM) and power consumption.
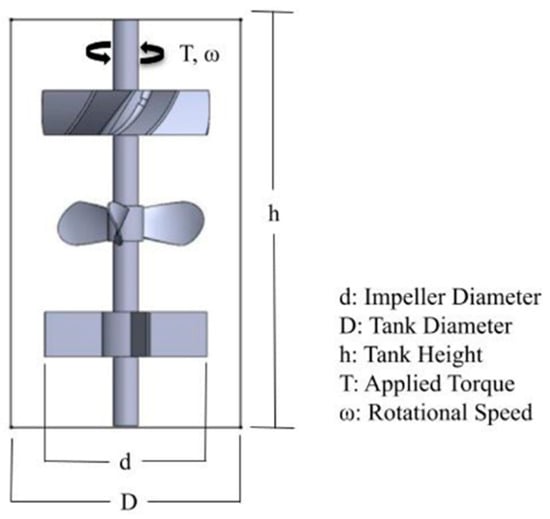
Figure 3.
Schematic configuration of agitation dynamics and component dimensions.
To evaluate the comparison of agitation design and configurations for fermentation performance during the bioreactor operation, the power input for a Rushton impeller is described using the aerated power number () and Reynolds number () [42,43]. The power per unit volume can be calculated by Equations (16) and (17).
is the impeller speed, is the impeller diameter; is the number of blades on the impeller; is the height of the blade. The power consumption, P, in stirred tanks with Rushton turbine can be calculated. The term indicates a characteristic power scale determined by fluid density, impeller speed, and size. The power number, , is an empirical correlation for estimating the power number of a specific impeller type based on its geometry. A larger blade height-to-diameter ratio (h/d) increases the impeller’s interaction with fluid and power demand. Equation (18) presents the reactor volume in terms of the characteristic length to the third power.
To maintain efficient mixing and scaling reactor performance, the requirement for the power per unit volume is constant as shown in Equations (19) and (20).
Increasing the diameter eightfold reduces the agitation rate (N) by a factor of four, illustrating the inverse relationship between scale and agitation. Scaling affects agitation rate () and impeller tip speed. The agitation rate scales depend on Equation (21):
While impeller tip speed scales follow as Equation (22):
For scale-up in mixing, the constant power per unit volume criterion is commonly applied in bioreactor design. As the impeller diameter increases, the rotational speed must decrease to maintain the same energy input per unit volume. However, different scale-up criteria may be selected depending on whether the primary objective is to preserve mixing intensity, control shear stress, or optimize oxygen transfer.
The relationship between agitator design variables and scale-related factors is analyzed using data from various operating conditions, represented in dimensionless forms. For fluid flow systems, the correlation between the friction factor (f) and Reynold number () is critical, considering laminar and turbulent circumstances. A similar approach is applied to stirred-tank reactors, where the impeller Reynolds number () and power number () are key parameters.
3. Numerical Results and Discussion
This work investigates the effectiveness of three different types of mixing blades in various agitator arrangements. These blades, Rushton blade, curved-pitch blade, and propeller blade, are simulated in different combinations of one, two, and three blades in a three-liter fluid container simulation using ANSYS Fluent. In order to determine mixing behavior and effectiveness of each blade and combination, the simulated fluid volume is split into two halves. Each half will effectively be the same fluid, liquid water, but is automatically color coded by Fluent allowing a better visualization of the mixture.
3.1. Agitator Blade Designs and Geometric Parameters for Bioreactor Mixing Systems
In bioreactors, agitators are crucial for optimal mixing and enhancing biological processes. Common designs include Rushton blades, pitched curved blades, and propeller blades, each offering unique mixing characteristics as shown in Figure 4.
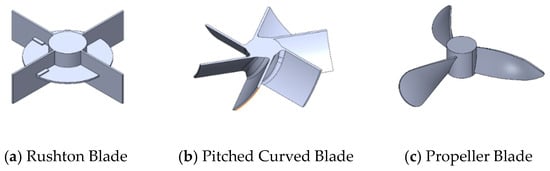
Figure 4.
Agitator blade design concepts: Rushton, curved-pitch, and propeller blades.
The Rushton blade generates radial flow for high-shear mixing and is commonly used for gas–liquid dispersion in aerobic fermentations. The Rushton design can be effective to provide gas dispersion for gas transfer in fermentation processes, while its flat-blade generates high shear to enhance mass transfer rates and mix viscous or solid fluids. Since its high shear levels may damage sensitive cell cultures and require high power consumption due to its design with substantial shear forces and turbulences. The pitched curved blade, angled between 30° and 45°, combines axial and radial flow, achieving balanced mixing and moderate shear, making it versatile for suspending solids and handling moderate viscosities. This design distributes nutrients more uniformly and is gentler on cell cultures, especially in animal and plant applications. Propeller blades, typically in a three-blade arrangement, produce primarily axial flow, enhancing bulk mixing and circulation with low shear. This makes them suitable for large bioreactors and low-viscosity applications, as they provide even nutrient and gas distribution without damaging cells. To create a low-shear environment, the agitation shaft may combine different blade types, balancing axial and radial flows for optimal mixing. The selection of agitator design depends on the specific bioprocess requirements, including shear needs, flow characteristics, and mixing uniformity, as shown in Figure 5.
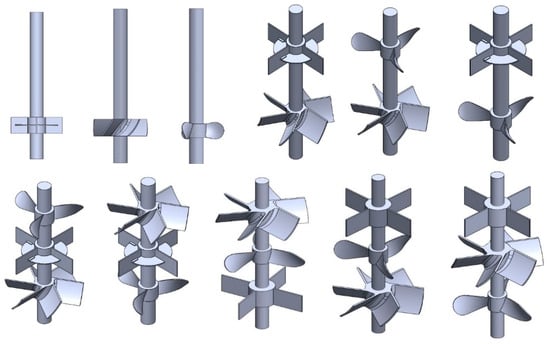
Figure 5.
Agitator arrangements and geometric considerations: Rushton, curved, and propeller agitators.
A bioreactor equipped with a single agitator is analyzed to assess the effects of different blade types of Rushton (R), Curved (C), and Propeller (P) for mixing performance. Key parameters under investigation include blade diameter, blade-to-tank diameter ratio, and the geometric ratio of blade diameter to thickness. The Rushton and Curved blades operate at rotational speeds of 40, 80, 120, and 150 rpm, with diameters of 80, 100, and 120 mm and a thickness of 25 mm. Their blade-to-tank diameter ratios are 0.60, 0.77, and 0.92, corresponding to geometric ratios of 3.2, 4.0, and 4.8. The Propeller blade operates at the same speeds but has a thickness of 12.5 mm, resulting in geometric ratios of 6.4, 8.0, and 9.6. These variations influence hydrodynamic characteristics and help optimize mixing conditions. For dual-blade configurations, six different arrangements are examined: Rushton on top with Curved on the bottom (R + C), Curved on top with Rushton on the bottom (C + R), Propeller on top with Curved on the bottom (P + C), Rushton on top with Propeller on the bottom (R + P), Curved on top with Propeller on the bottom (C + P), and Propeller on top with Rushton on the bottom (P + R). Each configuration is evaluated based on rotational speed, blade thickness, and geometric ratios to determine its impact on fluid dynamics. Triple agitation arrangements are also simulated, incorporating all three blade types in various sequences. One such configuration includes Rushton at the top, Curved in the middle, and Propeller at the bottom (R + C + P). These arrangements aim to enhance fluid circulation, minimize vortex formation, and improve overall mixing efficiency.
Table 2 presents a comparative analysis of single-agitator applications in the bioreactor, detailing the diameters of Rushton, Curved, and Propeller blades, their blade-to-tank diameter ratios, and geometric ratios. This study evaluates how blade design and blade-to-vessel geometry influence bioreactor performance, offering insights into the most effective mixing strategies for biological processes.
Table 2.
Comparison of single agitation system with three agitator designs and geometric parameters.
Six double-blade configurations (R-C, C-R, P-C, R-P, C-P, P-R) are evaluated, considering Rushton, curved, and propeller arrangements with variations in rpm, thickness, and geometric ratios shown in Table 3.
Table 3.
Evolution of double agitation mixing with three agitator designs and geometric parameters.
Triple-blade layouts include six Rushton, curved, and propeller configurations, evaluated by speed, diameter, thickness, and geometry shown in Table 4.
Table 4.
Development of triple agitation arrangement with three agitator designs and geometric parameters.
3.2. Fluid Flow and Mixing Analysis in Bioreactor Systems: Volume Fraction/Fluid Mixing Capability
The mesh involved in the CFD study involves two sets of zones. The first zone involves the fluid regions that surround the impellers. Since the impellers themselves have more complex geometries and serve as focus points in the CFD analysis, data gathered from these zones must be accurate. Figure 6 shows the Rushton blade, curved blade, propeller blade, and the surrounding fluid CFD mesh regions. The second zone includes the remaining fluid region not included in the first zone. This is much more geometrically simple and will be modeled with a more course mesh. Figure 7 shows the total CFD mesh including the three impellers’ geometries and the total fluid volume that contains them.
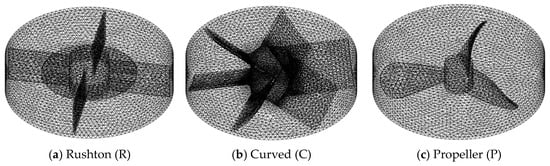
Figure 6.
CFD mesh surrounding Rushton blade, curved blade, and propeller blade impellers as well as the surrounding fluid.
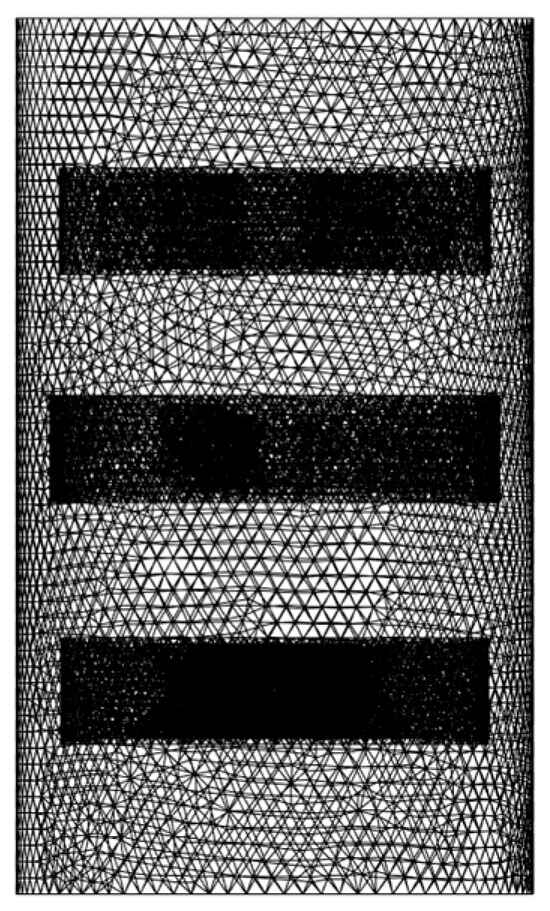
Figure 7.
CFD mesh of total bioreactor fluid volume.
The cell size used in the mesh is based on the limitation of the ANSYS student license. With the license, only mesh with element counts not exceeding 1,048,576 cells can run simulations. This number will provide the upper limit for a mesh as well as provide the endpoint for any mesh independence verification. Table 5 lists the cell size and the total number of cells for each zone and whether the bioreactor had one, two, or three blades. The cells shape used in each mesh was tetrahedron.
Table 5.
Cell size information and total mesh cell count with respect to number of blades.
The initial conditions set for the bioreactor focus on the operating of the blades themselves, since the volume of fluid is fixed through the process and no fluid is added or removed except to account for loss through evaporation or the removal of product. Mesophilic conditions, typically around 37 °C and 1 atm, provide an optimal environment for microbial activity in bioreactors. Fluid flow analysis under these conditions, as shown by velocity streamlines and contour plots, offers insights into mixing patterns and substrate transport, which directly influence microbial growth and reactor performance Viscosity and density are measured and applied based on water properties. The bioreactor geometry is defined, which includes the vessel shape and the position of components such as the agitator blades. Boundary conditions are applied to the walls and agitator blades, with varying rotational speeds. Fluid phase conditions are also considered for accurate simulation results. In fluid analysis, volume fraction and fluid mixing capability refer to the proportion of a specific fluid within a mixture and describe the distribution characteristics within a fluid system. They analyze the ability of a bioreactor system to promote the homogeneous distribution of different biomass materials within a mixture. The analysis of volume fraction and fluid mixing capability measures how effectively various substances mix together and how quickly equilibrium is reached. To better grasp the effectiveness of the fluid mixture, Figure 8 is provided to show the separation of the two fluid regions when t = 0 s.
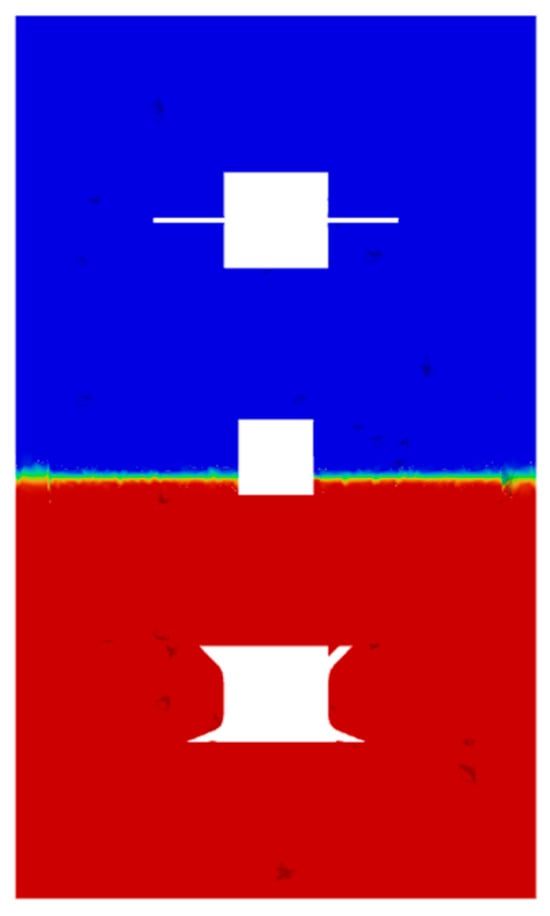
Figure 8.
Initial mixing dynamics of three blade agitator arrangements at t = 0 s.
Figure 9 provides the fluid mixing dynamics for single agitator arrangements, highlighting the performance of curved, propeller, and Rushton blades. The velocity distribution and volume fractions are demonstrated using a color scale that transitions from blue to red, with each color corresponding to a specific velocity magnitude. Low velocities begin in blue and progressively shift through cyan, green, yellow-green, yellow, and orange as the magnitude increases, ultimately reaching red at the highest values. This gradient provides an intuitive visualization of velocity variations across the field. The color mapping also explains the corresponding values of velocities and volume fractions for clearer interpretation.
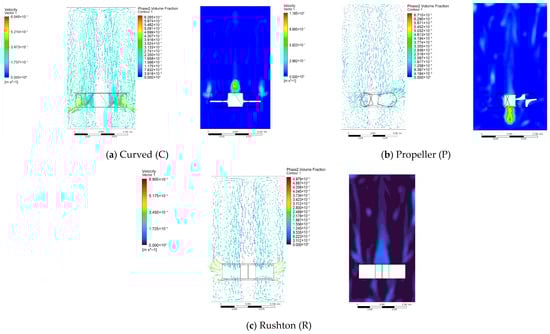
Figure 9.
Mixing dynamics of single agitator arrangements: velocity distribution, flow directions, and volume fractions of Rushton, curved, and propeller blades at 120 RPM.
The curved blade generated a high peak velocity of 0.521 m/s above the blade, which produced an average velocity of 0.347 m/s and circulated fluid effectively in the upper region. The blade, localized circulations developed between the shaft’s sides, with an average velocity of 0.225 m/s. The average volume fraction in this setup was 6.15%, with peak values at the blade edges and shaft center, ranging from 43.32% to 62.26%. The propeller blade showed a lower average velocity of 0.254 m/s, maintaining uniform circulation above the blade and promoting fluid mixing through localized flow. It showed an average volume fraction of 12.25%, with peaks of 29.35%, especially below the blade where volume fractions reached 37.24% to 67.71%. The Rushton blade produced a high velocity of 0.281 m/s and generated an average of 0.347 m/s above the blade and 0.284 m/s below. This resulted in consistent circulation and a 6.22% average volume fraction, peaking between 3.11% and 18.67% near blade edges and the shaft center.
In the dual-blade configurations shown in Figure 10, different combinations show varying effects on velocity, velocity directions, and mixing.
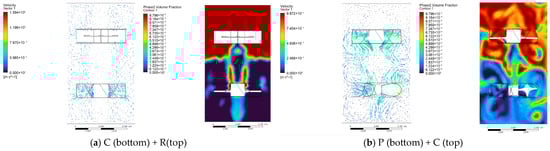
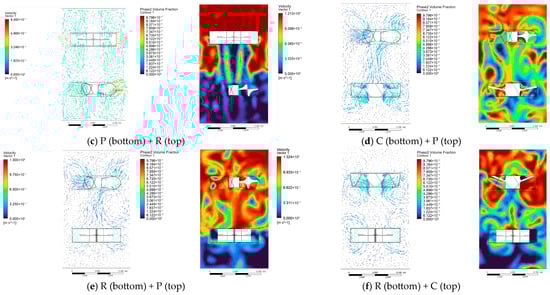
Figure 10.
Mixing dynamics of double agitator arrangements: velocity distribution, flow Directions, and volume fractions of Rushton, curved, and propeller blades at 120 RPM.
In the curved-propeller setup, the propeller positioned at the top demonstrated an average velocity of 0.342 m/s, and showed strong circulation above, while the bottom curved blade maintains 0.184 m/s. This arrangement produced a bottom volume fraction between 18% and 62%, with an average of 74% above the propeller and 44% below it. In the curved-Rushton combination, the curved blade locally moved fluid at 0.321 m/s, whereas the Rushton blade contributed stronger motion at 0.364 m/s. The lower region reflected a volume fraction of 12%, while the upper region around the Rushton reaches 97%, and showed distinct layers of mixing intensity. In the propeller-curved design, the propeller circulated fluid at 0.282 m/s, and the top curved blade generated a slower 0.164 m/s. Volume fractions were 24% near the propeller and 85% in the curved blade area. For the propeller-Rushton pair, the velocities were 0.258 m/s and 0.312 m/s, with corresponding volume fractions of 16% and 92%. The Rushton-curved setup provided 0.182 m/s and 0.331 m/s, respectively, with volume fractions of 24% and 78%. For the Rushton-propeller pair, velocities of 0.182 m/s and 0.325 m/s produced mixing efficiencies of 16% and 74% across different vessel regions.
In the triple-blade configurations illustrated in Figure 11, various combinations provided distinct effects on velocity magnitude, flow direction, and overall mixing performance.
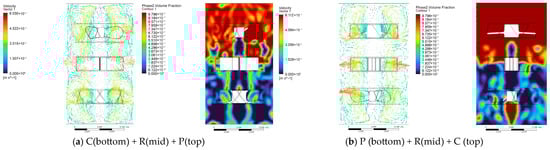
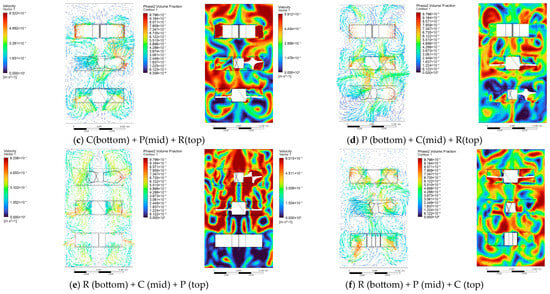
Figure 11.
Mixing dynamics of triple agitator arrangements: velocity distribution, flow Directions, and volume fractions of Rushton, curved, and propeller blades at 120 RPM.
In the triple-blade configurations, distinct mixing dynamics were observed across all setups. In the curved–Rushton–propeller arrangement, the average fluid velocity reached 0.301 m/s. The Rushton blade achieved a high-volume fraction of 93% at and above its level, while below it, the fraction dropped to 26%, which reflects a more balanced, though uneven, distribution. In the propeller–Rushton–curved configuration, mixing remained consistent with a slightly higher average velocity of 0.305 m/s. Volume fractions peaked above the Rushton blade at 92%, but fell to 18% below. The Rushton–curved–propeller setup showed the highest average velocity at 0.310 m/s and demonstrated strong circulation in the upper two-thirds of the vessel, where volume fractions ranged from 24% to 91%. However, the lowest third remained weakly mixed, with only 18% volume fraction, confirming that Rushton blades positioned at the bottom promote radial fluid movement but still result in limited lower-region mixing. The radial flowing fluid collides with surround reactor walls ascend and descend in a vertical motion creating a circulation in the tank. As a result, all configurations supported uniform mixing in upper regions, while lower zones consistently showed reduced mixing intensity due to flow patterns shaped by the Rushton blade’s position.
Effective bioreactor performance relies on efficient biomass agitation using motorized blades to prevent fluid settling and vortex formation. Analysis of single, double, and triple blade setups reveals distinct mixing behaviors, velocity distributions, and volume fractions. Curved blades generate higher velocities with localized circulations, while propeller and Rushton blades produce more uniform mixing. Double blade combinations like curved–propeller or curved–Rushton improve fluid dynamics and enhance localized mixing. Triple blade arrangements offer the most consistent mixing overall, though lower volume fractions often appear below Rushton blades. Velocity direction helps validate mixing by identifying stagnation zones and vortexes that hinder efficiency. Blade elevation adjustments enhance circulation. The curved–bottom and propeller–top setup proved most effective, achieving full circulation and thorough fluid blending across regions.
3.3. Analysis of Turbulent Kinetic Energy Distribution
There are single, double, and triple arrangements to analyze torque variations. Turbulence and drag were investigated to understand how each blade contributes to torque and power, which considers rotational speeds and the geometric information of the agitators and vessel tank size. In terms of velocity distributions, pressure gradients, and mechanical stresses, power consumption and uniform mixing are investigated. In all cases, torque variations are influenced by the number of blades, types of blade arrangements, rotational speed, and fluid viscosity, with multi-stage configurations requiring more power to maintain the desired mixing intensity shown in Figure 12.
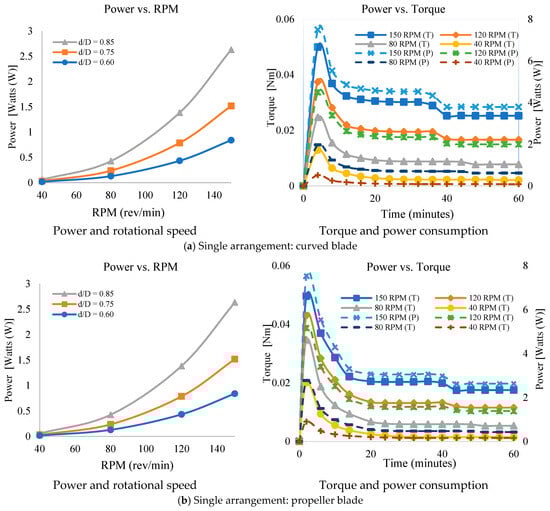
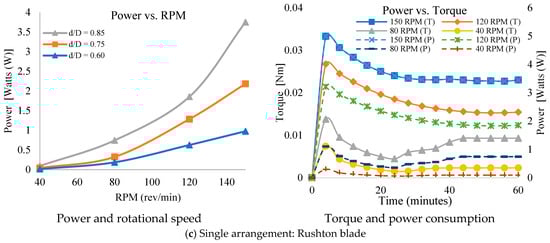
Figure 12.
Effects of a single agitator arrangement with curved, propeller, and Rushton blades on power, torque, and the agitator-to-tank ratio at different RPMs.
The analysis of the single curved blade and propeller configurations in a bioreactor provided a similar pattern in terms of power and torque output as RPM increases. Both systems demonstrated nonlinear power increases with higher RPM, and the power output was significantly higher at larger diameter-to-tank diameter ratios (d/D). For the single curved blade, power increased as RPM rises, with larger d/D ratios leading to a greater increase in power. At 150 RPM, the power output increased from 0.84 W at d/D = 0.55 to 2.63 W at d/D = 0.85. This indicated that larger impeller diameters contributed significantly to enhanced power output at higher speeds. In terms of torque and power over time, the single curved blade system showed that both torque and power values decrease as time progresses. At 150 RPM, the system started with the highest torque (0.04996 Nm) and power (4.49 W), which gradually declined to 0.02525 Nm and 1.99 W, respectively, after 60 s. At 40 RPM, the torque started at 0.01294 Nm and reduced to 0.00211 Nm, while power dropped from 0.52 W to 0.085 W over the same time span. This indicated that as the system stabilizes, there were losses in both torque and power, likely due to stabilization effects and energy losses within the system. Higher RPMs initially demonstrated greater torque and power outputs, but the system’s efficiency decreased over time. For the propeller configuration, a similar nonlinear increase in power output was observed as RPM increases, with larger d/D ratios resulting in significantly greater power. At 150 RPM, power increased from 0.8408 W at d/D = 0.55 to 2.6325 W at d/D = 0.85, which demonstrated that a larger blade-to-diameter ratio improved propeller performance by enhancing thrust efficiency and air displacement. However, this found at the cost of increasing energy demands. Regarding torque and power over time, the propeller system showed that both power and torque decreased as RPM decreases, with higher RPMs generating significantly greater power. At 150 RPM, power started at 7.54 W but progressively decreased to 2.63 W, while torque followed a similar decreasing trend. This drop in both torque and power over time provided efficiency lost due to resistance, drag, or system limitations. At 80 RPM, power started at 2.78 W and decreased to 0.43 W, reflecting a more pronounced efficiency loss than at higher RPMs. The decreasing torque and power indicated that the system’s performance was less efficient at lower RPMs, likely due to increased drag and resistance. Thus, both the single curved blade and propeller configurations showed a nonlinear increase in power with RPM, and larger d/D ratios led to higher power output. However, both systems experience a decline in efficiency over time, with higher RPMs exhibiting a more significant drop in power and torque. These findings demontrated that while higher RPMs provided better performance initially, the system’s efficiency diminished over time. The larger d/D ratios enhanced the power output, but they also increased the energy consumption, emphasizing the importance of optimizing the RPM and impeller design to balance performance and energy usage in bioreactor applications.
Figure 13 provides the impact of a double agitator arrangement, featuring curved, propeller, and Rushton blades, on power, torque, and the agitator-to-tank ratio across varying RPMs.
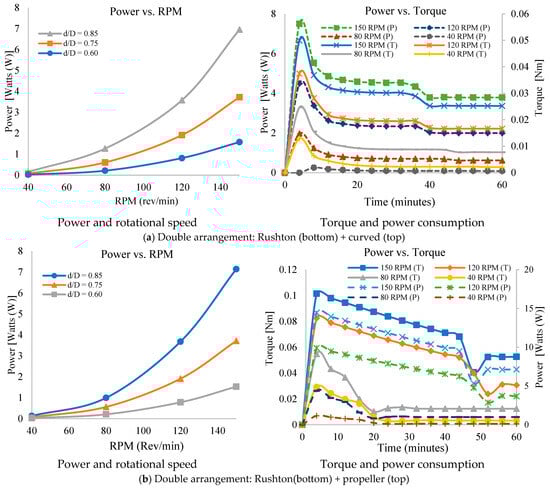
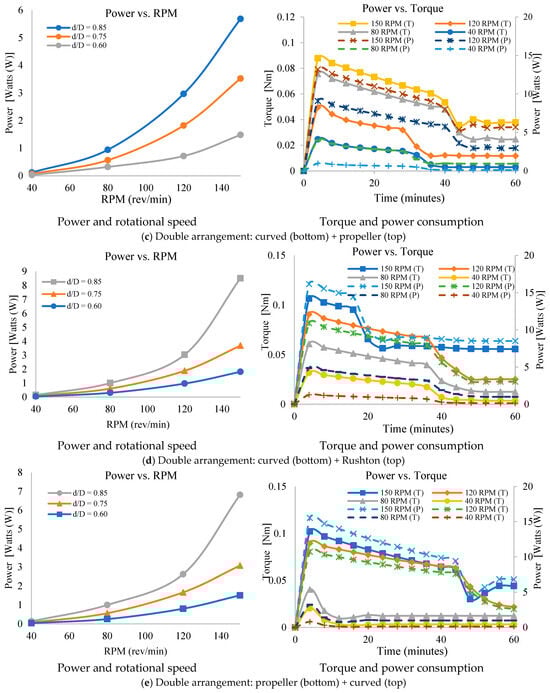
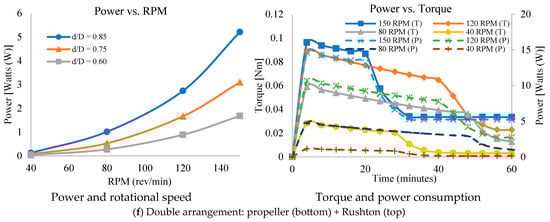
Figure 13.
Effects of a double agitator arrangement with curved, propeller, and Rushton blades on power, torque, and the agitator-to-tank ratio at different RPMs.
The performance of various double-blade configurations in a bioreactor was assessed by analyzing torque and power consumption over time at different rotational speeds (RPMs) and blade diameter ratios (d/D). Across all configurations, torque and power were initially high but declined steadily as the system stabilized. At higher RPMs, this decline was more gradual due to the greater energy required to sustain faster fluid motion. In the configuration with the propeller on top and curved blade at the bottom, consistent reductions in torque and power were observed. At 40 RPM, torque decreased from 0.0246 Nm to 0.00297 Nm and power from 0.985 W to 0.118 W. At 150 RPM, torque dropped from 0.0879 Nm to 0.0379 Nm, and power declined from 13.19 W to 5.69 W. This provided greater energy stability at higher speeds, despite initially higher power demands. In the configuration with the curved blade at the bottom and Rushton blade on top, torque and power followed comparable findings. At 40 RPM, torque reduced from 0.0317 Nm to 0.0036 Nm, and power from 1.27 W to 0.14 W. At 150 RPM, torque decreased from 0.1066 Nm to 0.0557 Nm, and power from 16.14 W to 8.51 W. These results indicated improved mixing stability at high speeds with increased energy usage. Increasing the d/D ratio from 0.55 to 0.85 led to a corresponding increase in power demand across all speeds, confirming that larger blade diameters consumed more energy to maintain the same RPM. The curved-top and propeller-bottom setup also demonstrated consistent energy declined over time. At 40 RPM, torque dropped from 0.0204 Nm to 0.0034 Nm, and power from 0.82 W to 0.135 W. At 150 RPM, torque declined from 0.1022 Nm to 0.0441 Nm, and power from 15.53 W to 6.81 W. These results supported the idea that higher speeds, while requiring greater energy initially, yielded more stable mixing conditions. In the propeller-bottom and Rushton-top arrangement, similar patterns were evident. At 40 RPM, power increased from 0.0365 W at d/D = 0.55 to 0.1238 W at d/D = 0.85. At 150 RPM, power was increased from 1.6816 W to 5.2139 W as blade size increased, further confirming the impact of diameter ratio on power consumption. The Rushton-bottom and curved-top configuration showed power at 40 RPM increasing from 0.0234 W (d/D = 0.55) to 0.1518 W (d/D = 0.85). At 150 RPM, power ranged from 1.5794 W to 6.9543 W. Simulated torque and power over 60 s showed steady declines. At 150 RPM, torque fell from 0.04996 Nm to 0.02525 Nm and power from 7.49 W to 3.79 W. The Rushton-bottom and propeller-top setup followed a consistent result. At 150 RPM, torque dropped from 0.1015 Nm to 0.0526 Nm, and power from 14.47 W to 7.14 W. These findings indicated that both RPM and blade size significantly influenced torque and power behavior, impacting mixing performance and energy efficiency. Thus, across all configurations, increasing RPM and blade diameter ratio directly led to higher torque and power requirements. However, torque and power values consistently declined over time, which indicated system stabilization and improved energy efficiency during bioreactor operation. While high RPMs offered more stable mixing and slower power reduction, they required significantly more initial energy. Blade configurations influenced these parameters, with the combination of curved and propeller blades generally achieving better circulation with moderate power consumption. These findings provided important insights for optimizing bioreactor blade designs to balance energy consumption with effective mixing.
Figure 14 demonstrates the impact of a triple agitator configuration, which shows curved, propeller, and Rushton blades, on power, torque, and the agitator-to-tank ratio at various RPMs.
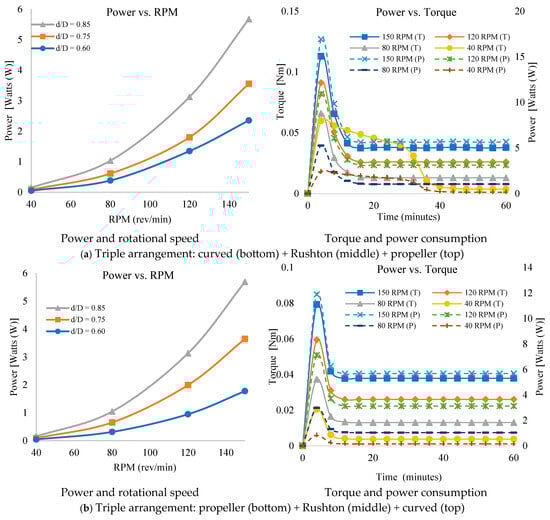
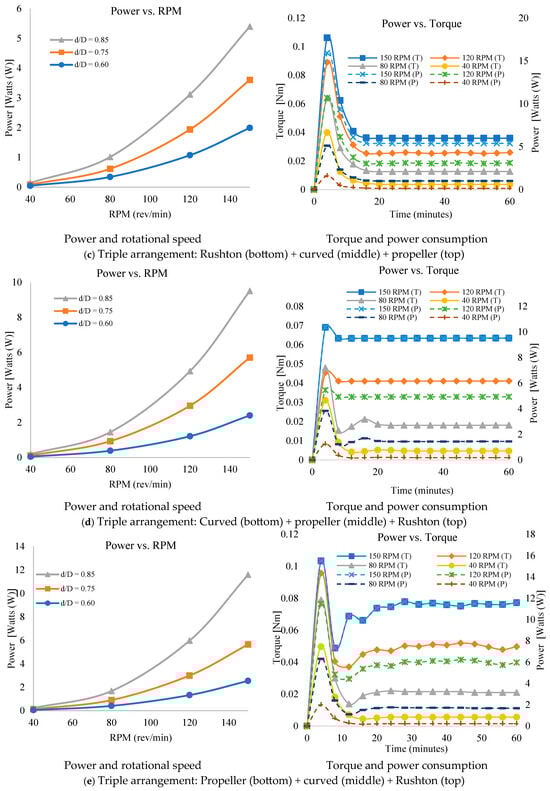
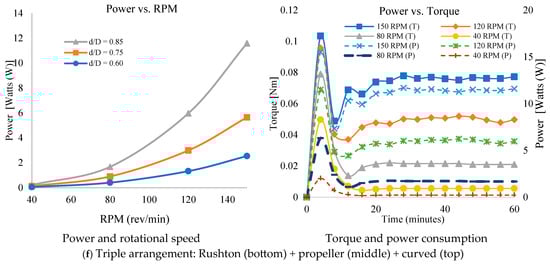
Figure 14.
Effects of a triple agitator arrangement with curved, propeller, and Rushton blades on power, torque, and the agitator-to-tank ratio at different RPMs.
The analysis of six impeller configurations in a bioreactor demonstrated significant findings related to power consumption, torque behavior, and energy efficiency across various rotational speeds (RPMs) and impeller-to-tank diameter ratios (d/D). From all configurations, power consumption increased following a cubic trend with RPM, as shown in Figure 9, with the steepest increased at higher RPMs and larger impeller diameters. In the triple impeller configuration with a curved blade at the bottom, Rushton turbine in the middle, and propeller at the top, power consumption escalated with both RPM and d/D ratio. At 150 RPM, power peaks around 16.94 W and stabilized near 5.67 W; at 40 RPM, power remained low at 0.15 W. An optimal energy-performance balance was achieved at d/D = 0.75 and RPMs between 80 and 120. Torque was highest at 150 RPM, which indicated strong turbulence and higher mixing intensity. With time, torque decreased while power increased to a steady-state value, which stabilized at 5.69 W at 150 RPM, 3.13 W at 120 RPM, and 1.05 W at 80 RPM. A similar pattern was observed when the Rushton turbine was placed at the bottom, followed by a curved blade in the middle and a propeller at the top. At 150 RPM, power output increased from 1.99 W at d/D = 0.55 to 5.39 W at d/D = 0.85. During operation, torque stabilized at lower levels. At 150 RPM, power started at 15.93 W and settled at 5.39 W; at 40 RPM, it dropped from 1.60 W to 0.1448 W. These findings provided the exponential relationship between power and RPM, and the steady-state behavior reached after initial turbulence. When the curved blade was placed at the bottom, propeller in the middle, and Rushton turbine at the top, power increased rapidly with RPM. At 150 RPM, the total power reached 17.62 W, with the Rushton turbine alone contributing roughly 54% of the load. The torque followed a three-phase transient pattern: an initial spike, a transitional phase with fluctuations, and final stabilization around 32 s. Power also followed this pattern, peaking early and then stabilizing. This arrangement showed higher energy use, particularly when the propeller was at the bottom, due to its limited shear efficiency compared to the Rushton turbine. The configuration with the propeller at the bottom, curved blade in the middle, and Rushton turbine at the top showed the same cubic relationship between power and RPM. Power consumption reached 15.5 W at 150 RPM and stabilizes at 11.5 W. At 120 RPM, it leveled off around 6 W, and at 80 and 40 RPM, it dropped to 1.68 W and 0.13 W, respectively. Torque behavior during start-up showed distinct peaks at higher RPMs, largely driven by inertia and fluid acceleration. In the setup with the Rushton turbine at the bottom, propeller in the middle, and curved blade at the top, power consumption increased nearly from 40 RPM to 150 RPM. The Rushton turbine again dominated energy demand. Power stabilized after about 32 s of operation, which peaked around 7.3 W at the highest RPM. The recommended RPM range for optimal operation was between 80 and 120 RPM, balancing energy input with effective mixing. A broader comparison among single, double, and triple impeller arrangements demonstrated clear findings. Single impeller setups were the most energy-efficient, especially at lower RPMs, though torque tends to decline more rapidly. Double arrangements offered improved mixing and torque stability, especially when combining Rushton and propeller blades, but at higher energy costs. Triple impeller systems consumed the most power and showed complex torque and power behaviors. These arrangements required more energy to maintain stable operation at higher RPMs and larger blade diameters. Thus, while higher RPMs and larger d/D ratios improved mixing efficiency, they also significantly increased power consumption. Selecting the optimal impeller configuration and RPM range between 80 and 120 RPM can ensure effective bioreactor performance while minimizing energy use.
3.4. Performance Evaluation of a Single Curved Blade
A single curved blade was installed in the bioreactor to evaluate mixing performance. ANSYS simulations showed that the curved blade generated a strong peak velocity above the blade, producing vigorous circulation in the upper region of the bioreactor. Localized circulations also developed along the sides of the shaft, creating targeted flow patterns that contribute mixing and promote more uniform fluid movement near the blade. The curved blade demonstrated moderate average volume fractions, with the highest values occurring near the blade edges and shaft center, and indicated concentrated energy input in regions of strong circulation. In comparison, the propeller blade generated lower overall velocities, maintaining more uniform circulation above the blade and promoting mixing through smaller, localized flows. Its volume fractions were generally higher and more evenly distributed, particularly below the blade, reflecting broader but less intense mixing compared to the curved-blade configuration.
These results indicate that the curved blade directs energy toward high-velocity, targeted flow regions for intense localized mixing, whereas the propeller blade distributes energy more evenly, generating moderate flow and more uniform fluid mixing. Power consumption increased with RPM for all blade diameter ratios, with the largest ratio (0.85), corresponding to the curved blade with the highest power demand at 120–150 rev/min. This reflects its ability to generate strong directional flow and intense localized mixing, with a nonlinear increase in power characteristic of turbulent conditions produced by curved blades. Torque and power profiles showed sharp peaks during the first 0–5 min due to rapid fluid acceleration, followed by stabilization as steady-state circulation was established. Compared to propeller blades at the same RPM, the curved blade consistently produced higher torque and power, indicating greater energy dissipation and more vigorous mixing, particularly in targeted regions around the blade. Thus, curved blades demand higher energy input, create strong localized and vertical flow, and contribute solid suspension and gas–liquid transfer, though careful consideration of energy input per unit volume is needed during scale-up. Figure 15 presents simulation and prototype testing of the curved blade, which illustrate velocity fields, flow patterns, volume fraction distributions, and energy profiles across varying RPMs (40–150).
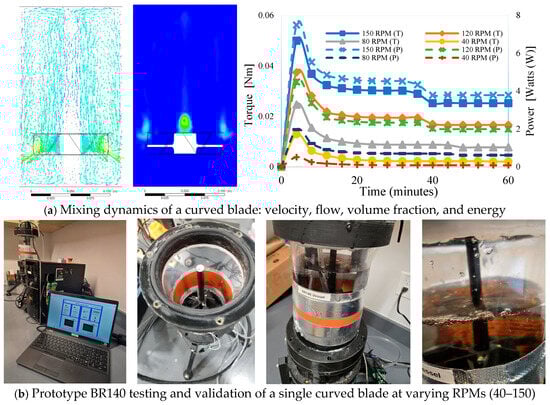
Figure 15.
Performance evaluation of a single curved-blade impeller in a bioreactor: flow behavior, power, and torque characteristics.
To evaluate the simulation results, the experimental setup demonstrated that the curved blade generated stable circulation patterns, with higher average velocities above the blade and slightly lower velocities below. Instead of using real manure or agricultural wastes, water and cheese whey were used as model fluids to visually evaluate the performance of the curved blade. These fluids allowed clear observation of flow patterns, circulation zones, and mixing behavior under controlled conditions. This approach provided qualitative assessment of the blade’s ability to generate radial and vertical flow, suspend solids, and promote homogeneous mixing, while avoiding the complications and variability associated with actual manure or agricultural waste. Flow showed distinct variations in volume fraction with lower values near the shaft center and higher concentrations near the blade edges, which indicated localized mixing regions. Energy analysis provided insight into the performance characteristics of curved blades. Power consumption increased nonlinearly with RPM across all impeller diameter ratios, with the largest ratio. This power requirement corresponds to the curved blade and requires the highest power at 120–150 rev/min due to strong directional flow and intensified turbulent mixing. Torque and power demonstrated sharp peaks during the first 0–5 min with rapid fluid acceleration, followed by stabilization as steady-state circulation was achieved. Experimental measurements corroborated these trends, demonstrating that curved blade consistently demand higher power and produce greater torque compared to propeller blades at equivalent operating speeds. Both simulation and experimental results indicate that curved blades promote strong radial and vertical circulation, localized turbulence, and significant energy dissipation. These features improve solid suspension and gas–liquid mass transfer but also increase energy requirements, which must be carefully considered during scale-up. Future studies will evaluate additional impeller designs with varying geometries and arrangements to examine their effects on circulation patterns, velocity distributions, and gas–liquid mixing efficiency. Experiments utilizing manure as the working fluid will more accurately replicate bioreactor operating conditions, and provide guidance for optimizing blade design to improve mass transfer, reduce energy consumption, and increase overall performance in anaerobic digestion and biofuel production systems.
4. Conclusions: Findings, Contributions, and Future Works
This study investigated the effectiveness of various agitator blade designs and configurations for bioreactor mixing using ANSYS Fluent simulations. The performance of Rushton, curved-pitch, and propeller blades was analyzed in single, double, and triple impeller setups within a three-liter fluid tank, which considered mixing efficiency, power consumption, and torque behavior. Single-blade analyses demonstrated that the curved blade generated the highest peak velocity of 0.521 m/s and promoted strong localized circulation, with an average gas volume fraction of 6.15% and peaks ranging from 43.32% to 62.26%. The propeller blade produced a lower average velocity of 0.254 m/s but maintained more uniform circulation, achieving an average volume fraction of 12.25% and peaks between 37.24% and 67.71%. The Rushton blade achieved moderate velocities of 0.281–0.347 m/s with consistent circulation, but lower average gas fractions (6.22%) and peaks of 3.11–18.67%. Dual-impeller configurations, such as curved–propeller or curved–Rushton, improved mixing by combining localized and uniform flow patterns. Especially, in the curved–propeller setup, average velocities were 0.342 m/s at the top and 0.184 m/s at the bottom, with volume fractions of 74% and 44%, respectively. Other combinations showed layered distributions, demonstrating that impeller placement strongly affects vertical mixing. Triple-impeller arrangements provided the most extensive circulation, particularly in the upper regions. The curved–Rushton–propeller setup achieved an average velocity of 0.301 m/s with high-volume fractions (93%) near the Rushton blade, while the lower region remained at 26%. The Rushton–curved–propeller configuration reached the highest average velocity of 0.310 m/s, with upper-region volume fractions of 24–91%, whereas the lower third remained poorly mixed (18%). Overall, triple-blade arrangements enhanced upper-region mixing, while lower zones were limited by the placement of Rushton turbines.
Power consumption increased nonlinearly with both RPM and the impeller-to-tank diameter ratio (d/D), with triple-blade configurations demanding the most energy. Torque and power values generally declined over time as the system stabilized. The most efficient energy-performance balance occurred at d/D = 0.75 and RPMs between 80 and 120. Although higher RPMs improved flow stability, they also increased energy usage. Configurations such as curved blades at the bottom and propellers at the top achieved thorough mixing with moderate power input and make them ideal for bioreactor optimization. Each blade type displayed various hydrodynamic characteristics affecting fluid flow, shear stress, and mixing efficiency. Rushton blades caused radial flow that improved gas dispersion but also created high shear. Curved-pitch blades offered a mix of axial and radial flow, enabling even nutrient distribution and moderate shear. Propeller blades created axial flow that supported bulk circulation with low shear and make them suitable for large-scale bioreactors.
The study shows that combining different blade types improves mixing efficiency, with triple-impeller configurations providing the most uniform flow and improved circulation. Analysis of fluid velocity, shear forces, and volume fractions revealed that single, double, and triple blade setups each have strengths in promoting homogeneous mixing. The findings identify optimal configurations that balance shear and circulation, supporting better biomass growth and gas exchange. Utilizing ANSYS Fluent for CFD simulations enabled detailed insights into bioreactor fluid dynamics, which reduces reliance on experimental testing. These results offer practical guidance for selecting blade designs intended for specific bioprocess needs, ultimately improving bioreactor efficiency and performance.
Future studies should validate the simulation results through experimental mixing tests in bioreactors to confirm the accuracy of CFD predictions. Investigating the impact of variable agitation speeds and fluid viscosities on mixing efficiency would provide insights into real-time bioreactor performance adjustments. Extending the analysis to larger-scale bioreactors will help assess the scalability of the proposed mixing configurations for industrial applications. Further research should consider gas–liquid and solid–liquid interactions in bioreactors to enhance mass transfer and process optimization. Integrating AI-based monitoring systems to analyze real-time data on mixing dynamics could enhance bioreactor automation and efficiency.
Author Contributions
Methodology, H.-G.L.; Software, B.R.; Data curation, B.R.; Writing—original draft, H.-G.L.; Writing—review & editing, H.-G.L.; Project administration, H.-G.L. All authors have read and agreed to the published version of the manuscript.
Funding
This research was funded by Tarleton State University Graduate Studies (Funding Number: U400071) in December 2023, and the APC was supported by the Clean Energy Initiative.
Data Availability Statement
The original contributions presented in this study are included in the article. Further inquiries can be directed to the corresponding author.
Conflicts of Interest
The authors declare no conflict of interest.
Nomenclature
| d | diameter (impeller) [m] |
| D | diameter (vessel) [m] |
| ρ | density [] |
| α | volume fraction |
| U | velocity [] |
| ε | average rate of energy dissipation |
| k | phase mass transfer coefficient [] |
| N | impeller speed [rpm] |
| g | gravity acceleration [] |
| p | pressure [] |
| μ | dynamic viscosity [Pa·s] |
| drag coefficient |
References
- Short-Term Energy Outlook (STEO); U.S. Energy Information Administration: Washington, DC, USA, 2024. Available online: https://www.eia.gov/outlooks/steo/pdf/steo_full.pdf (accessed on 20 February 2025).
- Messer, D.; Lee, H.G. Study on the capacity of a hybrid solar PV/wind turbine system using small-scale prototype application for dairy farm power demand in North Texas. Int. J. Comput. Sci. Eng. 2024, 27, 302–313. [Google Scholar] [CrossRef]
- Ahmad, S.T.; Shaukat, H.; Rout, P.R.; Fazal, T. Bioenergy production from wastewater using cost-effective ceramic membranes: A review. Environ. Chem. Lett. 2025, 23, 463–490. [Google Scholar] [CrossRef]
- Dominic, D.; Baidurah, S. A review of biological processing technologies for palm oil mill wastes treatment and simultaneous bioenergy production at laboratory scale, pilot scale and industrial scale applications with technoeconomic analysis. Energy Convers. Manag. X 2025, 26, 100914. [Google Scholar] [CrossRef]
- Kim, J.Y.; Kim, J.; Kim, M.; Lee, S.M.; Kwon, E.E. Bioenergy production from yeast through a thermo-chemical platform. Bioresour. Technol. 2025, 419, 132086. [Google Scholar] [CrossRef]
- Ban, L.; Wu, D.; Sun, D.; Zhou, H.; Wang, H.; Zhang, H.; Xu, C.C.; Yang, S. Sustainable Production of Biofuels from Biomass Feedstocks Using Modified Montmorillonite Catalysts. ChemSusChem 2024, 18, e202401025. [Google Scholar] [CrossRef]
- Rosa, R.G.; Ferreira, V.C.; Barroso, T.L.; Castro, L.E. Corn biomass as a feedstock for biorefinery: A bibliometric analysis of research on bioenergy, biofuel and value-added products. Biofuels Bioprod. Biorefining 2024, 19, 206–230. [Google Scholar] [CrossRef]
- Cerqueira, C.Q.; Lora, E.E.S.; Souza, L.L.P.; Leme, M.M.V.; Barros, R.M.; Venturini, O.J. Life Cycle Assessment of Methanol Production from Municipal Solid Waste: Environmental Comparison with Landfilling and Incineration. Resources 2025, 14, 12. [Google Scholar] [CrossRef]
- Dhavaleswarapu, R.K.; Khuntia, H.K. 15–Biorefinery and circular economy approach for organic solid waste management. In Waste-to-Energy; Elsevier: Amsterdam, The Netherlands, 2025; pp. 361–382. [Google Scholar] [CrossRef]
- Neuner, T.; Meister, M.; Pillei, M.; Rauch, W. Optimizing mixing efficiency of anaerobic digesters with high total solids concentrations using validated CFD simulations. Biochem. Eng. J. 2024, 208, 109320. [Google Scholar] [CrossRef]
- Singh, B.; Szamosi, Z.; Simenfalvi, Z. State of the art on mixing in an anaerobic digester: A review. Renew. Energy 2019, 141, 922–936. [Google Scholar] [CrossRef]
- Hu, F.; Zhang, S.; Wang, X.; Wang, C.; Wu, J.; Poncin, S. Quantitative hydrodynamic characterization of high solid anaerobic digestion: Correlation of “mixing-fluidity-energy” and scale-up effect. Bioresour. Technol. 2022, 344, 126237. [Google Scholar] [CrossRef]
- Arnau, R.; Coment, J.; Martinez, R.; Rodriguez, J.; Chiva, S. Evaluation of hydraulic mixing performance in a full-scale anaerobic digester with an external liquid recirculation system using CFD and experimental validation. Chem. Eng. Sci. 2022, 251, 117392. [Google Scholar] [CrossRef]
- Neuner, T.; Meister, M.; Pillei, M.; Senfter, T. Impact of Design and Mixing Strategies on Biogas Production in Anaerobic Digesters. Water 2024, 16, 2205. [Google Scholar] [CrossRef]
- Kariyama, I.D.; Zhai, X.; Wu, B. Influence of mixing on anaerobic digestion efficiency in stirred tank digesters: A review. Water Res. 2018, 143, 503–517. [Google Scholar] [CrossRef] [PubMed]
- Ramirez-Carmona, M.; Rendon-Castrillon, L.; Ocampo-Lopez, C.; Alvarez-Florez, V. Design and Construction of an Aerated Accumulation Bioreactor for Solid Waste Treatment. Processes 2025, 13, 2312. [Google Scholar] [CrossRef]
- Lee, H.G.; Dulany, Z. Biogas and hydrogen production from waste biomass via dark fermentation evaluating VFAs, COD, and HRT for process optimization. Biomass 2025, 5, 57. [Google Scholar] [CrossRef]
- Muralidharan, N.; Bolduc, E.; Davis, M. Characterizing Oxygen Mass Transfer and Shear During Cell Culture: Calculating the Maximum Cell Density Supported By a 20,000-Liter Stirred-Tank Bioreactor. BioProcess Int. 2024, 22, 38–46. [Google Scholar]
- Oyejide, A.; Okeke, C.S.; Zaccheus, J.E.; Ige, E.O. Computational Assessment of Turbulent Eddy Impact on Hydrodynamic Mixing in a Stirred Tank Bioreactor with Vent based Impellers. arXiv 2024, arXiv:2412.18660. [Google Scholar]
- Waler, T. Bioreactors: The Heart of Pharmaceutical Bioprocessing. Pharm. Bioprocess. 2024, 12, 208–209. [Google Scholar]
- Palladino, F.; Marcelino, P.R.R.; Schologl, A.E. Bioreactors: Applications and Innovations for a Sustainable and Healthy Future—A Critical Review. Appl. Sci. 2024, 14, 9346. [Google Scholar] [CrossRef]
- Garcia-Ochoa, F.; Gomez, E. Bioreactor scale-up and oxygen transfer rate in microbial processes: An overview. Biotechnol. Adv. 2009, 27, 153–176. [Google Scholar] [CrossRef] [PubMed]
- Farid, M.U.; Olbert, I.A.; Buck, A.; Ghafoor, A.; Wu, G. CFD modelling and simulation of anaerobic digestion reactors for energy generation from organic wastes: A comprehensive review. Heiyon 2025, 11, e41911. [Google Scholar] [CrossRef]
- Sierra-Espinosa, F.; Carrillo, F.; Garciano, D. Computational analysis and modeling of algal bioreactors performance. In Algal Bioreactors; Elsevier Science Ltd.: London, UK, 2025; pp. 189–204. [Google Scholar] [CrossRef]
- Lin, X.; Li, K.; Wu, C.; Zhang, C.; Zhang, G.; Huo, X. Advances in modeling analysis for multi-parameter bioreactor process control. Biotechnol. Bioprocess Eng. 2024, 30, 235–261. [Google Scholar] [CrossRef]
- Akenteng, Y.D.; Chen, H.; Opoku, K.N.; Ullah, F.; Wang, S.; Kumar, S. The Role of Computational Fluid Dynamics (CFD) in Phytohormone-Regulated Microalgae-Based Carbon Dioxide Capture Technology. Sustainability 2025, 17, 860. [Google Scholar] [CrossRef]
- Abdelrahman, A.M.; Tabar, S.A.; Cicekalan, B.; Basa, S.; Ucas, G. Mesophilic versus thermophilic digestion of sludge in anaerobic membrane bioreactors. Bioresour. Technol. 2025, 417, 131822. [Google Scholar] [CrossRef]
- Lee, H.G.; Mckee, A.E.; Dulany, Z. Development of a compact, cost-effective bioreactor (BR 140) with integrated feedback control for optimised biogas production. Int. J. Des. Eng. 2024, 13, 176–212. [Google Scholar] [CrossRef]
- Zhu, Z.; Zhao, N.; Liu, S.; Hu, C.; Zhu, Y.; Qi, J. Boosting low-temperature sulfur-based autotrophic-heterotrophic denitrification using electrical stimulation in a continuous-flow bioreactor. J. Water Process Eng. 2025, 70, 107087. [Google Scholar] [CrossRef]
- Achleitner, L.; Winter, M.; Satzer, P. 3D printed autoclavable biocompatible biodegradable bioreactor vessels with integrated sparger made from poly-lactic acid. J. Biotechnol. 2024, 391, 33–39. [Google Scholar] [CrossRef] [PubMed]
- Yerolla, R.; Besta, C.S. Advanced temperature control in ethanol fermentation using a PSO-PID controller with split-range control strategy. Prep. Biochem. Biotechnol. 2025, 55, 196–209. [Google Scholar] [CrossRef]
- Campos, B.G.; Veloso, I.K.; Silva, M.M.; Badino, A.C.; Cruz, A.J.G. A novel approach to heat removal and temperature control in fed-batch extractive ethanol fermentation using CO2. Chem. Eng. Process.—Process Intensif. 2025, 210, 110212. [Google Scholar] [CrossRef]
- Karpinska, A.M.; Bridgeman, J. CFD-aided modelling of activated sludge systems-A critical review. Water Res. 2016, 88, 861–879. [Google Scholar] [CrossRef]
- Sharma, C.; Malhotra, D.; Rathore, A. Review of Computational fluid dynamics applications in biotechnology processes. Biotechnol. Prog. 2011, 27, 1497–1510. [Google Scholar] [CrossRef]
- Rairez, L.A.; Perez, E.L.; Diaz, C.G.; Luengas, D.A.C.; Ratkovich, N.; Reyes, L.H. CFD and Experimental Characterization of a Bioreactor: Analysis via Power Curve, Flow Patterns and kLa. Process 2020, 8, 878. [Google Scholar] [CrossRef]
- Nadal-Rey, G.; McClure, D.; Kavanagh, J.M.; Cassells, B.; Cornelissen, S.; Fletcher, D.F.; Gernaey, K.V. Computational fluid dynamics modelling of hydrodynamics, mixing and oxygen transfer in industrial bioreactors with Newtonian broths. Biochem. Eng. J. 2022, 177, 108265. [Google Scholar] [CrossRef]
- Fitschen, J.; Maly, M.; Rosseburg, A.; Wutz, J.; Wucherpfennig, T.; Schluter, M. Influence of Spacing of Multiple Impellers on Power Input in an Industrial-Scale Aerated Stirred Tank Reactor. Chem. Ing. Tech. 2019, 91, 1794–1801. [Google Scholar] [CrossRef]
- Xing, Z.; Duane, G.; Sullivan, J.; Chelius, C.; Smith, L.; Borys, M.C.; Khetan, A. Validation of a CFD model for cell culture bioreactors at large scale and its application in scale-up. J. Biotechnol. 2024, 387, 79–88. [Google Scholar] [CrossRef] [PubMed]
- Pincovschi, I.; Dragomirescu, A.; Modrogan, C. Influence of impeller design on oxygen transfer in a stirred water tank with square cross-section. Biochem. Eng. J. 2025, 216, 109649. [Google Scholar] [CrossRef]
- Yamoah, S.; Martinez-Cuenca, R.; Monros, G.; Chiva, S.; Macian-Juan, R. Numerical investigation of models for drag, lift, wall lubrication and turbulent dispersion forces for the simulation of gas–liquid two-phase flow. Chem. Eng. Res. Des. 2015, 98, 17–35. [Google Scholar] [CrossRef]
- Shiue, A.; Hu, Q.; Ye, Y.; Jeng, J.; Leggett, G. Gas–liquid mixing performance of anon-Newtonian fluid in a multiple-impeller agitated tank. J. Chem. Technol. Biotechnol. 2025, 100, 104–120. [Google Scholar] [CrossRef]
- Kadic, D.; Heindel, T.J. An Introduction to Bioreactor Hydrodynamics and Gas-Liquid Mass Transfer; Wiley: New York, NY, USA, 2014; ISBN 978-1-118-10401-9. [Google Scholar]
- Madenius, C.F. Bioreactors: Design, Operations, and Novel Applications; Wiley: New York, NY, USA, 2016; ISBN 978-3-527-33768-2. [Google Scholar]
Disclaimer/Publisher’s Note: The statements, opinions and data contained in all publications are solely those of the individual author(s) and contributor(s) and not of MDPI and/or the editor(s). MDPI and/or the editor(s) disclaim responsibility for any injury to people or property resulting from any ideas, methods, instructions or products referred to in the content. |
© 2025 by the authors. Licensee MDPI, Basel, Switzerland. This article is an open access article distributed under the terms and conditions of the Creative Commons Attribution (CC BY) license (https://creativecommons.org/licenses/by/4.0/).