Article

An Efficient Concept to Integrate Traffic Activity Dynamics into Fleet LCAs

by
Sokratis Mamarikas
,
Zissis Samaras
and
Leonidas Ntziachristos
*
Department of Mechanical Engineering, Aristotle University Thessaloniki, 54124 Thessaloniki, Greece
*
Author to whom correspondence should be addressed.
Energies 2025, 18(19), 5075; https://doi.org/10.3390/en18195075
Submission received: 31 July 2025 / Revised: 15 September 2025 / Accepted: 19 September 2025 / Published: 24 September 2025

Abstract

This paper addresses the underrepresentation of traffic activity in Life Cycle Assessment (LCA) practice despite its critical influence on the energy and environmental footprint of both electrified and conventional vehicles. To bridge this gap, the paper proposes a new framework that enhances the integration of traffic dynamics into fleet LCAs while maintaining computational simplicity. The approach combines Macroscopic Fundamental Diagrams (MFDs), which estimate network-level traffic performance, with an average-speed-based emissions model to evaluate on-road energy use and emissions performance of traffic. This quantification is further extended by applying life cycle inventory emission factors to account for upstream and downstream impacts, including energy production, vehicle manufacturing, and end-of-life treatment. The framework is demonstrated through a case study involving urban traffic networks in Zurich and Thessaloniki. Results illustrate the method’s capacity to evaluate multiple vehicles within realistic flow scenarios and adaptability to variable traffic conditions, offering a practical and scalable tool for improved energy and environmental assessment of road transport fleets.

1. Introduction

In previous decades, environmental assessments for the road transport sector focused on the tailpipe emissions of vehicular fleets in various research, policy, and engineering application areas [1,2,3]. This choice was evident because fleets were dominated by Internal Combustion Engine Vehicles (ICEVs) that produce most of their emissions directly from exhaust during driving. In this tailpipe-oriented assessment framework for ICEVs, traffic activity—i.e., the multiple vehicles movement and interactions in road networks—had a central role, being one of the most important parameters that influence the footprint of the sector [4,5,6,7,8].
Tailpipe emissions are, however, neutral in emerging powertrain types like Battery Electric Vehicles (BEVs) [9,10], with these cars’ footprint identified in upstream and downstream processes, as in production of electricity [11,12], their manufacturing processes (especially for batteries), and end-of-life treatment [13]. Although BEVs produce no tailpipe emissions, traffic activity remains important for them. Congestion, for example, significantly affects the on-road electricity consumption [14], thereby influencing proportionally the quantities that should be generated in the upstream. Thus, traffic activity should continue being a key parameter in fleet-based environmental assessment cases in the electrified era.
Life Cycle Analysis (LCA) is the most popular environmental assessment method for BEVs because it combines all the emission sources associated with the vehicle lifetime, extended from the extraction of materials to the final deposition [15]. However, an open question relates to whether the method takes traffic activity sufficiently into account when it is applied in practice, particularly when the target is the fleet footprint.
Typical LCAs in the literature overlook both elemental aspects of traffic activity, i.e., the collective movement of vehicles and interactions. They totally ignore the multiple vehicle dimension, focusing on individual units by design. Research by Hawkins et al. [16], De Souza et al. [17], Hill et al. [18], Bieker [19] and García et al. [20] are some indicative examples among the many existing ones. By isolating vehicles from the traffic blocks that circulate in networks, these LCAs also insufficiently consider the second dimension of traffic activity that relates to the interactions in-between vehicles and with road infrastructure. Interactions are the reason that many different traffic conditions are created in networks, influencing emissions; however, LCAs only consider a specific static set described in a predefined driving cycle, mostly a standardized one with world-average characteristics. For example, the WLTC cycle is widely applied, but it is well known to exhibit a gap compared to real-world energy and emission performance, particularly under varying traffic dynamics [21]. This WLTC selection highlights an additional limitation of typical LCAs, given that traffic obtains different characteristics from region to region that cannot be reflected in a world-average cycle.
Fleet-based LCA has been proposed and applied in the literature to fulfill the need of treating multiple vehicles together [22,23,24,25]. Nevertheless, traffic activity is present but still not significant, commonly considered at the static and aggregated level of the fleet’s annual mileage that is conducted under average traffic conditions. Only a few attempts can be identified in fleet-based LCA literature that increase the level of detail to traffic dynamics. For instance, variable traffic loads and conditions that are specific to different networks and regions have been considered in research by Patella et al. [26], Patella et al. [27], and Göhlich et al. [28]. However, these papers enable traffic simulation models for producing the necessary data. Detailed simulation approaches are suitable for evaluations of this kind, but they also present some drawbacks since they require advanced know-how to set up the models and increased computational efforts for running wide-scale simulations and post-processing output data.
In this context, this paper proposes an efficient concept that is positioned in the fleet LCA domain and introduces traffic activity dynamics in the fleet footprint estimation. The proposed method evaluates the environmental performance of entire traffic streams composed of modern vehicle fleets, and it takes traffic conditions, including congestion, into account to provide a generic environmental LCA footprint assessment suitable for different traffic networks and regions. Τhe concept differentiates from literature given that it relies on a combination of simplified tools rather than complex models.

2. Materials and Methods

2.1. Fleet LCA Concept Overview

The fleet orientation in automotive LCA became feasible after the research of Field et al. [22]. In their paper, they have underlined that LCA principles for individual car units can be adjusted in the direction of considering entire fleets. They proposed as a major change that the notion of time can be introduced when lifecycle emissions are calculated, stressing the point that impacts at a system level change as time passes, being influenced by parameters such as the electricity mix decarbonization, advances in manufacturing, and others.
We make similar considerations in our case, focusing on the parameter of traffic activity that also changes status with time. So, in our fleet LCA concept, the actual “product” is the fleet of vehicles that penetrates traffic streams of a road network, selecting as a functional unit the fleet operation in a traffic environment for a variable temporal resolution. With this unit, the LCA output becomes the total quantity of emissions for which the fleet in a traffic network is responsible over a chosen period (e.g., year, month, day, hour), the exact duration of which can be specified by the analysis needs and the application type. Spatial boundaries extend the traffic network domain, while the system boundaries include the LCA stages of vehicle use (including the production of energy), along with materials extraction, vehicle manufacturing, and end-of-life treatment.
The fleet LCA concept is graphically introduced in Figure 1 and mainly targets simplicity and computational efficiency, even though it examines many vehicles that operate and interact in a traffic network that changes states throughout a time period. This intention is reflected in the selection of the tools that are combined in the concept.
Specifically, the concept integrates two approaches that macroscopically estimate how traffic operates in an area at a given period, and what the subsequent energy consumption/emissions performance of vehicles is. For this purpose, we chose Macroscopic Fundamental Diagrams (MFDs) for the traffic activity part and the average speed approach for the vehicles on road energy consumption/emissions estimations. These two approaches are linked, as traffic data from the first feed the second to estimate the on-road emissions and energy use of traffic flow (referred to as the Tank-to-Wheel footprint). It is noted that the connection of the two methods recently attracted scientific interest, expressed in papers by Barmpounakis et al. [29], Mamarikas and Ntziachristos [30], and Batista et al. [31]. It is also noted that although several other combination alternatives exist, ranging from more conventional simulation-based micro [32] and macro [33] frameworks to new deep learning techniques [34], we focus on a macro and simulation-free method that best satisfies our criteria of simplicity and computational efficiency.
A third approach in the form of LCA emission factors is applied on top of the average speed approach to calculate upstream generated emissions (referred to as the Well-to-Tank), associated with the production of energy quantities that are used by vehicles during their on-road operation. LCA emission factors are similarly utilized to define impacts beyond the use stage, considering processes of vehicle materials extraction, component manufacturing, and end-of-life deposition recycling.

2.2. Integrated Methodology

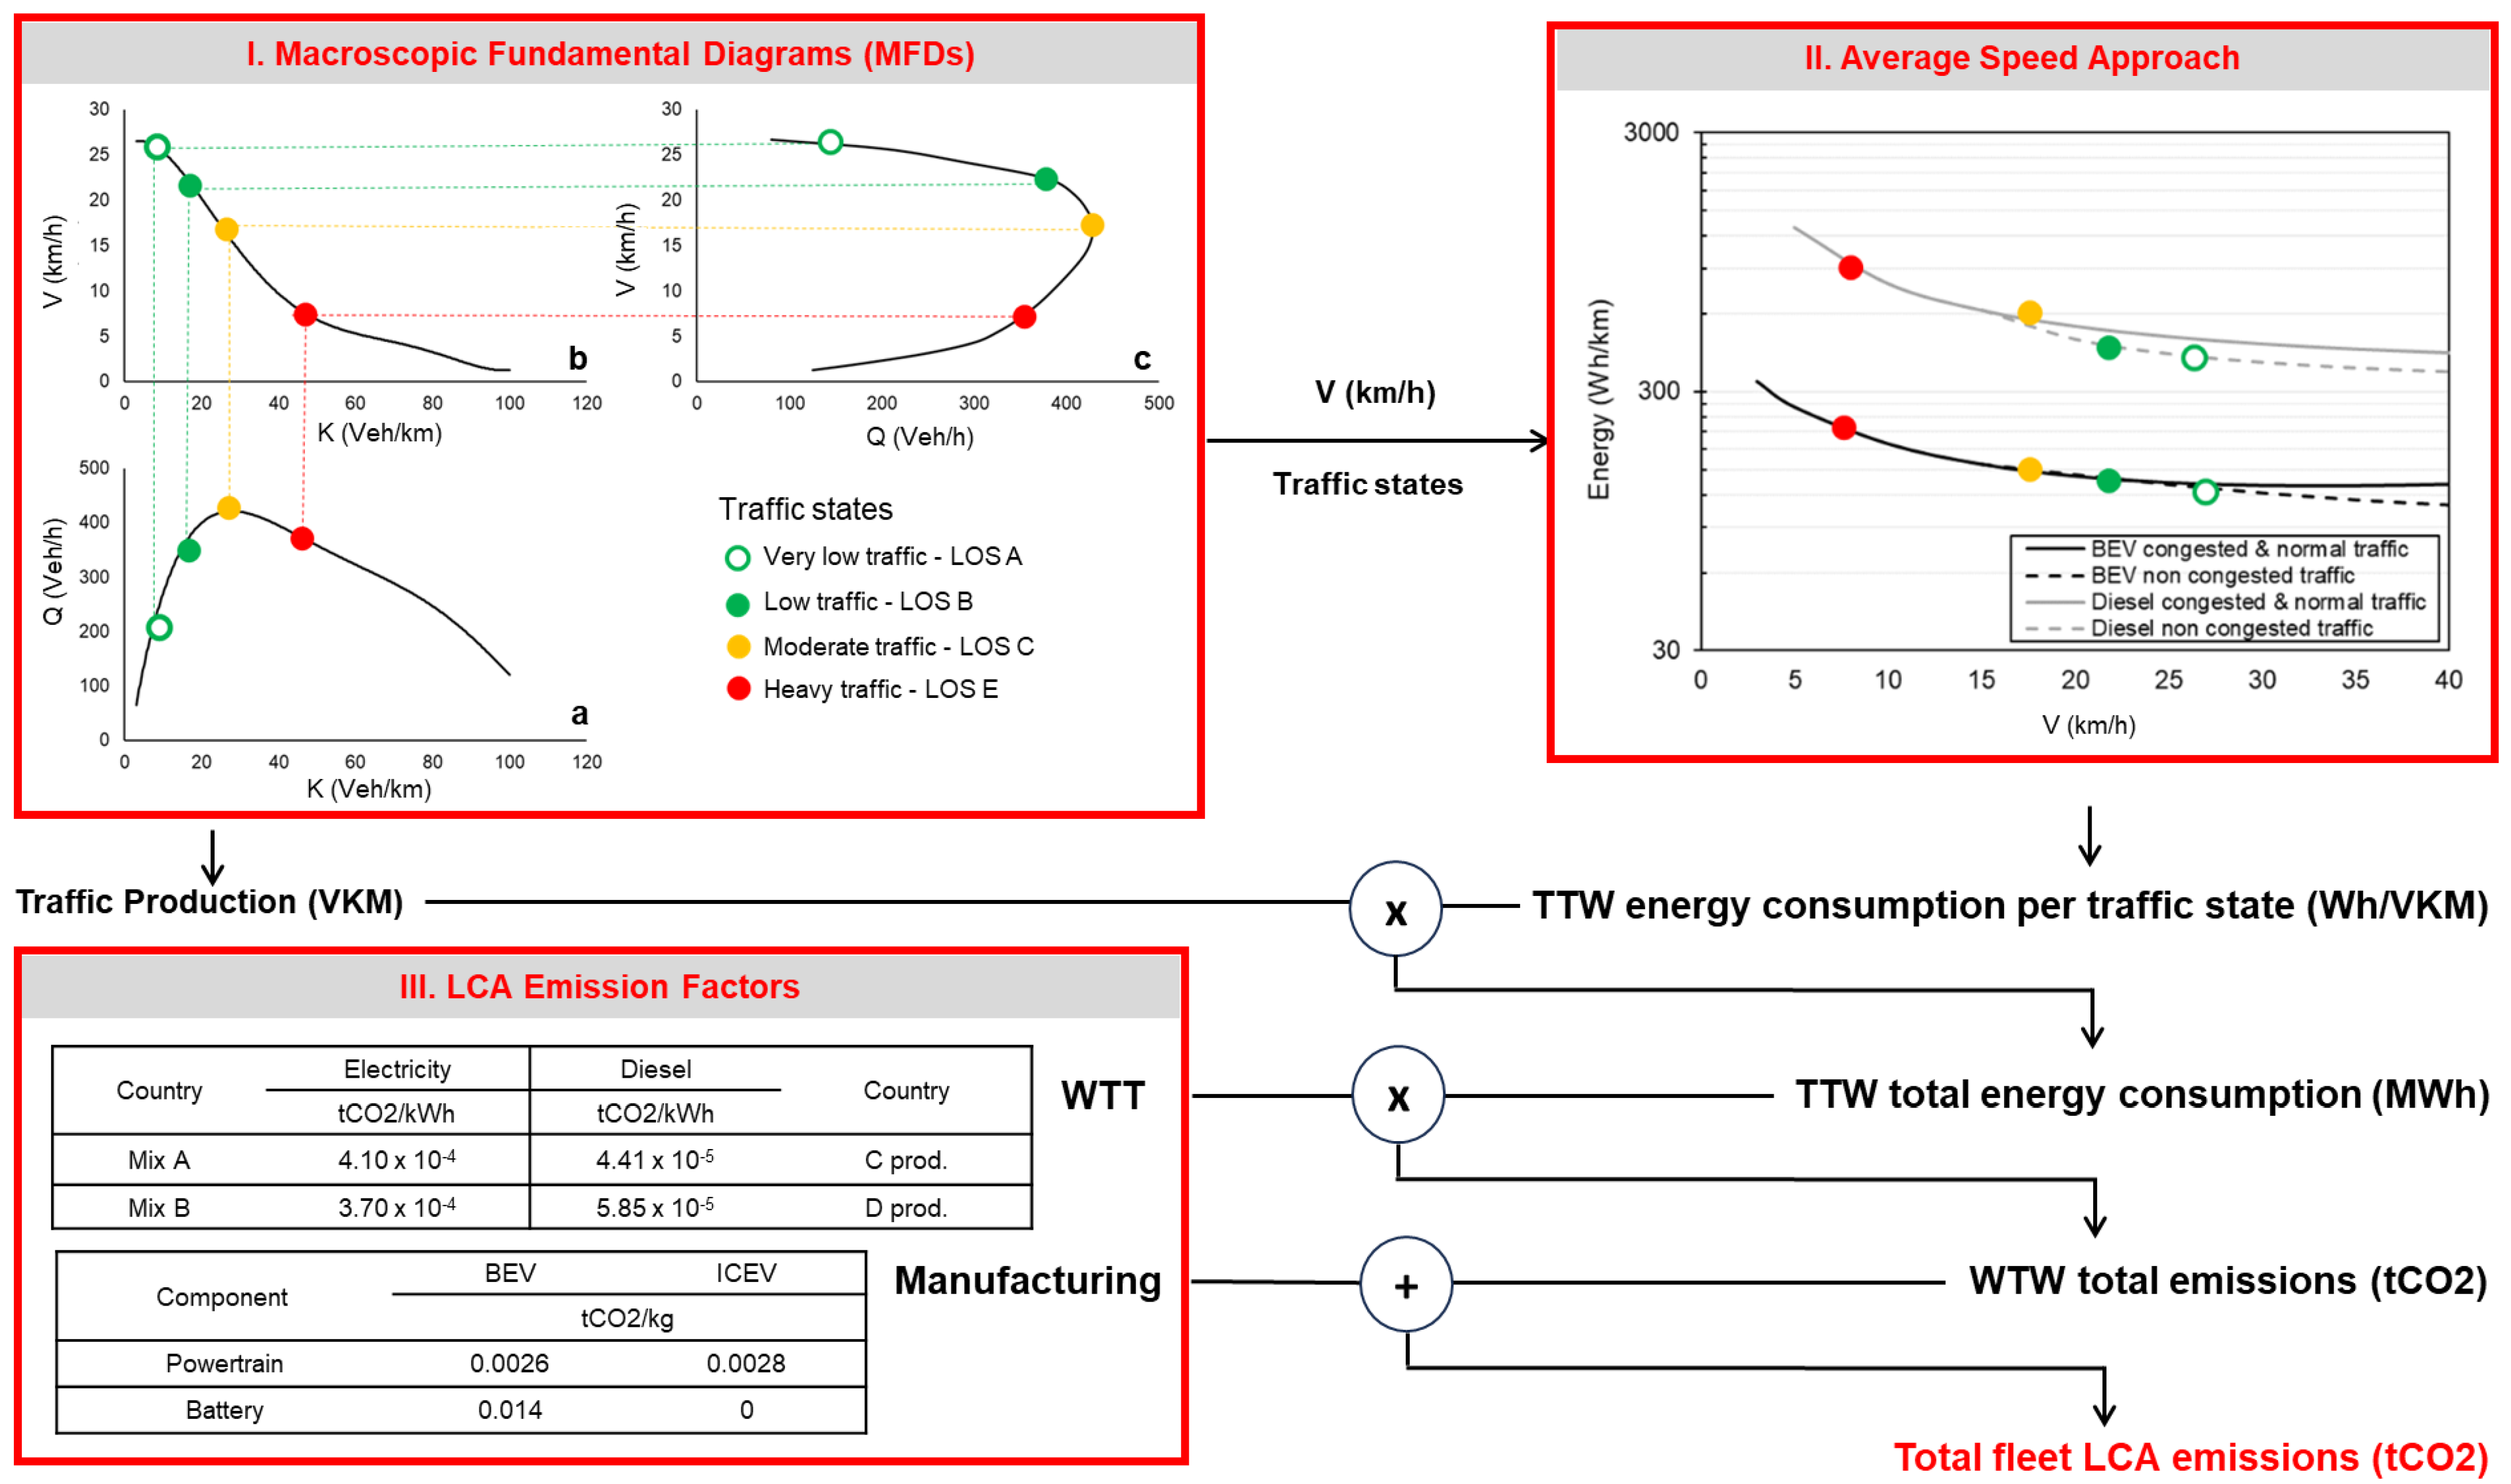
A more detailed schematic representation of the concept is developed in Figure 2. It includes the three individual tools (i.e., MFDs, average speed approach, LCA emission factors) and presents their connection through the exchange of input and output variables, along with the performed calculations and the extracted results. The methodological chain in Figure 2 quantifies the energy consumption and CO2 emissions in relation to the climate change contribution of fleets. But the overall concept can be similarly applied for pollutant emissions that are associated with other major environmental problems.
The following sections describe the overall method and tools in their theoretical background, providing the main principles that establish each approach. Their combination is later demonstrated in the Section 3 via two case studies in actual urban networks that are penetrated by conventional and electrified fleets. The application output, which also commented on the results, reveals the LCA-related footprint of fleets composed of BEVs and ICEVs, with emphasis given during the analysis on the dynamic integration of traffic activity achieved with the concept. Readers will be guided through the panels of Figure 2 to follow the concepts conveyed in this paper.

2.2.1. Traffic Performance with MFDs

The method of MFDs, adopted in this concept for traffic performance estimations, is the approach that expanded the well-established traffic theory method of Fundamental Diagrams from specific road sections to wider network areas. Geroliminis and Daganzo [37] particularly showed that a singular macroscopic relationship exists between the average traffic variables of density (K) and flow (Q) when considering multiple roads.
A MFD of density–flow (K-Q), similar to the one indicatively presented in Panel I-a of Figure 2, sufficiently explains how traffic behaves in an aggregated network. It indicates that flow (veh/h) remains low as density (veh/km) is low, meaning that few vehicles are in the area passing through road sections. Once more vehicles tend to use the system, traffic flow rises till a maximum point at which road network density reaches critical capacity. There, traffic flow can be optimally served with the maximum number of vehicles passing by. After this point, saturation appears because density exceeds capacity. Traffic flow is then evidently reduced as a limited number of vehicles can cross the dense roads for a specific time period.
Naturally, traffic conditions in a network are formulated and change based on this network operation profile described in the density–flow MFD. Vehicles face free-flow and non-congested conditions when the network operates at the left branch of the MFD, while normal conditions exist for an operation located around the critical peak point. Congestion, on the other hand, appears when operating in the MFD right branch.
Congestion causes delays and affects the quality of mobility services provided in the area, with the average speed (V) being a good metric for quantifying this quality. Speed (km/h) is higher in free-flow and non-congested conditions (left branch of the density–flow MFD) but dramatically drops when congestion appears (right branch of the MFD). To quantify the average speed of the network, this can be simply accomplished from the density–flow MFD, as the variable is equal to the ratio of flow over density according to a well-established relationship in traffic engineering theory. Through this rationale, continuous relationships between the speed and the other two variables can be produced in the form of MFDs of density–speed (K-V) and volume–speed (Q-V), similar to those presented in Figure 2 (Panels I-b, I-c). The complete set of MFDs of an area is interconnected, and it can fully quantify the status of traffic at a given period.
Overall, the shape of MFDs is a property of the network and remains the same irrespective of the traffic demand, given the flow is homogenously distributed in the examined area. The flow–density MFD also depicts a relation of accumulation with production for the traffic in this area. Accumulation refers to the total number of vehicles found in the road network (veh), and it is calculated by multiplying the density with the total road length. Production corresponds to the total distance traveled in the area by all the vehicles per hour (in vehicle kilometers–VKM), and it is the product of mean flow with the road network length.
Variables of production and average speed, together with the descriptive condition of traffic state (congested, normal, or non-congested), are the critical data that someone needs to specify and extract from MFDs, and further feed to the average speed approach as it proceeds to the next step for estimating the tank-to-wheel energy consumption and emissions footprint of the fleet in a specific area.

2.2.2. Tank-to-Wheel Energy Consumption/Emissions with the Average Speed Approach

The average speed approach, employed in our concept for estimating the direct on-road (tank-to-wheel) environmental impacts of traffic, is the algorithmic basis of popular traffic emission models (i.e., COPERT [38]) that provide network-level evaluations with increased accuracy despite their aggregated character.
The work of Ntziachristos and Samaras [39] has demonstrated that the energy consumption of road vehicles depends on average speed at the macroscopic level of traffic (similar to the one of Figure 2, Panel II). At low average speeds where stop-and-go is dominant, energy consumption is high, and this decreases when speed increases and smoother traffic conditions are achieved. However, BEVs present an energy consumption pattern that is different from the one of ICEVs because of their powertrain characteristics. While consumption of both powertrains elevates at very low speeds, each car type reacts differently when speed increases. BEVs present an early minimum in consumption at speeds around 35 km/h, typically found within urban traffic. In contrast, ICEVs optimum appears later on (approx. 70 km/h) outside of cities [14]. Braking regeneration is the main reason that BEVs behave particularly efficiently in traffic interactions, despite the fluctuations of urban driving. On top of this, and because of the overall excellent efficiency of the powertrain, BEV consumption changes with speed quite inelastically and always presents an absolute level that is lower than ICEVs.
Looking at traffic conditions’ impact on consumption in more detail, one can understand that free-flow situations should be characterized by considerably lower consumption than normal and congested because of reduced traffic dynamics even though speed does not dramatically increase. So, besides the fact that a single speed-dependent function is commonly used to express the variance of consumption with traffic conditions, Samaras et al. [8] showed that it is possible to distinguish the congested and normal from free-flow traffic, by expressing the energy consumption of the latter with a separate speed-dependent function. A change from a congested situation to a normal one takes place along the same continuous curve just by increasing average traveling speed. But the transition to a free-flow state is performed towards a second curve of lower consumption by applying the according speed shift from one state to the other. This method enhances the ability of the average speed approach to effectively capture different consumption levels as traffic changes status. It is applicable for both ICEVs and BEVs, even if the consumption of the second powertrain type is less sensitive to conditions change [14].
Hence, in our case, energy consumption and emission factors (i.e., consumption or emissions per vehicle distance unit—Wh/VKM or g/VKM) can be estimated for all powertrain types per traffic situation using this “enhanced” average-speed approach. This is accomplished once the approach receives traffic data inputs of average speed from MFDs, together with the descriptive condition of traffic where this speed is found. Further consideration of mileage activity conducted in the area, expressed by the MFD output of production, provides the total tank-to-wheel footprint of traffic in absolute value (in MWh for energy and in tons for emissions), on a temporal and spatial resolution determined by the available traffic inputs.

2.2.3. Well-to-Tank, Manufacturing, and End-of-Life Impacts with Emission Factors

“LCA-related” emission factors, as those used here to quantify the footprint on upstream and end-of-life stages, are found in relevant databases for compiling the inventories of LCA studies. These factors are compact, incorporating the emission impacts from the complete series of mechanical, thermal, electrical, and chemical processes employed in the energy (electricity/fuel) production chain and in the vehicle manufacturing industry.
The emission factors for energy production (electricity, fuel) typically extend just before the energy consumption by vehicles during on-road operation. These well-to-tank factors express the emission quantities released per unit of energy consumed (i.e., in g/kWh), and they combine stages of energy resource extraction/feedstock production, as well as the subsequent electricity generation/fuel production at power plants and refineries, respectively. They also take into account the efficiency of electricity transmission through power line networks and the footprint of fuel distribution via transportation means (ships, tanks). Looking at the background of these factors, we can observe that while for typical automotive fuels (i.e., diesel), emissions do not present critical deviations per production method, in the case of electricity, the picture is different. The energy mix used in generation strongly influences emissions. Once the electricity mix is based on fossil fuels like coal, then the carbon footprint is intensive, while it stays neutral when the mix relies on renewables. This is reflected in Panel III of Figure 2, which presents characteristic examples of the aforementioned factors: one for electricity generation under different fuel mixes, and a second for diesel production in refineries of different countries.
For the vehicle manufacturing and deposition LCA stages, vehicles are treated as typical products where impacts are defined for the beginning of their life (prior to the use stage) and for the end (after the use stage). The LCA-related emission factors for this case concern the vehicle components, such as the internal combustion engines, chassis, batteries, motor/generator, and other car parts. Each factor specifically quantifies the manufacturing emissions released per mass of component (i.e., in g/kg), merging the emission quantities related to the acquisition of raw materials, their further transformation into components, and the integration of components in cars during assembly. Transportation activity between production locations also adds some emission impact. Final deposition or recycling supplements the analysis, and dedicated factors are applied to specify them. In their background, these “LCA-related” factors, estimate the emissions based on the energy (electricity and/or fuel) consumed in various industrial processes (thermal, mechanical, etc.). Evidently, the material synthesis, the production country of each vehicle component, and the manufacturing method differentiate the according impacts because of the material impacts, the specific energy mix, and the distances between production sites and final customers.

2.2.4. Overall Impacts

The fleet’s total LCA environmental impact in relation to climate change (in tons of CO2) is finally revealed by summarizing together the emissions of all stages. The example in the following section sheds light on how to calculate this footprint.

3. Results—Application Through Theoretical Case Studies

To demonstrate the concept, we created two theoretical case studies in cities of different countries. Part of the urban areas of Thessaloniki in Greece and Zurich in Switzerland have been chosen to apply there the LCA concept and quantify total (on-road, upstream, end-of-life) environmental impacts of the fleet that evolves in their traffic network during a typical day. Selection of use cases is guided by two considerations. First, the availability of reliable traffic data ensures that the modeling can be performed with sufficient accuracy and comparability across contexts. Second, differences in the electricity mix of the countries play a crucial role in shaping the overall environmental footprint, as variations in renewable and fossil-based energy sources directly affect the emissions associated with vehicle operation. By focusing on use cases that reflect both criteria, we can capture meaningful variations in impact while maintaining robustness and transparency in the analysis.
The assessment is conducted twice for each area to compare the two main vehicle technologies that will penetrate fleets in Europe in the following years, and that accumulate the main discussion with respect to recent zero-emission policy decisions: the BEVs vs. the ICEVs (diesel). To highlight the change in footprint introduced by shifting to BEVs, the evaluation is made supposing that traffic streams are totally composed of one car type in each iteration. To particularly focus on the influence of traffic activity, we used a similar fleet composition for both areas, that of a typical medium-sized passenger car. Even though this is not a realistic case, it simplifies the analysis to effectively serve the target of demonstrating the method and highlight the role of traffic activity in fleet LCA. With such a simplification, the analysis is disengaged from differences in composition that exist among fleets of different countries (vehicle sizes, emission technologies, age, etc.) that would complicate the analysis in the direction of demonstrating the method. Therefore, the results can be considered realistic in absolute terms, as all pieces of the analysis are sufficiently covered with data that reflects their actual order of magnitude (traffic activity, on-road energy consumption, and LCA CO2 impacts). However, due to the fleet composition simplification, they should not be considered for inventory purposes for the two areas.
The MFDs for Thessaloniki’s city center, already presented in Figure 2, are based on data from Stamos et al. [35]. Those for Zurich are derived from the work of Loder et al. [40], which additionally provides an extensive dataset for many cities in the UTD19 database that is widely used in traffic engineering practice. The tank-to-wheel energy consumption factors for BEVs and ICEVs are obtained using the average-speed approach presented in Mamarikas et al. [14], whose work also contributed data to the updates of the widely applied COPERT model [38]. The LCA factors are taken from the GREET model [36], one of the most widely used LCA databases worldwide. All these data sources and models are considered reliable, as they incorporate real-world data during their development and validation and are broadly applied by the research community, thereby ensuring confidence in the accuracy of the results and conclusions.

3.1. Scenario

Compiling first the evaluation scenario, imagine a network area that operates in various traffic states throughout the day. This is because it receives various traffic loads as different numbers of drivers demand to use the system as time passes. Traffic conditions in that region will alter accordingly. Congestion will be caused by high demand at rush hours, while uncongested conditions will be faced by the limited number of vehicles that arrive in the area during off-peak. With this scenario, the contribution of traffic activity dynamics to the fleet LCA emissions for both areas can be sufficiently examined, taking into account the total number of vehicles in the network and the influence of traffic conditions that change throughout the day in response to the variable daily demand.
Since networks are non-identical, it is essential to identify similar traffic states for Thessaloniki and Zurich that can provide comparable results when these networks are relatively examined. For this purpose, we exploit the Level of Service (LOS) indicators, a scoring scale from A to F that is widely applied in traffic engineering practice to characterize the performance of traffic in road segments. Traffic is generally increased moving from LOS A to F, while quality of services accordingly drops. Even though the LOS characterization is a qualitative scoring method for traffic performance, the indicators can match quantitative variables. This attribute offers to our example a standardized but also a measurable way to describe common states and to compare how different networks behave.
We focus here for simplicity on four states (A, B, C, E) out of the LOS scale of six to construct a theoretical activity profile of daily traffic that can be representative of a typical one met in city centers during weekdays. We particularly assumed that both urban networks operate for twelve hours under low traffic, which finally leads to a performance typical of LOS A and B characterization. In the other half of the day, moderate traffic is develops for six hours, decreasing the quality of services to a C rate, while heavy traffic is attracted in the remaining six, which leads to a further downgrade of services at the E level.

3.2. Traffic Performance Evaluation

Characterizing numerically now the traffic performance in each study area using MFDs, the considered qualitative LOS states were firstly located on the density–flow graph (and on its derivative version of accumulation–production). We performed the allocation by applying a rationale found in Landman et al. [41], who specify in their paper the LOS ratings as a percentage of maximum network accumulation (derivative of density). Panel I-a of Figure 2 presents the indicative output of this process for Thessaloniki, visualizing states with different colored dots, while a similar picture would exist for Zurich. The first two states foreseen to reflect operation periods under light traffic (LOS A, B) were positioned to the left branch of the density–flow MFD at 30% and 60% of maximum accumulation (density equally). Both states are visualized in Figure 2-Panel Ι with green dot variants. The third state of moderate traffic (LOS C), marked with yellow, was found at the critical capacity point (100% of accumulation). The fourth state of heavy traffic (LOS E), colored with red, balanced on the right branch that corresponds to 200% accumulation. Once the four states were identified on the MFD, the status of traffic in both networks could then be quantified.
Traffic production values (in VKM) were obtained from the density–flow derivative of accumulation–production to measure total kilometers driven by all the vehicles of the fleet in the two areas per state. Kilometric activity conducted by the fleet is evidently narrow in light traffic states because of the low flow; it is maximized for moderate traffic where flow is optimally served at capacity, while it is marginally reduced in heavy traffic due to flow restrictions.
The description of the congestion status, related to the MFD branch on which states were located, was the second element of traffic interest extracted. States on the left branch correspond to free-flow and non-congested conditions. The peak point relates to normal conditions, and the right branch to congestion.
The networks’ average speed was finally specified, following the process illustrated in Figure 2-Panel Ι, where MFDs of flow–speed and density–speed were connected to the density–flow one. Speed appears increased in light traffic hours, surpassing 25 km/h, and drops towards heavy traffic formation, reaching a minimum of around 7 km/h.
Table 1 summarizes the three output values that are of interest to us in the traffic analysis. Metrics at the two areas appear close on their absolute values and relative behavior because networks responded in a similar way to the examined traffic states.

3.3. Energy Consumption/Emissions Performance Evaluation

3.3.1. Tank-to-Wheel Evaluation

After quantifying traffic performance, the tank-to-wheel energy consumption can be calculated for the fleets developed in Zurich and Thessaloniki. To do so, MFDs of each area were coupled with the average speed approach, with the variable of average speed being the key variable that connected the two tools. This is indicatively presented in Figure 2/Panel ΙΙ, where the four states of the scenario are positioned on the suitable speed-dependent function. Remember that average speeds associated with free-flow and non-congested conditions were provided as input to the function that reflects energy consumption in these situations. Similarly, speeds in normal and congested cases were fed to the second polynomial curve dedicatedly constructed for them. Therefore, energy consumption factors in Wh/VKM were estimated (Table 2), being relevant to the traffic conditions that characterized each state. The energy consumption factors in each network were calculated twice using the same traffic inputs in each iteration: once for a stream fully composed of ICEVs and a second time for a fleet composition substituted by BEVs.
Table 2 indicates that traffic flows in Zurich and Thessaloniki are characterized by almost identical energy consumption factors, given that these networks produced similar traffic outputs and common speed-dependent functions were employed under the assumption of the same fleet synthesis. So, the tank-to-wheel energy performance is explained jointly below without presenting substantial region-specific differentiations.
Commenting on this performance, we observe through Table 2 that a fleet of BEVs would always exhibit a lower consumption factor than the fleet of diesel cars. This is evident when we compare the two powertrain types in mutual traffic situations. Interestingly, the picture does not even change when we compare them in drastically contrasted cases, as the factors for BEVs in heavy congestion and for diesel in free flow characteristically reveal. Such findings are attributed to BEVs’ excellent powertrain efficiency and regenerative braking, which are both characteristics that make this car type optimally perform within urban traffic. Thus, driven by vehicle technology characteristics, a fleet of BEVs transforms traffic streams in the direction of becoming less energy intensive than they used to be when composed of ICEVs under any traffic conditions.
However, findings in Table 2 also reveal that traffic conditions still appear important when evaluating the energy performance in road networks, even if they are fully penetrated by BEVs. Changes in traffic conditions throughout the day differentiate importantly the energy efficiency of flows, but in a way that is specific to the powertrain type. Flows with ICEVs are affected more by transitions, while those with BEVs show a more inelastic pattern. For example, an improvement in the operation of networks towards mitigating congestion optimizes the efficiency of streams on both syntheses, with the case of ICEVs presenting the greater energy gains when free flow conditions are restored (59%), while BEVs seem to be influenced less (43%) by such a change. Both percentage values, though, indicate a critical consumption benefit that highlights how variable the energy intensity of streams can be during a day. So, traffic conditions remain an important aspect of consideration in on-road evaluations both for conventional and electrified fleet syntheses.
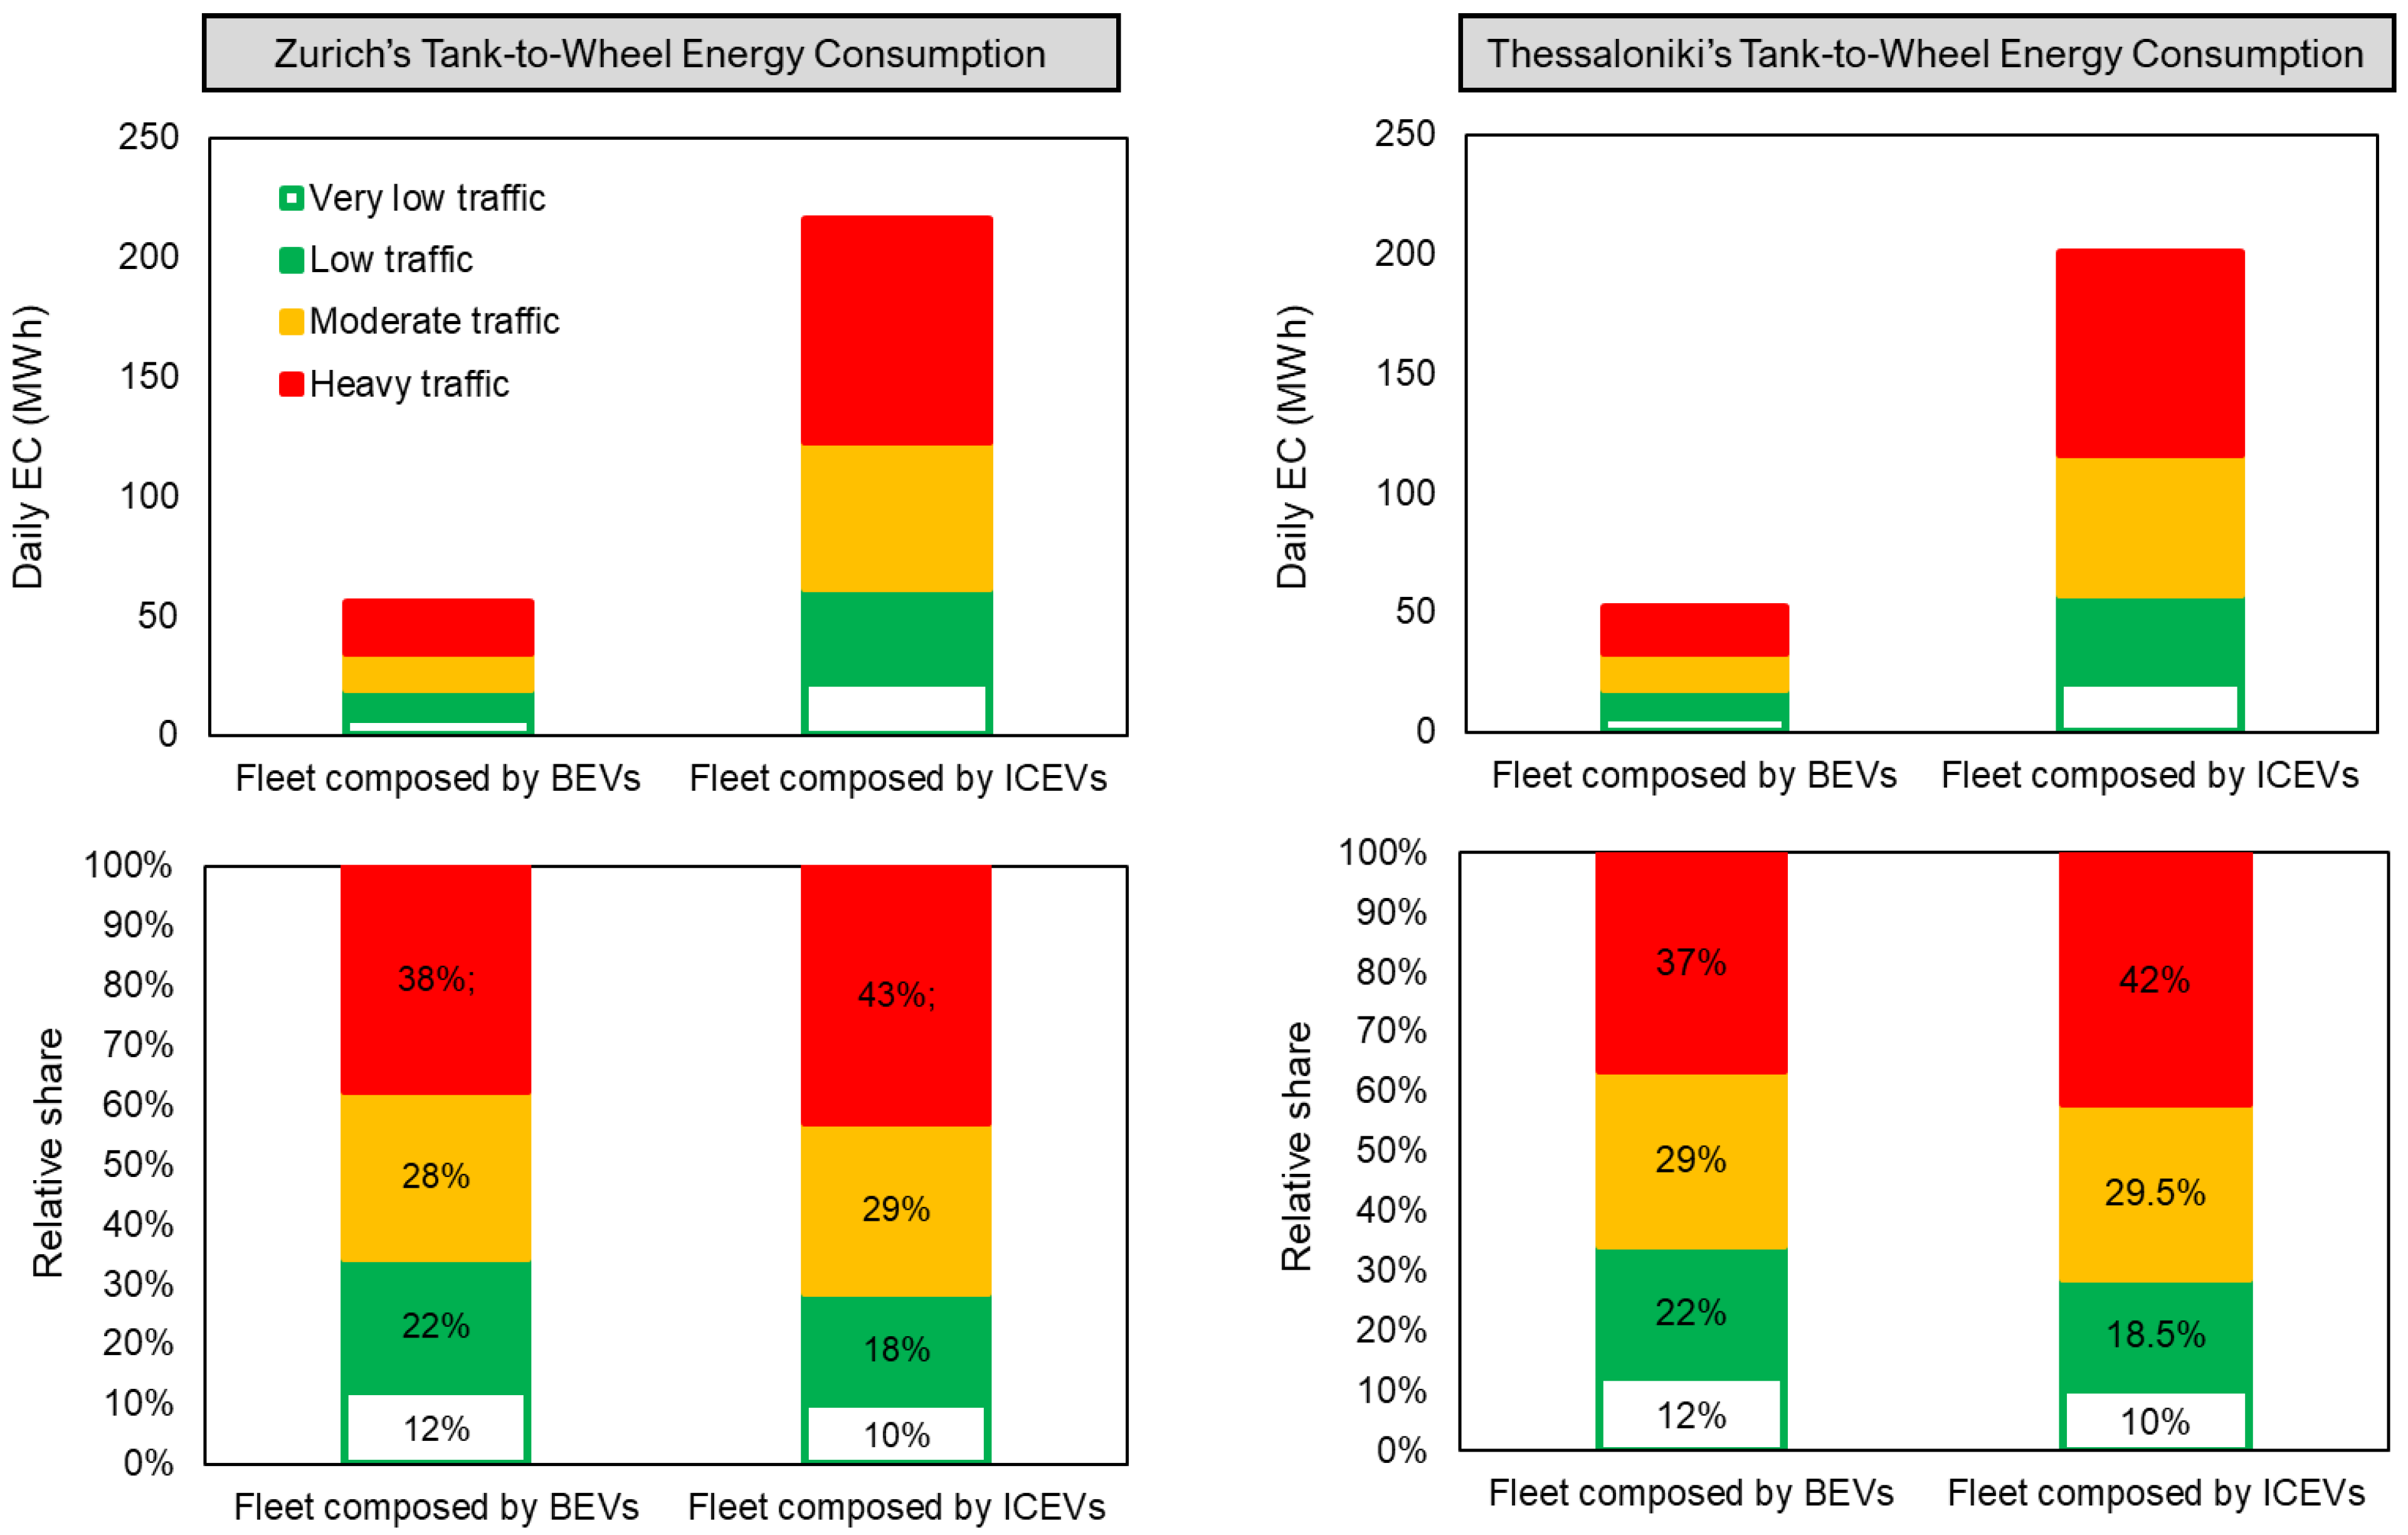
Once the energy consumption factors are multiplied by the activity variable of production (VKM), then the fleet total tank-to-wheel energy consumption was calculated for the four traffic states of the scenario. A daily profile of energy consumption for both networks had been produced when these states were synthesized in a temporally equal way, as Figure 3 presents on its upper panels. Results reveal the energy needs of the entire fleet in the area over 24 h, which are found to be reduced by 75% under the composition of BEVs compared to ICEVs.
Figure 3 also lists in its lower panels the percentage share that each state has of total consumption to better understand how traffic operation finally influences the tank-to-wheel footprint of the fleet. Hours of heavy traffic evidently contribute more to energy needs since they combine the intensive consumption factor of congestion with the increased mileage activity of dense flows. The contribution of the other states is reduced towards going to the states of light traffic as conditions are improved and fewer vehicles gradually circulate in networks. This pattern exists for both fleets, and obviously BEVs could not be an exception. In addition, increased vehicular activity in any fleet synthesis naturally elevates the role of the busiest traffic hours in shaping the consumption profile of networks. But what also attracts our attention here is the quite narrower relative share that these two states occupy on the BEV consumption profile in relation to ICEVs (i.e., 66% vs. 72%). This finding verifies in practice that as traffic streams are populated by BEVs and become more energy efficient, then networks can carry increased loads of vehicles while suffering less from rises in their consumption than in the past.
In the previous paragraphs, the tank-to-wheel energy consumption footprint was quantified for entire traffic flows. The respective CO2 emission footprint could be obviously derived. It is zero for BEVs because they do not directly emit CO2 as they run on electricity, while it is proportional to fuel consumption for ICEVs. However, upstream emissions should be added on top of these to reveal the real CO2 footprint of fleets, as this paper highlights in its Section 1 and Section 2. Thus, two upstream emission parts were the remaining aspects under identification for concluding the evaluation cycle: (a) the primary CO2 emissions from energy production (well-to-tank), and (b) the CO2 emissions released from processes of vehicle manufacturing and end-of-life treatment.

3.3.2. Well-to-Wheel and LCA Evaluation

Well-to-tank CO2 emissions from electricity generation and diesel fuel production were addressed by utilizing LCA-related emission factors according to the methodological section guidelines.
For electricity generation, CO2 emission factors for various energy sources were retrieved from GREET and then weighted with the mix of energy sources of Switzerland and Greece. Typical transmission losses of 5% were also considered, assuming the same power line network efficiency in both countries. The carbon intensity of electricity in each country was then calculated in the form of a composite emission factor that integrates all the partial energy sources and the transmission efficiency. Table 3 summarizes these factors together with all energy source input data. Values show that electricity generated in Switzerland produces 92% less carbon emissions than in Greece. This is reasonable given that renewables and nuclear energy dominate the mix of the country, while the mix of Greece relies on a compromise between fossil fuels and renewables.
For diesel fuel, an LCA-related emission factor has been utilized, also from GREET, accounting for fossil fuel production and distribution. A typical refinery production was assumed, so a common factor was adopted for both countries. This factor is also included in Table 3 and clearly reflects that automotive fuel is linked with significantly lower upstream emissions than electricity when the latter relies on an intensive mix (i.e., Greece). However, primary impacts of diesel fuel appear more adverse than those of electricity when the generation of the latter is relieved from fossil fuel sources, as happens in Switzerland.
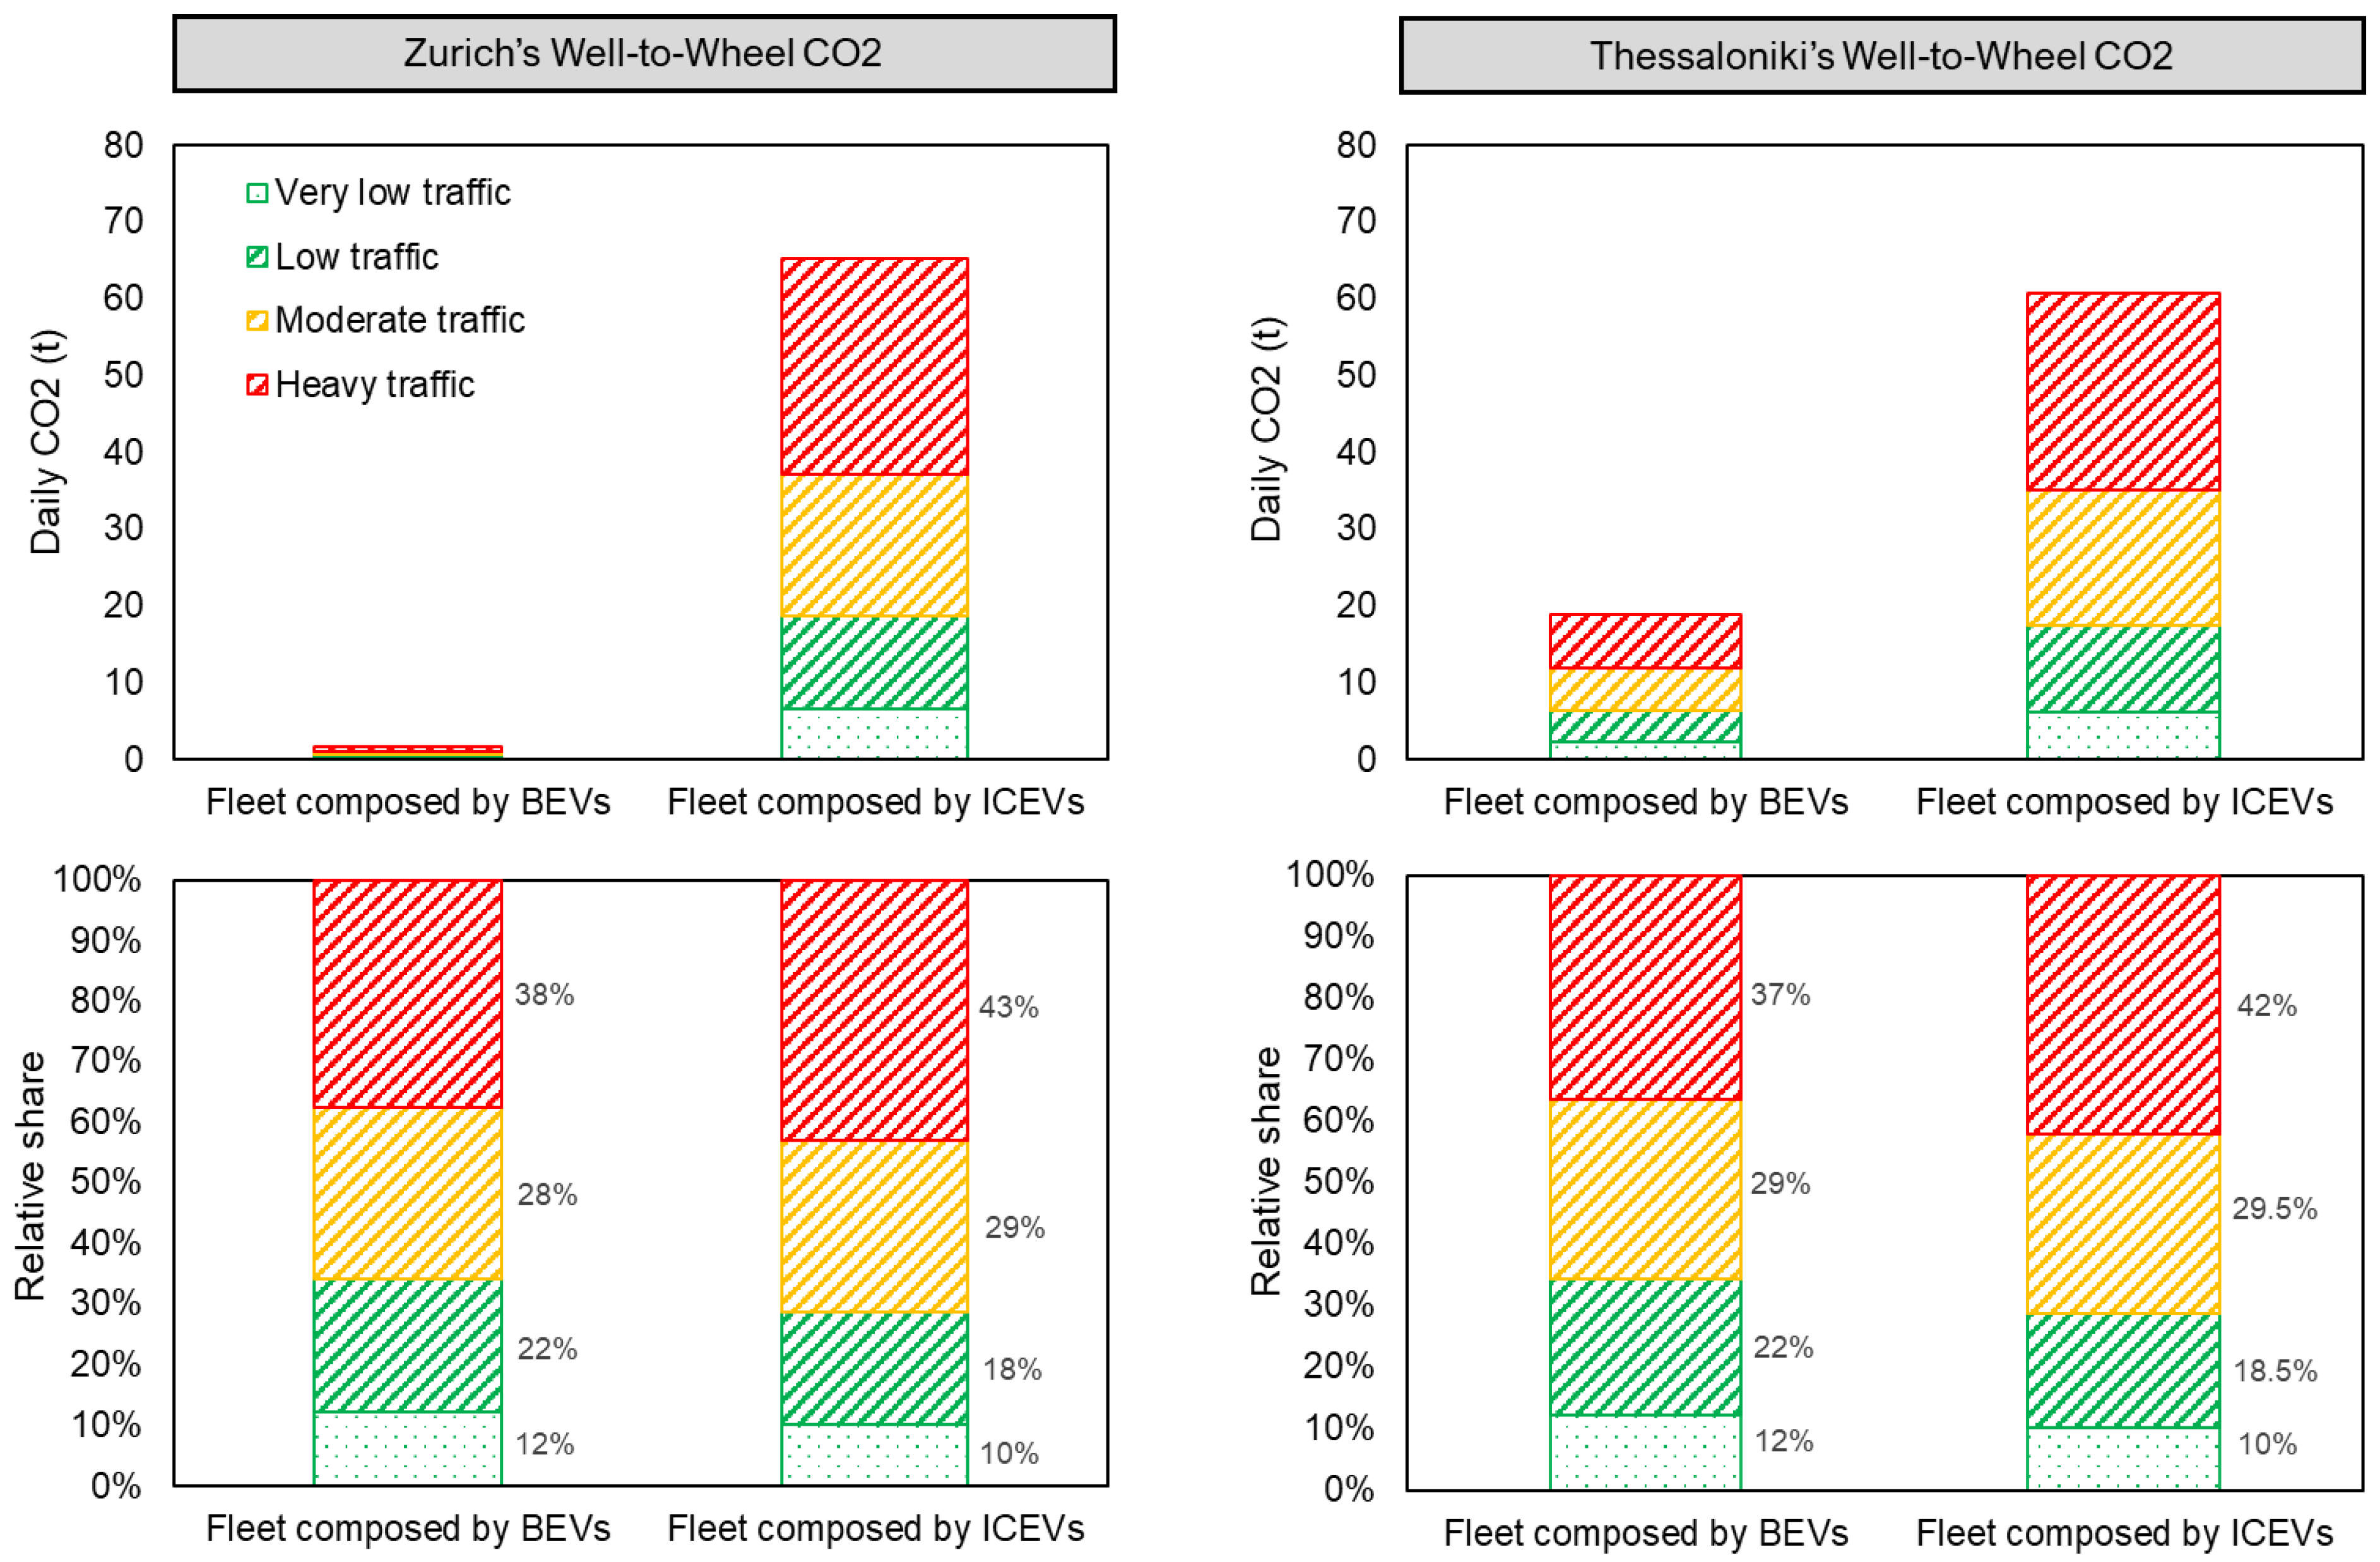
To calculate the well-to-tank CO2 emissions for fleets in Zurich and Thessaloniki traffic areas, the LCA emission factors for electricity and diesel fuel production (Table 3) were multiplied by the tank-to-wheel energy quantities used by BEV and ICEV fleets during their on-road operation (Figure 3). The CO2 daily profile was then updated from a well-to-wheel perspective in Figure 4, summarizing the quantities emitted for energy production, distribution, and use. Results verify that the carbon footprint of the fleet is clearly improved if BEVs were to substitute ICEVs, but in a way that is critically different among case study areas.
In the example of Thessaloniki, a difference of 65% was found in environmental impacts between the two examined fleet variants. That margin increases in Zurich, reaching a substantial level of 97%. Such a close to net-zero emission level achieved in Zurich under BEVs penetration is evidently attributed to the low carbon sources of electricity production in Switzerland. So, the electricity mix emerges here as a factor that dominantly differentiates the environmental performance of the BEV fleet between the two areas.
Looking closer at the daily profiles to understand the role of traffic activity, we observe that the non-intensive carbon mix in electricity generation diminishes the role of traffic states in determining the emission impacts for a BEV fleet. Emissions are minimal even in heavy traffic in Zurich. However, as electricity production becomes more carbon intensive, like in the case of Thessaloniki, traffic activity still drives emission impacts. Heavy traffic contributes more to daily CO2 and light traffic less in a way that has already been explained in the energy consumption part of the analysis. For a fleet of ICEVs, traffic states obviously keep shaping their footprint following the trends recognized in the tank-to-wheel part without experiencing substantial region-specific differentiations.
The impacts related to vehicle manufacturing and end-of-life stages were also addressed with LCA-related factors. Again, these were retrieved from GREET, being specific to the vehicle component masses. Table 4 lists such factors for component manufacturing per powertrain type along with some typical masses. The intensive factor of battery manufacturing indicates that this is the critical component that differentiates manufacturing emissions between BEVs and ICEVs. The other components do not offer substantial CO2 differentiations, as their factors reveal.
For end-of-life, it is noted that GREET follows the 100-0 cut-off allocation method. This means that components receive benefits when containing recycled materials, but they are exposed to the cost of the recycling process. This rationale is reflected in the manufacturing emission factors that appear reduced compared to the case of using virgin materials.
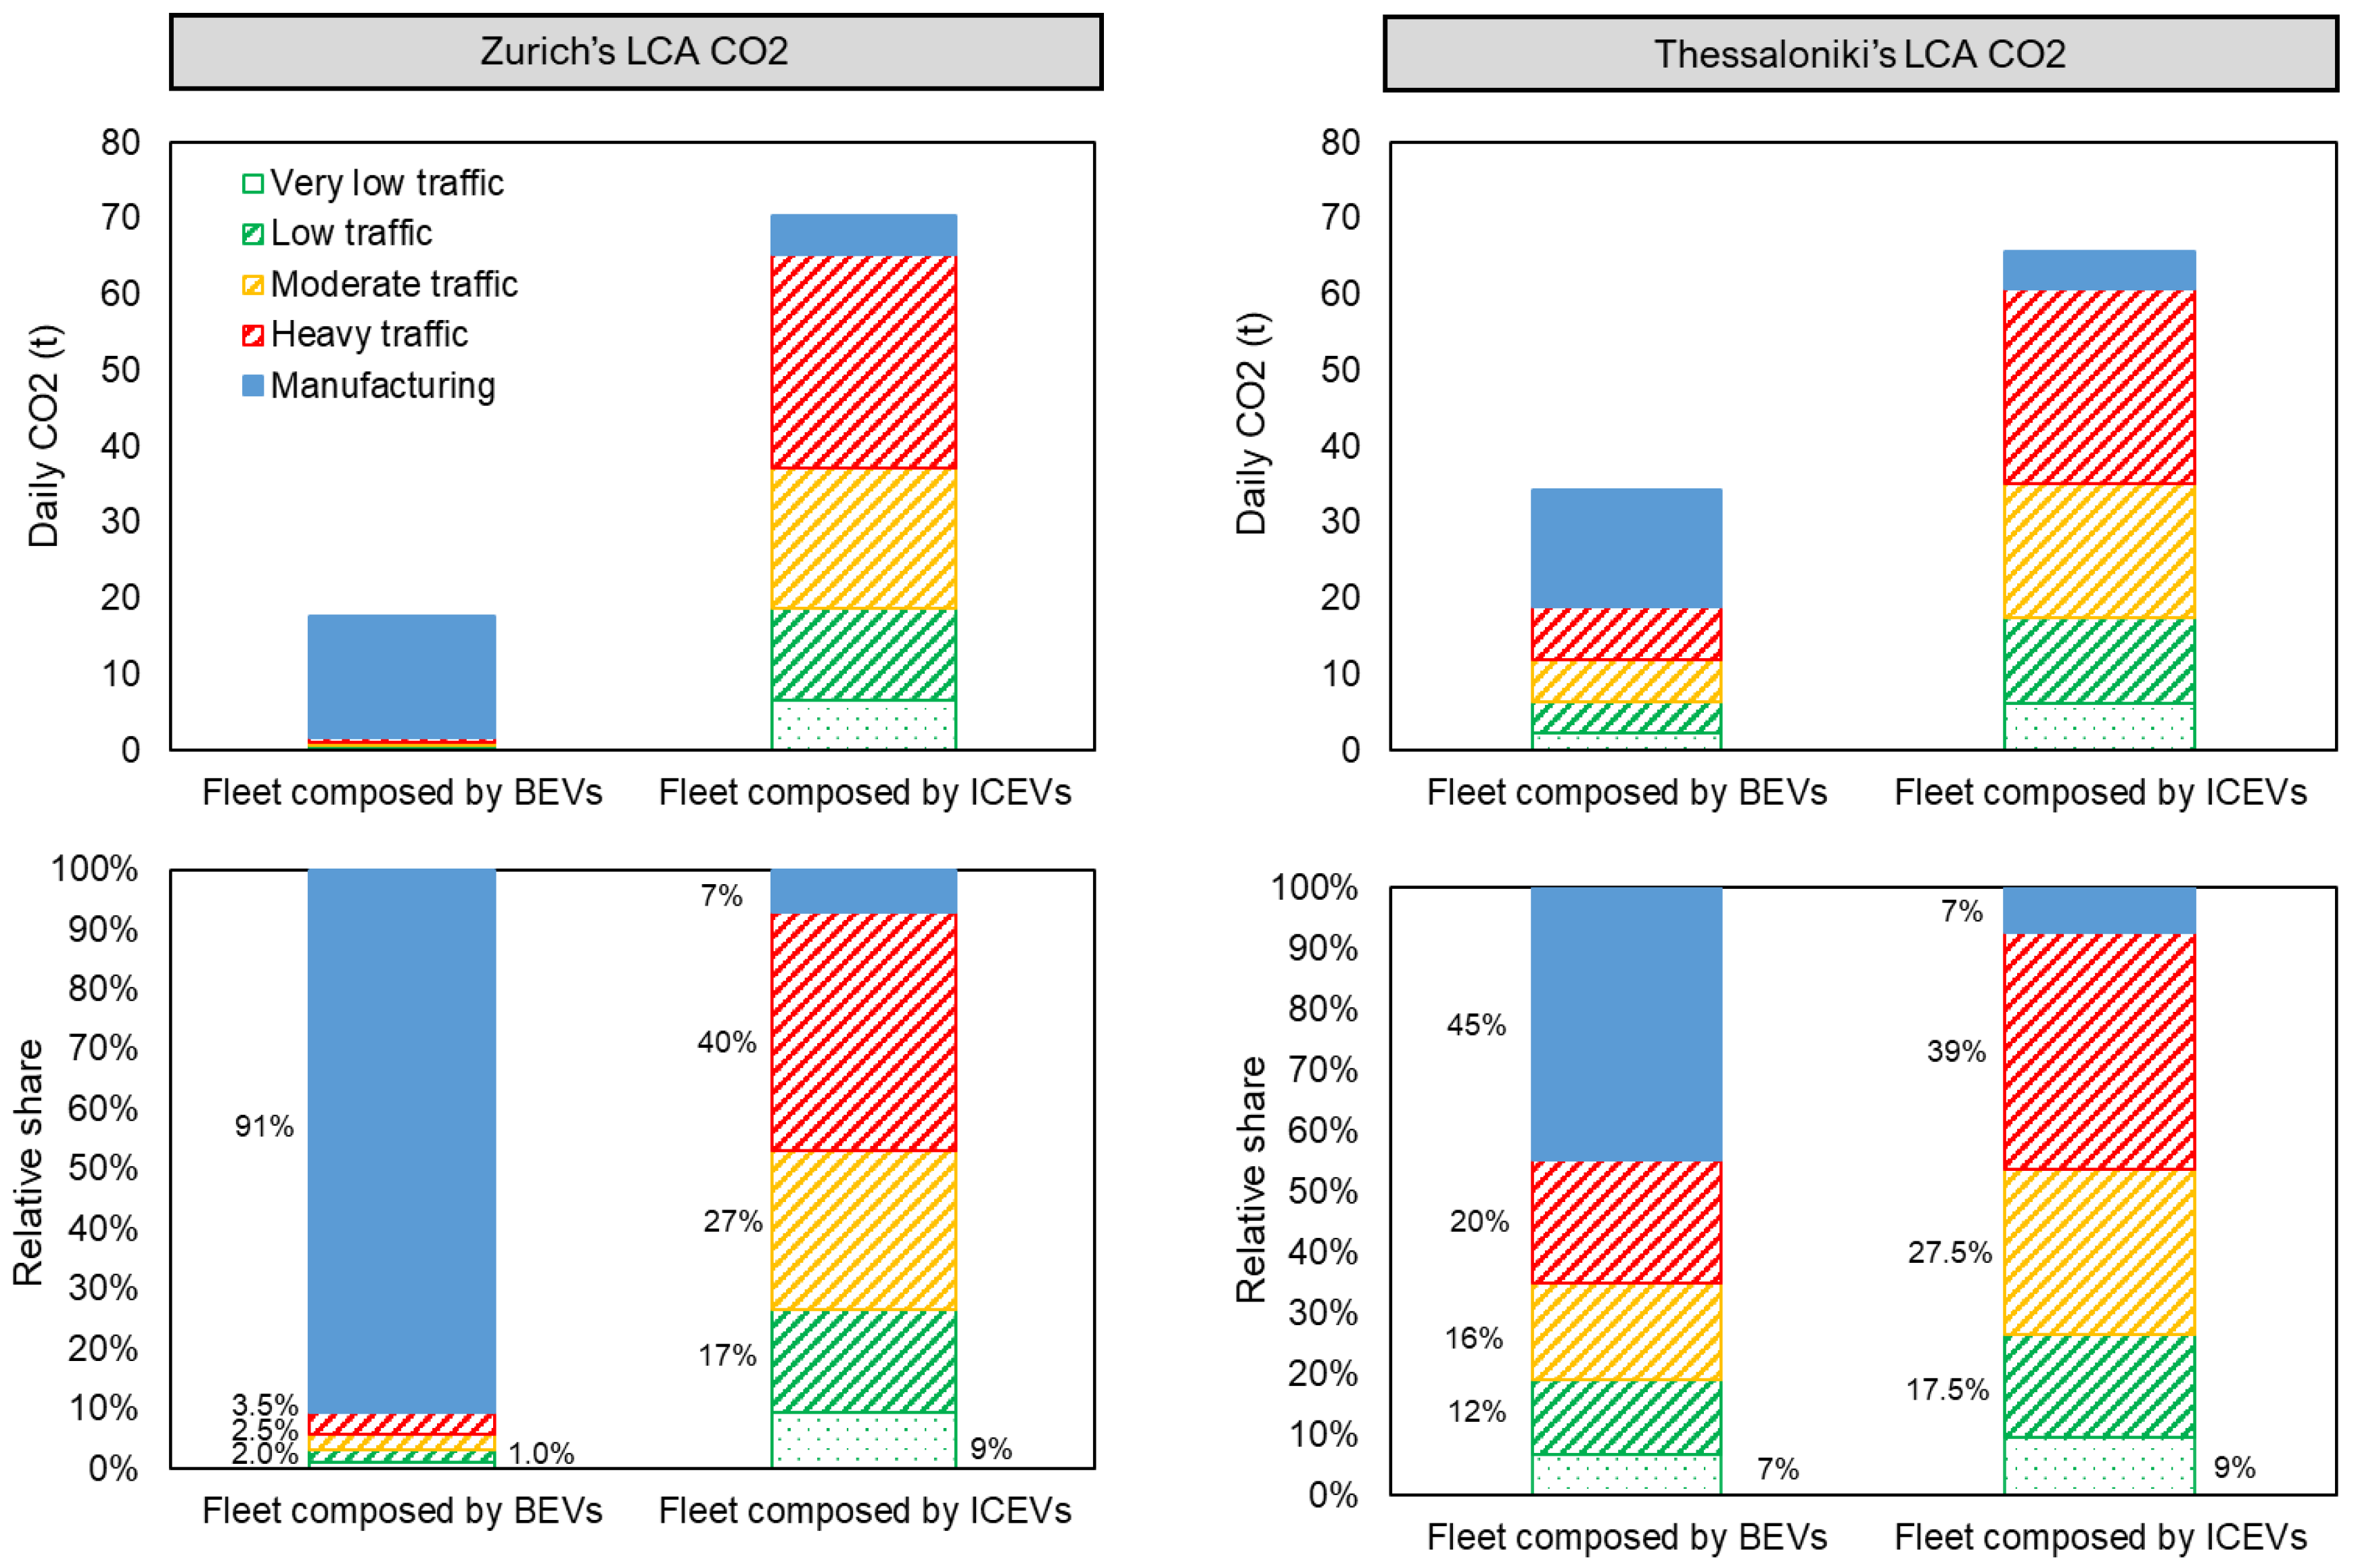
Thus, the overall LCA analysis for the two case studies was concluded with the calculation of the fleet emissions associated with the manufacturing processes of BEVs and ICEVs. The quantities of CO2 that occurred were added on top of the well-to-wheel ones, further updating the daily profiles in Figure 5 to now provide the complete LCA picture of the examined fleets in both areas.
But this part had to be added in a consistent way to the well-to-wheel emissions. The impact of manufacturing that can be typically allocated in LCAs throughout the vehicle lifetime had to be aligned with our concept that handles the fleet footprint on an adaptive temporal and spatial resolution. Here we used the daily resolution to highlight the role of traffic activity in a specific area. So, we assigned only part of the total manufacturing emissions to these networks in a way that is proportional to the conducted fleet activity in them. In particular, the two vehicle topologies were initially treated as products for which emissions from manufacturing were calculated on a car unit basis. This was made at a first step made by simply multiplying the LCA-related factors of vehicle components with their masses (data in Table 4). CO2 quantities were then apportioned on every km driven by a single vehicle during its lifetime, assuming a 225,000 km total operation. Fleet-based impacts were estimated after the distance specific emissions from manufacturing per car were multiplied by the total mileage production in each area for the entire fleet and per day.
Looking at the complete LCA results of Figure 5, the addition of manufacturing emissions closed the gap of environmental impacts between the BEV and ICEV fleets for both networks. Nevertheless, BEVs still appear as the environmentally friendlier solution for minimizing climate impacts, but their potential is reduced due to intensive battery manufacturing. Characteristically, the footprint difference between BEVs and ICEVs, found previously to be 97% in Zurich and 65% in Thessaloniki when only the well-to-wheel emissions were taken into account, is now adjusted to 74% and 45%, respectively.
Regarding the role of traffic activity, it seems to shape the total LCA footprint of BEVs equally with the manufacturing part in Thessaloniki, while manufacturing dominates the impacts in Zurich with traffic activity contribution being minimal for reasons already explained having to do with the electricity mix. In ICEVs, traffic activity seems quite more important than manufacturing.

4. Conclusions

This paper recognizes fleet LCA as a key method for environmental impact assessment in the electrified era of road transport but highlights that traffic activity dynamics are commonly underrepresented in existing LCA literature. To address this gap, it proposes a new computational concept for integrating traffic dynamics into fleet LCAs in an efficient and adaptive way, moving beyond traditional traffic simulations that may pose barriers for LCA practitioners to sufficiently cover the traffic activity part in their studies.
The concept, with its adaptive character, can quantify emissions from a given road network, taking into account the variable traffic status in terms of vehicle number and traffic conditions. The concept’s efficient character ensures that these estimations can be provided utilizing only simple tools rather than complex models. So, a powerful and cost-effective approach in estimating environmental footprints is offered, without the need for time- and resource-demanding traffic calculations in the complete network.
This paper on its methodological core proved that the combination of popular macroscopic approaches for estimating traffic performance and vehicular energy consumption/emissions is possible. MFDs can be effectively coupled with the average speed approach, since they produce necessary inputs of speed, congestion status, and vehicle-kilometer activity data for calculating the energy consumption and emissions produced directly from traffic activity. Typical LCA emission factors for energy production and manufacturing, once added to this combination, extended its utility in producing broader lifecycle environmental evaluations.
This concept can be applied in LCA environmental studies for road transport, particularly those aimed at exploring fleet-level policy implications. By integrating traffic activity, it captures detailed traffic phenomena that drive regional variations in life cycle impacts. This enables countries and cities to perform more granular and transparent evaluations, considering traffic activity alongside other footprint influencing factors such as powertrain composition and climatic conditions. Consequently, the effects of operational measures—such as traffic management and optimization—on the energy and emission footprint of modern fleets can be more precisely quantified, and so broader policy interventions, including fleet modernization and shifts in the electricity mix, can be jointly assessed with traffic-related strategies.
A theoretical demonstration of the method was conducted for two typical European cities (Zurich and Thessaloniki), in part of their urban network, and revealed that traffic streams of BEVs are more environmentally friendly than ICEVs when climate-change-related impacts are examined. The CO2 footprint of each fleet type is significantly shaped by the traffic status of the network, but the final gap between BEVs and ICEVs increases (or decreases) depending on the energy mix in electricity generation and the vehicle manufacturing. Overall, these results indicate that countries can substitute ICEVs with BEVs to reduce CO2 impacts. However, countries with an intensive electricity mix still have the option to improve traffic conditions in their cities for further reducing CO2. Countries with a decarbonized electricity mix could look at more strategic policy options, such as promoting vehicles with a low manufacturing footprint to achieve net zero impacts.
Future research can extend the method to assess the impact of specific measures or to develop an analysis framework that accounts for actual fleet compositions for energy and emission inventory purposes. Future research could also include a comprehensive uncertainty analysis considering traffic phenomena, lifecycle data, and fleet composition to further assess the robustness of the results and account for potential variability in the input data.

Author Contributions

Conceptualization, S.M., Z.S. and L.N.; methodology, S.M., Z.S. and L.N.; resources, L.N.; data curation, S.M.; writing—original draft preparation, S.M.; writing—review and editing, S.M., Z.S. and L.N.; visualization, S.M.; supervision, L.N. and Z.S.; project administration, L.N.; funding acquisition, S.M. All authors have read and agreed to the published version of the manuscript.

Funding

This research was supported by the Hellenic Foundation for Research and Innovation (HFRI) under the HFRI PhD Fellowship grants (Fellowship Number: 1041).

Data Availability Statement

The original contributions presented in this study are included in the article. Further inquiries can be directed to the corresponding author.

Acknowledgments

This article is a revised and expanded version of a paper entitled “Expected changes in the energy performance of traffic flows as penetrated by electrified vehicles”, which was presented at Transport Research Arena, Lisbon, Portugal, 14–17 November 2022. The traffic data for Zurich has been extracted by the publication of Loder et al. 2019 [40] (doi:10.1038/s41598-019-51539-5), also associated with the data source UTD19 (https://utd19.ethz.ch/, accessed on 23 April 2025). The authors would like to thank Georgios Fontaras for his kind provision of comments and remarks on the manuscript.

Conflicts of Interest

The authors declare no conflict of interest.

References

  1. Colvile, R.N.; Hutchinson, E.J.; Mindell, J.S.; Warren, R.F. The transport sector as a source of air pollution. Atmos. Environ. 2001, 35, 1537–1565. [Google Scholar] [CrossRef]
  2. Eggleston, H.S.; Buendia, L.; Miwa, K.; Ngara, T.; Tanabe, K. 2006 IPCC Guidelines for National Greenhouse Gas Inventories; Intergovernmental Panel on Climate Change: Geneva, Switzerland, 2006. [Google Scholar]
  3. EMEP/EEA. Air Pollutant Emission Inventory Guidebook—Technical Guidance to Prepare National Emission Inventories; European Environment Agency: Copenhagen, Denmark, 2019. [Google Scholar]
  4. Frey, H.C.; Rouphail, N.M.; Unal, A.; Colyar, J.D. Emissions Reduction Through Better Traffic Management: An Empirical Evaluation Based Upon On-Road Measurements (No. FHWA/NC/2002-001). 2001. Available online: https://trid.trb.org/View/661327 (accessed on 5 May 2025).
  5. Barth, M.; Boriboonsomsin, K. Real-world carbon dioxide impacts of traffic congestion. Transp. Res. Rec. 2008, 2058, 163–171. [Google Scholar] [CrossRef]
  6. Shaheen, S.A.; Lipman, T.E. Reducing greenhouse emissions and fuel consumption: Sustainable approaches for surface transportation. IATSS Res. 2007, 31, 6–20. [Google Scholar] [CrossRef]
  7. Klunder, G.A.; Malone, K.; Mak, J.; Wilmink, I.R.; Schirokoff, A.; Sihvola, N.; Holmén, C.; Berger, A.; de Lange, R.; Roeterdink, W.; et al. Impact of Information and Communication Technologies on Energy Efficiency in Road Transport: Final Report. Commission of European Communities (CEC). EU Publications. 2009. Available online: https://publications.europa.eu/en/publication-detail/-/publication/6b4f8023-5a8a-4b97-8d29-82924574cc97/language-en (accessed on 16 June 2025).
  8. Samaras, C.; Tsokolis, D.; Toffolo, S.; Magra, G.; Ntziachristos, L.; Samaras, Z. Enhancing average speed emission models to account for congestion impacts in traffic network link-based simulations. Transp. Res. Part D Transp. Environ. 2019, 75, 197–210. [Google Scholar] [CrossRef]
  9. Qi, X.; Wu, G.; Boriboonsomsin, K.; Barth, M.J. Data-driven decomposition analysis and estimation of link-level electric vehicle energy consumption under real-world traffic conditions. Transp. Res. Part D Transp. Environ. 2018, 64, 36–52. [Google Scholar] [CrossRef]
  10. Fiori, C.; Arcidiacono, V.; Fontaras, G.; Makridis, M.; Mattas, K.; Marzano, V.; Ciuffo, B. The effect of electrified mobility on the relationship between traffic conditions and energy consumption. Transp. Res. Part D Transp. Environ. 2019, 67, 275–290. [Google Scholar] [CrossRef]
  11. Helmers, E.; Marx, P. Electric cars: Technical characteristics and environmental impacts. Environ. Sci. Eur. 2012, 24, 14. [Google Scholar] [CrossRef]
  12. Smit, R.; Kennedy, D.W. Greenhouse Gas Emissions Performance of Electric and Fossil-Fueled Passenger Vehicles with Uncertainty Estimates Using a Probabilistic Life-Cycle Assessment. Sustainability 2022, 14, 3444. [Google Scholar] [CrossRef]
  13. Koroma, M.S.; Costa, D.; Philippot, M.; Cardellini, G.; Hosen, M.S.; Coosemans, T.; Messagie, M. Life cycle assessment of battery electric vehicles: Implications of future electricity mix and different battery end-of-life management. Sci. Total Environ. 2022, 831, 154859. [Google Scholar] [CrossRef] [PubMed]
  14. Mamarikas, S.; Doulgeris, S.; Samaras, Z.; Ntziachristos, L. Traffic impacts on energy consumption of electric and conventional vehicles. Transp. Res. Part D Transp. Environ. 2022, 105, 103231. [Google Scholar]
  15. Ilgin, M.A.; Gupta, S.M. Environmentally conscious manufacturing and product recovery (ECMPRO): A review of the state of the art. J. Environ. Manag. 2010, 91, 563–591. [Google Scholar] [CrossRef]
  16. Hawkins, T.R.; Singh, B.; Majeau-Bettez, G.; Strømman, A.H. Comparative environmental life cycle assessment of conventional and electric vehicles. J. Ind. Ecol. 2013, 17, 53–64. [Google Scholar] [CrossRef]
  17. De Souza, L.L.P.; Lora, E.E.S.; Palacio, J.C.E.; Rocha, M.H.; Renó, M.L.G.; Venturini, O.J. Comparative environmental life cycle assessment of conventional vehicles with different fuel options, plug-in hybrid and electric vehicles for a sustainable transportation system in Brazil. J. Clean. Prod. 2018, 203, 444–468. [Google Scholar] [CrossRef]
  18. Hill, N.; Amaral, S.; Morgan-Price, S.; Nokes, T.; Bates, J.; Helms, H.; Ziem-Milojevic, S. Determining the Environmental Impacts of Conventional and Alternatively Fuelled Vehicles Through LCA: FINAL Report; Publications Office of the European Union: Luxembourg, 2020. [Google Scholar]
  19. Bieker, G. A Global Comparison of the Life-Cycle Greenhouse Gas Emissions of Combustion Engine and Electric Passenger Cars; International Council on Clean Transportation (ICCT): Washington, DC, USA, 2021. [Google Scholar]
  20. García, A.; Monsalve-Serrano, J.; Martinez-Boggio, S.; Alcaide, R.S. Carbon footprint of battery electric vehicles considering average and marginal electricity mix. Energy 2023, 268, 126691. [Google Scholar] [CrossRef]
  21. Pavlovic, J.; Fontaras, G.; Ktistakis, M.; Anagnostopoulos, K.; Komnos, D.; Ciuffo, B.; Valverde, V. Understanding the origins and variability of the fuel consumption gap: Lessons learned from laboratory tests and a real-driving campaign. Environ. Sci. Eur. 2020, 32, 53. [Google Scholar] [CrossRef]
  22. Field, F.; Kirchain, R.; Clark, J. Life-cycle assessment and temporal distributions of emissions: Developing a fleet-based analysis. J. Ind. Ecol. 2000, 4, 71–91. [Google Scholar] [CrossRef]
  23. Garcia, R.; Freire, F. A review of fleet-based life-cycle approaches focusing on energy and environmental impacts of vehicles. Renew. Sustain. Energy Rev. 2017, 79, 935–945. [Google Scholar]
  24. Shui, B.; Luo, X.; Huang, G. Greenhouse gas emissions benefits of the lightweight vehicle fleet in China: A dynamic fleet perspective. Resour. Conserv. Recycl. 2024, 205, 107544. [Google Scholar] [CrossRef]
  25. Davies, B.; Llamas-Orozco, J.A.; Meng, F.; Posen, I.D.; MacLean, H.L.; Abdul-Manan, A.F.; McKechnie, J. Future material demand and greenhouse gas emissions implications for electrification of the UK light-duty vehicle fleet. RSC Sustain. 2024, 2, 2275–2288. [Google Scholar] [CrossRef]
  26. Patella, S.M.; Scrucca, F.; Asdrubali, F.; Carrese, S. Traffic simulation-based approach for a cradle-to-grave greenhouse gases emission model. Sustainability 2019, 11, 4328. [Google Scholar]
  27. Patella, S.M.; Scrucca, F.; Asdrubali, F.; Carrese, S. Carbon Footprint of autonomous vehicles at the urban mobility system level: A traffic simulation-based approach. Transp. Res. Part D Transp. Environ. 2019, 74, 189–200. [Google Scholar] [CrossRef]
  28. Göhlich, D.; Nagel, K.; Syré, A.M.; Grahle, A.; Martins-Turner, K.; Ewert, R.; Jefferies, D. Integrated approach for the assessment of strategies for the decarbonization of urban traffic. Sustainability 2001, 13, 839. [Google Scholar] [CrossRef]
  29. Barmpounakis, E.; Montesinos-Ferrer, M.; Gonzales, E.J.; Geroliminis, N. Empirical investigation of the emission-macroscopic fundamental diagram. Transp. Res. Part D Transp. Environ. 2021, 101, 103090. [Google Scholar] [CrossRef]
  30. Mamarikas, S.; Ntziachristos, L. Expected changes in the energy performance of traffic flows as penetrated by electrified vehicles. In Proceedings of the Transport Research Arena Conference Published by Transportation Research Procedia 2022, Transport Research Arena, Lisbon, Portugal, 14–17 November 2022; Volume 72, pp. 2355–2361. [Google Scholar]
  31. Batista, S.F.A.; Tilg, G.; Menéndez, M. Exploring the potential of aggregated traffic models for estimating network-wide emissions. Transp. Res. Part D Transp. Environ. 2022, 109, 103354. [Google Scholar] [CrossRef]
  32. Wang, Y.; Lv, C.; Nie, Q.; Liu, H. Analyzing the Impact of Road Accidents on Carbon Dioxide Emissions in Freeway Traffic: A Simulation and Statistical Modeling Approach. Sustainability 2024, 16, 2168. [Google Scholar] [CrossRef]
  33. Cifuentes, F.; González, C.M.; Trejos, E.M.; López, L.D.; Sandoval, F.J.; Cuellar, O.A.; Aristizábal, B.H. Comparison of top-down and bottom-up road transport emissions through high-resolution air quality modeling in a city of complex orography. Atmosphere 2021, 12, 1372. [Google Scholar] [CrossRef]
  34. Yang, Z.; Zhang, Q.; Chang, W.; Xiao, P.; Li, M. EGFormer: An enhanced transformer model with efficient attention mechanism for traffic flow forecasting. Vehicles 2024, 6, 120–139. [Google Scholar] [CrossRef]
  35. Stamos, I.; Maria, J.; Grau, S.; Mitsakis, E.; Mamarikas, S. Macroscopic fundamental diagrams: Simulation findings for Thessaloniki’s road network. Int. J. Traffic Transp. Eng. 2015, 5, 225–237. [Google Scholar] [CrossRef]
  36. Wang, M.; Elgowainy, A.; Lee, U.; Baek, K.H.; Balchandani, S.; Benavides, P.T.; Zhang, J. Summary of Expansions and Updates in R&D GREET (No. ANL/ESIA-23/10); Argonne National Laboratory (ANL): Argonne, IL, USA, 2023. [Google Scholar]
  37. Geroliminis, N.; Daganzo, C.F. Existence of urban-scale macroscopic fundamental diagrams: Some experimental findings. Transp. Res. Part B Methodol. 2008, 42, 759–770. [Google Scholar] [CrossRef]
  38. Ntziachristos, L.; Gkatzoflias, D.; Kouridis, C.; Samaras, Z. COPERT: A European road transport emission inventory model. In Information Technologies in Environmental Engineering, Proceedings of the 4th International ICSC Symposium, Thessaloniki, Greece, 28–29 May 2009; Springer: Berlin/Heidelberg, Germany; pp. 491–504.
  39. Ntziachristos, L.; Samaras, Z. Speed-dependent representative emission factors for catalyst passenger cars and influencing parameters. Atmos. Environ. 2000, 34, 4611–4619. [Google Scholar] [CrossRef]
  40. Loder, A.; Ambühl, L.; Menendez, M.; Axhausen, K.W. Understanding traffic capacity of urban networks. Sci. Rep. 2019, 9, 16283. [Google Scholar] [CrossRef] [PubMed]
  41. Landman, R.; Hoogendoorn, S.; Westerman, M.; Hoogendoorn-Lanser, S.; Van Kooten, J. Design and implementation of integrated network management in the Netherlands. In Proceedings of the 89th Annual Meeting of the Transportation Research Board, Washington, DC, USA, 10–14 January 2010. [Google Scholar]
Figure 1. The fleet LCA concept proposed by this paper emphasizes introducing traffic activity dynamics to lifecycle energy consumption and emissions calculations of vehicular fleets.
Energies 18 05075 g001
Figure 2. The methodological combination of tools (MFDs, average speed approach, LCA emission factors) in the fleet LCA concept. Data inputs and outputs per method as well as calculations are being indicated towards estimating the fleet CO2 emissions. Concept adapted from Mamarikas and Ntziachristos [30]. MFDs of Panel I (graphs: (a,b,c)) have been produced using data from the paper of Stamos et al. [35], the average speed approach in Panel II was extracted from Mamarikas et al. [14], and the LCA factors of Panel III came from the GREET model [36].
Energies 18 05075 g002
Figure 3. Absolute (up) and relative (down) daily tank-to-wheel fleet energy consumption profiles for Zurich and Thessaloniki considered traffic areas under the penetration of BEVs and ICEVs.
Energies 18 05075 g003
Figure 4. Absolute (up) and relative (down) daily well-to-wheel CO2 emission profiles of the fleets in Zurich and Thessaloniki traffic areas under the penetration of BEVs and ICEVs.
Energies 18 05075 g004
Figure 5. Absolute (up) and relative (down) daily total LCA CO2 footprint of the fleets in Zurich and Thessaloniki traffic areas under the penetration of BEVs and ICEVs.
Energies 18 05075 g005
Table 1. Traffic variables extracted from MFDs per traffic state for the two case study areas.
Traffic StateVariablesZurichThessaloniki
Very Low TrafficConditionFree FlowFree Flow
Speed27.5 km/h28.5 km/h
Production9000 VKM8555 VKM
Low
Traffic
ConditionNon-CongestedNon-Congested
Speed22.9 km/h23.8 km/h
Production15,000 VKM14,280 VKM
Moderate TrafficConditionNormalNormal
Speed15.4 km/h16.7 km/h
Production16,800 VKM16,749 VKM
Heavy
Traffic
ConditionCongestedCongested
Speed7.2 km/h7.1 km/h
Production15,800 VKM14,282 VKM
Table 2. Energy consumption factors extracted from the average speed approach per traffic state for the two case study areas under BEV and ICEV fleet composition.
Traffic PerformanceEnergy Consumption Factors (Wh/km)
ZurichThessaloniki
Traffic StateConditionFleet Composed of BEVsFleet Composed of ICEVsFleet Composed of BEVsFleet Composed of ICEVs
Very Low
Traffic
Free Flow126.4404.3124.5398.6
Low
Traffic
Non-Congested136.1441.2134.1432.6
Moderate
Traffic
Normal156.1610.8151.0585.4
Heavy
Traffic
Congested220.9976.2222.4986.7
Table 3. Energy sources applied for electricity generation and automotive diesel fuel production in the two case study areas, and relevant LCA emission factors extracted from GREET.
Energy SourcesShare in SwitzerlandShare in GreeceCO2 LCA Factors Switzerland (t/Wh)CO2 LCA Factors Greece (t/Wh)
Coal-14%-1.00 × 10⁻⁶
Natural Gas6%45%4.67 × 10−74.67 × 10−7
Hydro Power61%9%00
Solar Energy4%12%00
Wind Energy-21%-0
Nuclear29%-5.54 × 10⁻⁹-
Sum for Electricity100%100%2.82 × 10−83.45 × 10−7
Automotive Diesel100%100%4.42 × 10−84.42 × 10−8
Table 4. Typical vehicle component masses and LCA-related emission factors for manufacturing extracted from the LCA database of GREET.
Vehicle Components BEVs Masses
(kg)
ICEVs Masses (kg)CO2 LCA Factors
BEVs (t/kg)
CO2 LCA Factors
ICEVs (t/kg)
Powertrain2404000.00260.0028
Vehicle Body-Chassis9009030.00250.0025
Battery30000.0140
Assembly--0.0010.001
Total14401300--
Disclaimer/Publisher’s Note: The statements, opinions and data contained in all publications are solely those of the individual author(s) and contributor(s) and not of MDPI and/or the editor(s). MDPI and/or the editor(s) disclaim responsibility for any injury to people or property resulting from any ideas, methods, instructions or products referred to in the content.