Abstract
It is well known that temperature strongly affects the photovoltaic (PV) performance. Raising the working temperature leads to a significant decrease in PV output of the power capacity, and it also lowers power conversion efficiency. This issue is highly important for the PV systems operating in tropical climate areas such as southern Viet Nam. Developing the cooling methods applied for reducing the PV module temperature might be the solution to this problem and has attracted many researchers and industrial sectors. However, the existing research might not sufficiently address the comparative evaluation of multiple active water-based cooling methods on power conservation efficiency, power output, and cost implications under high-temperature conditions in tropical areas. This study is a case study that aims at conducting some experimental investigations for active water-based cooling methods applied to PV modules in Ho Chi Minh City, South Viet Nam. There are four active water-based cooling methods, including the spraying liquid method (SL), the dripping droplet method (DD), tube heat exchanger method (TE), and the liquid flowing on the PV surface method (LF), that have been developed and experimentally investigated. The voltage, current, temperature, and humidity of the PV cells have been automatically recorded in every one-minute interval via sensors and electronic devices. The experimental results indicate that the surface temperature, the power conversion efficiency, and the output power of PV module are developed toward the useful and positive direction with four cooling methods. In detail, the SL is the best one, in which it leads the PV temperature to reduce from 52 °C to 34–35 °C, the output power increases up to 6.3%, its power conversion efficiency improves up to 2%, while the water flow rate is at its lowest with 0.65 L/min. Similarly, LF also creates results that are similar to SL, but it needs a higher amount of cooling water, which is up to 3.27 L/min. The other methods, like DD and TE, have less power conversion efficiency compared to the SL; it improves only around 1 to 1.3%. These results might be useful for improving the benefits of PV power generation in some tropical regions and contributing to the green energy development in the world.
1. Introduction
Renewable energy, including solar power, wind power, small hydropower, and biomass energy, is being considered the sustainable energy source that needs to be developed in the context of globalizing greenhouse gas emission reduction and 2050 (NZE) Scenario targets [1]. Solar energy, as a highly potential renewable energy source, offers a wide range of applications, particularly in the fields of alternative power generation and environmental protection [2]. Most systems using solar energy directly convert radiation to electricity or thermal energy [3]. Recently, the photovoltaic (PV) solar cell has become widely used for electricity generation due to its high energy power generation efficiency, wide range of power generation capacity, low investment cost, and relatively low pollutant emissions [4]. For instance, at the end of 2024, the global PV solar installations in the world reached 597 GW, which is a 33% increase over the previous year and accounts for 81% of all new renewable energy capacity added worldwide. The target is to reach a total PV solar installed capacity of 7.1 TW by 2030 [5]. Vietnam is a tropical climate country that has high radiation intensity most of the year [6,7] leading to the use of photovoltaic (PV) as high-potential solar energy for power generation. It is estimated that the potential solar power using silicon-based PV cells in Viet Nam might be 963,000 MW, of which 837,400 MW is on the ground, 77,400 MW is on water, and 48,200 MW is on roofs [8]. It is interesting to note that the total photovoltaic (PV) solar power installed capacity was about 19,400 MWp (of which nearly 9300 MWp is rooftop solar power), equivalent to about 16,600 MW, accounting for approximately 76.64% of the total RE power generated [9]. This leads to the fact that Viet Nam has become the top country in Southeast Asia in terms of installed PV solar power capacity [10]. However, the development of PV solar cells is facing some problems, where one of the important impact factors is high operating temperature. The effects of temperature on photovoltaic (PV) cells are significant and influence their performance in various ways [11,12,13,14]. The first one is that output power decreases as temperature increases. This causes the power conversion efficiency of PV cells to generally decrease. The second one is that open-circuit voltage (Voc) drops with rising temperature, which creates the voltage reduction. On the other hand, the short-circuit current (Isc) tends to increase slightly with temperature, but this change is usually small compared to the decrease in voltage [12,13]. As a result, there is a reduction in the overall power conversion efficiency and power output of the PV cell when temperature increases. Results showed that an increase of 1 °C in temperature led to an average decrease of 0.4–0.5% in power output. The last one is that temperature effects also depend on the type of PV material. For example, monocrystalline silicon panels tend to have a more significant voltage drop with temperature compared to thin-film panels, which are often more temperature-cooled and can perform slightly better in high temperatures [14,15]. In terms of modeling and simulation of PV module performance under different temperature, a detailed mathematical model to predict PV output based on temperature data was developed [16,17]. The results also confirmed that temperature significantly impacts both voltage and power output, and the simulation results match with experimental data.
There are some studies focusing on the solutions to mitigate the negative effects of high temperatures on PV operating in which the various cooling strategies and methods applied, as the use of cooling mechanisms or ventilation to reduce operating temperature [18,19,20], selecting the PV technologies with lower temperature coefficients [21], and proper installation to allow airflow behind panels, which helps dissolve heat [22], have been proposed [18,19,20,21,22,23]. Many researchers conducted experiments for the removal of heat from the solar PV panels for improving the efficiency by passive cooling or forced convection cooling, hydraulic cooling, refrigerant cooling, and heat pipes [24]. The first cooling method applied and proposed is passive cooling, which is a cooling mechanism primarily based on natural processes. These approaches include natural ventilation, spraying liquids, dripping droplets, liquid film cooling, and heat exchangers integrated with the PV back surface [25]. In this method, water is considered an agent because it has a lower temperature and higher thermal diffusivity, although in some cases pumps are needed to supply water. Another approach to passive cooling studied by Refaey et al. [23] presented the effectiveness of straight-finned heat sinks in controlling temperature and sustaining the conversion efficiency of concentrator triple-junction solar cells (CPV TJ) even under harsh climatic conditions. These methods are attractive due to their simplicity and low energy demand. However, their cooling effectiveness is strongly influenced by climatic conditions, and water-based systems may lead to significant water consumption. The second method is active cooling or forced convection cooling. It provides better control of temperature, enabling the reduction of the PV surface temperature quickly and significantly. Active cooling approaches, such as forced air cooling, forced water cooling, heat pipes, or hybrid PV/T systems, can achieve higher cooling efficiency but require additional power input, increase system complexity, and raise operational costs [26]. The last one that might be applied is using the thin-film modules or PV materials with lower temperature coefficients. These demonstrate improved thermal stability, but recently they are less commercially widespread, especially in Viet Nam.
It can be seen that in most of the previous studies, the experimental research has been conducted in dry or subtropical regions and has provided valuable insights into cooling performance and efficiency enhancement. However, there are some limitations that need to be cleared. Firstly, most studies emphasize instantaneous cooling effects, while long-term cost–benefit evaluations are limited [27]. Secondly, water management strategies, such as water recovery and recycling, are often neglected [28]. Thirdly, the experimental investigations frequently use small sample sizes, and that leads to a lack of validation at system or regional scales [29]. Fourthly, there are limited studies conducted under tropical monsoon conditions like Ho Chi Minh city, Vietnam, where both high humidity and strong solar radiation coexist. This city is located in the tropical monsoon climate zone, with temperature ranges from 22 °C to 38 °C. The maximum air temperature during the day can reach to 34–36 °C. It is combined with high radiation intensity for many months of the year, causing the surface temperature of PV panels to often exceed the optimal threshold. The distinct climate characteristics of dry and rainy seasons also create favorable conditions for the development and application of solar power generation. The typical hot and humid climate also poses many challenges to the performance and durability of photovoltaic (PV) panels. In addition, despite the growing body of literature on PV cooling, there is a lack of systematic experimental studies in Vietnam, particularly in Ho Chi Minh City, where climatic conditions create distinct challenges for PV performance. Existing articles have not sufficiently addressed the comparative evaluation of multiple active water-based cooling methods, considering both efficiency improvement and cost implications under tropical conditions. Among the solutions for reducing the PV cells surface temperature, active water-based cooling is considered one of the reasonable options. The main mechanism of cooling by water is based on the heat exchange process between water and the PV cell surface. This method has high applicability, easy implementation, and might lead to a quick decrease in the surface temperature of PV and to a significant increase in power conversion efficiency [30,31,32,33,34]. However, to ensure power conversion efficiency and sustainability, the application of water cooling techniques needs to be studied in depth to optimize the system design, save water resources, and be suitable for the specific climate conditions of regions like Vietnam.
Conducting the experimental study applying the active water-based cooling with different methods for the PV modules in Ho Chi Minh City might be necessary to contribute to clearing some of the above-mentioned limitations. There are four active water-based cooling methods, namely spraying liquids (SL), dripping droplets (DD), tube heat exchangers (TE), and liquid flowing on the PV surface (LF), that have been selected for this study. Investigating the impact of each method on the PV module performance indicators (temperature reduction, power output, and conversion efficiency), evaluating the water consumption and cooling equipment cost, and identifying feasible, low-cost, and suitable solutions for rooftop and small-scale PV systems in tropical monsoon regions and then developing a comparison between four methods are the aims of this study. To achieve this goal, the following section describes in detail the experimental setup, the measurement procedures, and the evaluation criteria used to investigate the four cooling methods applied to PV modules in Ho Chi Minh City. With a comparative analysis under real operating conditions, this study might contribute to optimizing water-based active cooling techniques for PV modules in Vietnam and similar climates regions and to supporting sustainable solar power development.
2. Experimental Facilities and Methods
The outdoor experiment was conducted at Nong Lam University, Ho Chi Minh City, Vietnam (10°49′ N, 106°37′ E), where annual solar radiation averages 1581 kWh/m2 with peaks up to 6.3 kWh/m2/day. A single 100 Wp monocrystalline PV module (0.5 m2, Voc = 22.27 V, Vmp = 18.56 V, Imp = 5.38 A) was installed at 11° tilt facing south. The use of one module is recognized as a limitation for generalization to larger PV systems. The experimental diagram and the PV experimental assessment system are set up as shown in Figure 1 and Figure 2, respectively.
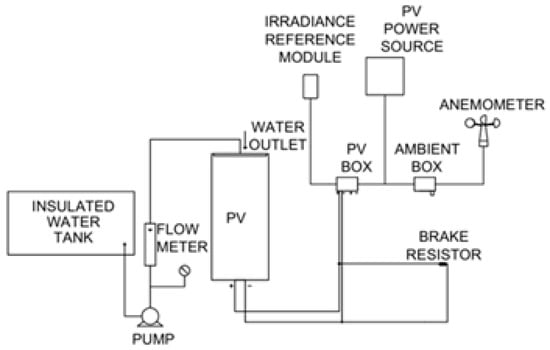
Figure 1.
The experimental diagram.
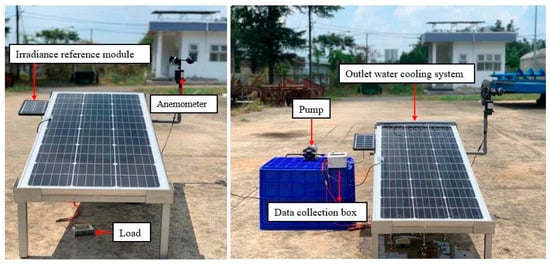
Figure 2.
The PV experimental assessment system.
A monitoring system based on Arduino Mega2560 R3 was developed to record automatically all assessment data during the experimental investigation, such as voltage, current, ambient temperature, air humidity, PV cell surface temperature, and wind velocity. The sensors and devices used in this system, including the integrating DS18B20 (recording the PV surface temperature), SHT30 (recording the ambient temperature and humidity), anemometer (recording the wind speed), INA219 /ACS712 (recording the voltage and current), and a mini solar cell (recording the radiation) with the specifications, are presented in Table 1. The interval time of collecting data was minute-by-minute to ensure high temporal resolution and serve the detailed analysis of the fluctuations of PV system operating parameters under real conditions. Data were recorded every minute and stored via an SD card module.

Table 1.
Specifications of the sensors and devices used in the experiment.
To conduct the experiment and study the impact of temperature in different active cooling methods, there are four water-based cooling methods, such as the spraying liquid method (SL) (Figure 3a), the tube heat exchanger method (TE) (Figure 3b), the dripping droplet method (DD) (Figure 3c), and the liquid flowing on the PV surface method (LF) (Figure 3d), have been applied. Cooling water at 27–30 °C was supplied through pumps and regulated flow. The flow rate of water through the PV surface is regulated through a dimmer to precisely control the cooling process and optimize system performance. Each method was tested for a period of 30 min under comparable radiation, with an auxiliary fan simulating wind effects. Each experiment was repeated at least three times. Baseline (no cooling) conditions were recorded prior to each trial. Data processing included sensor calibration, noise removal, and statistical analysis (average, standard deviation, error estimation) to assess temperature reduction and efficiency improvement.
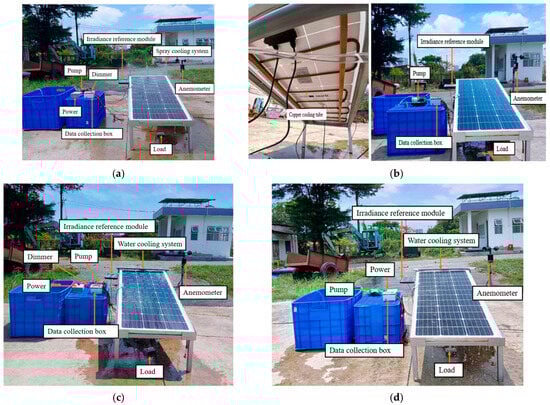
Figure 3.
The experimental investigation system for (a) spraying liquid method (SL), (b) tube heat exchanger method (TE), (c) dripping droplet method (DD), (d) liquid flowing on the PV surface method (LF).
To evaluate the effect of wind speed, from the outside on the cooling process and overall performance of the PV system, a fan system was developed for controlling wind speed to ensure actual wind conditions at the real site.
The power conversion efficiency of PV modules is calculated by the following equation:
where is power conversion efficiency; is the power output; is theoretical power; U is Voltage; I is current; G is the solar radiation; A is size of PV module.
Limitations include the small-scale setup, location-specific climate, and lack of long-term durability and water consumption analysis. Future work should extend to larger PV arrays, long-term testing, and water recycling systems.
3. Results and Discussion
3.1. Testing the Power Conversion Efficiency of the PV Modules
The experiment was conducted to test the power conversion efficiency (called power conversion efficiency) of the PV module in the real conditions, including the solar radiation, ambient temperature, humidity, and wind speed during the testing day presented in Figure 4. The observed solar radiation intensity in Figure 4 shows that it increased from approximately 635 W/m2 to a peak of approximately 973 W/m2 at noon, then gradually decreased to approximately 315 W/m2 at 15:00 p.m. Meanwhile, the ambient temperature fluctuated only between 34 and 37 °C, and the relative humidity decreased from approximately 63% to a low of 52% at noon, then returned to 56% at the end of the recording. The variation in solar radiation resulted in the surface temperature in front and back of the PV also changing. This might create the power conversion efficiency of PV fluctuations as shown in Figure 5.
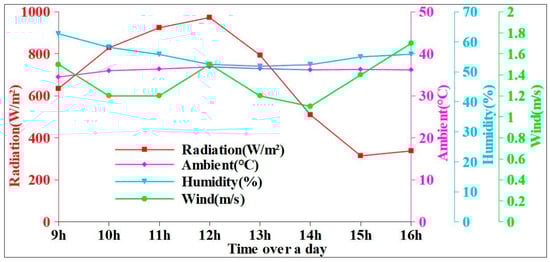
Figure 4.
Solar radiation, ambient temperature, humidity, and wind speed during the testing day on 29 April 2025.
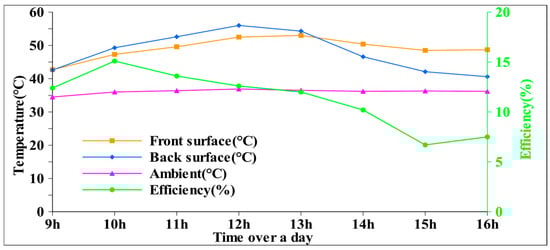
Figure 5.
PV front surface temperature, PV back surface temperature, ambient temperature and power conversion efficiency during the day.
The experimental results from this study reveal a strong inverse relationship between PV surface temperature and power conversion efficiency (PCE). Specifically, the PCE peaked at approximately 15% when the irradiance was 828 W/m2 and the PV module temperature was 47 °C, whereas in the afternoon, when irradiance dropped to 337 W/m2 and the temperature slightly increased to 48.8 °C, the PCE decreased sharply to around 6.7%. This indicates that PV performance is influenced not only by temperature but also directly by irradiance intensity. These findings are in good agreement with previous studies. Mar et al. [11] and Chander et al. [12] both reported that the efficiency of mono-crystalline silicon PV modules decreases significantly with rising operating temperatures. Similarly, Radziemska [14] quantified the power drop per degree Celsius increase, highlighting the thermal sensitivity of crystalline silicon modules. However, our results emphasize that even when the temperature difference is relatively small, a concurrent reduction in irradiance can exacerbate the efficiency decline. This combined effect of irradiance and temperature has also been observed in tropical climates, as documented by Nguyen et al. [24,35] for rooftop PV systems in Vietnam. Furthermore, the maximum efficiency observed in this study (~15%) aligns well with the typical range (10–18%) reported under real-world operating conditions. The sharp reduction to 6.7% under low irradiance conditions underscores the critical importance of maintaining stable and sufficient solar irradiance for sustaining system performance. This result resonates with the findings of Eze et al. [36], who identified irradiance intensity as one of the dominant factors influencing solar energy system efficiency. From an application perspective, our study reinforces the necessity of dual strategies as follows: (i) controlling PV module surface temperature through appropriate passive or active cooling techniques, as suggested by Dwivedi et al. [18], Silverman et al. [21], and more recent cooling investigations and (ii) ensuring stable irradiance conditions by optimizing the installation angle, avoiding shading, and deploying systems in locations with consistent solar resources. Compared with prior works that often analyzed temperature and irradiance independently, the present findings provide clearer experimental evidence of their interactive impact, particularly in tropical conditions where both high temperature and fluctuating irradiance coexist.
3.2. Effect of Surface Temperature on PV Performance Power Conversion Efficiency
Figure 6 presents solar radiation, ambient temperature, humidity, and wind speed in the testing of the cooling effect on the PV performance. In addition, the recorded wind speed tends to be stable and seems to not show a significant impact on the variation in temperature and humidity during the testing period.
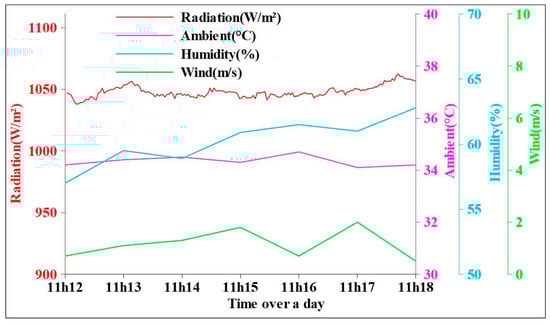
Figure 6.
Solar radiation, ambient temperature, humidity, and wind speed during the cooling testing day on 30 April 2025.
The experimental results presented in Figure 6, Figure 7, Figure 8 and Figure 9 clearly demonstrate the effectiveness of active cooling using cold-water spraying. When the PV surface temperature decreased sharply from 50 °C to 10 °C, the PCE increased from 13.7% to 17.8%. This rapid cooling, achieved within approximately six minutes, dropped the front surface temperature from ~50 °C to 10 °C and the back surface from 53 to 56 °C down to ~23 °C, while the ambient temperature remained constant at 34–35 °C. These findings confirm the substantial role of thermal management in enhancing PV performance. This observation aligns with previous studies [11,14,18,25] that highlighted the strong correlation between temperature reduction and improved efficiency. Our findings are consistent with these conclusions, showing that efficiency gains of ~4% were achievable through surface water spraying. Moreover, the rapid reduction in both front and back surface temperatures is comparable with the results obtained by Raju et al. [20] and Wibowo et al. [31], who demonstrated that water spray cooling could significantly lower PV module surface temperature within a few minutes. The difference in temperature reduction between the front (down to 10 °C) and back (~23 °C) observed in our study also reflects the uneven thermal behavior noted in numerical and experimental modeling studies by Keddouda et al. [16]. Notably, while previous works such as Kaneesamkandi et al. [33] and Rasool & Abdullah [34] explored passive and backside cooling systems, our results provide experimental evidence of a direct surface-spray method under tropical outdoor conditions. This highlights not only the potential of active cooling to restore efficiency closer to nominal values but also the importance of practical implementation strategies. In summary, the present results reinforce the consensus across the literature that cooling is a decisive factor for sustaining PV efficiency under high-temperature outdoor environments. Compared with earlier studies, our findings contribute additional insights by quantifying the magnitude and speed of efficiency recovery when cold-water spray is applied directly to PV surfaces in real tropical conditions.
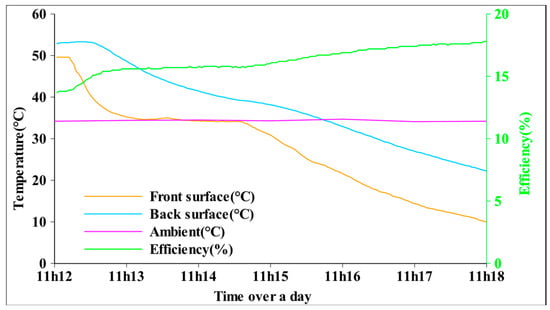
Figure 7.
PV front surface temperature, PV back surface temperature, ambient temperature and power conversion efficiency during the cooling testing day on 30 April 2025.
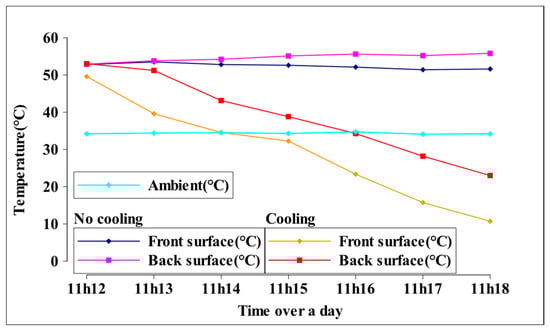
Figure 8.
The temperature of front and back surface PV with and without cooling.
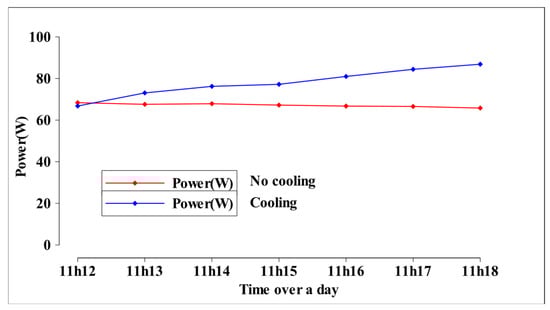
Figure 9.
The generated power of PV with and without cooling.
The experimental investigation results indicate that rapid temperature reduction at the PV panel surface might play an important role in limiting the degradation of energy conversion power conversion efficiency due to thermal effects. This is an important factor for proposing and developing effective cooling solutions in hot and humid tropical climate areas like Ho Chi Minh City, Vietnam.
Figure 10 and Figure 11 illustrate the characteristics of PV performance, such as current-voltage (I–V) and current—power (I–P) curves, under conditions of without and with cooling at different temperature.
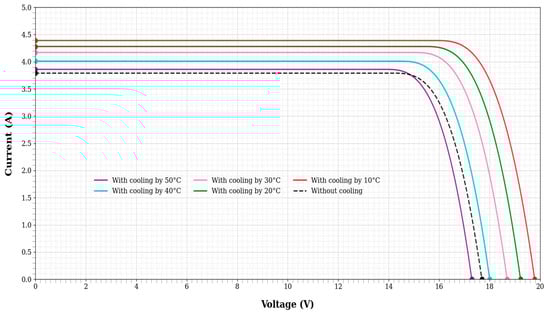
Figure 10.
I–V curve of PV without and with cooling at different temperature.
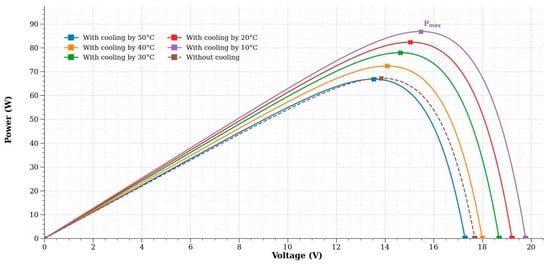
Figure 11.
P–V curve of PV panel without and with cooling at different temperature.
The I–V and P–V curves (Figure 10 and Figure 11) clearly show that cooling significantly enhances PV performance. As the surface temperature decreased from 50 °C to 10 °C, the voltage rose from 17.69 V to 19.78 V and the current from 3.79 A to 4.39 A, shifting the I–V curve to higher operating voltages. Consequently, the maximum power output (Pmax) increased, reaching its highest value at 10 °C. These results align with Radziemska [14] and Zaini et al. [15], who found voltage to be the most temperature-sensitive parameter. Takyi and Nyarko [13] also emphasized that small temperature reductions improve current and voltage simultaneously. Furthermore, our findings are consistent with Mar et al. [11] and Hasan et al. [19], where cooling directly enhanced Pmax. Compared with passive cooling approaches [28,33], active water cooling demonstrates a more immediate and pronounced effect on both efficiency and output power, reinforcing the role of thermal management in optimizing PV performance. The reason might be higher temperatures cause an increase in the cell’s internal resistance, leading to an increase in the circuit resistance. As a result, the velocity of the electron, which directly affects the open circuit voltage, besides badly influencing the cell material and the voltage drop-in. The temperature reliance of the particular material used for PV cell performance indicates the strong dependency of PV power output on the surface temperature of the PV. These results specify that controlling and reducing the PV surface temperature might be a key factor in improving the photoelectric conversion power conversion efficiency, especially in tropical climate conditions such as in Ho Chi Minh City, Vietnam.
3.3. Effect of Cooling Methods on PV Performance
3.3.1. The Effect of Spraying Liquid Method (SL) on PV Performance
The first cooling method to reduce the temperature of PV is spraying liquid method (SL). The outdoor data for this testing are presented in Figure 12.
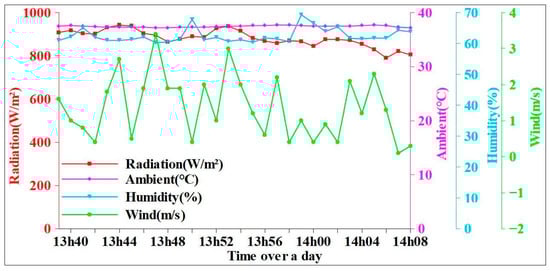
Figure 12.
Solar radiation, ambient temperature, humidity, and wind speed during the testing day (from 13:40 till 14:08).
Figure 13 illustrates the impact of surface liquid (SL) cooling at a flow rate of water of 0.65 L/min. Despite the ambient temperature remaining at 36–37 °C, the PV front and back surface temperatures dropped rapidly from ~50 °C and 48 °C to ~33 °C and 34 °C, respectively. This cooling led to a notable rise in power conversion efficiency, increasing from ~12% to ~15% within a short period. Once stabilized, the PCE remained steady between 14.8% and 15.2%, demonstrating the system’s ability to sustain high efficiency under SL cooling. These results are consistent with studies such as Raju et al. [20] and Wibowo et al. [31], which confirmed that water-based cooling effectively maintains PV modules at lower operating temperatures, thereby enhancing stable long-term efficiency.
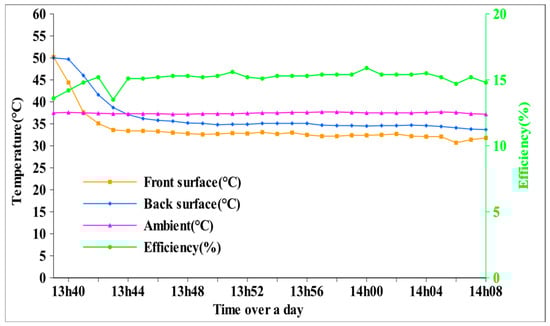
Figure 13.
PV front surface temperature, PV back surface temperature, ambient temperature and power conversion efficiency during the testing day (from 13:40 till 14:08) with water flow rate is 0.65 L/min.
Moreover, the I–V and P–V curves of the PV modules in this case are similar with the curves in Figure 10 and Figure 11. The above results confirm that the SL cooling method is not only effective in cooling PV, surfaces quickly, but also it maintains a high-power conversion efficiency under conditions of high radiation and high ambient temperature.
Figure 14 shows the effect of water flow rate on PV power conversion efficiency (PCE). Five levels were tested (0.45, 0.65, 0.80, 1.00, and 1.20 L/min). The PCE remained around 15% across most flow rates, except at 0.80 L/min, where it dropped to 13.5%. This anomaly is likely due to lower irradiance conditions (~800 W/m2) rather than the cooling effect itself. Thus, the variation in PCE is more strongly correlated with irradiance intensity than with flow rate. Increasing flow rate beyond a certain threshold did not yield additional efficiency gains but helped maintain stable PV surface temperatures. These findings are consistent with Raju et al. [20] and Menacer et al. [28], who noted that flow rate adjustments primarily support thermal stability rather than directly boosting efficiency.
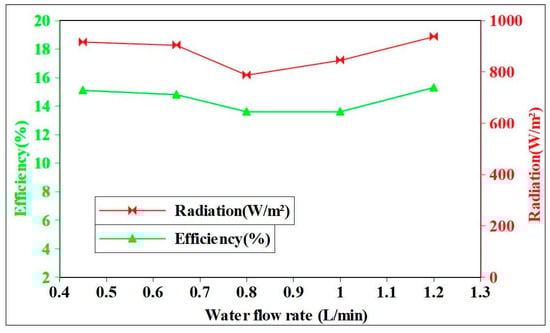
Figure 14.
The power conversion efficiency of PV with different water flow rates.
3.3.2. The Effect of Tube Heat Exchanger Method (TE) on PV Performance
In this experiment, the cooling system removes heat from PV using a copper tube with outer and inner diameter of 8.7 mm and 7.7 mm, respectively. The tube, has a length of 5 m, was fixed to directly contact the back of the PV panel and spread across 18 PV cells to optimize the heat exchange between the cooling system and the PV surface (Figure 3b). The outdoor parameters for this investigation are shown in Figure 15.
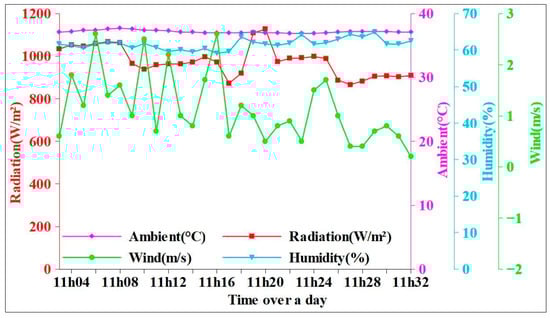
Figure 15.
Solar radiation, ambient temperature, humidity, and wind speed during the testing day (from 11:04 a.m. till 10:32 a.m.) using the TE.
Figure 16 presents the PV performance under the TE cooling method. Compared to the no-cooling condition, the front and back surface temperatures decreased only slightly, by about 2–3 °C on average. Correspondingly, the PCE remained relatively stable in the 13–14% range, except for a brief peak at 14.8% between 11:17 and 11:18 a.m., when the PV surface temperature dropped more noticeably. However, this method required a high flow rate of ~1.8 L/min, equivalent to 54 L in just half an hour, which represents substantial water consumption. Despite this, the improvement in PCE was minimal. The limited performance gain can be attributed to the small contact area between the copper tube and the PV backside, leading to inefficient heat transfer. Similar observations were reported by Hasan et al. [19] and Kaneesamkandi et al. [33], who emphasized that effective thermal exchange depends strongly on surface contact design.
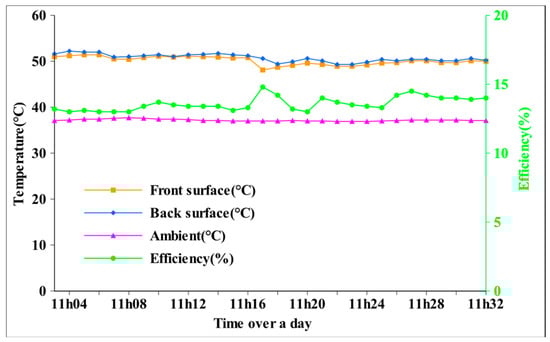
Figure 16.
PV front surface temperature, PV back surface temperature, ambient temperature and power conversion efficiency during the testing day (from 11:04 a.m. till 11:32 a.m.) with TE.
3.3.3. The Effect of Dripping Droplet Method (DD) on PV Performance
Figure 17 shows the outside parameters that the DD was investigated. It can be seen that the ambient temperature and humidity were keeping the constant value during the testing. The results were presented in Figure 18, in which the power conversion efficiency of photovoltaic (PV) panels shows a clear inverse relationship with surface temperature. With the parameters shown in Figure 17, the front surface temperature reaches around 50 °C, leading to the PV power conversion efficiency being only from 12% to 12.5%. However, when the cooling with DD was applied, the surface temperature decreased to around 40 °C and the PV power conversion efficiency rose to 13.5%, and this value remained stable throughout the test period. Therefore, in this cooling method, the PV power conversion efficiency might be improved by around 0.1% with the PV surface temperature decreaseing 1 °C. The disadvantage of this method was it required a continuous supply of a significant amount of water, with one liter per minute. This leads to significantly increased operating costs if applied on a large scale.
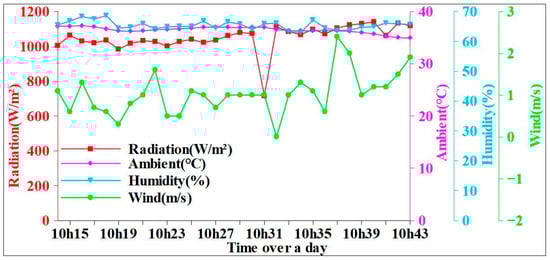
Figure 17.
Solar radiation, ambient temperature, humidity, and wind speed during the testing day (from 10:15 a.m. till 10:43 a.m.) using the DD.
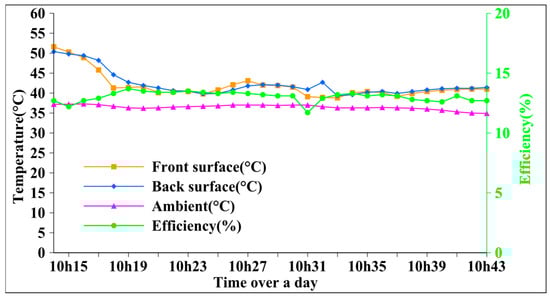
Figure 18.
PV front surface temperature, PV back surface temperature, ambient temperature and power conversion efficiency during the testing day (from 10:15 a.m. till 10:43 a.m.) using the DD.
3.3.4. The Effect of Liquid Flowing on the PV Surface (LF) on PV Performance
The last one of the cooling methods is liquid flowing on the PV surface (LF) was applied. During the entire testing period, the outdoor factors such as wind velocity and relative humidity did not record significant fluctuations, ensuring stable experimental conditions (Figure 19). The solar radiation ranges from 994 to 1179 W/m2, which is in the high radiation region, suitable for evaluating the performance of the PV system (Figure 19). It can be seen that before activating the cooling system, the PV surface temperature on both sides exceeded 50 °C, as shown in Figure 20. However, this temperature quickly decreased significantly to around 35 °C after the LF applied that indicates that both sides of the PV were effectively cooled through the heat exchange process by cooling system (Figure 20). As a result, the PV power conversion efficiency increases from 12.5% to 14%, corresponding to an improvement of nearly 1.5%. This confirms that the LF is effective in controlling the PV surface temperature, thereby improving the power conversion efficiency and stability of the system under high solar radiation and tropical climate conditions.
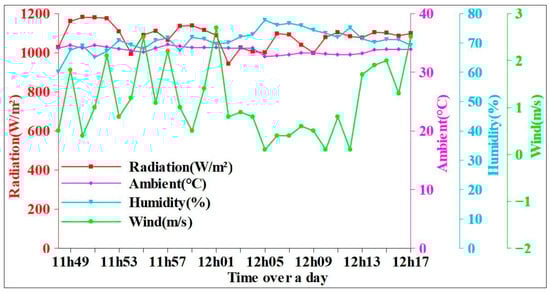
Figure 19.
Solar radiation, ambient temperature, humidity, and wind speed during the testing day (from 11:49 a.m. till 12:17 a.m.) using the LF.
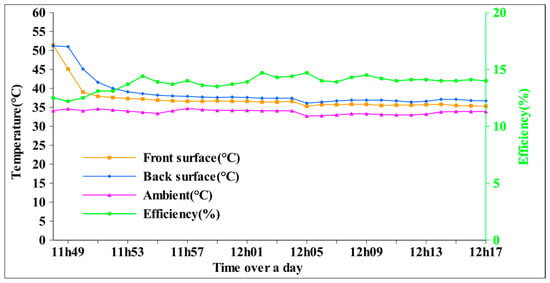
Figure 20.
PV front surface temperature, PV back surface temperature, ambient temperature and power conversion efficiency during the testing day (from 11:49 a.m. till 12:17 a.m.) using the LF.
A key drawback of the LF cooling method is its high water consumption. During a 30 min test, the system required about 98 L of water, corresponding to an average flow rate of 3.27 L/min. Such demand necessitates the use of recovery and recirculation systems to limit operating costs and ensure sustainability. However, this also implies higher initial investments in pumps, piping, filters, and flow control devices with sufficient capacity. As highlighted in studies by Raju et al. [20] and Wibowo et al. [31], water-based cooling can enhance PV efficiency, but technical and economic aspects must be carefully balanced. Therefore, the LF requires comprehensive evaluation to weigh its performance benefits against the financial and resource-related costs.
3.4. Comparing the PV Performance of Four Active Cooling Methods
It is clear that four cooling methods assisted in reducing the PV temperature significantly, which led to an increase in the PV power conversion efficiency. This is a very important factor for PV operating in tropical conditions like Ho Chi Minh City, Vietnam. However, each method creates a different result in terms of power generated and power conversion efficiency. Figure 21 presents the P–V curve of four active water-based cooling methods (SL; LF; DD; and TE) that indicates that the PV maximum power output is highest at the SL and lowest at the TE. This might point out that lower temperature leads to the higher maximum power output.
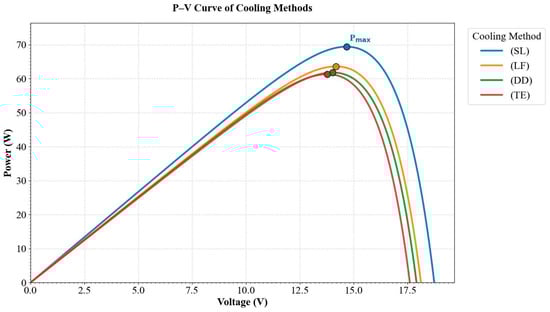
Figure 21.
The P–V curve of four cooling methods (SL; LF; DD; and TE).
Similarly, Figure 22 revealed the PV power conversion efficiency of four cooling methods (SL; LF; DD; and TE) that shows the similar trend with the output power in Figure 21. The high maximum power output leads to the high PV efficiency. SL is the best cooling method for PV operating.
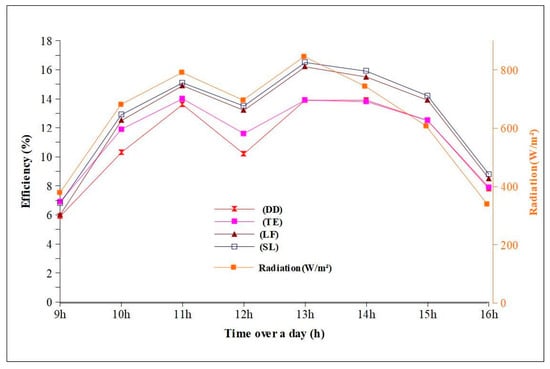
Figure 22.
The P–V power conversion efficiency of four cooling methods (SL; LF; DD; and TE).
The comparison of four active water-based cooling methods in detail is presented in Table 2. It can be seen that the SL is the best one with high PCE and low water supply. Suggesting that developing this method on a large scale, like a PV field, is possible and economical.
Table 2.
Comparative performance of four active water-based cooling methods for photovoltaic modules.
4. Conclusions
This study investigated the effectiveness of four active water-based cooling techniques-spraying liquid method (SL), dripping droplet method (DD), tube heat exchanger method (TE), and liquid flowing on the PV surface method (LF)—on the thermal and electrical performance of photovoltaic (PV) modules under tropical conditions. The results confirmed that the SL provided the most favorable outcomes, reducing the PV surface temperature from 52 °C to 34–35 °C, enhancing power output by up to 6.3%, and improving conversion efficiency by approximately 2% with the lowest water consumption (0.65 L/min). The LF achieved similar cooling and efficiency gains but required a significantly higher water flow rate (3.27 L/min), leading to increased pumping energy and maintenance costs. In contrast, the DD and TE yielded only modest efficiency improvements in the range of 1.0–1.3%.
From a practical perspective, the findings suggest that active cooling strategies such as SL can contribute to improving PV system performance in tropical climates, thereby enhancing both economic returns and system sustainability. However, this work is limited to short-term experiments on a single PV module, without addressing system-level integration, durability of cooling mechanisms over extended operation, or the potential for water recovery and reuse.
Future research should focus on scaling the experiments to larger PV arrays, evaluating long-term operational stability, and integrating water recirculation systems to improve sustainability. In addition, comparative assessments with passive cooling techniques could provide a more comprehensive understanding of the trade-offs between efficiency, cost, and maintenance requirements. Such studies will strengthen the technical and economic feasibility of deploying optimized PV cooling solutions in tropical regions with high solar radiation.
Author Contributions
Conceptualization, N.Q.N. and H.I.B.; methodology, N.Q.N. and H.B.N.; software, V.L.N.; validation, H.I.B. and N.Q.N.; formal analysis, N.Q.N. and V.L.N.; resources, H.B.N.; writing—original draft preparation, N.Q.N.; writing—review and editing, H.I.B.; visualization, V.L.N.; supervision, N.Q.N. and H.I.B.; project administration, N.Q.N. and H.I.B. All authors have read and agreed to the published version of the manuscript.
Funding
This research was funded by the European Union—NextGenerationEU—through the National Recovery and Resilience Plan of the Republic of Bulgaria under project № BG-RRP-2.013-0001.
Data Availability Statement
The original contributions presented in this study are included in the article. Further inquiries can be directed to the corresponding author.
Acknowledgments
The authors thanks to Nong Lam University Ho Chi Minh City, Vietnam for supporting this study under project CS-CB24-CKCN-01.
Conflicts of Interest
The authors declare no conflicts of interest.
Abbreviations
The following abbreviations are used in this manuscript:
| PV | Photovoltaic |
| SL | Spraying liquid |
| DD | Dripping droplet |
| TE | Tube heat exchanger |
| LF | Liquid flowing |
| Voc | Open-circuit voltage |
| Isc | Short-circuit current |
| CPV TJ | Concentrator triple-junction solar cells |
| PCE | Power conversion efficiency |
References
- Sharma, V.K.; Monteleone, G.; Braccio, G.; Anyanwu, C.N.; Aneke, N.N. A Comprehensive Review of Green Energy Technologies: Towards Sustainable Clean Energy Transition and Global Net-Zero Carbon Emissions. Processes 2025, 13, 69. [Google Scholar] [CrossRef]
- Liu, Z. Chapter 6-Innovation in Global Energy Interconnection Technologies. In Global Energy Interconnection; Liu, Z., Ed.; Academic Press: Cambridge, MA, USA, 2015; pp. 239–272. [Google Scholar] [CrossRef]
- Ju, X.; Xu, C.; Hu, Y.; Han, X.; Wei, G.; Du, X. A review on the development of photovoltaic/concentrated solar power (PV-CSP) hybrid systems. Sol. Energy Mater. Sol. Cells 2017, 161, 305–327. [Google Scholar] [CrossRef]
- Kapsalis, V.; Maduta, G.; Skandalos, N.; Bhuvad, S.S.; D’Agostino, D.; Yang, R.J.; Udayraj, P.D.; Karamanis, D. Bottom-up energy transition through rooftop PV upscaling: Remaining issues and emerging upgrades towards NZEBs at different climatic conditions. Renew. Sustain. Energy Transit. 2024, 5, 100083. [Google Scholar] [CrossRef]
- Solar Power Europe. Global Market Outlook for Solar Power 2025–2029. Available online: https://www.solarpowereurope.org/insights/outlooks/global-market-outlook-for-solar-power-2025-2029/detail (accessed on 12 May 2025).
- Riva Sanseverino, E.; Le Thi Thuy, H.; Pham, M.-H.; Di Silvestre, M.L.; Nguyen Quang, N.; Favuzza, S. Review of Potential and Actual Penetration of Solar Power in Vietnam. Energies 2020, 13, 2529. [Google Scholar] [CrossRef]
- Phap, V.M.; Huyen, C.T.T.; Tung, N.T.; Thao, N.T.N.; Thanh, D.Q. Study on technical, economic, environmental power conversion efficiency of self-consumption rooftop solar power using lithium-ion battery for households in Vietnam. J. Energy Storage 2024, 99, 113446. [Google Scholar] [CrossRef]
- Do, T.N.; Burke, P.J.; Nguyen, H.N.; Overland, I.; Suryadi, B.; Swandaru, A.; Yurnaidi, Z. Vietnam’s solar and wind power success: Policy implications for the other ASEAN countries. Energy Sustain. Dev. 2021, 65, 1–11. [Google Scholar] [CrossRef]
- Vietnam Electricity Corporation, Overview of National Power Sources in 2023. Available online: https://en.evn.com.vn/d6/news/Overview-of-national-power-sources-in-2023-66-142-4147.aspx (accessed on 22 March 2025).
- Koons, E. Vietnam’s Solar Energy Boom: Lighting Up the Future. Available online: https://energytracker.asia/vietnam-solar-energy-boom/ (accessed on 11 June 2025).
- Mar, S.; Bahich, M.; Bentahar, Y.; Afifi, M.; Barj, E. A Study of the Temperature Influence on Different Parameters of Mono-Crystalline Silicon Photovoltaic Module. J. Power Energy Eng. 2021, 9, 29–42. [Google Scholar] [CrossRef]
- Chander, S.; Purohit, A.; Sharma, A.; Nehra, S.P.; Dhaka, M.S. Impact of temperature on performance of series and parallel connected mono-crystalline silicon solar cells. Energy Rep. 2015, 1, 175–180. [Google Scholar] [CrossRef]
- Takyi, G.; Nyarko, F. Investigation of the Effect of Temperature Coefficients on Mono-Crystalline Silicon PV Module Installed in Kumasi, Ghana. J. Power Energy Eng. 2020, 8, 20–34. [Google Scholar] [CrossRef]
- Radziemska, E. The effect of temperature on the power drop in crystalline silicon solar cells. Renew. Energy 2003, 28, 1–12. [Google Scholar] [CrossRef]
- Zaini, N.H.; Kadir, M.Z.A.; Izadi, M.; Ahmad, N.I.; Radzi, M.A.M.; Azis, N. The effect of temperature on a mono-crystalline solar PV panel. In Proceedings of the 2015 IEEE Conference on Energy Conversion (CENCON), Johor Bahru, Malaysia, 19–20 October 2015; pp. 249–253. [Google Scholar] [CrossRef]
- Keddouda, A.; Ihaddadene, R.; Boukhari, A.; Atia, A.; Arıcı, M.; Lebbihiat, N.; Ihaddadene, N. Experimental and numerical modeling of photovoltaic modules temperature under varying ambient conditions. Energy Convers. Manag. 2024, 312, 118563. [Google Scholar] [CrossRef]
- Khamma, K.; Vajpai, J. Performance Evaluation of Different Models of PV Panel in MATLAB/ Simulink Environment. Appl. Sol. Energy 2022, 58, 86–94. [Google Scholar] [CrossRef]
- Dwivedi, P.; Sudhakar, K.; Soni, A.; Solomin, E.; Kirpichnikova, I. Advanced cooling techniques of P.V. modules: A state of art. Case Stud. Therm. Eng. 2020, 21, 100674. [Google Scholar] [CrossRef]
- Hasan, I.A.; Mohammed, M.J.; Attallah, M. Analytical and experimental performance evaluation of direct flow cooling effect on PV panel. AIP Conf. Proc. 2022, 2415, 020013. [Google Scholar] [CrossRef]
- Raju, M.; Sarma, R.N.; Suryan, A.; Nair, P.P.; Nižetić, S. Investigation of optimal water utilization for water spray cooled photovoltaic panel: A three-dimensional computational study. Sustain. Energy Technol. Assess. 2022, 51, 101975. [Google Scholar] [CrossRef]
- Silverman, T.J.; Deceglie, M.; Subedi, I.; Show, S.; Repins, I. Reducing Operating Temperature in Photovoltaic Modules. IEEE J. Photovolt. 2018, 8, 532–540. [Google Scholar] [CrossRef]
- Zhang, G.; Misaran, M.S.; Adzrie, M.; Amaludin, N.A.; Guramun, S. Research on the Passive Cooling System of Solar Photovoltaic Panel Based on Hybrid Solar Chimney and Ventilator. J. Phys. Conf. Ser. 2023, 2655, 012016. [Google Scholar] [CrossRef]
- Refaey, H.A.; Abdelrahman, M.A.; Alharthi, M.A.; Bendoukha, S.; Khan, S.G.; Emam, M. Passive cooling of highly-concentrator triple-junction solar cell using a straight-finned heat sink: An experimental investigation. Case Stud. Therm. Eng. 2022, 40, 102521. [Google Scholar] [CrossRef]
- Nguyen, D.T.; Le, T.H.; Pham, V.H. Long-term performance of rooftop grid-connected photovoltaic systems in central Viet Nam. Int. J. Renew. Energy Dev. 2023, 12, 629–639. [Google Scholar] [CrossRef]
- Sharaf, M.; Yousef, M.S.; Huzayyin, A.S. Review of cooling techniques used to enhance the efficiency of photovoltaic power systems. Environ. Sci. Pollut. Res. 2022, 29, 26131–26159. [Google Scholar] [CrossRef]
- Zondag, H.A. Flat-plate PV–Thermal collectors and systems: A review. Renew. Sustain. Energy Rev. 2008, 12, 891–959. [Google Scholar] [CrossRef]
- Koondhar, M.A.; Albasha, L.; Mahariq, I.; Graba, B.B.; Touti, E. Reviewing floating photovoltaic (FPV) technology for solar energy generation. Energy Strategy Rev. 2024, 54, 101449. [Google Scholar] [CrossRef]
- Menacer, B.; Baghdous, N.E.H.; Narayan, S.; Al-lehaibi, M.; Osorio, L.; Tuninetti, V. Efficiency Enhancement of Photovoltaic Panels via Air, Water, and Porous Media Cooling Methods: Thermal–Electrical Modeling. Sustainability 2025, 17, 6559. [Google Scholar] [CrossRef]
- Sornek, K. Experimental investigation of direct water cooling and cleaning of photovoltaic modules. Energies 2024, 17, 4392. [Google Scholar] [CrossRef]
- Mostakim, K.; Akbar, M.R.; Islam, M.A.; Islam, M.K. Integrated photovoltaic-thermal system utilizing front surface water cooling technique: An experimental performance response. Heliyon 2024, 10, e25300. [Google Scholar] [CrossRef]
- Wibowo, S.; Arifin, Z.; Rachmanto, R.A.; Himawanto, D.A.; Prasetyo, S.D. Optimization of Photovoltaic Performance Using a Water Spray Cooling System with Different Nozzle Types. Int. J. Comput. Methods Exp. Meas. 2024, 12, 9–19. [Google Scholar] [CrossRef]
- Nateqi, M.; Rajabi Zargarabadi, M.; Rafee, R. Experimental investigations of spray flow rate and angle in enhancing the performance of PV panels by steady and pulsating water spray system. SN Appl. Sci. 2021, 3, 130. [Google Scholar] [CrossRef]
- Kaneesamkandi, Z.; Almalki, M.J.; Sayeed, A.; Haidar, Z.A. Passive Cooling of PV Modules Using Heat Pipe Thermosiphon with Acetone: Experimental and Theoretical Study. Appl. Sci. 2023, 13, 1457. [Google Scholar] [CrossRef]
- Rasool, I.N.; Abdullah, R.S. Experimental Study of PV Panel Performance Using Backside Water Cooling Chamber. Int. J. Energy Prod. Manag. 2023, 8, 89–95. [Google Scholar] [CrossRef]
- Ngo, X.C.; Do, N.Y. A comparative study on the performance of rooftop grid-connected photovoltaic systems under tropical monsoon climate in Vietnam. AIP Conf. Proc. 2022, 2534, 020005. [Google Scholar] [CrossRef]
- Eze, V.H.U.; Richard, K.; Ukagwu, K.J.; Okafor, W. Factors Influencing the Power conversion efficiency of Solar Energy Systems. J. Eng. Technol. Appl. Sci. 2024, 6, 119–131. [Google Scholar] [CrossRef]
Disclaimer/Publisher’s Note: The statements, opinions and data contained in all publications are solely those of the individual author(s) and contributor(s) and not of MDPI and/or the editor(s). MDPI and/or the editor(s) disclaim responsibility for any injury to people or property resulting from any ideas, methods, instructions or products referred to in the content. |
© 2025 by the authors. Licensee MDPI, Basel, Switzerland. This article is an open access article distributed under the terms and conditions of the Creative Commons Attribution (CC BY) license (https://creativecommons.org/licenses/by/4.0/).