Article

Experimental Energy and Exergy Performance Evaluation of a Novel Pumpless Rankine Cycle (PRC) Unit Employing Low-Temperature Heat Sources

by
Evangelos Syngounas
*,
John Konstantaras
,
Nikolaos Arapkoules
,
Dimitrios Tsimpoukis
,
Maria K. Koukou
* and
Michail Gr. Vrachopoulos
Energy and Environmental Research Laboratory, Department of Agricultural Development, Agri-Food and Natural Resources Management, National and Kapodistrian University of Athens, 34000 Psachna, Evia, Greece
*
Authors to whom correspondence should be addressed.
Energies 2025, 18(17), 4766; https://doi.org/10.3390/en18174766
Submission received: 15 July 2025 / Revised: 15 August 2025 / Accepted: 3 September 2025 / Published: 8 September 2025
(This article belongs to the Special Issue Advances in Waste Heat Utilization Systems)

Abstract

The current study experimentally investigates the performance of a novel pumpless Rankine cycle (PRC) configuration utilizing low-temperature heat sources. Precisely, a 1 kWe PRC configuration using R245fa refrigerant is tested under different heat source and heat sink temperature levels. The energetic and exergetic performance indexes are calculated using validated simulation models developed in MATLAB incorporating the CoolProp library. The derived efficiency results are compared with the corresponding indexes of a conventional ORC system used as the baseline. The findings show that for a hot water heat source temperature of 90 °C and a cold water heat sink temperature of 10 °C as the working conditions, the time-averaged thermal efficiency maximizes at 4.5%, while the corresponding time-averaged exergy efficiency is calculated at 31%. Additionally, the innovative PRC topology shows higher efficiency rates compared to the conventional ORC solution for all the working scenarios tested. For a heat sink of 40 °C and a heat source of 90 °C, the thermal efficiency and the exergy efficiency calculated for the PRC are 7.7% and 7.5% higher, respectively, than the baseline ORC system, showing improved exploitation potential.

1. Introduction

The ongoing fragility of the energy market emphasizes the importance of establishing global energy security through more efficient and cleaner energy systems [1]. The latter can be achieved through the exploitation of the abundant amount of low-grade thermal energy that is currently being underutilized worldwide [2]. More precisely, although low-temperature renewable sources exhibit significant exploitation potential, there is only a limited spread in the industry of energy systems that employ such heat sources [3]. Organic Rankine cycle (ORC) configurations are characterized as the most mature technology to harvest low-temperature heat sources, such as solar energy, geothermal energy, biomass energy and industrial waste heat [4,5].
Solar thermal energy is probably the easiest renewable source to utilize, and there is a lot of research interest in its coupling with ORC applications for power generation purposes due to their capacity for operation under various source temperatures [6,7]. Several studies have also investigated the employment of low-enthalpy geothermal energy, which is characterized by constant thermal potential throughout the year, in ORC-based topologies for sustainable electricity generation [8,9]. ORC combined heat and power (CHP) systems offer viable solutions when they are integrated with biomass-fired arrangements by providing both electricity and heat, especially for district regions [10,11]. Additionally, the exploitation of large amounts of waste heat that are rejected from various industrial sectors globally using ORC configurations is gaining more scientific attention because of the adaptability of this technology to different source temperatures characterizing each waste heat application [12,13]. However, even though ORC systems have been thoroughly investigated during the last few years, their accompanied relatively low performance rates in combination with their increased investment cost prevent their further adoption in the market [14,15]. In this context, modified ORC topologies have been proposed in recent years to increase the thermal efficiency and achieve higher exploitation rates of the renewable heat sources offered in the corresponding applications [16,17,18].
Among the analyzed alternative ORC topologies, several researchers focus on the substitution of the refrigerant pump by means of thermal compression. The thermal compression concept includes the passive compression of the working medium in the low stage without the need of a pump and therefore could become more efficient than conventional ORC cycles [19]. Additionally, the so-called pumpless Rankine cycle (PRC) system offers compactness and disengagement from pump-related maintenance and repair costs [20,21,22]. Yamada et al. [23] experimentally analyzed a PRC prototype using valves for changing the cold and hot source heat exchangers, achieving a relatively higher generated power portion in comparison to a conventional ORC system. A small-scale PRC driven by low-temperature heat sources tested by Gao et al. [24] under different hot water temperatures of 80 to 95 °C showed maximum energy and exergy efficiency of 2.3% and 12.8%, respectively. Jiang et al. [25] proposed a novel control strategy to PRC operation to achieve improved stability for the output power, leading to thermal efficiency augmentation up to 2.3% for the hot water temperature range. To tackle the inherent problem of the unstable operation of the PRC configurations, Wang et al. [26] introduced a gravity-type modification consisting of two condensers, enhancing the energy performance up to 3.1% for 95 °C hot source temperature. Gkimisis et al. [27] presented an analytical simulation approach of the PRC concept under real dynamic conditions and validated their model with a 1 kWe prototype, achieving a time-averaged thermal efficiency of 4.8%. Further investigation of the optimal liquid level range in the intermediate storage vessels during a pumping cycle was conducted in the study of Zhang et al. [28], in which a 10 kWe PRC prototype was constructed and experimentally tested, showing energy savings of 36.1% compared to the conventional electrically driven pump module. The experimental study of a thermal–gravitational pumping module for evaporation temperatures below 75 °C implemented by Zhu et al. [29] showed maximum shaft power at a 62.4 °C evaporation temperature, with energy and exergy efficiency rates of 3.8% and 24.3%, respectively. Although thermal compression integration in Rankine cycles has been investigated by several researchers, leading mainly to small-scale proof-of-concept experimental approaches, scientific study in this area is still rare.
The current study aims to experimentally evaluate the energy efficiency of a novel 1 kWe PRC unit using R245fa as refrigerant for the utilization of low-temperature heat sources. The developed prototype was tested under real operation conditions in a lab environment to simulate its performance in the corresponding heat source and heat sink temperature ranges employed. As discussed, similar experimental data in the literature are negligible, and there is plenty of room for further study and amelioration of PRC technology. Additionally, a detailed parametric analysis was performed regarding the heat source and heat sink temperature ranges to emphasize the corresponding impact on energy and exergy efficiency for each working scenario. Therefore, the current experimental analysis of the evaluated novel PRC system offers important findings to exploit low-temperature renewable heat sources using the Rankine power generation technology. Another innovative aspect of this research is based on the architecture of the developed prototype in a vertical logic to facilitate the natural circulation of the liquid refrigerant by means of gravity, anticipating improved performance rates due to better exploitation of the liquid’s potential energy for its circulation among the different cycle components.

2. Materials and Methods

2.1. The Examined PRC Configuration

The current study investigates a novel PRC configuration exploiting low-temperature heat to generate renewable power. The examined power generation system employs R245fa as the working media. Several researchers have focused on the impact of the working fluid selection in modified ORC configurations, using HFCs, PCFs and other natural refrigerants as alternatives [28,30]. The results of Kajurek et al.’s study [31] show that although refrigerants such as R717 showed better efficiency, R245fa is considered the best adoption for experimental purposes due to its non-flammable and non-toxic characteristics. Additionally, another important aspect of R245fa lies in the fact that its saturation curve secures the superheated vapor existence after isentropic expansion, ensuring that there are no liquid droplets in the expander outlet affecting its lifetime [27].
The main innovative aspect of the described topology lies in the incorporation of the passive compression concept, which substitutes the refrigerant pump commonly used in the conventional ORC systems. More precisely, as depicted in the simplified flowchart of Figure 1, the examined layout consists of two distinct pressure circuits, namely, the high (Phigh) pressure at the expander inlet and the low (Plow) pressure at the expander outlet. Each circuit is connected to a buffer tank and a heat exchanger arrangement interconnected through a pneumatic valve system.
The high-pressure circuit, connected to the “hot” buffer tank, absorbs the provided heat to compress the working media and feed the expander module. It includes the preheater heat exchanger, which heats the liquid refrigerant up to the saturation point, and the evaporator heat exchanger, in which the superheated vapor refrigerant is produced. The preheater is fed through natural circulation from the down part of the “hot” buffer tank due to the height difference between the two modules. The upper part of the hot buffer is connected to the expander suction with a pressure equalization line. The achieved pressure increment is based on the vapor mass accumulation on the expander inlet. More precisely, the excessive vapor production in the evaporator outlet is higher than the mass flow rate driven through the expander due to the expander inertia in combination with the continuous natural circulation feeding the evaporator and the constant hot water flow charging it with heat.
The low-pressure circuit rejects heat to the ambient air to cool the expander outlet. In the low-pressure circuit, which is connected to the “cold” buffer tank, there is a desuperheater heat exchanger, which extracts the superheated heat from the low-pressure vapor down to the saturation point, and the condenser heat exchanger, in which the latent heat of the refrigerant is rejected to the environment to change its phase from vapor to liquid. The produced liquid refrigerant at the condenser exit is driven by means of gravity to the “cold” buffer tank to be stored. The upper part of the cold buffer is connected to the condenser inlet with a pressure equalization line.
The pneumatic valve system at the top and the bottom of each buffer tank enables them to switch from the high-pressure to the low-pressure circuit and vice versa. The switch of the two buffer tanks takes place after sufficient running time for every working cycle. At the moment of switching, the liquid level of the hot buffer has been reduced to a minimum point, while the liquid level of the cold buffer is high enough to ensure the proper and continuous feeding of the preheater heat exchanger after switching. The switching procedure includes the simultaneous change in open/close status of the four valve pairs: (Va1, Va2), (Va3, Va4), (Vb1, Vb2) and (Vb3, Vb4), as they are shown in Figure 1. The aforementioned switching procedure inherently introduces a relative disruption in the constant refrigerant flow throughout the PRC cycle, which is unlikely in the conventional ORC configuration.
Regarding the incorporated components of the investigated PRC prototype, the expander module is of a scroll type connected to a DC permanent magnet motor used as the generator. The heat exchangers used are of a brazed plate type, and the pneumatic valve system includes refrigerant ball valves driven by pneumatic actuators.
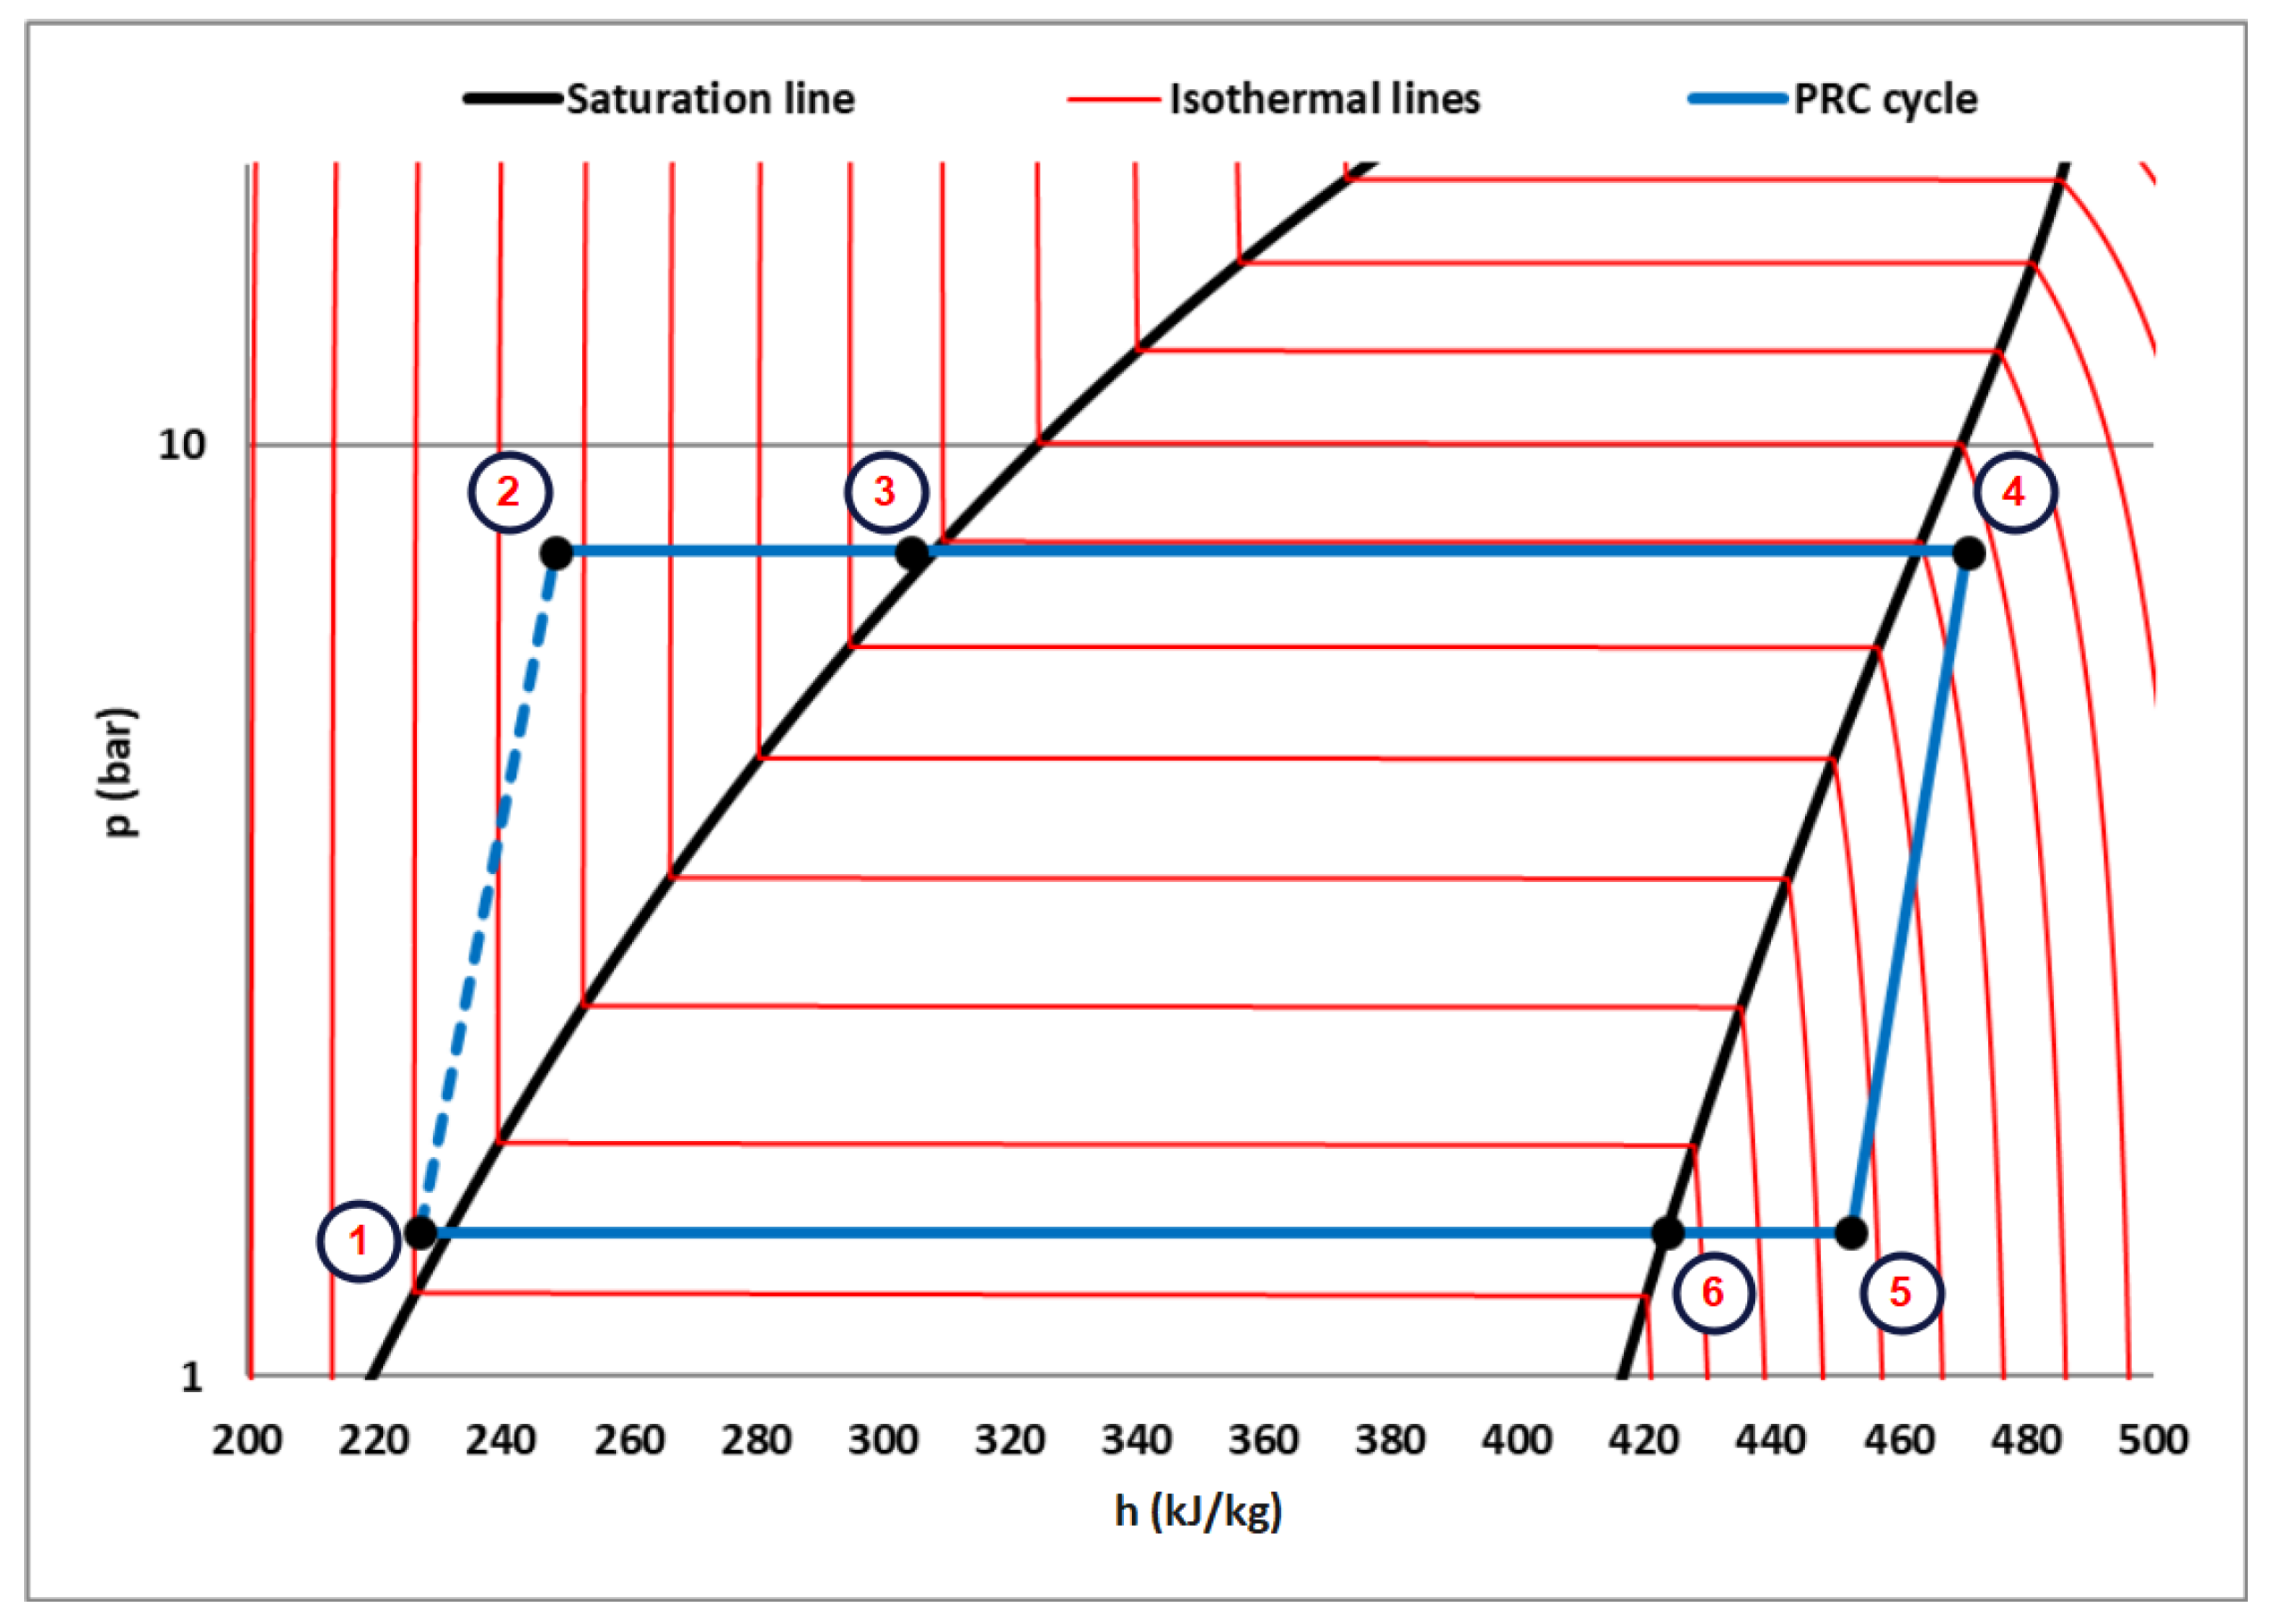
The dynamic behavior of the described thermal cycle has been evaluated using the time-averaged thermodynamic values of each working cycle so as to enable its energy performance investigation. For the case of secondary working fluid temperatures of thwin = 90 °C and tcwin = 10 °C, the working cycle of the investigated topology is presented in the pressure-specific enthalpy and the temperature-specific entropy diagrams of Figure 2 and Figure 3, respectively. The dynamic passive compression procedure cannot be illustrated with fixed points in the thermodynamic diagrams since, in practice, it includes plenty of intermediate transitional states until the equilibrium final state is reached after each switching phase. Therefore, the thermodynamic change from point 1 to point 2, illustrated with dot-lines in the diagrams below, represents the passive compression phenomenon, in which the working refrigerant instantly switches its pressure to the evaporating pressure when the pneumatic valve system simultaneously changes its opening/closing status [23,28].
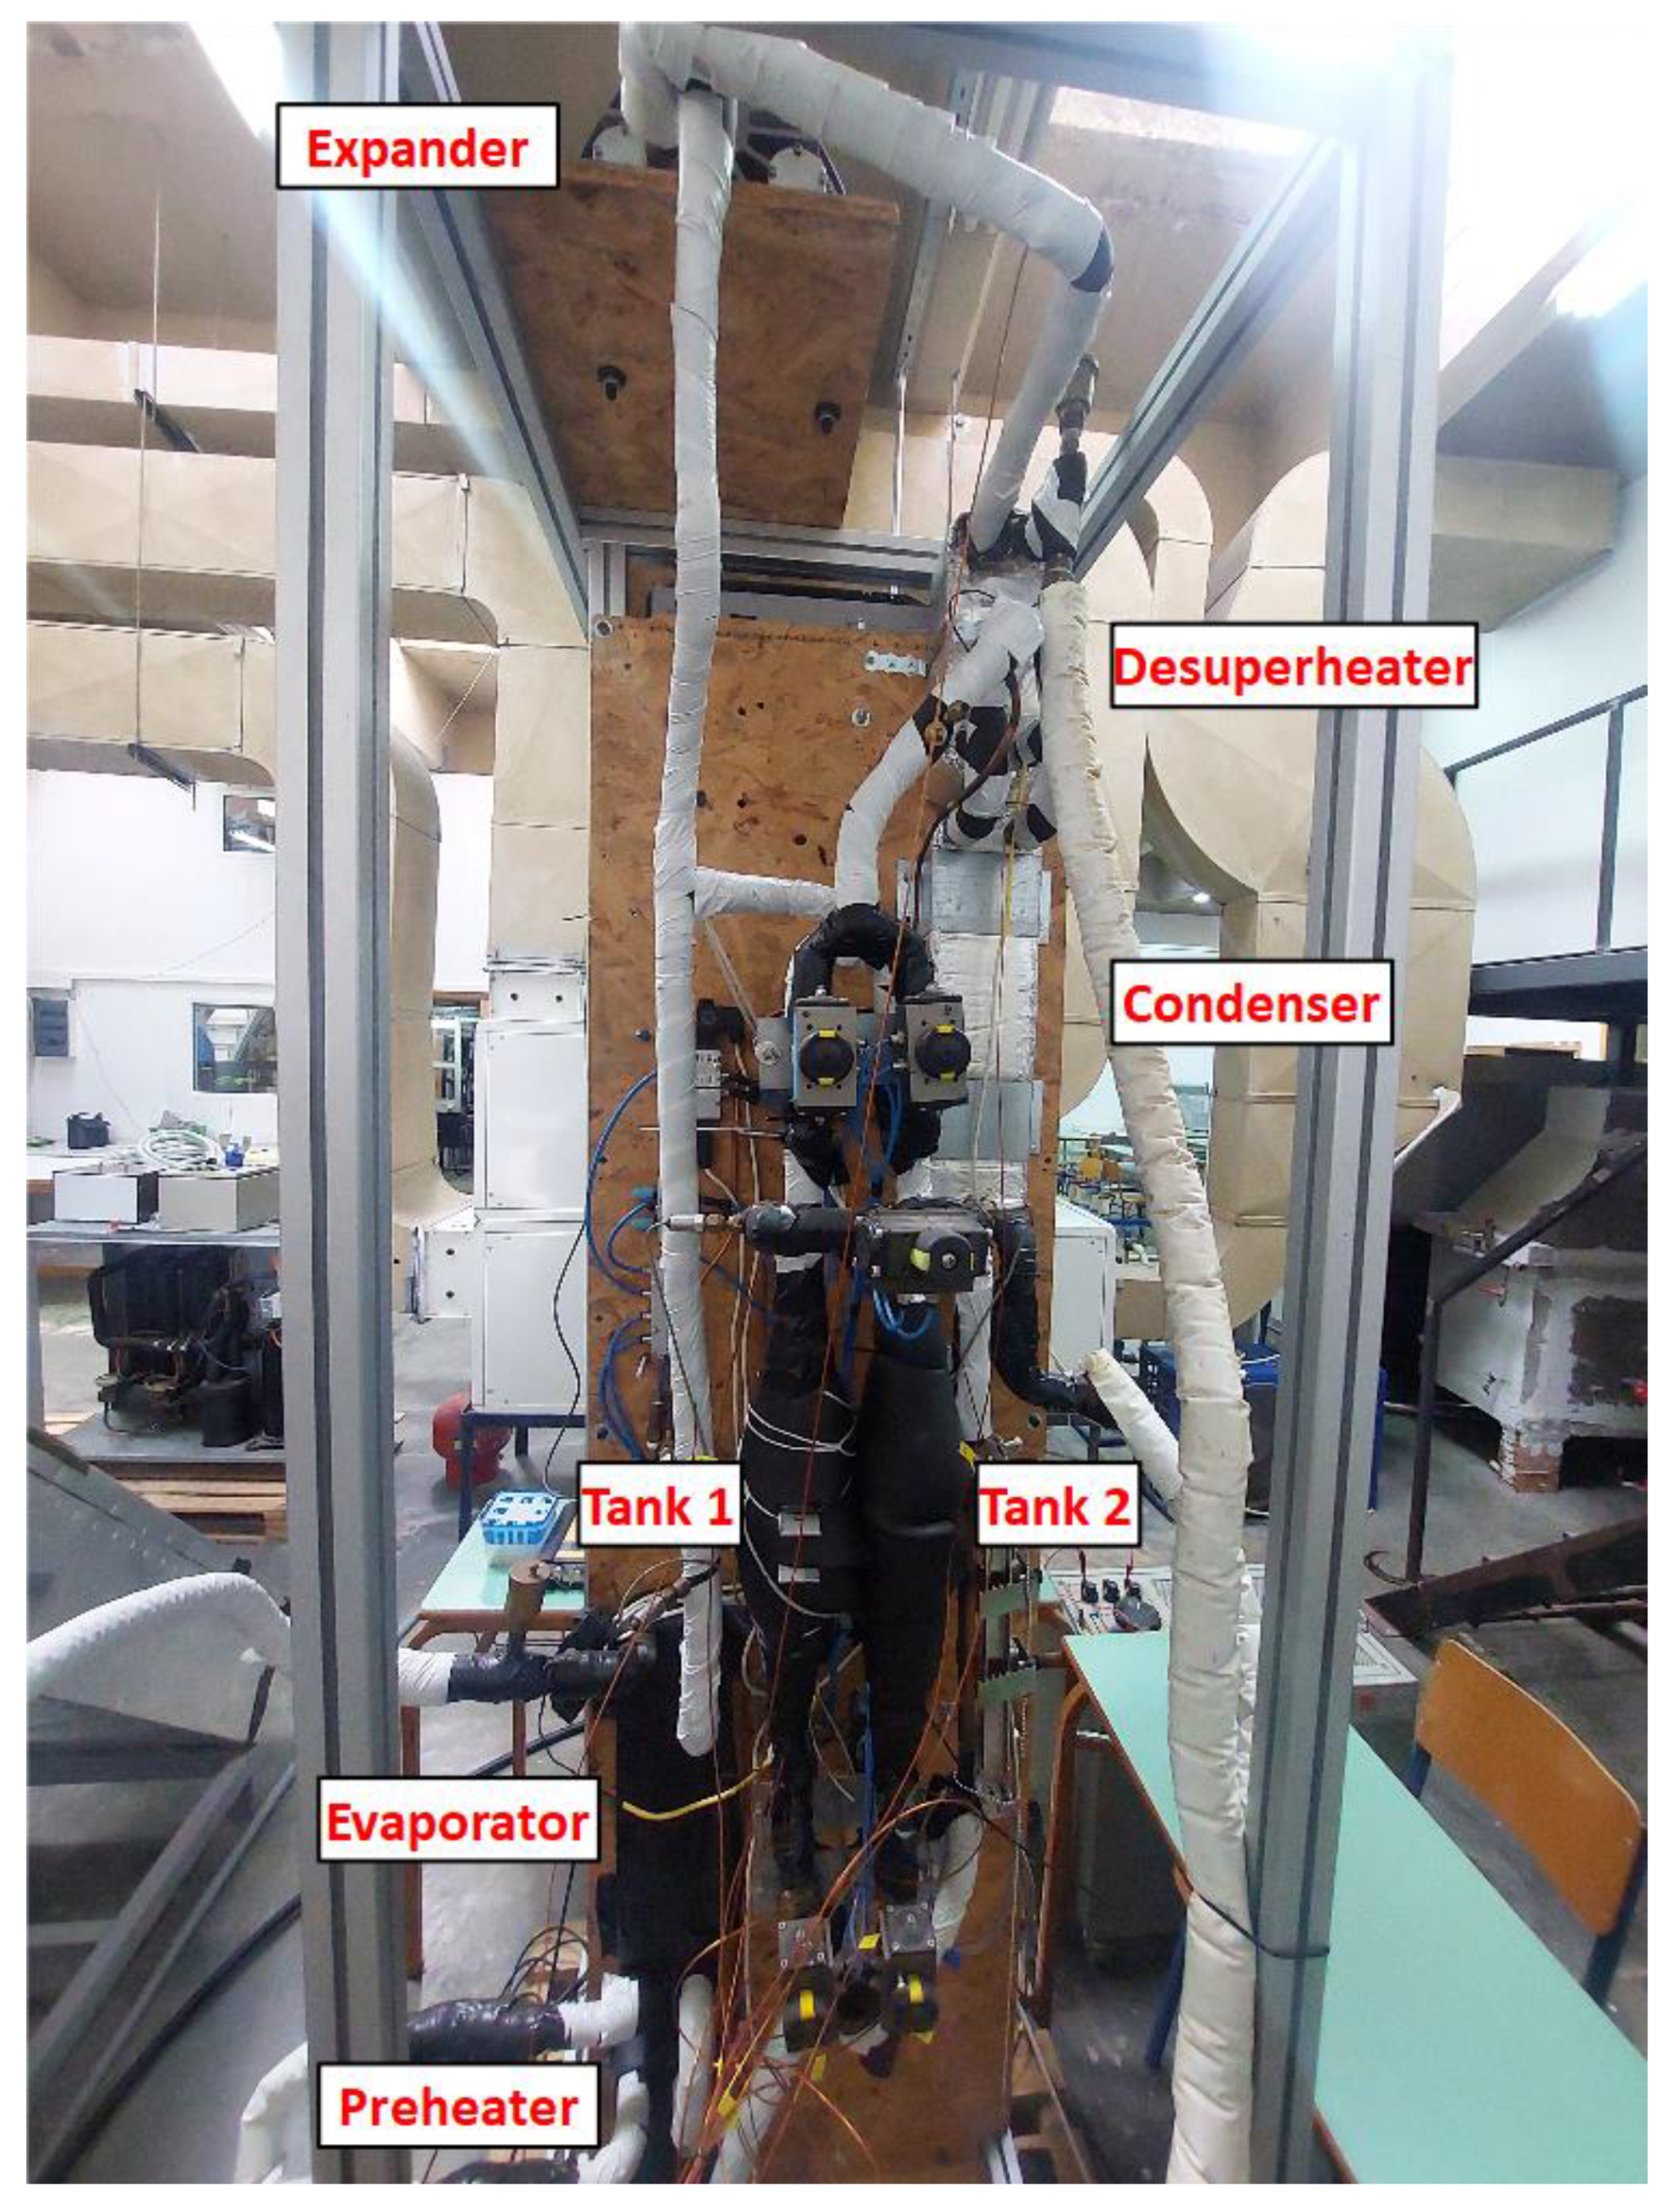
The investigated prototype configuration tested in the experimental procedure of the current study is presented in Figure 4. A view of the pneumatic valves set on the upper part of Tank 2 is given in Figure 5, while the expander arrangement is depicted in Figure 6. The novel prototype constructed by Heliix Inc. (Athens, Greece) is based on a novel PRC unit, patented and commercialized under the name Phaethon™. The dynamic simulation of the aforementioned module has been thoroughly analyzed in the work of Gkimisis et al. [27]. The current prototype investigated consists of a slightly modified architecture based on the vertical arrangement of the cycle components. The latter facilitates the natural circulation of the working fluid among the different components by better exploitation of its gravitational potential energy.

2.2. The Experimental Test Setup

The investigated prototype pumpless PRC configuration has been experimentally evaluated in the test rig of the E2ReLab of the NKUA [32]. The experimental setup is depicted in Figure 7, while the P&ID of the experimental configuration is presented in Figure A1 of Appendix A. The test rig is composed of two 300lt water buffer vessels. The hot buffer vessel is heated by three 12 kWe electric heaters and can operate at a maximum temperature of 95 °C. The cold buffer tank is chilled by a secondary heat transfer fluid passing through the buffer tank in a spiral tube heat exchanger and is chilled by a 12 kWth water chiller. The cold buffer vessel can maintain water temperature as low as 5 °C. The two buffer vessels are used to supply the device under tests with hot and cold water with adjustable temperature and volume flow. The controller of the test setup is composed of a computer running LabVIEW software (Laboratory Virtual Instrument Engineering Workbench), Release: 2024 Q3, and the I/O signals are transmitted to the monitoring and control computer. The control program is developed to maintain the water at the inlet ports of the device under testing (PRC) at a constant temperature set by the user for the different testing scenarios by regulating the three-way valves installed at the adjacent circuits. The flow in the two circuits is regulated by adjusting the speed of the pumps through PWM signals generated by the controller. The data acquisition part of the controller is responsible for the collection of temperature and water flow measurements for the test setup, as well as temperature and refrigerant pressures for the device under testing. The sensor placement for the entire data acquisition system is presented in Table 1.

2.3. The Experimental Procedure

In order to evaluate the performance of the investigated prototype in the experimental test rig, the configuration has been tested under different heat source and heat sink temperatures, as described below:
  • Four different heat source temperature levels (thwin): 60.0, 70.0, 80.0 and 90.0 °C, with a maximum deviation of ±1.0 K. The heat source temperature level was configured by setting the temperature of the secondary fluid (water) at the inlet of the evaporator heat exchanger and fixing the water flow rate to ~8 lpm.
  • Four different heat sink temperature levels (tcwin): 10.0, 20.0, 30.0 and 40.0 °C, with a maximum deviation of ±0.5 K. The heat sink temperature level was configured by setting the temperature of the secondary fluid (water) at the inlet of the condenser heat exchanger and fixing the water flow rate to ~8 lpm.
  • The test runs carried out included 16 different test runs for each pair of the heat source and heat sink temperature levels mentioned above.
All the performed test runs of the pumpless PRC prototype were measured for periods longer than 10 min in order for the system to reach a repeatable stable working pattern for each thermal cycle. The sampling time was every 1 s. The set cycle time was fixed at 70 s.
The uncertainty of the non-measured thermodynamic parameters utilized in the current analysis for the performance evaluation of the examined configuration was determined using Moffat’s uncertainty analysis [33], employing the accuracy of the measuring equipment presented in Table 1.

2.4. Thermodynamic Formulation

The performance investigation of the examined novel PRC configuration was performed using the thermodynamic equations presented in this section. Each thermal cycle is considered a total for the purposes of the current analysis. In this context, the input heat (Qin) that is absorbed by the heat source and the output heat (Qout) that is rejected to the ambient air are calculated as the sum of the measured values of the respective figures for the total duration of each thermal cycle, as shown below:
Q i n = c p h w · m ˙ h w · t h w i n t h w o u t d t Δ t
Q o u t = c p c w · m ˙ c w · t c w o u t t c w i n d t Δ t
The input heat is analyzed in the individual heat fluxes absorbed under the different thermal processes of the preheating, the isochoric compression and the evaporation of the working refrigerant:
Q i n = Q i s . c o m p + Q p r e h + Q e v a p
Q o u t = Q d e s u p + Q c o n d
The heat flux rate in each different component of the system is calculated by the delta of the specific enthalpy in it, multiplied by the refrigerant mass flow rate, as follows:
Q i s . c o m p = m ˙ r · ( h 2 h 1 )
Q p r e h = m ˙ r · ( h 3 h 2 )
Q e v a p = m ˙ r · ( h 4 h 3 )
Q d e s u p = m ˙ r · ( h 5 h 6 )
Q c o n d = m ˙ r · ( h 6 h 1 )
The generated power in the expander module is described as follows:
W e x p = m ˙ r · ( h 4 h 5 )
The energy balance equation in the system is expressed by the following formula:
Q i n = Q o u t + W e x p
The isentropic efficiency of the expander (ηisexp) is calculated as below:
η i s e x p = h e x p i n h e x p o u t h e x p i n h e x p o u t i s
The mechanical efficiency of the expander (ηisexp) is expressed as the fraction of the output power in the generator to the generated power in the expander:
η m e x p = P o u t W e x p
The thermal efficiency (ηth) of the PRC system is calculated using the formula below:
η t h = P o u t Q i n
The input and output exergy rate in the system are expressed, respectively, as follows:
E x i n = Q i n · ( 1 T o T h w a v g )
E x o u t = P o u t
The exergy efficiency (ηex) of the PRC system is linked to the second law of thermodynamics and is expressed as follows:
η e x = E x o u t E x i n

2.5. Followed Methodology

The first step of the current analysis consists of a preliminary assessment of the experimental findings to present the working behavior of the investigated PRC unit. More precisely, for each pair of thwin–tcwin, the experimental results of the pressure variation in the buffer tanks, the temperatures in the different points of the examined cycle and the output power and generation speed are important to demonstrate and clarify the operation of the tested prototype on a thermal cycle range. The analysis continues with the calculation of the thermal energy distribution in the heat exchangers of the system for each working cycle. The absorbed heat in the evaporator and the rejected heat in the condenser modules are split into their separate parts, respectively, to specify the thermal compression portion and to evaluate the design of the unit and the effect of the prototype architecture on its operation.
The next step of the current study includes the evaluation of the expander module of the tested prototype. Using the experimental findings the isentropic and the mechanical efficiency rates are calculated to generate the correlation of the figures above with the working pressure ratio for every working condition. Using the thermodynamic formulation presented, a simulation model was developed in MATLAB (Version: 2024b) using the CoolProp library (Version: 7.0.0.) for the thermophysical properties of the working refrigerant. The derived simulation model was verified using the time-averaged experimental data of the real tested PRC unit. Then, the thermal efficiency and exergy efficiency rates of the system were calculated for each pair of the selected thwin–tcwin.
The final part of the analysis includes the performance comparison of the investigated PRC configuration with a conventional ORC system using the same refrigerant (R245fa). For the performance simulation of the conventional ORC, a simulation model was developed, which was validated with experimental data from the literature. The energetic and exergetic figures of the PRC and the ORC systems were compared for the entire range of the selected heat source and heat sink temperatures, and the maximum deviation of the PRC was derived to show the benefit of the pumpless modification against the conventional topology.
The most important assumptions made in this study are summarized below:
  • The heat transfer between the different devices and their surroundings is negligible;
  • The pressure differences in the gaseous phases of the cycle are considered negligible;
  • The energy analysis was performed under quasi-steady state conditions for each timestep.

3. Results and Discussion

3.1. Preliminary Experimental Results Analysis

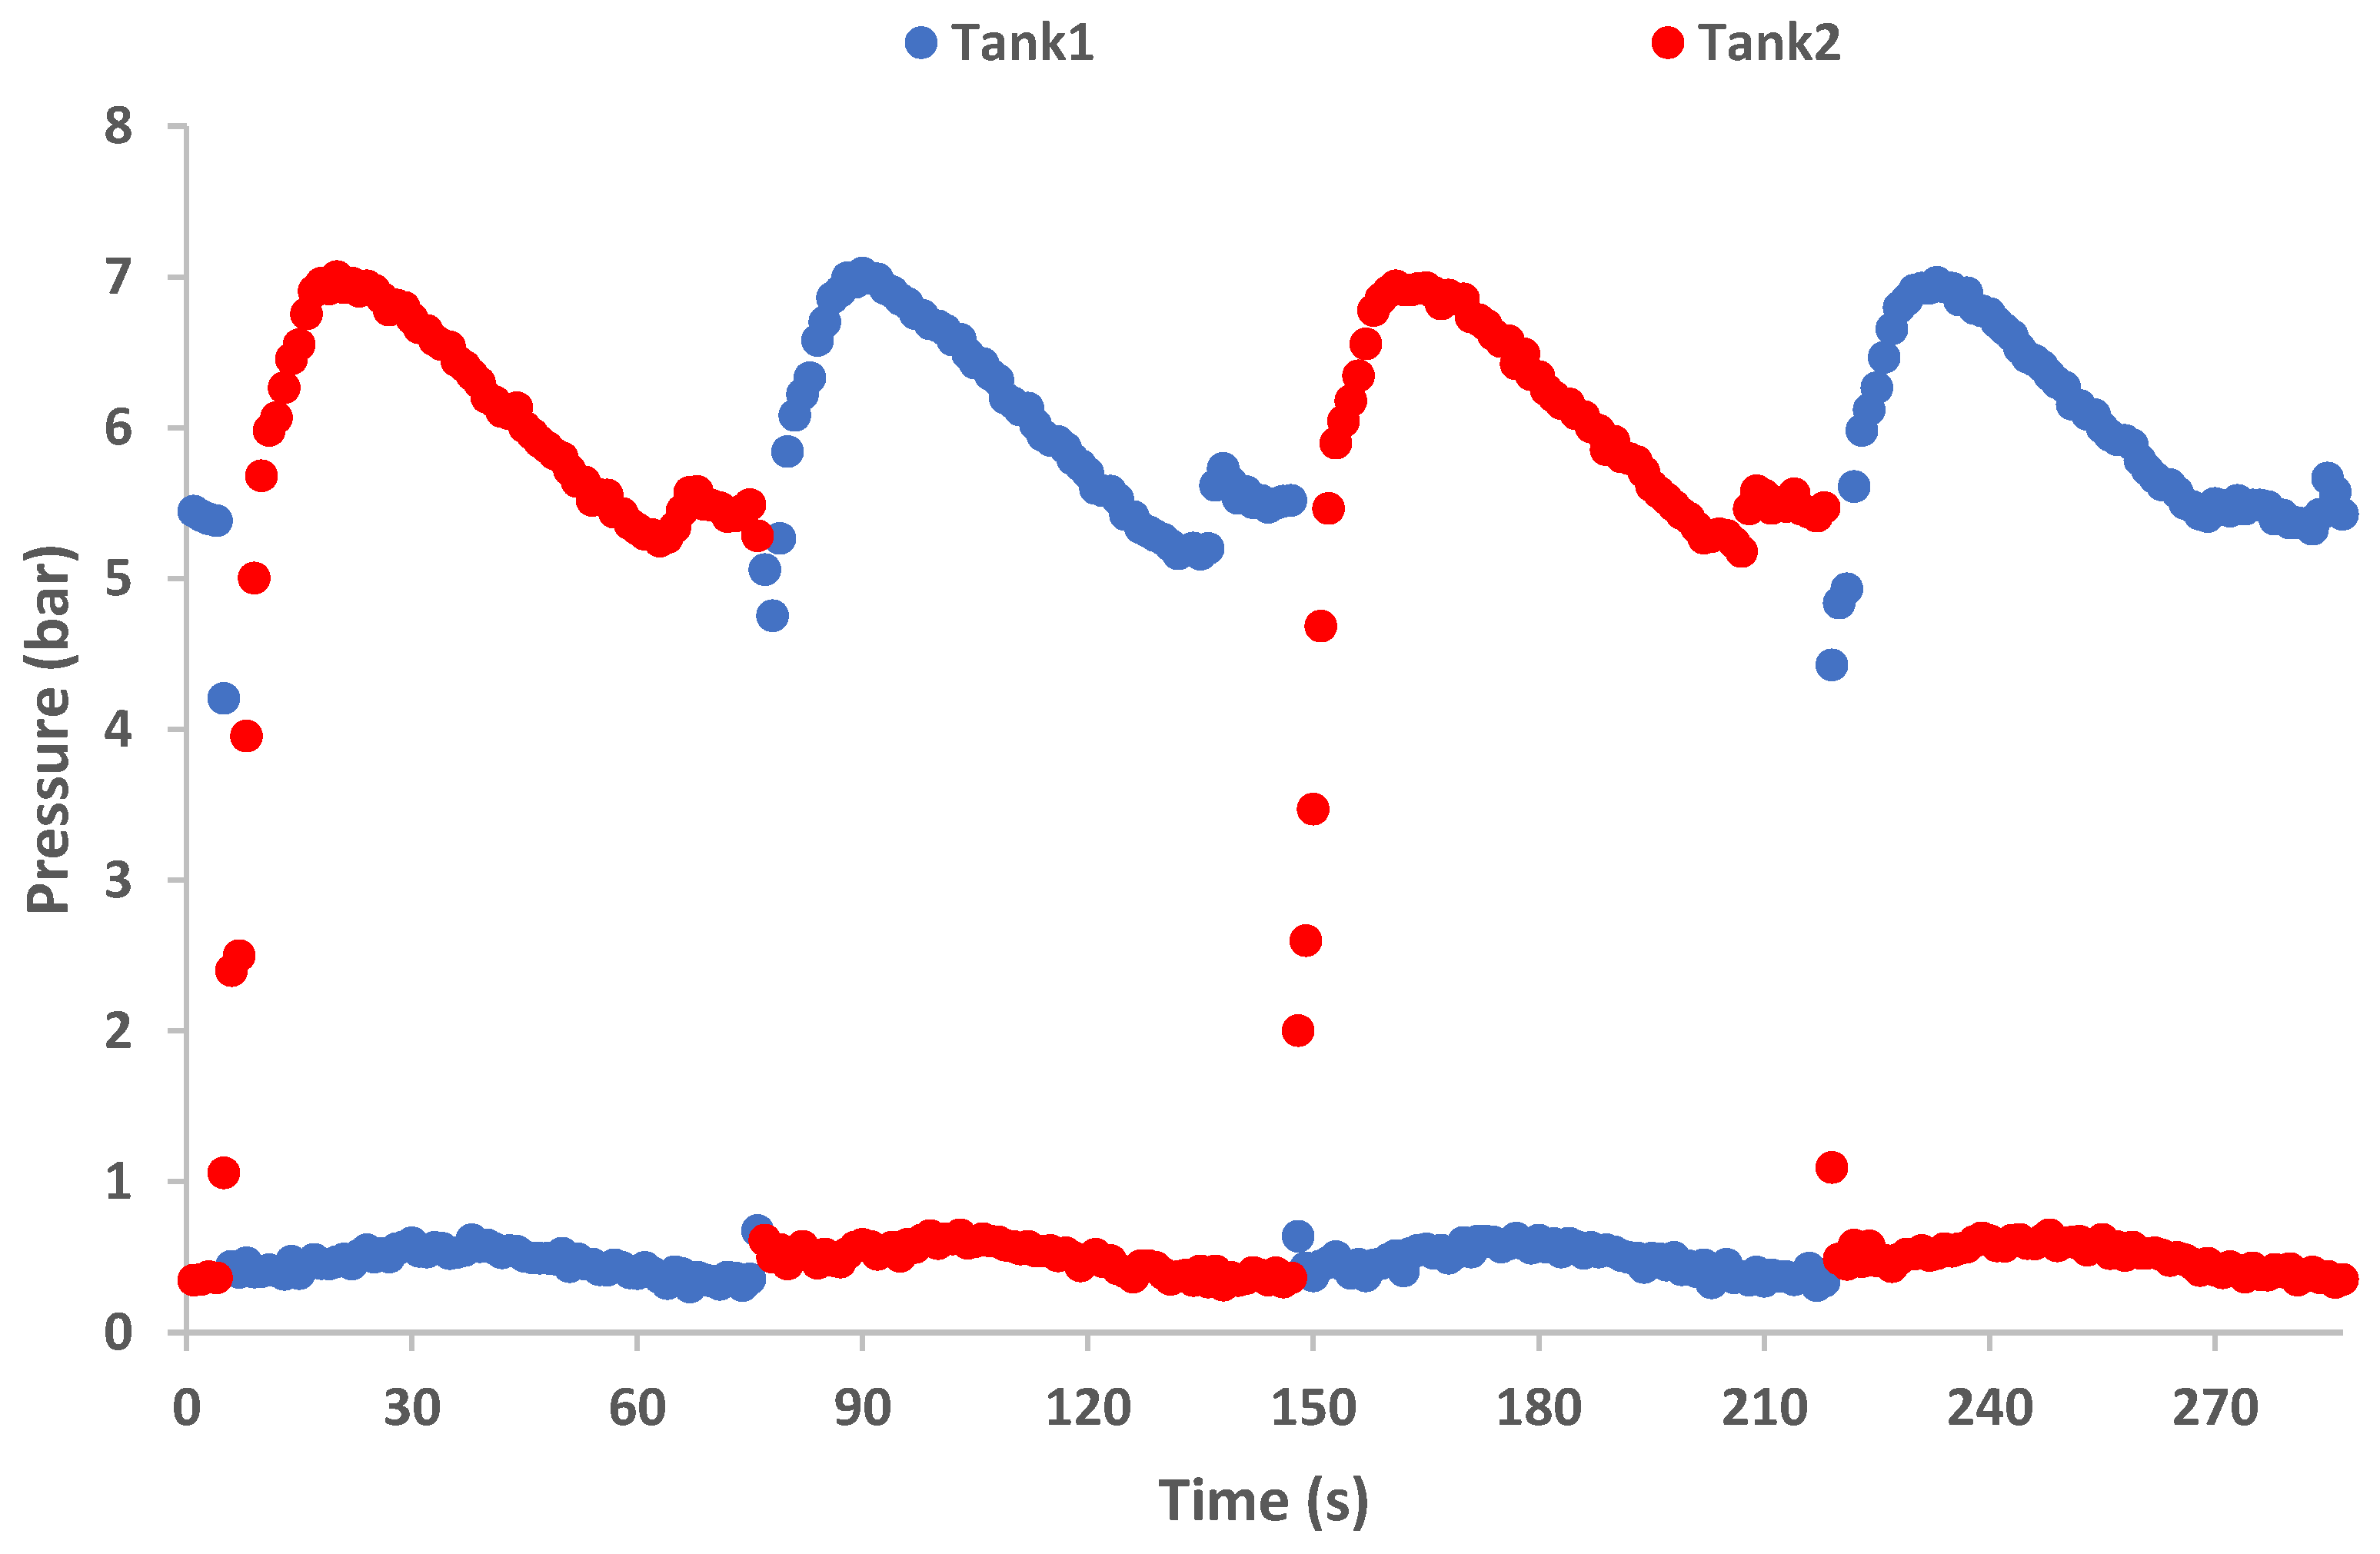
In the preliminary analysis results, the experimental data for thwin = 90 °C and tcwin = 10 °C as heat source and heat sink temperature levels are selected, respectively, and the presented results are summarized in two consecutive thermal cycles. Each thermal cycle consists of two working cycles in a row. The pressure fluctuation on each buffer tank is depicted in Figure 8. In the graph it is shown that the pressure range in the two buffer tanks depicts the same variation pattern. For the first half of each thermal cycle, Tank 2 has the role of the “hot” buffer tank, being in the high-pressure circuit, while at the same time, Tank 1 is on the low-pressure side as the “cold” buffer tank. In the second half of the thermal cycle, i.e., after the end of the previous working cycle, the two buffer tanks exchange roles, and this moment coincides with the switching of the valve system. In the same manner, the end of the second working cycle means the end of the current thermal cycle, which is followed by the beginning of a new thermal cycle. The high pressure shows a sharp rise in the beginning of each working cycle due to the existence of the passive compression phenomenon in this period of the cycle. After the high pressure reaches its maximum point, it stays stable for a few seconds, and then it follows a gradual decrease until the end of the working cycle. The beginning of the decrease in high pressure coincides with the complete evaporation of the refrigerant liquid in the high-pressure circuit, meaning that the “hot” buffer tank empties, and the thermal compression finalizes. It is important to notice that the high pressure variation follows a relative stable pattern on every operation cycle, without sharp drops at every switching phase, maintaining values over 5 bar throughout the thermal cycle, enabling the continuous power generation of the configuration. The latter important result lies in the adopted innovative design introduced by Gao et al. [26], who proposed the maintenance of the evaporator heat exchanger constantly on the high-pressure side and the condenser heat exchanger on the low-pressure side. Previous studies included the switch of evaporator and condenser heat exchanger functions, leading to sharp decreases in the cycle high pressure after every switching phase, as was the case in the results of Yamada et al. [23]. The continuous heat source and heat sink fluxes to the evaporator and condenser heat exchangers, respectively, tackle the latter drawback of PRC configurations, while the results of the current study regarding the maintenance of the high pressure in relatively high figures, even during the switching phases, are in line with the respective results of Zhu et al. [29]. Additionally, the low pressure shows also a relatively stable pattern throughout the thermal cycle since the condensation procedure remains more or less constant during each cycle.
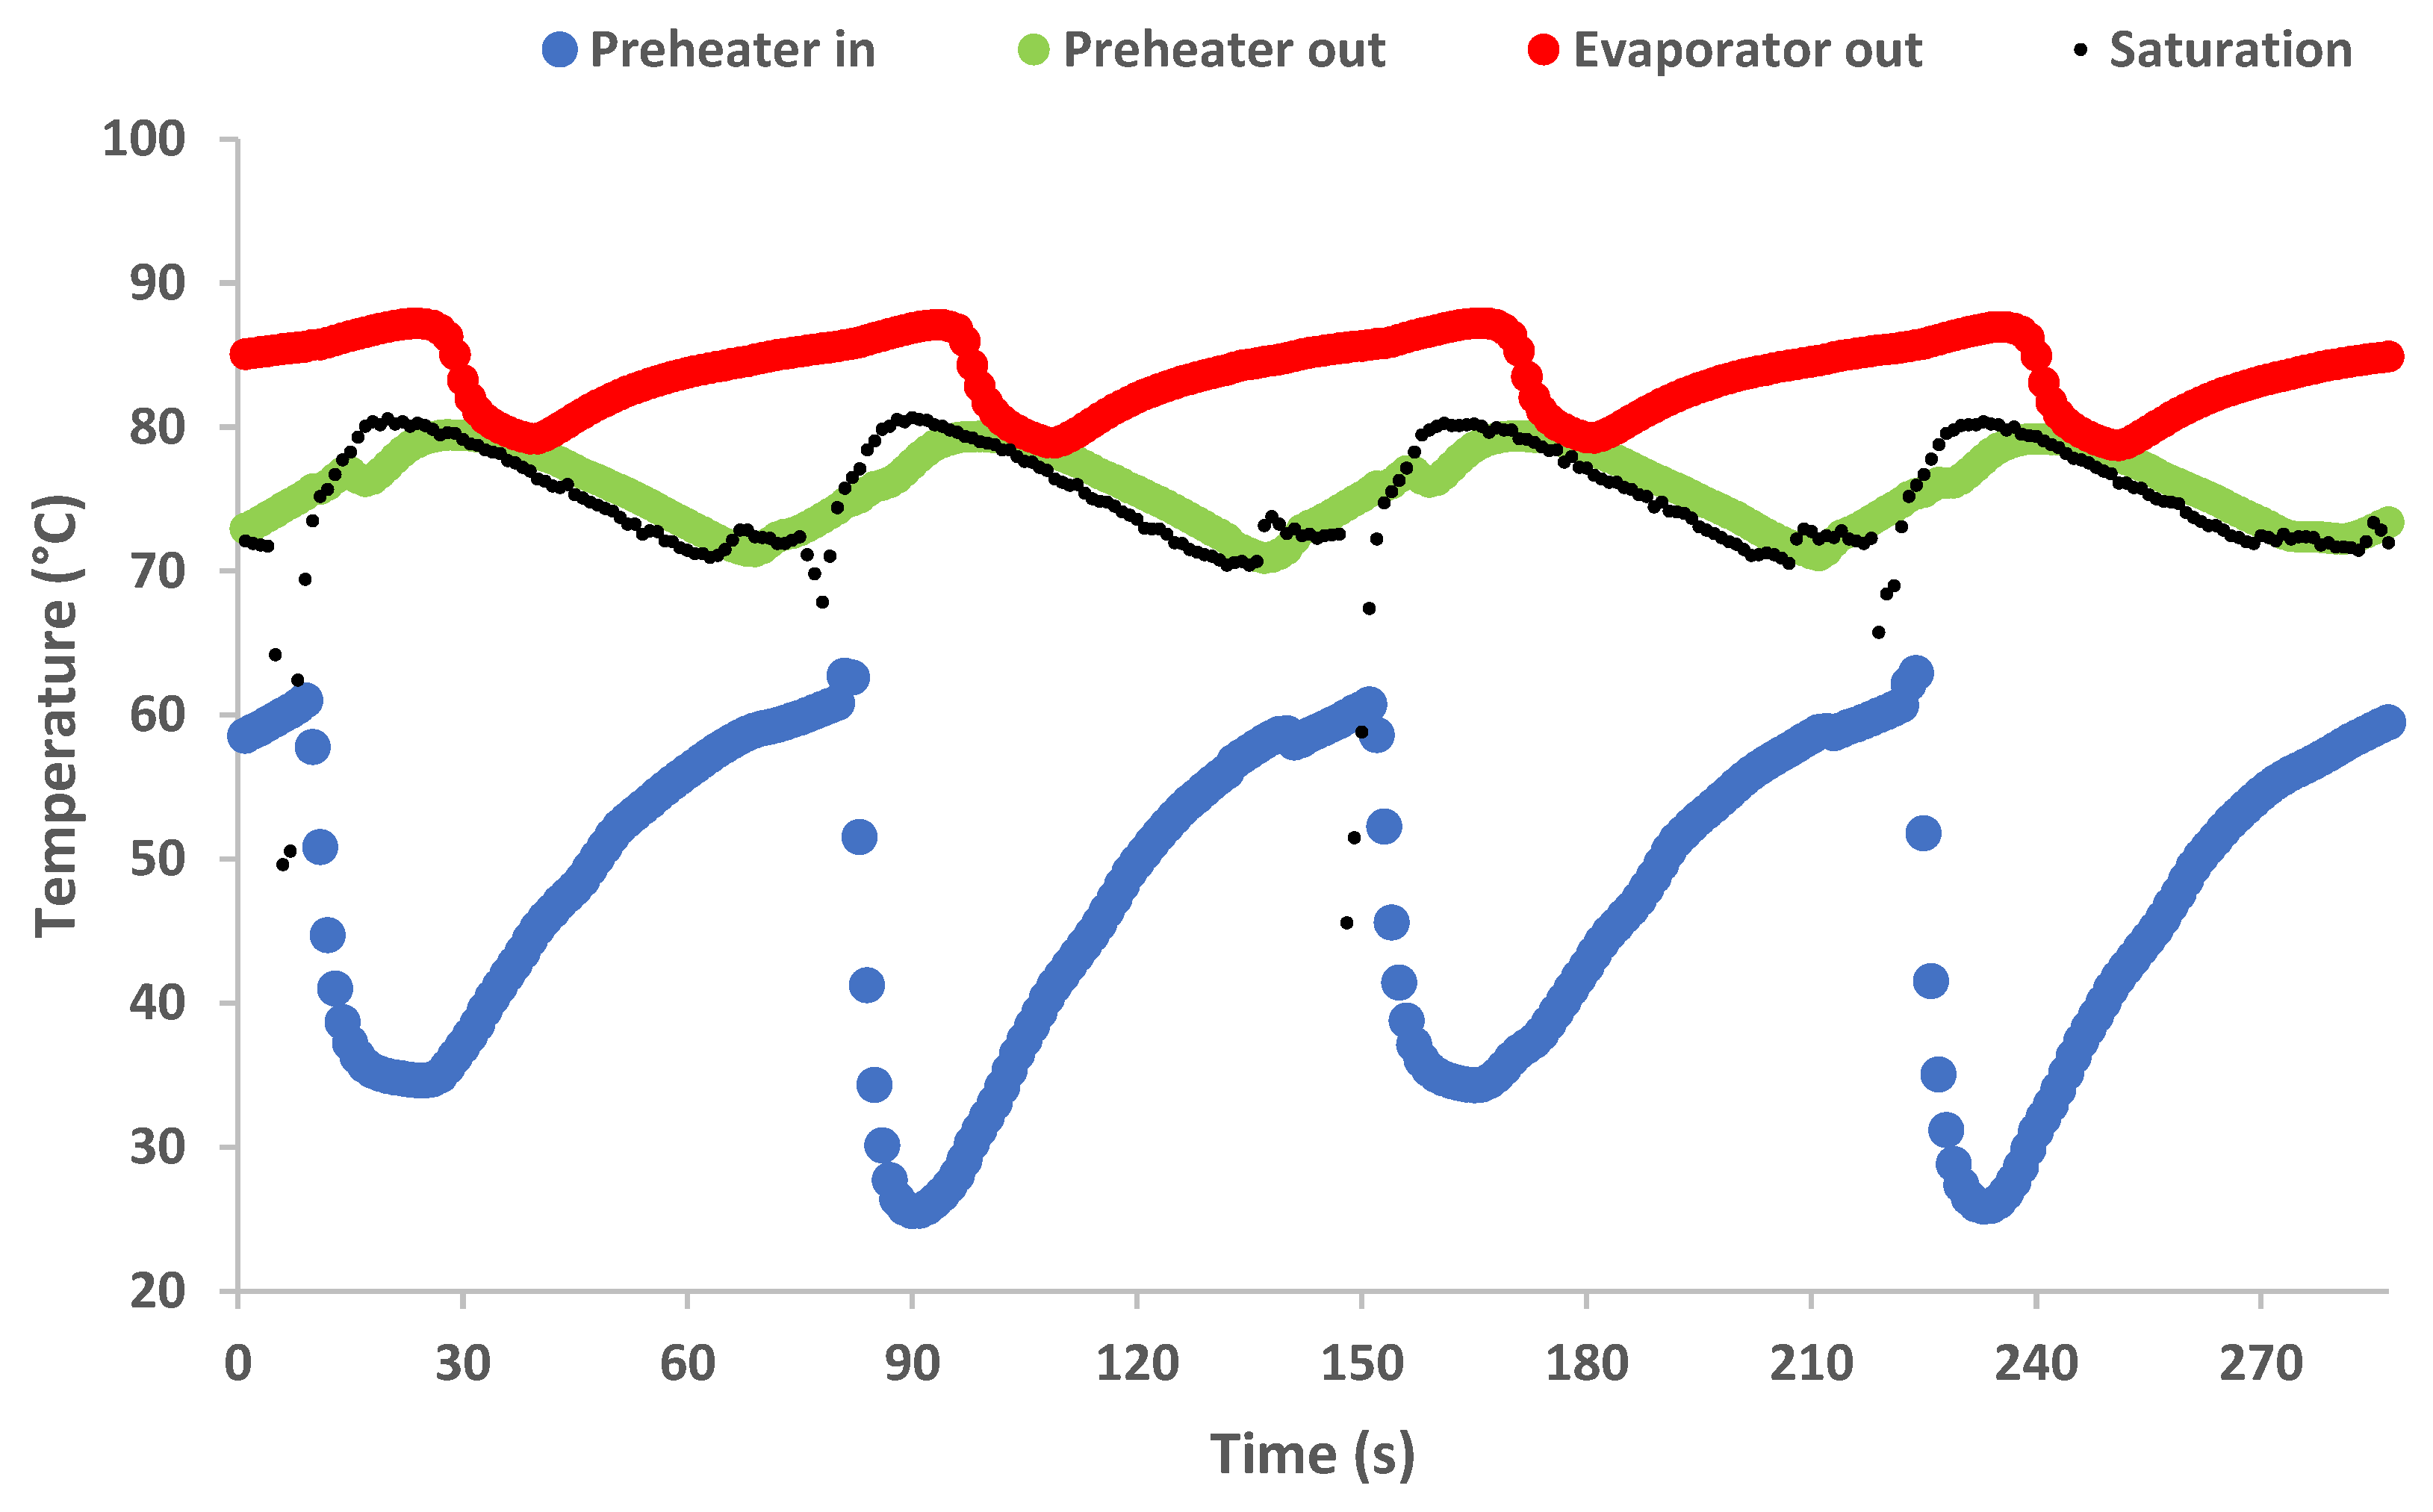
The analysis of the fluctuation of the expander inlet and outlet temperature values in combination with the change in the corresponding pressure levels is of the utmost importance since using those values allows for evaluation of the performance of the expander, which characterizes the efficiency of the total cycle to a high degree. The temperature in the expander outlet has a negligible alteration during each cycle, as shown in the graph of Figure 9. The expander inlet temperature has a slight incremental increase at the beginning of each working cycle, which is justified by the rise in the high pressure in the same period. However, a sharp decrease follows, which corresponds to the end of the evaporation procedure. This means that the expander inlet temperature approaches or is even equal for a few seconds with the saturation temperature in the evaporator heat exchanger. The latter is confirmed by the variation of the evaporator outlet temperature given in Figure 10. After the end of the evaporation, the heat transfer includes only direct heat transfer between the secondary heat source fluid and the vapor refrigerant in both the preheater and the evaporator heat exchangers, which is confirmed by a gradual increase in its temperature until the end of the cycle.
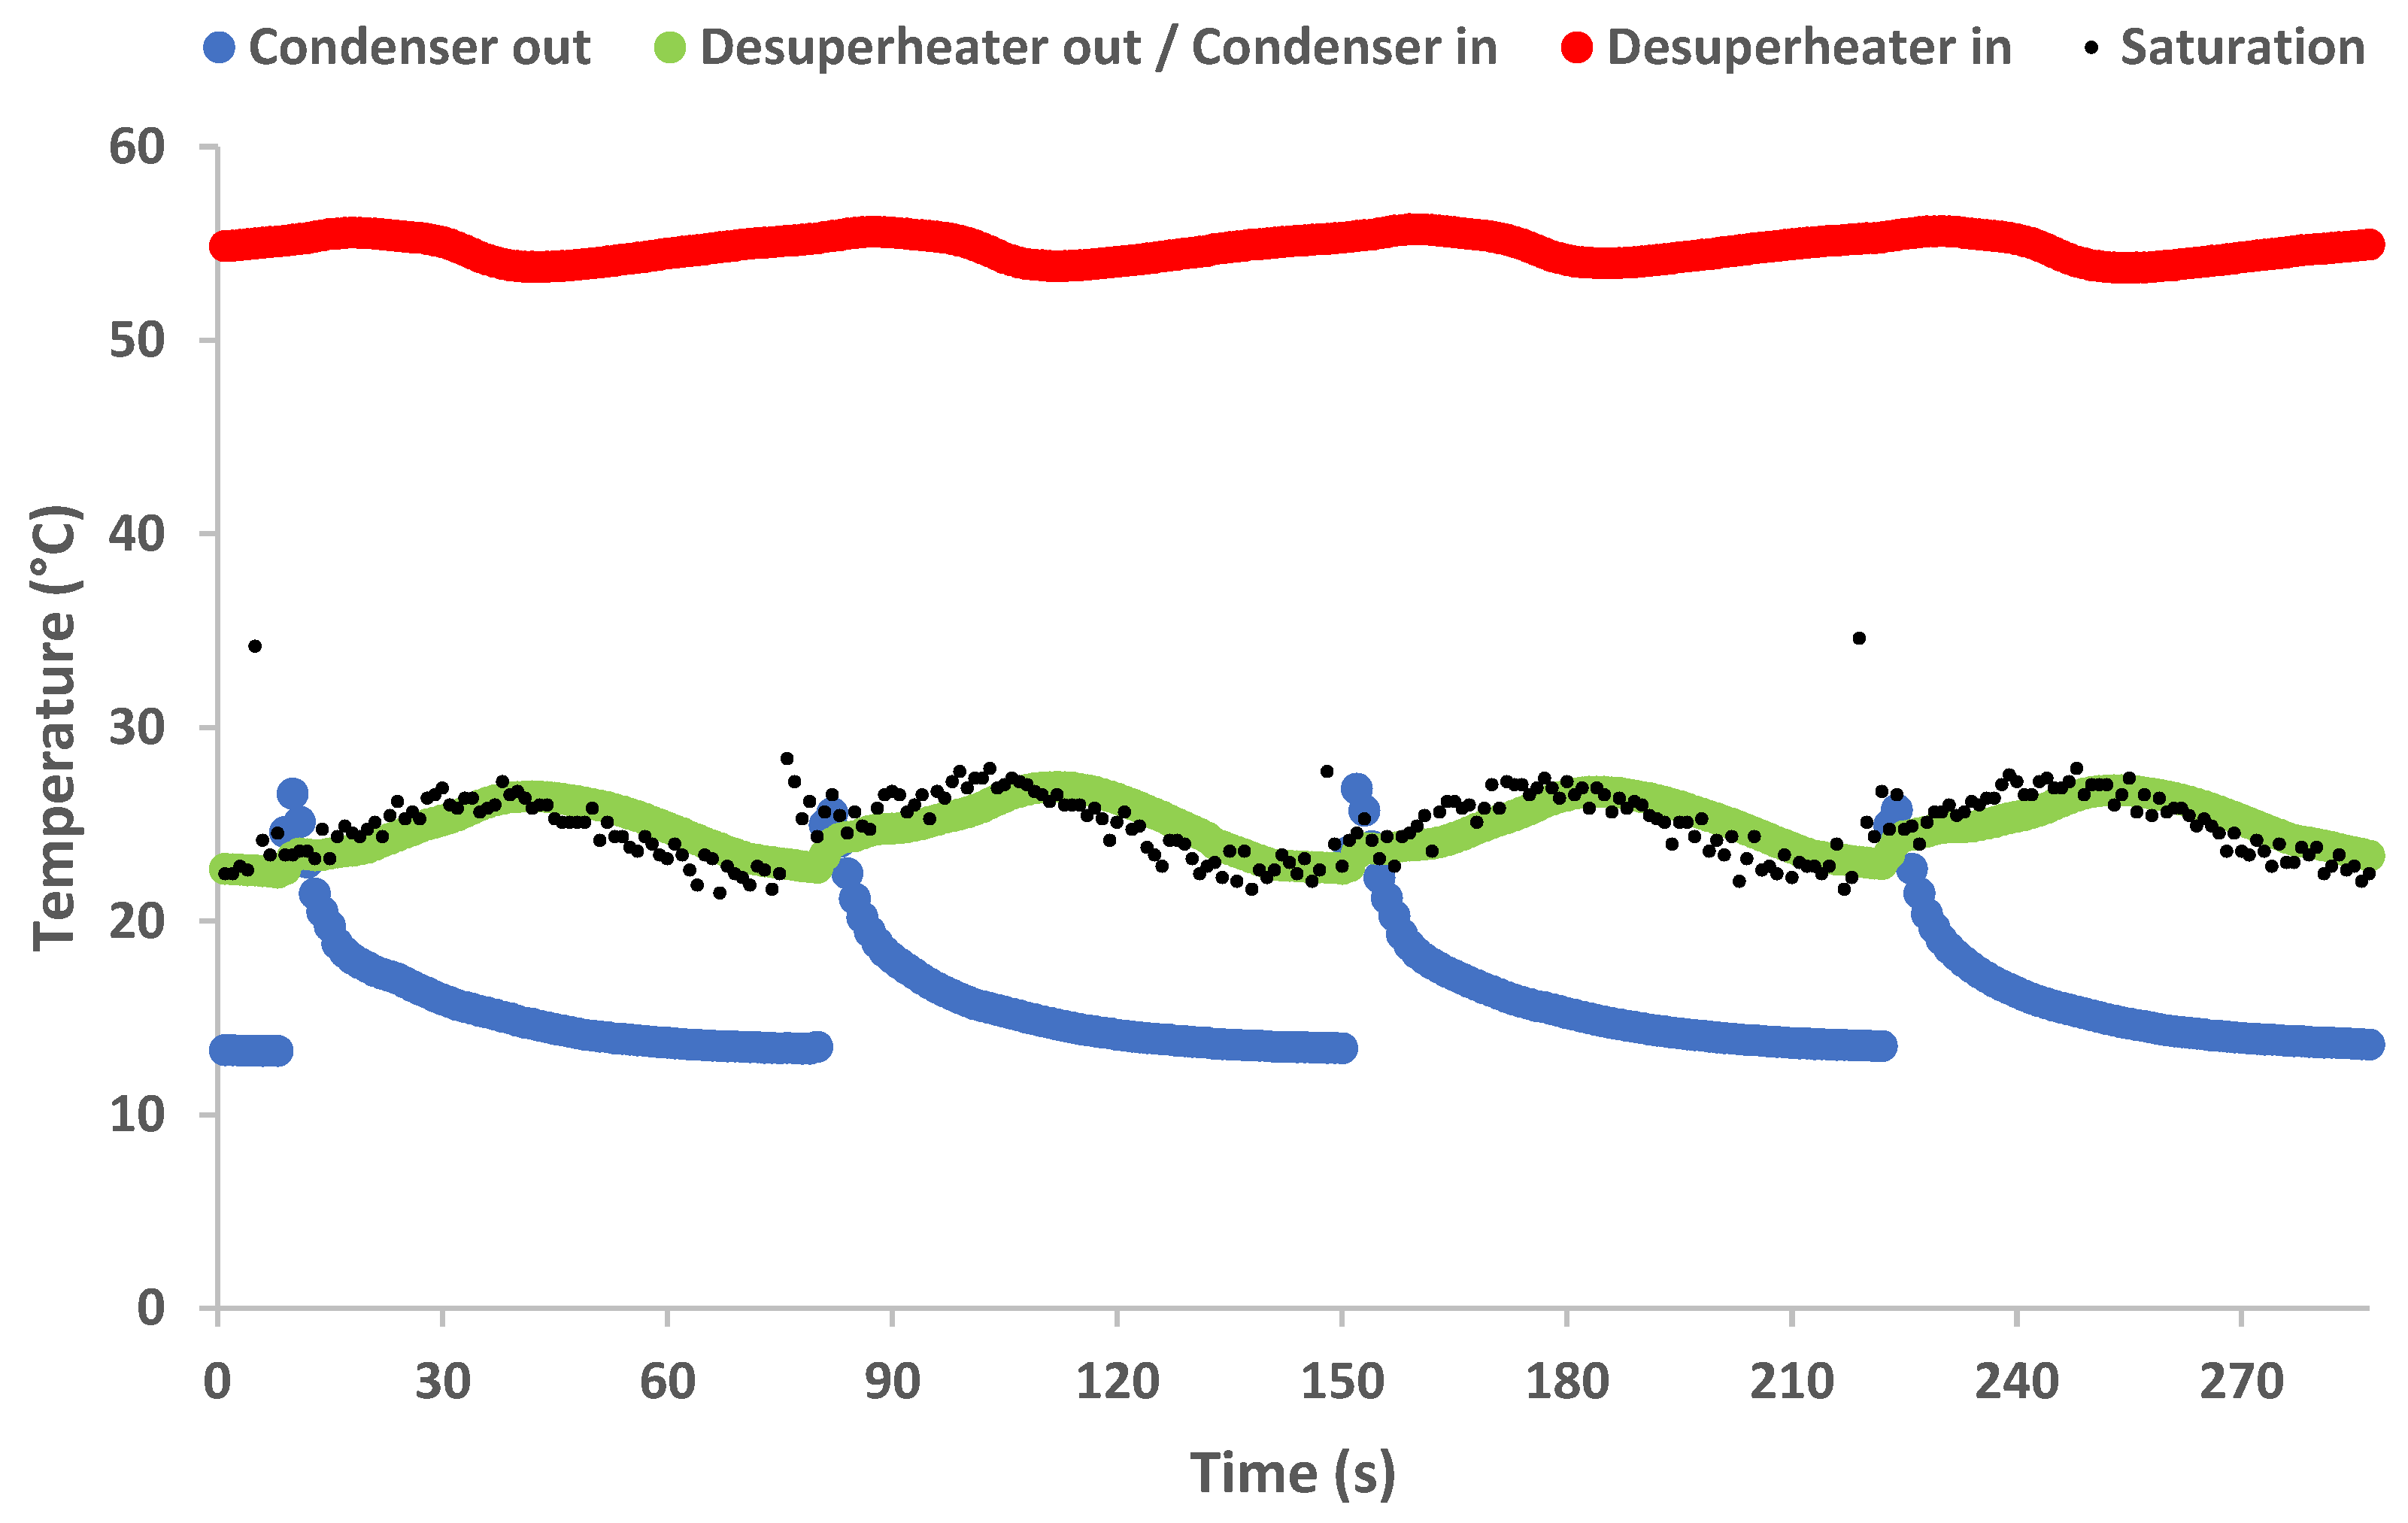
The saturation temperature in the high-pressure side is completely defined by the high-pressure variation, and it is depicted in the graph of Figure 10. Values close to the saturation temperature are given in the same plot for the outlet of the preheater, as expected, since the liquid refrigerant is heated up to the saturation point in this heat exchanger. The preheater inlet temperature corresponds to the refrigerant temperature in the main liquid line, which drops down close to the condensation temperature at the beginning of each cycle due to the switching of the two buffer tanks. When the “hot” buffer tank empties, the vapor refrigerant temperature in the preheater inlet begins to rise as it follows the heating of the vapor in the rest of the high-pressure circuit. In Figure 11 the variation of the temperature levels before and after the desuperheater and the condenser heat exchangers modules are given. The desuperheater inlet temperature remains almost stable throughout every cycle, corresponding to the expander outlet temperature. The desuperheater outlet temperature fluctuates close to the pattern of the saturation temperature corresponding to the variation of the low-pressure circuit, which is equal to the condensing pressure of the refrigerant. More precisely, it can be seen that for about the first half of each working cycle, the preheater outlet is higher than the saturation temperature, while during the second half, it drops below it. This means that on the one hand, in the first case, the desuperheater operates as a “condenser”, i.e., the condensation takes place in this heat exchanger. On the other hand, in the second case, the preheater module operates as a “desuperheater”, meaning that it only cools the refrigerant vapor close to the saturation point. The condenser outlet temperature in the same graph shows a sharp incremental increase during the first seconds after the beginning of each cycle due to the buffer tanks switching, when the condenser fully empties the liquid refrigerant, and its outlet instantly contains vapor refrigerant. After a few seconds liquid refrigerant fills again to the line at the condenser outlet, and the corresponding temperature drops back to a level below the saturation temperature due to the excessive subcooling degree.
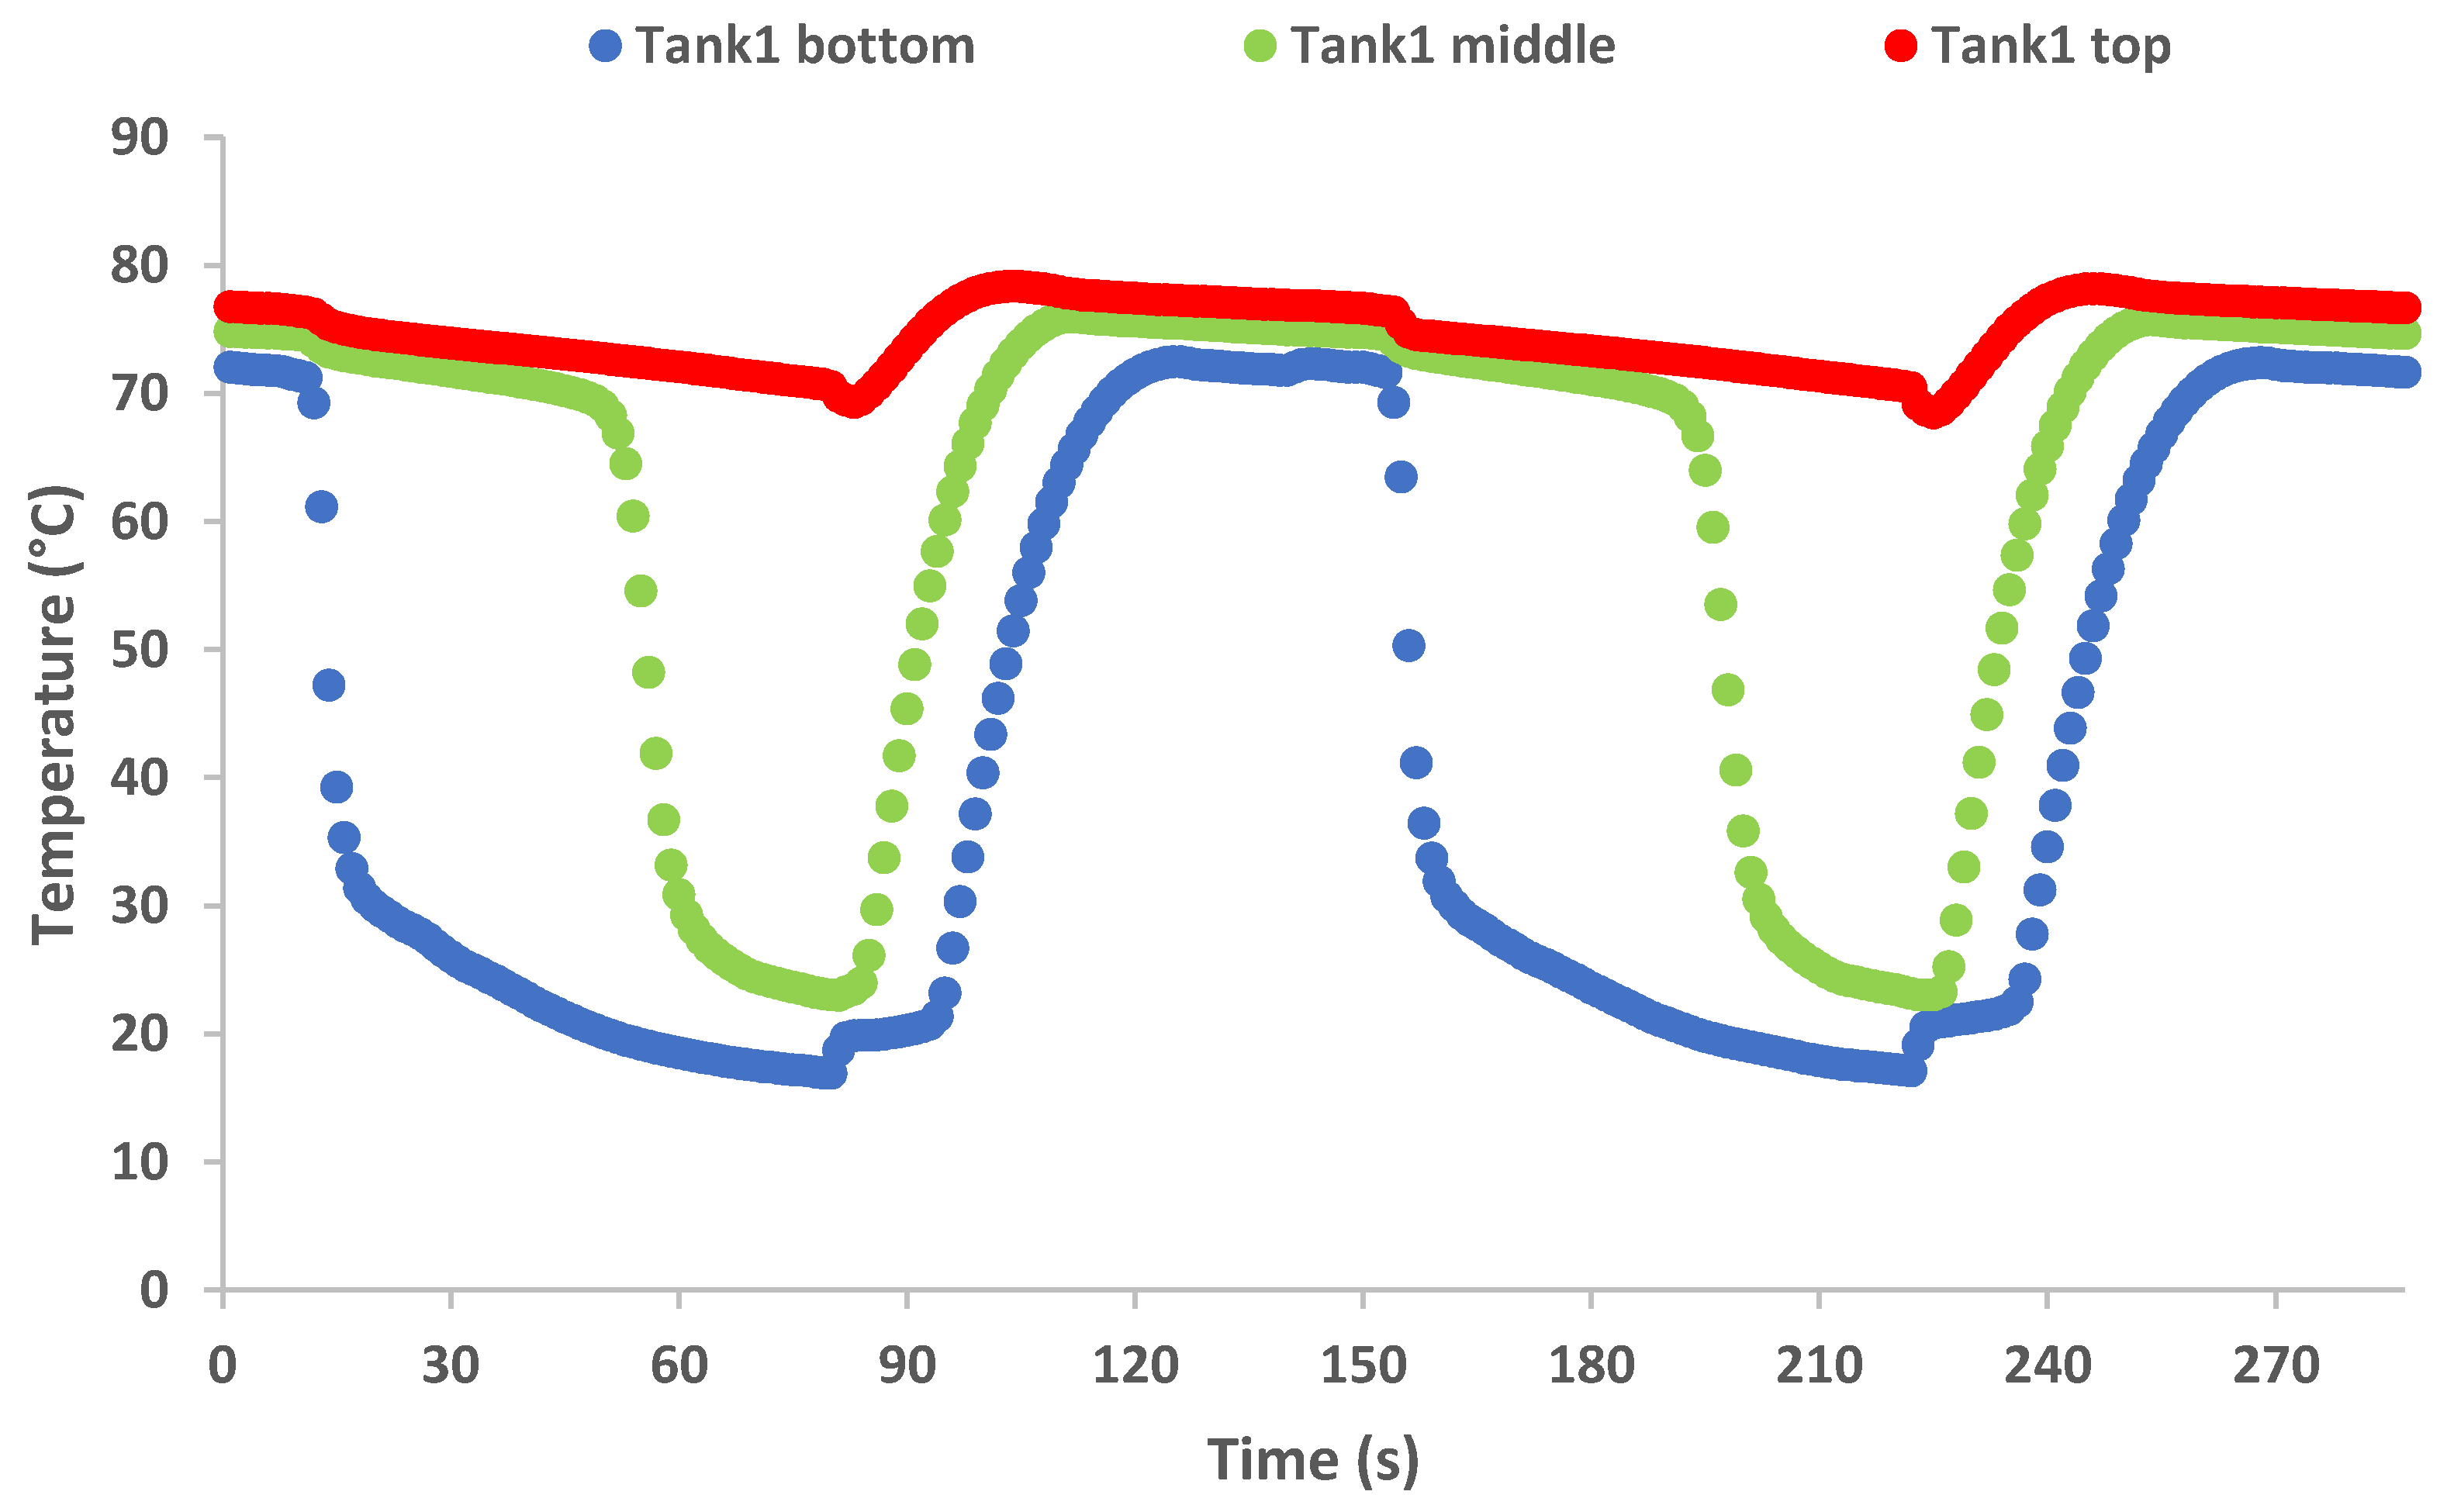
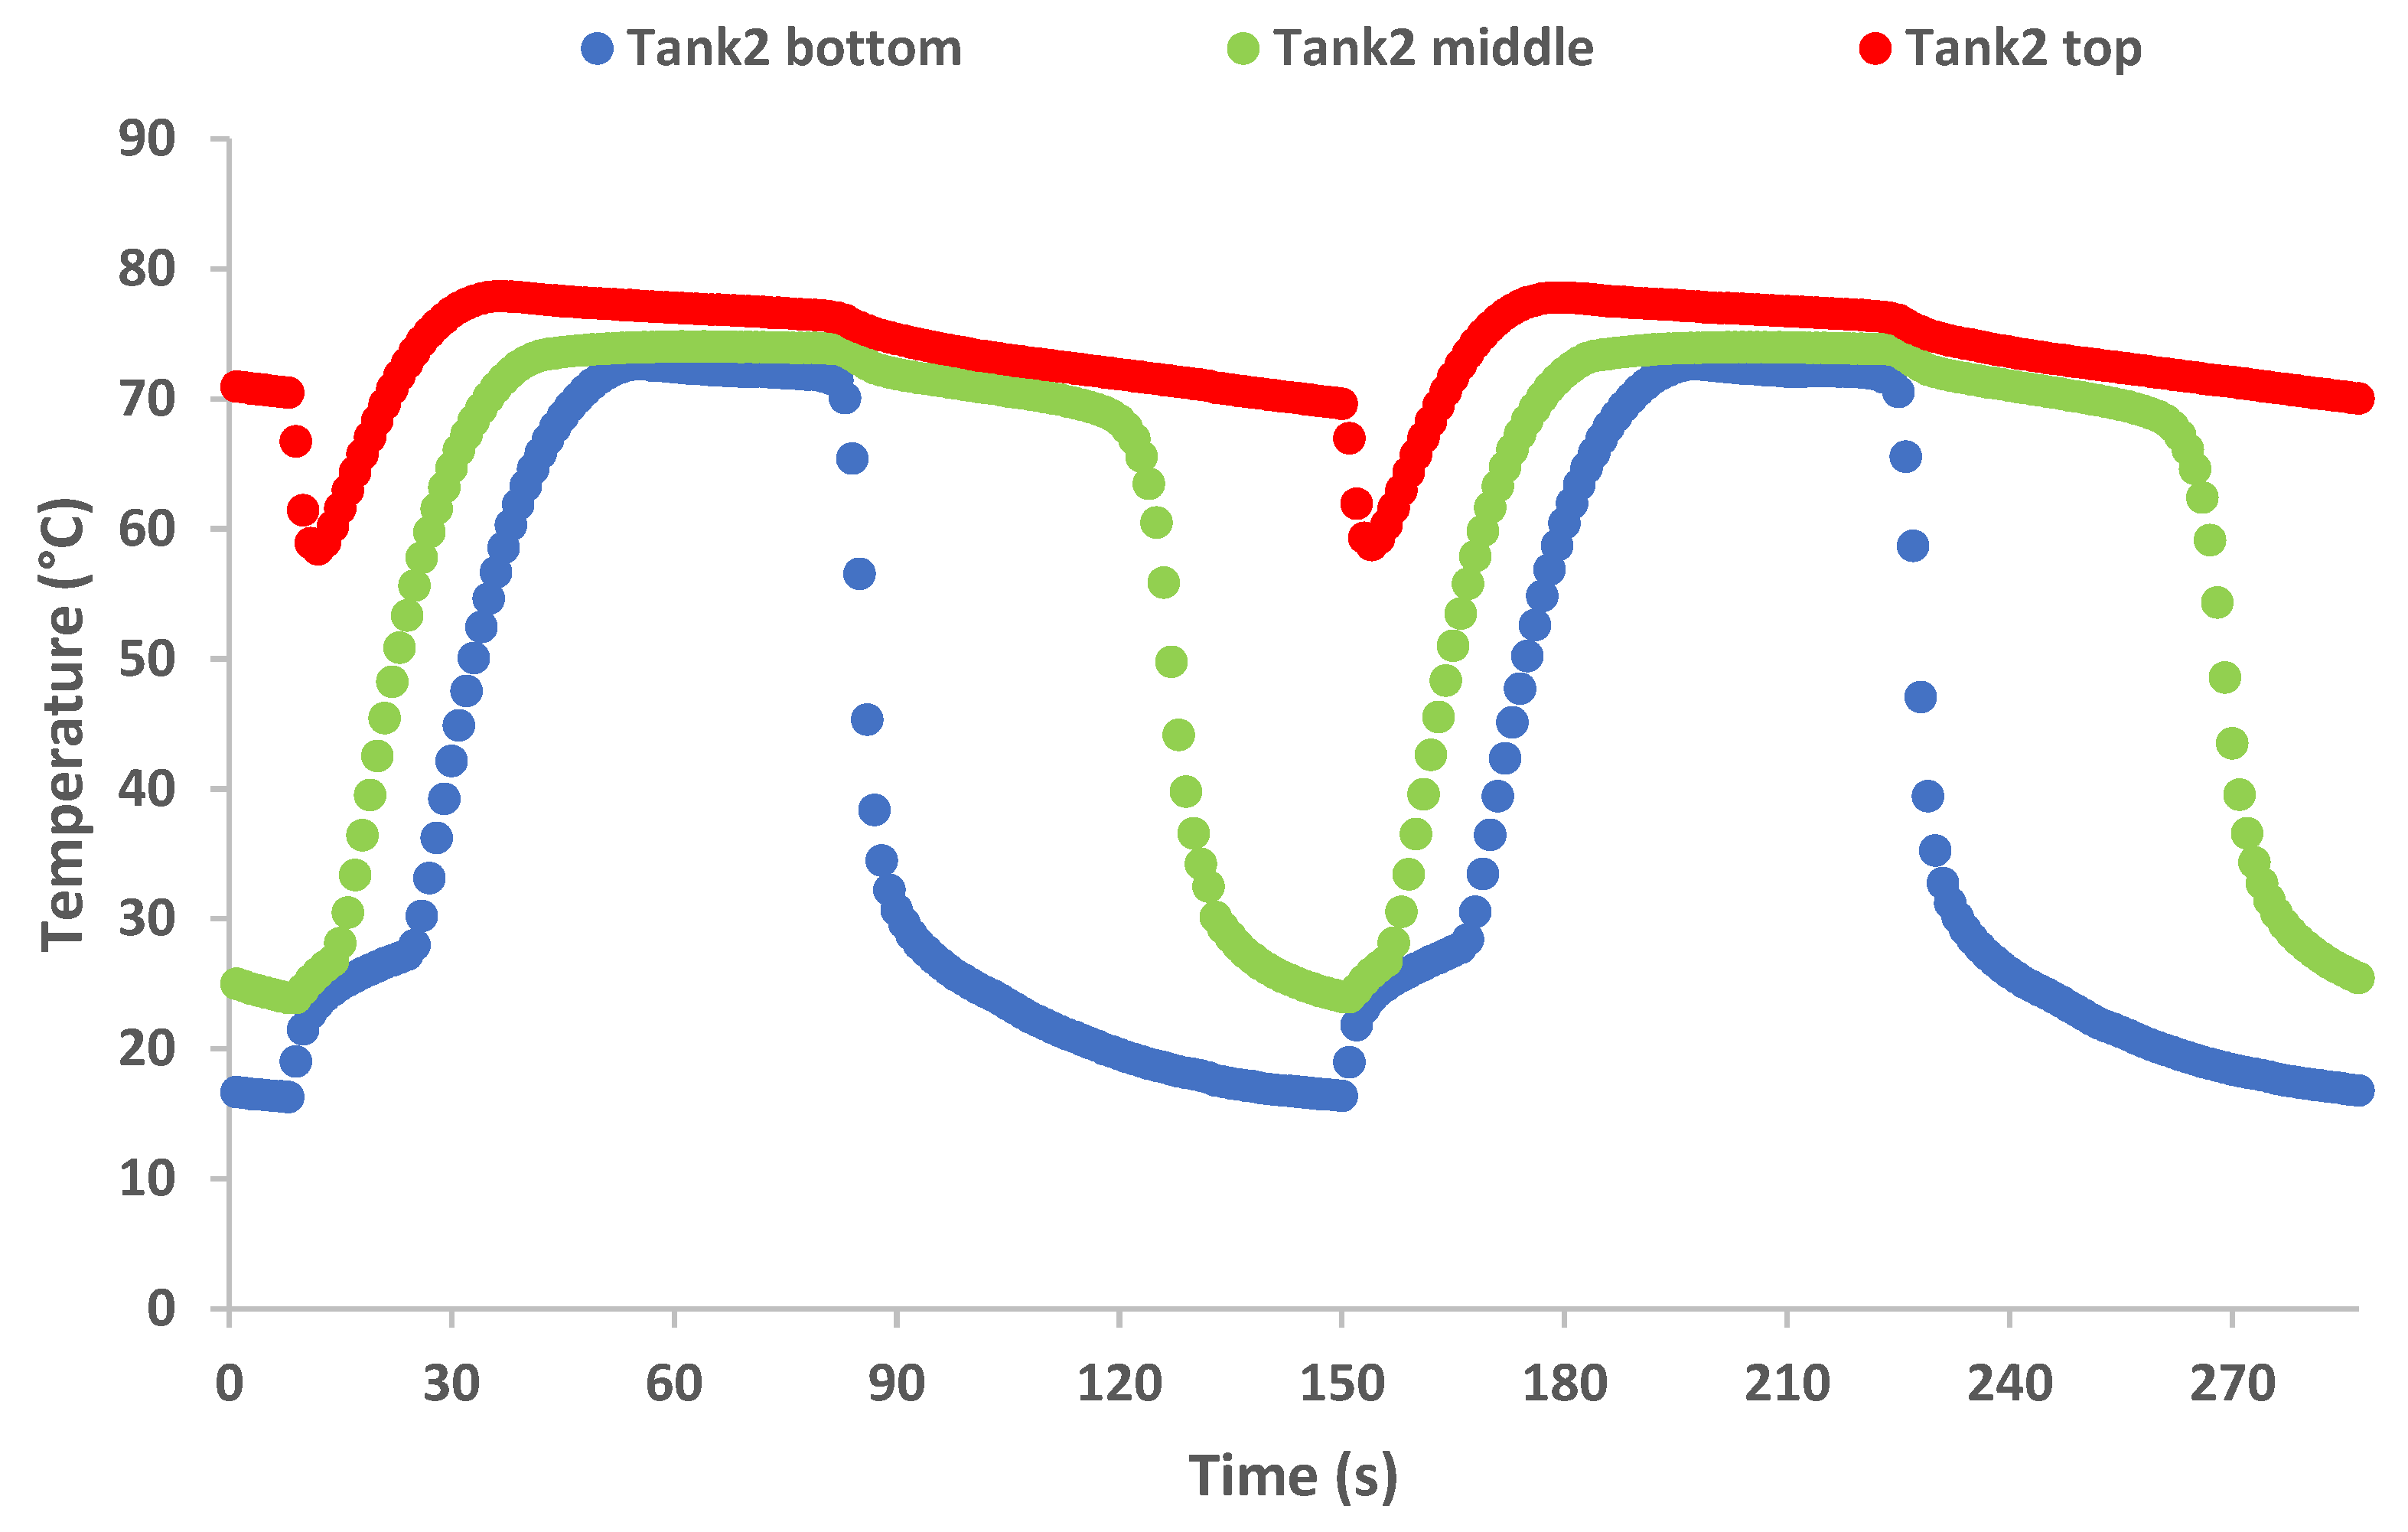
For a better understanding of the pumpless cycle operation, the temperature plots including the different height points of the two buffer tanks given in Figure 12 and Figure 13 can be used. Refrigerant temperature can be directly linked to the liquid level if this is over or below the temperature probe installation height point. As mentioned earlier, the graphs presented show two consecutive thermal cycles, or four working cycles in a row. During the first thermal cycle, Tank 1 is the “cold” buffer and Tank 2 is the “hot”, and vice versa in the second thermal cycle. As it is depicted in the graphs below, the cold buffer contains only vapor refrigerant at the beginning of each working cycle and starts to be filled with liquid refrigerant from bottom to top. By the end of each working cycle, the cold buffer has filled beyond the middle point with liquid refrigerant. Additionally, after the switch phase between each working cycle, the hot buffer tank is initially half-full with liquid refrigerant. After a few seconds of operation, the liquid level drops drastically, and the hot buffer empties as the temperature in the entire vessel rises. The two temperature patterns in the two vessels are almost equal, having a time displacement of one working cycle, as expected. The working cycle time of 70 s was selected to ensure that the cold buffer is totally empty and the liquid level in the hot buffer tank is as high as possible at the end of each cycle, as is justified by the results. On the one hand, high switching frequencies lead to increased transitional periods and more consecutive drops in power production, resulting in unstable operation. On the other hand, prolonged cycle operation stops the passive compression phenomenon as soon as the entire liquid refrigerant in the main liquid line has been evaporated, resulting in negligible power generation. Additionally, the buffer tank volume seems to play an important role in the cycle operation since increased tank volume could enable higher cycle duration; however, aspects such as techno-economic and construction restrictions should be considered.
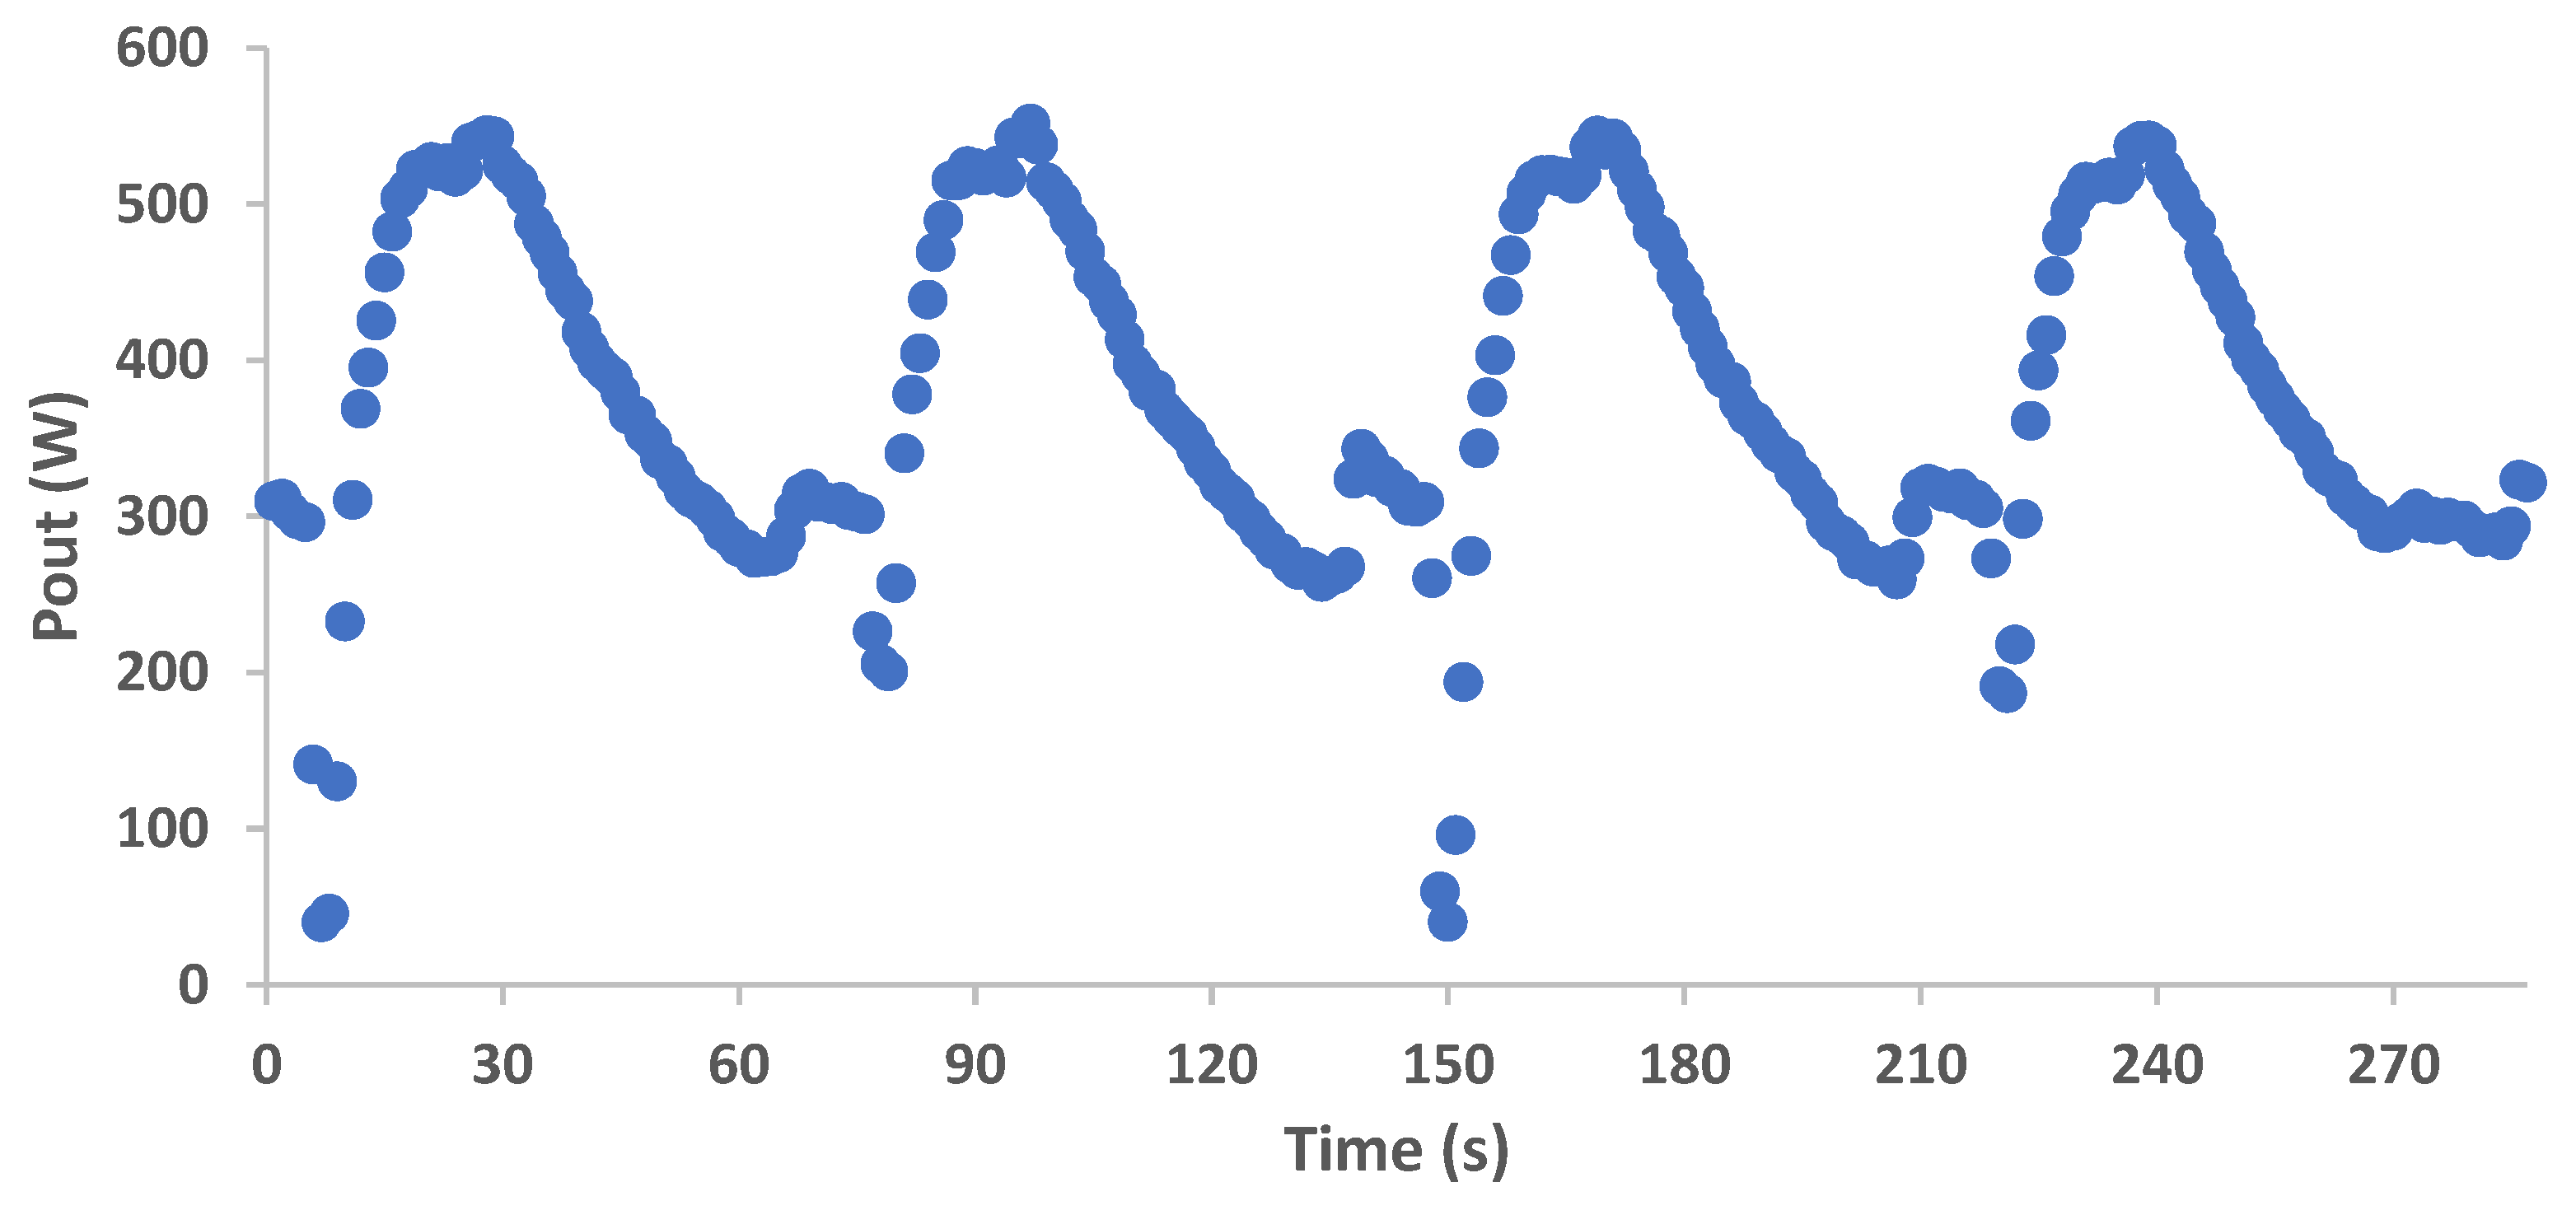
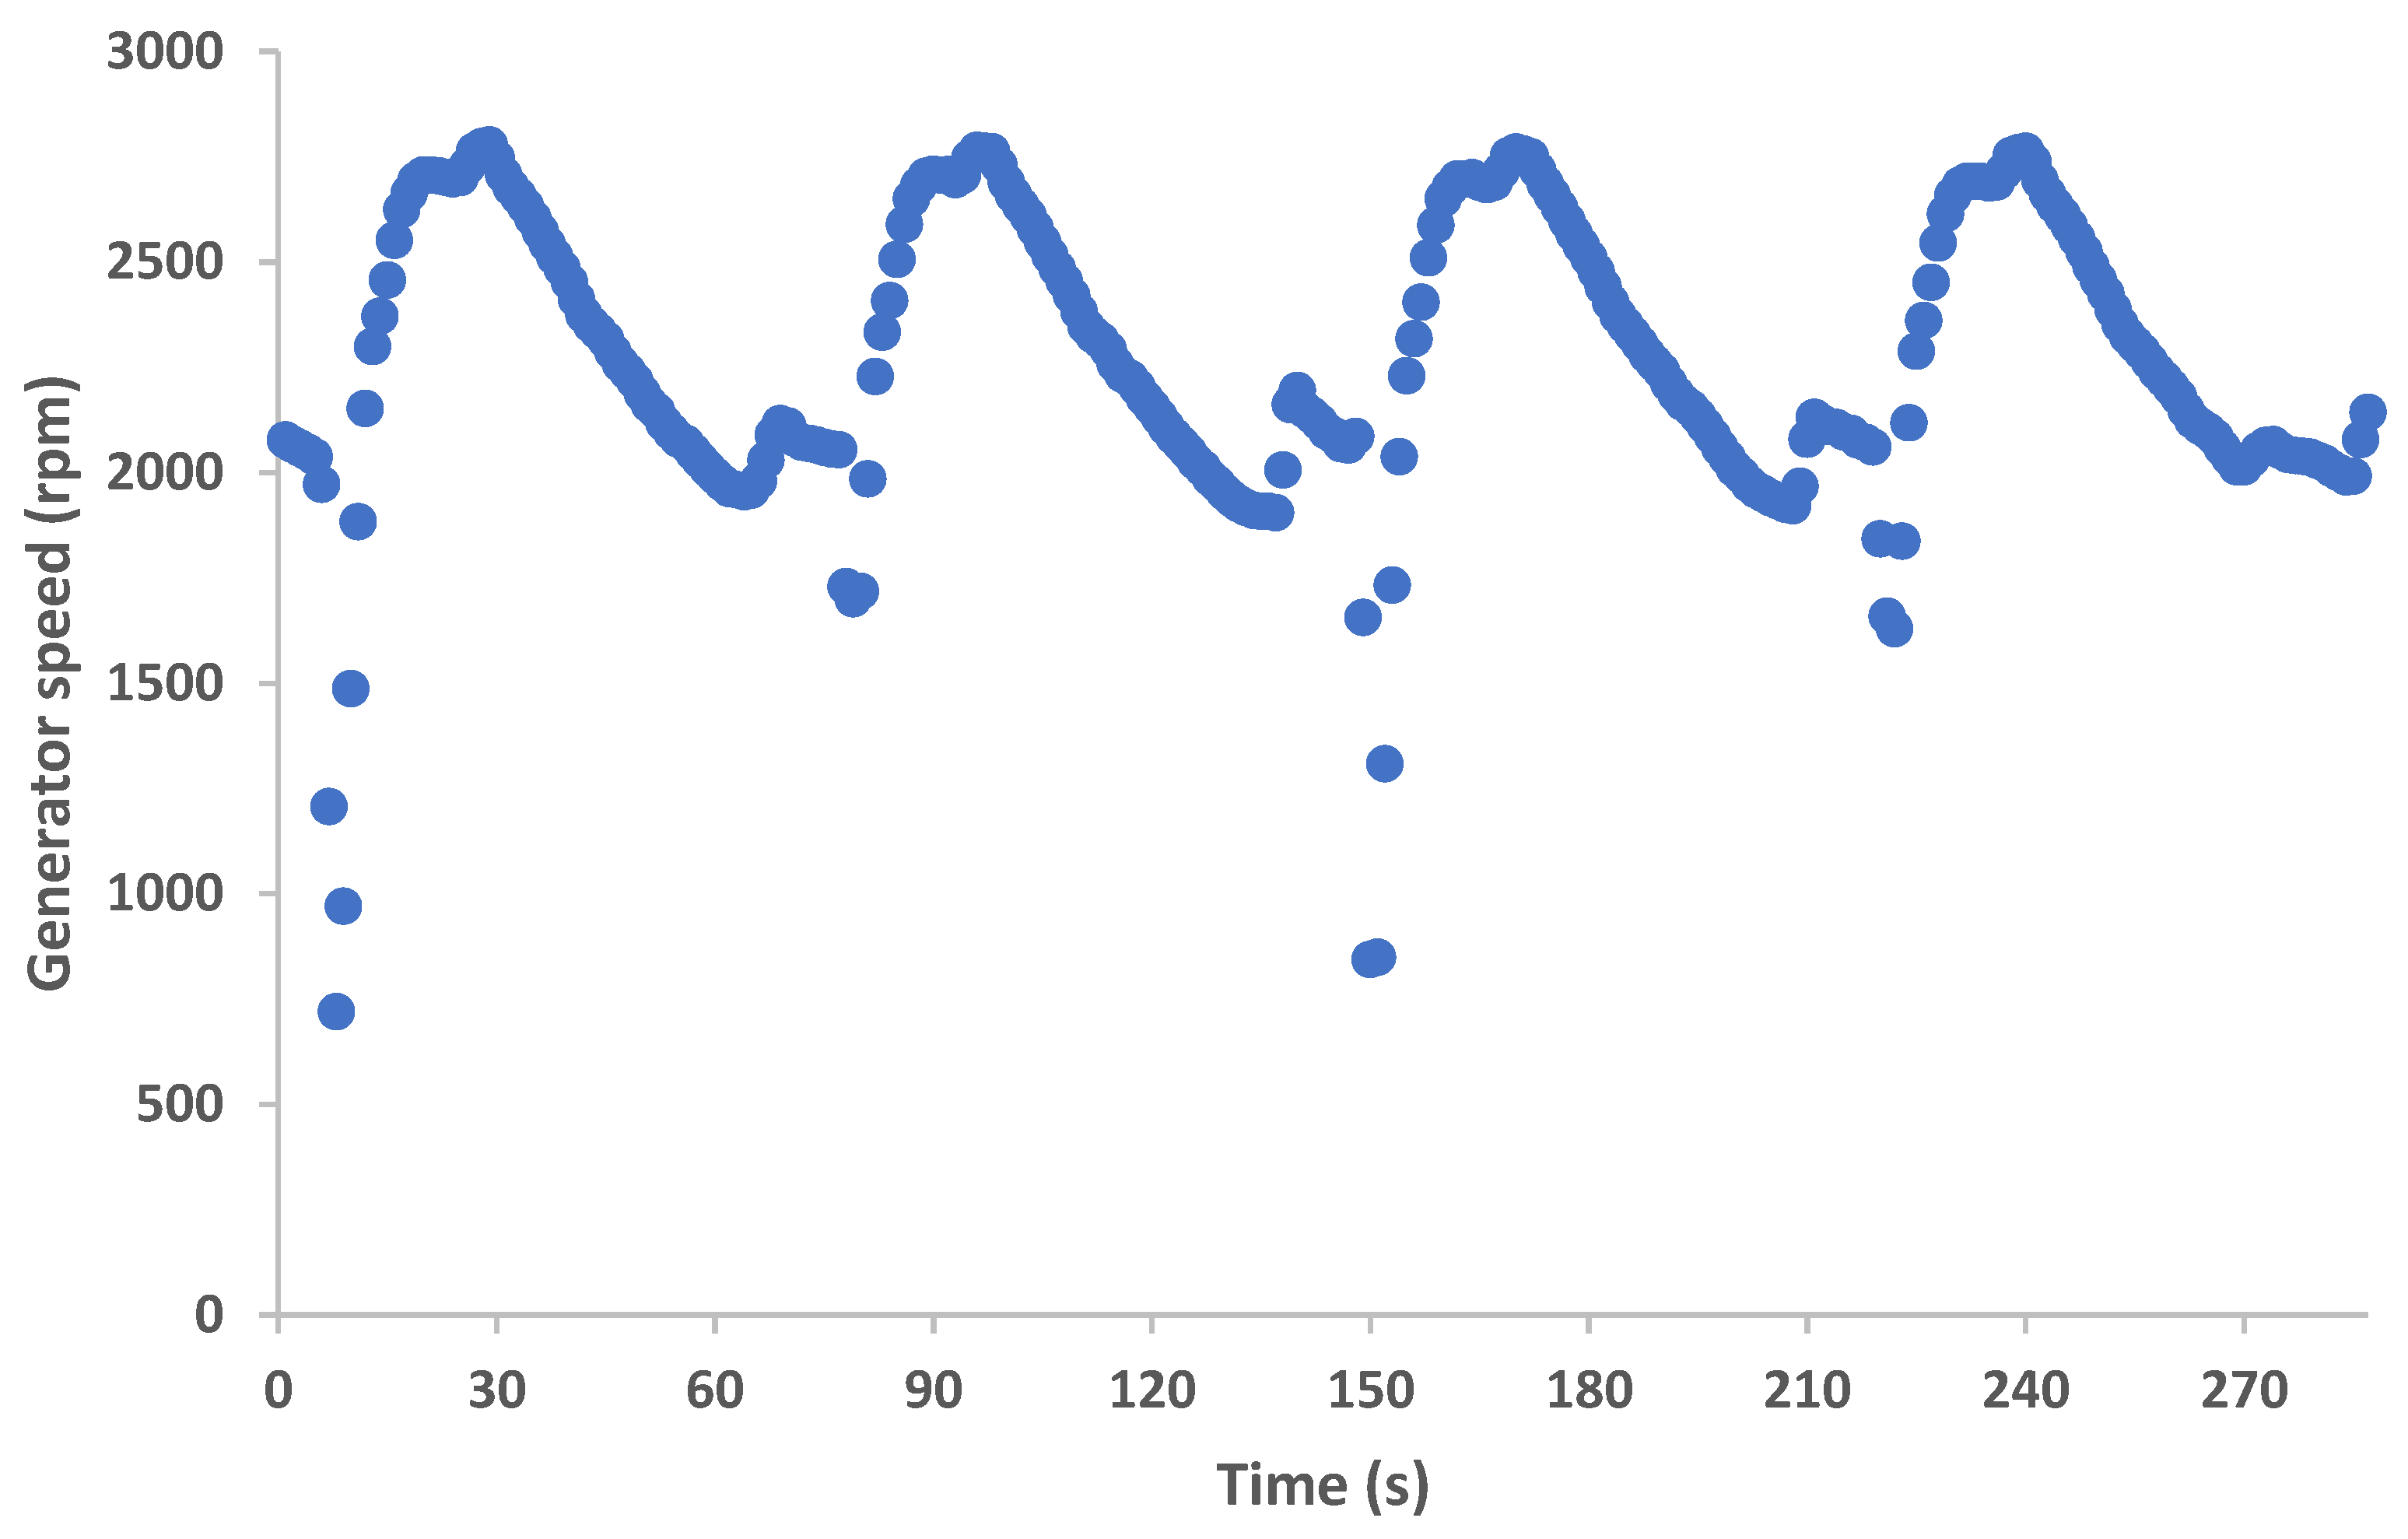
The generated output power (Pout) and the generator speed variation are presented in the plots of Figure 14 and Figure 15, respectively. The two figures are as expected: directly proportional to each other, plus both of them follow the variation of the high pressure, i.e., the pressure ratio in the expander module, since the low pressure is more or less stable. It is important to highlight the fact that the output power, for the selected 90–10 °C thwin-tcwin pair, ranges between 300 and 550 W, having drops in its value below 300 W only for a few seconds during the switching phase between each working cycle. Additionally, the generator speed fluctuates between 2000 and 2800 rpm, while it hardly drops below this range. The latter confirms that the examined configuration shows relatively stable operation, with continuous power generation despite the switching phase, which inherently disrupts the constant refrigerant flow throughout the cycle. PRC performance enhancement could be obtained by optimizing its design, focusing on architectures providing continuous liquid refrigerant flow in the evaporator heat exchanger, e.g., with increased buffer tank volume, to prolong the continuous power generation of the configuration.

3.2. Thermal Energy Analysis

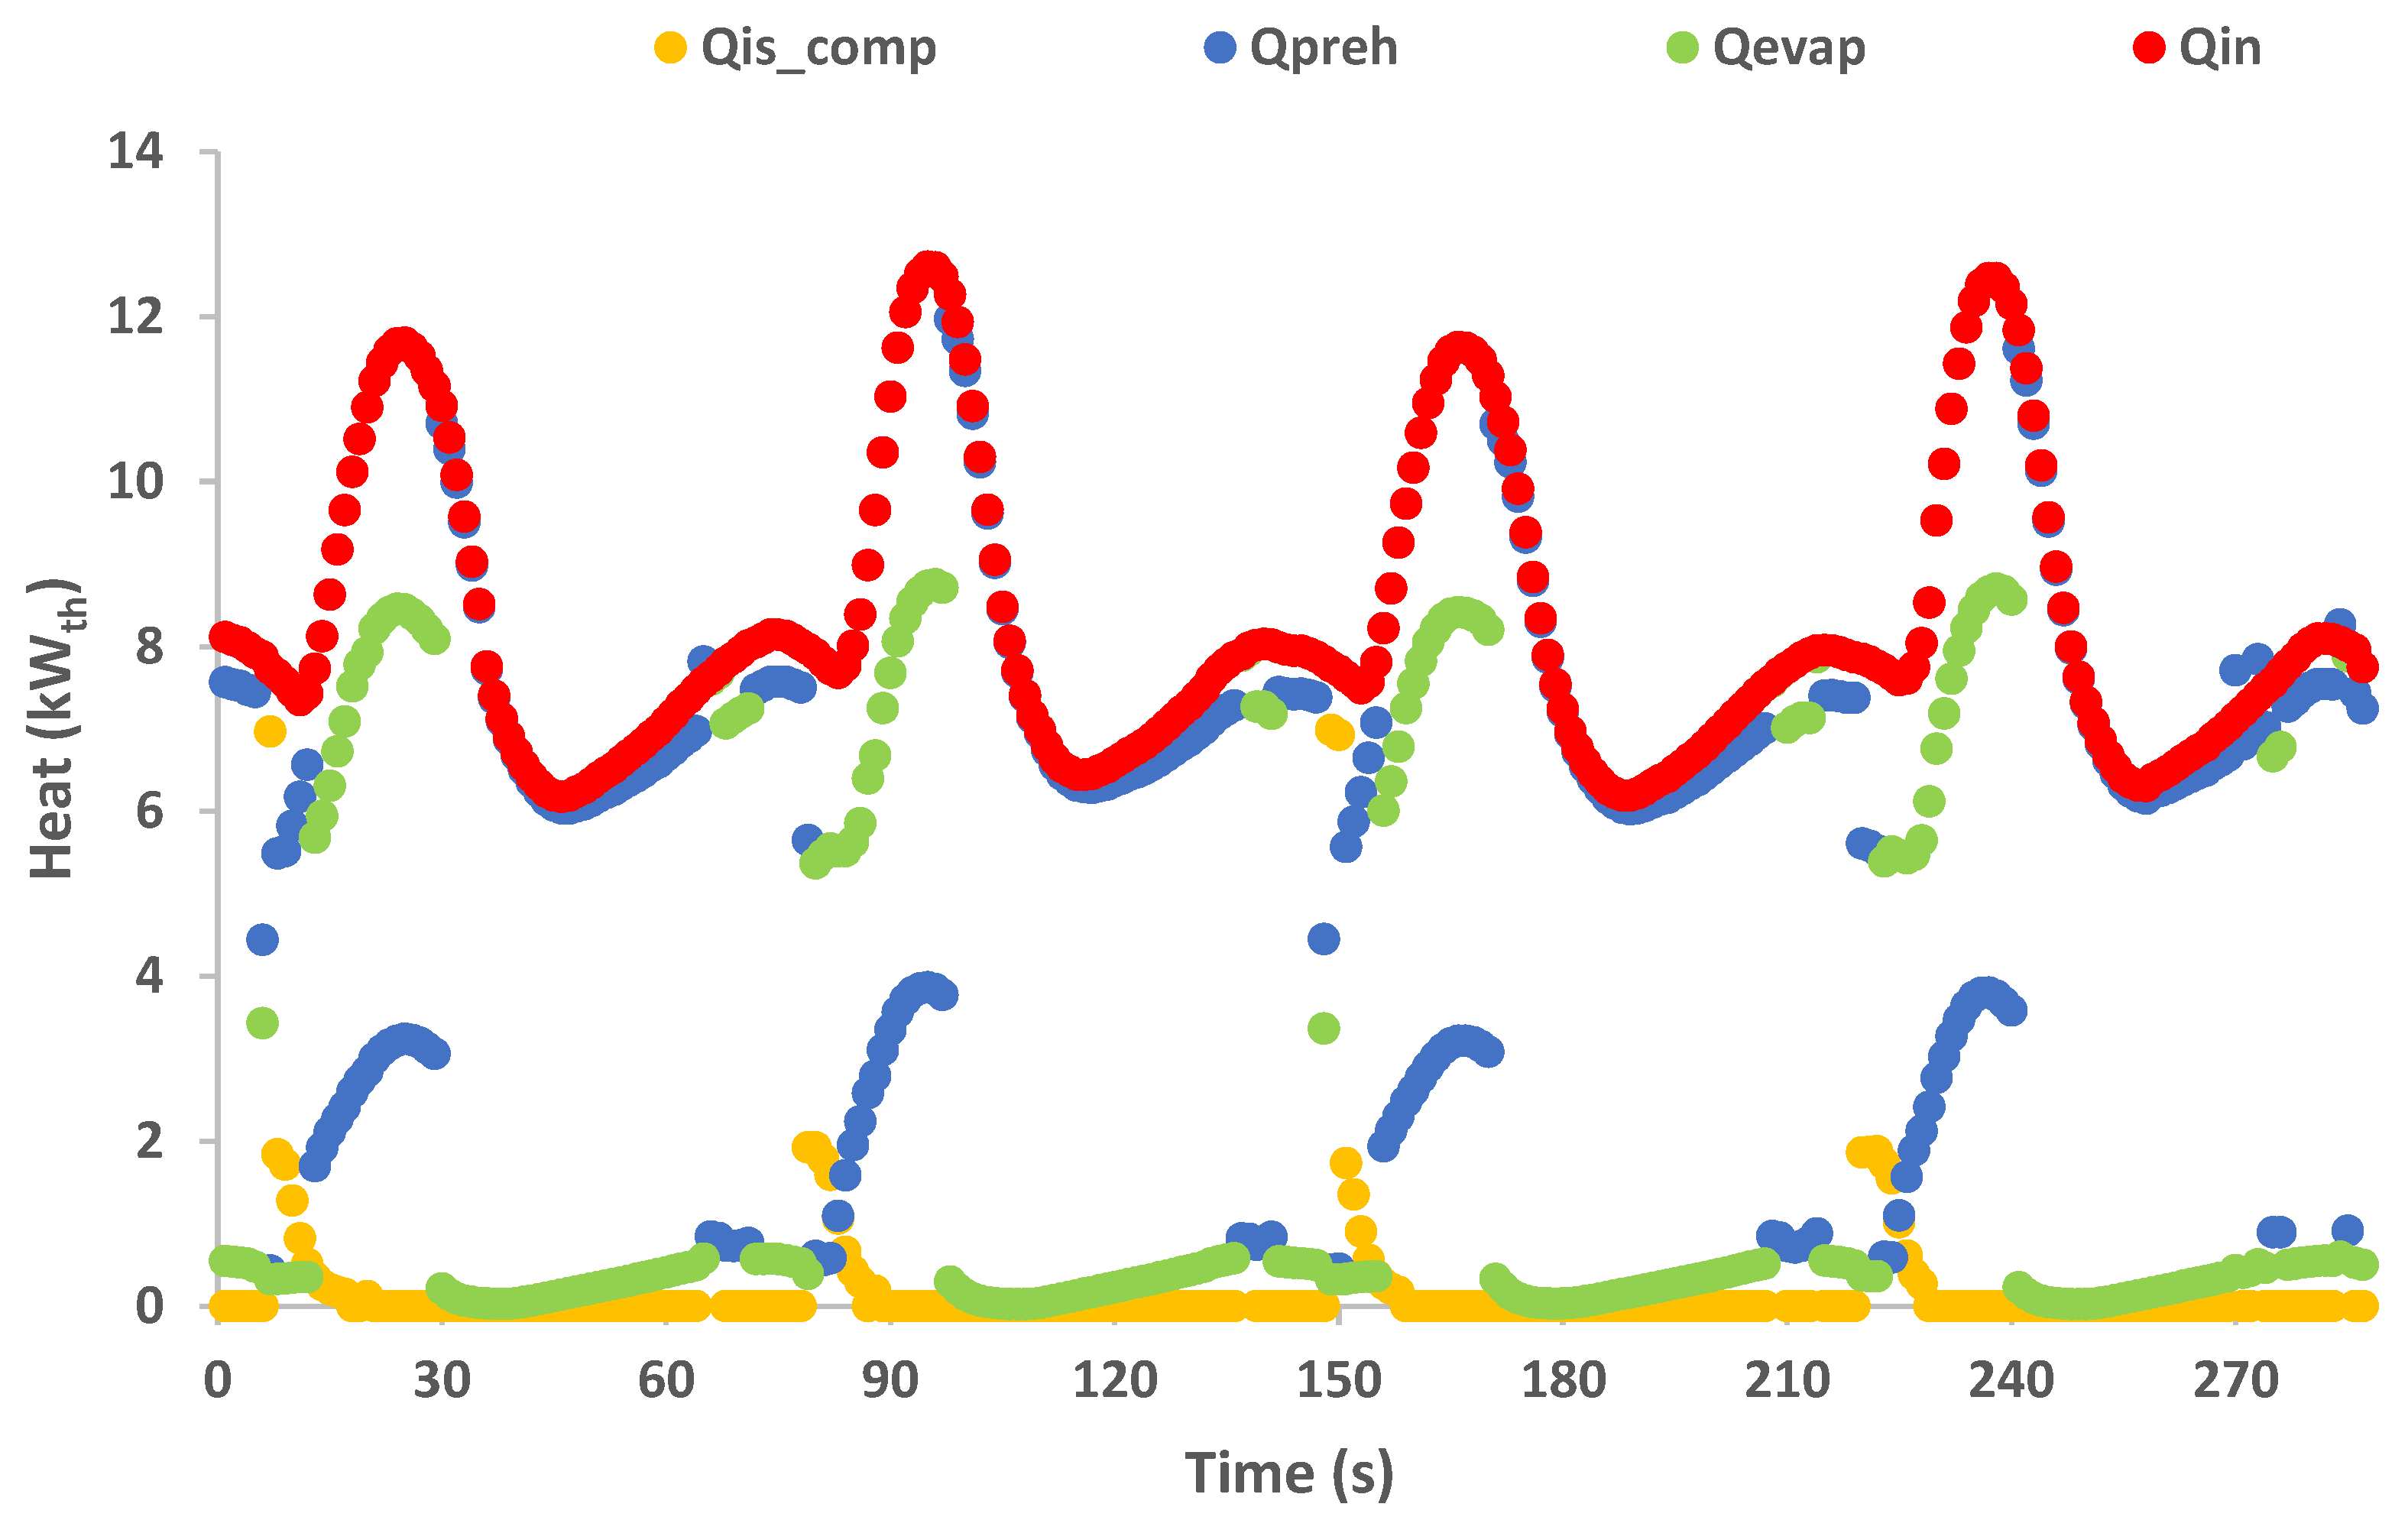
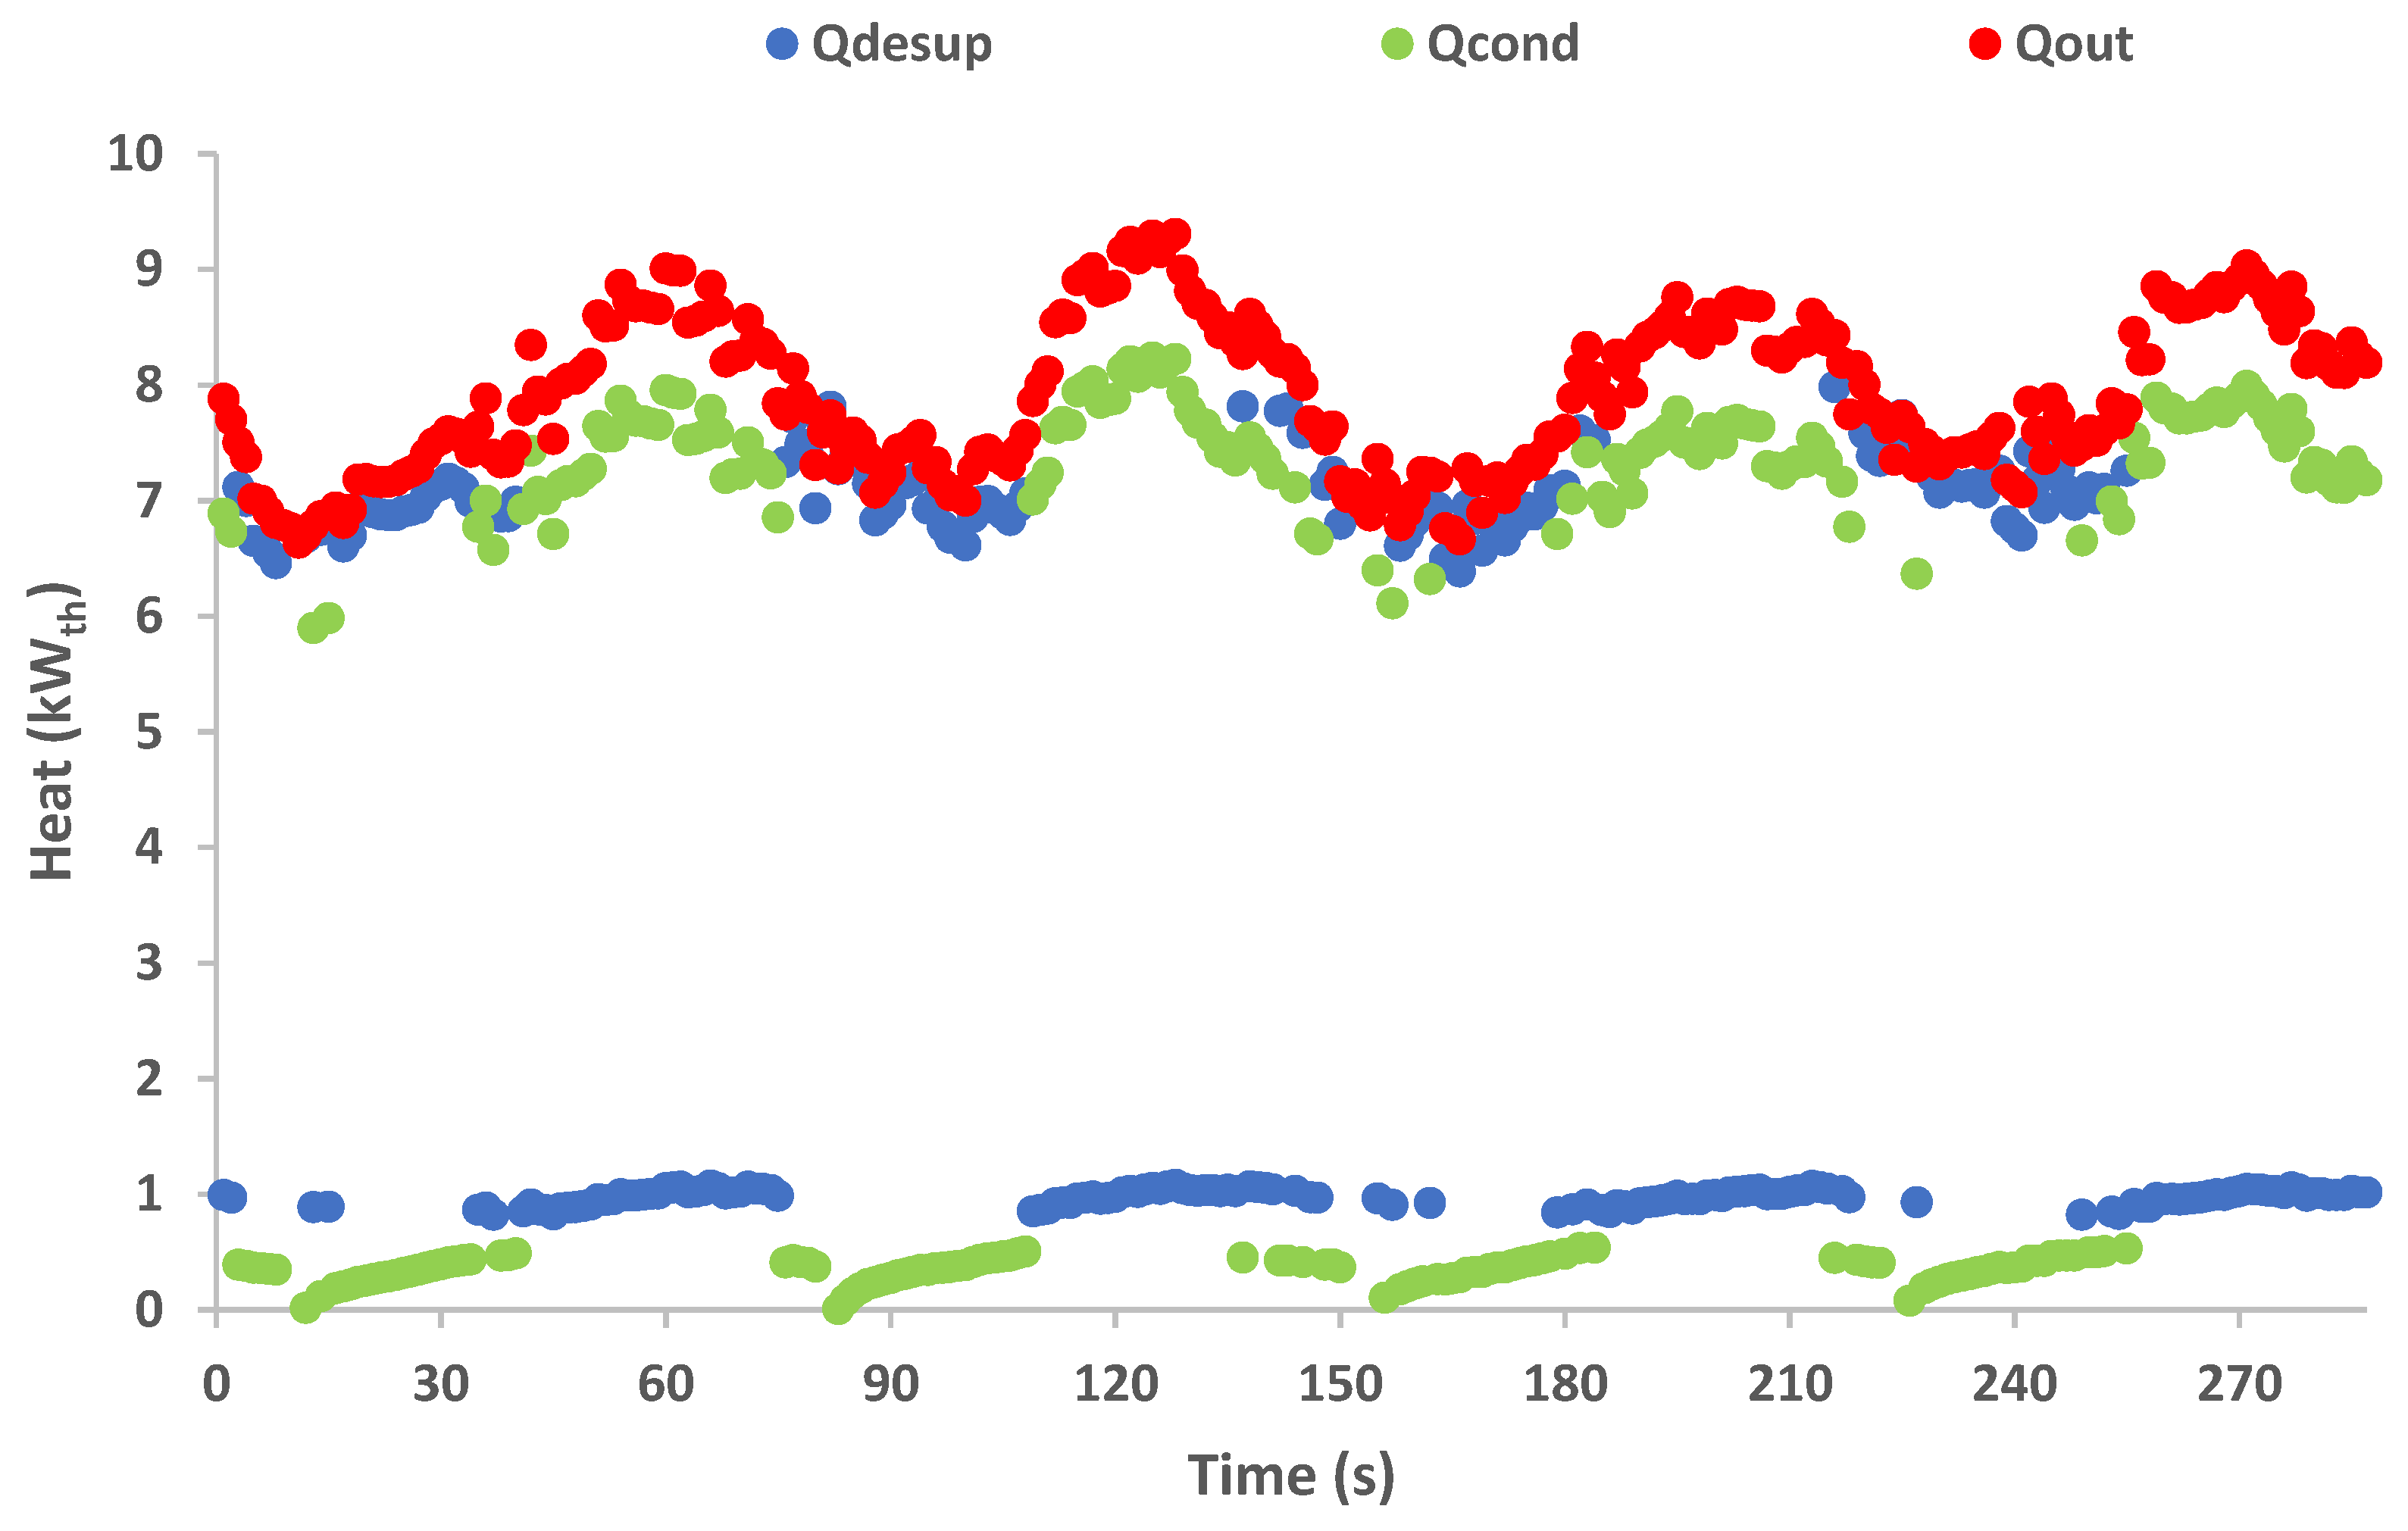
The current section includes the calculation results of the thermal fluxes of the different individual parts of Qin and Qout as they are presented in the graphs of Figure 16 and Figure 17, respectively. As the plots present two thermal cycles, Qin shows a sharp augmentation during the first half of each cycle due to the intense evaporation process taking place during this phase of the cycle. The latter is confirmed by the high portion of the Qevap at the same period, while the Qpreh follows the same pattern with lower values. It is notable that at the beginning of each cycle, or after the switching phase, Qiscomp instantly increased to its maximum point, followed by a sharp decrease, while it dropped to a zero value after a few seconds. The latter is based on the isochoric compression phenomenon, which takes place during the beginning of each cycle, accompanied by the sharp increment of the high pressure in the same period as analyzed in the previous section. As soon as the high pressure starts to decrease, the phenomenon is finished, and normally, Qiscomp has zero values. Qout is almost equal to the Qdesup for the first half of each cycle since, during this period, the condensing process takes place entirely in the desuperheater heat exchanger, and the condenser module has a negligible cooling effect. However, during the second half of each working cycle, the increased condensing load cannot be handled by the desuperheater module. During this phase the desuperheater cools the refrigerant vapor close to the saturation point, as discussed earlier, and the condensation takes place in the main condenser, which has the main portion of the heat rejected to the ambient air. The reason that the peaks of Qin and Qout do not coincide is based on the thermal inertia of the configuration, which can split the investigated system operation into the charging and the discharging phases. During the charging phase the system absorbs high amounts of heat by the heat source due to the evaporation process during the first half of each cycle, while during the second half of each cycle, the produced refrigerant vapor accumulated in the low-pressure circuit leads to the increased condensing load.

3.3. Expander Analysis

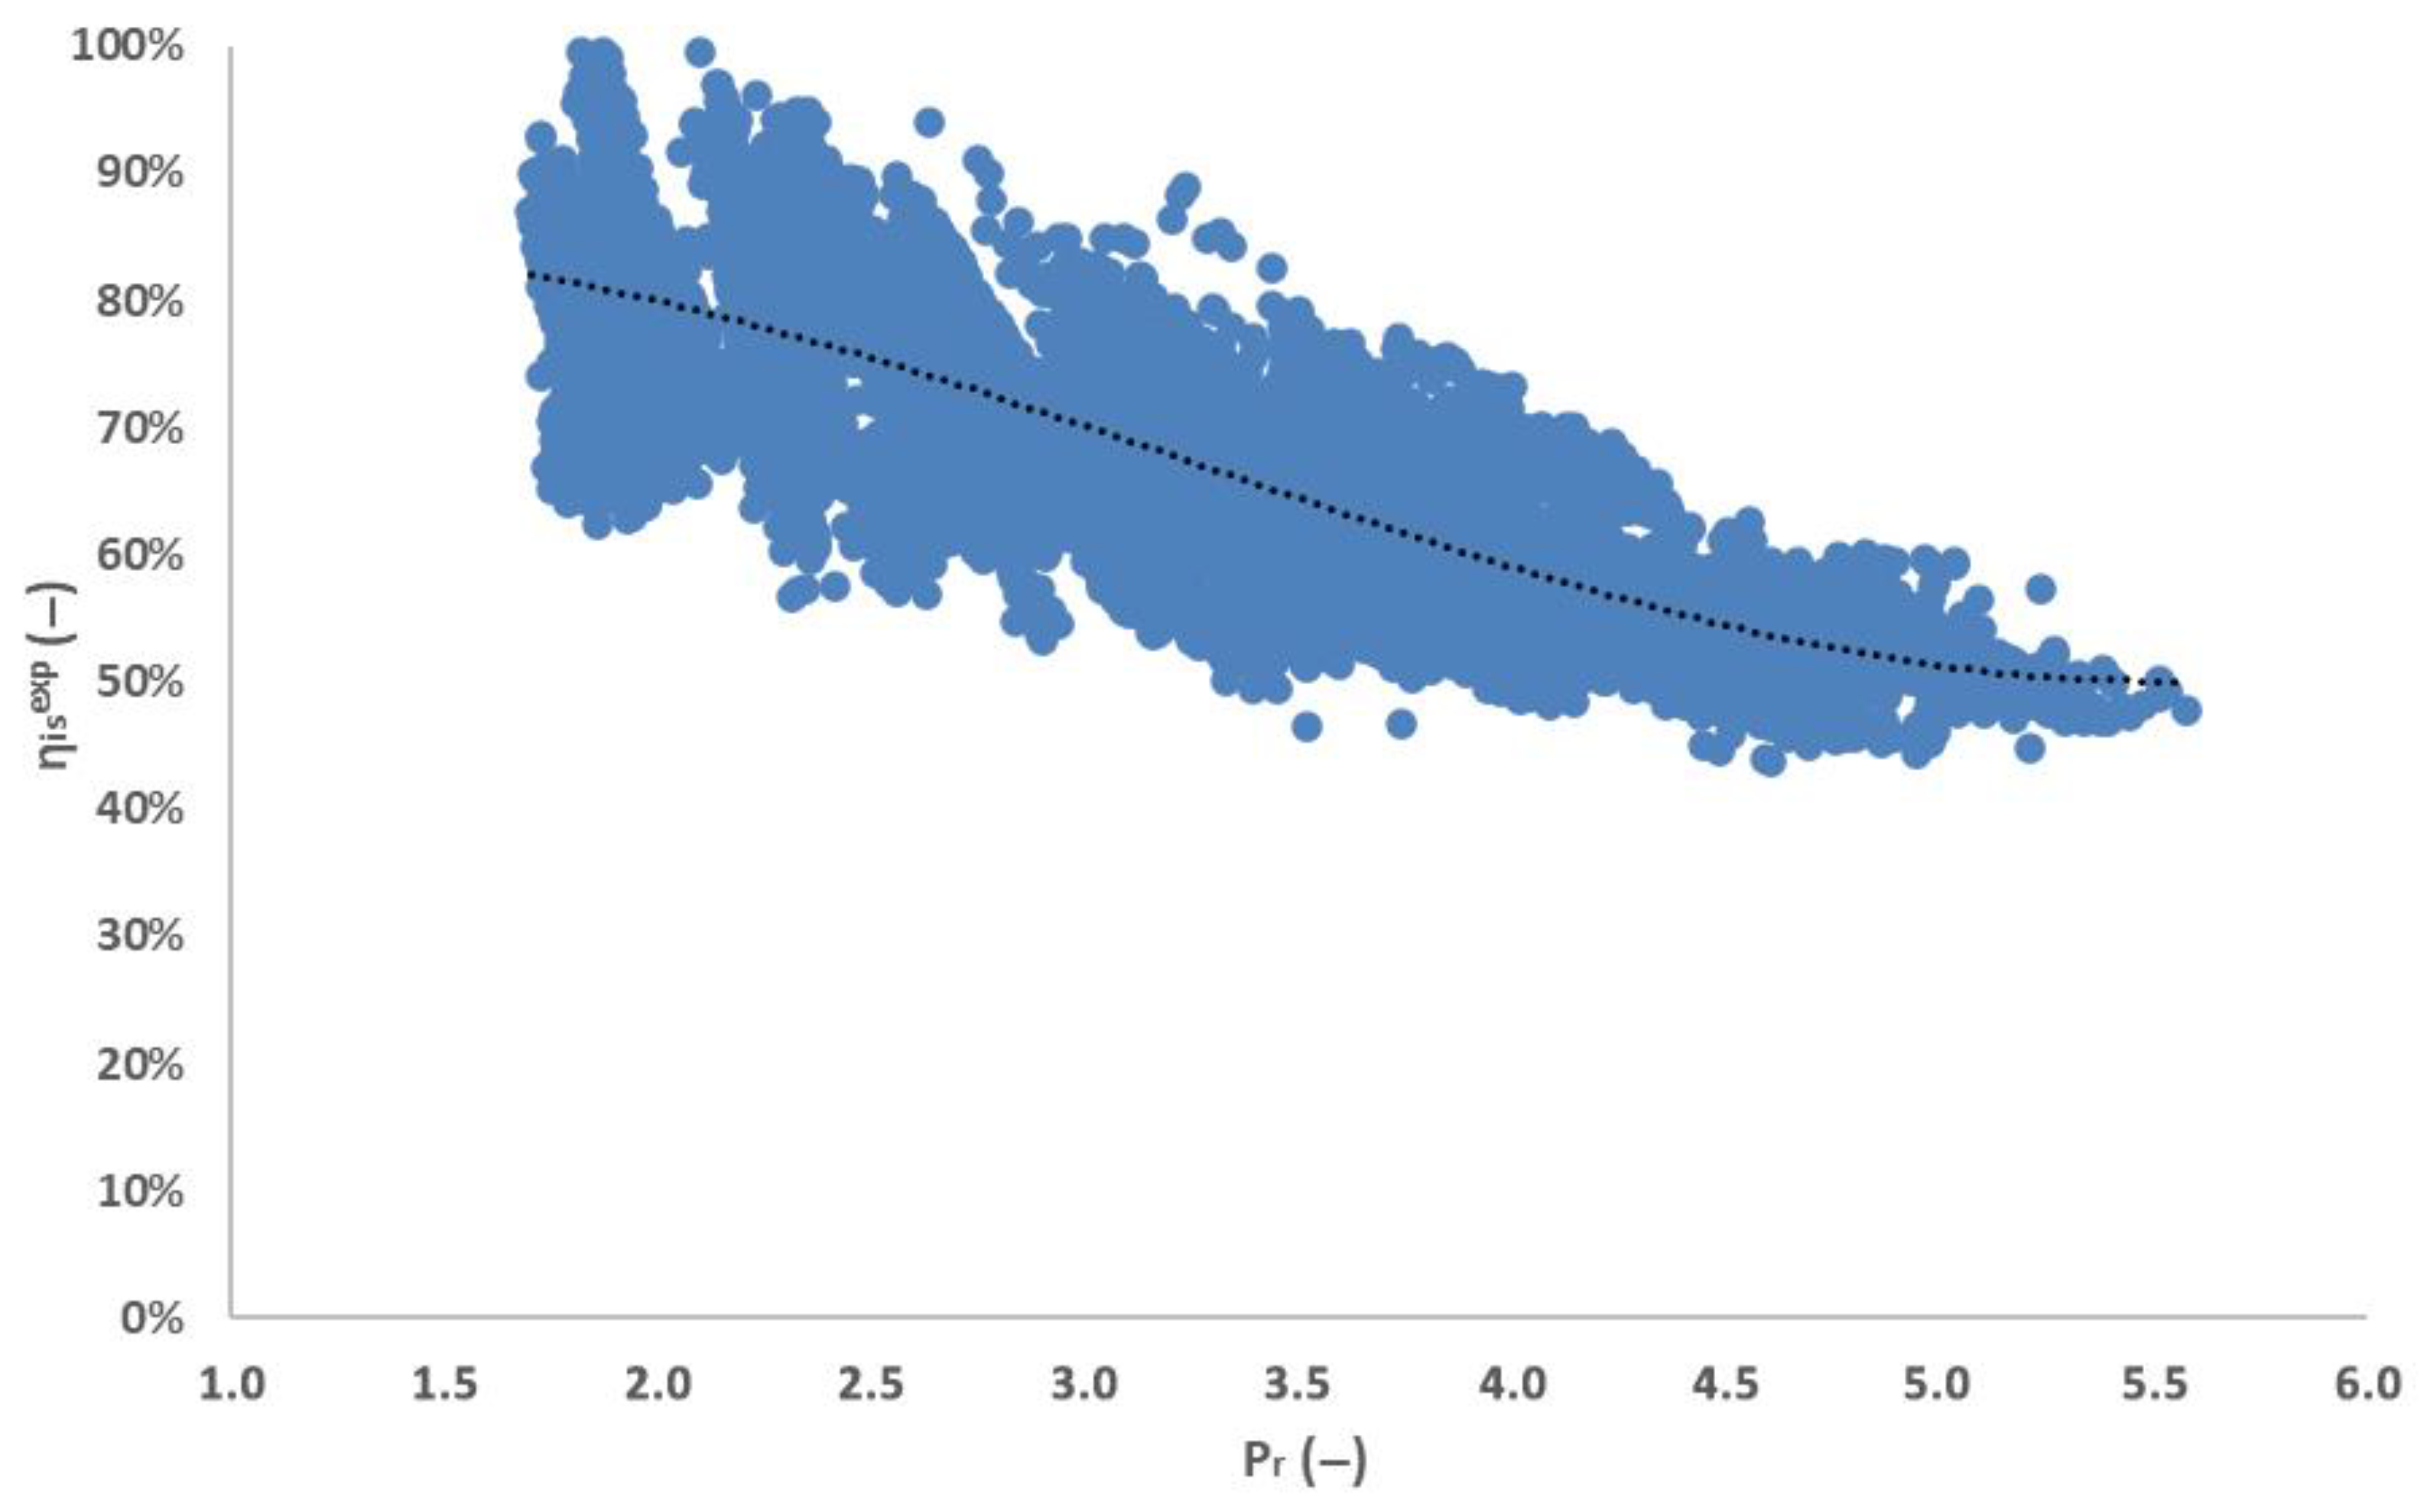
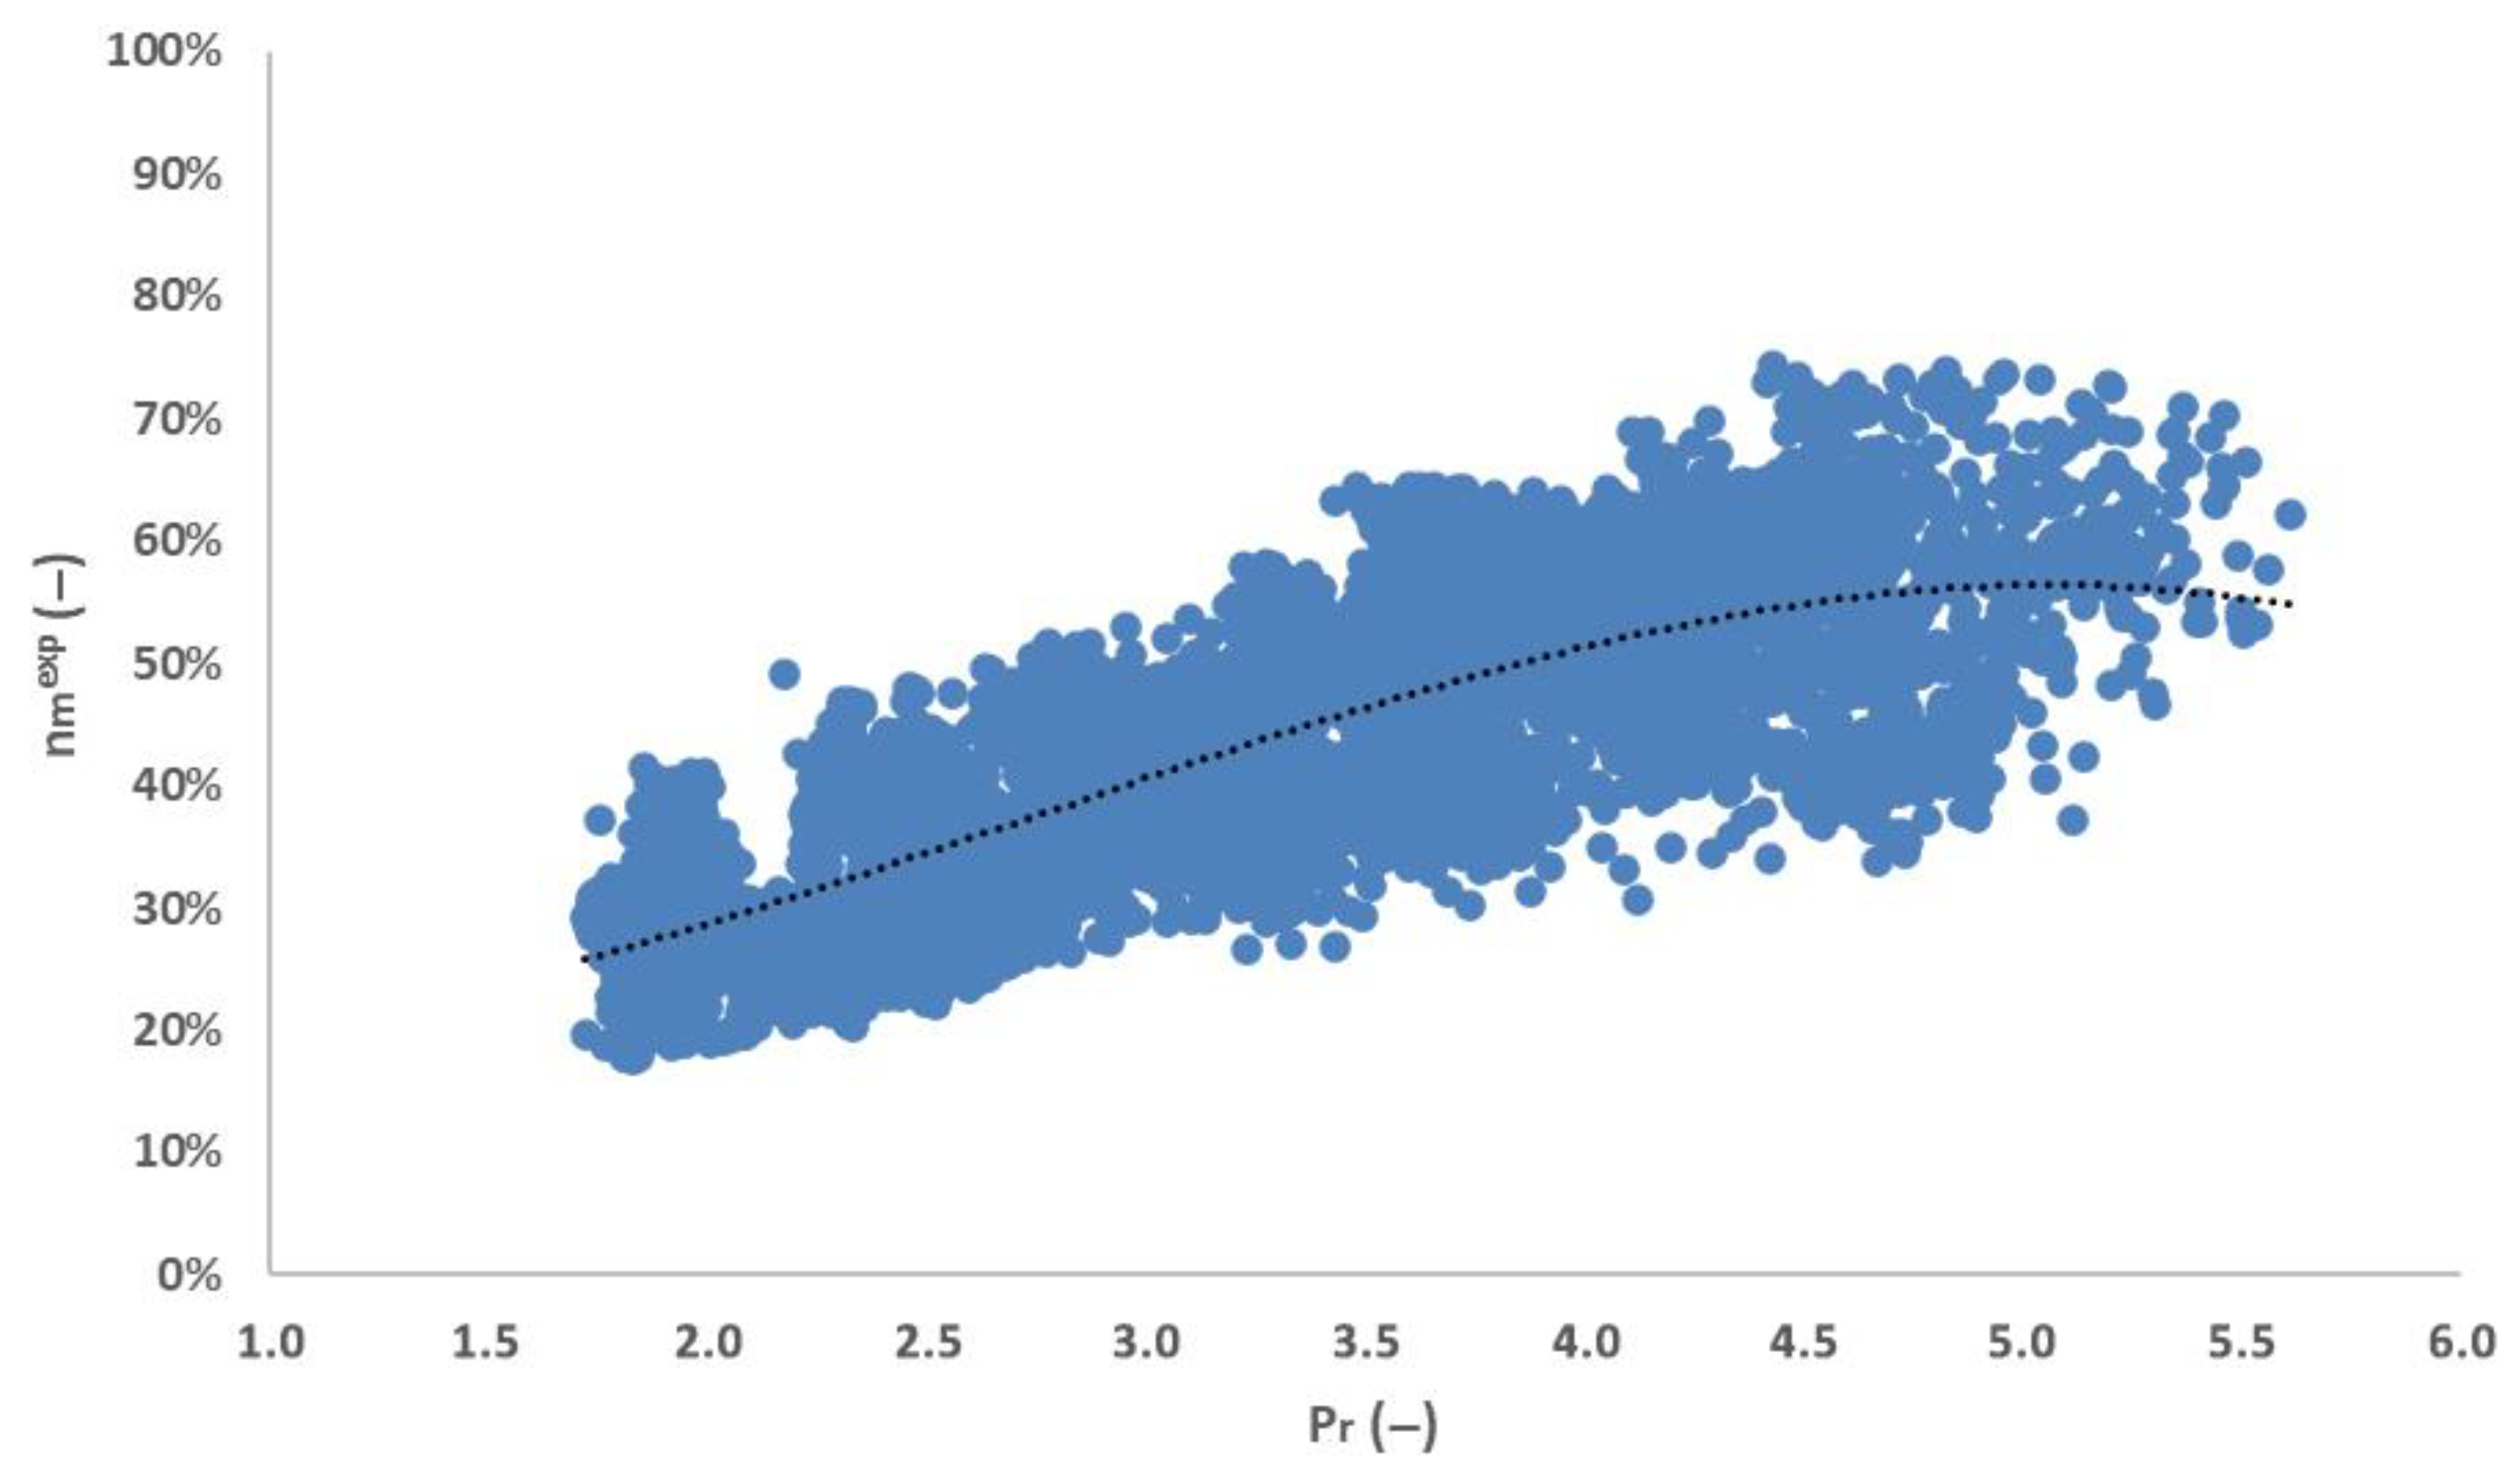
From the derived experimental data, the figures of ηisexp and ηmexp are calculated for the expander arrangement of the investigated prototype, and the resulted values for all the tested conditions are presented in correlation to the expander pressure ratio (Pr) in the graphs of Figure 18 and Figure 19. Using the extrapolation method for the data presented, the isentropic and mechanical efficiency of the evaluated expander can be expressed by the following formulas, which are considered acceptable in the current analysis, having root mean square values over 70% for the examined sample of measurements. The derived formulas are used in the evaluation performance results given in the following sections.
η i s e x p = 0.008 · P r 3 0.075 · P r 2 + 0.131 · P r + 0.776
η m e x p = 0.008 · P r 3 + 0.062 · P r 2 0.047 · P r + 0.194

3.4. Energy and Exergy Performance Analysis

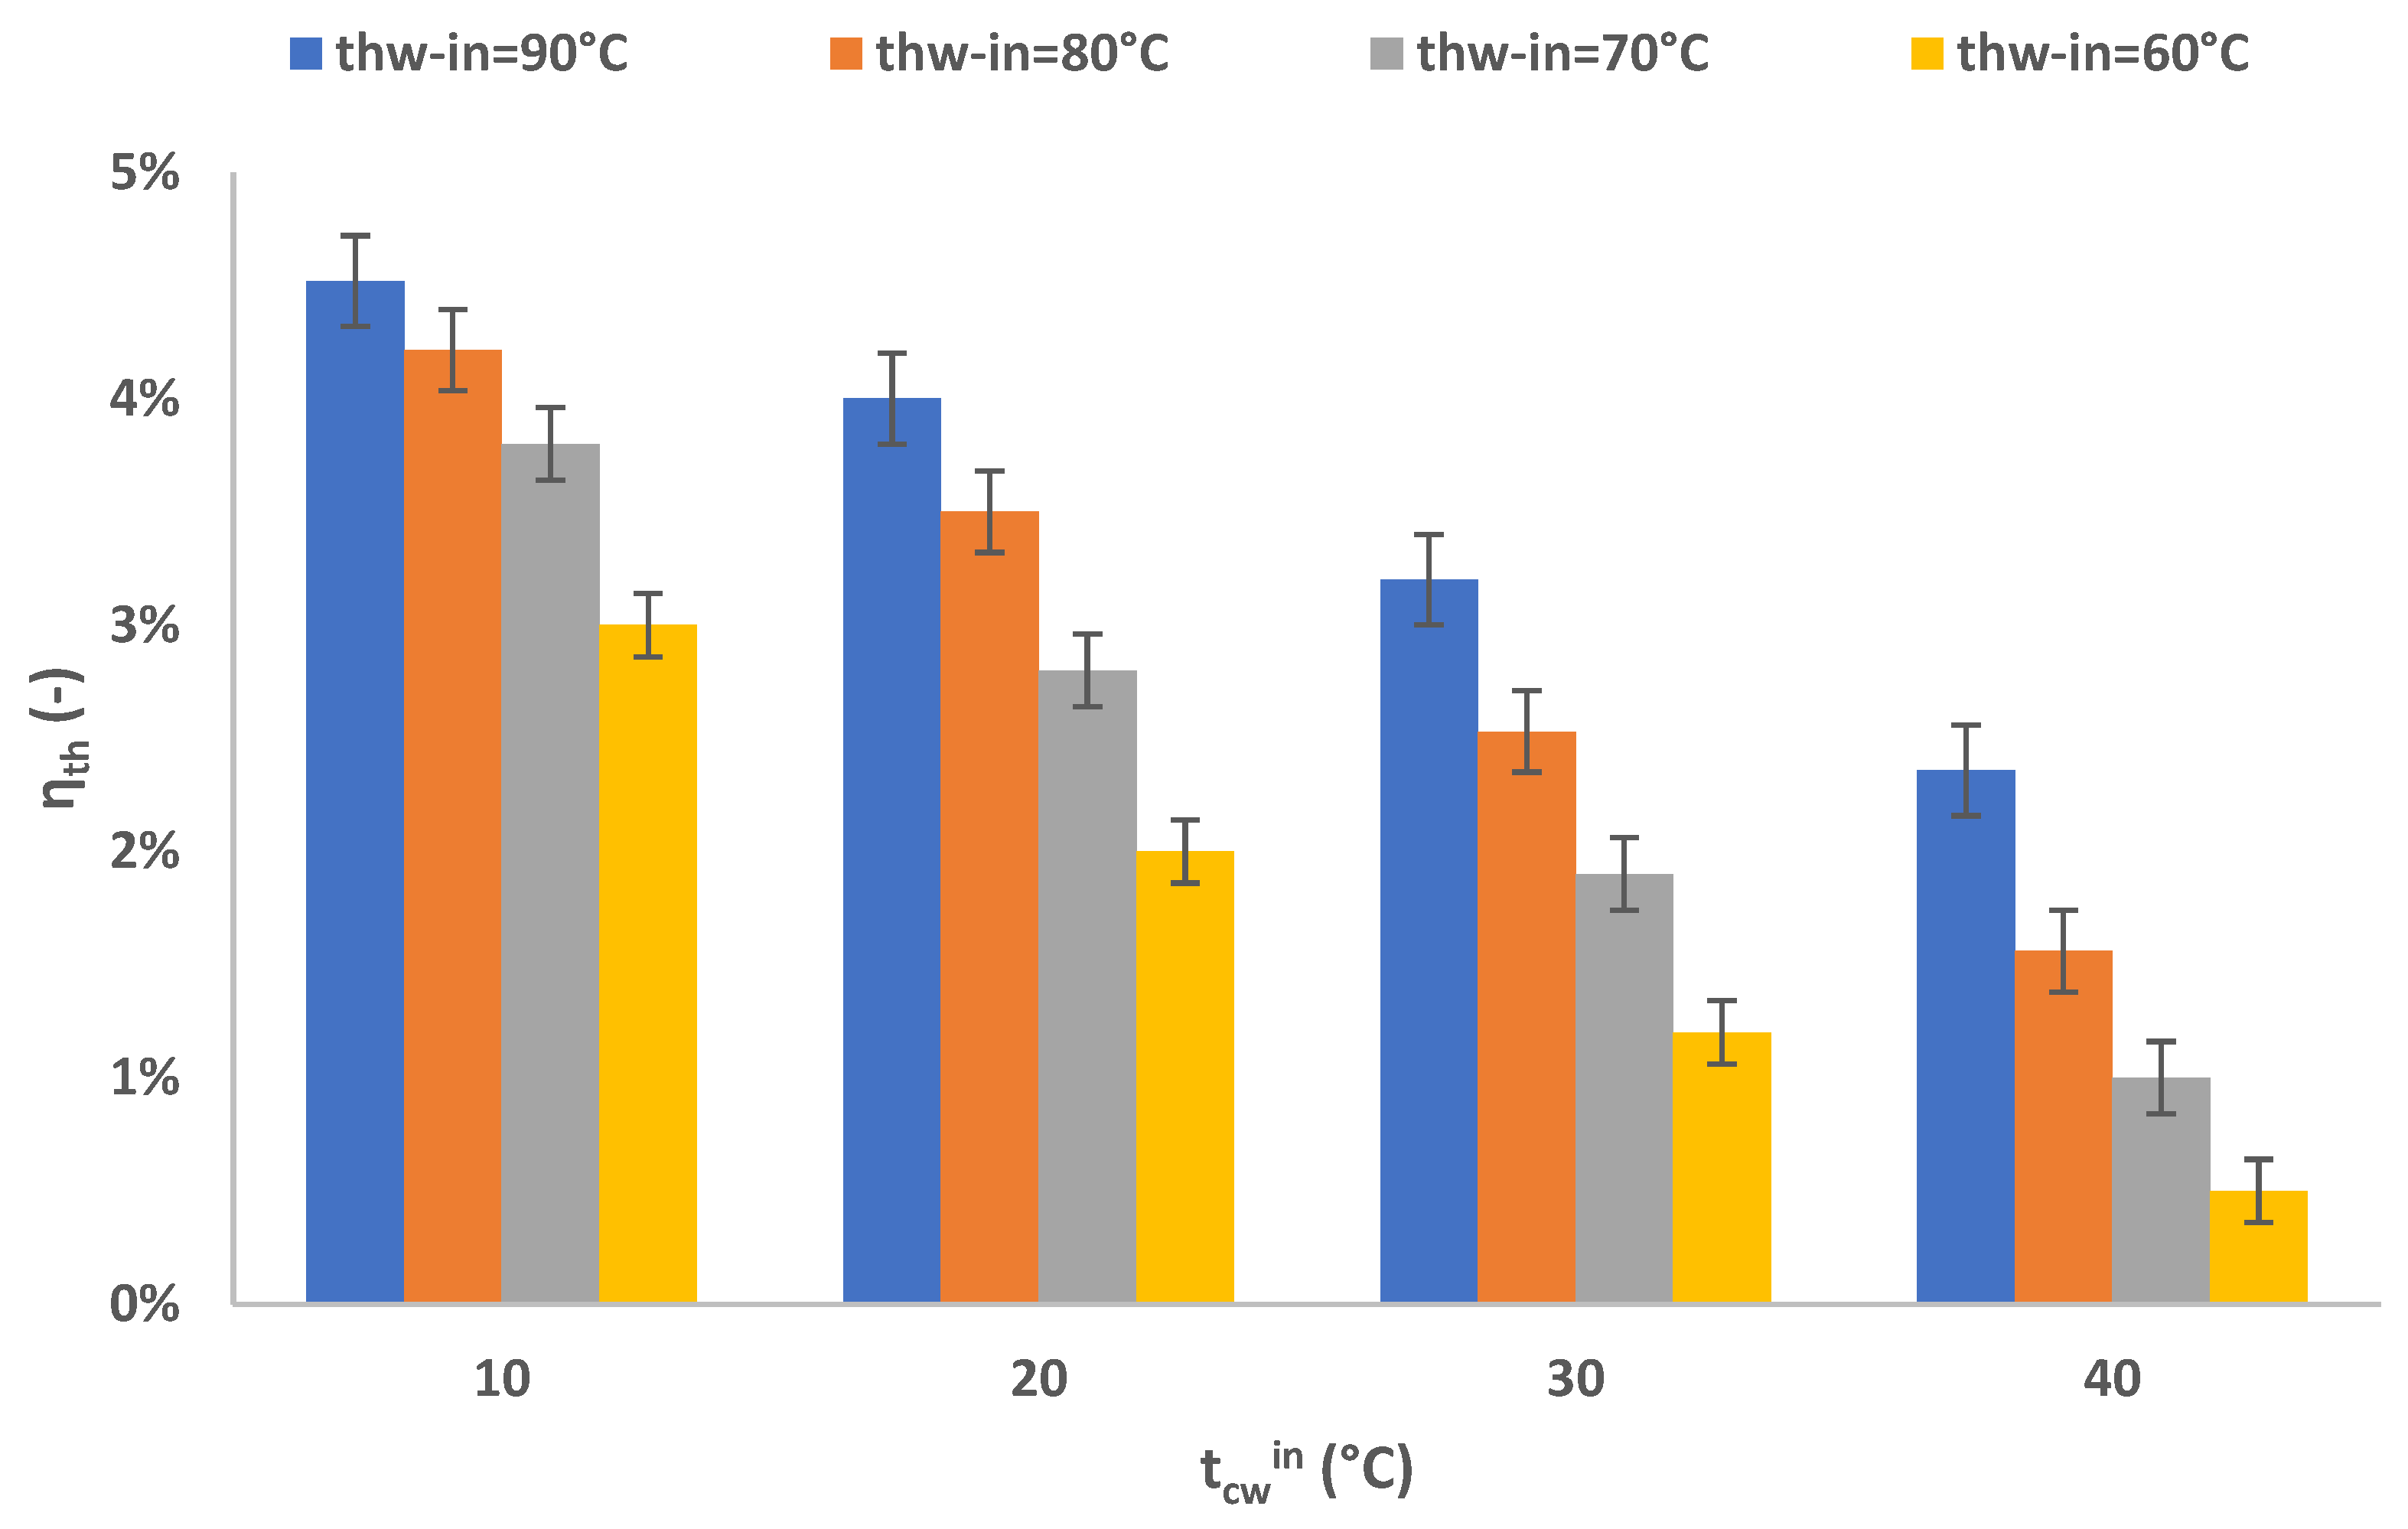
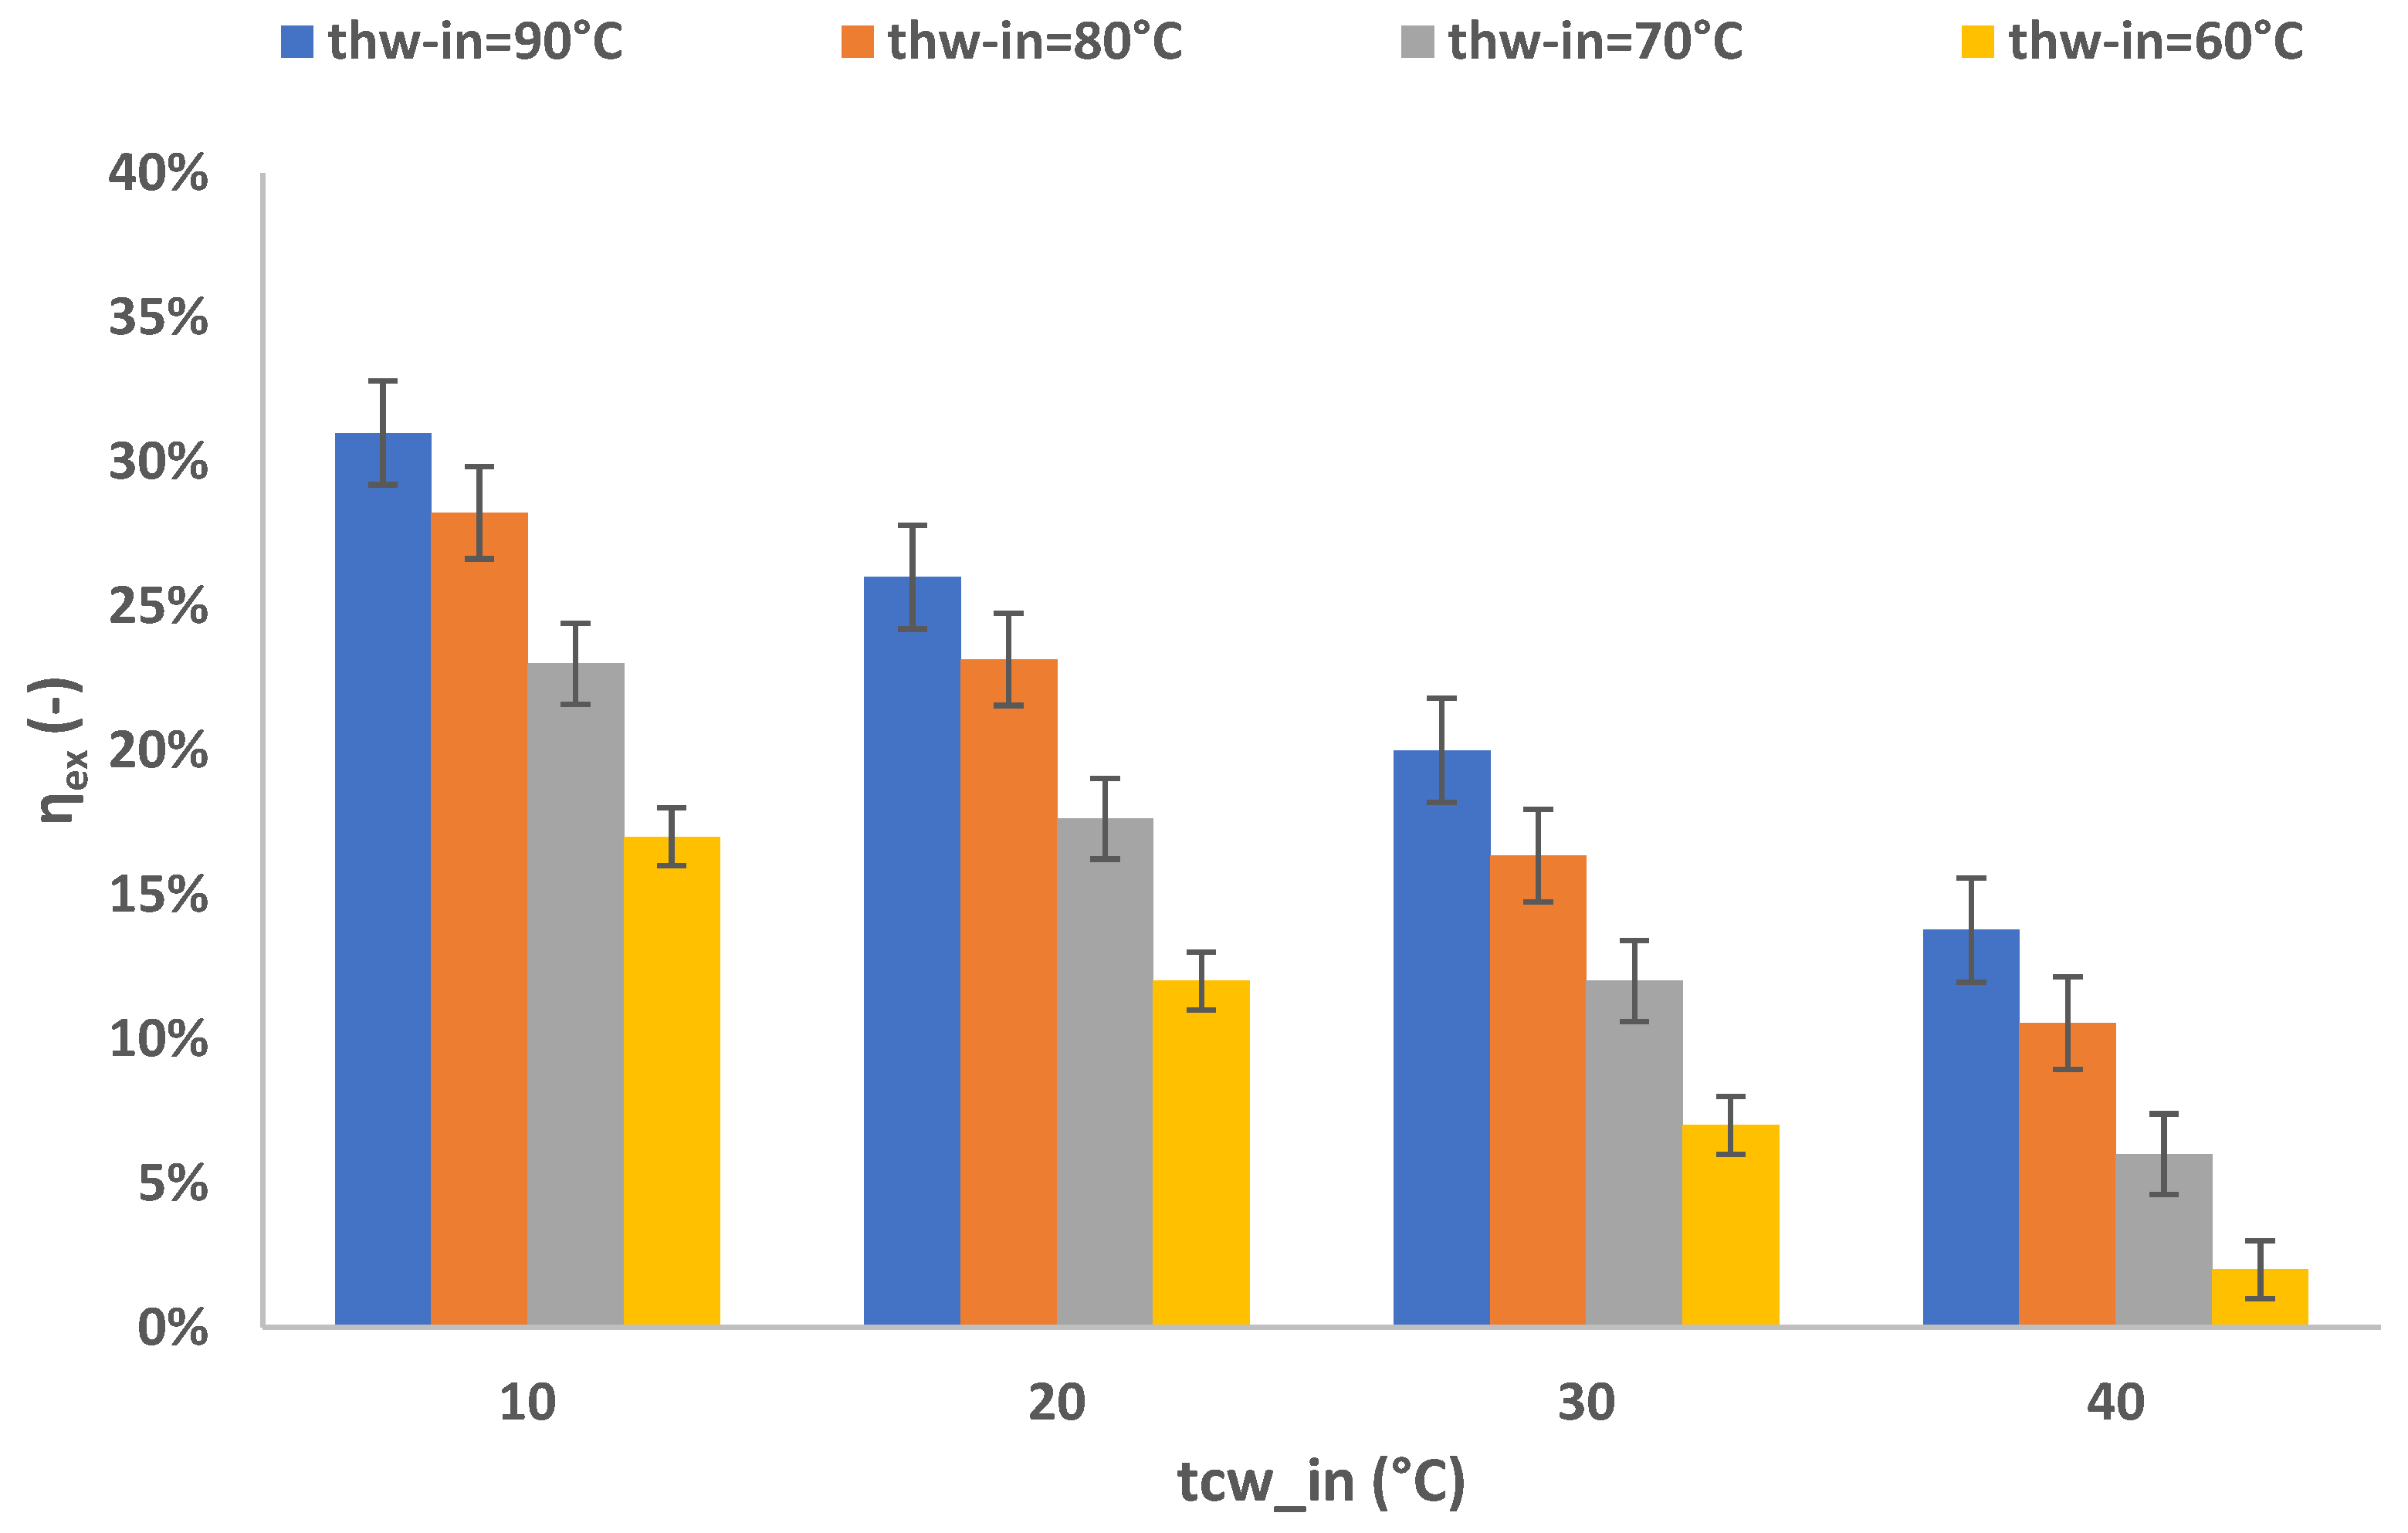
In this section the energetic and exergetic parametric performance evaluation of the examined PRC configuration is conducted. More specifically, for each pair of the four different heat source and heat sink water temperature levels (thwin, tcwin), the thermal efficiency (ηth) and exergetic efficiency (ηex) rates of the system are calculated using the experimental data, and the results are presented in Figure 20 and Figure 21, respectively. The graphs show that both ηth and ηex efficiency figures, as expected, are dependent on the heat source and the heat sink temperatures since the latter affects the pressure ratio. The extracted results confirm that the higher the difference between thwin and tcwin is, the higher the efficiency is, and vice versa. The highest performance figures are given for the thwin = 90 °C and tcwin = 10 °C working conditions, in which the maximum time-averaged thermal efficiency is 4.5%, while the time-averaged exergy efficiency calculated is 31%, respectively. It is notable that even for cases with low temperature differences between the heat source and heat sink, the tested prototype was able to operate and generate power, even with relatively low performance values, since for the working pair of thwin = 60 °C and tcwin = 40 °C, thermal efficiency resulted in nearly 0.5%, and the corresponding exergy efficiency was at 2%. The averaged calculated relative uncertainty is for ηth and for ηex, and the resulted maximum relative uncertainty is for ηth and ηex, respectively. The uncertainty measurements are summarized in Table A1 of the Appendix A.

3.5. Simulation Models Validation

3.5.1. Verification of the PRC Simulation Model

The simulation model developed for the performance evaluation of the investigated PRC system is compared in this section with the corresponding experimental findings. For all the examined working condition pairs of thwin-tcwin, the values of ηth are given in Table 2, extracted by the experiment and the simulation model, respectively. The results show that the simulation model is close to the experimental figures, having maximum absolute and average absolute deviations of 9.2% and 4.0%, respectively, compared to the experiment. The latter deviation is considered acceptable for the purposes of the current study, which validates the simulation model.

3.5.2. Verification of the ORC Simulation Model Used as the Baseline

The analyzed novel PRC system should be compared in terms of efficiency with the conventional ORC topology to emphasize the potential performance advantage the disengagement from the electrically driven refrigerant pump offers to the Rankine power generation systems. In this context, a simulation model for the operation of a typical ORC system is developed, and the performance results are compared to the corresponding experimental figures from the work of Eyerer et al. [34]. The comparison results are summarized in Table 3, and the derived maximum and average absolute deviations of 3.0% and 1.9%, respectively, show that the developed model is verified in reference to the literature data for the same working conditions.

3.6. Performance Comparison to the Conventional System

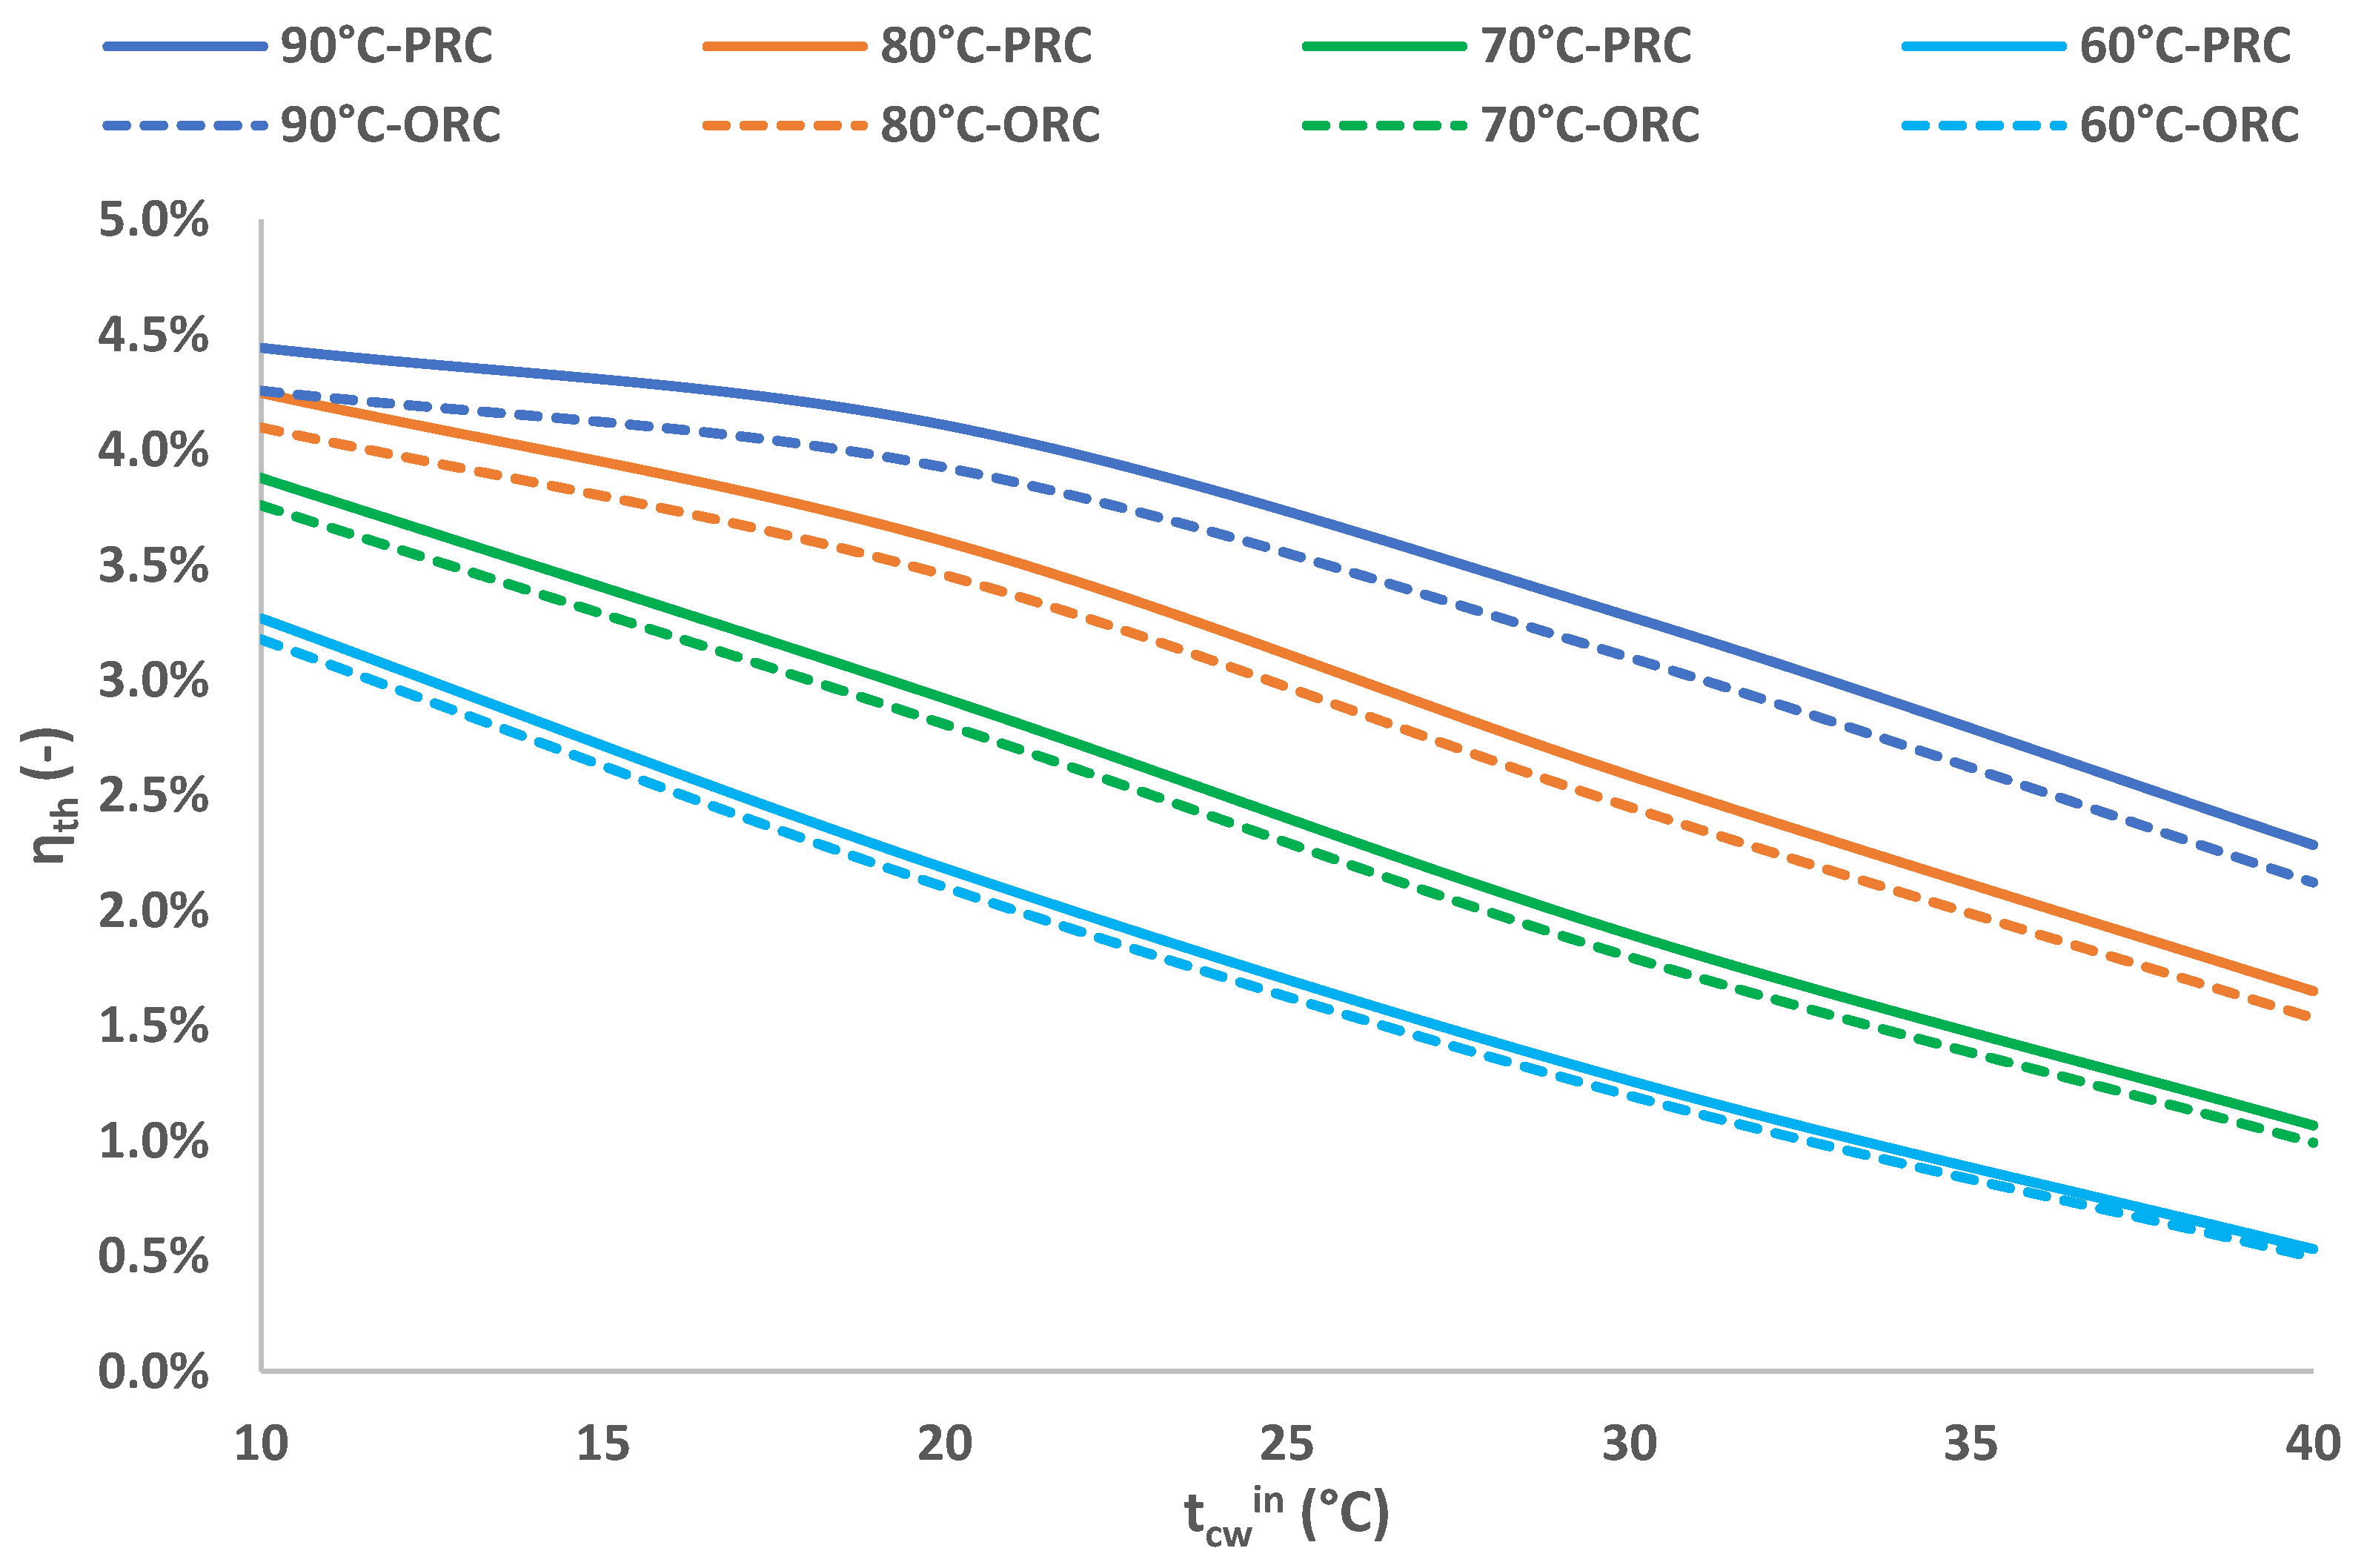
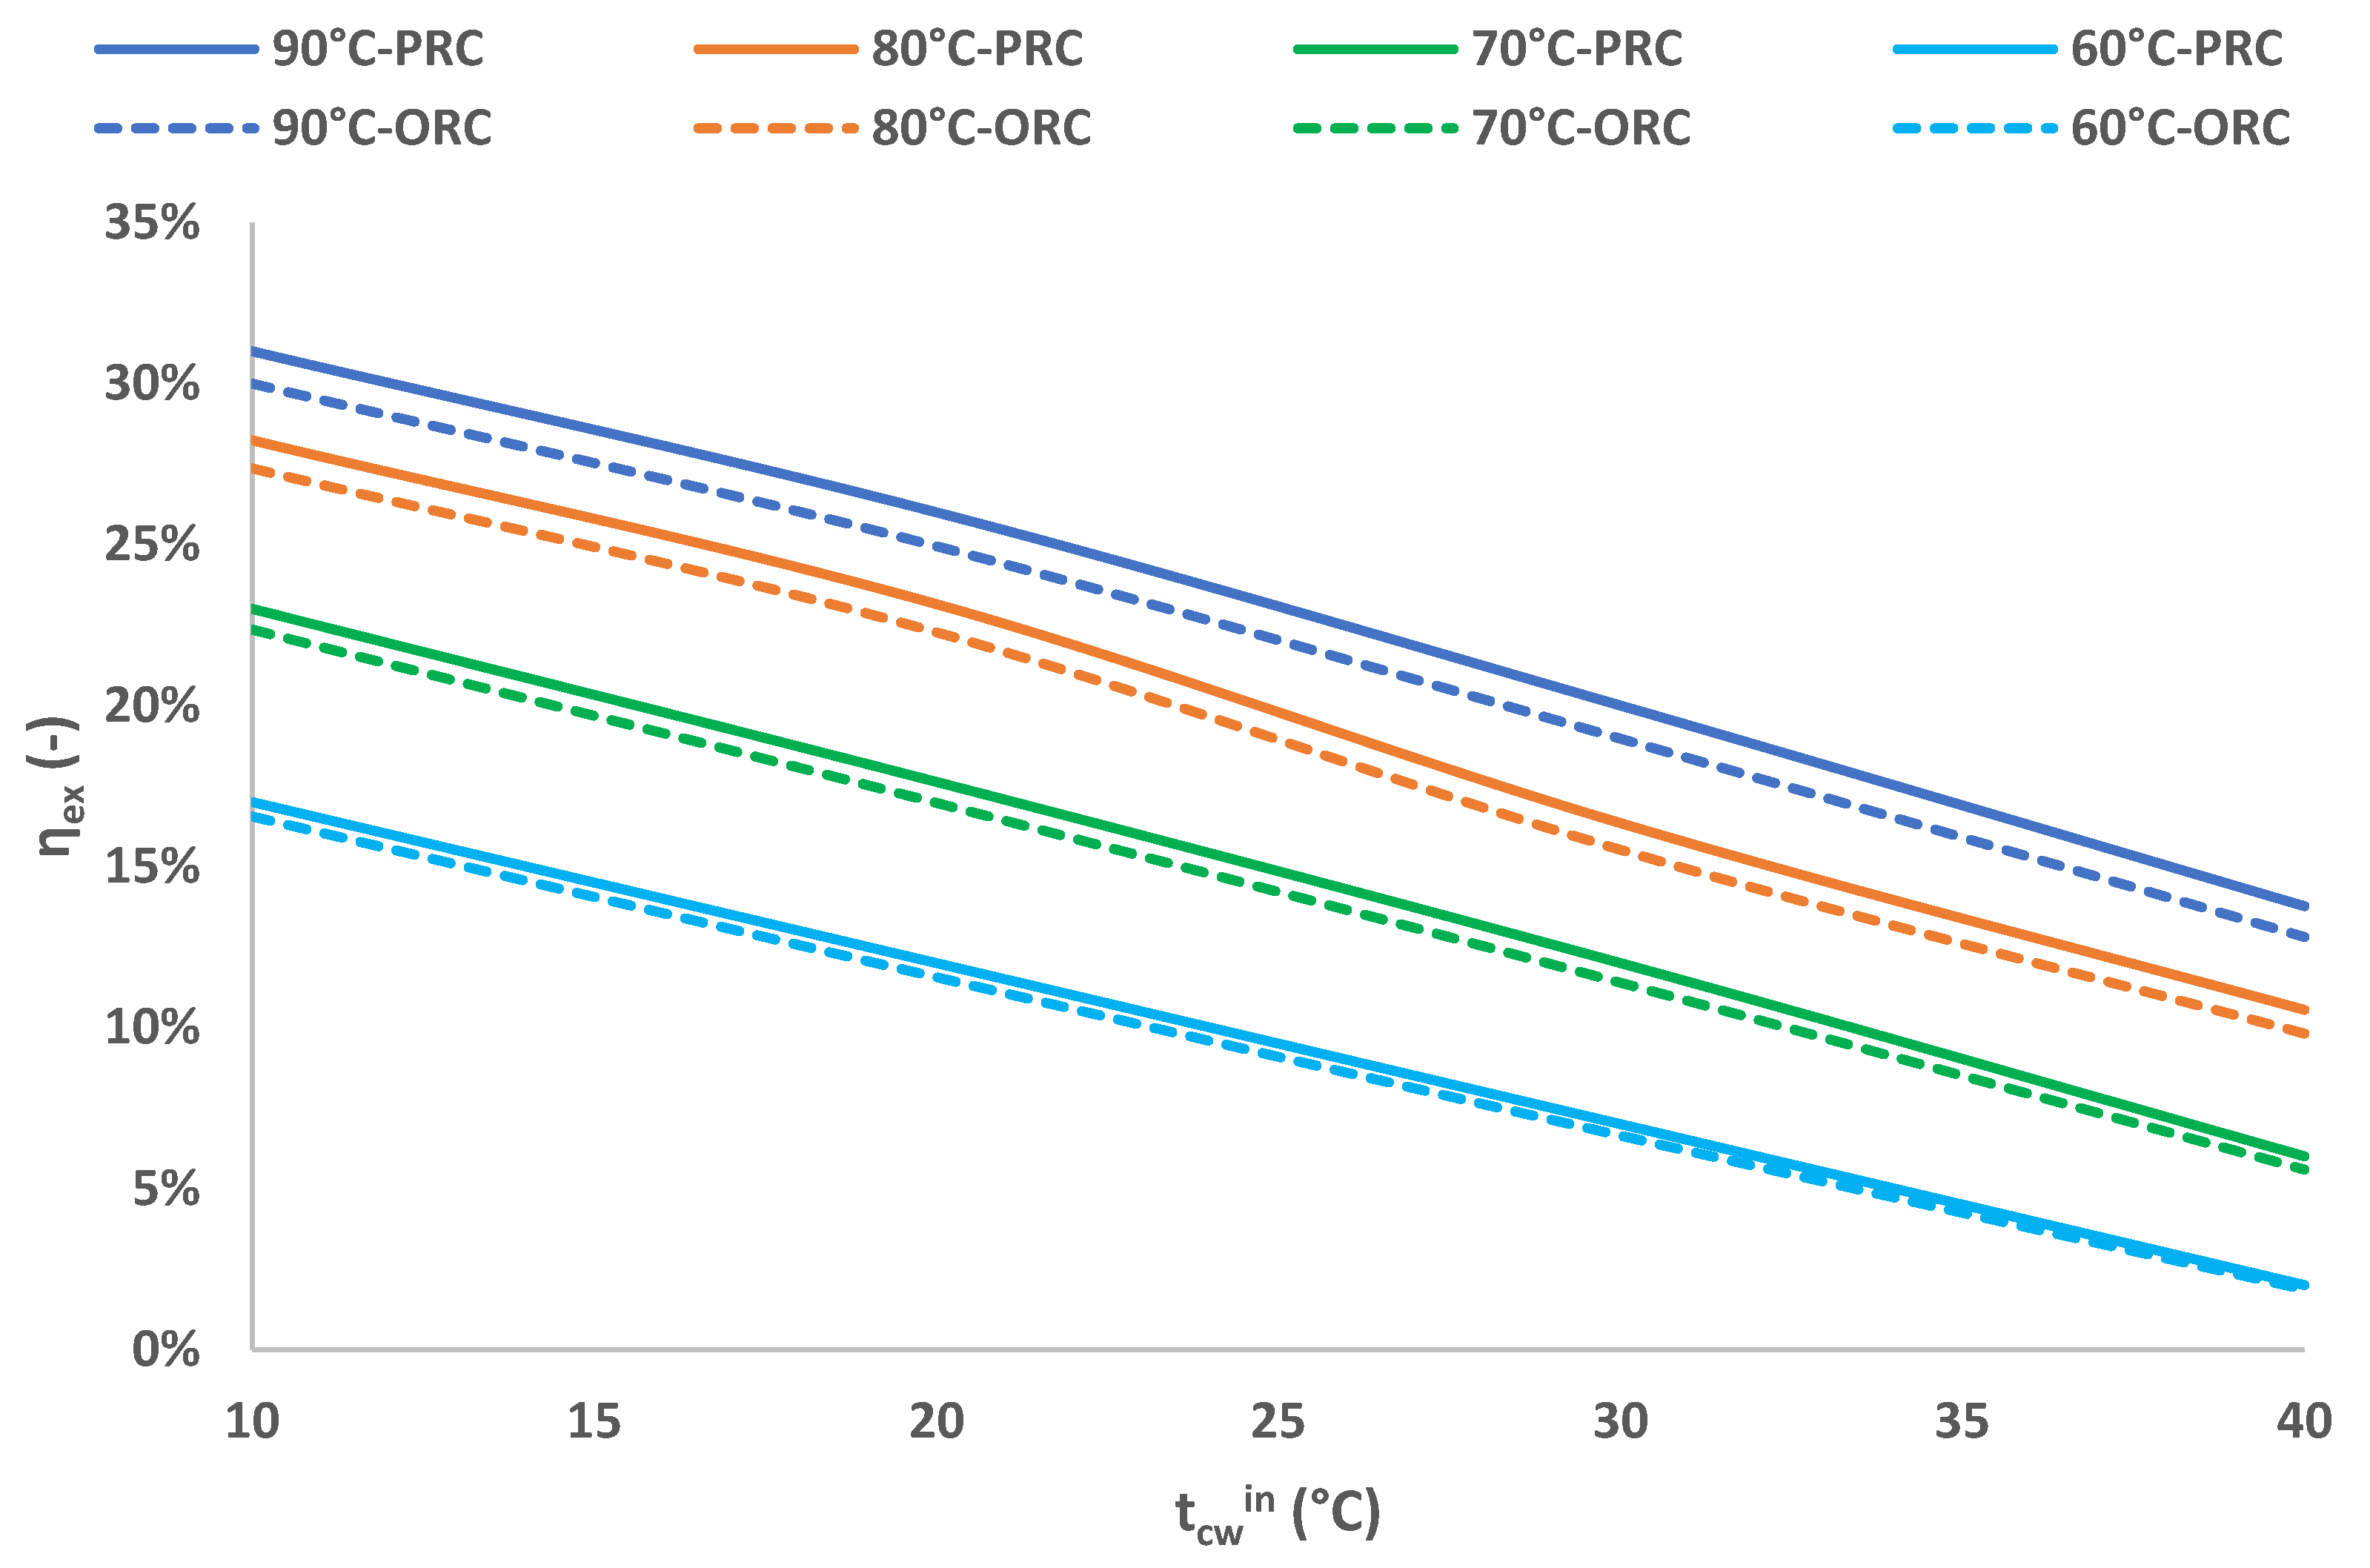
In order to quantify the overall benefit in the performance of the investigated PRC technology, it is important to compare the novel examined configuration with a conventional ORC topology operating in the same working conditions. In this context, using the simulation models developed, for the four thwin temperatures of 60, 70, 80 and 90 °C and tcwin ranging between 10 and 40 °C, the ηth and the ηex are calculated for both the PRC and the ORC cases. The results of the parametric analysis are presented in the graphs of Figure 22 and Figure 23. The results show that both examined power generation systems follow approximately the same pattern in terms of performance figures variation in relation to the operating conditions since both ηth and ηex decrease as the thwin rises or the tcwin decreases accordingly. For all the examined cases, the PRC system results in higher efficiency figures compared to the conventional ORC solution. The deviation between the two cases shows increased values in both tcwin and thwin. More precisely, for the case of tcwin = 40 °C and thwin = 90 °C, the ηth and the ηex calculated for the PRC are higher by 7.7% and 7.5%, respectively, than the case of the ORC. The latter implies that the PRC configuration has increased efficiency impact for higher heat sink temperatures and for higher heat source temperatures, as well.

4. Conclusions

In the current study a novel PRC configuration was experimentally tested to evaluate its performance and quantify the benefit of the thermal compression concept in comparison with a conventional ORC system as the baseline. The methodology followed includes the energetic and exergetic efficiency figures calculation for the different test conditions, plus the parametric evaluation of the examined PRC topology for different heat source and heat sink temperatures. The derived results are compared with the corresponding efficiency values of the baseline ORC system. The performance evaluation is conducted using simulation models developed in MATLAB, which are validated with the experimental data. The most important findings need to be noted are summarized below:
  • The experimental results of the pressure in the buffer tanks, the temperatures in the different points of the PRC cycle and the output power and generation speed show approximately the same variation patterns on every thermal cycle.
  • The examined configuration shows a relatively stable operation, with continuous power generation despite the switching phase, which inherently disrupts the constant refrigerant flow throughout the cycle.
  • Efficiency figures increase along with the temperature difference between the heat source and heat sink. For the thwin = 90 °C and tcwin = 10 °C working conditions, the maximum time-averaged thermal efficiency is 4.5%, while the time-averaged exergy efficiency was calculated at 31%, respectively.
  • Even for cases with low temperature difference between the heat source and heat sink, the tested prototype was able to operate and generate power, even with relatively low performance values, since for the working pair of thwin = 60 °C and tcwin = 40 °C, thermal efficiency was nearly 0.5%, and the corresponding exergy efficiency was at 2%.
  • For all the examined cases, the PRC system results in higher efficiency figures compared to the conventional ORC solution. The deviation between the two cases shows increased values along with the increment of both tcwin and thwin. More precisely, for the case of tcwin = 40 °C and thwin = 90 °C, the ηth and the ηex calculated for the PRC are 7.7% and 7.5% higher, respectively, than the case of the ORC.
  • PRC technology efficiency enhancement could be obtained by optimizing its design in future research, focusing on architectures providing continuous liquid refrigerant flow in the evaporator heat exchanger by increasing the buffer tank volume to prolong the continuous power generation of the configuration.

Author Contributions

Conceptualization, E.S., J.K. and N.A.; methodology E.S., N.A. and D.T.; software, E.S., J.K. and D.T.; investigation, E.S., N.A. and D.T.; resources, N.A., M.K.K. and M.G.V.; writing—original draft, E.S. and J.K.; writing—review and editing, D.T., M.K.K. and M.G.V.; visualization, E.S.; supervision, M.K.K. and M.G.V.; data curation, J.K. and N.A.; formal analysis, D.T.; project administration, M.G.V.; validation, E.S. and J.K. All authors have read and agreed to the published version of the manuscript.

Funding

This research received no external funding.

Data Availability Statement

The original contributions presented in this study are included in the article. Further inquiries can be directed to the corresponding author(s).

Conflicts of Interest

The authors declare no conflicts of interest.

Nomenclature

SymbolsSubscripts and superscripts
cpspecific heat, kW∙kg−1K−1avgaverage
Exexergy, kWcondcondenser
hspecific enthalpy, kj∙kg−1K−1cwcold water
mmass flow rate, kg∙s−1desupdesuperheater
Ppressure, barhwhot water
Poutoutput power, kWevapevaporation
Prexpander pressure ratio, -exexergy
Qheat load, kWexpexpander
ttemperature, °Cis.compisochoric compression
Wwork load, kWodead state
prehpreheater
rrefrigerant
Abbreviationththermal
CHPCombined heat and powerGreek Symbols
HFCsHydrofluorocarbons refrigerantsδuncertainty, -
ORCOrganic Rankine cycleηexexergy efficiency, -
PCFsPerfluorocarbons refrigerantsηmmechanical efficiency, -
PRCPumpless Rankine cycleηisisentropic efficiency, -
ηththermal efficiency, -

Appendix A

The P&ID of the experimental test rig of the E2ReLab of the NKUA [32], where the performance of investigated prototype pumpless PRC configuration has been experimentally evaluated, is presented in Figure A1.
Figure A1. P&ID of the of the experimental setup.
Energies 18 04766 g0a1
The uncertainty of the non-measured parameters used in the performance evaluation of the examined configuration are presented in Table A1.
Table A1. Uncertainty analysis results for ηth and ηex.
Experimental Set
(thwin–tcwin)
ηth (−)ηex (−)δηth (−)δηthth (−)δηex (−)δηexex (−)
90–104.5%31.0%0.00040.96%0.00341.11%
90–204.0%26.0%0.00040.97%0.00291.12%
90–303.2%20.0%0.00030.97%0.00211.12%
90–402.4%13.8%0.00020.98%0.00151.13%
80–104.2%28.2%0.00041.04%0.00351.21%
80–203.5%23.1%0.00041.05%0.00281.22%
80–302.5%16.3%0.00031.09%0.00201.25%
80–401.6%10.5%0.00021.57%0.00181.69%
70–103.8%23.0%0.00041.25%0.00321.44%
70–202.8%17.6%0.00031.25%0.00251.44%
70–301.9%12.0%0.00021.53%0.00181.68%
70–401.0%6.0%0.00022.67%0.00152.77%
60–103.0%17.0%0.00021.95%0.00252.12%
60–202.0%12.0%0.00022.57%0.00222.70%
60–301.2%7.0%0.00012.64%0.00132.77%
60–400.5%2.0%0.00012.68%0.00042.81%

References

  1. IEA. Global Energy Review 2025. 2025. Available online: https://www.iea.org/reports/global-energy-review-2025 (accessed on 26 June 2025).
  2. Feng, X.; Shi, F.; Qiao, G.; Li, Y.; Liu, C. Integrating organic Rankine cycle with thermoelectric generator in various applications utilizing low-grade energy: A review. Sustain. Energy Technol. Assess. 2024, 68, 103882. [Google Scholar] [CrossRef]
  3. Huo, D.; Tian, H.; Wang, W.; Shu, G. Na/K mixed electrolyte for high power density and heat-to-electricity conversion efficiency low-grade heat harvesting system. Mater. Today Nano 2022, 18, 100206. [Google Scholar] [CrossRef]
  4. Lykas, P.; Atsonios, K.; Gkountas, A.; Bakalis, P.; Manolakos, D.; Grammelis, P.; Itskos, G.; Nikolopoulos, N. Energy, exergy, and economic comparison of ORC with quasi-isothermal expansion with other ORC designs for low-grade waste heat recovery. Therm. Sci. Eng. Prog. 2024, 55, 103010. [Google Scholar] [CrossRef]
  5. Liang, Y.; Wu, J.; Sun, Z.; Zhu, Y.; Ye, K.; Dong, M.; Lu, J. Thermodynamic and economic analysis of refrigerant mixture R290/R1234ze used in an ORC-EERC system for low temperature heat sources. Appl. Therm. Eng. 2023, 229, 120635. [Google Scholar] [CrossRef]
  6. Wang, X.; Liu, D.; Gao, G.; Li, J.; Yang, Z.; Lin, R. Thermal performance study of a solar-coupled phase changes thermal energy storage system for ORC power generation. J. Energy Storage 2024, 78, 110126. [Google Scholar] [CrossRef]
  7. Bellos, E.; Tzivanidis, C. Parametric analysis and optimization of a solar driven trigeneration system based on ORC and absorption heat pump. J. Clean. Prod. 2017, 161, 493–509. [Google Scholar] [CrossRef]
  8. Chitgar, N.; Hemmati, A.; Sadrzadeh, M. A comparative performance analysis, working fluid selection, and machine learning optimization of ORC systems driven by geothermal energy. Energy Convers. Manag. 2023, 286, 117072. [Google Scholar] [CrossRef]
  9. Akbari, S.; Faghiri, S.; Zinjanabi, A.M.; Bijarchi, M.A.; Shafii, M.B.; Hosseinzadeh, K. Thermo-economic investigation and comparative multi-objective optimization of dual-pressure evaporation ORC using binary zeotropic mixtures as working fluids for geothermal energy application. Int. J. Thermofluids 2024, 24, 100899. [Google Scholar] [CrossRef]
  10. Zhang, Q.; Feng, Y.-Q.; Xu, K.-J.; Liang, H.-J.; Liu, Z.-N.; Zhao, C.-Y.; Wang, Y.-Z.; Sapin, P.; Markides, C.N. Dynamic behaviour and performance evaluation of a biomass-fired organic Rankine cycle combined heat and power (ORC-CHP) system under different control strategies. Appl. Therm. Eng. 2024, 248, 123236. [Google Scholar] [CrossRef]
  11. Nguyen, T.; Lin, L. Potentials and effects of electricity cogeneration via ORC integration in small-scale biomass district heating system. Green Energy Resour. 2025, 3, 100113. [Google Scholar] [CrossRef]
  12. Kosmadakis, G.; Neofytou, P. Reversible high-temperature heat pump/ORC for waste heat recovery in various ships: A techno-economic assessment. Energy 2022, 256, 124634. [Google Scholar] [CrossRef]
  13. Asim, M.; Khan, S.; Khan, S.A.; Baig, T.; Imran, M.; Zia, A.W.; Riaz, F.; Leung, M.K. Thermal analysis and optimal fluid selection for the novel integrated vapor compression cycle and ORC system for ultra-low grade waste heat recovery using the desuperheating method. Energy Nexus 2025, 17, 100357. [Google Scholar] [CrossRef]
  14. Bianchi, M.; Branchini, L.; De Pascale, A.; Melino, F.; Ottaviano, S.; Peretto, A.; Torricelli, N.; Zampieri, G. Performance and operation of micro-ORC energy system using geothermal heat source. Energy Procedia 2018, 148, 384–391. [Google Scholar] [CrossRef]
  15. Algieri, A.; Morrone, P. Energetic analysis of biomass-fired ORC systems for micro-scale combined heat and power (CHP) generation. A possible application to the Italian residential sector. Appl. Therm. Eng. 2014, 71, 751–759. [Google Scholar] [CrossRef]
  16. Mateu-Royo, C.; Mota-Babiloni, A.; Navarro-Esbrí, J.; Peris, B.; Molés, F.; Amat-Albuixech, M. Multi-objective optimization of a novel reversible High-Temperature Heat Pump-Organic Rankine Cycle (HTHP-ORC) for industrial low-grade waste heat recovery. Energy Convers. Manag. 2019, 197, 111908. [Google Scholar] [CrossRef]
  17. Mana, A.A.; Kaitouni, S.I.; Kousksou, T.; Jamil, A. Enhancing sustainable energy conversion: Comparative study of superheated and recuperative ORC systems for waste heat recovery and geothermal applications, with focus on 4E performance. Energy 2023, 284, 128654. [Google Scholar] [CrossRef]
  18. Aliahmadi, M.; Moosavi, A.; Sadrhosseini, H. Multi-objective optimization of regenerative ORC system integrated with thermoelectric generators for low-temperature waste heat recovery. Energy Rep. 2021, 7, 300–313. [Google Scholar] [CrossRef]
  19. Yamada, N.; Minami, T.; Mohamad, M.N.A. Fundamental experiment of pumpless Rankine-type cycle for low-temperature heat recovery. Energy 2011, 36, 1010–1017. [Google Scholar] [CrossRef]
  20. Safarian, S.; Aramoun, F. Energy and exergy assessments of modified Organic Rankine Cycles (ORCs). Energy Rep. 2015, 1, 1–7. [Google Scholar] [CrossRef]
  21. Li, J.; Pei, G.; Li, Y.; Ji, J. Analysis of a novel gravity driven organic Rankine cycle for small-scale cogeneration applications. Appl. Energy 2013, 108, 34–44. [Google Scholar] [CrossRef]
  22. Bao, H.; Wang, Y.; Roskilly, A.P. Modelling of a chemisorption refrigeration and power cogeneration system. Appl. Energy 2014, 119, 351–362. [Google Scholar] [CrossRef]
  23. Yamada, N.; Watanabe, M.; Hoshi, A. Experiment on pumpless Rankine-type cycle with scroll expander. Energy 2013, 49, 137–145. [Google Scholar] [CrossRef]
  24. Gao, P.; Wang, L.W.; Wang, R.Z.; Jiang, L.; Zhou, Z.S. Experimental investigation on a small pumpless ORC (organic rankine cycle) system driven by the low temperature heat source. Energy 2015, 91, 324–333. [Google Scholar] [CrossRef]
  25. Jiang, L.; Lu, H.T.; Wang, L.W.; Gao, P.; Zhu, F.Q.; Wang, R.Z.; Roskilly, A.P. Investigation on a small-scale pumpless Organic Rankine Cycle (ORC) system driven by the low temperature heat source. Appl. Energy 2017, 195, 478–486. [Google Scholar] [CrossRef]
  26. Gao, P.; Wang, Z.X.; Wang, L.W.; Lu, H.T. Technical feasibility of a gravity-type pumpless ORC system with one evaporator and two condensers. Appl. Therm. Eng. 2018, 145, 569–575. [Google Scholar] [CrossRef]
  27. Gkimisis, L.; Arapkoules, N.; Vasileiou, G.; Soldatos, A.; Spitas, V. Modelling and numerical simulation of a novel Pumpless Rankine Cycle (PRC). Appl. Therm. Eng. 2020, 178, 115523. [Google Scholar] [CrossRef]
  28. Zhang, X.; Wang, L.; Zhu, H. Investigation on a novel pumpless module driven by thermal energy and gravity and its application in an ORC system. Renew. Energy 2022, 195, 476–487. [Google Scholar] [CrossRef]
  29. Zhu, H.; Zhang, X.; Gao, Z.; Wang, L.; Wang, Z. Thermodynamic analysis and experimental study of two-stage thermal-gravitational pumping ORC under low evaporation temperatures. Sustain. Energy Technol. Assess. 2024, 66, 103820. [Google Scholar] [CrossRef]
  30. Świerzewski, M.; Kalina, J.; Musiał, A. Techno-economic optimization of ORC system structure, size and working fluid within biomass-fired municipal cogeneration plant retrofitting project. Renew. Energy 2021, 180, 281–296. [Google Scholar] [CrossRef]
  31. Kajurek, J.; Rusowicz, A.; Grzebielec, A.; Bujalski, W.; Futyma, K.; Rudowicz, Z. Selection of refrigerants for a modified organic Rankine cycle. Energy 2019, 168, 1–8. [Google Scholar] [CrossRef]
  32. E2ReLab. Available online: https://e2relab.core.uoa.gr/ (accessed on 30 June 2025).
  33. Moffat, R.J. Using Uncertainty Analysis in the Planning of an Experiment. 1985. Available online: https://fluidsengineering.asmedigitalcollection.asme.org (accessed on 10 August 2025).
  34. Eyerer, S.; Dawo, F.; Kaindl, J.; Wieland, C.; Spliethoff, H. Experimental investigation of modern ORC working fluids R1224yd(Z) and R1233zd(E) as replacements for R245fa. Appl. Energy 2019, 240, 946–963. [Google Scholar] [CrossRef]
Figure 1. The examined novel PRC configuration.
Energies 18 04766 g001
Figure 2. Log(p)-h diagram of the examined PRC cycle.
Energies 18 04766 g002
Figure 3. T-s diagram of the examined PRC cycle.
Energies 18 04766 g003
Figure 4. Photograph of the PRC prototype.
Energies 18 04766 g004
Figure 5. Pneumatic valves set on the upper part of Tank 2.
Energies 18 04766 g005
Figure 6. Photograph of the expander arrangement.
Energies 18 04766 g006
Figure 7. Photograph of the experimental setup.
Energies 18 04766 g007
Figure 8. Pressure variation in the buffer tanks for thwin = 90 °C, tcwin = 10 °C.
Energies 18 04766 g008
Figure 9. Expander inlet and outlet temperature variation for thwin = 90 °C, tcwin = 10 °C.
Energies 18 04766 g009
Figure 10. Preheater and condenser inlet and outlet temperature variation for thwin = 90 °C, tcwin = 10 °C.
Energies 18 04766 g010
Figure 11. Desuperheater and condenser inlet and outlet temperature variation for thwin = 90 °C, tcwin = 10 °C.
Energies 18 04766 g011
Figure 12. Buffer Tank 1 bottom, middle and top point temperature variation for thwin = 90 °C, tcwin = 10 °C.
Energies 18 04766 g012
Figure 13. Buffer Tank 2 bottom, middle and top point temperature variation for thwin = 90 °C, tcwin = 10 °C.
Energies 18 04766 g013
Figure 14. Output power variation for thwin = 90 °C, tcwin = 10 °C.
Energies 18 04766 g014
Figure 15. Generator speed variation for thwin = 90 °C, tcwin = 10 °C.
Energies 18 04766 g015
Figure 16. Heat input distribution variation for thwin = 90 °C, tcwin = 10 °C.
Energies 18 04766 g016
Figure 17. Heat output distribution variation for thwin = 90 °C, tcwin = 10 °C.
Energies 18 04766 g017
Figure 18. Expander isentropic efficiency in correlation to the pressure ratio.
Energies 18 04766 g018
Figure 19. Expander mechanical efficiency in correlation to the pressure ratio.
Energies 18 04766 g019
Figure 20. Thermal efficiency (ηth) variation with tcwin for different thwin.
Energies 18 04766 g020
Figure 21. Exergy efficiency (ηex) variation with tcwin for different thwin.
Energies 18 04766 g021
Figure 22. Thermal efficiency (ηth) comparison between PRC and conventional ORC for different conditions.
Energies 18 04766 g022
Figure 23. Exergy efficiency (ηex) comparison between PRC and conventional ORC for different conditions.
Energies 18 04766 g023
Table 1. Description and types of measurement devices.
Measured VariableMeasurement DeviceRangeCalibrated Accuracy
Temperature probes
Hot water inT-type thermocouple0.0 to 140.0 °C±0.5 K
Hot water outT-type thermocouple0.0 to 140.0 °C±0.5 K
Cold water inT-type thermocouple0.0 to 140.0 °C±0.5 K
Cold water outT-type thermocouple0.0 to 140.0 °C±0.5 K
Main liquid lineT-type thermocouple0.0 to 140.0 °C±0.5 K
Preheater outT-type thermocouple0.0 to 140.0 °C±0.5 K
Expander inT-type thermocouple0.0 to 140.0 °C±0.5 K
Expander outT-type thermocouple0.0 to 140.0 °C±0.5 K
Desuperheater outT-type thermocouple0.0 to 140.0 °C±0.5 K
Condenser outT-type thermocouple0.0 to 140.0 °C±0.5 K
Tank 1 liquid lineT-type thermocouple0.0 to 140.0 °C±0.5 K
Tank 1 bottomT-type thermocouple0.0 to 140.0 °C±0.5 K
Tank 1 middleT-type thermocouple0.0 to 140.0 °C±0.5 K
Tank 1 topT-type thermocouple0.0 to 140.0 °C±0.5 K
Tank 1 vapor lineT-type thermocouple0.0 to 140.0 °C±0.5 K
Tank 2 liquid lineT-type thermocouple0.0 to 140.0 °C±0.5 K
Tank 2 bottomT-type thermocouple0.0 to 140.0 °C±0.5 K
Tank 2 middleT-type thermocouple0.0 to 140.0 °C±0.5 K
Tank 2 topT-type thermocouple0.0 to 140.0 °C±0.5 K
Tank 2 vapor lineT-type thermocouple0.0 to 140.0 °C±0.5 K
Flow meters
Hot-water flowMagnetic flow meter0.0 to 10.0 lpm±0.03% of the rate
Pressure transmitters
Tank 1 pressurePressure gauge0.0 to 10.0 bar±0.6% of the span
Tank 2 pressurePressure gauge0.0 to 10.0 bar±0.6% of the span
Generator measurements
Generator power outputDigital watt meter0.0 to 1000.0 W±0.5% of the reading
Generator speedDigital tachometer0 to 2500 rpm±0.5% of the reading
Table 2. Confirmation of the developed simulation model against the experimental data.
thwin (°C)tcwin (°C)ηthDeviation
ExperimentSimulation
90100.0450.044−1.7%
90200.040.0412.7%
90300.0320.0332.4%
90400.0240.023−3.0%
80100.0420.0420.8%
80200.0350.0362.9%
80300.0250.0262.3%
80400.0160.0175.9%
70100.0380.0392.1%
70200.0280.0294.3%
70300.0190.019−0.1%
70400.010.0116.8%
60100.030.0339.0%
60200.020.0229.2%
60300.0120.0135.3%
60400.0050.0056.2%
Table 3. Validation of the developed conventional ORC with R245fa model with Reference [34].
tcond (°C)ηth (−)Absolute
Ref. [34]Present StudyDeviation
235.34%5.40%1.2%
305.03%5.04%0.2%
404.64%4.53%2.3%
503.90%3.79%3.0%
602.28%2.34%2.8%
Disclaimer/Publisher’s Note: The statements, opinions and data contained in all publications are solely those of the individual author(s) and contributor(s) and not of MDPI and/or the editor(s). MDPI and/or the editor(s) disclaim responsibility for any injury to people or property resulting from any ideas, methods, instructions or products referred to in the content.