Abstract
Thermal energy storage (TES) technology is pivotal for storing thermal energy and has numerous applications in buildings and industrial processes. Graphite is a potential additive for improving TES materials because of its high-temperature resistance and thermal conductivity. This study presents an examination of TES concrete with 5%, 10%, and 15% (by volume of binder) compared to concrete that contains only ordinary Portland cement (OPC). Notably, increasing graphite content reduced the unit weight by 0.3%, 2.0%, and 2.6%. Additionally, the graphite mixture exhibited less strength loss than the OPC mixture. Specifically, the G15 mixture achieved a 38.3% cut in compressive strength compared to 51.9% for OPC and a 51.8% cut in splitting tensile strength compared to 56.1% for OPC. Additionally, the thermal conductivity of graphite mixtures was greater than that of the OPC concrete under high-temperature conditions. Microstructural analysis through scanning electron microscopy (SEM) and X-ray diffraction (XRD) revealed reduced portlandite content and fewer voids in graphite-integrated samples, suggesting increased thermal stability and matrix densification. Thermogravimetric analysis (TGA) further confirmed the effect of graphite on thermal behavior, revealing distinct mass loss patterns at increased temperatures. Based on the findings, numerical simulations were conducted. The results confirm trends in thermal conductivity and heat propagation in the experiment, revealing the potential of graphite concrete in TES design by obtaining temperature distributions under thermal cycling. Overall, this study confirms the feasibility and efficiency of using graphite to improve the thermal properties of concrete for TES applications.
1. Introduction
Thermal energy storage (TES) is a technology that helps capture and store thermal energy for subsequent use by charging thermal energy through heating a storage medium and discharging it through cooling. TES technology has been widely used in buildings and industrial processes and is eco-friendly since it reduces carbon dioxide emissions [1,2]. TES can be classified into three types: sensible heat storage (based on the temperature change in TES materials), latent heat storage (based on the phase change in TES materials), and thermochemical storage (based on adsorption/desorption or reversible chemical reactions). Among these methods, sensible heat storage is the most developed technology; however, it has the lowest storage capacity because of the large number of low-cost energy storage materials available [3].
Compared with other mechanical or chemical storage technologies, TES using solid, nonflammable materials with stable thermal properties at high temperatures is relatively inexpensive and highly efficient [4]. Solid media, such as alumina, concrete, and graphite, can provide consistent thermal performance at high temperatures and are commonly used [5]. Concrete, in particular, is an appealing option as a storage medium in TES systems because of its relatively low cost [6]. Previous research [6,7,8,9,10,11,12,13] has also demonstrated the advantages of using concrete as a solid storage medium for thermal energy. Additionally, the use of concrete at high temperatures above 400 °C has been demonstrated in actual prototypes [9,14]. However, the use of concrete as a solid material in TES applications remains challenging. One of the primary challenges is that concrete used for TES systems often develops thermal fatigue, cracking, and structural degradation when it is repeatedly exposed to high temperatures, decreasing its long-term durability.
Graphite is a material with remarkably high-temperature resistance and thermal conductivity. Recent studies have investigated graphite and graphite-based materials for use in thermal energy storage, and graphite in UV-curable resin-based phase change material composites is multifaceted in that it enhances the thermal properties of the material [15]. A novel method combines graphite-encapsulated phase change materials with highly directional graphene films to create laminated phase change composites aimed at overcoming the key limitations of low thermal conductivity and the risk of leakage [16]. Graphite foams have also been used in the encapsulation of erythritol for medium-temperature latent heat energy storage and address the low thermal conductivity and high degree of supercooling of erythritol [17]. The thermal cycling behavior of paraffin/graphite matrix composites in a shell-tube configuration was studied to investigate how the graphite matrix bulk density and compaction speed affected the performance of these composites during charge-discharge cycles [18]. A novel TES concrete was developed by incorporating a composite phase change material encapsulated in hollow steel balls into the concrete matrix to improve thermal performance [19]. The thermal conductivity of concrete that contains recycled coarse aggregates was increased with graphite, which also increased its durability [20]. The mechanical properties of conductive fine-grained concrete that contains graphite were examined by investigating the effects of single and double doping with carbon fiber and graphite [21]. The thermal properties of steel fiber-reinforced concrete that incorporates graphite were investigated for use in snow-melting and radiant heating, and models were proposed to support energy-efficient heating applications [22].
The aim of this study is to investigate the properties of TES concrete that contains graphite. The effects of using graphite as a partial replacement of the concrete were investigated. The compressive strength, split tensile strength, thermal conductivity, specific heat, and microstructure of the graphite concrete were evaluated. In addition, the experimental results reveal essential input parameters and validation data for the FEM simulation. By accurately measuring the mechanical and thermal properties of graphite concrete through experiments, the FEM model can simulate heat transfer and structural behavior under different conditions with greater precision. This integrated approach allows for the prediction and optimization of TES concrete performance in real-world applications, supporting the development and integration of graphite-enhanced concrete in thermal energy storage systems.
2. Materials and Test Preparation
2.1. Materials
In this study, ordinary Portland cement (OPC) and graphite were used as the main binders. The components of OPC and graphite were evaluated through X-ray fluorescence (XRF) analysis and are presented in Table 1 and Table 2, respectively. The components of OPC are CaO, SiO2, Al2O3, and Fe2O3, and the contents of each are 64%, 17.8%, 5%, and 3.1%, respectively. These four components are the main constituents of hydraulic cement that induce hydration reactions, thus contributing to the strength development. However, graphite does not contain these four components, which induce hydration reactions. In graphite, carbon is the dominant component; thus, it is expected to be advantageous for heat transfer. Graphite with a density of 2.26 g/cm3 was utilized in this study. Polypropylene (P.P.) fibers with a diameter of 21 μm, specific gravity of 0.91, length of 12.7 mm, and tensile strength of 400 MPa were also used to prevent the spalling phenomena in concrete at high temperatures [23].

Table 1.
Chemical composition of the ordinary Portland cement (OPC) used in this study.
Table 2.
Chemical composition of the graphite used in this study.
2.2. Mix Proportions
To investigate the effects of replacing OPC with graphite on the material properties of concrete for TES application, four mixtures were considered. One control mixture included only OPC as a binder. The other three mixtures replaced OPC with graphite at 5%, 10% and 15% contents. The mixture proportions used in this study are summarized in Table 3.
Table 3.
Mix proportions for concrete with only OPC and concrete with graphite.
2.3. Fabrication of the Samples
Cylindrical concrete specimens with a diameter of 100 mm and a height of 200 mm were fabricated in the laboratory. Sixteen concrete samples were prepared for a mixture; accordingly, a total of 64 concrete samples were prepared for the experimental program. For each mixture, three samples were tested for compressive strength, and three samples were tested for splitting tensile strength at room temperature. After high-temperature exposure, three samples were tested for compressive strength, and three samples were tested for splitting tensile strength. In addition, three samples were used to determine the unit weight, whereas one sample was used to measure the thermal conductivity and specific heat. After the mixtures were prepared, the samples were cured at room temperature for 24 h and then submerged in a water tank at a temperature of 20 ± 3 °C. Because the study focuses primarily on the thermal behavior of concrete after heat exposure, the tests were conducted mainly on samples that were already under thermal treatment. Thus, the effect of humidity on the results is considered minimal and therefore can be disregarded. Additionally, all sample fabrication and testing were conducted under standard laboratory conditions (23 ± 2 °C) to ensure the consistency of the results and decrease the effect of external environmental factors.
After fabrication, some samples were evaluated at room temperature, whereas other samples were placed into an electric oven for heat exposure. This process included four thermal cycles overall, which were selected to represent the realistic conditions of thermal energy storage (TES) applications. The thermal cycle scenario applied for each thermal cycle in this study consisted of a 2 h heating stage, a 2 h high-temperature holding stage, as shown in solid line in Figure 1 and a subsequent 16 h natural cooling stage, as shown in dashed line in Figure 1. This scenario was designed to represent the actual thermal energy storage systems, in which the durations of charging and discharging processes are generally similar. However, due to the limitations of the electric oven used in the experiment, the cooling rate could not be mechanically controlled. Therefore, after the heating and holding stages, the oven door was slightly opened to allow natural cooling for 16 h to ensure that the samples cooled down gradually without experiencing thermal shock. Figure 1 shows the thermal cycle scenario for the heat exposure process, and the test sequence is shown in Figure 2.
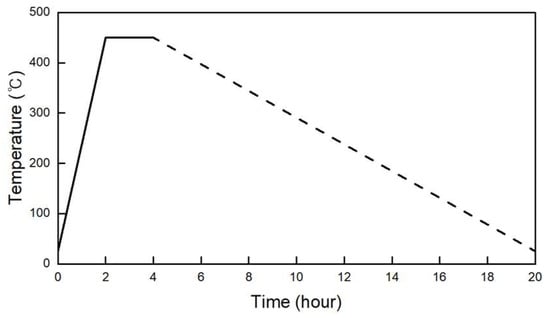
Figure 1.
Thermal cycle scenario for the concrete samples.
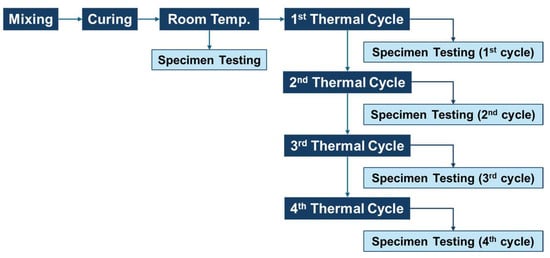
Figure 2.
Test sequence in this study.
2.4. Test Procedure
Each cylindrical test sample was 100 mm in diameter and 200 mm in height. The unit weight of each sample was measured before and after each thermal cycle. To ensure the reliability of the measurement results, the unit weight of three specimens per series was measured, and the average value was used. The unit weight was calculated using the weight and volume of the samples.
Cylindrical samples with a diameter of 100 mm and a height of 200 mm were prepared for compressive and splitting tensile strength tests. The equipment used for the experiments was a universal testing machine (UTM) with a capacity of 2000 kN, and the tests were conducted under displacement control. The compressive strength tests were conducted at a loading rate of 0.8 mm/min, whereas the splitting tensile strength tests were conducted at a loading rate of 0.3 mm/min. The compressive strength and splitting tensile strength were measured before and after high-temperature exposure. To ensure reliability, three measurements were evaluated, and the average value was used. Figure 3 and Figure 4 show the overall view of the experiment setup and the failure patterns of compressive strength and splitting tensile strength, respectively.
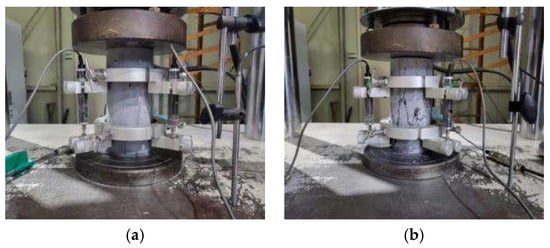
Figure 3.
Compressive strength test: (a) experimental setup and (b) failure pattern.
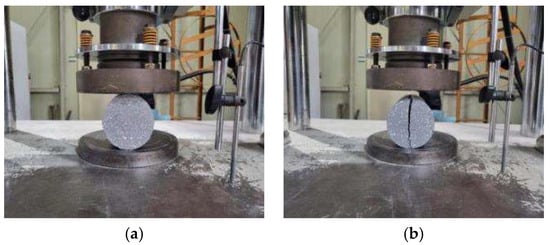
Figure 4.
Splitting tensile strength test: (a) experimental setup and (b) failure pattern.
Thermal conductivity and specific heat were measured before and after each thermal cycle with a thermal conductivity measuring device. Techniques for measuring concrete thermal conductivity include ASTM D5334-00 [24], a guarded hot plate (GHP), a heat flow meter, and the transient plane source (TPS) method. The TPS method was applied according to ISO 22007-2 [25] in this study. Measurements were performed by inserting a temperature device between two samples, as shown in Figure 5. A TPS-1500 instrument (Hot Disk Ltd., Gothenburg, Sweden) was used. The center of the cylindrical samples was cut, and then a thermal measurement sensor was inserted between the two cut samples to measure thermal conductivity and specific heat. The thermal measurement sensor consists of a nickel-based double helix, which transmits heating current and detects or controls voltage drops. The thermal conductivity and specific heat of concrete were measured by supplying heat waves with a power of 0.3 W from a heat source, and the measurements were performed three times for each sample to increase the reliability of the experimental results.
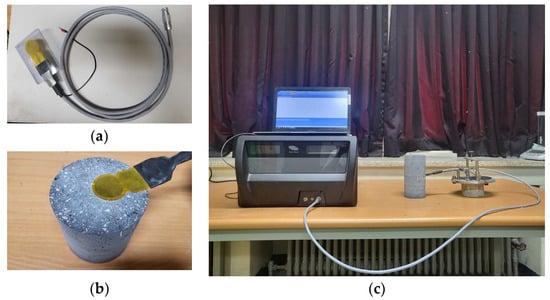
Figure 5.
Thermal characteristics experimental process: (a) measurement sensor, (b) sensor installation for measurement, and (c) measurement setup.
3. Results
3.1. Unit Weight
The unit weights for various mixtures before and after four thermal cycle applications are presented in Figure 6. The unit weight of the OPC specimen at room temperature was 2154 kg/m3, whereas the unit weights of the G05, G10, and G15 specimens were 2147, 2112, and 2098 kg/m3, respectively; these were reduced by 0.3%, 2%, and 2.6% with respect to the OPC specimens. After high-temperature exposure (after four cycles), the unit weight of the OPC specimens was 1876 kg/m3, whereas the unit weights of the G05, G10, and G15 specimens were 1876, 1856, and 1834 kg/m3, respectively; these results indicated a decrease in unit weight with increasing graphite content. The unit weight of the concrete specimens decreased under both room temperature conditions and high-temperature exposure as the graphite content rate increased; these results were attributed to the lower density of graphite than of OPC. In addition, the flake morphology of graphite weakens the matrix of the mixture. Graphite is hydrophobic; thus, it does not readily interact with water in cement paste [26]. As a result, the addition of graphite creates more voids in the matrix, increasing porosity and decreasing the unit weight.
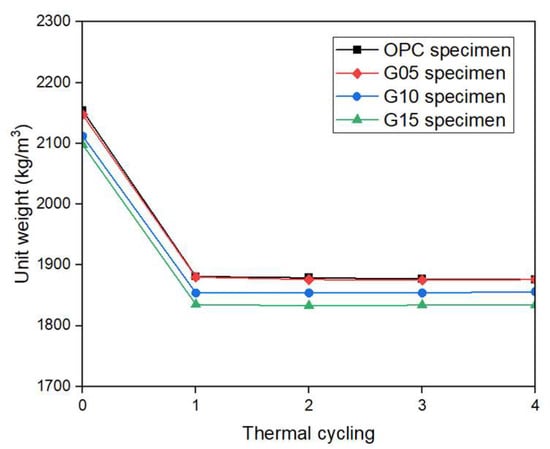
Figure 6.
Unit weight of the concrete samples during various thermal cycles.
After the application of one heat cycle, the unit weights of OPC, G05, G10, and G15 specimens decreased by 12.7%, 12.4%, 12.2%, and 12.5%, respectively, and subsequent applications of heat cycles resulted in minimal changes in unit weight. These results indicated that the concrete reached a thermally stabilized state. Both specimens containing OPC and those containing graphite had similar unit weights and similar rates of decrease in unit weight after high-temperature exposure. In addition, graphite is highly stable and does not degrade or oxidize at moderate temperatures. Thus, based on the experimental results, the unit weight of concrete with graphite incorporation up to a content of 15% was suitable for the thermal capacity of TES media because the unit weight of solid media for TES was closely related to the thermal capacity.
3.2. Compressive Strength
The results from the compressive strength test before and after exposure to high temperatures are shown in Figure 7. At room temperature, the compressive strength of the OPC series specimen was 69.8 MPa, whereas the values for the G05, G10, and G15 series specimens were 63.7, 57.0, and 49.3 MPa, respectively. The compressive strengths of the graphite series specimens were 8.8%, 18.4%, and 29.4% lower than those of the OPC specimens. The difference in the compressive strengths between the OPC series and graphite series specimens resulted from the presence or absence of the components of CaO, SiO2, Al2O3, and Fe2O3. These components induced hydration reactions and were present in the OPC, as shown in Table 1. In contrast, these components were not present in the graphite composition. Finally, a remarkable decrease in compressive strength occurred as the graphite content increased.
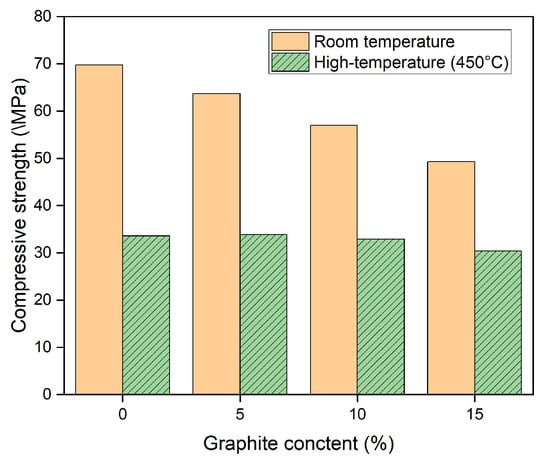
Figure 7.
Compressive strength of concrete samples before and after heat exposure.
The compressive strength of the OPC series specimen after high-temperature exposure at 450 °C was 33.6 MPa, whereas those of the G10, G10, and G15 series specimens were 33.1, 32.9, and 30.4 MPa, respectively. The compressive strength of the graphite concrete specimens was lower than that of the OPC concrete specimens. Specifically, they were 1.5%, 2.1%, and 9.5% lower than those of the OPC specimens, respectively. The slippery nature of graphite in coating materials decreases the adhesion between the cement paste and the coarse aggregates, which decreases the load-bearing capacity of the coarse aggregates.
Moreover, after high-temperature exposure, the compressive strengths of the OPC, G05, G10, and G15 specimens decreased by 51.9%, 46.7%, 42.4%, and 38.3%, respectively, compared with the compressive strength at room temperature. Evidently, the decrease in the compressive strength of the graphite-containing specimens was lower than that of the OPC specimen because of the thermal resistance of the graphite under high-temperature conditions. In addition, the high thermal conductivity of graphite enables heat to be dispersed more evenly throughout the sample and thus decreases the thermal stress, which may cause internal cracking in the concrete. The compressive strength results after high-temperature exposure in this study were greater than those reported in previous studies [27] and were similar to the results of another study [28], as shown in Figure 8. In addition, the compressive strength of the concrete with graphite in this study was greater than that of the concrete using high-temperature material in previous studies, as shown in Table 4.
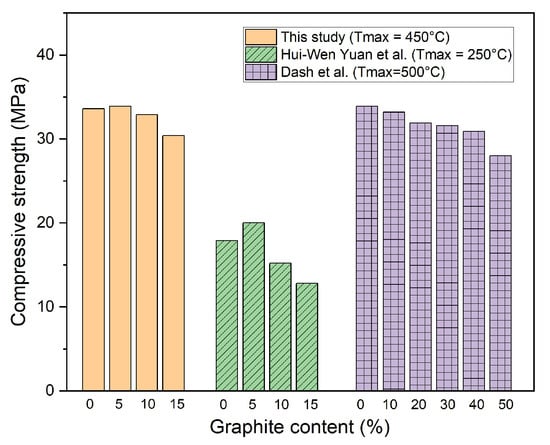
Figure 8.
Comparison of compressive strength between this study and previous studies [27,28].
Table 4.
Comparison of compressive strength between this study and previous studies.
3.3. Splitting Tensile Strength
The resulting splitting tensile strengths before and after exposure to a high temperature of 450 °C are shown in Figure 9. At room temperature, the splitting tensile strength of the OPC series specimen was 5.5 MPa, whereas the splitting tensile strengths of the G05, G10, and G15 series specimens were 5.3, 4.7, and 4.5 MPa, respectively; these values were 4.6%, 15.2%, and 19.4% lower than that of the OPC specimen. The splitting tensile strength decreased as the graphite incorporation rate increased. The inactive graphite in the mixture hindered the development of hydration products, decreasing the rate of hydration of cement. In addition, when graphite is mixed directly into concrete, the graphite tends to agglomerate, causing defects such as open porosity, which can also negatively affect the mechanical properties.
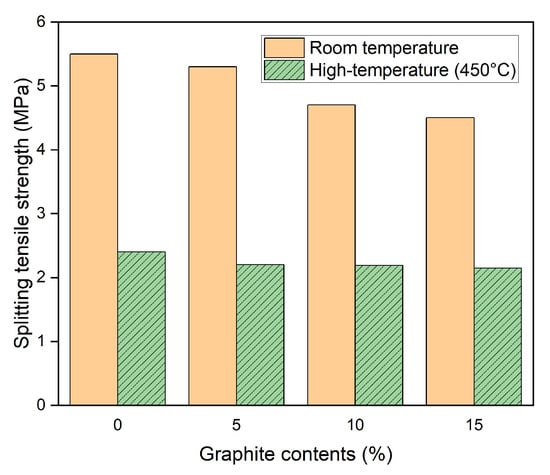
Figure 9.
Splitting tensile strength of concrete samples before and after heat exposure.
After high-temperature exposure, the splitting tensile strength of the OPC series specimen was 2.4 MPa, whereas the splitting tensile strengths of the G05, G10, and G15 specimens were 2.2 MPa, 2.19 MPa, and 2.15 MPa, respectively; these results indicated minimal variations in the splitting tensile strength with different graphite incorporation rates, although the splitting tensile strength of the specimens with graphite contents was actually lower than that of the OPC specimen at room temperature. Furthermore, after high-temperature exposure, the splitting tensile strengths of the OPC, G05, G10, and G15 series specimens decreased by 56.1%, 58.3%, 53.3%, and 51.8%, respectively, compared with those at room temperature. The decrease in the splitting tensile strength of the graphite concrete specimens (the G10 and G15 series) was lower than that of the OPC series specimens. Similar to the compressive strength, the high thermal conductivity of graphite helps distribute heat more evenly and reduce thermal stress, thus improving the ability of the material to withstand high temperatures.
3.4. Thermal Conductivity
The results from the thermal conductivity test for various graphite mixing ratios at room temperature and for each thermal cycle for up to four cycles are shown in Figure 10. At room temperature, the thermal conductivity of the OPC series specimen was 1.47 W/m·K, and those of the G05, G10, and G15 series specimens were 1.81, 2.11, and 2.28 W/m·K, respectively. Therefore, the thermal conductivities of the graphite concrete specimens were 23%, 42.8%, and 54.8% greater than those of the OPC specimens.
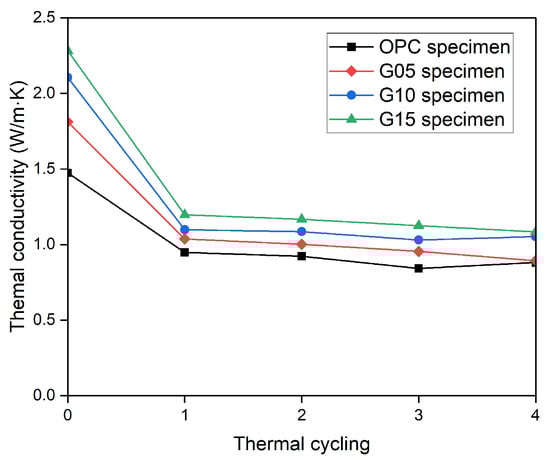
Figure 10.
Thermal conductivity of the concrete specimens during various thermal cycles.
After high-temperature exposure for four thermal cycles, the thermal conductivity of the OPC specimen was 0.88 W/m·K, whereas the thermal conductivities of the G05, G10, and G15 series specimens were 0.86, 1.05, and 1.08 W/m·K, respectively. As the graphite content increased, the thermal conductivity of the concrete remained higher than that of the control samples at room temperature and even after high-temperature exposure. Compared with those at room temperature, the thermal conductivities of the OPC, G05, G10, and G15 concrete specimens at high temperatures decreased by 40.2%, 52.5%, 50%, and 52.5%, respectively. Although the decrease in the thermal conductivity of the OPC specimen was greater than that of the G10 and G15 specimens, the thermal conductivities of the G10 and G15 samples remained significantly greater.
Therefore, the test results revealed that the thermal conductivity of the concrete containing graphite in this study was greater under high-temperature conditions than that of the control specimen. Additionally, the test results of the thermal conductivity after high-temperature thermal cycles in this study and previous studies are compared in Figure 11. As shown in the figure, the thermal conductivity results of this study after high-temperature exposure were higher than those of previous studies [25]. Furthermore, the thermal conductivity of graphite-incorporated concrete in this study was greater than that of the concrete using high-temperature material in previous studies, as shown in Table 5.
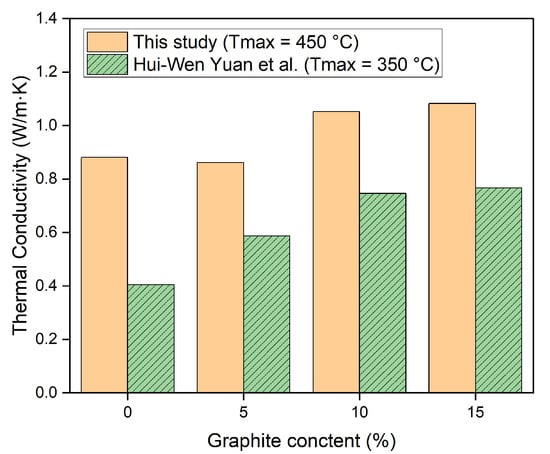
Figure 11.
Comparison of the thermal conductivity between this study and a previous study [27].
Table 5.
Comparison of thermal conductivity between this study and previous studies.
3.5. Specific Heat
The specific heat results at initial room temperature and after thermal cycles for each graphite concrete specimen are shown in Figure 12. At room temperature, the specific heat of the standard specimen was 939 J/kg·K, and the specific heats of the specimens mixed with 5%, 10%, and 15% graphite were 892, 830, and 789 J/kg·K, respectively.
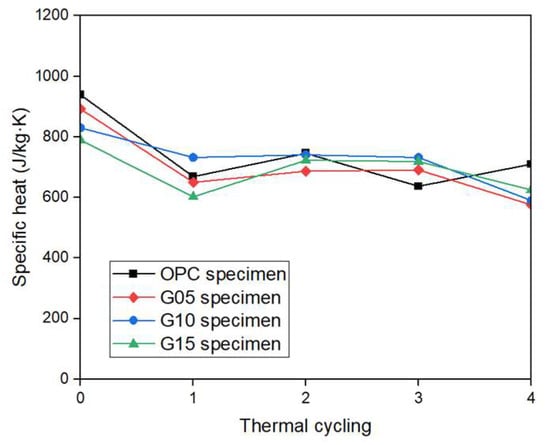
Figure 12.
Specific heat of concrete samples during various thermal cycles.
A higher graphite mixing ratio correlated with a lower specific heat. Specifically, at room temperature, the specific heats of the G05, G10, and G15 specimens decreased by 5%, 11.6%, and 16%, respectively, compared with the specific heats of the OPC specimens. The specific heat of the OPC specimen after high-temperature exposure (after four cycles) was 710 J/kg·K; the specific heats of the G05, G10, and G15 concrete specimens were 576, 590, and 625 J/kg·K, respectively; and the specific heat of the specimen mixed with graphite was lower than the specific heat of the reference specimen. After one heating cycle, the specific heats of the OPC, G05, G10, and G15 concrete specimens decreased by 28.7%, 27.1%, 11.8%, and 23.7%, respectively, compared with the specific heat at room temperature. Specifically, the specific heat reduction rates of the G05, G10, and G15 specimens were lower than that of the OPC specimen. Thus, the graphite-mixed concrete specimen had better thermal resistance performance under high-temperature conditions than the concrete of the standard specimens.
3.6. Economic Impact of Graphite
Although the graphite used in this study has a higher unit price than ordinary Portland cement, the G10 mixture had an increase in binder cost of approximately 65%. Nonetheless, the G10 mixture also achieved an improvement in thermal conductivity of 19.3% and a reduction in compressive strength loss of 42.4% after high-temperature exposure, indicating notable performance improvements. These improvements are expected to decrease the charging/discharging time and improve durability in TES systems, resulting in increased maintenance intervals and operational efficiency. Consequently, despite the initial cost increase, graphite-incorporated concrete may decrease the overall life-cycle cost of TES systems. The economic viability can improve further with the use of recycled graphite [32]. Therefore, graphite is considered an excellent material that provides both technical and economic advantages for high-temperature TES applications.
4. Microstructural Characteristics
4.1. SEM Analysis
To analyze the internal structural characteristics of the concrete at room temperature and after exposure to high temperatures, scanning electron microscopy (SEM) imaging was performed, and the results are presented in Figure 13. The morphology of the concrete was investigated via scanning electron microscopy (SEM; SU8820, Hitachi, Tokyo, Japan). After high-temperature exposure, the P.P. fibers had dissolved in all test specimens, which resulted in the formation of voids at the dissolved locations. The formation of voids in concrete contributed to the prevention of the spalling of concrete at high temperatures, but could cause degradation in the strength and thermal conductivity of the concrete. The presence of graphite within the concrete could also be observed because of its incorporation in the concrete used in this study, as shown in Figure 14. The flaky and layered characteristics of graphite weaken the structural cohesion of the mixture, decreasing the mechanical properties compared to concrete with only OPC. Nevertheless, the dispersion of graphite, as well as concrete hydration products, improves the performance under high-temperature conditions, because the thermal resistance of graphite helps improve the stress transfer within the sample.
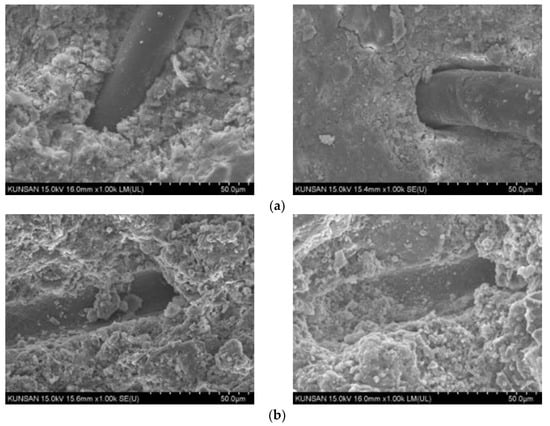
Figure 13.
P.P. fiber in the concrete structure at room temperature and after high-temperature exposure: (a) room temperature and (b) high temperature.
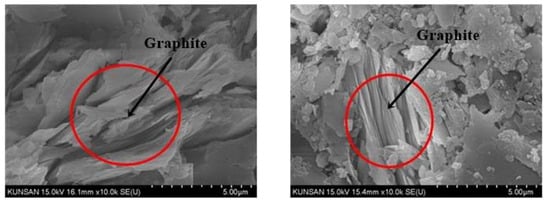
Figure 14.
SEM images of the graphite inside the concrete.
4.2. XRD Analysis
The crystalline structure of graphite concrete was examined via the X-ray diffraction (XRD) method, with a Malvern Panalytical Empyrean device (Malvern Panalytical Ltd, Malvern, UK) under Cu Kα radiation. The X-ray diffraction (XRD) analysis results of each concrete series at room temperature and after exposure to a high temperature of 450 °C are shown in Figure 15, and for reference, the components of the concrete analyzed from the XRD measurements and their chemical formulas are provided in Table 6.
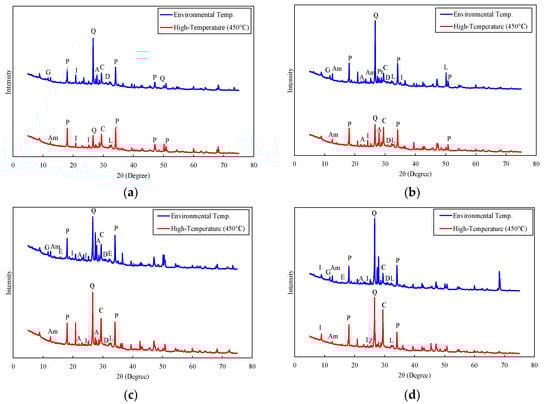
Figure 15.
XRD patterns: (a) graphite replacement = 0% (OPC), (b) graphite replacement = 5% (G05), (c) graphite replacement = 10% (G10), and (d) graphite replacement = 15% (G15).
Table 6.
Symbol notation for XRD analysis.
At room temperature, the amount of portlandite (Ca(OH)2), which is the major hydration product of concrete, decreased as the graphite content increased. The amount of portlandite in the OPC concrete specimen was 20.3%, and it was 13.6% in the G15 concrete specimen. The decrease in the Portlandite content was responsible for the strength of the concrete. Therefore, the strength of the concrete decreased as the graphite content increased, as described earlier in Section 3.2 and Section 3.3.
The amount of quartz decreased after high-temperature thermal cycling. Although quartz does not participate directly in cement hydration reactions, its reduction after thermal exposure could affect the overall microstructural stability of the concrete. The decrease in quartz after thermal exposure contributed to a decrease in strength and thermal conductivity due to the weakening of the structural matrix. The decrease in quartz content after high-temperature exposure was even 15.4% in the OPC specimen, whereas it was 3.1% in the G15 specimen. These results indicated that the OPC concrete specimen should experience a greater reduction in compressive strength than the G15 series concrete specimen after high-temperature exposure.
5. FEM Simulation
5.1. Experimental Data Collection of the Concrete Blocks
Three concrete blocks containing graphite contents of 5%, 10%, and 15% based on the G05, G10, and G15 mixtures, as shown in Table 1, were fabricated. The thermal performance of the concrete blocks was analyzed according to the heating and cooling scenario, and the experimental results were compared with the finite element (FE) analysis results.
The concrete of each mixture was cast into a mold with dimensions of 100 mm × 100 mm × 800 mm. Heat exchanger pipes with an outer diameter of 17.4 mm, an inner diameter of 13.4 mm, and a length of 100 mm were embedded in the center of the concrete block to allow heat to transfer between the heat exchanger pipe and the concrete block. Temperature sensors were embedded to measure the temperature distribution. The temperature sensors were installed in three sections of the concrete block: inlet section, middle section, and outlet section; additionally, six temperature sensors were installed in each section. The concrete block and positions of the sensors are shown in Figure 16 and Figure 17, respectively. As shown in Figure 17b, for six temperature sensors, numbers 1, 2, and 3 correspond to the surface, the surface-to-center, and the center of the concrete block in the vertical direction, while numbers 4, 5, and 6 correspond to the center, the center-to-surface, and the surface of the concrete block in the horizontal direction, respectively.
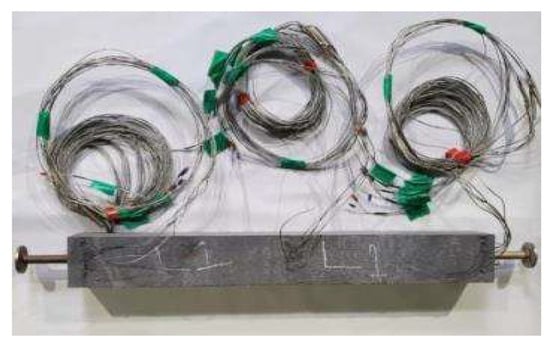
Figure 16.
Concrete block used for the thermal experiment.
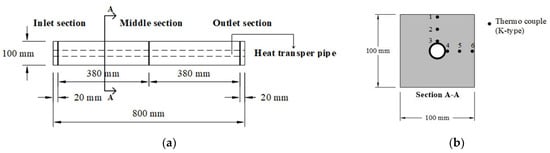
Figure 17.
Installation of the thermal sensors (thermocouples): (a) sections for measuring the temperature distribution and (b) positions for thermocouple installation.
An experimental device for simulating heat transfer between the heat transfer fluid and the concrete block, which incorporates heating and cooling cycles, is shown in Figure 18. The experimental device for heat transfer simulation consisted of a heat transfer fluid supply (blower), heater, concrete block, and controller. The blower located at the bottom of the device blew air at a constant velocity. The air blown from the blower was heated to the target maximum temperature of 400 °C by a heater and then passed through the pipe embedded in the concrete block as a heat transfer fluid. When the heat transfer fluid passes through the pipe in the concrete block, the process involves heat transfer from the heat transfer fluid to the concrete block (i.e., charging process) and heat transfer from the concrete block to the heat transfer fluid (i.e., discharging process). The controller of the device controlled the flow rate of the heat transfer fluid. It could also measure the difference in pressure between the inlet and outlet fluid in the concrete block and the temperature of the heat transfer fluid at the inlet and outlet of the concrete block. To minimize heat loss from the concrete block, the surface of the concrete block was covered with insulation.
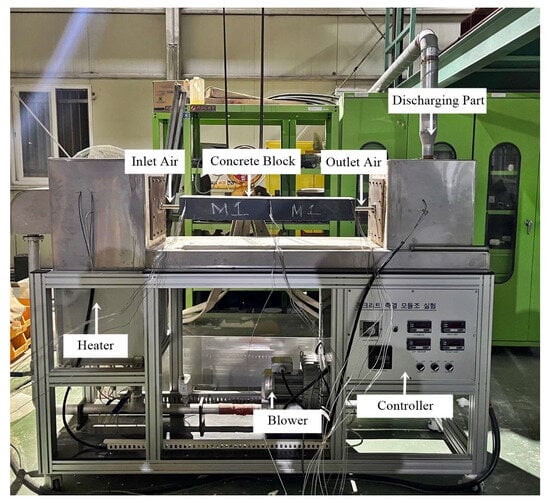
Figure 18.
The heating device used in the thermal experiment.
5.2. Numerical Simulation by FEM
The numerical analysis model was simulated using FEM, and the results were then compared with the experimental results for the concrete blocks. FE analysis was performed with ANSYS CFX 2022 R1.
A quarter of the concrete block was modeled to simplify the FE analysis process. The 3D geometry and cross-sectional mesh for the numerical model of the TES concrete block module are shown in Figure 19. Although insulation was used in the experiment, heat loss was not completely eliminated. To account for this effect in the FEM simulation, the heat transfer coefficient of the insulation layer was determined through a parameter study. This approach allowed the boundary conditions in the simulation to represent the actual experimental environment more accurately. Convection conditions at room temperature (25 °C) and a convection coefficient of 9 W/m2∙K obtained from Eurocode 1, Part 1–2 [33] were used in the FE analysis to model the insulation layer on the external surface of the concrete block.
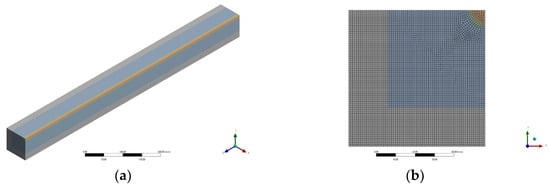
Figure 19.
Three-dimensional geometry and cross-sectional mesh of a quarter of a concrete block: (a) three-dimensional geometry and (b) cross-sectional mesh.
The simulation used a transient type, and the assumed total time was 420 min, which corresponded to the heating scenario of the experiment: heating stage (0–120 min), constant temperature (120–240 min), as shown in solid line in Figure 20, and discharging stage (240–420 min), as shown in dashed line in Figure 20.
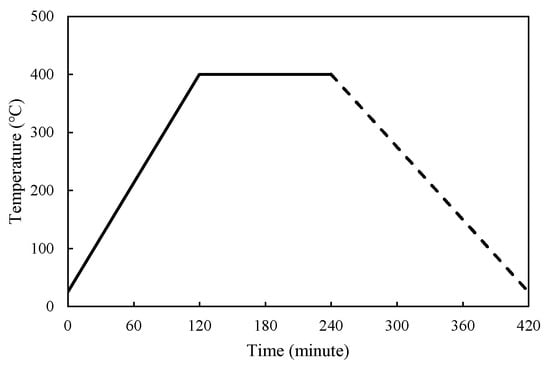
Figure 20.
Thermal cycle scenario for the concrete blocks.
The heat transfer fluid was set to flow at a velocity of 17 m/s and an intensity of 5%. The governing equation for the fluid domain is as follows:
where ρ is the density, htot is the total enthalpy, U is the flow velocity, T is the temperature, τ is the stress tensor, SE is the source and includes the external energy source, and the term is called the viscous work term. A convection boundary is considered between the heat exchangers (steel pipe) and the heat transfer fluid as Fourier’s Law of heat conduction between a fluid and a solid:
The following governing equation is applied to express the heat transfer condition between the concrete and the heat exchanger (steel pipe), as well as between the concrete and the insulation domains:
An adiabatic condition is assumed for the inlet and outlet sections of the concrete block for simplification.
where k represents the thermal conductivity.
Three FE analysis cases corresponding to the three experimental graphite concrete mixtures, G05, G10, and G15, were considered. The material input properties are summarized in Table 7. To evaluate the thermal performance of the concrete block for TES, the thermal properties obtained from the material test results for each concrete mixture were used as inputs for FE analysis. Overall, the material properties of the concrete obtained from the experimental results after four heating cycles were applied, and the values for the heat exchanger and heat transfer fluid were obtained from the ANSYS material library. Insulation material properties are obtained from structural design for fire safety [34].
Table 7.
Material input properties used for the numerical simulation.
Figure 21 shows a comparison of the temperatures obtained from both the experimental and numerical approaches during the charging and discharging stages for a block fabricated with a 10% graphite-containing mixture (G10 series mixture) among three blocks in three different sections. The temperature of the concrete block steadily increased as the HTF temperature increased during the charging stage, according to the experimental results. The temperature of the concrete block continued to increase at a slower rate than that of the charging state during the stage with a constant temperature in the thermal cycle scenario, where the HTF temperature was held constant and finally reached its peak temperature by the end of the stage. In the discharging stage, the temperature gradually decreased as the HTF temperature returned to room temperature.
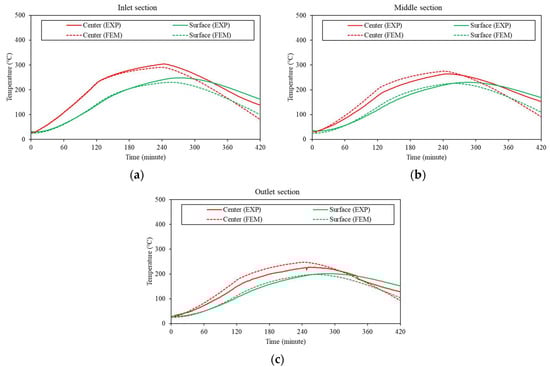
Figure 21.
Comparison of the temperature distributions between the experimental and numerical results for the G10 concrete block: (a) inlet section, (b) middle section, and (c) outlet section.
The center point of the concrete block, which was closer to the HTF, had a higher temperature than the surface point of the block. Similarly, the numerical results showed the same trend as the experimental results. For the numerical results from the FE analysis, the temperature increased in accordance with the thermal energy supply during the charging stage, then gradually increased during the constant temperature stage, and then decreased during the discharging stage.
Therefore, overall, the numerical results were in good agreement with the experimental data. The two curves from the experimental and numerical results closely matched, especially during the charging stage (0~240 min). Thus, the comparison verified the validity of the numerical simulation using FEM. This accomplishment allows future studies to observe thermal behavior by adjusting the input data without conducting experiments, thus increasing efficiency and reducing costs. Furthermore, the results reveal the crucial role of thermal properties in the heat performance of TES concrete, suggesting that future research should focus on this aspect.
6. Conclusions
The focus of this study was on investigating the experimental and numerical analysis results of the properties of concrete containing graphite for application in TES. The major conclusions are as follows:
- (1)
- The unit weight of the concrete specimens with graphite contents of 5%, 10%, and 15% was less than that of the concrete specimens including only OPC under room temperature, with reductions of 0.3%, 2%, and 2.6%, respectively. The lower density of graphite than OPC contributed to a greater decrease in the unit weight. The unit weight of the specimens was nearly constant after exposure to just one thermal cycle; these results indicated that the density characteristics of the concrete containing up to 15% graphite were similar to those of the OPC concrete.
- (2)
- The compressive strengths of samples G05, G10, and G15 were 8.8%, 18.4%, and 29.4% lower than those of the OPC specimens, and the splitting tensile strengths were 4.6%, 15.2%, and 19.4% lower, respectively. The depletion is caused by the absence of hydration components such as CaO and SiO2 in the graphite. However, after heat exposure, the decrease in the compressive strengths of samples G05, G10, and G15 (46.7%, 42.4%, and 38.3%, respectively) was less than that of the concrete containing OPC (51.9%). These results indicated that graphite provided improved thermal stability, possibly due to its inherent heat resistance.
- (3)
- The presence of graphite in the concrete mixture improved the thermal conductivity. The thermal conductivity of graphite concrete at both room temperature and high temperature was greater than that of OPC concrete as the graphite content increased; thus, the efficiency of graphite in the TES applications could be increased when the thermal conductivity is directly correlated with the thermal storage performance.
- (4)
- Microstructural analyses, such as SEM and XRD, further confirmed the role of graphite in terms of thermal resistance and structural integrity. The presence of graphite reduced portlandite formation, which slightly weakened the strength of the concrete. Moreover, the inclusion of graphite prevented excessive degradation in the thermal performance and thus compromised the loss of strength with improved thermal performance; these factors are essential for advanced applications.
- (5)
- The agreement between the experimental and numerical results confirmed the reliability of the FEM approach for predicting the thermal performance of graphite-incorporated concrete blocks. This validation could support the application of FEM simulations for optimizing concrete mixtures and designing TES systems, ensuring that experimental findings could be effectively reflected and analyzed under simulation conditions.
- (6)
- The study has presented the thermal performance of concrete containing graphite used for the TES system. From the results, future studies can expand the scope of application by adjusting the temperature range or quantity of graphite content in concrete samples. In addition, the number of thermal cycles, which is an important factor for a thermal storage system, can be considered in further studies. Moreover, other additives such as fly ash and slag could be considered to investigate the performance of TES concrete.
Author Contributions
Conceptualization, I.-H.Y. and S.-T.J.; data curation, S.-T.J. and J.-H.P.; formal analysis, T.-K.T.; investigation, J.-H.P.; resources, S.-T.J. and J.-H.P.; software, T.-K.T.; supervision, I.-H.Y.; visualization, S.-T.J. and T.-K.T.; writing—original draft preparation, T.-K.T.; and writing—review and editing, I.-H.Y. All authors have read and agreed to the published version of the manuscript.
Funding
This research was supported by a grant from the Basic Research Program funded by the Korea Institute of Machinery and Materials (grant number: NK256B).
Institutional Review Board statement
Not applicable.
Informed Consent Statement
Not applicable.
Data Availability Statement
The data used to support the findings in this study are available from the corresponding author upon request.
Conflicts of Interest
The authors declare no conflicts of interest.
References
- Sarbu, I.; Sebarchievici, C. A Comprehensive Review of Thermal Energy Storage. Sustainability 2018, 10, 191. [Google Scholar] [CrossRef]
- Dinçer, İ.; Rosen, M.A. Thermal Energy Storage; Wiley: Hoboken, NJ, USA, 2010; ISBN 9780470747063. [Google Scholar]
- Islam, M.P.; Morimoto, T. Advances in Low to Medium Temperature Non-Concentrating Solar Thermal Technology. Renew. Sustain. Energy Rev. 2018, 82, 2066–2093. [Google Scholar] [CrossRef]
- Kuravi, S.; Trahan, J.; Goswami, D.Y.; Rahman, M.M.; Stefanakos, E.K. Thermal Energy Storage Technologies and Systems for Concentrating Solar Power Plants. Prog. Energy Combust. Sci. 2013, 39, 285–319. [Google Scholar] [CrossRef]
- Wang, S.; Abdulridha, A.; Bravo, J.; Naito, C.; Quiel, S.; Suleiman, M.; Romero, C.; Neti, S.; Oztekin, A. Thermal Energy Storage in Concrete: Review, Testing, and Simulation of Thermal Properties at Relevant Ranges of Elevated Temperature. Cem. Concr. Res. 2023, 166, 107096. [Google Scholar] [CrossRef]
- Alonso, M.C.; Vera-Agullo, J.; Guerreiro, L.; Flor-Laguna, V.; Sanchez, M.; Collares-Pereira, M. Calcium Aluminate Based Cement for Concrete to Be Used as Thermal Energy Storage in Solar Thermal Electricity Plants. Cem. Concr. Res. 2016, 82, 74–86. [Google Scholar] [CrossRef]
- Cao, V.D.; Pilehvar, S.; Salas-Bringas, C.; Szczotok, A.M.; Rodriguez, J.F.; Carmona, M.; Al-Manasir, N.; Kjøniksen, A.-L. Microencapsulated Phase Change Materials for Enhancing the Thermal Performance of Portland Cement Concrete and Geopolymer Concrete for Passive Building Applications. Energy Convers. Manag. 2017, 133, 56–66. [Google Scholar] [CrossRef]
- John, E.; Hale, M.; Selvam, P. Concrete as a Thermal Energy Storage Medium for Thermocline Solar Energy Storage Systems. Solar Energy 2013, 96, 194–204. [Google Scholar] [CrossRef]
- Laing, D.; Bahl, C.; Bauer, T.; Fiss, M.; Breidenbach, N.; Hempel, M. High-Temperature Solid-Media Thermal Energy Storage for Solar Thermal Power Plants. Proc. IEEE 2012, 100, 516–524. [Google Scholar] [CrossRef]
- Buscemi, A.; Panno, D.; Ciulla, G.; Beccali, M.; Lo Brano, V. Concrete Thermal Energy Storage for Linear Fresnel Collectors: Exploiting the South Mediterranean’s Solar Potential for Agri-Food Processes. Energy Convers. Manag. 2018, 166, 719–734. [Google Scholar] [CrossRef]
- Bataineh, K.; Gharaibeh, A. Optimal Design for Sensible Thermal Energy Storage Tank Using Natural Solid Materials for a Parabolic Trough Power Plant. Solar Energy 2018, 171, 519–525. [Google Scholar] [CrossRef]
- Salomoni, V.A.; Majorana, C.E.; Giannuzzi, G.M.; Miliozzi, A.; Di Maggio, R.; Girardi, F.; Mele, D.; Lucentini, M. Thermal Storage of Sensible Heat Using Concrete Modules in Solar Power Plants. Solar Energy 2014, 103, 303–315. [Google Scholar] [CrossRef]
- Yang, I.-H.; Park, J. Mechanical and Thermal Properties of UHPC Exposed to High-Temperature Thermal Cycling. Adv. Mater. Sci. Eng. 2019, 2019, 9723693. [Google Scholar] [CrossRef]
- Hoivik, N.; Greiner, C.; Barragan, J.; Iniesta, A.C.; Skeie, G.; Bergan, P.; Blanco-Rodriguez, P.; Calvet, N. Long-Term Performance Results of Concrete-Based Modular Thermal Energy Storage System. J. Energy Storage 2019, 24, 100735. [Google Scholar] [CrossRef]
- Güler, O.; Er, Y.; Hekimoğlu, G.; Ustaoglu, A.; Sarı, A.; Subaşı, S.; Maraşlı, M.; Gencel, O. Production and Assessment of UV-Cured Resin Coated Stearyl Alcohol/Expanded Graphite as Novel Shape-Stable Composite Phase Change Material for Thermal Energy Storage. Appl. Therm. Eng. 2024, 247, 123105. [Google Scholar] [CrossRef]
- Dai, Z.; Zhang, G.; Xiao, Y.; Ding, Y.; Li, Y.; She, X.; Zhang, X.; Zhao, D. High-Directional Thermally Conductive Stearic Acid/Expanded Graphite—Graphene Films for Efficient Photothermal Energy Storage. Chem. Eng. J. 2024, 484, 149203. [Google Scholar] [CrossRef]
- Wei, C.; Li, Y.; Song, J.; Cheng, J.; Tang, Z. Supercooling Suppression and Thermal Conductivity Enhancement of Erythritol Using Graphite Foam with Ultrahigh Thermal Conductivity for Thermal Energy Storage. Int. Commun. Heat Mass Transf. 2024, 153, 107392. [Google Scholar] [CrossRef]
- Saglam, M.; Ceboglu, E.; Birinci, S.; Sarper, B.; Aydin, O. Thermal Cycling Performance of a Shell-and-Tube Latent Heat Thermal Energy Storage System with Paraffin/Graphite Matrix Composite. J. Energy Storage 2024, 83, 110697. [Google Scholar] [CrossRef]
- Chen, P.; Wang, C.; Bouazza, A.; Guo, Y.; Kong, G.; Ding, X. Assessment of Phase Change Material within Hollow Steel Balls Mixed with Graphite Powder-Enhanced Concrete for Underground Energy Structures. J. Energy Storage 2025, 120, 116489. [Google Scholar] [CrossRef]
- Chen, C.; Liu, X.; Liu, Z.; Shao, L.; Chang, H.; Liu, Q.; Miao, C.; Feng, P. Developing Heat-Conductive Concrete with Graphite-Modified Recycled Aggregates. Compos. B Eng. 2024, 284, 111721. [Google Scholar] [CrossRef]
- Li, S.; Yin, S.; Wang, Z.; Dai, Y. Effect of Carbon Fiber and Graphite on the Mechanical Properties of Conductive Fine-Grained Concrete in Textile Reinforced Concrete. Structures 2023, 56, 104929. [Google Scholar] [CrossRef]
- Rao, R.; Wang, H.; Wang, H.; Tuan, C.Y.; Ye, M. Models for Estimating the Thermal Properties of Electric Heating Concrete Containing Steel Fiber and Graphite. Compos. B Eng. 2019, 164, 116–120. [Google Scholar] [CrossRef]
- Han, C.-G.; Hwang, Y.-S.; Yang, S.-H.; Gowripalan, N. Performance of Spalling Resistance of High Performance Concrete with Polypropylene Fiber Contents and Lateral Confinement. Cem. Concr. Res. 2005, 35, 1747–1753. [Google Scholar] [CrossRef]
- ASTM D5334-00; Test Method for Determination of Thermal Conductivity of Soil and Rock by Thermal Needle Probe Procedure. ASTM: West Conshohocken, PA, USA, 2022.
- DIN EN ISO 22007-2:2015-12; Kunststoffe_-Bestimmung Der Wärmeleitfähigkeit Und Der Temperaturleitfähigkeit_-Teil_2: Transientes Flächenquellenverfahren (Hot-Disk-Verfahren) (ISO_22007-2:2015). European Standard: Brussels, Belgium, 2015.
- Liu, H.; Li, L. Graphitic Materials: Intrinsic Hydrophilicity and Its Implications. Extreme Mech. Lett. 2017, 14, 44–50. [Google Scholar] [CrossRef]
- Yuan, H.-W.; Lu, C.-H.; Xu, Z.-Z.; Ni, Y.-R.; Lan, X.-H. Mechanical and Thermal Properties of Cement Composite Graphite for Solar Thermal Storage Materials. Solar Energy 2012, 86, 3227–3233. [Google Scholar] [CrossRef]
- Dash, M.K.; Patro, S.K.; Acharya, P.K.; Dash, M. Impact of Elevated Temperature on Strength and Micro-Structural Properties of Concrete Containing Water-Cooled Ferrochrome Slag as Fine Aggregate. Constr. Build. Mater. 2022, 323, 126542. [Google Scholar] [CrossRef]
- Saleh, A.N.; Attar, A.A.; Ahmed, O.K.; Mustafa, S.S. Improving the Thermal Insulation and Mechanical Properties of Concrete Using Nano-SiO2. Results Eng. 2021, 12, 100303. [Google Scholar] [CrossRef]
- Coelho, N.P.F.; Nalon, G.H.; Mendes, J.F.; de Oliveira, T.J.P.; Mendes, R.F. Effects of Coffee Husk Biochar on the Properties of Concrete. Constr. Build. Mater. 2025, 491, 142680. [Google Scholar] [CrossRef]
- Ahmad, F.; Rawat, S.; Yang, R.; Zhang, L.; Zhang, Y.X. Fire Resistance and Thermal Performance of Hybrid Fibre-Reinforced Magnesium Oxychloride Cement-Based Composites. Constr. Build. Mater. 2025, 472, 140867. [Google Scholar] [CrossRef]
- Abhilash; Uma Maheswari, M.; Raghava Reddy, K.; Aminabhavi, T.M.; Aravindan, V.; Meshram, P. Recycling Strategies for Renewable Graphite and Other Carbon Nanomaterials from Used Batteries: A Review. J. Clean. Prod. 2025, 493, 144871. [Google Scholar] [CrossRef]
- EN 1991-1-2; Eurocode 1: Actions on Structures—Part 1–2: General Actions—Actions on Structures Exposed to Fire. The European Union: Brussels, Belgium, 2002.
- Buchanan, A.H.; Abu, A.K. Structural Design for Fire Safety; John Wiley & Sons Inc.: Hoboken, NJ, USA, 2017; ISBN 9780470972892. [Google Scholar]
Disclaimer/Publisher’s Note: The statements, opinions and data contained in all publications are solely those of the individual author(s) and contributor(s) and not of MDPI and/or the editor(s). MDPI and/or the editor(s) disclaim responsibility for any injury to people or property resulting from any ideas, methods, instructions or products referred to in the content. |
© 2025 by the authors. Licensee MDPI, Basel, Switzerland. This article is an open access article distributed under the terms and conditions of the Creative Commons Attribution (CC BY) license (https://creativecommons.org/licenses/by/4.0/).