Article

Fuzzy Logic Estimation of Coincidence Factors for EV Fleet Charging Infrastructure Planning in Residential Buildings

by
Salvador Carvalhosa
1,2,*,
José Rui Ferreira
1,2 and
Rui Esteves Araújo
1,2
1
INESC TEC—Institute for Systems and Computer Engineering, Technology and Science, Centre for Power and Energy Systems, s/n R. Dr. Roberto Frias, 4200-465 Porto, Portugal
2
Faculty of Engineering, University of Porto, s/n R. Dr. Roberto Frias, 4200-465 Porto, Portugal
*
Author to whom correspondence should be addressed.
Energies 2025, 18(17), 4679; https://doi.org/10.3390/en18174679
Submission received: 29 July 2025 / Revised: 27 August 2025 / Accepted: 28 August 2025 / Published: 3 September 2025

Abstract

As electric vehicle (EV) adoption accelerates, residential buildings—particularly multi-dwelling structures—face increasing challenges to electrical infrastructure, notably due to conservative sizing practices of electrical feeders based on maximum simultaneous demand. Current sizing methods assume all EVs charge simultaneously at maximum capacity, resulting in unnecessarily oversized and costly electrical installations. This study proposes an optimized methodology to estimate accurate coincidence factors, leveraging simulations of EV user charging behaviors in multi-dwelling residential environments. Charging scenarios considering different fleet sizes (1 to 70 EVs) were simulated under two distinct premises of charging: minimization of current allocation to achieve the desired battery state-of-charge and maximization of instantaneous power delivery. Results demonstrate significant deviations from conventional assumptions, with estimated coincidence factors decreasing non-linearly as fleet size increases. Specifically, applying the derived coincidence factors can reduce feeder section requirements by up to 86%, substantially lowering material costs. A fuzzy logic inference model is further developed to refine these estimates based on fleet characteristics and optimization preferences, providing a practical tool for infrastructure planners. The results were compared against other studies and real-life data. Finally, the proposed methodology thus contributes to more efficient, cost-effective design strategies for EV charging infrastructures in residential buildings.

1. Introduction

The growing adoption of electric vehicles (EVs) places significant new demands on residential electrical infrastructures. While single-family homes can generally absorb this load, multi-dwelling buildings face simultaneous charging events that stress feeders, switchboards, and transformers originally sized without considering EV integration. Current planning practices, dictated by national standards [1,2], apply conservative coincidence factors (Cfs). Although this ensures reliability, it often results in oversizing and inflated installation costs, while failing to capture variability in charging demand.
Several empirical studies have demonstrated the time-dependent nature of EV charging. Large datasets of charging sessions reveal distinct differences between residential and public usage, as well as the emergence of evening “duck curve” peaks [3]. Others confirm that most home charging occurs overnight at reduced rates, motivated by vehicle availability and lower tariffs [4]. Still, synchronized charging during price-attractive windows can raise simultaneity factors and stress distribution transformers [5,6,7]. These works underline that charging behavior is heterogeneous and that peak coincidence is not a fixed property but depends on timing, control, and user choices.
Beyond the home, research on shared mobility and fleet-based systems further highlights demand clustering. Car-sharing studies report temporal and spatial peaks tied to weather, weekday patterns, and proximity to transit hubs [8]. Planning methodologies for shared or autonomous fleets likewise account for stochastic demand, battery constraints, and clustered behaviors [9,10,11]. Reviews of charging demand modeling emphasize the limitations of static or deterministic assumptions and call for planning tools that account for uncertainty and heterogeneous user profiles [12]. Even where advanced control strategies are considered, planning-stage methods rarely address the variability of demand in a way that informs feeder or breaker sizing for multi-dwelling buildings.
Residential-focused studies confirm the risks of unmanaged charging in apartment complexes. Field data and simulations show that peak demand rises sharply with EV penetration but can be mitigated through coordinated load management, reducing peaks by ~40% at full adoption [7]. Stochastic modeling of apartment charging further indicates that transformer loss-of-life accelerates significantly with penetration levels, though rooftop PV can partly offset this effect [13]. Other works investigate household-level charging [14,15,16], charging station deployments [17], and residential area scenarios [18,19], but often neglect optimization strategies or the specific challenges of retrofitting multi-unit dwellings.
Table 1 summarizes representative studies and shows that while EV load modeling has advanced across various contexts, gaps remain in multi-dwelling scenarios. In particular, prior work typically assumes fixed or unoptimized charging power, disregards user-behavior-driven optimization, or omits feeder sizing considerations. Consequently, infrastructure is often over-dimensioned, creating economic barriers for EV adoption in residential buildings.
Recent reviews also highlight the relevance of fuzzy logic for EV demand modeling. By classifying uncertain inputs—such as state of charge, trip distance, and range—into fuzzy sets, these methods can simulate heterogeneous charging decisions without exhaustive behavioral data [22]. Such approaches are well-suited to bridge the gap between simplified Cf assumptions and the complex variability observed in practice.
This paper makes four main contributions.
  • We develop coincidence factor estimations based on simulated EV user behavior for multi-dwelling residential contexts, extending beyond the single-dwelling and public charging focus of earlier studies.
  • We analyze optimization strategies (minimization and maximization) and quantify their impact on infrastructure sizing.
  • We design a fuzzy inference model that dynamically adapts Cf values to realistic scenarios, allowing expert input at the planning stage while avoiding the need for detailed behavioral datasets.
  • We demonstrate substantial practical benefits, including feeder size reductions up to 86% and optimized breaker sizing, translating to lower installation costs and improved infrastructure planning.
The remainder of the paper is structured as follows. Section 2 details the methodology for coincidence factor estimation, Section 3 presents simulation scenarios and key findings, Section 4 discusses practical implications and limitations, and Section 5 concludes.

2. Methodology

2.1. Coincidence Factor Concept

The coincidence factor (Cf), also known as the simultaneity or demand factor (DF), is critical for accurately sizing electrical feeders in residential buildings, particularly when integrating EV charging infrastructure. According to IEC 60050, the coincidence factor reflects the likelihood that multiple electrical loads will reach their peak simultaneously. Conventionally, regulations apply conservative Cf values, often assuming maximum simultaneous EV charging, which results in oversized infrastructure.
However, real-world EV charging behavior in residential buildings rarely reaches this assumed simultaneity. EV users typically charge their vehicles based on daily commuting patterns, battery capacities, and individual usage habits, leading to significantly lower actual peak demand. Thus, accurately estimating coincidence factors based on realistic user behaviors is vital for cost-effective infrastructure sizing; however, the availability of large datasets where charging events can be tracked is lacking, even more so when different levels of EV penetration in multi-residential buildings are required. Therefore, generating trusted and reliable synthetic data is critical to conducting these types of estimations.

2.2. Methodology Overview

The overall methodology for this research is presented in Figure 1 and, as illustrated, is broken down into 6 main blocks.
In the first block, a random fleet of EVs is generated, with a given fixed number of EVs with different characteristics according to current market trends.
Then, for each fleet size, the first 10 simulations were carried out using the same fleet characteristics, meaning that the starting conditions were the same. The remaining 10 simulations were split into two groups of 5, with one group having more demanding conditions, such as higher daily discharges and larger battery capacities, and the other group with less demanding conditions.
Once each fleet with different characteristics is generated, the simulation runs, modeling the daily discharges and charges of each EV in the fleet and saving each charging current into a database. When all simulations are carried out, the data for the charging currents is processed to extract, amongst other information, the maximum number of EVs charging at any given time, as well as the maximum charging current registered. This allows us to calculate the coincidence factors and compute the different curves for the fuzzy inference model.

2.3. EV Charging Simulations

To develop accurate coincidence factor estimates, this study employs extensive simulations of EV charging behaviors, considering fleet sizes ranging from 1 to 70 vehicles. Each simulation scenario involves defining EV fleet characteristics, including initial battery state-of-charge (SoC), required daily energy (based on commuting distances and user habits), battery capacity, and charging current limits.
Simulations were conducted over representative daily cycles with three-minute resolution, capturing realistic variations in charging behavior. The main simulation inputs for each EV include the following:
  • Initial State-of-Charge (SoC): Randomly assigned within realistic daily operational ranges (typically between 20 and 80%).
  • Desired SoC: Determined daily based on expected commuting patterns and typical usage behavior. Also accounts and checks for the previous threshold (20–80%), typically within the range that users report charging to protect the battery.
  • Battery Capacity: Set according to industry-standard EV battery sizes (20–100 kWh).
  • Charging Current Limit: Defined at 16 A per phase, representing typical residential slow-charging infrastructure.
The charging periods for each EV were scheduled based on typical residential patterns, predominantly overnight charging during off-peak hours.

2.4. Optimization Scenarios

Two distinct optimization strategies were applied in simulations to reflect varying infrastructure design goals.
  • Minimization Scenario: The algorithm, developed in [23], allocates the minimum possible electrical current to achieve the desired SoC by the scheduled unplugging time. This scenario represents conservative, cost-effective infrastructure sizing where peak demands are minimized.
  • Maximization Scenario: Charging is optimized to deliver the maximum available power instantaneously, potentially achieving desired SoC levels well before scheduled unplugging. This reflects scenarios where power availability or charging speed is prioritized over cost constraints.
These two distinct strategies are crucial to correctly frame the space of viable solutions for the fuzzy coincidence factor to be estimated, as they will act as the lower and upper bounds.

2.5. Simulation Approach

To accurately estimate realistic coincidence factors, extensive EV charging simulations were performed across various scenarios representative of multi-dwelling residential buildings. These simulations covered a wide range of fleet sizes (1, 2, 5, 10, 15, 20, 25, 30, 40, 50, 60, and 70 EVs), thus providing a comprehensive dataset for analysis. Each scenario involved multiple simulation runs to account for variability in EV user behaviors and charging demands.
In total, 240 simulations were conducted—20 simulations per fleet size—to ensure robust results. Each simulation spanned an 80-day period with a high-resolution temporal granularity (3 min intervals), adequately capturing typical fluctuations in charging behavior and load profiles.
This work leverages other studies to complement the carried-out simulations and generate reliable synthetic data that allows for valid results. Several factors come into play when considering charging patterns and charging habits of EV users; these patterns and habits play a key role in the dimensioning of electrical infrastructures. The work carried out in [24] categorizes EV users into nine types. Of these, three groups, representing 49% of users, primarily charge overnight, with an average frequency between 1.86 and 4.60 sessions per week. These groups are the most relevant for our study, since their charging behavior directly contributes to peak load in residential buildings. The remaining six user types either charge predominantly during off-peak, low-demand periods or do not charge at home at all, and thus, have a limited impact on residential infrastructure requirements. The classification is further supported by metrics such as average daily distance travelled and battery capacity use, which were applied to characterize both user groups and EV fleet compositions.

2.6. Coincidence Factor Estimation from Simulation Results

The coincidence factor (Cf-simulated) for each EV fleet size was calculated using Equation (1) by leveraging the outputs from the simulations to plot the discrete values.
C f s i m u l a t e d = M a x i m u m   C u r r e n t   O b s e r v e d E V   F l e e t   S i z e × E V   M a x i m u m   C u r r e n t
where
  • Maximum Observed Current: Highest total charging current recorded during simulations for each fleet size.
  • Fleet Size: Number of EVs simulated.
  • Maximum Current per EV: Defined as 16 A per phase.
Recognizing that absolute maximum values can include outliers or extreme conditions, an adjusted coincidence factor was also calculated by disregarding the highest 1% of current values. This “99% maximum” coincidence factor provides a more realistic and robust basis for feeder sizing, as the top 1% values can be easily mitigated by implementing specific rules, and their occurrence had little expression, time-wise, meaning they occurred very rarely and for very short periods.

2.7. Coincidence Factor Model Development

Leveraging on the results of the simulations and by using Equation (1), it is possible to plot at a discrete level the coincidence factors for different fleet sizes at each scenario, then, with the plotted values, a curve is fitted following a power-law trend, according to Equation (2).
C f s c e n a r i o = a n b
where Cf-scenario is the fitted coincidence factor for a given optimization scenario, n is fleet size, and a and b are fitting parameters determined from the simulation’s discrete results. Model accuracy was evaluated using the coefficient of determination (R2), ensuring a robust and practical predictive capability.

2.8. Fuzzy Logic Inference Model

To enhance the adaptability and contextual relevance of the coincidence factor (Cf) estimations, we developed a fuzzy inference system (FIS) that introduces a scenario-specific correction to the base Cf values. The fuzzy model developed constitutes a solution to the problem, as it has an interesting and useful property, which is its intrinsic adaptability to information uncertainties. Briefly, owing to the smooth transitions in the grades of memberships of linguistic variables, they make it possible to tolerate inaccuracies in the initial electrical installation requirements. The model incorporates two linguistic variables.
  • Demand Level: A qualitative estimate of the fleet’s average charging needs is characterized as Low, Medium, or High.
  • Optimization Level: The level of control and demand management offered by the charging infrastructure (e.g., unmanaged, load-balanced, predictive), also categorized as Low, Medium, or High.
Beyond the linguistic variables, it also includes the base coincidence factor (Cf.avg), which is computed from the analytical model described in Section 3.
The output variable of the fuzzy model is a fuzzy correction coefficient (FCC), which adjusts the base Cf estimate, as demonstrated in Equation (3):
C f . f u z z y = C f . a v g   × F C C
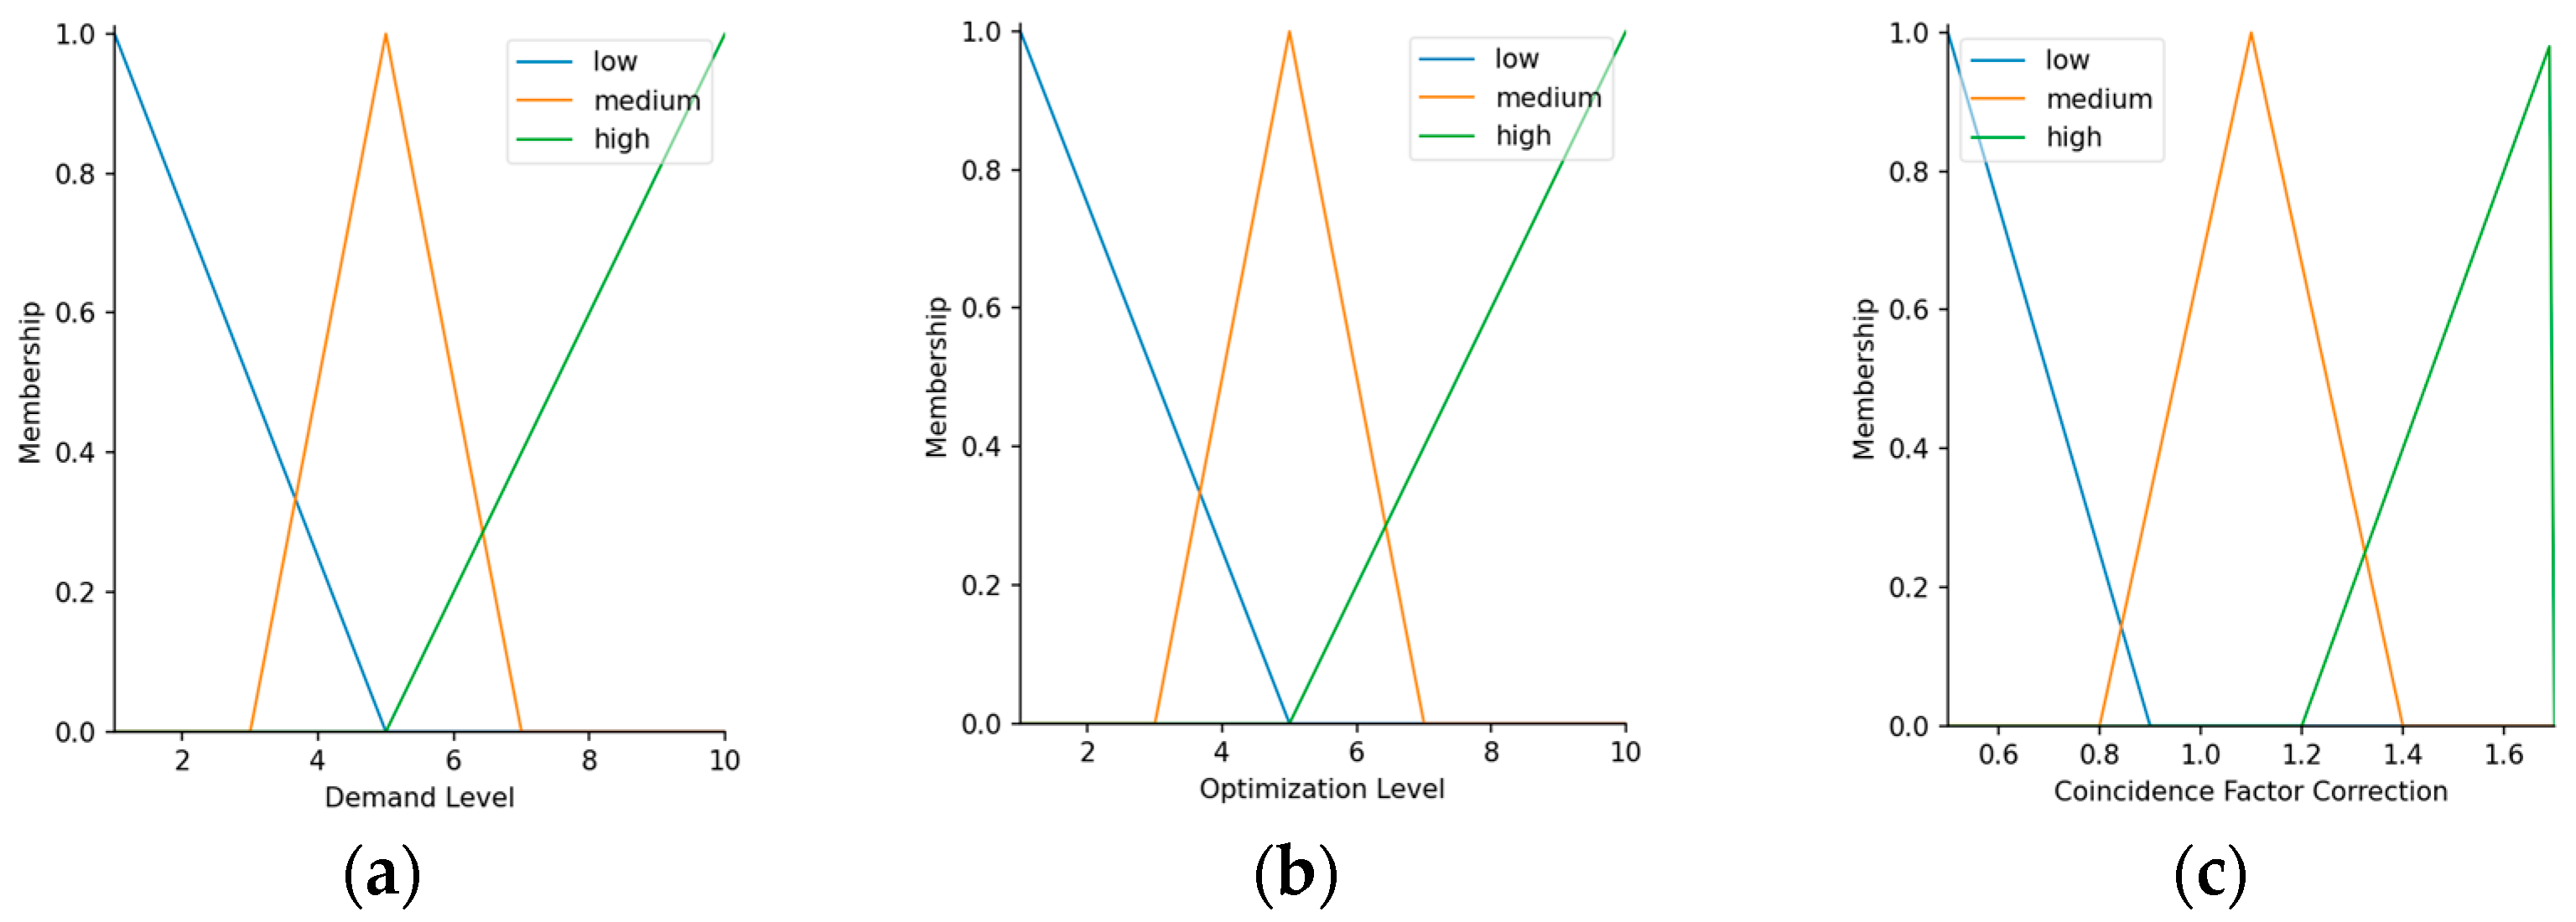
The model uses triangular membership functions for all inputs and output variables, illustrated in Figure A1 (in Appendix A). The rule base consists of nine expert-informed logical rules, as follows:
  • If demand is high and optimization is low, then FCC is high;
  • If demand is low and optimization is high, then FCC is low;
  • If both are medium or contradicting, then FCC is medium.
Defuzzification is performed using the centroid method, providing a crisp output for FCC. This structure allows the planner to encode real-world expectations about user behavior and control sophistication into a flexible, transparent correction mechanism. The full rule set and membership function parameters are available in Appendix A.

3. Results

3.1. Coincidence Factor Estimation—Allocated Current Under Minimization Problem

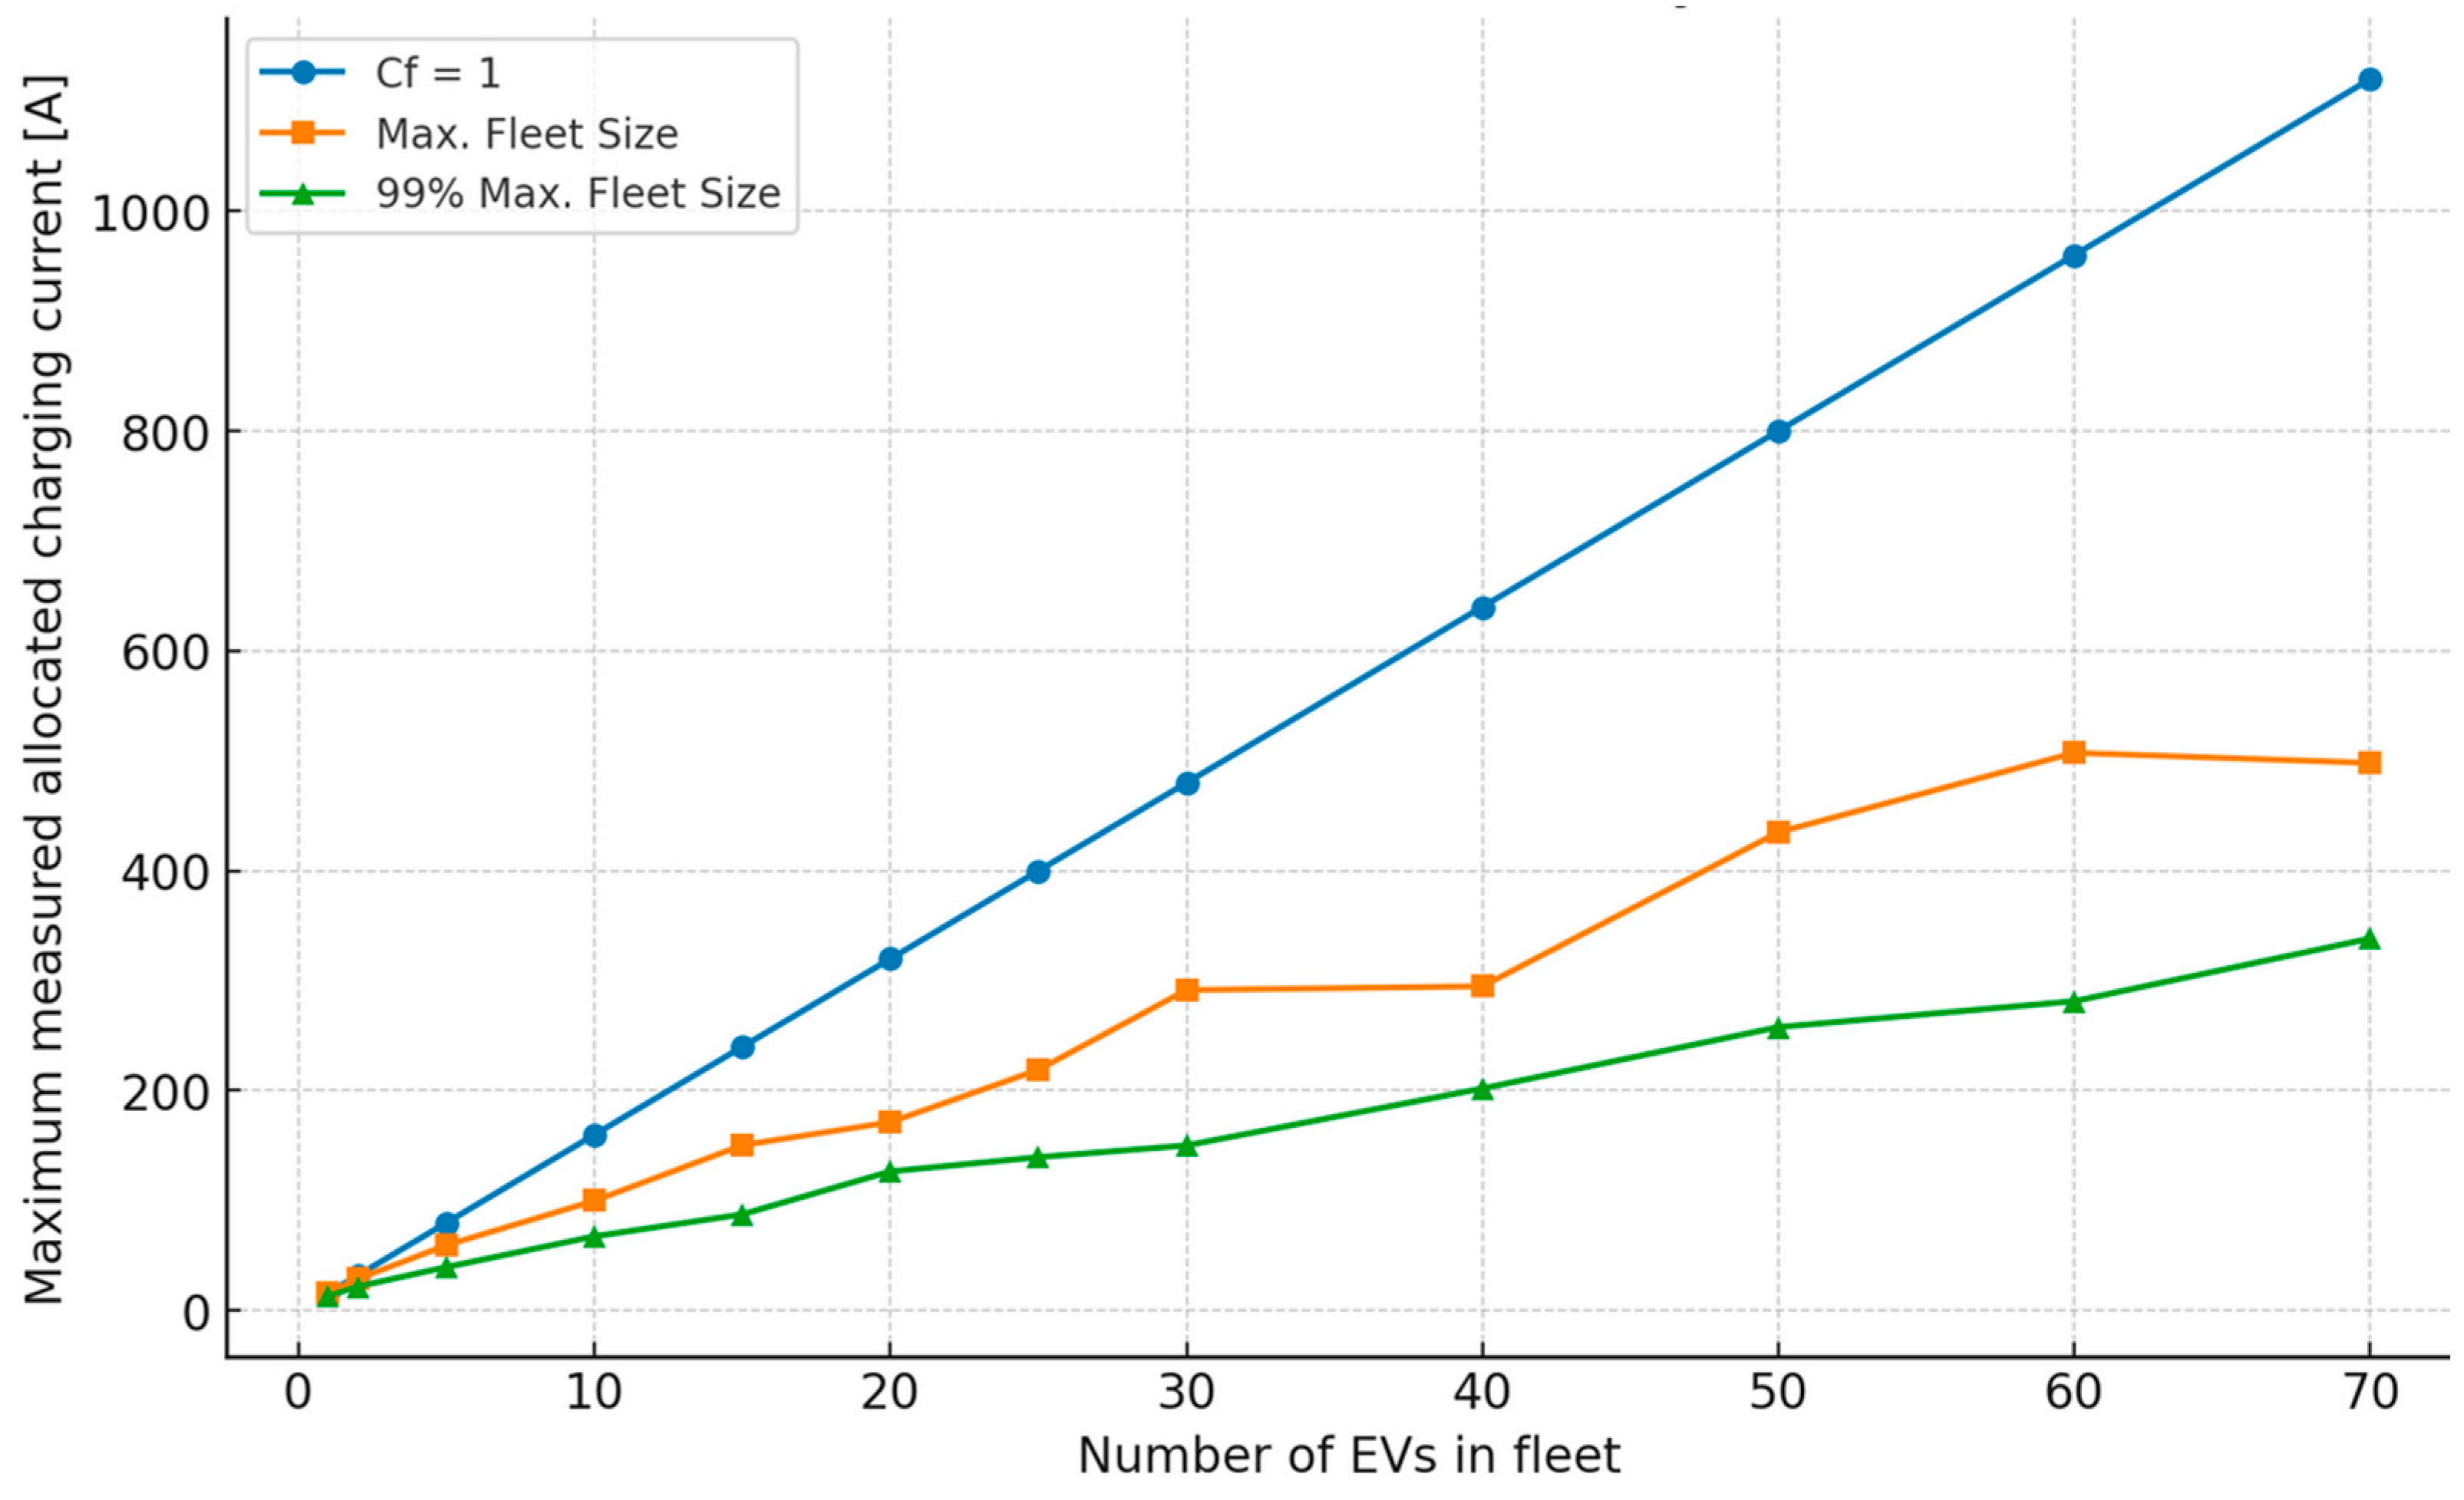
Regarding the allocated current, under the minimization problem, the value increases as the overall fleet size increases; however, it does not increase proportionally but with diminishing returns. This relation can be observed in the following Figure 2.
By analyzing the previous Figure 2, it is possible to observe how the maximum value of allocated charging increases with the increase in the overall fleet. This means that the larger the fleet is, the higher the energy needs will be; however, it becomes evident that there is no need to consider a Cf equal to 1, as this would lead to an overestimation of energy needs. Looking at the worst-case scenario of a fleet size of 70 EVs, we see that by considering a Cf equal to 1 would mean an allocated current of 1120 A. However, during simulations and disregarding the top 1% of values, the maximum allocated current observed was 338.44 A, which is a decrease of 69.78%.
Furthermore, as demonstrated in Figure 3, the actual knee of the cumulative sum curve is closer to the 90% mark at 256.0 A. Nonetheless, to disregard 10% of the values and design the system for a maximum of 256.0 A would put the feeders at higher risk of overheating and causing recurring system shutdowns and possible energy shortages.
Leveraging the data from the simulations, based on both behavioral aspects of EV users and charging algorithms, it is possible to extrapolate the Cf equations for each one of the fleet’s sizes, taking into account both the maximum allocated current overall, Cf1, and the maximum allocated current when disregarding the highest 1% values, Cf2, as seen in Figure 4.
The trend observed in Figure 4 can be described by the following Equations (4) and (5). Both these functions describe the coincidence factor, Cf, with satisfactory levels of R2, of 0.85 and 0.89, respectively.
C f 1 = 0.9023 n 0.203   n   ϵ   N , n u m b e r   o f   E V s   i n   t h e   f l e e t
C f 2 = 0.6542 n 0.224   n   ϵ   N , n u m b e r   o f   E V s   i n   t h e   f l e e t

3.2. Coincidence Factor—Allocated Current Under Maximization Problem

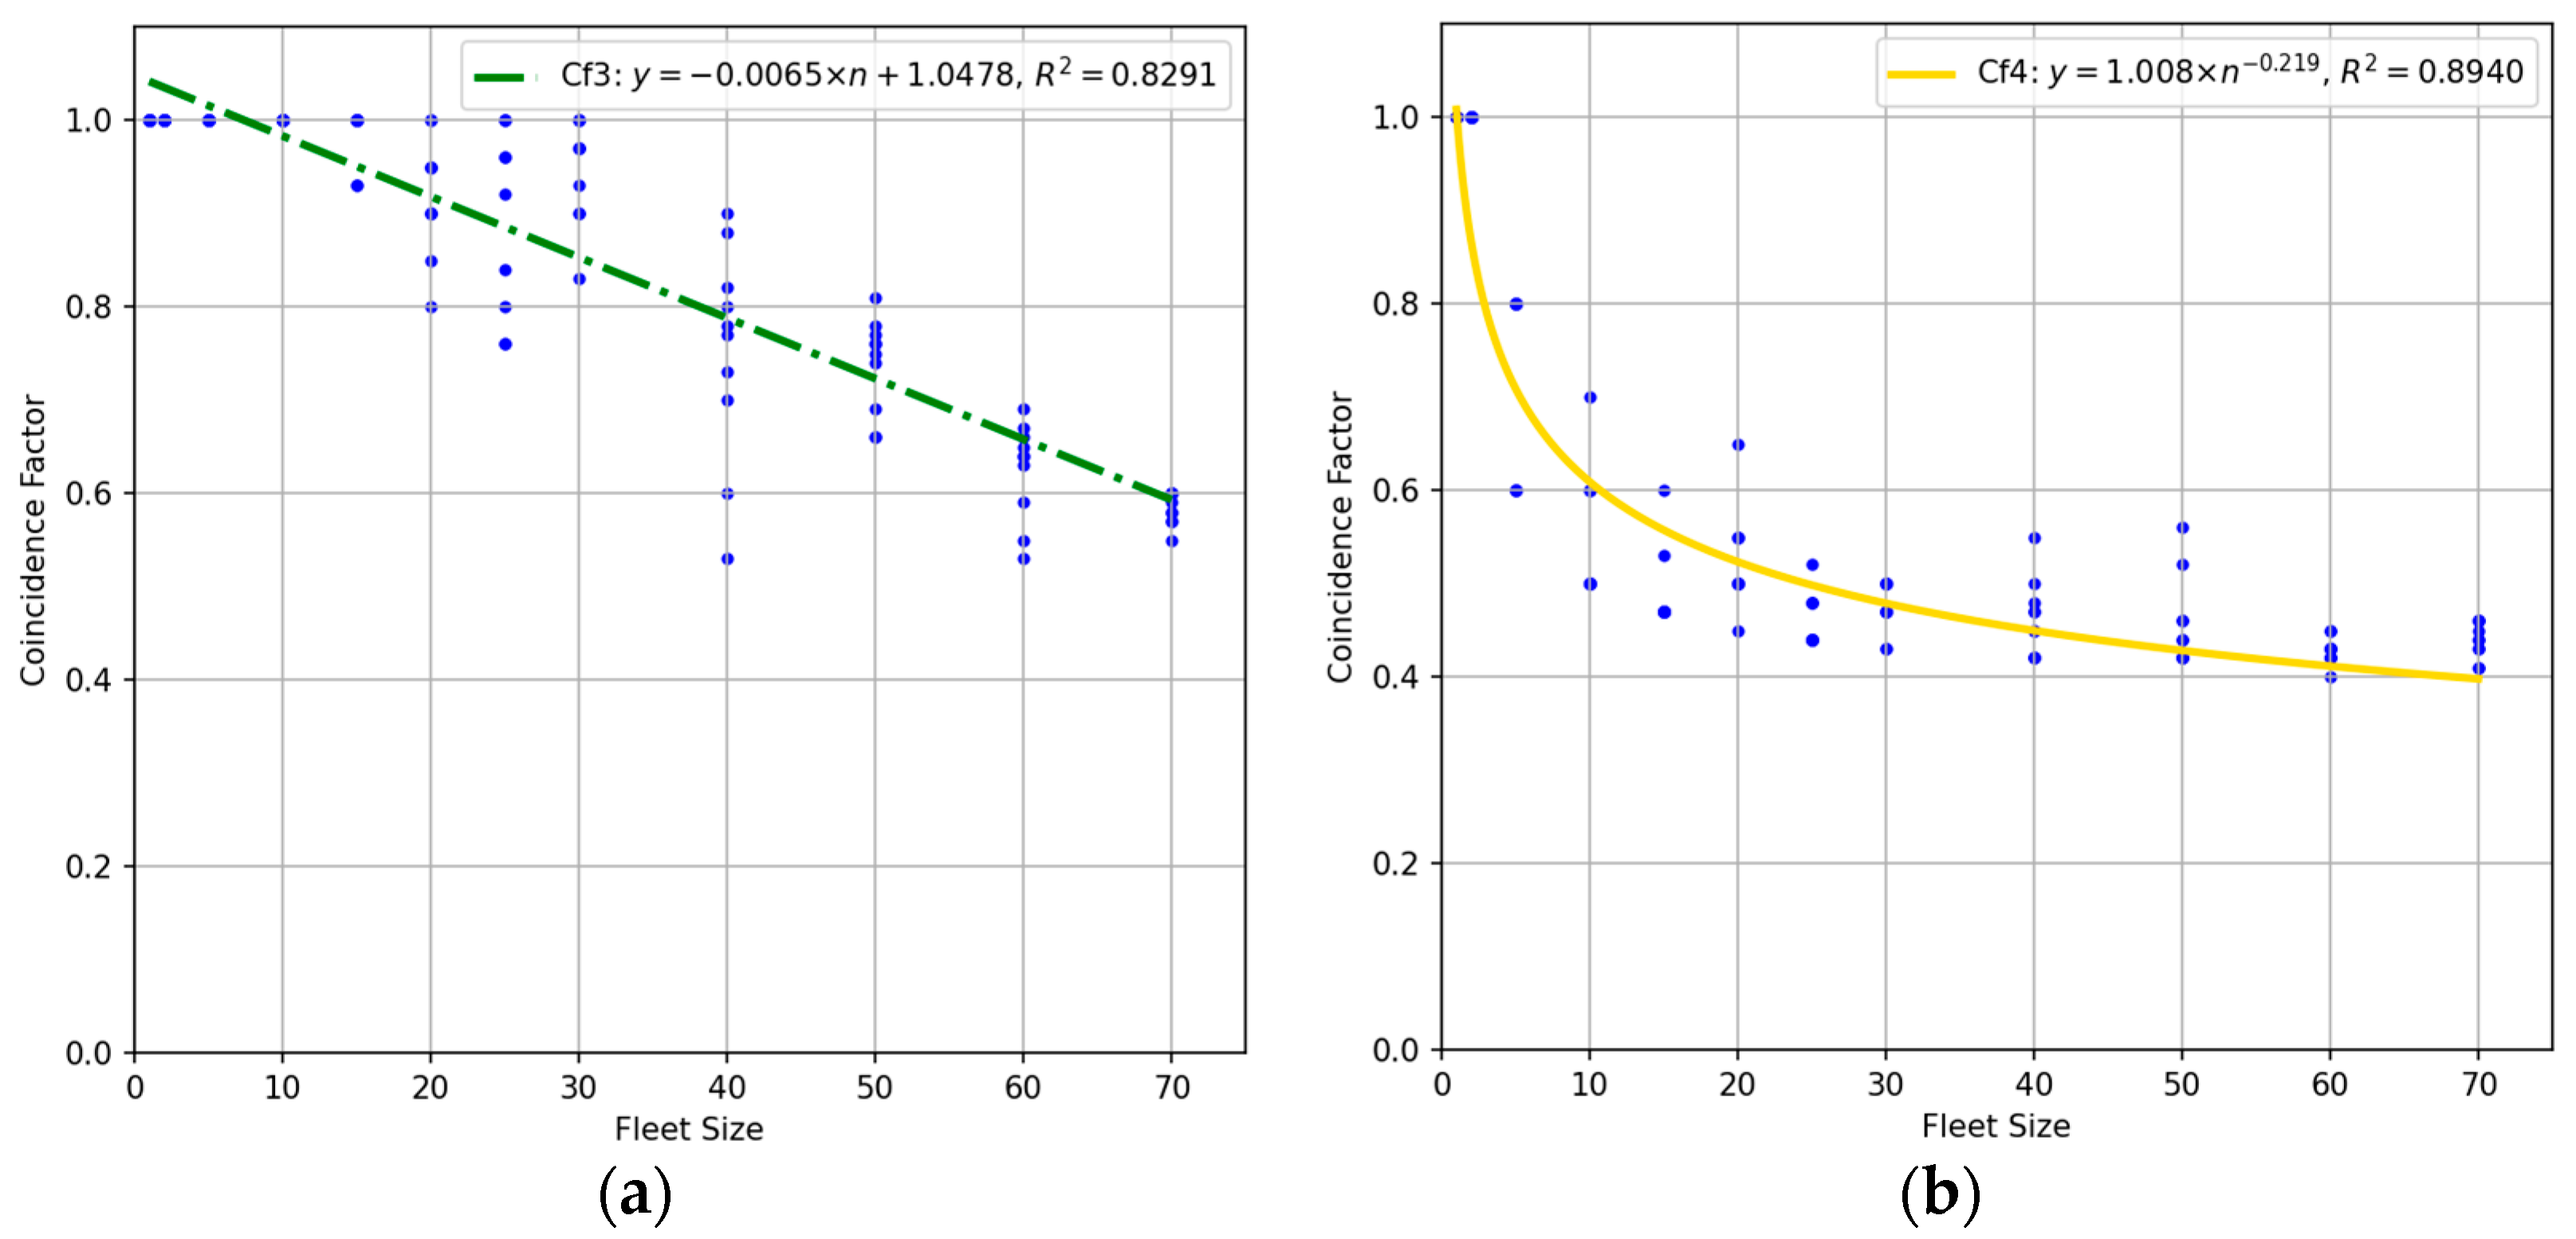
Contrasting with the minimization problem, the maximization problem aims to allocate the maximum possible electrical current to each charging EV, simulating a high demand and low optimization scenario, even if this means that the EV will reach its desired SoC before the expected unplug time. Figure 5 presents the number of EVs charging in relation to the fleet size.
Once more, both trends observed in the previous Figure 5 can be described by the following Equations (6) and (7). The scatter plot and respective trendlines observed for Cf3 and Cf4, with their respective R2 values of 0.8291 and 0.8940.
C f 3 = 0.0065 × n + 1.0478   n   ϵ   N , n u m b e r   o f   E V s   i n   t h e   f l e e t
C f 4 = 1.008 n 0.219   n   ϵ   N , n u m b e r   o f   E V s   i n   t h e   f l e e t
However, to properly consider Cf3 as the upper boundary of the feasible region of solutions, a new trendline was calculated, using a power function instead of a linear approximation.
This new approach, as expected, yielded a reduced value of R2 of 0.476, which can be observed in Figure 6, but when analyzing the re-fitted curve of Cf3, we observe that it underestimates the coincidence value for smaller fleet sizes and overestimates for larger fleet sizes. This characteristic was preferred over the linear fitting of Cf3 as it not only presents a more conservative approach but will also lead to larger feeder and breaker sizing for larger fleets, assuring a safer operation during high-demand periods.

3.3. Average Coincidence Factor Estimation

As previously mentioned, the trendlines for the coincidence factors of Cf3 and Cf2 will be the boundaries for the Cf-fuzzy, and the starting point will be a curve described by Cf-avg; this starting point or input will be equivalent to a scenario where no correction is applied and can be seen in Equation (8).
C f . a v g = 0.9292 n 0.1887   n   ϵ   N , n u m b e r   o f   E V s   i n   t h e   f l e e t
Applying this transformation to Cf3 and calculating a new Cf.avg allows us to extrapolate a new plot where the feasible range solutions area can be observed in Figure 7.

3.4. Fuzzy Coincidence Factor Estimation

The goal of defining a Cf-fuzzy is to provide planners with a useful tool that facilitates the definition of a coincidence factor for the development of a given electrical infrastructure, based on the size of the EV fleet, the habits of the users, and the level of optimization provided by the charging system.
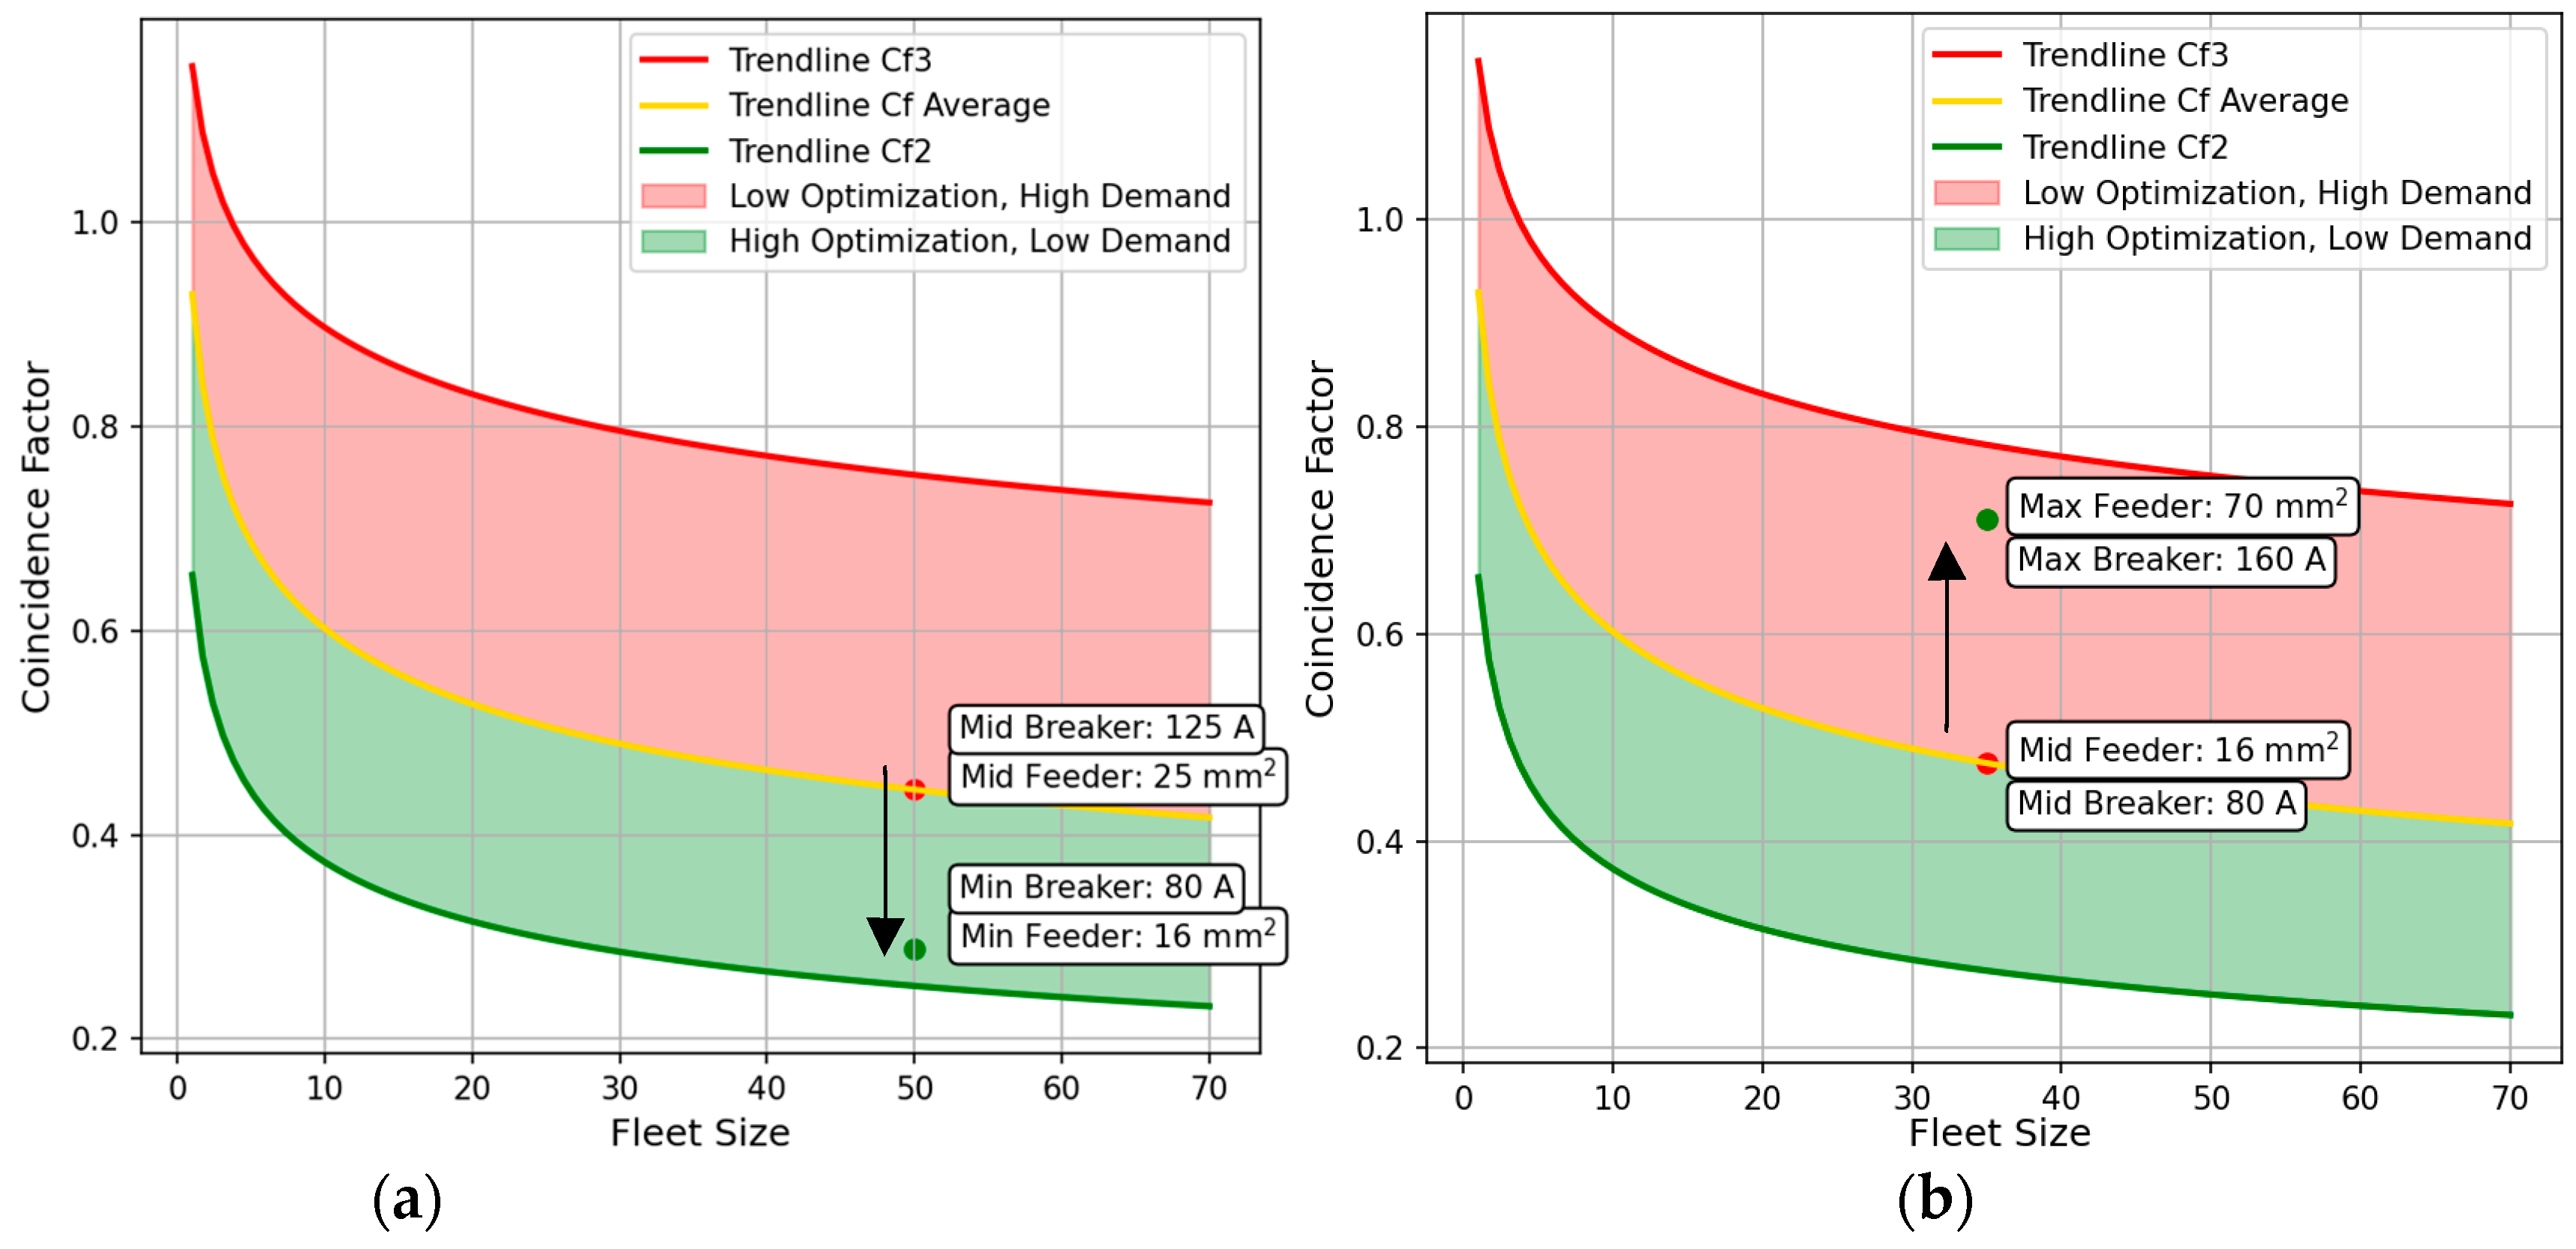
Now, it is possible to create a fuzzy logic inference method that, using as input the Sc.avg, plus the demand and optimization levels, outputs a Cf-fuzzy for the fleet size being considered and the characteristics of the charging equipment, as seen in Figure 8.
For example, if we consider a fleet size of 50, we have a Sc.avg of 0.444, but with a demand level of 2 (in a scale of 1 to 10) and an optimization level of 7, it is corrected to 0.295, because the model accounts for both the user behavior and the system’s capabilities of optimizing the charging process, in this case both causing a decrease in expected energy consumption. The use of a fuzzy inference model to correct the average coincidence factor is justified by the inherently imprecise nature of the influencing variables, such as “Demand Level” and “Optimization Level”. These concepts are not easily defined by crisp numerical values, as they reflect qualitative judgments about user behavior and system intelligence. By allowing planners to provide these inputs in linguistic terms (e.g., “low,” “medium,” “high”), the fuzzy model captures the uncertainty and variability associated with real-world EV fleet operations.
This approach enables more realistic and adaptable modeling, improving the accuracy of the adjusted coincidence factor while reducing the reliance on hard-to-define thresholds.

3.5. Electrical Feeder Analysis

To validate the calculated Cf1 and Cf2, it is important to cross-check with the commonly used feeders in these types of electrical installations. For the purposes of this study, the authors considered commonly used sheeted copper and aluminum cables with the following characteristics, as seen in Table 2.
Table 3 presents the minimum required feeder section for Cf1 and Cf2, according to the maximum observed electrical current per fleet size. It is important to notice that the section of feeder depends on several factors, meaning that the maximum allowed current can change for the same feeder depending on its length, type of installation, number of neighboring feeders, and other external factors.
For this study, the impact of voltage drops along the feeder was disregarded, as it varies with each installation, and an isolated feeder deployment in perforated cable trays was considered, meaning a best-case scenario in heat dissipation by the feeder. Continuing, Figure 9 presents the 2D plot of fleet size versus maximum current, underlayered by the recommended feeder for Cf1, and Figure 10 presents the 3D plot with the variation of the coincidence factor Sc1, in relation to fleet size and maximum current consumed.
By using the previously extrapolated equations for the Cf calculations, it is possible to cross-check the electrical feeder that each sized fleet would require to be installed to safely charge the EVs.
By analyzing Table 3, it becomes obvious that applying either one of calculated coincidence factors will lead to a decrease in the required feeder for the electrical infrastructure, and as fleet size increases, the reduction becomes more evident, looking at the values for a fleet of 70 EVs the feeder decreases from the required 185 mm2 to 50 mm2 when considering Cf1 and to 25 mm2 when considering Cf2.
The main takeaway is that groups with different fleet sizes, although having different coincidence factors, will ultimately use the same feeder section. For example, when considering Cf1, any fleet size between 30 and 60 EVs will use a 25 mm2 per phase section feeder.

3.6. Circuit Breakers and Fuses Analysis

Similarly to the previous analysis, it is also necessary to explore if the circuit breakers or fuses to be employed also act as a limiting factor.
In Table 4, the most common circuit breaker values for domestic use are presented, and Table 5 presents the match-up of those circuit breakers with the respective fleet size.
Therefore, for example, the way to interpret the previous table is, a circuit breaker with a stipulated current, In, of 32 A and an associated conventional triggering current, I2, of 46 A will ensure that feeders larger than 6 mm2 are protected against overcurrent, but a feeder of 6 mm2 is not protected.

4. Discussion

4.1. Analysis of Results

After conducting both a feeder section and circuit breaker, or fuse, analysis, it is possible to aggregate both analyses and couple their findings with the Cf-fuzzy model.
It is important to reinforce the fact that in these cross-checking analyses certain assumptions were made to manage complexity and the scope was narrowed, as they do not consider factors such as downstream feeder length, upstream circuits breakers In, other feeder and isolator materials, amongst other variables; nonetheless, it was carried out considering a common scenario where feeders’ lengths are short and they are installed in perforated cable trays. The goal is to determine which are the limiting factors in Cf stipulation: feeder size or circuit breaker caliber. To do that, Table 6 presents the necessary information that allows for a cross-check of each component, and the applicable Cf1; for this, it was necessary to use the following Equation (9).
I B I n I Z and I 2 1.45 × I Z
where In and I2 are characteristics of the chosen circuit breaker, IB is the maximum observed current per phase for each EV fleet size, and IZ is the maximum allowed current for each phase of the electrical feeder.
Therefore, to comply with (9) and (10), looking at the previous table, we can take as an example the fleet of 60 EVs. In this particular case, the section of the feeder had to be incremented by 2 because it was the only way to validate the feeder section with the fuse and the maximum expected value of current allocated. Contrarily, looking at a fleet of 25 EVs, we notice that there is no need to increment the feeder section beyond what was initially calculated because the circuit breaker and maximum expected value of current allocated both match. Therefore, by coupling the feeder analysis and the circuit breaker analysis, together with the Cf.fuzzy model, it makes it possible to output valuable information, presented in Figure 11, that can be leveraged at the design stage of a building's charging infrastructure, in order to minimize cost without compromising the user’s accessibility to energy for EV charging.

4.2. Validation and Comparative Analysis of Results

To validate our findings, we compared them to coincidence factors extracted from a publicly available dataset of EV charging. The dataset used in this comparison is the “Data set of a Norwegian energy community”, available on Mendeley Data [25]. It characterizes electric vehicle charging behavior by specifying the statistical distributions of charging start probabilities and charging durations, which are provided for all seasons, weekdays, and weekends, and 4 h groupings for an energy community.
Each entry is defined using an exponential distribution for both start probability and charging duration. The parameters include λstart and λduration, as well as minimum and maximum values used to bound each variable in the simulations, as demonstrated in the following Table 7.
For our baseline estimation, we focused on weekdays during the spring months, considering a 12 h time window between 20 h00 and 08 h00 and an average charging duration of 6 h for each EV.
In this case, we defined the coincidence factor as follows in (10).
C f b a s e l i n e = E n max N
where nmax is the maximum number of EVs charging simultaneously during the observed timed window and E is the expectation across multiple simulations. This coincidence factor reflects the peak simultaneous number of EVs charging relative to the total fleet.
To estimate the Cf-baseline, we used a Monte Carlo simulation approach, and for each simulation, we selected a fleet size N.
Regarding the simulation, we repeated for each trial and for each EV the following steps: generate a start time ts; define a duration of charging period D, the charging duration for an EV. It is modeled as a continuous random variable that follows an exponential distribution with a mean of 6 h; compute the charging interval [ts, ts + D]. Then we collect all the intervals and compute the maximum number of overlapping intervals at any moment, which provides us the nmax. Finally, we compute the Cf-baseline over all trials.
The likelihood of an EV to begin its charging period is based on the information provided by the previously mentioned dataset.
Two different distributions were considered for the charging start time ts ∈ [20, 32] (i.e., 20 h00 to 08 h00): a uniform distribution that assumes users are equally likely to plug in at any given time, which reflects the assumption of perfect temporal randomness, and an exponential distribution that assumes a more realistic model, assuming users are more likely to plug in soon after returning home, typically in the evening, capturing the behavioral skew toward earlier evening hours and reflecting user behavior without managed charging systems.
The Cf-baseline results obtained for different-sized fleets are presented in the following Figure 12.
We note that the uniform distribution underestimates coincidence factors, especially in small to medium fleets, as it spreads charging evenly. The exponential start times produce higher coincidence factors, indicating more overlapping charging activities during early evening hours.
These observed differences are non-trivial for grid planning. At 50 EVs, the difference is close to 22% higher coincidence under exponential start times.
Thus, using more realistic distributions aligned with empirical behavior can significantly improve the accuracy of demand forecasts.
However, this baseline does not consider that when multiple EVs are charging, they can do so at different charging rates, drawing more or less power depending on the EV needs, resulting in a dummy charging assumption that can over-penalize the coincidence factors when we look at consumed power instead of the number of EVs charging simultaneously. The nuances and empirical behaviors, as well as optimized charging mechanisms, were considered during our simulations.
In the following Table 8, we can observe how the simulated coincidence factors are compared to the initially calculated baseline coincidence factors.
It is possible to observe that Cf3, which aims to mimic a high demand/low optimization scenario, closely mimics the exponential baseline in the small to medium fleet size, and from the medium to large fleet size, it overestimates the coincidence factors that were expected based on previously explained assumptions.
On the other hand, Cf2, which resides at the other extreme of the spectrum, meaning high levels of optimization and low demand, always underestimates the coincidence factor when compared to the baselines, meaning that the baselines are encompassed by both simulated coincidence factors as intended, leaving room for the decision-makers and planners.
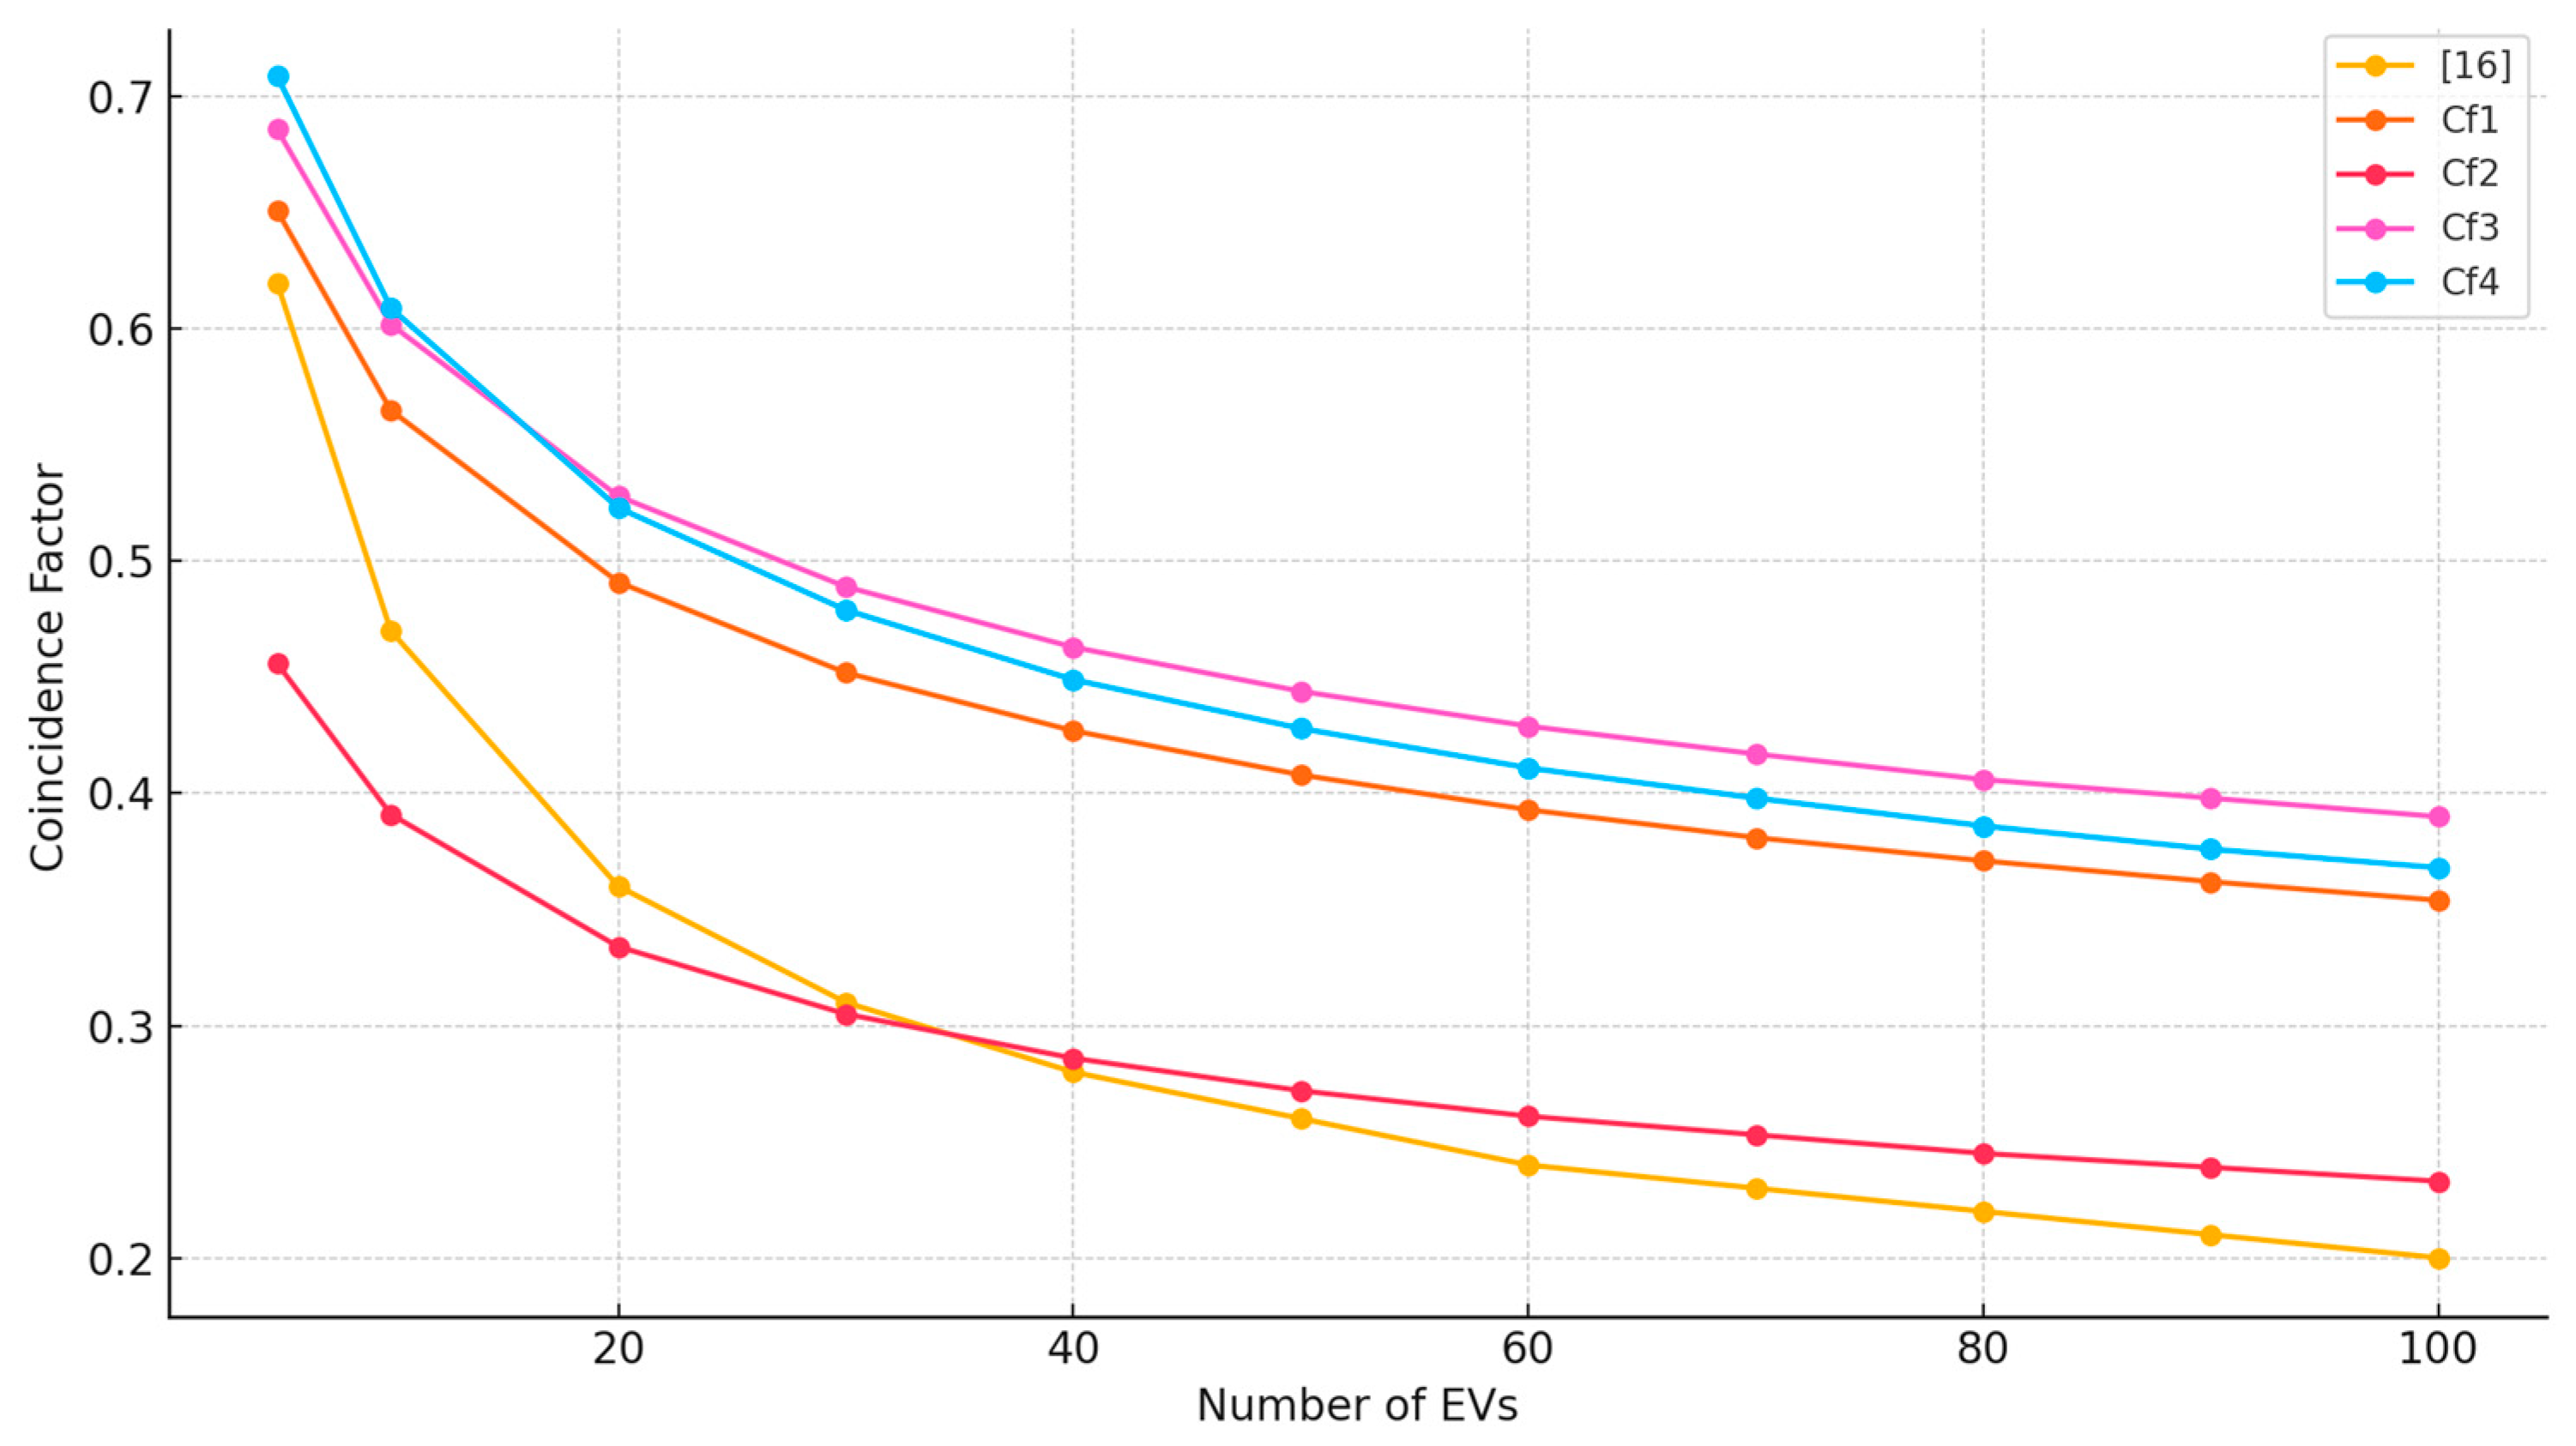
As previously mentioned, other studies have also aimed at estimating coincidence factors for residential EV charging utilizing other methodologies and assumptions. To validate our results, we cross-checked our findings with [21] in the following Figure 13.
As it is possible to observe in Figure 13, Cf1, Cf3, and Cf4 trends above the coincidence factors of [21], while Cf2 is more closely related to it, so it is safe to assume that, Cf1, Cf3, and Cf4 are indeed more conservative but can be modulated to closer match the referenced coincidence factor by using the fuzzy correction factor.
A recent study by [26] analyzed residential EV charging behaviors in Norway and revealed CF values typically below 15% for uncontrolled (normal) charging and as high as 32% during early morning hours underprice-driven smart charging. These empirical observations confirm how behavioral incentives and synchronization can shift but not eliminate high simultaneity in charging, often introducing new peaks at nontraditional hours (e.g., early morning instead of evening). By contrast, our methodology, although it accounts for this, is not derived from behavioral datasets but rather enables planners to correct estimated CFs ex ante, using fuzzy rules linked to optimization levels and fleet demand characteristics. While the Norwegian study captures variability through observational data, it does not generalize well to planning stages in contexts lacking local empirical profiles. Our fuzzy inference model fills this gap by offering a behavioral proxy that adapts to usage assumptions, thereby reducing reliance on empirical data collection. Moreover, the authors demonstrate that mass smart charging has the potential to generate new critical peaks. This insight serves to emphasize the importance of incorporating coincidence uncertainty directly into infrastructure planning, a contribution that is precisely what this work aims to deliver.
In [27], the authors present a thorough investigation of large-scale battery-electric vehicle (BEV) charging behavior under varying ambient temperatures and available charging power levels. The study emphasized the influence of these factors on charging load profiles and coincidence factors across different locations. Their findings reveal that coincidence increases under colder conditions and lower charging power, with the highest values being observed in workplaces, hotels, and homes. However, even in extreme cases (e.g., −20 °C), coincidence factors remained below 0.44, reflecting the general diversity of charging behavior across large fleets. Additionally, they observe that greater available power leads to sharper peaks and deeper valleys, while lower power flattens the load, confirming the sensitivity of demand profiles to infrastructure parameters. The authors observe that, whilst the overall coincidence remains moderate in large populations, local deviations can be substantial in smaller groups of vehicles, where stochastic effects dominate.
The present study builds upon this insight by proposing an innovative methodology for infrastructure planners, particularly in contexts where small to medium-scale residential EV adoption may lead to sizing uncertainty. In contrast to the simulation of charging events based on environmental parameters, our approach focuses on the analysis of behavioral patterns. Utilizing a fuzzy inference system, we correct coincidence factors based on system-level assumptions, notably charging system optimization level and fleet energy demand. In contrast to the author’s data-driven modeling, which is ideally suited for evaluating operational impacts under defined scenarios, our method aims to support early-stage design by providing planners with an adaptive tool that generalizes across varying usage intensities and control sophistication. Together, both approaches contribute to a richer understanding of how charging simultaneity influences infrastructure design, one through empirical modeling, the other through flexible inference for planning under uncertainty.
The authors of [28] analyze EV charging simultaneity by segmenting users into energy demand buckets and simulating their interaction with different charger power levels across rural, urban, and semi-urban settings. Their findings show that vehicles with higher daily energy demands tend to exhibit greater simultaneity factors (SFs), particularly in cases where mid-range chargers (3.5–7 kW) are utilized. The CF values in such cases frequently range from 0.38 to 0.58. While their analysis does not vary fleet size directly, the patterns they report reflect the fundamental relationship between behavioral clustering and charging overlap, a phenomenon the present study also addresses, but from a different modeling perspective.
Rather than disaggregating behavior by individual energy consumption, the fuzzy-based methodology proposed here estimates coincidence factors (CFs) as a function of fleet size and system optimization level. This approach generalizes charging diversity through aggregate rules, allowing planners to capture behavioral uncertainty and infrastructure stress without detailed energy-use profiles. Although indexed differently, both models reflect the inverse relationship between user diversity and peak simultaneity, with our Cf1 values decreasing from 1.0 (for 1 EV) to 0.38 (for 70 EVs), comparable in range and trend to the author’s CFs across energy demand segments. Thus, while the methodological frames differ, the results are thematically aligned and reinforce the robustness of modeling approaches that incorporate diversity into EV charging infrastructure planning.
Thus, compared to prior work, the proposed methodology adopts fundamentally different assumptions about the availability of user data, the regularity of charging behavior, and the adaptability of coincidence estimation. Whereas empirical and simulation-based studies assume well-defined user schedules, location-specific load profiles, or access to charging event data, this study assumes a more typical planning scenario in which such information is unavailable. By embedding key behavioral and control characteristics into a fuzzy inference system, the model enables planners to adjust coincidence factors based on abstract but meaningful parameters like system optimization level and energy demand scale. This shift in assumptions supports a more resilient and generalizable infrastructure design process, particularly suited to early planning phases or emerging residential developments. While it may lead to more conservative sizing compared to models fine-tuned to historical data, it reduces the risk of undersized infrastructure in novel or evolving usage contexts.

5. Limitations of the Current Work

While the proposed methodology offers a flexible and planner-oriented approach to estimating coincidence factors for different-sized electrical vehicle fleets, its limitations should be acknowledged regarding its assumptions, simplifications, and applicability.
(1)
The model relies on real inputs like fleet size, energy demand, and system optimization level. However, it does not incorporate empirical validation from real-world charging behavior. Although the fuzzy inference system is designed to approximate behavioral diversity, the absence of calibration with actual charging event data introduces uncertainty in how well the proposed coincidence factors reflect localized usage patterns. However, as demonstrated, CFs presented in other works in the field tend to align with the values proposed in this study, while following different approaches. Nevertheless, they do tend to lack the high interpretability presented in the current work and the concrete recommendations for electrical infrastructure planning stages.
(2)
The simulations assume ideal electrical installation and operation conditions, such as balanced phase distribution and unconstrained access to the electrical grid. Real-world constraints, including voltage drops, cable capacity, and equipment aging, are not explicitly modeled. Additionally, the methodology abstracts away from spatial factors such as charging location clustering, topological layout, or feeder configuration, which may influence simultaneity in practice. Still, it is important to note that the simulations are based on a previously presented and validated charging algorithm that accounts for phase balancing and the limitations of energy supply.
(3)
The optimization levels considered are conceptual and based on qualitative expert-informed categories. While useful for modeling a range of demand management sophistication, these levels are not derived from quantitative field measurements and may not capture all intermediate behaviors seen in hybrid or semi-automated systems. However, this limitation can be accounted for by assuming a more risk-averse profile in the planning stage by considering lower optimization and higher demand levels.
(4)
While this study does not directly model spatial load distribution or feeder topologies, it focuses on providing a generalizable estimation framework for planners at the building or substation level. Spatial diversity is indirectly captured in the demand diversity embedded in fleet size and optimization level parameters, though future extensions could couple this approach with spatial clustering or geographic demand allocation tools.
(5)
Finally, the proposed methodology is targeted at multi-dwelling residential buildings, specifically at existing buildings that may require an infrastructure overhaul to integrate EV charging in the parking spots. This in itself presents an issue, as currently, EV penetration has not yet reached a state where these scenarios are widespread or even occurring at rates that allow for data gathering to occur. Therefore, the reliance on simulated data is, in fact, one of the key limitations of the current study. Nonetheless, efforts were made in order to validate the results based on other published work and reports, as well as expert input.
As such, the results presented are best interpreted as a flexible estimation framework for early-stage infrastructure planning under uncertainty, rather than a replacement for detailed simulation or empirical modeling.

6. Conclusions and Future Work

6.1. Conclusions

This study demonstrates that the conventional assumption of a coincidence factor (Cf) of 1 for electric vehicle (EV) charging installations in multi-dwelling residential buildings leads to significantly oversized and cost-inefficient electrical infrastructure. This inefficiency was addressed by introducing a novel simulation-based methodology integrated with a fuzzy logic inference model, grounded in realistic EV driving and charging patterns as well as industry guidelines. The proposed approach yielded several key contributions.
  • Comprehensive Coincidence Factor Reference: Established a set of coincidence factor values (with associated equations) for EV fleet sizes up to 70 vehicles, derived under an optimized charging strategy and worst-case daily demand conditions. These results enable designers to replace the overly conservative Cf = 1 with data-driven Cf values tailored to realistic usage scenarios, avoiding unnecessary over-design of infrastructure.
  • Fuzzy Logic Inference Model: Developed a fuzzy logic inference model that provides a systematic method to calculate the appropriate Cf as a function of the EV fleet size and the level of charging optimization employed. This model offers a flexible planning tool, allowing infrastructure designers to adjust Cf according to different building scenarios and smart charging strategies, thereby adding methodological rigor to the planning process.
  • Reduced Infrastructure Sizing: Demonstrated a methodology to maximize economic benefits by significantly reducing the required electrical feeder capacity by as much as a factor of seven relative to conventional sizing, while still reliably meeting EV charging demand. This quantifiable reduction in cable sizing and related infrastructure translates into substantial cost and material savings without compromising service quality or future expansion needs.
These outcomes are underpinned by an extensive simulation campaign that combined real-world usage data with synthetic scenarios, ensuring the robustness and generality of the results. The number of simulated scenarios provides a high degree of confidence in the validity of the derived coincidence factors and the effectiveness of the fuzzy inference approach. Furthermore, the methodology is dynamic and adaptable: as driving patterns, battery capacities, or charging technologies evolve, the fuzzy logic model can be recalibrated to reflect new conditions. This adaptability makes the planning framework resilient to uncertainties and future-proof for the continued integration of EVs.
From a practical perspective, the findings offer valuable guidance for infrastructure planners and policymakers in the residential building sector. By applying the refined coincidence factors and utilizing the fuzzy logic tool, planners can avoid unnecessary over-dimensioning of electrical systems, thereby reducing capital and operational costs. At the same time, they can ensure that the infrastructure is appropriately scaled to actual user demand and capable of accommodating growth in EV adoption. In summary, this research provides a scientifically grounded and practically applicable framework for EV fleet charging infrastructure planning in multi-dwelling buildings, one that balances methodological rigor with real-world applicability.

6.2. Future Work

Looking ahead, plans for future research focus on validating the proposed fuzzy correction model against empirical data from actual residential EV charging systems, particularly in multifamily housing contexts, although large integration of EVs in multi-dwelling buildings has yet to be achieved on a broader scale, limiting access to valuable data. Incorporating real-world charging event logs and occupancy patterns will help refine the rule base and strengthen the model’s predictive power. Additionally, extending the methodology to account for dynamic energy pricing schemes and time-varying load profiles could enhance its applicability in smart grid environments. Further exploration of how the fuzzy logic framework compares with alternative approaches, such as agent-based models or machine learning-driven demand forecasting, could also provide valuable benchmarking insights and guide the development of hybrid planning tools. Additionally, integration with building energy management systems (BEMS) can add a security layer over the electrical infrastructure by imposing energy limits in accordance with the coincidence factors, electrical feeders, and circuit breakers utilized.

Author Contributions

Conceptualization, S.C., J.R.F. and R.E.A.; Methodology, S.C., J.R.F. and R.E.A.; Validation, S.C., J.R.F. and R.E.A.; Formal analysis, J.R.F. and R.E.A.; Investigation, J.R.F. and R.E.A.; S.C.; Writing—review & editing, S.C., J.R.F. and R.E.A.; Supervision, J.R.F. and R.E.A. All authors have read and agreed to the published version of the manuscript.

Funding

This work is funded by national funds through FCT—Fundação para a Ciência e a Tecnologia, I.P., under the support UID/50014/2023 (https://doi.org/10.54499/UID/50014/2023).

Data Availability Statement

The original contributions presented in this study are included in the article, all dataset sets are referenced correctly, additional inquiries can be directed to the corresponding author.

Conflicts of Interest

The authors declare no conflict of interest.

Abbreviations

The following abbreviations are used in this manuscript:
AbsAbsolute
AvgAverage
CfCoincidence Factor
EVElectric Vehicle
LoLLoss-of-Life
MaxMaximum
MinMinimum
SoCState of Charge

Appendix A

The fuzzy logic inference model was implemented in Python 3.12. Three inputs were utilized: the Cf.avg., the demand level, and the optimization level. The rules utilized are presented in the following Table A1.
Table A1. Fuzzy logic inference model rules.
InputsThen Correction Factor …
If Demand …and Optimization …
LowHighLow
MediumMediumMedium
HighLowHigh
LowMediumMedium
MediumLowHigh
HighHighMedium
LowLowMedium
MediumHighMedium
HighMediumMedium
Finally, the Cf-fuzzy is calculated in the following manner, as seen in Equation (A1).
C f . f u z z y = C f . a v g × F u z z y   C o r r e c t i o n   C o e f f i c i e n t
To determine the demand level, it is necessary to evaluate user behavior in terms of distance travelled, EV battery capacity, and other factors that may influence the daily charge needs. This can be achieved, for example, by conducting surveys at the stage of the system conceptualization, so if the fleet exhibits a high prevalence of EV users that travel long distances daily and require full charges every day, the evaluation could fall on the side of “high demand”, and if the fleet exhibits a prevalence of EV users that perform short commutes daily and only charge, for example, once per week, then the evaluation could fall on the side of “low demand”. To determine the optimization level of the charging systems, it is necessary to determine the level of control it allows and how it manages the charging of the whole fleet. As an example, a system that has no optimization capability falls on the side of “low optimization”, a system that can manage the allocation of current in real time could fall on “medium optimization”, and a system that is able to allocate current in real time according to the EV needs, manage the schedule of charging events, and forecast user needs could fall on “high optimization”. Of course, this evaluation is expert-oriented at the time of conception and can also be influenced and managed according to other factors, such as risk aversion.
In Figure A1, we present the membership functions used.
Figure A1. Membership functions used to determine (a) demand level, (b) optimization level, and (c) the coincidence factor correction value.
Energies 18 04679 g0a1

References

  1. Direção Geral da Energia Parte 5/Secção 51. In Regras Técnicas de Instalações Eléctricas de Baixa Tensão; Imprensa Nacional-Casa da Monedal: Lisboa, Portugal, 2000; pp. 1–736.
  2. National Fire Protection Association Section 220. In National Electrical Code; IEEE: New York, NY, USA, 2023.
  3. Jonas, T.; Daniels, N.; Macht, G. Electric Vehicle User Behavior: An Analysis of Charging Station Utilization in Canada. Energies 2023, 16, 1592. [Google Scholar] [CrossRef]
  4. Rastad, A.A.; Busengdal, H.S.; Hiep, E. Report on Consumer Behaviour; European Comission: Arnhem, The Netherlands, 2023. [Google Scholar]
  5. Almaghrebi, A.; James, K.; Al Juheshi, F.; Alahmad, M. Insights into Household Electric Vehicle Charging Behavior: Analysis and Predictive Modeling. Energies 2024, 17, 925. [Google Scholar] [CrossRef]
  6. Unterluggauer, T.; Hipolito, F.; Klyapovskiy, S.; Andersen, P.B. Impact of Electric Vehicle Charging Synchronization on the Urban Medium Voltage Power Distribution Network of Frederiksberg. World Electr. Veh. J. 2022, 13, 182. [Google Scholar] [CrossRef]
  7. Ramsebner, J.; Hiesl, A.; Haas, R. Efficient Load Management for BEV Charging Infrastructure in Multi-Apartment Buildings. Energies 2020, 13, 5927. [Google Scholar] [CrossRef]
  8. Turoń, K. Car-Sharing Systems in Smart Cities: A Review of the Most Important Issues Related to the Functioning of the Systems in Light of the Scientific Research. Smart Cities 2023, 6, 796–808. [Google Scholar] [CrossRef]
  9. Lokhandwala, M.; Cai, H. Siting Charging Stations for Electric Vehicle Adoption in Shared Autonomous Fleets. Transp. Res. D Transp. Environ. 2020, 80, 102231. [Google Scholar] [CrossRef]
  10. Ma, T.Y.; Fang, Y. Survey of Charging Management and Infrastructure Planning for Electrified Demand-Responsive Transport Systems: Methodologies and Recent Developments. Eur. Transp. Res. Rev. 2022, 14, 36. [Google Scholar] [CrossRef]
  11. Patil, P.; Kazemzadeh, K.; Bansal, P. Integration of Charging Behavior into Infrastructure Planning and Management of Electric Vehicles: A Systematic Review and Framework. Sustain. Cities Soc. 2023, 88, 104265. [Google Scholar] [CrossRef]
  12. Kumar, M.; Panda, K.P.; Naayagi, R.T.; Thakur, R.; Panda, G. Comprehensive Review of Electric Vehicle Technology and Its Impacts: Detailed Investigation of Charging Infrastructure, Power Management, and Control Techniques. Appl. Sci. 2023, 13, 8919. [Google Scholar] [CrossRef]
  13. Hong, S.-K.; Lee, S.G.; Kim, M. Assessment and Mitigation of Electric Vehicle Charging Demand Impact to Transformer Aging for an Apartment Complex. Energies 2020, 13, 2571. [Google Scholar] [CrossRef]
  14. Quiros-Tortos, J.; Ochoa, L.F.; Lees, B. A Statistical Analysis of EV Charging Behavior in the UK. In Proceedings of the 2015 IEEE PES Innovative Smart Grid Technologies Latin America (ISGT LATAM), Montevideo, Uruguay, 5–7 October 2015; pp. 445–449. [Google Scholar]
  15. Calearo, L.; Thingvad, A.; Suzuki, K.; Marinelli, M. Grid Loading Due to EV Charging Profiles Based on Pseudo-Real Driving Pattern and User Behavior. IEEE Trans. Transp. Electrif. 2019, 5, 683–694. [Google Scholar] [CrossRef]
  16. Flammini, M.G.; Prettico, G.; Julea, A.; Fulli, G.; Mazza, A.; Chicco, G. Statistical Characterisation of the Real Transaction Data Gathered from Electric Vehicle Charging Stations. Electr. Power Syst. Res. 2019, 166, 136–150. [Google Scholar] [CrossRef]
  17. Aunedi, M.; Woolf, M.; Strbac, G.; Babalola, O.; Clark, M. Characteristic Demand Profiles of Residential and Commercial EV Users and Opportunities for Smart Charging. In Proceedings of the Internation Conference on Electricity Distribution (CIRED), Lyon, France, 16–18 June 2015; p. 1088. [Google Scholar]
  18. Tong, X.; Guo, C.; Yang, X.; Chen, C. Research on Characteristics of Electric Vehicle Charging Load and Distribution Network Supportability. In Proceedings of the 2016 IEEE PES Asia-Pacific Power and Energy Engineering Conference (APPEEC), Xi’an, China, 25–28 October 2016; pp. 1539–1542. [Google Scholar]
  19. Thie, N.; Junge, E.; Hillenbrand, S.; Konermann, M. Evaluation of Grid Compatible Load Management Concepts for E-Mobility in Distribution Grids. In Proceedings of the 2019 54th International Universities Power Engineering Conference (UPEC), Bucharest, Romania, 3–6 September 2019; pp. 1–5. [Google Scholar]
  20. Palomino, A.; Parvania, M. Probabilistic Impact Analysis of Residential Electric Vehicle Charging on Distribution Transformers. In Proceedings of the 2018 North American Power Symposium (NAPS), Fargo, ND, USA, 9–11 September 2018; pp. 1–6. [Google Scholar]
  21. Bollerslev, J.; Andersen, P.B.; Jensen, T.V.; Marinelli, M.; Thingvad, A.; Calearo, L.; Weckesser, T. Coincidence Factors for Domestic EV Charging from Driving and Plug-In Behavior. IEEE Trans. Transp. Electrif. 2022, 8, 808–819. [Google Scholar] [CrossRef]
  22. Huaman-Rivera, A.; Calloquispe-Huallpa, R.; Luna Hernandez, A.C.; Irizarry-Rivera, A. An Overview of Electric Vehicle Load Modeling Strategies for Grid Integration Studies. Electronics 2024, 13, 2259. [Google Scholar] [CrossRef]
  23. Carvalhosa, S.; Ferreira, J.R.; Araújo, R.E. Electric Vehicle Charging Method for Existing Residential Condominiums. IEEE Access 2024, 12, 166537–166552. [Google Scholar] [CrossRef]
  24. Helmus, J.R.; Lees, M.H.; van den Hoed, R. A Data Driven Typology of Electric Vehicle User Types and Charging Sessions. Transp. Res. Part. C Emerg. Technol. 2020, 115, 102637. [Google Scholar] [CrossRef]
  25. Berg, K.; Löschenbrand, M. Data Set of a Norwegian Energy Community. Mendeley Data 2023. [Google Scholar] [CrossRef] [PubMed]
  26. Opstad, A.; Bakken, B.H.; Doorman, G.; Nygard, H.S.; Sevdari, K. CSE N°35 December 2024; CIGRE: Paris, France, 2024. [Google Scholar]
  27. Jokinen, I.; Lehtonen, M. Modeling of Electric Vehicle Charging Demand and Coincidence of Large-Scale Charging Loads in Different Charging Locations. IEEE Access 2023, 11, 114291–114315. [Google Scholar] [CrossRef]
  28. Fani, H.; Hashmi, M.U.; Deconinck, G. Impact of Electric Vehicle Charging Simultaneity Factor on the Hosting Capacity of LV Feeder. Sustain. Energy Grids Netw. 2024, 40, 101581. [Google Scholar] [CrossRef]
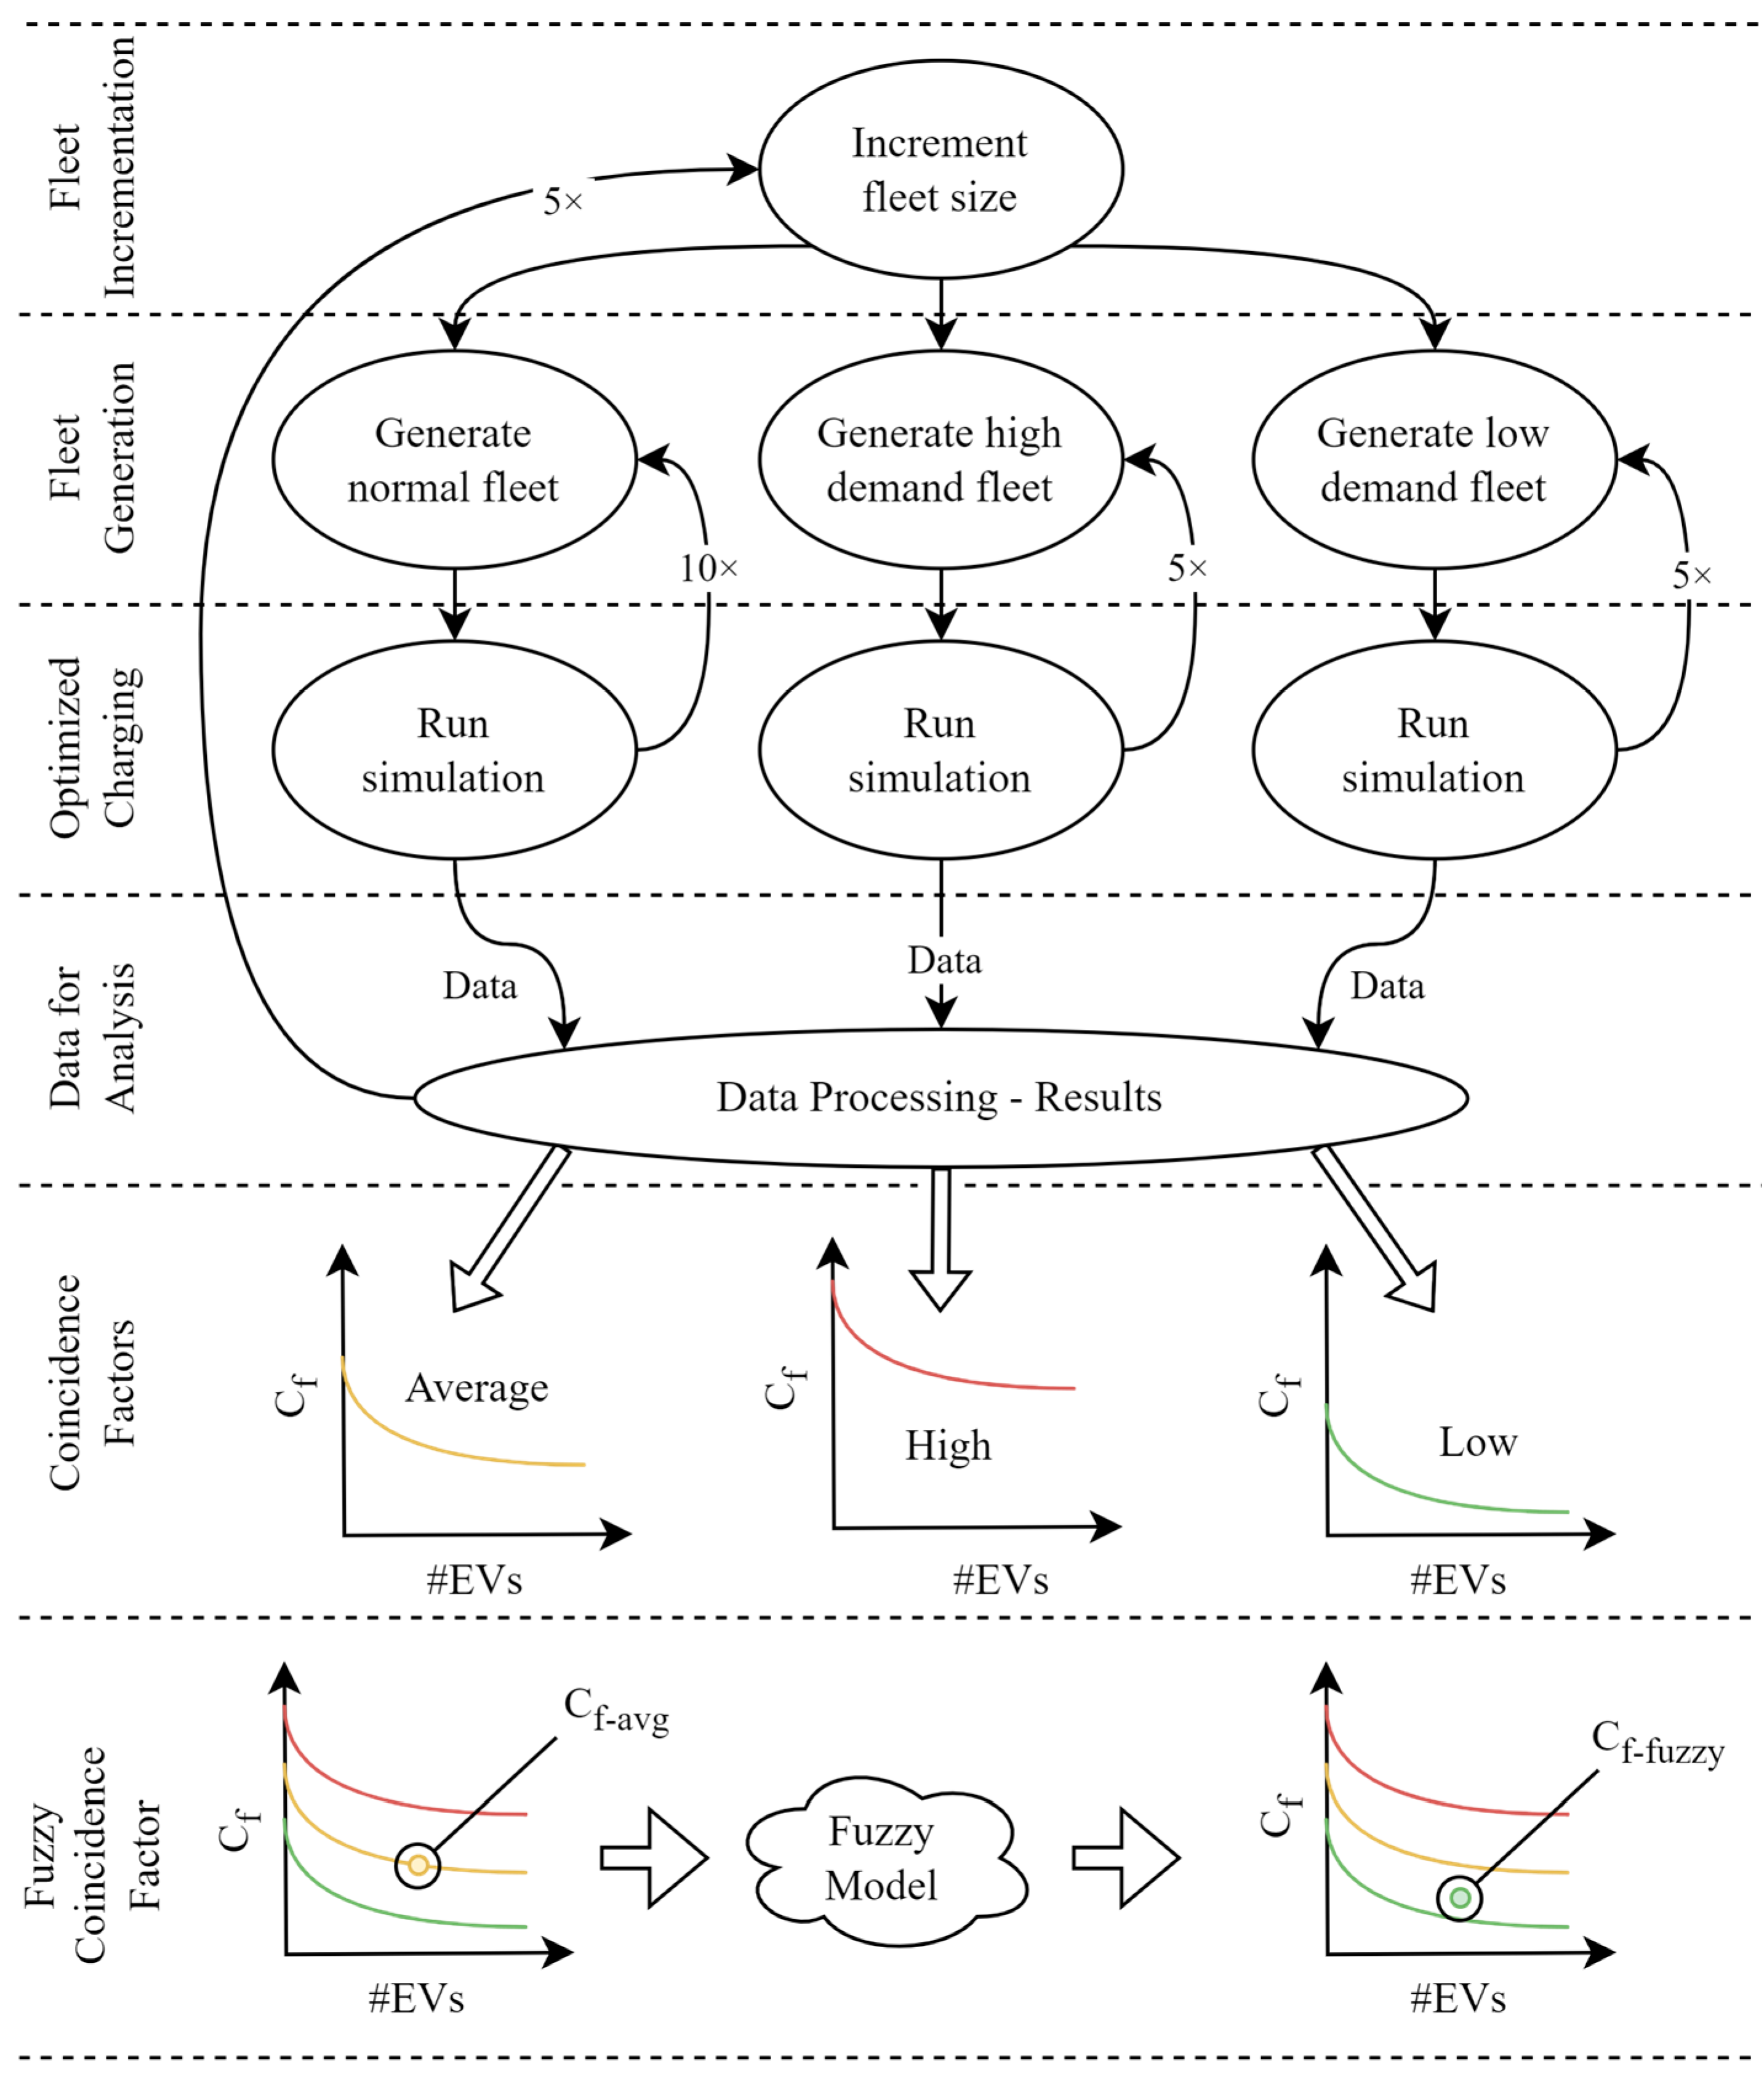
Figure 1. Complete methodology overview from data generation to Cf-fuzzy estimation, including optimal charging simulations and result generation.
Energies 18 04679 g001
Figure 2. Maximum allocated charging current for each EV fleet size where the circle dotted line represents the measured allocation of current when all EVs charged at 16 A at the same time, the square dotted line represents the highest measured allocated current during the charging events, while the triangle dotted line represents the highest measured allocated current, when we disregard the top 1% of measured values, during the charging events.
Energies 18 04679 g002
Figure 3. Cumulative frequency of the observed allocated current with a 99% threshold. This curve was plotted with the data generated by the charging simulations.
Energies 18 04679 g003
Figure 4. (a) Scatter plot of Cf1 with respective trendline, (b) scatter plot of Cf2 with respective trendline. Where the x-axis is the overall fleet size, and the y-axis is the coincidence factor observed.
Energies 18 04679 g004
Figure 5. (a) Scatter plot of Cf3 with respective trendline, (b) scatter plot of Cf4 with the respective trendline, where the x-axis is the overall fleet size and the y-axis is the coincidence factor observed.
Energies 18 04679 g005
Figure 6. Scatter plot of Cf.3 with respective updated trendline, where the x-axis is the overall fleet size and the y-axis is the coincidence factor observed.
Energies 18 04679 g006
Figure 7. Feasible Range of Solutions.
Energies 18 04679 g007
Figure 8. The corrections, by Cf-fuzzy of the coincidence factor (a) to a lower value considering a fleet size of 50 EVs, a demand value of 2, and an optimization value of 7 (b) to a higher value, considering a fleet size of 35 EVs, a demand value of 7, and an optimization value of 1. The arrow demonstrates the change between the original Cf (red dot) and the new Cf-fuzzy (green dot).
Energies 18 04679 g008
Figure 9. 2D plot of used feeder section per fleet size and maximum observed allocated current, by applying Cf1.
Energies 18 04679 g009
Figure 10. 3D plot of used feeder section per fleet size and maximum observed allocated current, by applying Cf1.
Energies 18 04679 g010
Figure 11. Simultaneity factor correction via fuzzy logic inference model for a fleet of (a) 50 EVs with high optimization and low demand, and (b) 35 EVs with low optimization and high demand.
Energies 18 04679 g011
Figure 12. Coincidence factor versus fleet size and uniform versus exponential distribution for start times between 20 h00 and 08 h00.
Energies 18 04679 g012
Figure 13. Comparative of the current study's coincidence factors with the literature’s coincidence factors.
Energies 18 04679 g013
Table 1. Analysis of previous works on coincidence factor estimation for EV charging.
WorkCharging Power [kW]FleetTypologyOptimized
Charging
[20]6.6, 19.2, 12.96 EVsSingle dwellingNo
[14]3.6200 EVsResidential AreasNo
[15]3.7, 11.020 EVsSingle DwellingNo
[16]12.0Not specifiedCharging StationsNo
[18]2, 6, 3, 151000 EVsResidential AreasNo
[17]3.7, 14.054 EVsCharging StationsNo
[19]Not specified10 EVsResidential AreasNo
[21]3.7, 11.0, 22.0100 EVsSingle DwellingNo
CurrentFrom 3.68 to 12.870 EVsMulti DwellingYes
Table 2. Maximum allowed current by feeder conductor section and material, isolation material, and installation type [1].
Feeder [Active Conductor Section in mm2]Maximum Allowed Current—Iz
Copper—PVCAluminum—PVCType
2.525 A19.5 AMulti conductor
434 A26 A
643 A33 A
1060 A 46 A
1680 A 61 A
25131 A84 ASingle conductor
35137 A105 A
50167 A128 A
70216 A166 A
95264 A203 A
120308 A237 A
150356 A274 A
185409 A315 A
Table 3. Feeder phase section per fleet size considering Cf1.
EV Fleet SizeCf = 1Current CalculationFeeder [Cu]
Cf1Maximum CurrentPer Phase
n = 116 A1 114.416 22.5
232 A0.7825.116 22.5
580 A0.6552.117.372.5
10160 A0.5790.530.174
15240 A0.52125.041.76
20320 A0.49157.252.410
25400 A0.47187.862.616
30480 A0.45217.172.3716
40640 A0.43273.191.0325
50800 A0.41326.2108.7325
60960 A0.39377.3125.7625
701120 A0.38426.6142.250
EV Fleet SizeCf = 1Current CalculationFeeder [Cu]
Cf2Maximum CurrentPer Phase
n = 116 A1 110.516 22.5
232 A0.5617.916 22.5
580 A0.4636.516 22.5
10160 A0.3962.520.832.5
15240 A0.3685.628.534
20320 A0.33107.035.676
25400 A0.32127.242.406
30480 A0.31146.648.8710
40640 A0.29183.261.0716
50800 A0.27217.972.6316
60960 A0.26251.083.6725
701120 A0.25282.994.3025
1 If n equals 1 then Cf must be 1 as well. 2 16 amps is the max-min charging rate per phase per EV.
Table 4. Feeder section per stipulated current and conventional triggering current for each circuit breaker [1].
In—Stipulated CurrentI2—Triggering CurrentProtects up to Section 1 [Cu]
10 A14 AAll
16 A23 AAll
20 A29 A>2.5 mm2
25 A36 A>4 mm2
32 A46 A>6 mm2
40 A58 A>10 mm2
50 A72 A>16 mm2
63 A91 A>25 mm2
80 A116 A>25 mm2
100 A145 A>50 mm2
125 A181 A>70 mm2
1 Not including the specified section.
Table 5. Circuit breaker phase section per fleet size, considering Cf1 and Cf2.
EV Fleet SizeCf = 1Current CalculationCircuit Breaker
CfMaximum CurrentPer Phase—IB
Cf1n = 116 A1 114.416 220
232 A0.7825.116 220
580 A0.6552.117.3720
10160 A0.5790.530.1732
15240 A0.52125.041.750
20320 A0.49157.252.463
25400 A0.47187.862.663 3
30480 A0.45217.172.3780
40640 A0.43273.191.03100
50800 A0.41326.2108.73125
60960 A0.39377.3125.76-
701120 A0.38426.6142.2-
Cf2n = 116 A1 110.516 220
232 A0.5617.916 220
580 A0.4636.516 220
10160 A0.3962.520.8325
15240 A0.3685.628.5332
20320 A0.33107.035.6740
25400 A0.32127.242.4050
30480 A0.31146.648.8750
40640 A0.29183.261.0763
50800 A0.27217.972.6380
60960 A0.26251.083.67100
701120 A0.25282.994.30100
1 If n equals 1 then Cf must be 1 as well as there is always the likelihood of 1 EV charging at its maximum rate. 2 16 amps is the max-min charging rate per phase per EV. 3 Close to IB but within regulations.
Table 6. Feeder section and circuit breaker stipulated per EV fleet size considering Cf1.
NCf1In [A]Feeder [mm2]Iz [A]Section Increment
11 1202.5 1 or 4250
20.78250
50.65250
100.57324340
150.52501060+1
200.49631680+1
250.47800
300.4580800
400.43100251310
500.411251310
600.39160 270167+2
700.38167+1
1 The 2.5 mm2 needs additional calculations to be validated; the 4 mm2 is the recommended minimum. 2 Fuse instead of circuit breaker.
Table 7. Dataset used to estimate a baseline for the simultaneity coefficients based on real data.
Charging Start Probability [%]Charging Duration [h]
HourλMaximumMinimumλMaximumMinimum
Springweekday00–042.087.6902.3414.30
04–082.477.6902.98105.740
08–122.4314.2902.7129.870
12–162.0430.7702.3344.70
16–201.6238.4602.0169.940
20–241.3723.0802.0261.460
Table 8. Comparison between simulated coincidence factors and baseline coincidence factors.
Fleet SizeBaseline
Uniform
Baseline
Exponential
Cf2
(Lower Bound)
Cf3
(Higher Bound)
11.00111
20.890.940.5601
50.750.830.4560.975
100.630.730.3910.907
200.560.660.3340.844
300.530.630.3050.809
400.510.610.2860.785
500.490.600.2720.767
600.480.590.2610.753
700.480.580.2530.741
Disclaimer/Publisher’s Note: The statements, opinions and data contained in all publications are solely those of the individual author(s) and contributor(s) and not of MDPI and/or the editor(s). MDPI and/or the editor(s) disclaim responsibility for any injury to people or property resulting from any ideas, methods, instructions or products referred to in the content.