Article

The Torrefaction of Agricultural and Industrial Residues: Thermogravimetric Analysis, Characterization of the Products and TG-FTIR Analysis of the Gas Phase

Faculty of Chemistry and Chemical Engineering, University of Maribor, Smetanova 17, 2000 Maribor, Slovenia
*
Author to whom correspondence should be addressed.
Energies 2025, 18(17), 4648; https://doi.org/10.3390/en18174648
Submission received: 29 July 2025 / Revised: 29 August 2025 / Accepted: 29 August 2025 / Published: 1 September 2025
(This article belongs to the Section B: Energy and Environment)

Abstract

Four biomass residues–rosemary pomace, rosemary cake, grape seed and apple pomace–were torrefied at 250, 350 and 450 °C, and the physical, chemical and structural changes were characterized. The mass and energy yield decreased with increasing torrefaction temperature; the lowest mass (~10.4%) and energy yield (~10.6%) were observed for rosemary cake torrefied at 450 °C. The HHV increased the most for all feedstocks at 350 °C, with rosemary cake reaching a peak value of 36.4 MJ/kg at 350 °C. Ash content increased with temperature due to organic mass loss, while volatiles decreased and fixed carbon increased in most samples. The FTIR spectra showed the progressive loss of hydroxyl, carbonyl and C–O functionalities and the appearance of aromatic C=C bonds, indicating the formation of the biochar. TGA and DTG analyses revealed that the torrefied samples exhibited higher initial and maximum temperatures for decomposition, confirming improved thermal stability. The TGA-FTIR analyses of gas emissions during pyrolysis and combustion showed that the emissions of CO2, CH4, NOx and SO2 decreased with increasing degree of torrefaction. Overall, 350 °C was optimal to maximize energy density. The results show that agro-industrial residues can be effectively converted into sustainable biofuels, which offer the dual benefit of reducing waste disposal problems and providing a renewable alternative. In practice, such residues could be used for decentralized power generation in rural areas, co-combustion in existing power plants, or as feedstock for advanced bioenergy systems.

1. Introduction

The continued use of fossil fuels is a major factor contributing to the prevailing global environmental issues. In response to this challenge, there is growing interest in sustainable energy alternatives that have the potential to reduce the carbon footprint of energy systems. In this context, biomass has emerged as a promising solution, offering a renewable, carbon-neutral fuel from organic waste materials [1]. However, the direct use of solid biomass as fuel has several limitations, including high moisture content, low bulk and energy density, poor grindability and susceptibility to microbial degradation. Due to these properties, its use in industry is also limited. For this purpose, various processing methods have been developed, among which physical, chemical, biological [2] and thermochemical [3] conversions stand out.
Among the thermochemical processes, torrefaction has attracted particular attention. This method makes it possible to effectively improve the properties of solid biomass and convert it into a higher quality fuel, known as biochar [4]. The torrefaction of agricultural and industrial residues is of great importance for the development of a circular bioeconomy. This is because it increases resource efficiency and supports waste utilization. The advantages of torrefaction have been described by numerous authors. The most important are a lower moisture content, a higher energy density and a higher heating value [5]. After torrefaction, the biomass becomes hydrophobic, which enables long-term storage without the risk of decomposition. The grindability and flowability of the powder material is also improved and the oxygen/carbon ratio is reduced, which contributes to higher gasification efficiency and lower combustion emissions [6]. Due to all these properties and its low environmental impact, torrefaction is considered one of the most promising methods for converting biomass into high-quality bioenergy. In addition, this technology also has a relatively low potential to contribute to global warming, making it one of the most environmentally friendly solutions for biomass energy utilization [7]. Despite the benefits of torrefied biomass, including improved fuel properties and lower emissions, its widespread adoption is still hampered by issues such as high ash content, slagging during combustion [8] and concerns about the economic viability of the process [9].
Alternative materials for biofuel production have been intensively researched in the last decade. Among the most promising are by-products from the agricultural and food industries, which are low-cost, locally available and abundant sources of carbon. Rosemary residues from the extraction of essential oils or the extraction of carnosic acid and carnosol contain high levels of lignocellulosic components and essential oils, making them suitable for use in thermal treatment processes, including biochar production [10]. Their rich aromatic and phenolic composition as well as bioactive compounds, antioxidant properties [11] and high energy value enable multiple utilization options, from the production of biofuels and polyphenols to adsorbents and other value-added materials. Apple pomace, a by-product of apple pressing for juice and vinegar production, contains pectin, sugars and fibers that enable efficient decomposition into fermentable sugars from which bioethanol or biomethane can be produced [12]. In addition to biofuels, several studies have been carried out to produce other value-added products such as enzymes, proteins, flavorings, ethanol, organic acids, etc. [13]. Waste from wine production, including grape pomace, leaves and grape seeds, is another valuable source of biomass for carbon recovery [14]. Grape seeds, rich in polyphenols and fibers, can be used, for example, in pyrolysis to produce biochar by thermal treatment at low temperature [15]. Their composition enables a high energy yield and allows them to be processed into carbon-neutral products. Utilizing these waste and by-products not only reduces the environmental footprint of the agricultural industry but also increases energy efficiency and the economic value of local biomass resources.
The most recent literature on the thermal degradation and energy conversion of grape pomace, apple pomace and rosemary residues include studies on torrefaction, pyrolysis and combustion processes. For example, in the study on the torrefaction of grape pomace, high mass and energy yields were achieved [16], while the flash pyrolysis of grape seeds led to a significant increase in heating value [17]. In addition, grape seeds, which are known for their high lignin content, have also been investigated for chemical production [18]. Apple pomace, which is characterized by a high content of hemicellulose, has recently been investigated for the recovery of value-added compounds by hydrothermal carbonization in addition to fast pyrolysis method [19]. However, most studies relate to apple pomace from soft drink production, while apple pomace from the vinegar production, which is ecologically problematic due to its high acetic acid content, has not been investigated. The pyrolysis of rosemary residues after the extraction of the essential oil has been shown to be a promising method for the efficient utilization of this type of waste, increasing the energy content and allowing the recovery of valuable bioactive compounds [10]. But on the other hand, there are few studies on rosemary residues from the extraction process of carnosol or carnosic acid.
Therefore, this study investigated the potential of two industrial wastes (rosemary cake and rosemary pomace, two industrial by-products that have rarely been studied in this context) and two agricultural residues (apple pomace and grape seeds) for the production of solid biofuels through thermochemical conversion processes. The study focused on the characterization of their energy-related properties before and after torrefaction at three different temperatures to evaluate their suitability for the production of high energy biofuels. Another novelty of this study is the application of combined TGA-FTIR gas phase analysis, which allowed a detailed investigation of the decomposition behavior and the emitted gases, providing valuable information for subsequent thermochemical applications such as pyrolysis or combustion.

2. Materials and Methods

The test procedure comprised two phases: first, the samples were thermally treated, and then both the treated products and the raw materials were subjected to comprehensive characterization and thermogravimetric analysis.

2.1. Samples Preparation

Four waste materials were used in the experimental work: rosemary cake, rosemary pomace, apple pomace and grape seeds. All materials that otherwise come from industrial processes, extraction of active ingredients from rosemary and agriculture would otherwise be unused and discarded.
Two factors were decisive for the selection of these materials: firstly, their occurrence as agricultural or industrial by-products and secondly their suitability for valorization. The yellow solid residue obtained after solvent extraction method, the so-called rosemary cake, had the highest initial moisture content of 50.4 wt.%. Due to its high acetone concentration, incineration is the standard process. Rosemary pomace with a moisture content of 33.71 wt.% is the residual plant material that remains after extraction of the active compounds. The collection of these materials is usually carried out by municipal services, with subsequent management of the materials either by composting under appropriate conditions or by disposing of the materials through other waste management systems. Apple pomace (20.68 wt.% moisture) and grape seeds (10.51 wt.% moisture) are common agro-industrial by-products generated during the production of juice and wine respectively. The relatively low moisture content of these materials makes them more stable for handling and processing. Two factors were decisive for the selection of these materials: their environmental relevance and the need to explore sustainable waste management and upcycling strategies.
Before measurements, the samples were dried to constant weight at 50 °C. To ensure sample homogeneity, the raw materials were ground in a Multi-Drive basic M20 grinder (manufacturer IKA) and stored for further analysis. The raw samples were treated with the torrefaction process, at three different temperatures and the same retention time. Sample designations and the corresponding temperature conditions are listed in Table 1.

2.2. Torrefaction Process

The torrefaction process was carried out in a Carbolite Gero tube furnace, in which boats filled with a sample (about 2 g) were placed. The furnace was heated to the desired temperature and the material was constantly heated at the selected temperature for 45 min. During the entire post-op, an inert atmosphere was maintained in the furnace with a continuous flow of nitrogen (N2, approximately 0.25 L/min) to prevent oxidation of the material. Figure 1 presents a schematic diagram of the torrefaction set-up studied in this work. After torrefaction, the obtained biochar was collected and stored in hermetically sealed containers. To ensure the repeatability of the results, all experiments were repeated two times.

2.3. Characterization of Raw Materials and Solid Products

The moisture content (MC), volatile matter (VM), ash content (ash) and fixed carbon (FC) were determined in accordance with the ASTM D7582:2015 standard [20]. Ash represents the inorganic fraction of biomass that remains as a combustion residue after thermal treatment, and is an important indicator for assessing the quality of biomass as a fuel. The higher heating values (HHVs), which representing the energetic values of material, were measured in an IKA C6000 adiabatic bomb calorimeter (Isoperibol; Staufen, Germany) according to the UNI EN 14918:2019 method [21].
Mass yield (MY) and energy yield (EY) were calculated using Equations (1) and (2). MY represents the proportion of solid residue after thermal treatment relative to the initial mass of raw biomass, while EY expresses the amount of energy retained in the solid product after torrefaction relative to the initial energy content of the raw material. EY thus does not only take into account the remaining mass but also includes changes in the energy density of the material as a result of thermal conversion.
MY   ( % )   = mass torrefied   sample mass raw   sample · 100
EY   ( % ) = MY · HHV torrefied   sample HHV raw   sample
Infrared spectroscopy with Fourier transform (FTIR) was used to record the infrared absorption spectrum of a materials, wherein Fourier transform method was used for data processing. The spectra of the samples were recorded on FTIR spectrometer Nicolet iS50 (Thermo Scientific, Waltham, MA, USA) using the classic Attenuated Total Reflectance method, namely in the range from 400 cm−1 to 4000 cm−1.
Thermogravimetric analysis (TGA/DTG) offers precise insight into the physical and chemical attributes of materials by monitoring mass changes under controlled heating in a specified gas environment. In this study, analyses were performed using the TGA/DSC3+ instrument (Mettler Toledo, Greifensee, Switzerland) under a nitrogen atmosphere (50 mL/min), at a heating rate of 20 °C/min and in the temperature range of 50 to 900 °C. Each sample, raw and torrefied, was subjected to TGA to comprehensively evaluate its thermal stability and decomposition behavior. Measurements were conducted in triplicate, with mean values reported. The onset (Ti) and burnout (Tb) temperatures were determined following the protocols established in one of authors previous papers [22]. A lower Ti generally indicates easier ignition, while a lower Tb supports more efficient combustion. However, when considering thermal stability, slightly higher Ti and Tb values are favorable as they reflect greater stability during storage and handling. For a more detailed insight into the dynamics of gas release during combustion or pyrolysis as a function of temperature and wavelength, the three-dimensional thermogravimetric–Fourier transform infrared (TG-FTIR) analysis technique was applied. 3D graphs allow the simultaneous display of infrared signal intensity, temperature and wavelength, which significantly facilitates the interpretation of complex thermal processes and enables quantitative monitoring of specific chemical components depending on the temperature regime [23]. The TG-FTIR analysis was performed by coupling the TGA/DSC3+ system with a Nicolet iS50 FTIR spectrometer (Thermo Fisher, Waltham, MA, USA), equipped with a heated gas transfer line and flow cell, both maintained at 250 °C. The evolved gases, generated under an N2 atmosphere, were conveyed directly into the FTIR gas cell via inert hot transfer line during the TG run. Spectra were recorded over the 500–4000 cm−1 range at a resolution of 4 cm−1, following the same sample preparation and measurement protocol as in the TGA experiments.

3. Results

This section presents the results of basic characterization of raw and thermally treated materials. Further, the results of TGA analysis are discussed and the 3D-FTIR graphs are commented.

3.1. Mass and Energy Yield, and the Energetic Value of the Products

Figure 2 shows MY, EY and HHV values of all four different biomass types subjected to torrefaction at three different temperatures: 250 °C, 350 °C and 450 °C.
All analyzed biomasses show a decrease in both mass and energy yields with increasing torrefaction temperature. This expected trend results from the intensified thermal decomposition of volatiles, particularly hemicelluloses and cellulose, which break down at higher temperatures and lead to greater mass and energy losses.
For rosemary pomace, the MY decreased from 86.74% at 250 °C to 68.83% at 350 °C and further to 33.56% at 450 °C, while the EY decreased from 76.18% to 49.37% and further to 25.47%. The rosemary cake reached the highest values of all samples at 250 °C, with the MY decreasing from 92.59% at 250 °C to 74.55% at 350 °C and to only 10.37% at 450 °C, while the EY decreased from 99.17% to 70.62% and then to 10.61%. Grape pomace showed a steady decrease in MY from 79.90% to 49.76% and then to 30.67%, while EY decreased from 65.10% to 35.47% and then to 24.64%. A similar trend can be observed for apple pomace, where EY was found to be 76.85% at 250 °C, decreasing to 40.71% at 350 °C and 27.53% at 450 °C. The MY dropped from 83.18% to 60.27% and then to 39.34%.
The rosemary cake has been found to be the most sensitive to higher temperatures of torrefaction, as evidenced by a significant decrease in MY and EY at 450 °C. This can be attributed to the higher content of volatile compounds such as fats and essential oils, which decompose and volatilize rapidly at higher temperatures, resulting in greater losses of mass and energy. High EY values are the result of a favorable ratio between remaining mass and HHV change, which is typical for materials with a high content of carbon [24].
Figure 2c shows the HHV of the torrefied biomass samples as a function of temperature, comparing raw and torrefied samples at three different temperatures (250 °C, 350 °C and 450 °C) for each biomass type. During the torrefaction process, an increase in HHV was observed, which can be attributed to the decreased oxygen content and increased carbon content. It is important to note that a higher volatile matter content is associated with a lower heating value and higher fuel reactivity, while a higher fixed carbon content contributes to a higher HHV and lower fuel reactivity [25]. For all analyzed biomass types—RP, RC, GS and AP—an increase in HHV was observed when the torrefaction temperature was increased from 250 °C to 350 °C. For RP, the HHV in the raw sample was 19.37 MJ/kg and increased to 27.00 MJ/kg at 350 °C, which corresponds to an increase of about 39%. At 450 °C, there was a slight decrease to 26.0 MJ/kg. The RC had the highest HHV of all the samples. It was 34.52 MJ/kg in the raw material and reached 36.44 MJ/kg at 350 °C, while at 450 °C it slightly decreased to 33.73 MJ/kg. GS had an initial HHV of 20.44 MJ/kg, increasing to 28.67 MJ/kg at 350 °C (approx. 40% increase) and dropping to 25.44 MJ/kg at 450 °C. AP showed a similar trend. The initial HHV was 19.35 MJ/kg, increased to 20.94 MJ/kg at 250 °C, increased to 28.65 MJ/kg at 350 °C and then decreased to 27.65 MJ/kg at 450 °C. The lowest measured HHV was found for raw AP, while the highest was measured for RC at 350 °C.
The high HHV of RC is probably due to its specific composition and pre-treatment. As a by-product of the extraction of essential oils and other soluble compounds from rosemary, the cake has a lower moisture and volatile matter content and a higher concentration of fixed carbon and energy-rich components such as lignin, waxes and solvent residues. These factors contribute significantly to its energy potential. In contrast, AP has the lowest HHV, which is related to its higher moisture content, lower fixed carbon content and the presence of thermally sensitive compounds that degrade at lower torrefaction temperatures and reduce the energy density of the material [26]. The results show that a temperature of 350 °C is optimal to achieve the highest energy values of all analyzed biomass types, while higher temperatures (450 °C) lead to a decrease in HHV due to excessive thermal degradation.
Experimental results are consistent with literature findings, confirming the strong energy potential of rosemary cake, apple pomace and grape seeds. For apple pomace, the measured HHV values between 19.35 and 28.65 MJ/kg align well with previously reported ranges of 18.5–19.4 MJ/kg [27], with torrefaction at 350 °C clearly enhancing its fuel quality. Similarly, the HHV values obtained for grape seeds (20.44–28.67 MJ/kg) fall within the range reported by Ferreira et al. [28], further supporting their suitability for thermochemical conversion. Rosemary cake demonstrated the highest HHV of all studied samples, reaching 36.44 MJ/kg at 350 °C, which exceeds most values reported for comparable aromatic herb residues [29], highlighting its exceptional energy density.

3.2. Analylsis of Ash Content, Volatile Matter and Fixed Carbon

Ash content (Figure 3a) represents the inorganic fraction of biomass that remains as a combustion residue after thermal treatment and is an important indicator for assessing the quality of biomass as a fuel. For all four materials, the ash content increases with increasing torrefaction temperature. In RP samples, the ash content increased from 6.3 wt.% for raw biomass to 19.9 wt.% for torrefied biomass at 450 °C. A similar trend is observed for RC, where the ash content increased from 5.02% to 9.0%. This increase is a consequence of the relative increase in the content of inorganic substances due to the loss of organic mass (volatile components) during torrefaction itself. [30]. Untreated GS and AP have significantly lower ash contents than RP and RC, 2.87 wt.% and 1.94 wt.%, respectively. After torrefaction the ash content of GS increased to 3.4 wt.% for sample torrefied at 350 °C and to 6.8 wt.% for sample torrefied at 450 °C. The same trend applied for AP. Interestingly, AP has the lowest initial and final ash contents among all the analyzed samples, which is desirable from the point of view of energy use (less deposits, slag and lower corrosiveness during combustion) [31]. However, in general, all four types of biomasses contained relatively low content of ash.
Selected biomass samples were rich in volatile compounds (Figure 3b), a low molecular weight organic compounds, that are released during the heating of biomass. Their amount significantly affects the flammability, HHV and reactivity of biomass in thermochemical processes such as combustion and pyrolysis [32], so they need to be monitored carefully.
However, for all torrefied materials, a gradual decrease in volatile matter content was observed with increasing torrefaction temperature. For example, rosemary pomace decreased from 90.3 wt.% (RP) to 76.3 wt.% (T-RP-450). A similar trend was observed for rosemary cake (from 93.5 to 87.5%), grape seeds (from 95.4 to 87.5 wt.%) and apple pomace (from 96.5 to 89.2 wt.%). These changes are due to the degradation of hemicellulose, partly also cellulose, and the release of volatile organic components such as acids, aldehydes, ketones and alcohols [33]. Among all samples, AP retained the highest proportion of volatiles even after torrefaction at 450 °C, indicating greater stability of the organic matrix in the form of FC. In contrast, RP showed the greatest relative decrease under the same conditions, confirming a higher content of VM.
When comparing both parameters, it becomes clear that there is an inverse relationship between VM and ash content—with a decrease in VM, the ash content increases relatively due to the loss of organic mass. From the point of view of energy use, materials with a lower ash content and a moderate VM content (e.g., apple pomace and grape seeds) are most suitable for direct thermal utilization. On the other hand, materials with a lower VM content and a higher ash content are more suitable for use than biochars with a high FC content, as they exhibit greater stability and lower reactivity [34].
The fixed carbon (FC) content (Figure 3c) increased after torrefaction for nearly all samples, except for RC, which exhibited a distinct behavior likely due to its unique composition. RC is the solid residue obtained after solvent extraction of rosemary leaves and may retain small amounts of solvents; however, its overall composition is the primary factor influencing its thermal behavior during torrefaction. Unlike standard lignocellulosic biomass, rosemary cake is rich in lipids and proteins, which decompose differently than cellulose, hemicellulose, or lignin. Consequently, its torrefaction behavior results in lower FC enrichment compared to woody or herbaceous biomass. Otherwise, the highest content of FC was measured in samples T-AP-450 (4.9 wt.%), T-GS-450 (5.8 wt.%) and T-RP-350 (6.3 wt.%). This increase is attributed to the progressive conversion of hemicellulose and cellulose during torrefaction, which concentrates the more thermally stable lignin and FC fractions. Additionally, the content of FC increases after torrefaction due to deoxygenation reactions that expel volatile gaseous products, decreasing oxygen and hydrogen content [35]. Studies on various biomass types, including pinewood sawdust [36], wheat straw [37] and walnut oil processing waste [38], demonstrate that torrefaction increases fixed carbon content and heating value while reducing moisture.

3.3. Functional and Structural Characteristics of the Samples

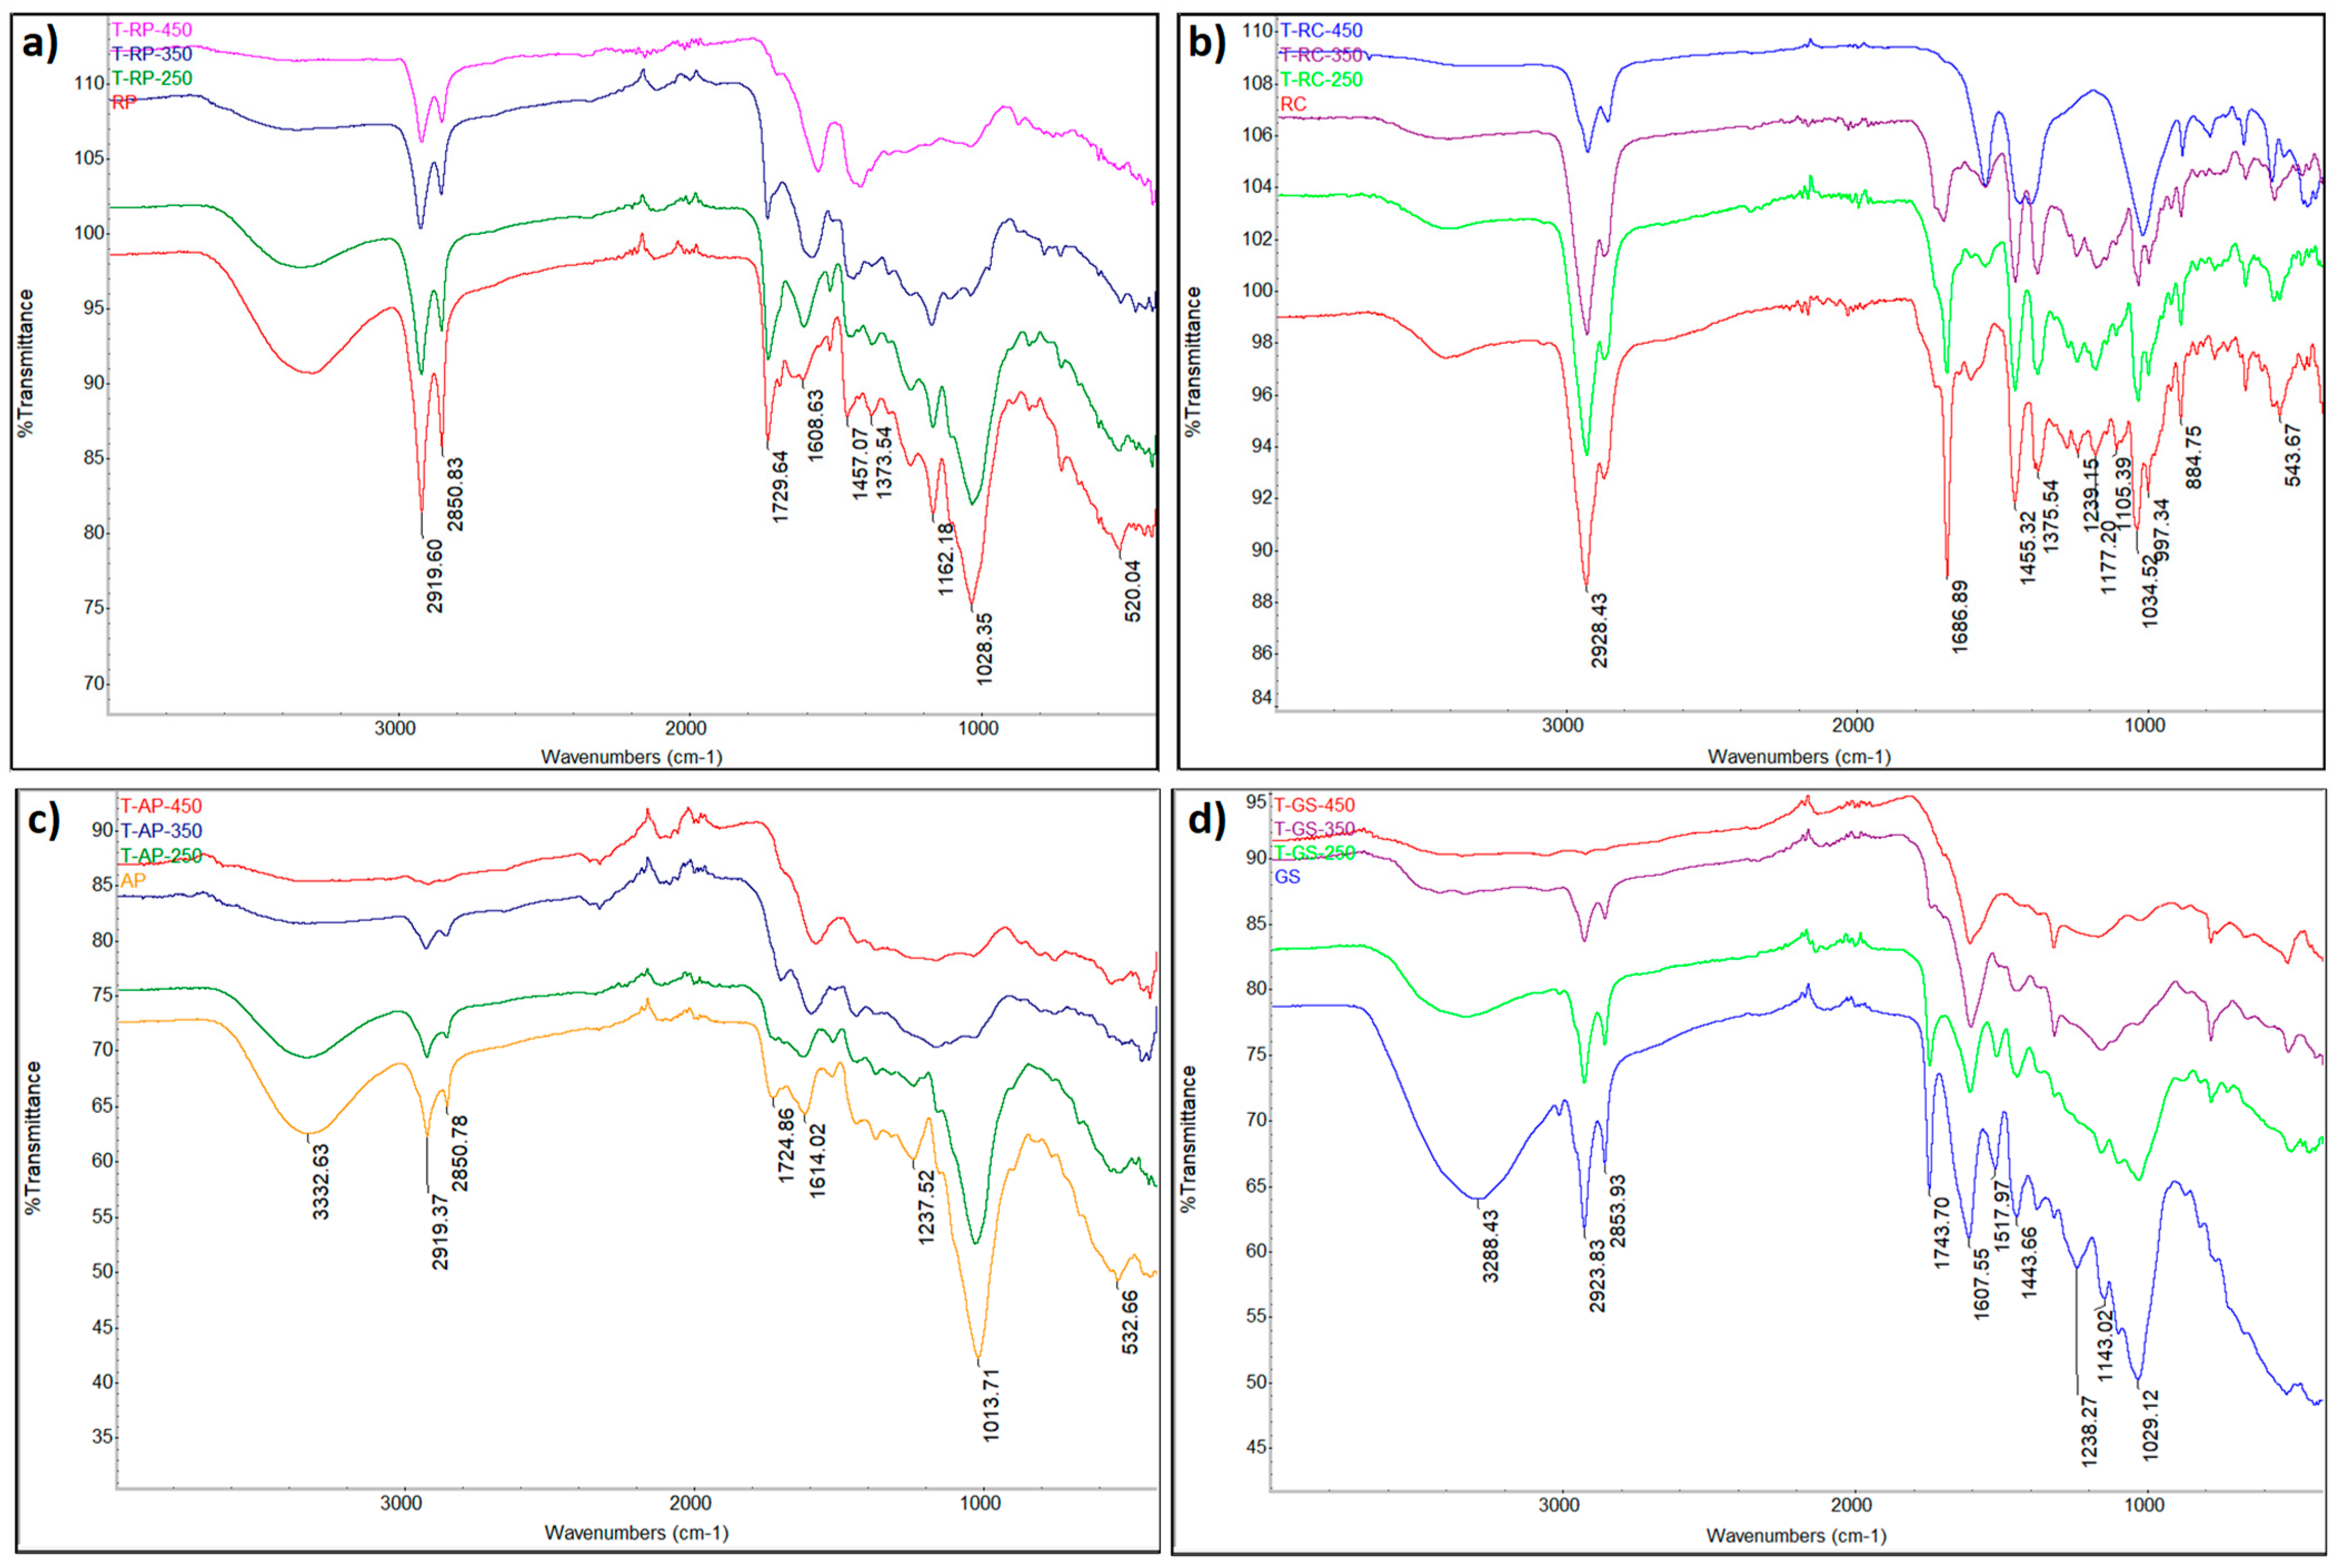
To understand the structural changes that occur during the torrefaction of biomass, both the raw materials and the torrefied materials were subjected to FTIR spectroscopy, the results of which are shown in Figure 4.
A broad absorption band around 3300 cm−1 was clearly present in both the raw samples and those treated at 250 °C, corresponding to the stretching of the O–H bonds of the hydroxyl groups, which is characteristic of cellulose, hemicellulose and the presence of moisture [39]. With increasing torrefaction temperatures of 350 °C and 450 °C, this band gradually disappeared, indicating dehydration and decomposition of the hydroxyl-rich components. At lower temperatures, the peaks at ~2920 and ~2850 cm−1 were also pronounced, which can be attributed to the stretching of C–H bonds in aliphatic chains [40]. These bands also weakened at higher temperatures, indicating the decomposition of polysaccharide and other components.
The absorption band at ~1700–1730 cm−1, characteristic of C=O bond stretching in carboxylic acids, ketones and esters, decreased significantly during torrefaction at 350 °C and disappeared almost completely at 450 °C. This confirms the decomposition of the oxygen functional groups, which leads to an increase in aromatic and less polar structures in the biochar [32]. Aromatic C=C bonds, identified as a band around ~1600 cm−1 [41], were more pronounced at 450 °C, which is characteristic of the progress of aromatic condensation and the formation of carbon skeleton. The characteristic bands in the ~1000–1200 cm−1 range, belonging to the stretching of C–O bonds in alcohol, ester and ether groups, also weakened at higher temperatures, confirming further devolatilization and decomposition of hemicellulose. These results are in accordance with the findings of other studies showing selective degradation of hemicellulose at temperatures between 200 and 300 °C [31]. The peaks near 800–900 cm−1 of torrefied lignocellulosic biomass are mostly related to aromatic C–H deformation or C–H bending, indicating lignin-derived aromatic structures [42].
The comparison between the materials showed that the degradation tendencies caused by torrefaction are repeated in all four biomaterials, albeit with varying intensity. Rosemary cake and pomace showed slightly more complex FTIR spectra, probably due to the higher content of essential oils and the high content of lignocellulosic components. FTIR analysis confirms that torrefaction at temperatures above 300 °C leads to extensive degradation of polar functional groups and an increase in the content of aromatic structures. These changes in the structure of the material confirm its transformation into a stable, carbon-rich product–biochar, with improved energy and sorption properties.

3.4. Thermogravimetric Analysis

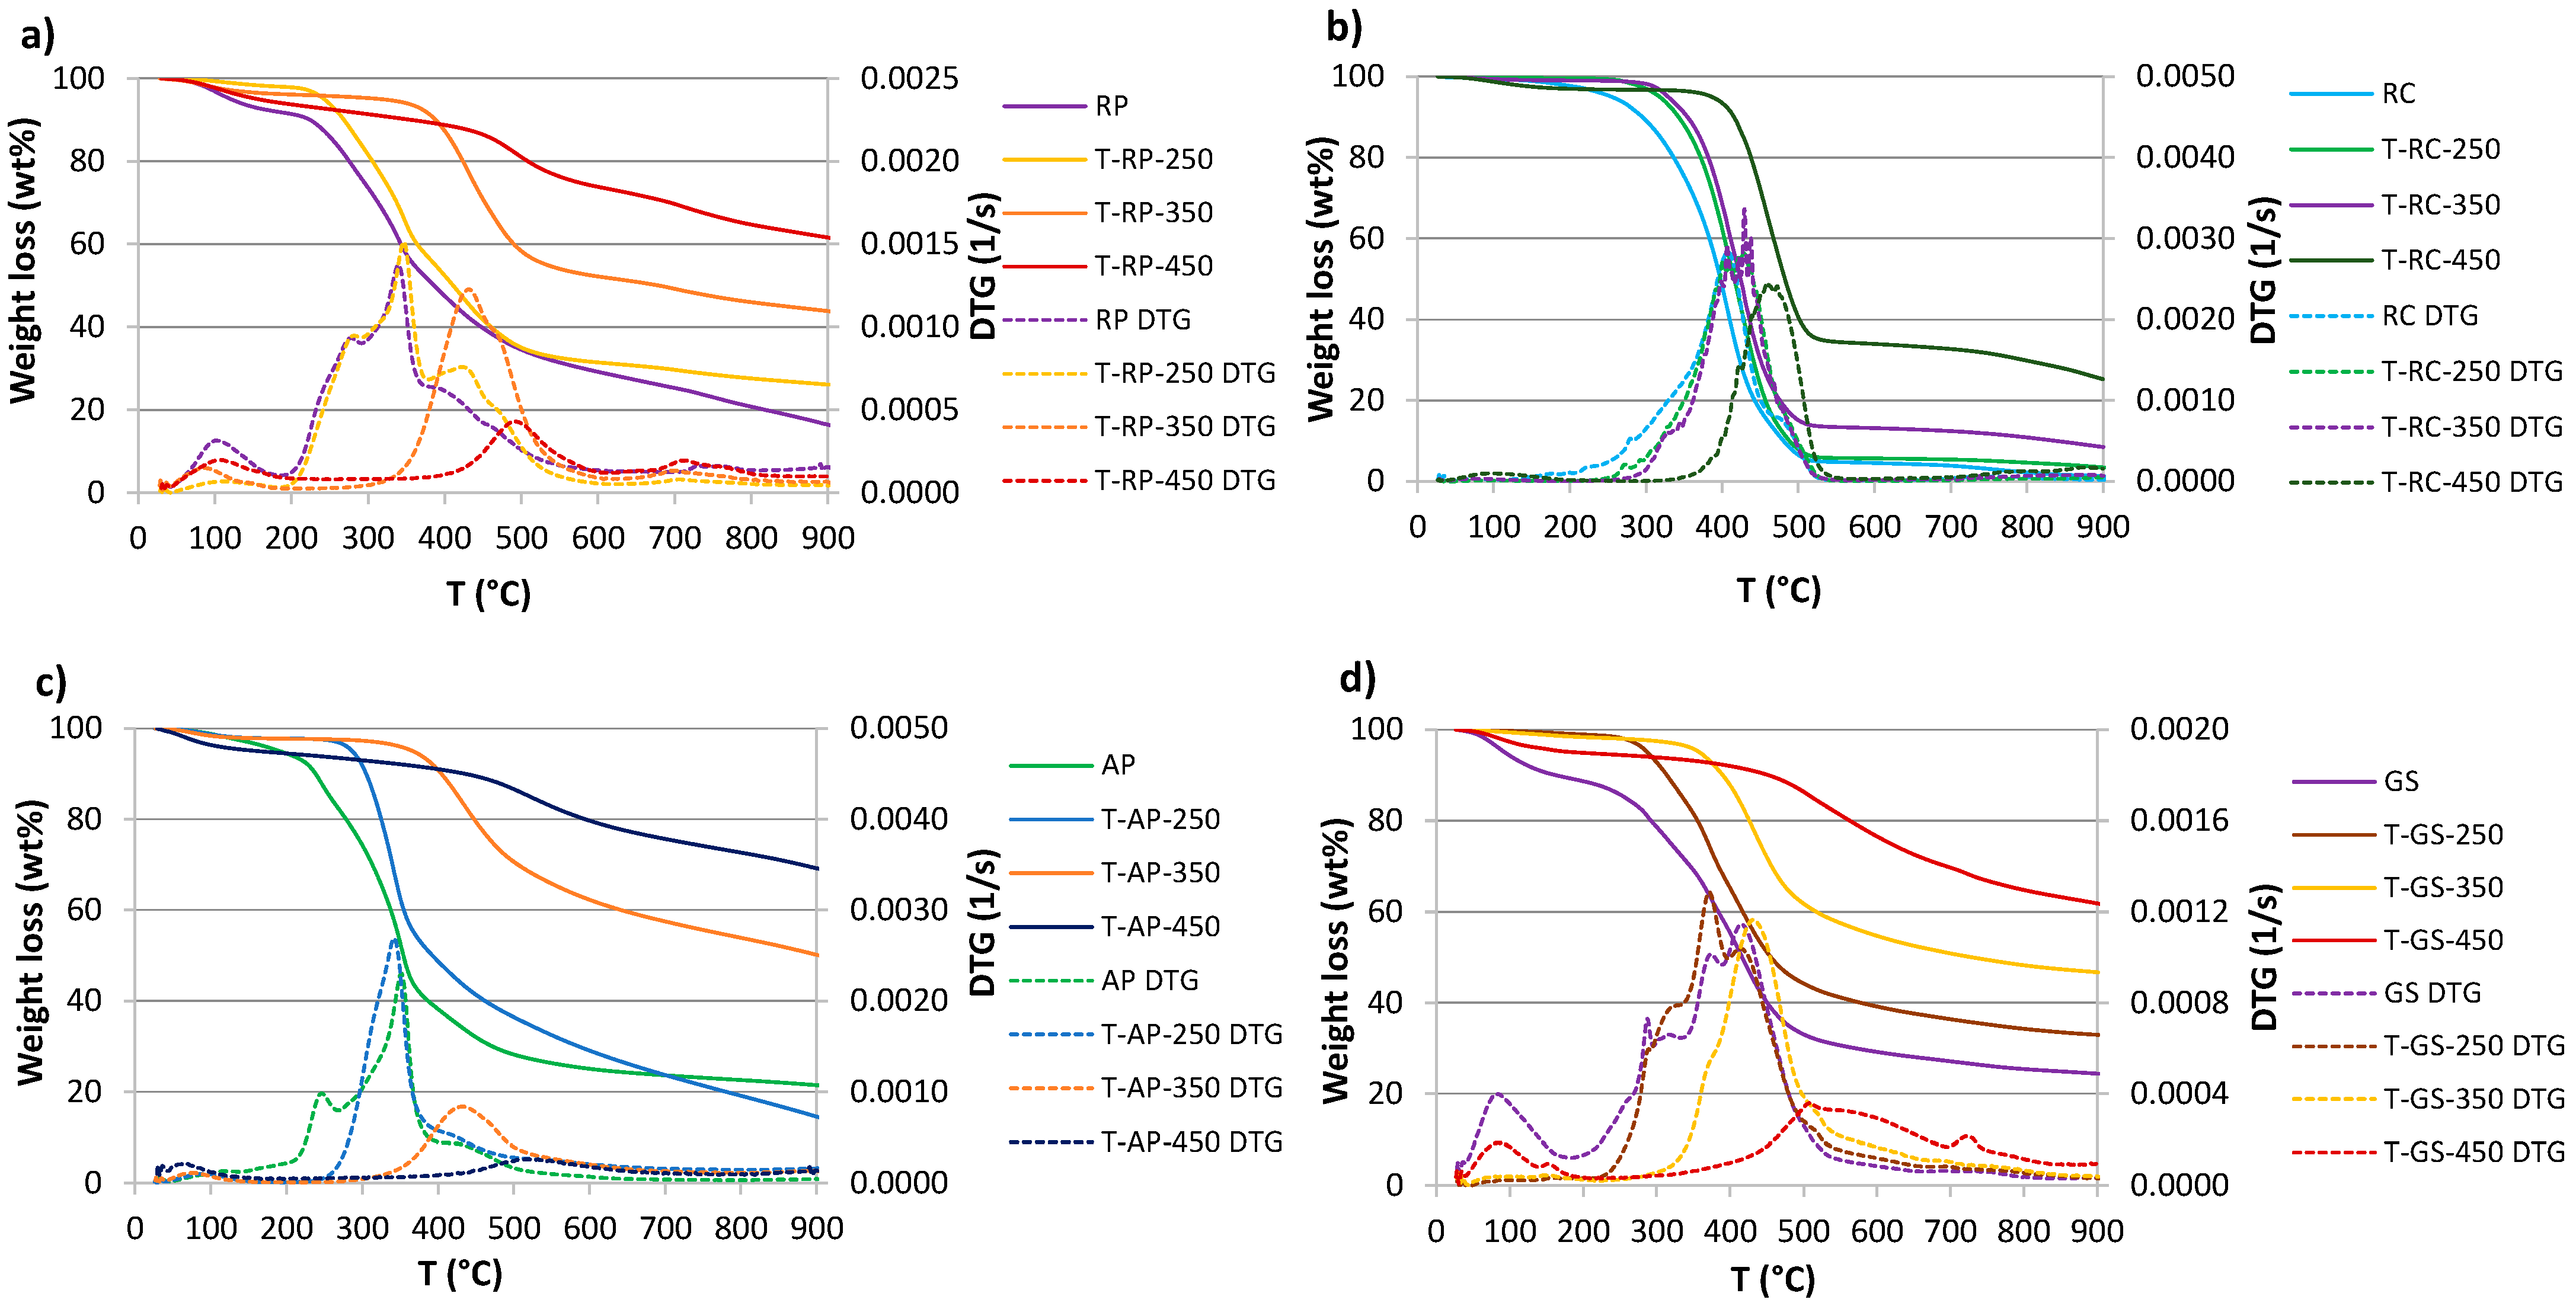
The results of the TGA measurements on untreated and torrefied samples are shown in Figure 5 and Table 2 for measurements in an N2 atmosphere simulating the pyrolysis process and in Figure 6 and Table 3 for measurements in an O2 atmosphere simulating the combustion process.
In samples subjected to pyrolysis in a nitrogen atmosphere, the first phase, known as devolatilization, occurs at temperatures below 200 °C, which is due to the removal of moisture and the partial conversion of volatile components. The active phase of pyrolysis takes place in the temperature range between 250 and 550 °C, where intensive decomposition of hemicellulose and cellulose takes place. After this phase, decomposition continues more slowly in the so-called passive zone, which begins at approximately 550 °C [43]. As stated in the literature, it is possible to separate the individual components of lignocellulosic biomass by analyzing the mass loss rate (DTG curve), since each of them is degraded in a characteristic temperature range. Hemicellulose generally degrades between 150 and 300 °C, cellulose somewhat later, in the range between 275 and 350 °C, while lignin degrades more slowly and in a wider temperature range between 250 and 500 °C. Due to these differences, the individual degradation phases appear as separate peaks or shoulders on the DTG curves, allowing the individual components to be recognized based on their thermal stability [44].
The main peak in the DTG curves of lignocellulosic materials is generally due to the cellulose devolatilization, while the shoulder band on the left is characteristic of the degradation of hemicellulose. Hemicellulose peak usually appears as a distinct shoulder or secondary peak at temperatures around 150 and 300 °C [45]. Such phenomenon was observed in unheated samples of apple pomace, grape seeds and rosemary pomace, where shoulders in the range of approximately 220–300 °C correspond to the typical hemicellulose degradation.
The total weight loss (Table 2) decreased significantly with the increase of the torrefaction temperature from 250 to 450 °C, e.g., by up to 48% (absolute value), which indicates a high thermal stability of the torrefied samples. In general, the highest overall weight loss was observed in RC samples (74.6–98.7%), followed by AP (30.8–85.74%), RP (38.5–83.6%) and GS samples (38.2–75.5%). The weight loss in a particular step, i.e., the pyrolysis stage, is different for the individual samples. For the non-torrefied samples, the weight loss was considerable in all three stages, with the maximum observed in the second step, while the torrefied samples, with few exceptions, showed a lower weight loss, especially in the first and second stage. The explanation for this is that the moisture content and some volatile compounds were already removed during torrefaction.
The comparison of the initial decomposition temperature (Ti) between non-torrefied and torrefied samples showed a significant influence of torrefaction on the thermal stability of the materials. The strongest increase in Ti was observed in rosemary pomace, where the temperature increased from 266.6 °C to 442.6 °C after treatment at 450 °C. For grape and apple pomace, the difference between non-torrefied and torrefied samples was also significant, as the temperature increased by 117.8 °C and 157.8 °C, respectively. The smallest change was observed in rosemary cake, where the temperature difference was only 69.6 °C. The increase in the initial decomposition temperature after torrefaction is due to a change in the chemical composition of the biomass. The decomposition of hemicellulose and cellulose increases the relative content of lignin, which has a higher thermal stability [46]. Torrefaction weakens the less stable side chains and ether bonds in hemicellulose and lignin, which contributes to increased heat resistance of the material and is reflected in the gradual shift of Ti to higher temperatures [47].
The comparison of the maximum temperatures (Tmax) of the DTG peaks showed that the main decomposition peak after torrefaction also shifted towards higher temperatures for all materials analyzed. In addition, the value of DTGmax decreased for samples obtained at higher temperatures. Such a shift indicates a higher thermal stability of the remaining biomass. This can be explained by the fact that by increasing the torrefaction temperature, less stable components are removed from the biomass, resulting in the decomposition of the remaining fractions taking place in a narrower temperature range.
In the presence of oxygen (Figure 6, Table 3), the decomposition of the biomass is faster than in pyrolysis under a nitrogen atmosphere, which is due to oxidation reactions. When comparing different types of biomass, it becomes clear that their ignition properties differ, which is related to the different chemical composition and reflects the differences in the cellulose, hemicellulose and lignin content of the samples.
In the case of the non-torrefied RP and AP samples, a prominent main peak appears on the DTG curves in the temperature range between 290 °C and 320 °C, which corresponds to the highest mass loss rate. The temperature of the peak reflects the thermal stability of the component to be degraded, whereby a higher temperature means higher thermal stability. In addition to the position of the peak, its height or area is also important, as it is related to the rate of degradation. A higher peak means faster degradation, while a lower shows the opposite behavior [48]. By comparing the RP and AP peaks with the GS and RC peaks, it can be concluded that the latter two samples are more thermally stable, as their peak occurs at a much higher temperature and is less pronounced, indicating a slower rate of degradation. Moreover, Ti and Tmax are slightly lower in the case of combustion of the samples than in the case of pyrolysis, while the values of DTGmax are higher. The overall weight loss is higher than in the case of pyrolysis, as the samples lost between 93.7 and 98.5% of their weight, with the lowest value observed for the RP sample, followed by GS, RC and AP, although the differences between the samples are quite small.
The thermogravimetric curves of raw and torrefied rosemary pomace (Figure 6b) show that the DTG peaks of the torrefied biomass are lower than that of the raw biomass. In particular, these peaks are significantly reduced in the sample treated at the highest torrefaction temperature (450 °C), indicating the degradation of most hemicellulose and cellulose components during torrefaction [49]. This sample therefore showed the lowest mass loss during combustion among all torrefied samples. In addition, the characteristics combustion temperatures (Ti, Tmax and Tb) were shifted in the torrefied samples. Ti increases with increasing temperature of torrefaction. The exception is sample T-RP-450, where Ti is lower than in the raw material. This can be attributed to the structural and compositional changes caused by thermal treatment. The crystallinity index of the biomass can increase with torrefaction, which influences the thermal properties and stability of the biomass [50].

3.5. TGA-FTIR Analysis of Gaseous Products Released During Pyrolysis and Combustion

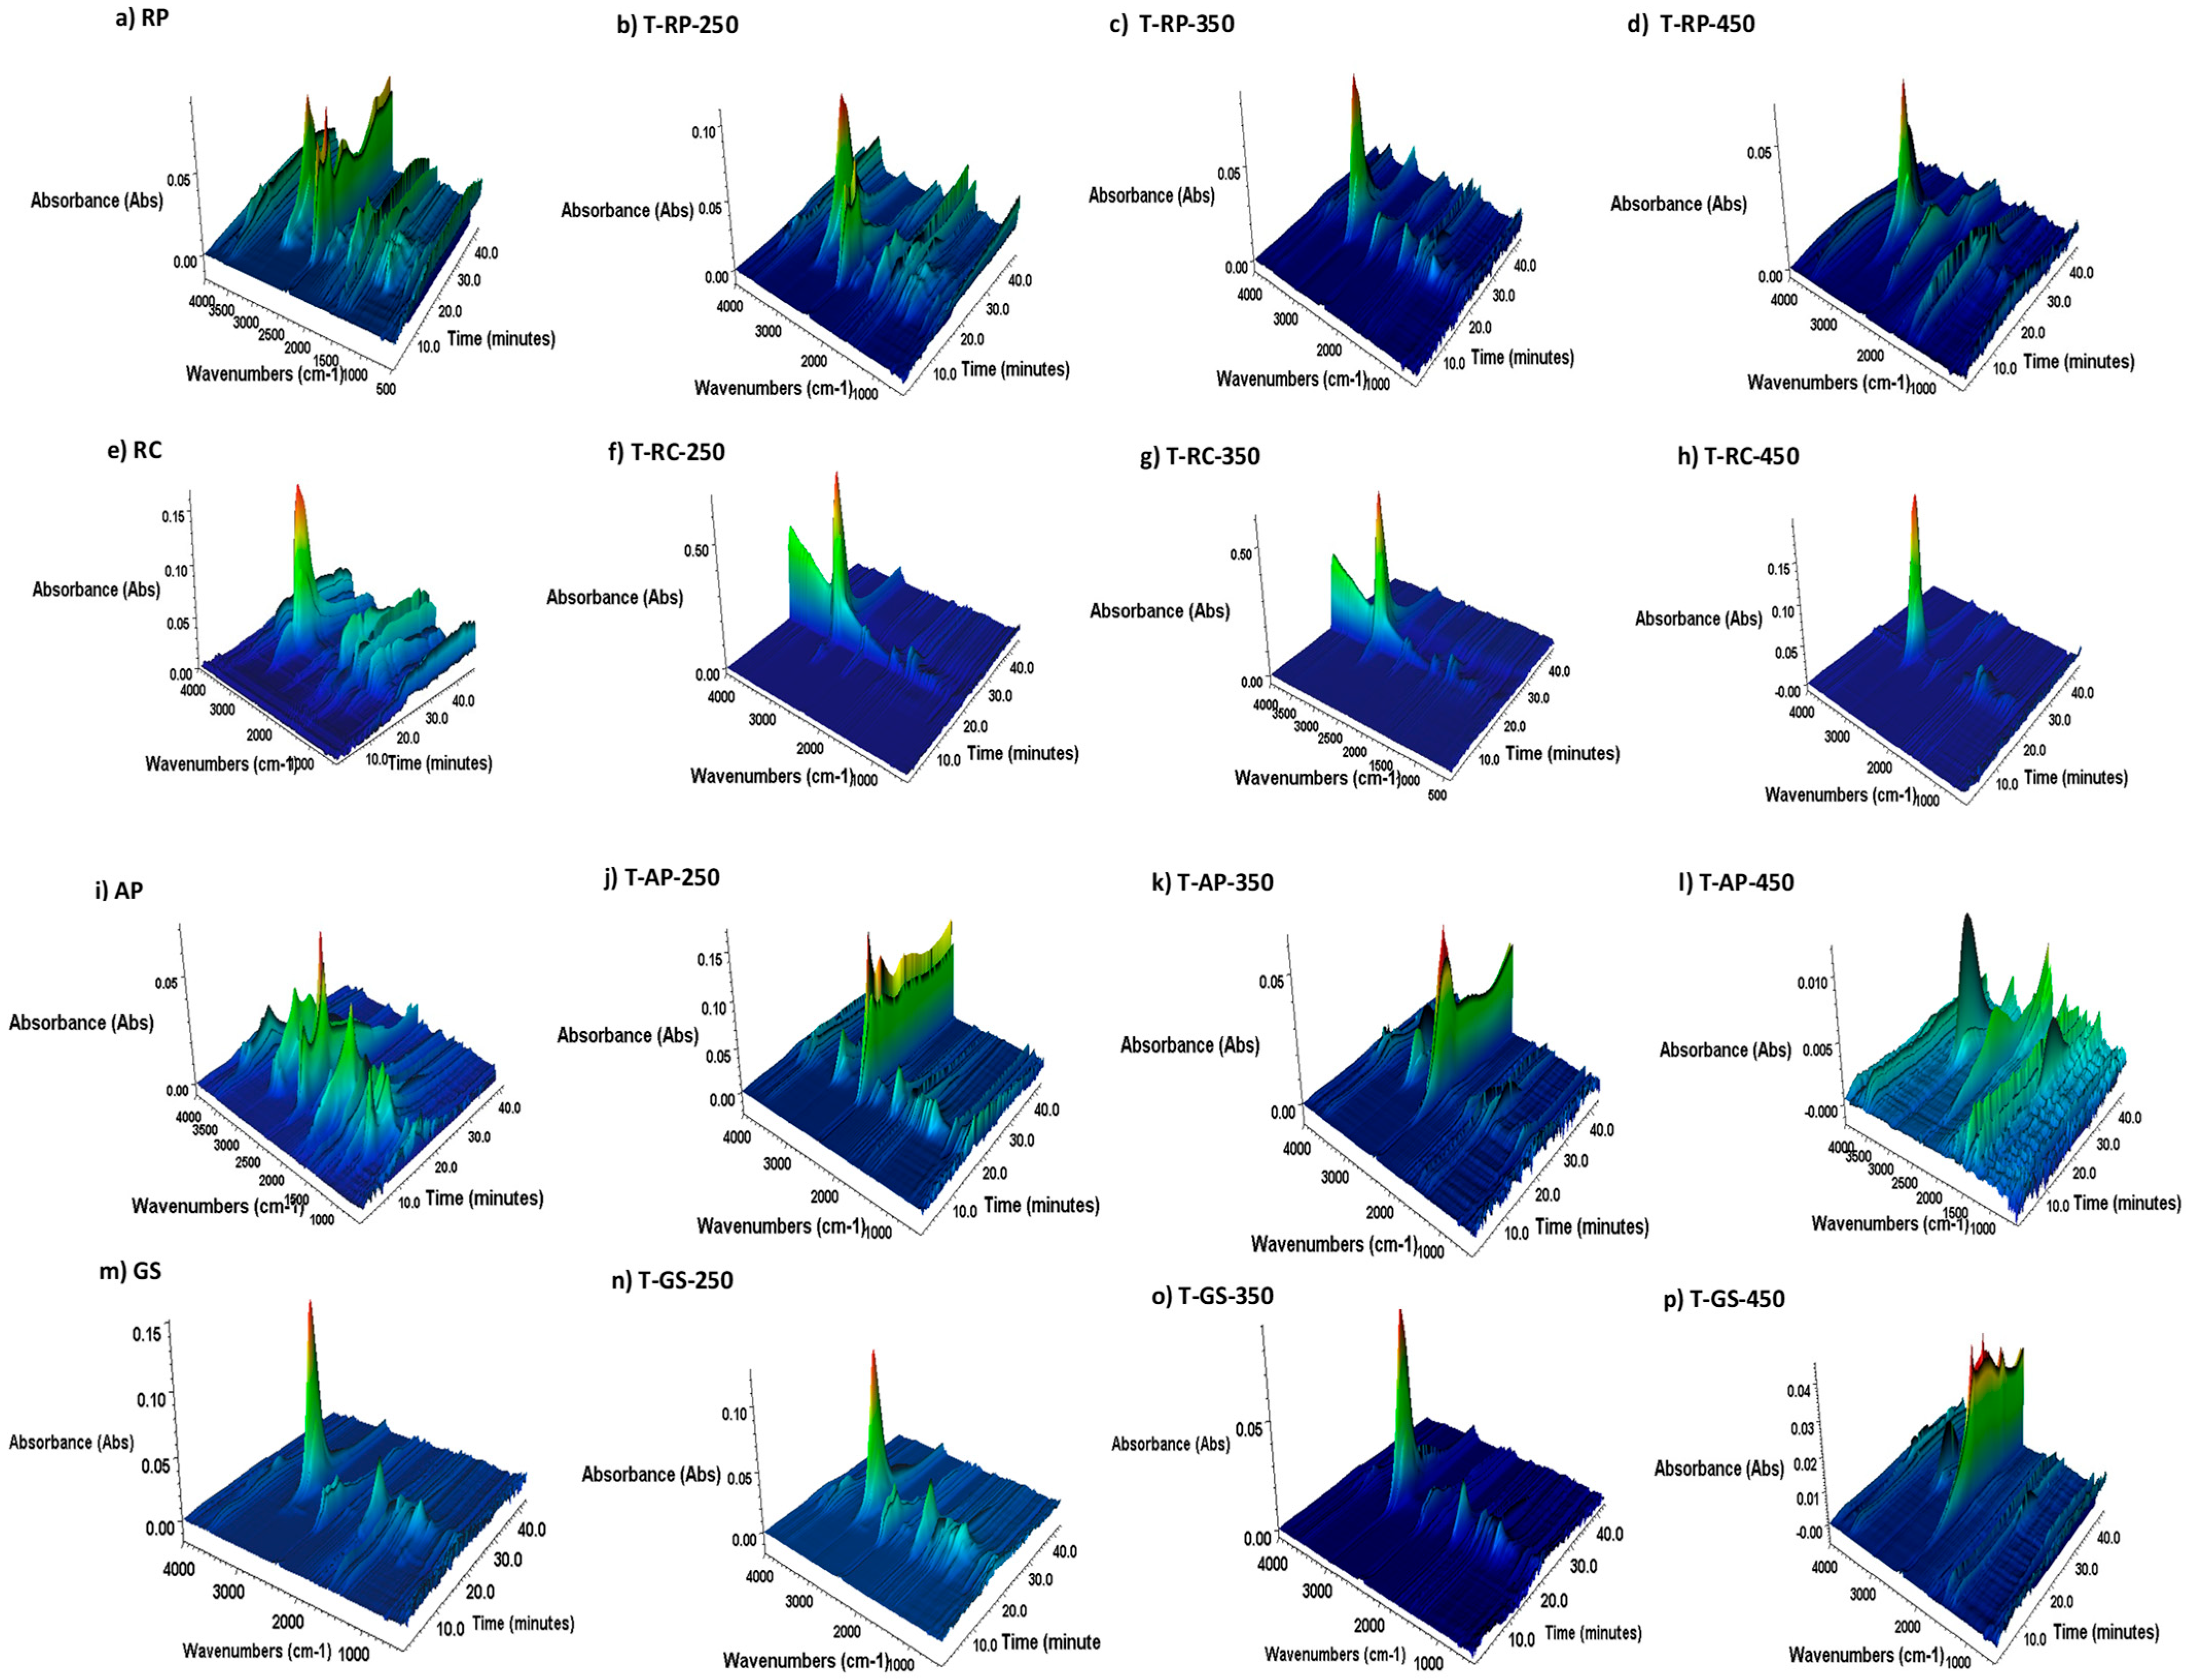
Untreated and torrefied samples were also subjected to TGA-FTIR analysis, which provides information on the chemical composition of the gaseous products released when the samples are heated and enables a comprehensive understanding of decomposition, oxidation and other reactions. The TGA-FTIR spectra of the gaseous products of samples exposed to pyrolysis in an N2 atmosphere are shown in Figure 7.
TGA-FTIR analysis offers valuable insights into the thermal decomposition and gas evolution of biomass. Previous studies indicate that the main gases released during pyrolysis include CO, CO2, CH4 and H2O, with decomposition typically occurring in three stages corresponding to hemicellulose, cellulose and lignin breakdown [42] The torrefaction modifies the thermal behavior of biomass, generally leading to simpler gas evolution profiles and altered activation energies at higher torrefaction temperatures [51]. Gas composition also depends on the type of biomass and processing conditions—for example, rapeseed oil cake pyrolysis produces bio-oil rich in oleic acid and aromatic compounds [52].
The analysis of the TGA-FTIR spectra obtained during pyrolysis of the test samples revealed the release of different gases compared to the spectra of the samples exposed to combustion. During pyrolysis, gaseous products such as CO, CO2, CH4, NOx, H2O and SO2 can be detected, while in the presence of oxygen, mainly carbon dioxide (CO2) is produced [53]. To identify the gases released, the characteristic wavenumbers from the literature were used based on which the following species were identified [54,55]: SO2 at 1342 cm−1, NOx at 1762 cm−1, CO at 2250–2000 cm−1, CO2 at 2400–2250 cm−1, CH4 at 3100–2800 cm−1 and H2O between 4000–3400 cm−1 [56]. These gases are typically present in the gas mixture from the pyrolysis of lignocellulosic biomass [42].
In the case of rosemary pomace (RP), the TGA-FTIR spectra become progressively simpler with increasing torrefaction temperature (250, 350 and 450 °C), reflecting a decrease in the content of volatile compounds. At 250 °C, various components are still present but in lower concentration, while at 350 °C and especially at 450 °C, the presence of hydrocarbon-related species due to C-H stretching vibrations, mainly methane (CH4), dominates, while the signals for carbon dioxide (CO2) and water vapor (H2O) almost completely disappear. As reported by other authors, the peaks in the range of 4000–3400 cm−1 are associated with stretching vibrations of the –OH groups, indicating the presence of water vapor [57]. Accordingly, torrefaction led to a reduced release of water vapor during pyrolysis. As the torrefaction temperature increases, the intensity and timeframe of CO2 and CH4 release decreases, although CH4 emissions are still relatively high. In general, the lowest CH4 emission was detected in the sample torrefied at the highest temperature. As the torrefaction temperature increased, the emission of gaseous products also shifted and started later, at higher pyrolysis temperatures.
The pyrolysis of AP yielded similar spectra to the pyrolysis of RP, but the emission of CH4 and especially CO2 runs through the entire spectrum and can still be observed at the end of the pyrolysis. In the case of GS, the highest emission of CH4 was observed, with the exception of sample T-GS-450, which had a higher CO2 content than CH4. In the case of AP and GS, the presence of other gases such as NOx and SO2 was also observed. The RC samples showed slightly different spectra, especially the torrefied samples. The emission of CH4 is quite high in all samples, but the emission of other compounds except –OH groups was almost negligible.
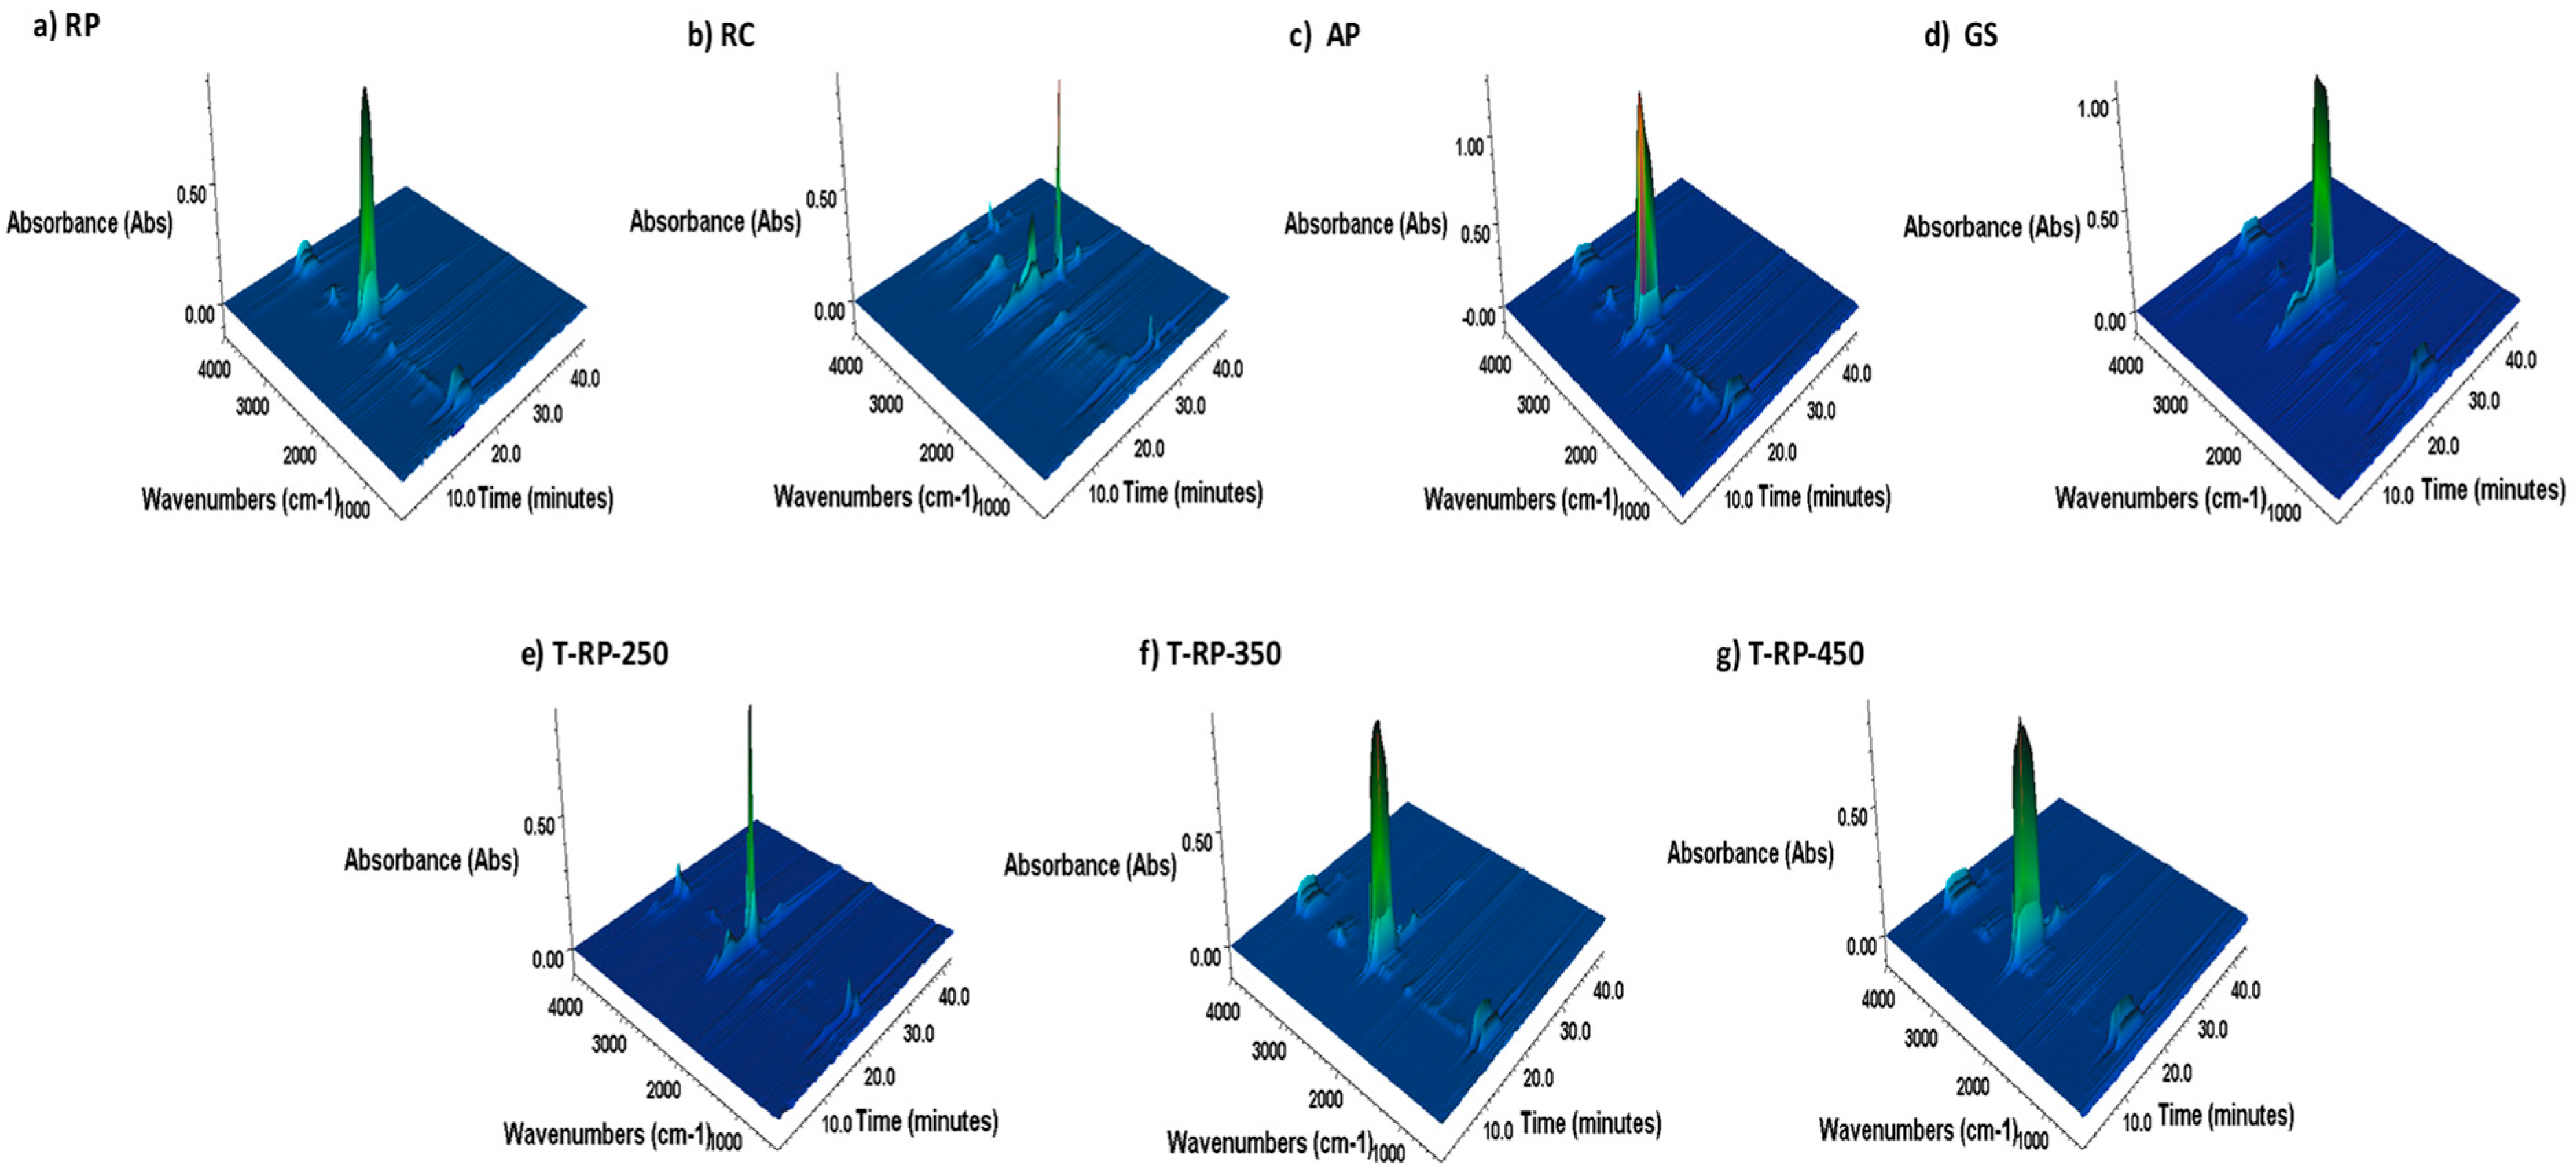
While the TGA-FTIR spectra for the N2 atmosphere were recorded for all test samples, the TGA-FTIR spectra for the O2 atmosphere (combustion) were only obtained for untreated biomass samples and for torrefied rosemary pomace at all operating temperatures (Figure 8).
The spectra obtained in O2 atmosphere are much simpler and contain a significant peak per spectrum located at about 2400 cm-1, which is very different from the TGA-FTIR spectra obtained in N2 atmosphere. In addition, their complexity decreases with increasing temperature (from 250 to 450 °C). The most prominent peak can be attributed to the release of carbon dioxide (CO2), which indicates a dominant oxidative decomposition [53]. Low peak values can also be observed for other gaseous products (H2O, CO, NOx and SO2), but their intensity is significantly lower compared to the values observed during pyrolysis and is almost neglected. When analyzing the effect of the torrefaction temperature on the combustion process, the intensity of the peak for CO2 emissions decreases with increasing torrefaction temperature, but on the other hand becomes broader and the emission is prolonged.
Similar patterns of TGA-FTIR spectra have also been observed in the literature, e.g., for the pyrolysis or combustion of other lignocellulosic materials such as olive pomace, sunflower waste, pinecone [42] and various types of wood biomass torrefied in combination with coal [57].

4. Conclusions

This study demonstrated that torrefaction significantly improves the fuel quality and thermal stability of agricultural and industrial residues such as rosemary cake, rosemary pomace, apple pomace and grape seeds. The process enhances energy density and increases fixed carbon and higher heating values, making the treated materials suitable for bioenergy applications. Structural analysis confirmed that torrefaction leads to the decomposition of oxygenated functional groups and the formation of stable aromatic structures, which contribute to improved hydrophobicity, storage stability and combustion behavior. TGA analysis revealed that torrefied biomass exhibits a shift in decomposition temperatures toward higher values, indicating improved thermal stability and reduced reactivity. The TGA-FTIR analysis provided a detailed understanding of the gaseous products formed during pyrolysis and combustion, confirming the reduction of undesirable emissions with increasing torrefaction severity.
Among the materials analyzed, rosemary cake had the highest energy potential in terms of HHV, followed by grape seeds, apple pomace and rosemary pomace, which had much lower but comparable HHVs. Apple pomace and grape pomace had favorable fuel properties due to their low ash content and balanced volatile matter content. Rosemary pomace and rosemary cake delivered high energy and mass yields at temperatures up to 350 °C, while torrefaction at higher temperatures (450 °C) significantly reduced both the mass yield and the energy value.
The results emphasize the potential of using the above residues as sustainable, locally available raw materials for the production of biofuel through torrefaction, as well as their potential for further use in incineration or other thermochemical processes. Torrefaction of agro-industrial by-products not only supports circular bioeconomy principles but also contributes to reducing environmental impacts by converting low-value waste into renewable energy carriers.

Author Contributions

Conceptualization, D.U. and A.P.; methodology, D.U. and A.P.; software, D.A.; formal analysis, D.A., E.G., A.Š. and N.Š.; investigation, D.A., E.G., A.Š. and N.Š.; resources, D.G.; data curation, D.U. and A.P.; writing—original draft preparation, D.A., E.G., A.Š. and N.Š.; writing—review and editing, D.U., D.G. and A.P.; visualization, D.A., E.G., A.Š. and N.Š.; supervision, D.G.; funding acquisition, D.G. All authors have read and agreed to the published version of the manuscript.

Funding

This research was funded by the Slovenian Research and Innovation Agency (ARIS), grant umbers: P2-0421, P2-0046, J4-50149 and L2-60155.

Data Availability Statement

Dataset available on request from the authors.

Acknowledgments

The authors would like to thank The Slovenian Research and Innovation Agency (ARIS) for supporting this work by funding the research programs P2-0421, P2-0046 and research projects J4-50149 and L2-60155. The work was conducted by the instruments obtained within the project “Upgrading national research infrastructures-RIUM”, co-financed by the Republic of Slovenia, the Ministry of Education, Science and Sport and the European Union from the European Regional Development Fund.

Conflicts of Interest

The authors declare no conflicts of interest. The funders had no role in the design of the study; in the collection, analyses, or interpretation of data; in the writing of the manuscript; or in the decision to publish the results.

Abbreviations

The following abbreviations are used in this manuscript:
APApple pomace
DTGDerivative thermogravimetric curve
EYEnergy yield
FTIRFourier transform infrared spectroscopy
GSGrape seeds
HHVHigher heating value
MYMass yield
RPRosemary pomace
RCRosemary cake
TGAThermogravimetric analysis

References

  1. Zhang, J.; Gu, J.; Shan, R.; Yuan, H.; Chen, Y. Advances in thermochemical valorization of biomass towards carbon neutrality. Resour. Conserv. Recycl. 2025, 212, 107905. [Google Scholar] [CrossRef]
  2. Okolie, J.A.; Epelle, E.I.; Tabat, M.E.; Orivri, U.; Amenaghawon, A.N.; Okoye, P.U.; Gunes, B. Waste biomass valorization for the production of biofuels and value-added products: A comprehensive review of thermochemical, biological and integrated processes. Process Saf. Environ. Prot. 2022, 159, 323–344. [Google Scholar] [CrossRef]
  3. Ashfaq, M.M.; Bilgic Tüzemen, G.; Noor, A. Exploiting agricultural biomass via thermochemical processes for sustainable hydrogen and bioenergy: A critical review. Int. J. Hydrogen Energy 2024, 84, 1068–1084. [Google Scholar] [CrossRef]
  4. Seraj, S.; Azargohar, R.; Dalai, A.K. Dry torrefaction and hydrothermal carbonization of biomass to fuel pellets. Renew. Sust. Energ. Rev. 2025, 210, 115186. [Google Scholar] [CrossRef]
  5. Ivanovski, M.; Urbancl, D.; Petrovič, A.; Stergar, J.; Goričanec, D.; Simonič, M. Improving Lignocellulosic and Non-Lignocellulosic Biomass Characteristics through Torrefaction Process. Appl. Sci. 2022, 12, 12210. [Google Scholar] [CrossRef]
  6. Zhang, X.; Ma, M.; Bai, Y.; Su, W.; Song, X.; Lv, P.; Wang, J.; Yu, G. Torrefaction of sludge under CO2 atmosphere to improve the fuel properties for high temperature gasification with coal. Thermochim. Acta 2022, 713, 179249. [Google Scholar] [CrossRef]
  7. Niu, Y.; Lv, Y.; Lei, Y.; Liu, S.; Liang, Y.; Wang, D.; Hui, S. Biomass torrefaction: Properties, applications, challenges, and economy. Renew. Sust. Energ. Rev. 2019, 115, 109395. [Google Scholar] [CrossRef]
  8. Chen, W.-H.; Lin, B.-J.; Lin, Y.-Y.; Chu, Y.-S.; Ubando, A.T.; Show, P.L.; Ong, H.C.; Chang, J.-S.; Ho, S.-H.; Culaba, A.B.; et al. Progress in biomass torrefaction: Principles, applications and challenges. Prog. Energy Combust. Sci. 2021, 82, 100887. [Google Scholar] [CrossRef]
  9. Zhu, G.; Wen, C.; Liu, T.; Xu, M.; Ling, P.; Wen, W.; Li, R. Combustion and co-combustion of biochar: Combustion performance and pollutant emissions. Appl. Energy 2024, 376, 124292. [Google Scholar] [CrossRef]
  10. Dira, A.; Harrou, A.; Elmouwahidi, A.; Bendahhou, A.; Carrasco-Marin, F.; Gharibi, E. Assessment of the electrical and energetic properties of rosemary residue biochars and their wettability. Biomass Bioenergy 2025, 201, 108065. [Google Scholar] [CrossRef]
  11. Vella, F.M.; Laratta, B. Rosemary Essential Oil Extraction and Residue Valorization by Means of Polyphenol Recovery. Biol. Life Sci. Forum 2023, 26, 8. [Google Scholar] [CrossRef]
  12. Rebolledo-Leiva, R.; Estévez, S.; Hernández, D.; Feijoo, G.; Moreira, M.T.; González-García, S. Apple Pomace Integrated Biorefinery for Biofuels Production: A Techno-Economic and Environmental Sustainability Analysis. Resources 2024, 13, 156. [Google Scholar] [CrossRef]
  13. Vendruscolo, F.; Albuquerque, P.M.; Streit, F.; Esposito, E.; Ninow, J.L. Apple Pomace: A Versatile Substrate for Biotechnological Applications. Crit. Rev. Biotechnol. 2008, 28, 1–12. [Google Scholar] [CrossRef] [PubMed]
  14. Cardarelli, A.; Barbanera, M. Hydrochar from winemaking industry wastes as solid biofuel: A thermal and kinetic analysis of pyrolysis and combustion. Fuel 2024, 372, 132256. [Google Scholar] [CrossRef]
  15. D’Eusanio, V.; Lezza, A.; Anderlini, B.; Malferrari, D.; Romagnoli, M.; Roncaglia, F. Technological Prospects of Biochar Derived from Viticulture Waste: Characterization and Application Perspectives. Energies 2024, 17, 3421. [Google Scholar] [CrossRef]
  16. Pala, M.; Kantarli, I.C.; Buyukisik, H.B.; Yanik, J. Hydrothermal carbonization and torrefaction of grape pomace: A comparative evaluation. Bioresour. Technol. 2014, 161, 255–262. [Google Scholar] [CrossRef]
  17. Pardo, R.; Taboada-Ruiz, L.; Fuente, E.; Ruiz, B.; Díaz-Somoano, M.; Calvo, L.F.; Paniagua, S. Exploring the potential of conventional and flash pyrolysis methods for the valorisation of grape seed and chestnut shell biomass from agri-food industry waste. Biomass Bioenergy 2023, 177, 106942. [Google Scholar] [CrossRef]
  18. Madadian, E.; Rahimi, J.; Mohebbi, M.; Simakov, D.S.A. Grape pomace as an energy source for the food industry: A thermochemical and kinetic analysis. Food Bioprod. Process. 2022, 132, 177–187. [Google Scholar] [CrossRef]
  19. Karod, M.; Orton, K.A.; Elkasabi, Y.; Mullen, C.A.; Harman-Ware, A.E.; Iisa, K.; Goldfarb, J.L. Recovery of value-added compounds through fast pyrolysis of apple pomace hydrochar. J. Anal. Appl. Pyrolysis 2025, 185, 106868. [Google Scholar] [CrossRef]
  20. ASTM_D7582-15(2015); Standard Test Method for Proximate Analysis of Coal and Coke by Macro Thermogravimetric Analysis. ASTMInternational: WestConshohocken, PA, USA, 2015.
  21. UNI EN 14918:2019; Solid Recovered Fuels—Method for the Determination of Calorific Value. UNI: Milano, Italy, 2019.
  22. Petrovič, A.; Cenčič Predikaka, T.; Škodič, L.; Vohl, S.; Čuček, L. Hydrothermal co-carbonization of sewage sludge and whey: Enhancement of product properties and potential application in agriculture. Fuel 2023, 350, 128807. [Google Scholar] [CrossRef]
  23. Bimal, A.; Ranjan, R.P.; Animesh, D. Qualitative and kinetic analysis of torrefaction of lignocellulosic biomass using DSC-TGA-FTIR. AIMS Energy 2015, 3, 760–773. [Google Scholar] [CrossRef]
  24. Chiou, B.-S.; Valenzuela-Medina, D.; Bilbao-Sainz, C.; Klamczynski, A.K.; Avena-Bustillos, R.J.; Milczarek, R.R.; Du, W.-X.; Glenn, G.M.; Orts, W.J. Torrefaction of pomaces and nut shells. Bioresour. Technol. 2015, 177, 58–65. [Google Scholar] [CrossRef]
  25. Park, S.Y.; Kim, S.J.; Oh, K.C.; Cho, L.H.; Jeon, Y.K.; Kim, D.H. Evaluation of the Optimal Conditions for Oxygen-Rich and Oxygen-Lean Torrefaction of Forestry Byproduct as a Fuel. Energies 2023, 16, 4763. [Google Scholar] [CrossRef]
  26. Chen, W.-H.; Kuo, P.-C. Torrefaction and co-torrefaction characterization of hemicellulose, cellulose and lignin as well as torrefaction of some basic constituents in biomass. Energy 2011, 36, 803–811. [Google Scholar] [CrossRef]
  27. Ivashchuk, O.; Atamanyuk, V.; Chyzhovych, R.; Manastyrska, V.; Sobechko, I. Evaluation of the Apple Pomace Use as a Raw Material for Alternative Solid Fuel. J. Sustain. Dev. Energy Water Environ. Syst. 2024, 12, 1120529. [Google Scholar] [CrossRef]
  28. Ferreira, C.I.A.; Calisto, V.; Cuerda-Correa, E.M.; Otero, M.; Nadais, H.; Esteves, V.I. Comparative valorisation of agricultural and industrial biowastes by combustion and pyrolysis. Bioresour. Technol. 2016, 218, 918–925. [Google Scholar] [CrossRef]
  29. Pulidori, E.; Gonzalez-Rivera, J.; Pelosi, C.; Ferrari, C.; Bernazzani, L.; Bramanti, E.; Tiné, M.R.; Duce, C. Thermochemical Evaluation of Different Waste Biomasses (Citrus Peels, Aromatic Herbs, and Poultry Feathers) towards Their Use for Energy Production. Thermo 2023, 3, 66–75. [Google Scholar] [CrossRef]
  30. Chen, W.-H.; Peng, J.; Bi, X.T. A state-of-the-art review of biomass torrefaction, densification and applications. Renew. Sust. Energ. Rev. 2015, 44, 847–866. [Google Scholar] [CrossRef]
  31. Phanphanich, M.; Mani, S. Impact of torrefaction on the grindability and fuel characteristics of forest biomass. Bioresour. Technol. 2011, 102, 1246–1253. [Google Scholar] [CrossRef] [PubMed]
  32. Yang, H.; Yan, R.; Chen, H.; Lee, D.H.; Zheng, C. Characteristics of hemicellulose, cellulose and lignin pyrolysis. Fuel 2007, 86, 1781–1788. [Google Scholar] [CrossRef]
  33. Chen, L.; Chen, X.; Zhao, Y.; Xie, X.; Yang, S.; Hua, D.; Wang, C.; Li, T. Effect of Torrefaction on the Physiochemical Characteristics and Pyrolysis of the Corn Stalk. Polymers 2023, 15, 4069. [Google Scholar] [CrossRef] [PubMed]
  34. Bach, Q.-V.; Skreiberg, Ø. Upgrading biomass fuels via wet torrefaction: A review and comparison with dry torrefaction. Renew. Sust. Energ. Rev. 2016, 54, 665–677. [Google Scholar] [CrossRef]
  35. Haykiri-Acma, H.; Yaman, S.; Kucukbayrak, S. Effects of torrefaction on lignin-rich biomass (hazelnut shell): Structural variations. J. Renew. Sustain. Energy 2017, 9, 063102. [Google Scholar] [CrossRef]
  36. Yang, Y.; Qu, X.; Huang, G.; Ren, S.; Dong, L.; Sun, T.; Liu, P.; Li, Y.; Lei, T.; Cai, J. Insight into lignocellulosic biomass torrefaction kinetics with case study of pinewood sawdust torrefaction. Renew. Energy 2023, 215, 118941. [Google Scholar] [CrossRef]
  37. Gajera, B.; Tyagi, U.; Sarma, A.K.; Jha, M.K. Impact of torrefaction on thermal behavior of wheat straw and groundnut stalk biomass: Kinetic and thermodynamic study. Fuel Commun. 2022, 12, 100073. [Google Scholar] [CrossRef]
  38. Zhang, D.; Han, P.; Zheng, H.; Yan, Z. Torrefaction of walnut oil processing wastes by superheated steam: Effects on products characteristics. Sci. Total Environ. 2022, 830, 154649. [Google Scholar] [CrossRef]
  39. Pandey, K.K.; Pitman, A.J. FTIR studies of the changes in wood chemistry following decay by brown-rot and white-rot fungi. Int. Biodeterior. Biodegrad. 2003, 52, 151–160. [Google Scholar] [CrossRef]
  40. Nepal, R.; Kim, H.J.; Poudel, J.; Oh, S.C. A study on torrefaction of spent coffee ground to improve its fuel properties. Fuel 2022, 318, 123643. [Google Scholar] [CrossRef]
  41. Parodi, E.; La Nasa, J.; Ribechini, E.; Petri, A.; Piccolo, O. Extraction of proteins and residual oil from flax (Linum usitatissimum), camelina (Camelina sativa), and sunflower (Helianthus annuus) oilseed press cakes. Biomass Convers. Biorefin. 2023, 13, 1915–1926. [Google Scholar] [CrossRef]
  42. Apaydın Varol, E.; Mutlu, Ü. TGA-FTIR Analysis of Biomass Samples Based on the Thermal Decomposition Behavior of Hemicellulose, Cellulose, and Lignin. Energies 2023, 16, 3674. [Google Scholar] [CrossRef]
  43. Kumar, P.; Subbarao, P.M.V.; Kala, L.D.; Vijay, V.K. Thermogravimetry and associated characteristics of pearl millet cob and eucalyptus biomass using differential thermal gravimetric analysis for thermochemical gasification. Therm. Sci. Eng. Prog. 2021, 26, 101104. [Google Scholar] [CrossRef]
  44. Chen, W.-H.; Kuo, P.-C. A study on torrefaction of various biomass materials and its impact on lignocellulosic structure simulated by a thermogravimetry. Energy 2010, 35, 2580–2586. [Google Scholar] [CrossRef]
  45. Zeng, J.; Singh, D.; Chen, S. Thermal decomposition kinetics of wheat straw treated by Phanerochaete chrysosporium. Int. Biodeterior. Biodegrad. 2011, 65, 410–414. [Google Scholar] [CrossRef]
  46. Tian, X.; Dai, L.; Wang, Y.; Zeng, Z.; Zhang, S.; Jiang, L.; Yang, X.; Yue, L.; Liu, Y.; Ruan, R. Influence of torrefaction pretreatment on corncobs: A study on fundamental characteristics, thermal behavior, and kinetic. Bioresour. Technol. 2020, 297, 122490. [Google Scholar] [CrossRef] [PubMed]
  47. Ru, B.; Wang, S.; Dai, G.; Zhang, L. Effect of Torrefaction on Biomass Physicochemical Characteristics and the Resulting Pyrolysis Behavior. Energy Fuels 2015, 29, 5865–5874. [Google Scholar] [CrossRef]
  48. Tapasvi, D.; Khalil, R.; Várhegyi, G.; Skreiberg, Ø.; Tran, K.-Q.; Grønli, M. Kinetic Behavior of Torrefied Biomass in an Oxidative Environment. Energy Fuels 2013, 27, 1050–1060. [Google Scholar] [CrossRef]
  49. Barzegar, R.; Yozgatligil, A.; Olgun, H.; Atimtay, A.T. TGA and kinetic study of different torrefaction conditions of wood biomass under air and oxy-fuel combustion atmospheres. J. Energy Inst. 2020, 93, 889–898. [Google Scholar] [CrossRef]
  50. Singara Veloo, K.; Lau, A.K.; Sokhansanj, S. Structural and molecular modifications of woody biomass under minimal torrefaction conditions toward making durable pellets. GSC Adv. Res. Rev. 2024, 20, 129–138. [Google Scholar] [CrossRef]
  51. Kopczyński, M.; Plis, A.; Zuwała, J. Thermogravimetric and Kinetic Analysis of Raw and Torrefied Biomass Combustion. Chem. Process Eng. 2015, 36, 209–223. [Google Scholar] [CrossRef]
  52. Ucar, S.; Ozkan, A.R. Characterization of products from the pyrolysis of rapeseed oil cake. Bioresour. Technol. 2008, 99, 8771–8776. [Google Scholar] [CrossRef]
  53. Meng, X.; Zhou, W.; Rokni, E.; Yang, X.; Levendis, Y.A. Evolution of Gases From the Pyrolysis of Raw and Torrefied Biomass and From the Oxy-Combustion of Their Bio-Chars. J. Energy Resour. Technol. 2021, 144, 021901. [Google Scholar] [CrossRef]
  54. Merdun, H.; Yıldırım, M. Pyrolysis and combustion of industrial hemp, coal and their blends for thermal analysis by thermogravimetric analysis/Fourier transform infrared spectrometer. Waste Manag. Res. 2025, 43, 192–206. [Google Scholar] [CrossRef]
  55. Chen, D.; Zhou, J.; Zhang, Q. Effects of Torrefaction on the Pyrolysis Behavior and Bio-Oil Properties of Rice Husk by Using TG-FTIR and Py-GC/MS. Energy Fuels 2014, 28, 5857–5863. [Google Scholar] [CrossRef]
  56. Parshetti, G.K.; Quek, A.; Betha, R.; Balasubramanian, R. TGA–FTIR investigation of co-combustion characteristics of blends of hydrothermally carbonized oil palm biomass (EFB) and coal. Fuel Process. Technol. 2014, 118, 228–234. [Google Scholar] [CrossRef]
  57. Singh, K.; Zondlo, J. Characterization of fuel properties for coal and torrefied biomass mixtures. J. Energy Inst. 2017, 90, 505–512. [Google Scholar] [CrossRef]
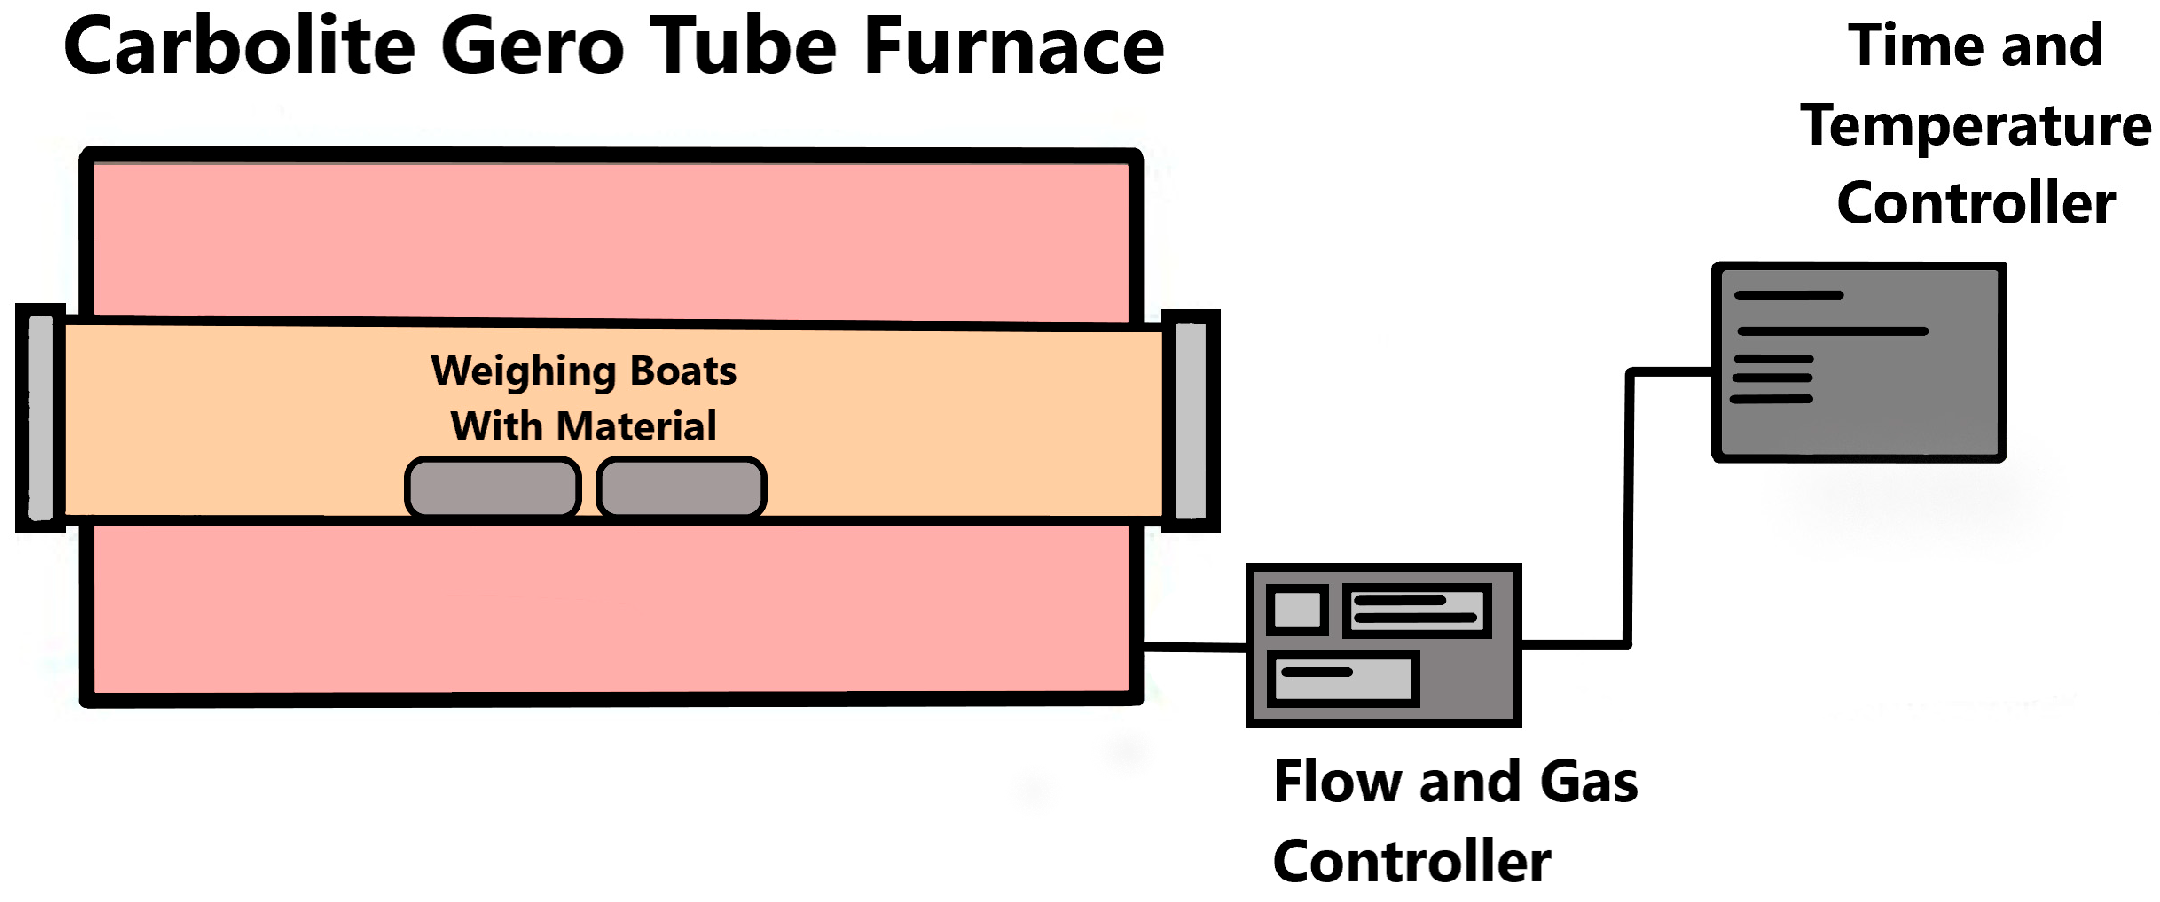
Figure 1. Schematic diagram of the torrefaction process.
Energies 18 04648 g001
Figure 2. MY (a), EY (b) and HHV (c) of four different types of biomasses (RP, RC, GS, AP) after torrefaction at temperatures 250, 350 and 450 °C.
Energies 18 04648 g002
Figure 3. The results of measurements of (a) ash content, (b) VM and (c) FC for the samples exposed to torrefaction process and untreated samples.
Energies 18 04648 g003
Figure 4. FTIR spectra for untreated biomass samples and samples treated by torrefaction at 250, 350 and 450 °C: (a) RP, (b) RC, (c) AP and (d) GS.
Energies 18 04648 g004
Figure 5. TG/DTG curves, recorded in N2 atmosphere (in the temperature range of 30–900 °C) for the untreated and torrefied samples: (a) RP, (b) RC, (c) AP and (d) GS.
Energies 18 04648 g005
Figure 6. TG/DTG curves recorded in O2 atmosphere in the temperature range of 30–900 °C for (a) untreated samples and (b) untreated and torrefied samples of RP.
Energies 18 04648 g006
Figure 7. TGA-FTIR spectra of the gaseous products released during pyrolysis of untreated and torrefied samples in N2 atmosphere: rosemary pomace (ad), rosemary cake (eh), apple pomace (il) and grape seeds (mp).
Energies 18 04648 g007
Figure 8. TGA-FTIR diagrams of the gaseous products released during the combustion of untreated biomass samples in the O2 atmosphere ((a)—RP; (b)—RC; (c)—AP; (d)—GS). Diagrams (eg) show the spectra of RP torrefied at temperatures of 250, 350 and 450 °C, respectively.
Energies 18 04648 g008
Table 1. Samples used in the experiments.
MaterialProcessOperating Temperature [°C]Operation Time
[min]
Sample Name
Rosemary pomaceRaw//RP
Torrefied25045T-RP-250
350T-RP-350
450T-RP-450
Rosemary cakeRaw//RC
Torrefied25045T-RC-250
350T-RC-350
450T-RC-450
Grape seedsRaw//GS
Torrefied25045T-GS-250
350T-GS-350
450T-GS-450
Apple pomaceRaw//AP
Torrefied25045T-AP-250
350T-AP-350
450T-AP-450
Table 2. The properties of the TG/DTG curves for untreated and torrefied samples (temperature range 30–900 °C, N2 atmosphere, heating rate 20 °C/min).
SampleTi
(°C)
Tmax
(°C)
Tb
(°C)
DTGmax (1/s)Weight Loss (wt.%)Residue (wt.%)
1st Step 2nd Step3rd StepTotal
RP266.6339.6547.40.001378.1761.6813.7383.5916.41
T-RP-250275.4346.5521.60.001512.0266.655.1973.8626.14
T-RP-350357.3431.5508.70.001234.0545.496.6456.1943.81
T-RP-450442.6491.1541.20.000436.3119.8512.3138.4761.53
RC346.0408.1514.30.002832.2193.313.2198.721.28
T-RC-250357.3428.6518.20.002820.4293.862.2796.553.45
T-RC-350379.2429.2512.90.003361.4085.624.4391.468.54
T-RC-450415.6459.0528.80.002453.1962.728.7274.6325.37
AP290.8351.2499.20.002303.2171.934.4379.5820.42
T-AP-250303.1341.4669.90.002692.1972.5211.0385.7414.26
T-AP-350375.8432.5635.00.000832.2840.926.7649.9650.04
T-AP-450448.6518.5610.70.000265.0319.536.2330.7969.21
GS312.4415.4521.20.0011510.6661.523.3475.5324.47
T-GS-250308.9371.6539.50.001293.6160.363.2067.1632.84
T-GS-350375.8431.1600.60.001162.7445.085.5153.3346.67
T-GS-450430.1508.4633.70.000365.6628.334.2038.1961.81
Table 3. The properties of the TG/DTG curves recorded in an O2 atmosphere for untreated and torrefied samples (temperature range 30–900 °C, heating rate 20 °C/min).
SampleTi
(°C)
Tmax (°C)Tb
(°C)
DTGmax
(1/s)
Weight Loss (wt.%)Residue (%)
1st Step 2nd Step3rd StepTotal
RP256.5312.1386.90.007708.1384.011.6093.746.26
T-RP-250264.0436.0487.10.006276.1685.312.9994.465.54
T-RP-350268.5277.7380.30.007265.5877.107.3390.019.99
T-RP-450260.8265.8385.80.004177.8167.3110.0985.2114.79
RC300.7588.4664.40.0049810.5383.294.6998.511.49
AP282.1300.9402.00.008609.9088.360.2798.531.47
GS265.6472.8529.70.0025711.2483.632.7497.612.39
Disclaimer/Publisher’s Note: The statements, opinions and data contained in all publications are solely those of the individual author(s) and contributor(s) and not of MDPI and/or the editor(s). MDPI and/or the editor(s) disclaim responsibility for any injury to people or property resulting from any ideas, methods, instructions or products referred to in the content.