1. Introduction
The issue of sustainable development and the pursuit of complete decarbonization of industry and the economy over the next few decades is also directly related to transportation. Transport, especially road transport, is characterized by significant environmental pressures, causing numerous damaging environmental impacts. However, given the essential functions transport serves in meeting society’s transportation needs, decarbonization processes in transport must be conducted considering transitional conditions related to the operation of various vehicles and the transformation of multiple sectors, including the energy sector, in individual European Union (EU) countries [
1]. The natural environment is endangered by pollution introduced directly to one of its three basic elements, i.e., the atmosphere, surface water or soil. Transport activity is mainly associated with primary pollutant emissions caused by electricity production or burning conventional fuels and generation of pollutants related to any consumables and components worn during the use of transport means, i.e., the so-called secondary emission. Despite many measures taken over the last nearly 30 years, the EU transport sector’s air pollutant emissions are increasing [
2]. Sustainability strategies, ESG criteria, and reporting obligations on the carbon footprint of companies currently being implemented in the EU should help to reduce air pollution. Nevertheless, the increasing energy needs of society will probably result in an increase in transport needs, which may neutralize, among others, the actual EU initiatives and legislative efforts aimed at achieving the environmental neutrality of transport in the 2050 perspective [
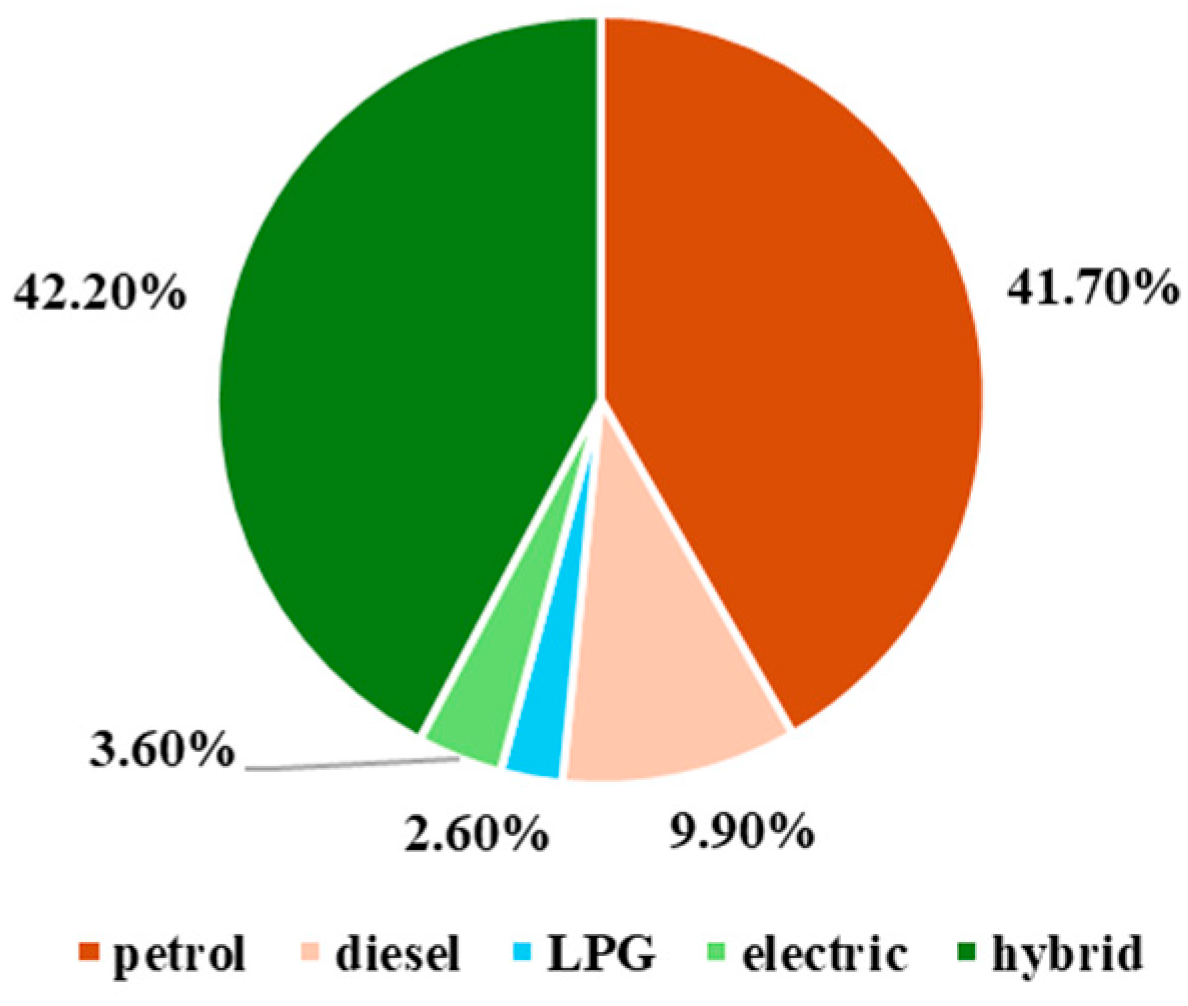
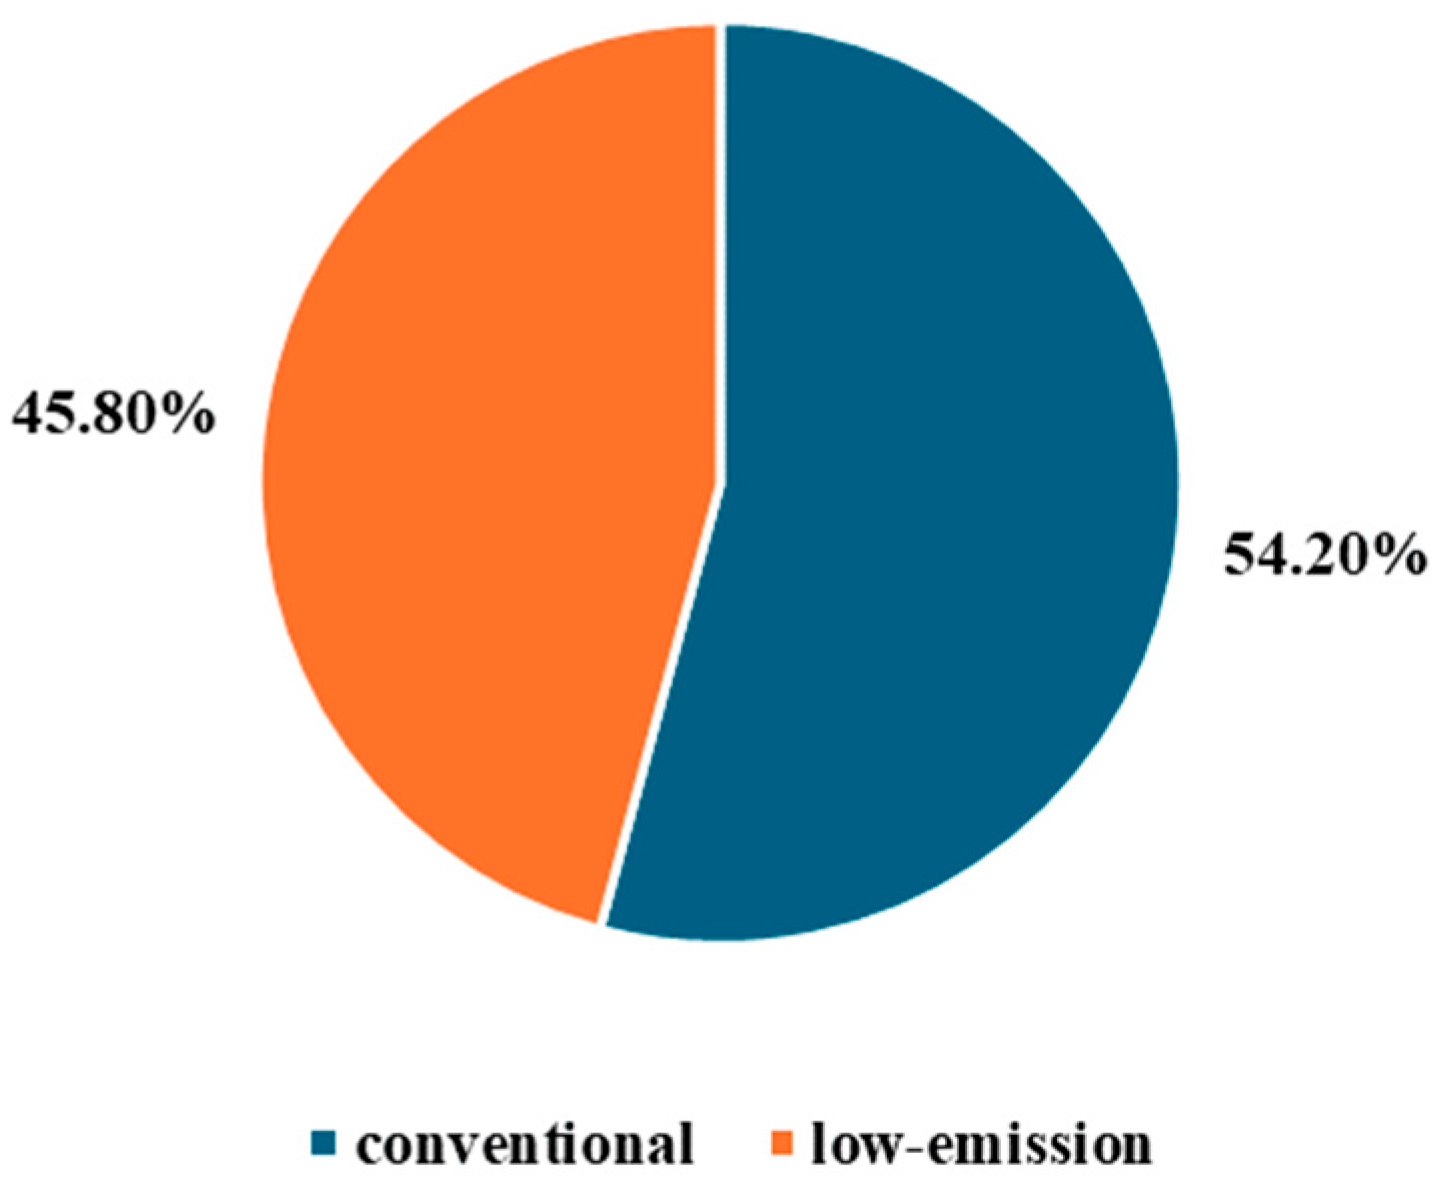
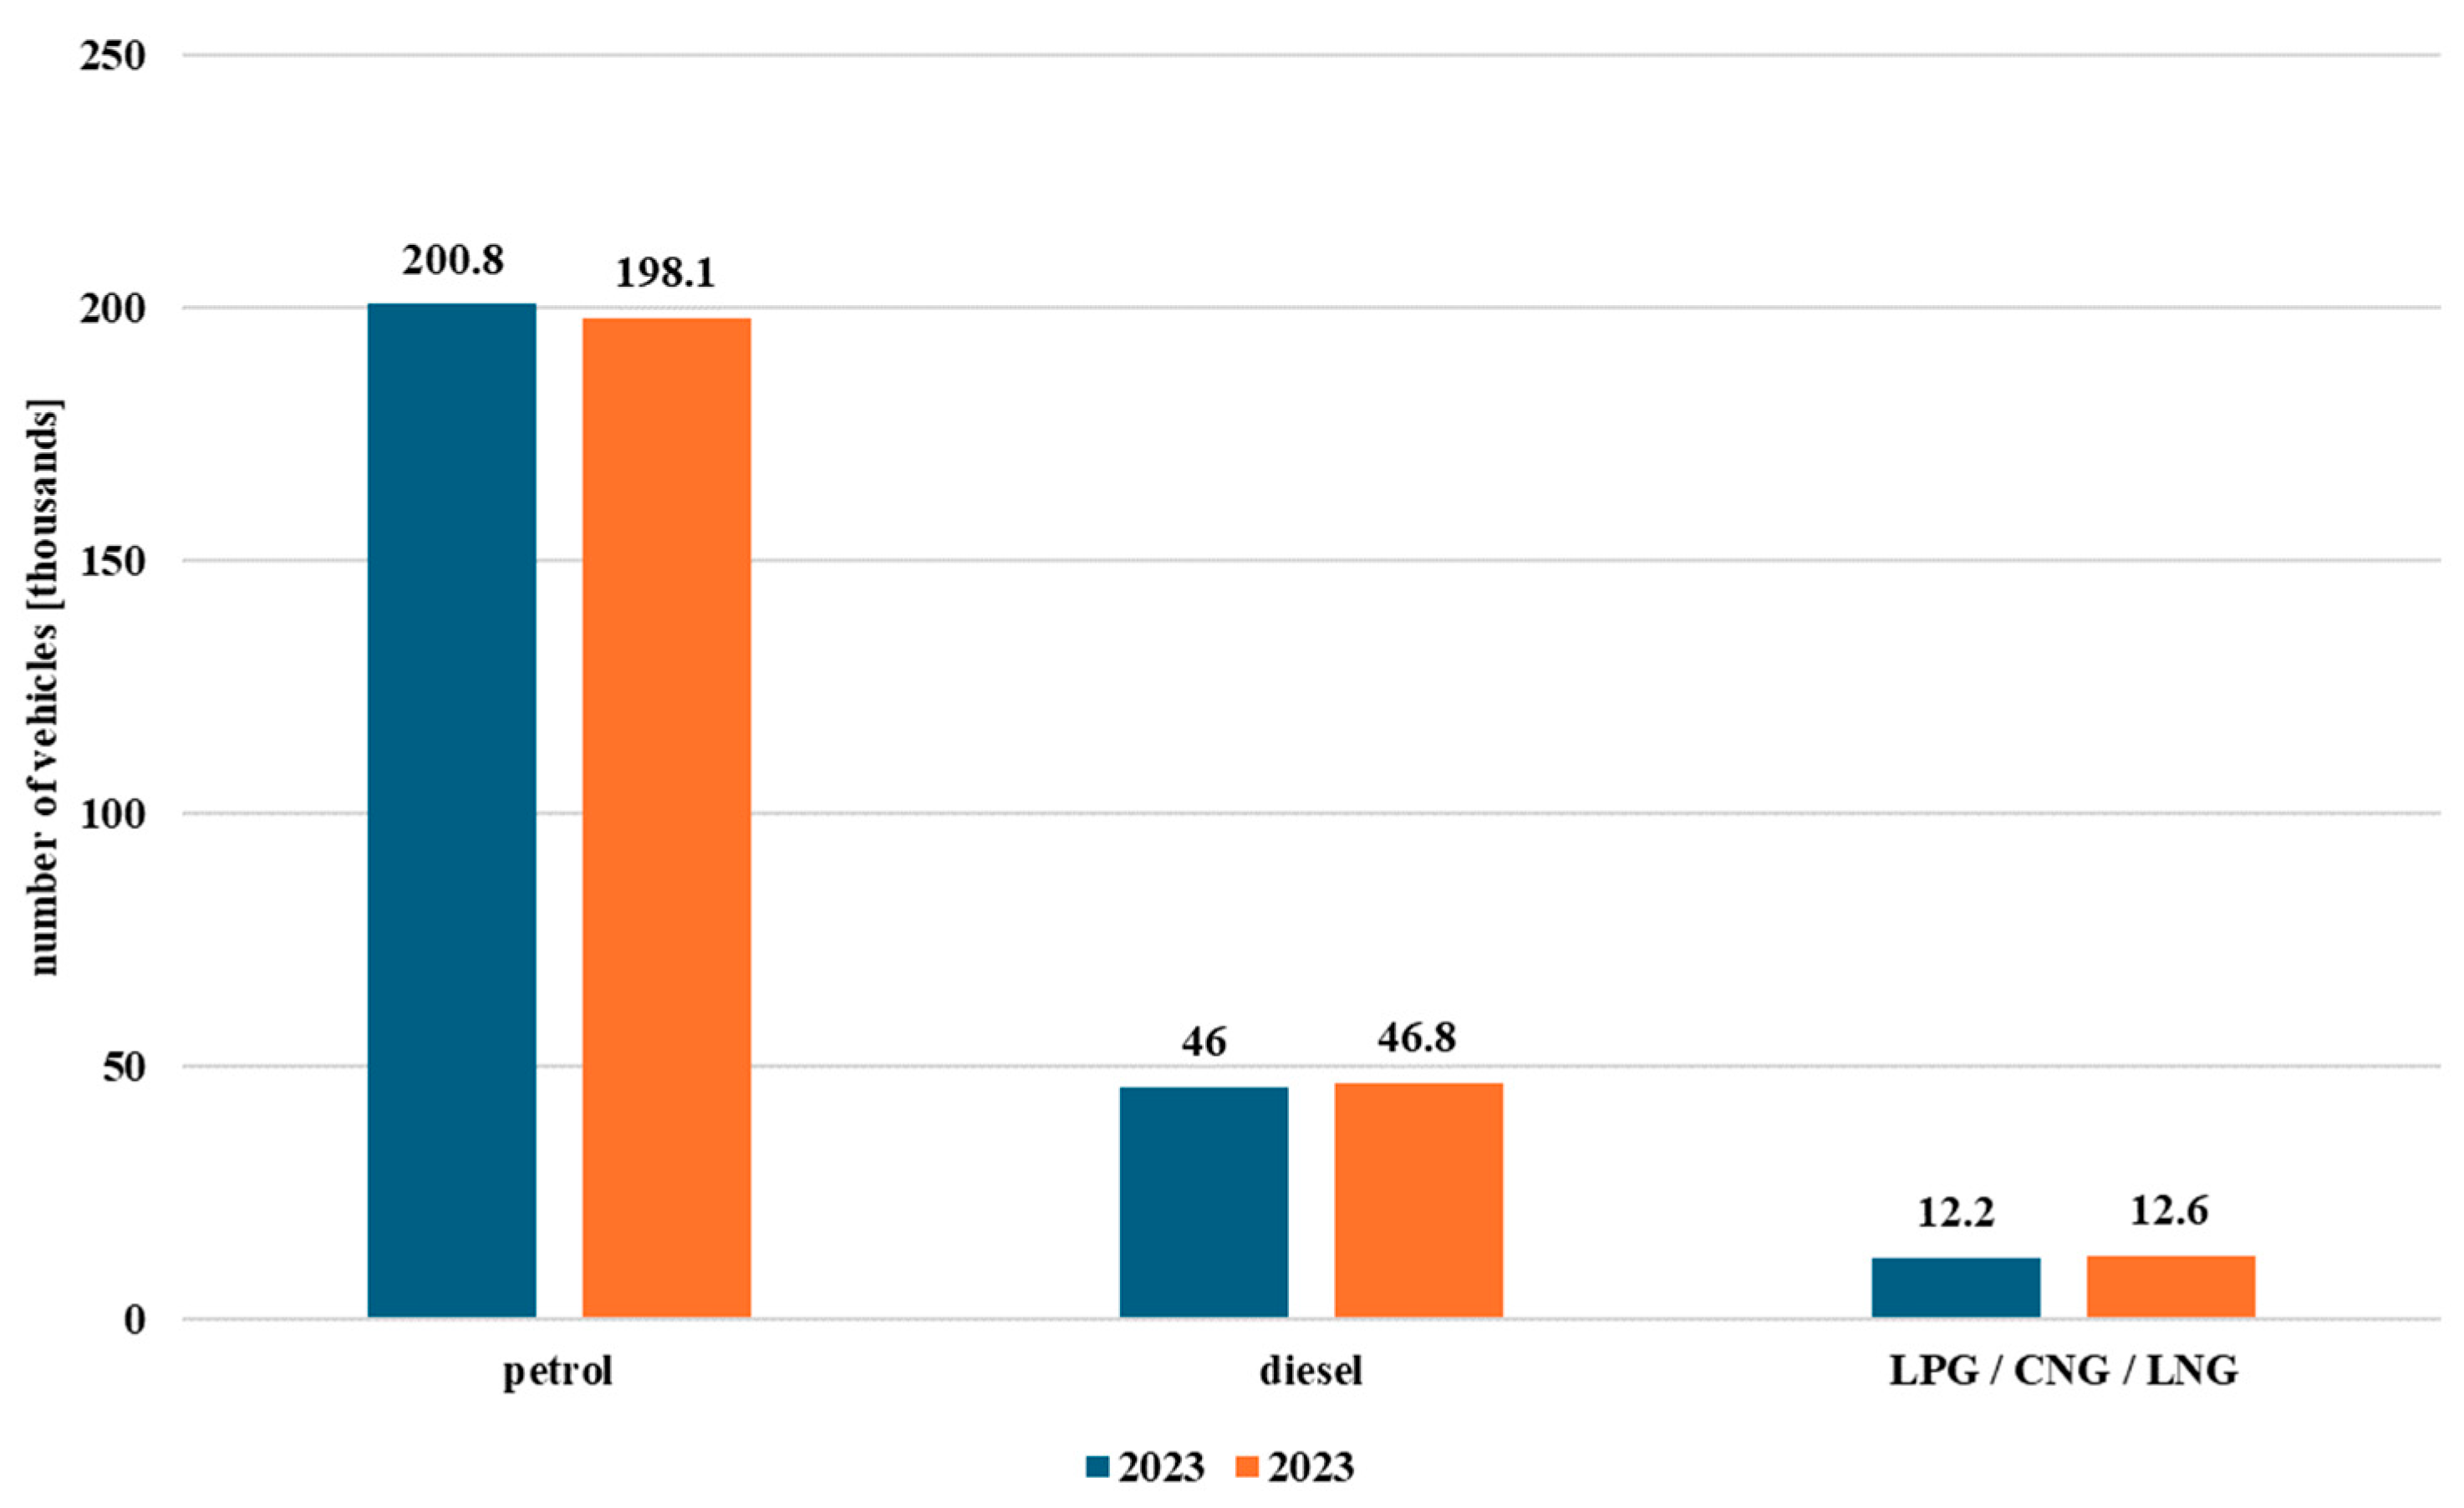
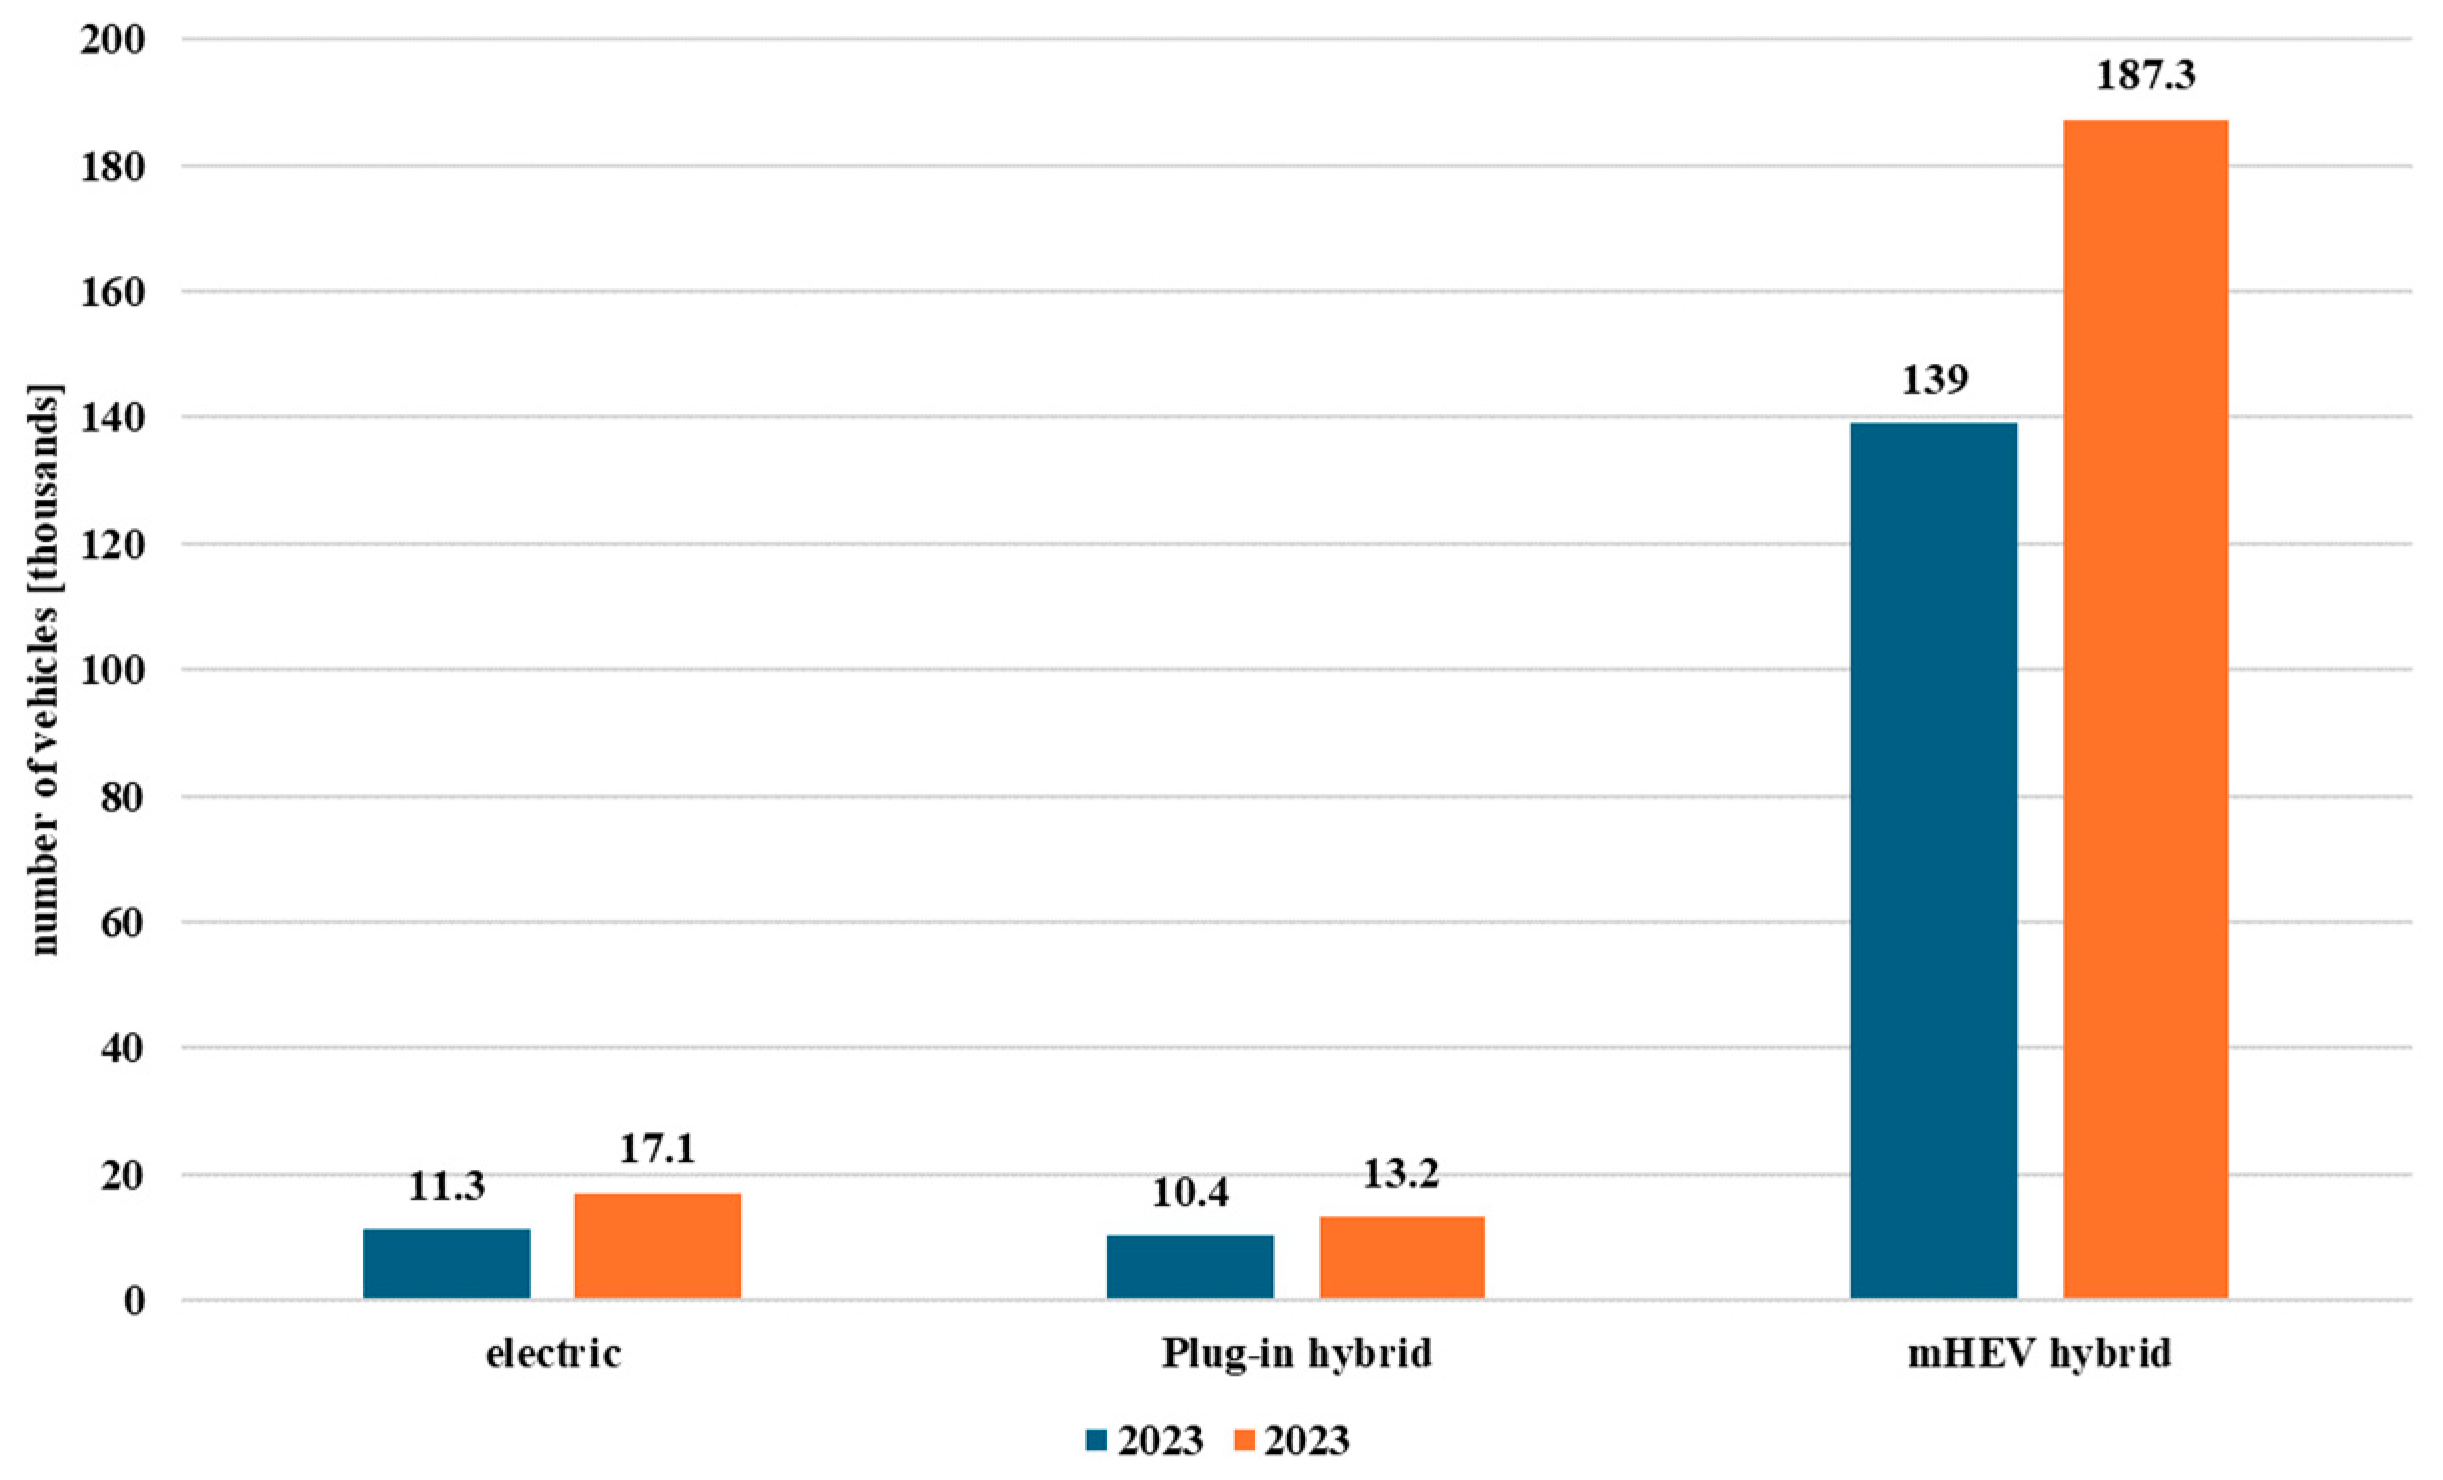
3]. However, the analysis of air pollutant emissions from various types of vehicles may contribute to the identification of vehicle types that have less impact on the environment in terms of emissions, taking into account factors related to the electricity production sources in Poland. Modern hybrid vehicles, as well as electric vehicles, can make a significant contribution to reducing emissions in the transport sector. However, it should be borne in mind that more than 54% of vehicles in Poland in 2023 were motor vehicles, powered by conventional fuels, i.e., petrol, diesel or gas, as shown in
Figure 1 and
Figure 2.
Nearly 46% of vehicles in Poland in 2023 were hybrid and electric vehicles. However, if only electric passenger vehicles are taken into consideration, their share of the Polish market in 2023 was just 3.6%. In absolute terms, the share of electric vehicles in the vehicle market in Poland is small, but the increase in the number of zero or low-emission vehicles is noticeable. This study provides a comprehensive comparison of electric, hybrid, and conventional vehicle emissions and whether electric vehicles contribute to reducing greenhouse gas emissions. The research methodology uses on-road emission tests and statistical data to calculate emissions for electric vehicles. The analysis referred to the published Polish and international literature on the environmental impact of transportation, particularly on greenhouse gas emissions.
2. State of the Art from the Polish Perspective
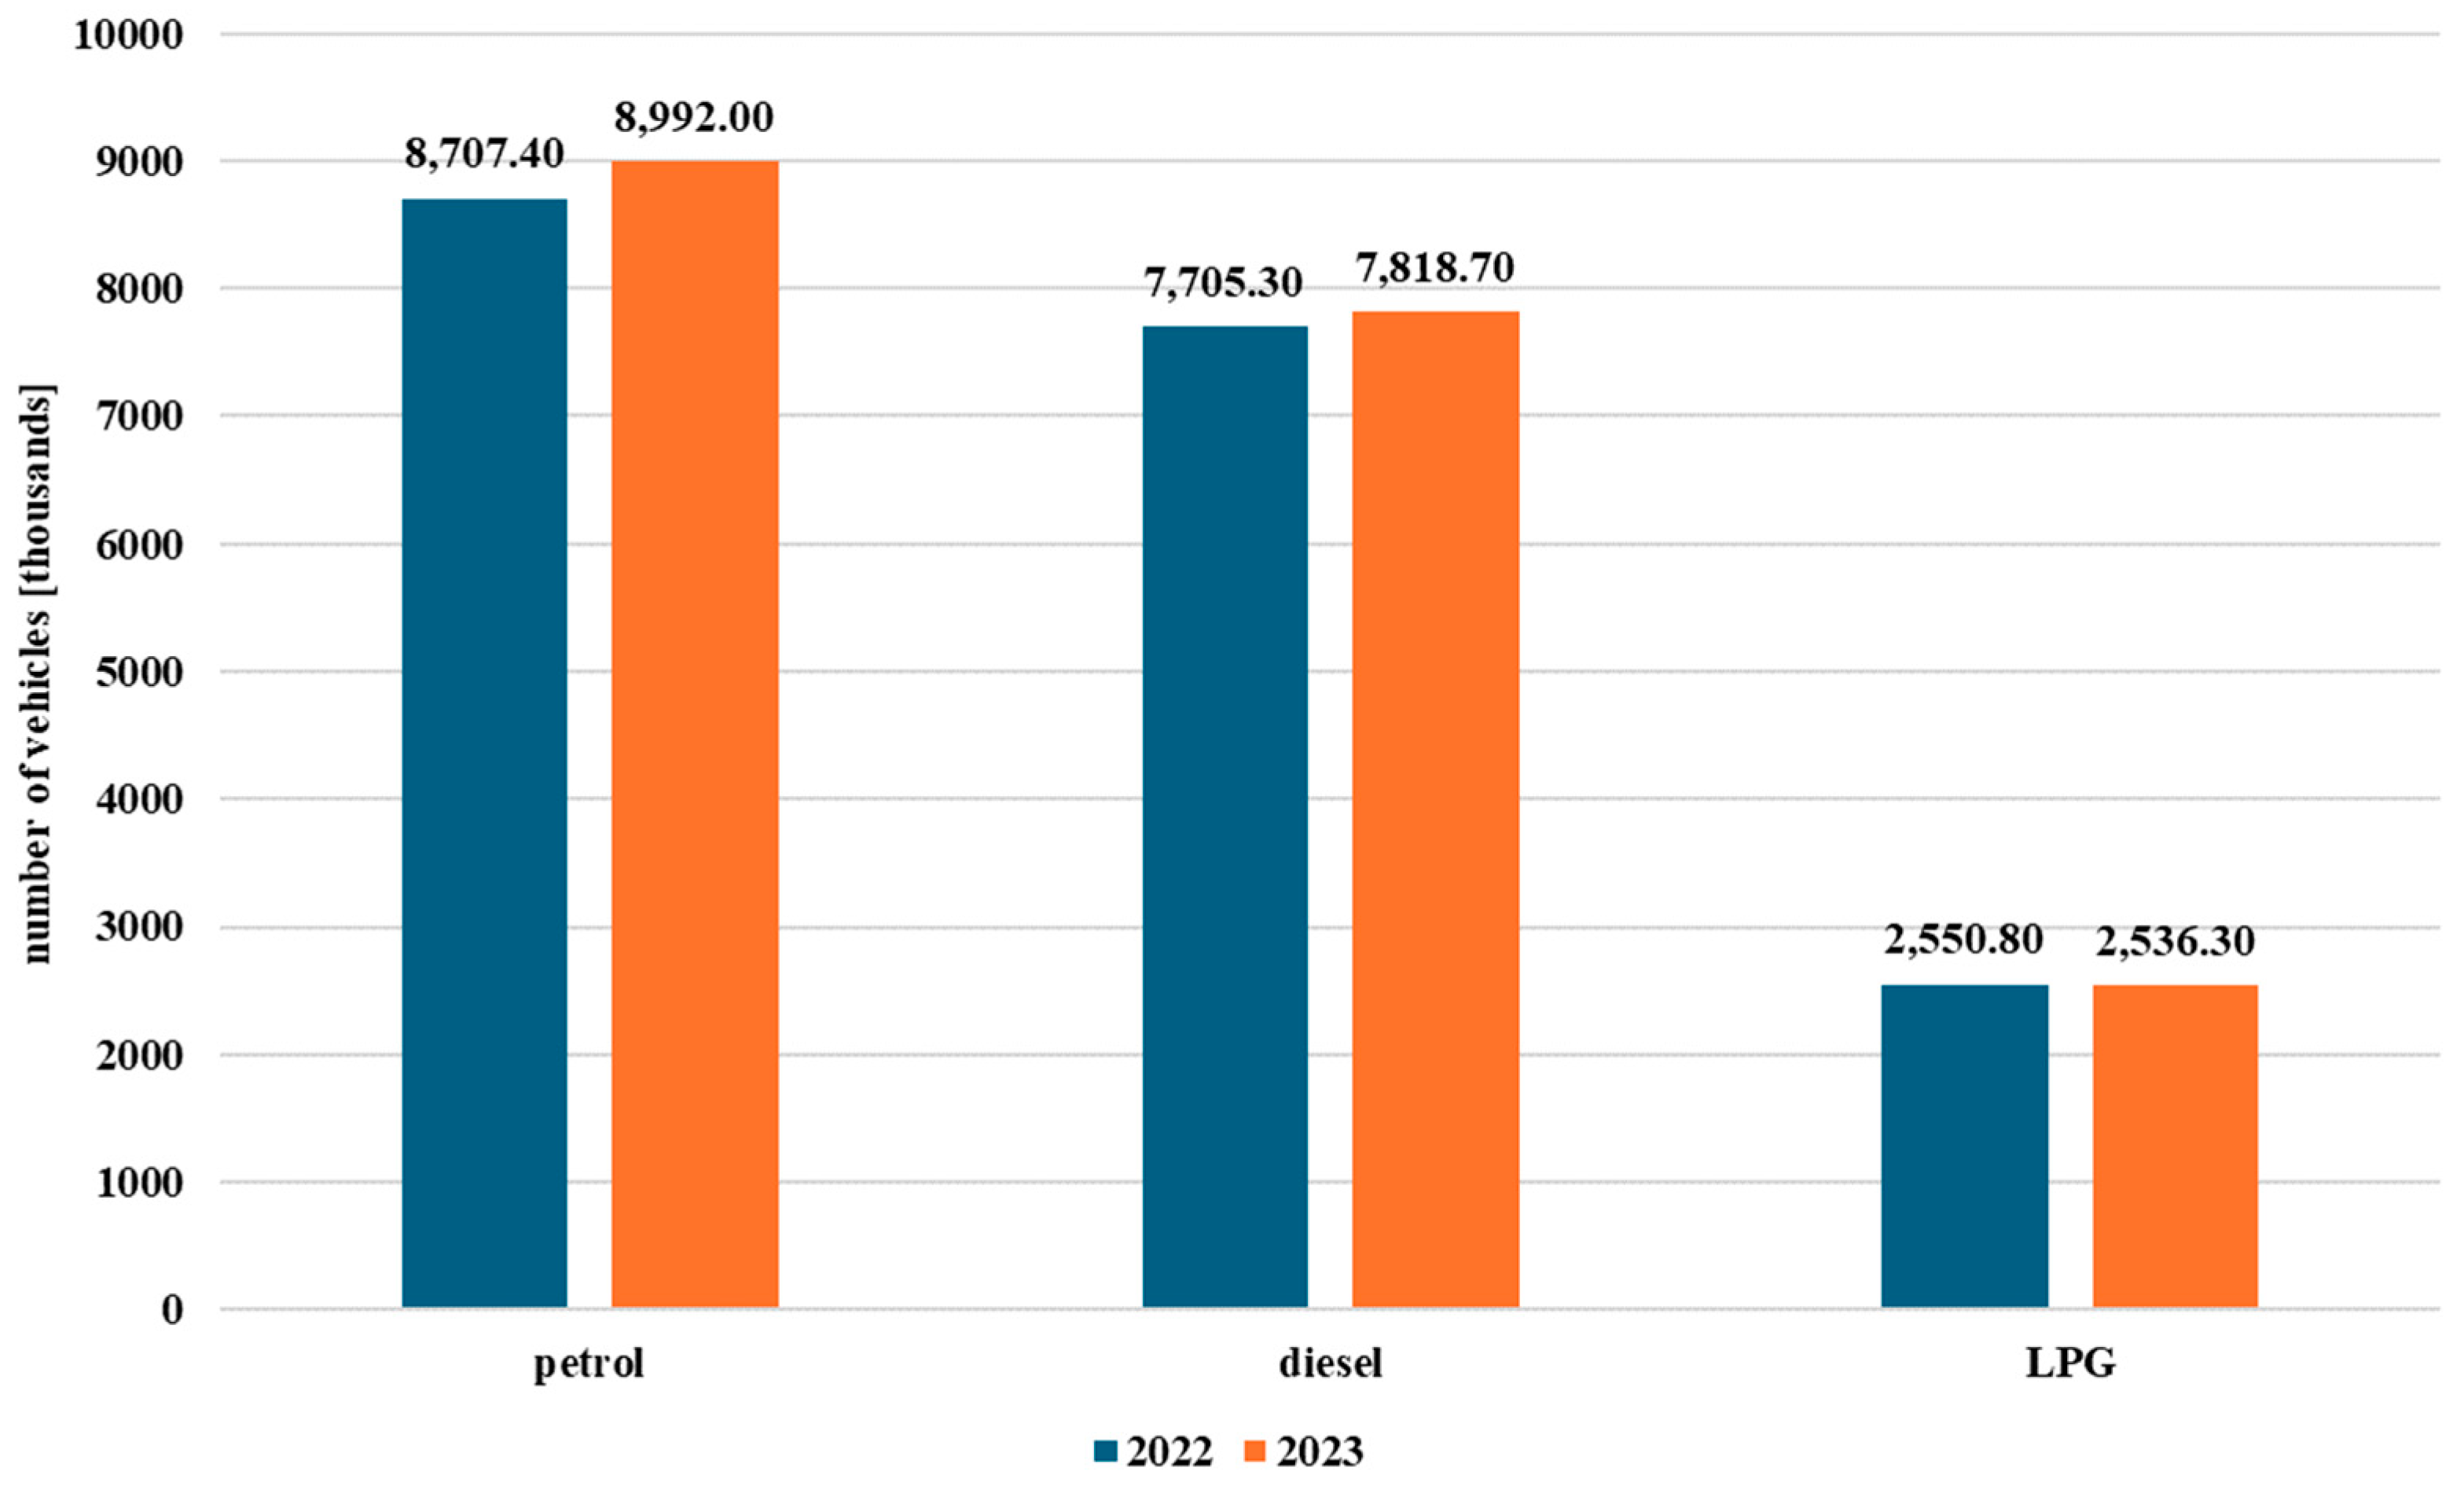
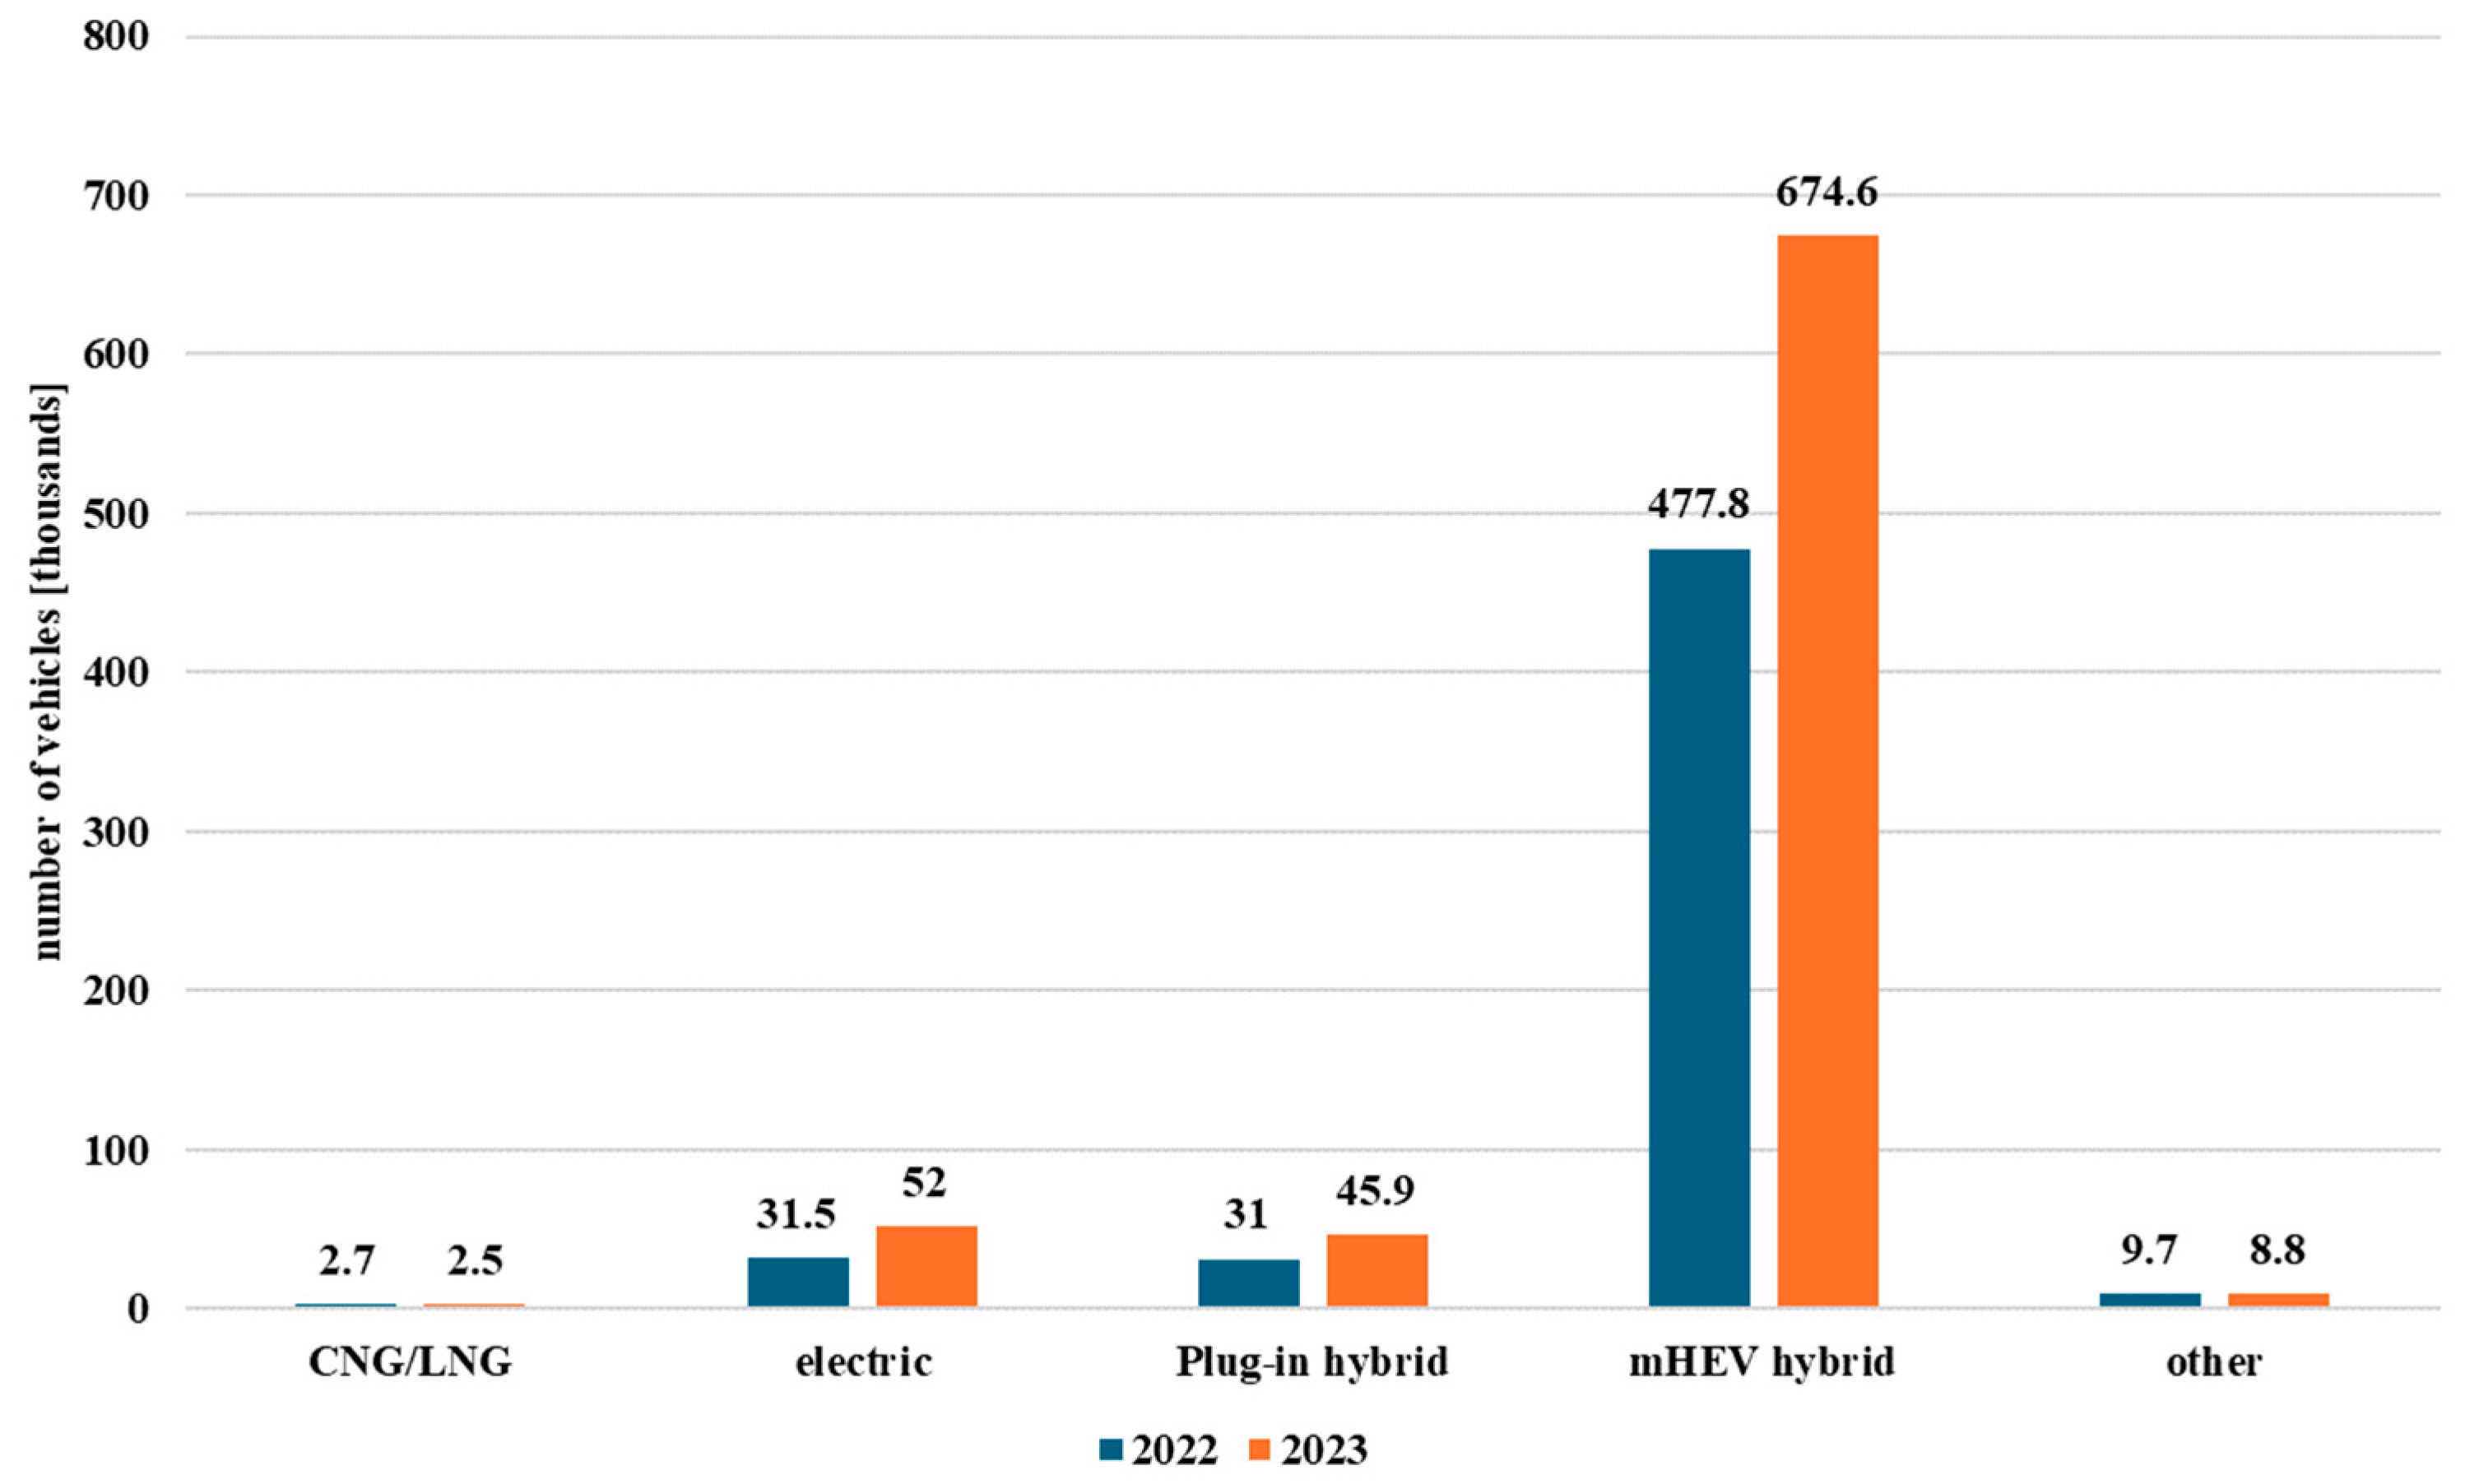
The number of PHEV (Plug-in Hybrid Electric Vehicle) and mHEV (Mild Hybrid Electric Vehicle) hybrids increased in 2023 relative to 2022 by 26% and 34.7%, respectively. The number of all-electric vehicles in 2023 increased by 51% from 2022 [
4]. The decrease in the number of passenger vehicles in 2023 only occurred for petrol-powered vehicles. It should be pointed out that despite the growing interest in low-emission vehicles in Poland, their share in the vehicle population is low, and the average age of a vehicle in Poland is over 15 years. The consequences of maintaining an old car fleet are not only borne by the car owners in the form of higher costs of, for example, technical repairs, but also by society. Old cars are less safe and less environmentally friendly. It seems that eliminating the use of old vehicles especially in urban areas can significantly reduce air pollution. It also seems important to promote innovation and develop the transition to a more sustainable transport system. Nevertheless, the reality of the car market in Poland indicates that imports of second-hand vehicles from Western European countries and the USA are not decreasing. The emissions problem will therefore persist, despite plans to eliminate vehicles running on conventional fuels as early as the next decade. Petrol and diesel-powered vehicles are still dominant in Poland. This situation is not improved by the above-mentioned import of second-hand vehicles with significant mileage and technical defects. The statements mentioned above are visually presented in
Figure 3,
Figure 4,
Figure 5 and
Figure 6.
For many years, electricity in Poland has been generated in coal-fired power plants. Poland’s primary energy sources are fossil fuels, particularly hard coal and lignite. However, between 2014 and 2024, the share of fossil fuels in electricity production in Poland declined by over 20%. This decline was driven by the transformation of the energy market and the development of renewable energy sources. Renewable sources in Poland accounted for nearly 40% at the end of 2024, but the share of fossil fuels remains as high as 60% due to the lack of nuclear power. The share of fossil fuels in Poland’s energy mix is twice as high as European Union statistics. The share of renewable sources in electricity production in Poland was close to the EU average at around 40%. Analyzing the structure of chemical compounds emitted into the atmosphere during the production of electricity for end-users, it should be noted that the rate of CO2 emissions in the last decade in Poland has decreased by almost 27%. The ongoing transformation of the energy sector in Poland and the installation of modern exhaust gas cleaning systems have resulted in a reduction of sulfur oxides by nearly 77% and nitrogen oxides by almost 63% over the past decade. The smallest decrease in air pollution from electricity generation in Poland was observed for carbon monoxide. In the last decade, a reduction of sulfur oxides by nearly 5% was recorded. Implementing modern and more efficient technologies in Polish power plants has made the last decade a breakthrough in Poland in reducing pollution generated during electricity generation. The next decade, with the development of nuclear power in Poland, will be equally groundbreaking. These reductions will be even greater if plans to build a nuclear power plant in Poland over the next decade are realized and if the restructuring process of Poland’s coal and lignite mines is completed.
The popularization of hybrid and electric vehicles, along with the modernization of the energy sector in Poland, is a key element in the decarbonization of the Polish economy. Notably, nearly 60% of new vehicles registered in Poland in 2025 were vehicles with alternative power sources, especially hybrid and electric vehicles. Sustainable transport development will contribute to the generation of less air pollution in the long term. European businesses will gradually report sustainable social, environmental, and corporate development [
5]. The specified reporting obligations regarding compliance with sustainable development conditions, including those of transport companies, will raise public ecological awareness regarding their carbon footprint [
6]. Transport processes are currently modeled considering current environmental goals and are primarily focused on producing more ecological vehicles that generate increasingly less air pollution. Issues related to sustainable transport systems, the development of electromobility [
7], risk analyses for the development of low-carbon transport in urban areas [
8], supply markets [
9], and optimalization of operational by conventional vehicles [
10], also from fleet management point of view [
11], are widely published in the literature. Nowadays, concerning the use of much greener vehicles, strategies are being formulated to reduce emissions in urban areas. There are more popular solutions to improve the operation of electric vehicles and range [
12] and studies in the field of air pollutant emission measurements of conventional, hybrid, and electric vehicles based on Real Drive Emissions (RDEs) procedures [
13,
14,
15]. EU environmental initiatives, i.e., Fit for 55, dedicated to the development of sustainable transport and energy solutions are leading to a re-evaluation of low-, zero-emission, and conventional transport means, and their impact on the environment. In this context, the replacement of conventional vehicles with hydrogen-powered [
16] and electric vehicles [
17] is a rather promising alternative. On the other hand, when analyzing transport’s environmental impact from an urban development perspective, it is important to be able to assess and model future urban development and its impact on traffic emissions and air pollution levels [
18]. Promoting less carbon-intensive transport means and sustainable patterns of resident behavior, especially in urban areas, can enable the implementation of a long-term, sustainability-oriented vision for transport and a simultaneous vision for climate change mitigation [
19]. Decision-making processes regarding transport organization, including the selection of means of transport for specific tasks, should be carried out with exhaust emissions in mind. However, this will not be possible without accurately estimating and assessing vehicle air pollutant emissions. However, measuring actual vehicle air pollutant emissions is difficult to achieve on a larger scale. There are many methods [
20] used to estimate air pollutant emissions. Numerous models are available to determine the carbon footprint of transport means [
21,
22] and to assess the impact of transport on the environment and urban areas, but these usually apply to the macro level.
However, there is a lack of micro-analytical methods to approximate the unit emissions of air pollutants generated by individual electric vehicles, which would allow a more precise comparison of emissions generated by conventional and low-emission vehicles. For this reason, issues related to the analysis of air pollutant emissions of transport vehicles, taking into account different passenger vehicle fuel types and propulsion technologies, are still relevant. The study of air pollutant emissions is one element in the process of decarbonizing transport. Air pollutant emissions tests using the RDEs method provide real results and enable the formulation of conclusions to assess the impact of vehicles on the environment. This is all the more important as air pollutant emissions in transport are increasing, compared to other sectors of the economy [
23]. When evaluating a vehicle’s CO
2 emissions, it is crucial to consider the CO
2 emitted during driving and emissions associated with manufacturing, maintenance (including repairs, replacing essential components, tire wear), and disposal. Producing and disposing of electric vehicles is less environmentally friendly than traditional internal combustion engine vehicles, and emissions from electric vehicles depend on how the electricity is generated. However, given Europe’s average energy mix, electric vehicles tend to be cleaner than vehicles powered by conventional fuels. In terms of renewable energy sources, Poland’s energy mix is around 40%, close to the European Union average. Significant efforts in nuclear power production could help reduce Poland’s reliance on coal-based electricity, which is currently nearly 60%, bringing it closer to the EU average of 30%. The increasing interest in renewable energy sources in Poland is notable. Therefore, in the long term, the environmental impact of electric vehicles is expected to be lower than that of conventional vehicles. As the proportion of renewable energy increases in Poland and the European Union, electric cars are expected to become even more environmentally friendly, especially with the EU’s plans to enhance the monitoring of batteries and reduce their negative environmental impact. The alternative solutions based on hydrogen also deserve attention. With regard to the Polish market, electromobility and electric vehicles, as well as the energy market transformation, seem to be a good direction for the reduction of air pollutant emissions and the development of environmentally friendly investments in transport. The above is also important in view of the significant number of passenger vehicles in Poland, which are imported in large numbers from Western Europe.
Electromobility seems to be a good alternative to this type of phenomenon, also in terms of technical facilities for low-emission vehicles. Poland is at the forefront of battery production in the context of electromobility development and its facilities. However, from 2025 onwards, every battery will be certified with a marked carbon footprint. The carbon footprint will therefore be calculated based on countries’ energy mixes, rather than the individual energy sources used by factories to produce components. With this in mind, it is important that Poland’s energy mix becomes similar to that of the EU over the next decade. Soon, decarbonization issues will gain momentum, partly due to the European Union’s legal framework, including the Green Deal. New technological trends related to the modernization of the energy sector in Poland, such as a gradual shift away from fossil fuels towards nuclear energy and renewable energy, will create favorable conditions for the development of sustainable transport over the next decade, which is also confirmed by statements presented in publications [
12,
16,
17].
3. Research Problem and Methodology
The research problem is to compare air pollutant emissions generated by different vehicle types in terms of changes in Poland’s energy mix between 2014 and 2023. Poland has a similar energy mix to other European countries, like Italy. However, due to data availability, this article analyzes data from the National Centre for Emissions Management [
24]. A comparative study for various European countries will be done in a subsequent publication. The research question identified in this paper is to confirm the lower emission impact of electric and hybrid vehicles from the point of view of sources of electricity production in Poland. To confirm this thesis, on-road air pollutant emissions tests were carried out for hybrid and conventional vehicles, and electric vehicle emissions were determined from statistical data. The changing structure of the resources required for electricity production in the last decade in Poland has an impact on the environmental impact of transport means and the appropriate choice of means for transport tasks. Air pollutant emissions of electric vehicles are equated with the emissions generated during electricity production in Poland. The emissions of electric vehicles are therefore dependent on the emission factors monitored by KOBIZE [
24]. Emission factors for electricity end-users are presented in
Table 1. The indicators in
Table 1, W1, W2, and W3, correspond to CO
2, NO
X, and CO emissions monitored by KOBIZE. The values of the indicators monitored by KOBIZE in
Table 1 determine the annual value of emissions of particular types of pollutants generated in Poland during electricity production. The indicators are based on annual reporting by electricity-producing institutions in Poland to KOBIZE.
As mentioned above, air pollutant emissions (CO
2, SO
2, NOX, CO) from electricity production in Poland have decreased significantly in recent years. This makes the operation of electric vehicles, especially in urban areas, less carbon-intensive. Air pollutants emitted by electric vehicles during operation are directly related to the pollutants generated during electricity generation. Electric vehicles’ power consumption is linked to the air pollutant emissions generated during electricity generation. This assumption is considered in the analytical method for determining air pollutant emissions generated by electric vehicles, based on indicators [
24]. The analytical method determines air pollutant emissions from electric vehicles, taking into account the changing structure of Poland’s energy mix. The calculation of air pollutant emissions using the proposed analytical method for electric vehicles is based on the following equations.
where the individual symbols stand for specific air pollutant emissions, i.e.,
ECO2—
CO2 emissions generated by the
k-th vehicle type in the
i-th year of evaluation;
ENOx—
NOx emissions generated by the
k-th vehicle type in the
i-th year of evaluation;
ECO—CO emissions generated by the
k-th vehicle type in the
i-th year of evaluation;
W1,i—CO
2 emissions from
Table 1 for the
k-th vehicle type and
i-th year of evaluation;
W2,i—
NOX emissions from
Table 1 for
k-th vehicle type and
i-th year of evaluation;
W3,i—CO emissions from
Table 1 for
k-th vehicle type and
i-th year of evaluation;
ET,i—total pollutant emissions generated by the
k-th vehicle type in the
i-th year of evaluation;
Pk—energy consumption of the
k-th electric vehicle type [kWh/km].
Air pollutant emissions from electric vehicles can be determined using the above method for both current and archived data relating to emission indicators for specific air pollutants. KOBIZE publishes current data at annual intervals. The current KOBIZE indicator values are from 2024 [
24,
25]. The research work involved an analysis of the air pollutant emissions of one electric vehicle, one hybrid vehicle, and two conventional vehicles. The test method used in this study in relation to hybrid and conventional vehicles comprised measuring actual RDEs (Real Driving Emissions) using test equipment, i.e., a SEMTECH DS exhaust gas analyzer. The test equipment’s technical specification is shown in
Table 2.
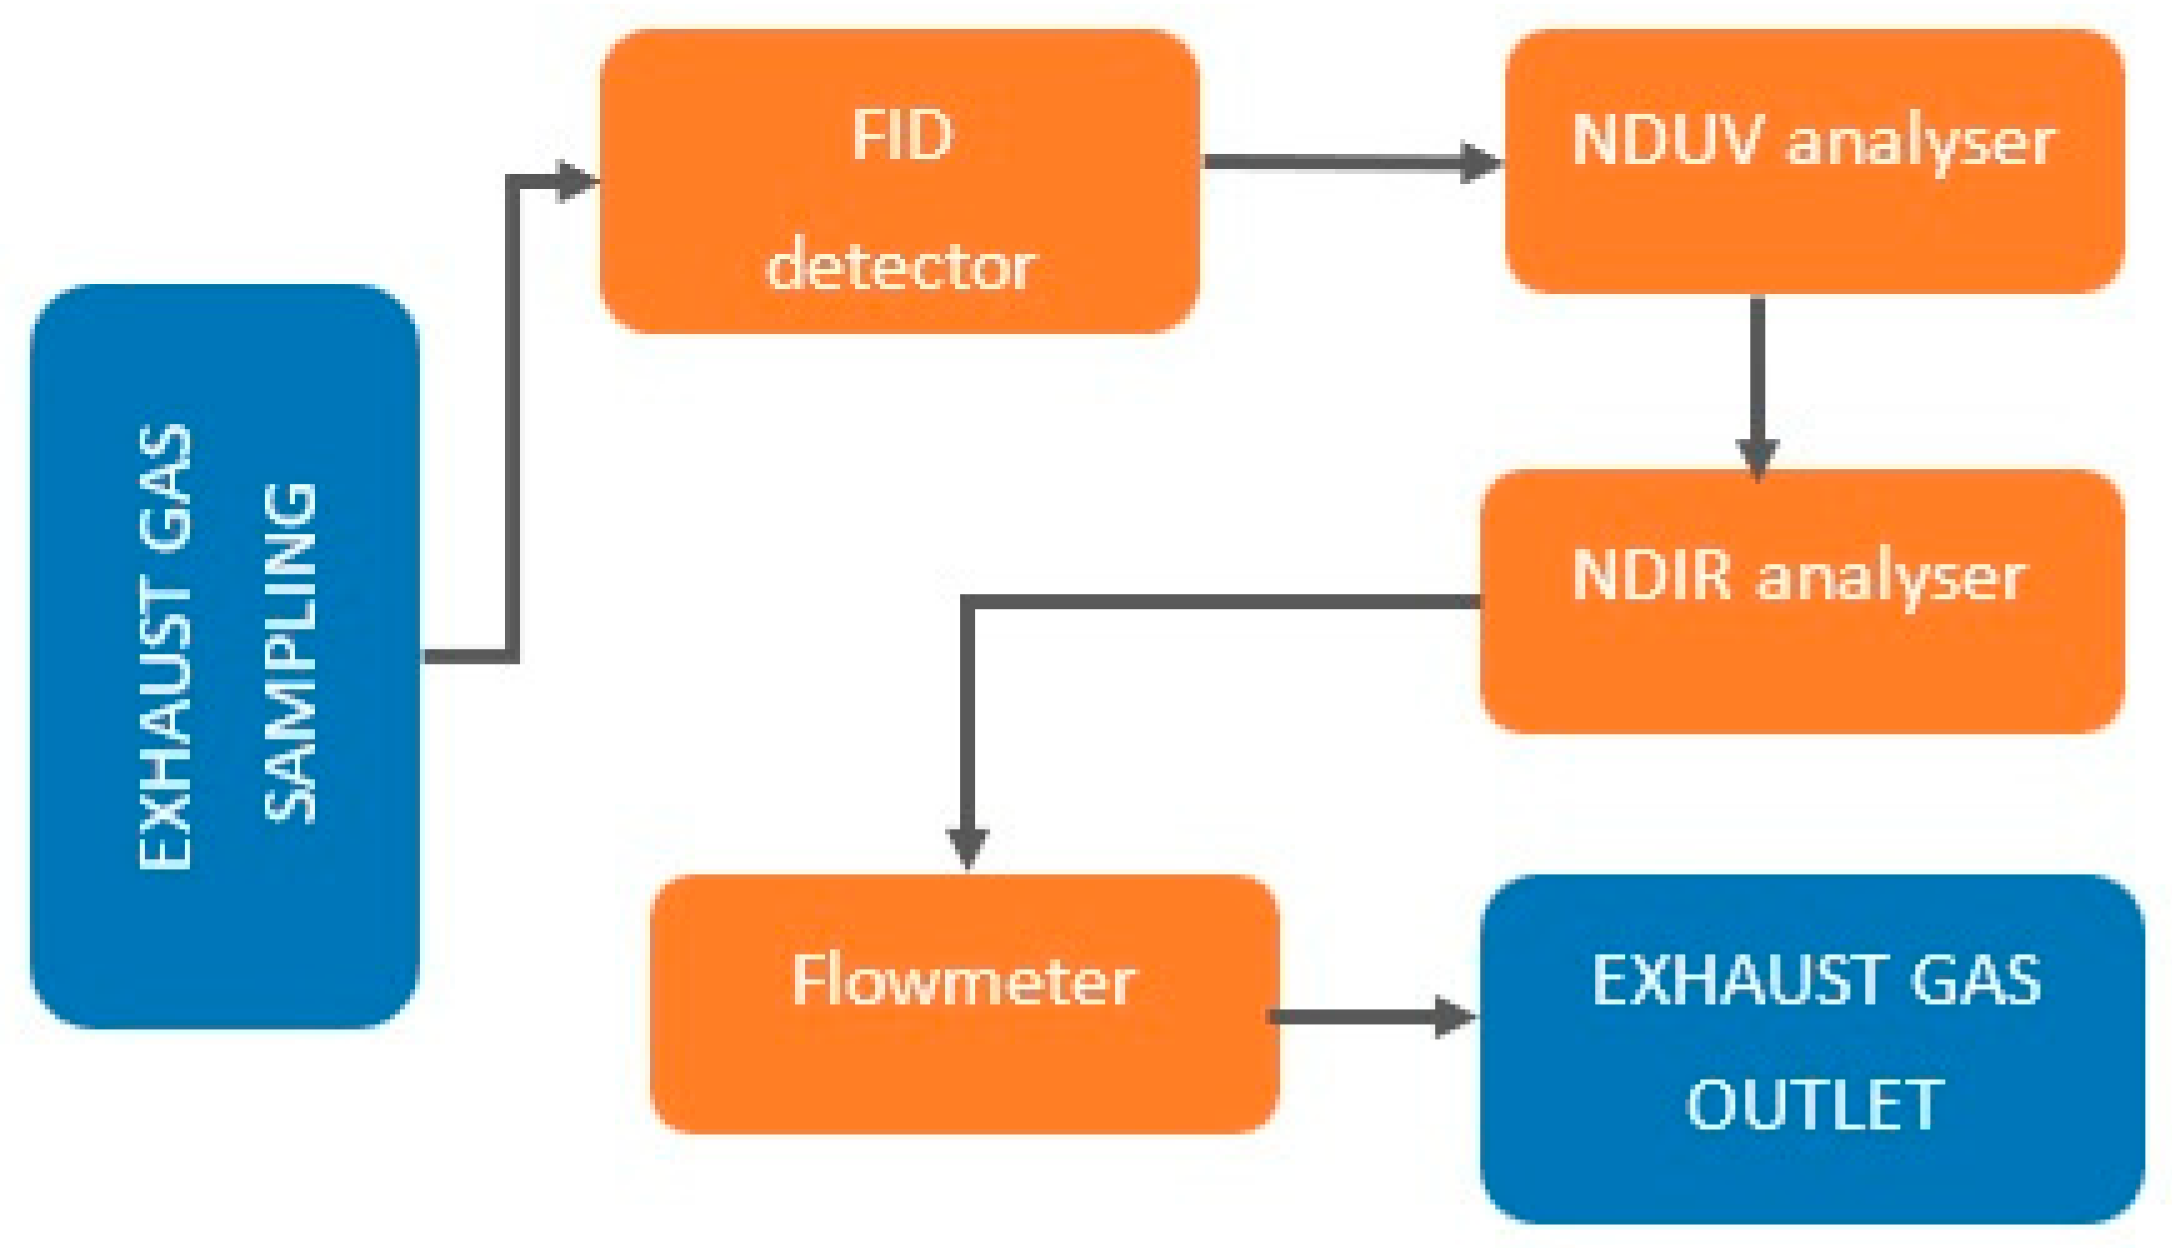
RDEs exhaust emissions tests using the SEMTECH DS analyzer (Sensors Inc., Saline, MI, USA) were conducted in the early morning hours, adhering to all technical requirements for the RDE procedure. The test vehicles began the tests with cold engines. The test equipment assembly, which took approximately two hours, was conducted with the engine turned off. Vehicle test runs lasted a maximum of two hours, and disassembling the test equipment after the test took an additional hour. With this in mind, the RDEs tests of the analyzed vehicles lasted two days. This study analyzed compounds in exhaust gases during vehicle operation in urban, rural, and highway conditions. A diagram of the measurement method used is shown in
Figure 7.
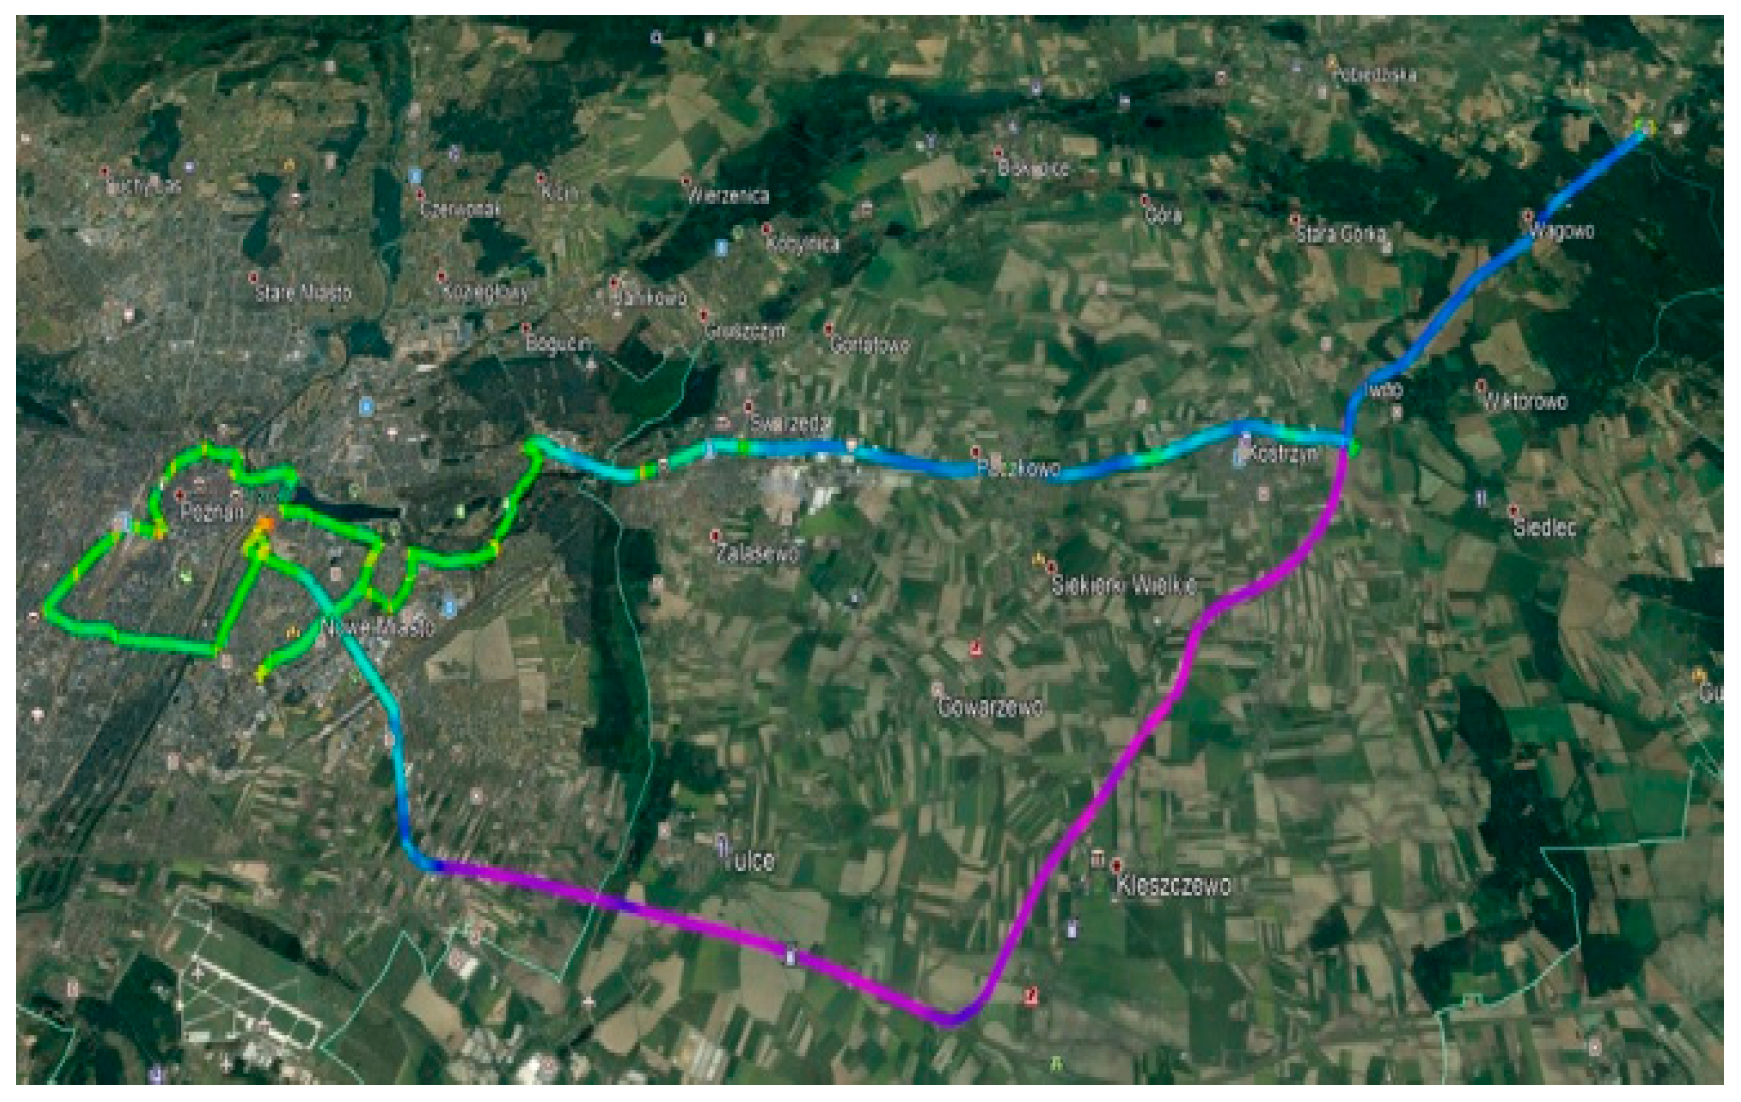
The tests conducted in Poznań and the surrounding area were conducted in field conditions that did not interrupt the recording of test signals. The route traversed urban, suburban, and highway areas. Each area had different driving conditions, particularly the speed at which the test vehicle traveled. Maximum speeds during the test were as follows: urban up to 60 km/h, suburban up to 90 km/h, and highway up to 145 km/h. The analyses did not take into account the effect of the vehicle’s operating age on emissions due to the lack of experimental data on the change in air pollutant emissions for a petrol-fueled vehicle and data for a hybrid vehicle.
4. Research Experiment and Results
Four vehicles were tested in the experiment, i.e., an electric vehicle, a hybrid vehicle, and two conventional vehicles, powered by petrol or diesel, respectively. The characteristics of the low-emission and conventional vehicles are shown in
Table 3.
The electric vehicle’s (V1) air pollutant emissions were determined using the analytical method described above. On-road RDEs tests were carried out for the hybrid vehicle (V2) and conventional vehicles (V3 and V4). The emissions for the hybrid vehicle (V2) do not take into account the use of electricity during operation in road conditions. Electric energy consumption by a hybrid vehicle was omitted. The impact of pollutants created from electric energy production on the emission of air pollutants generated by hybrid vehicles during the RDEs test is relatively small [
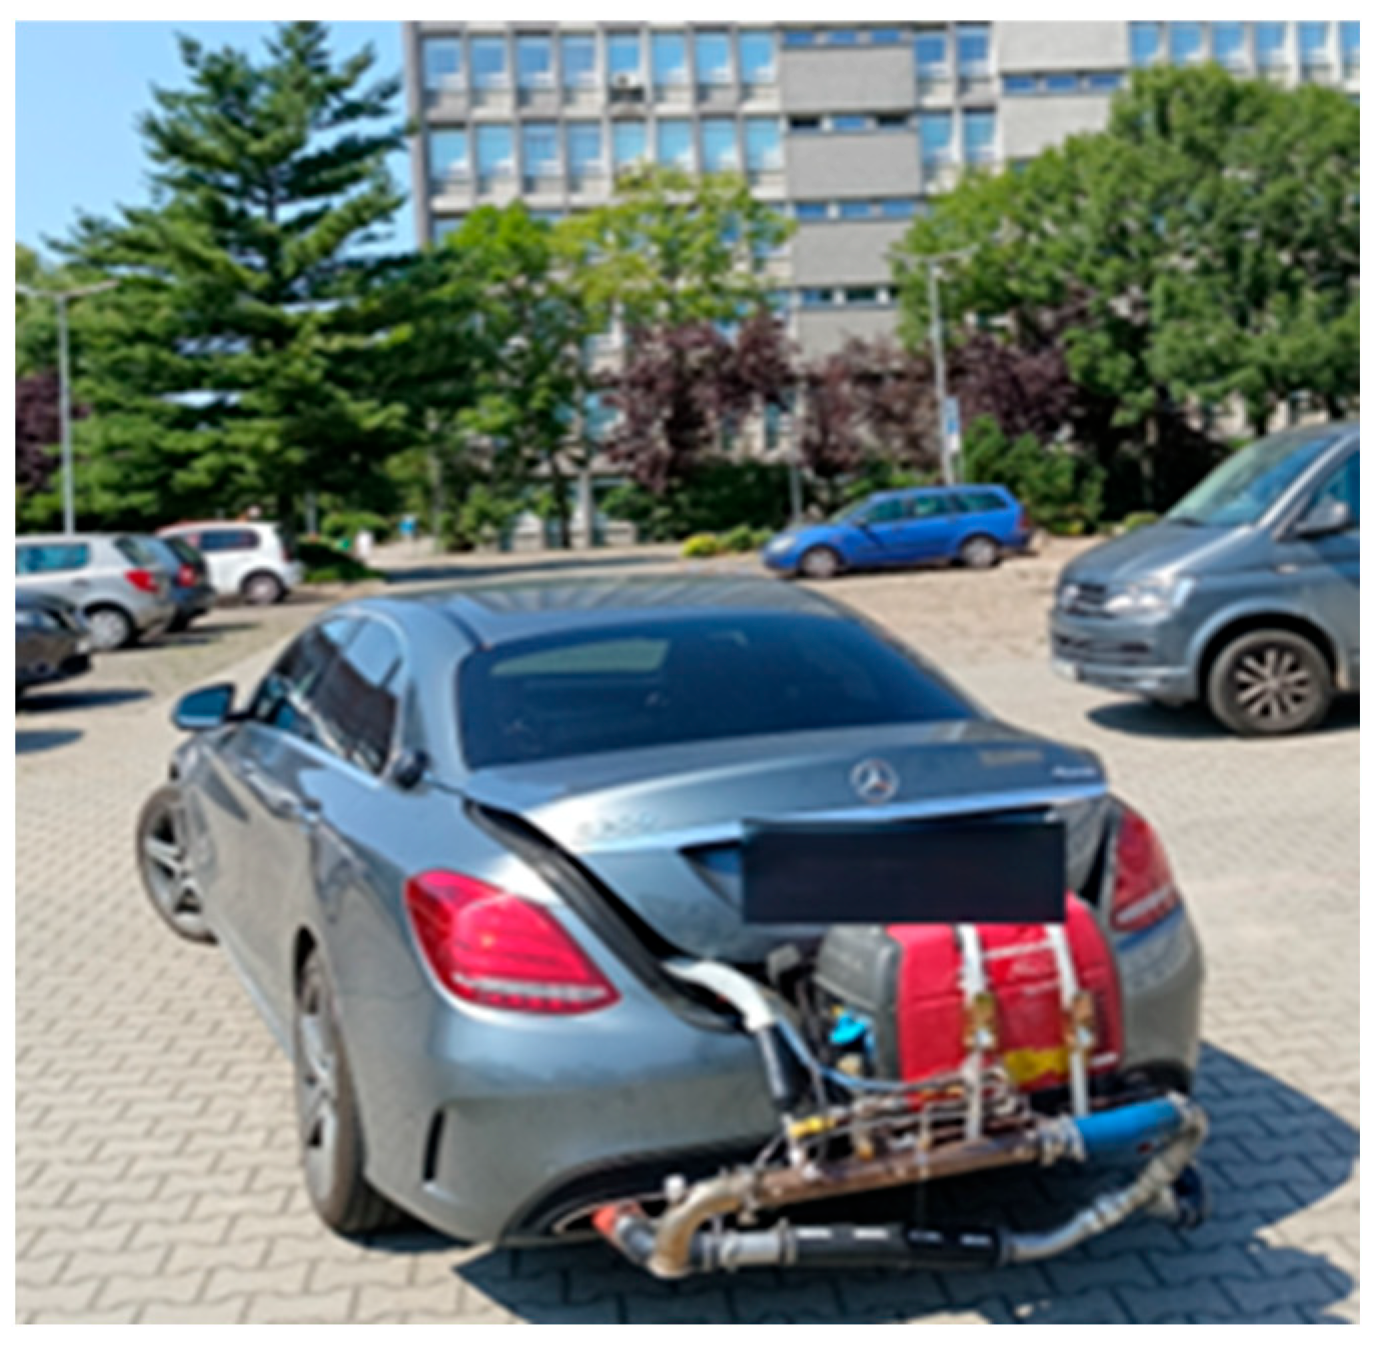
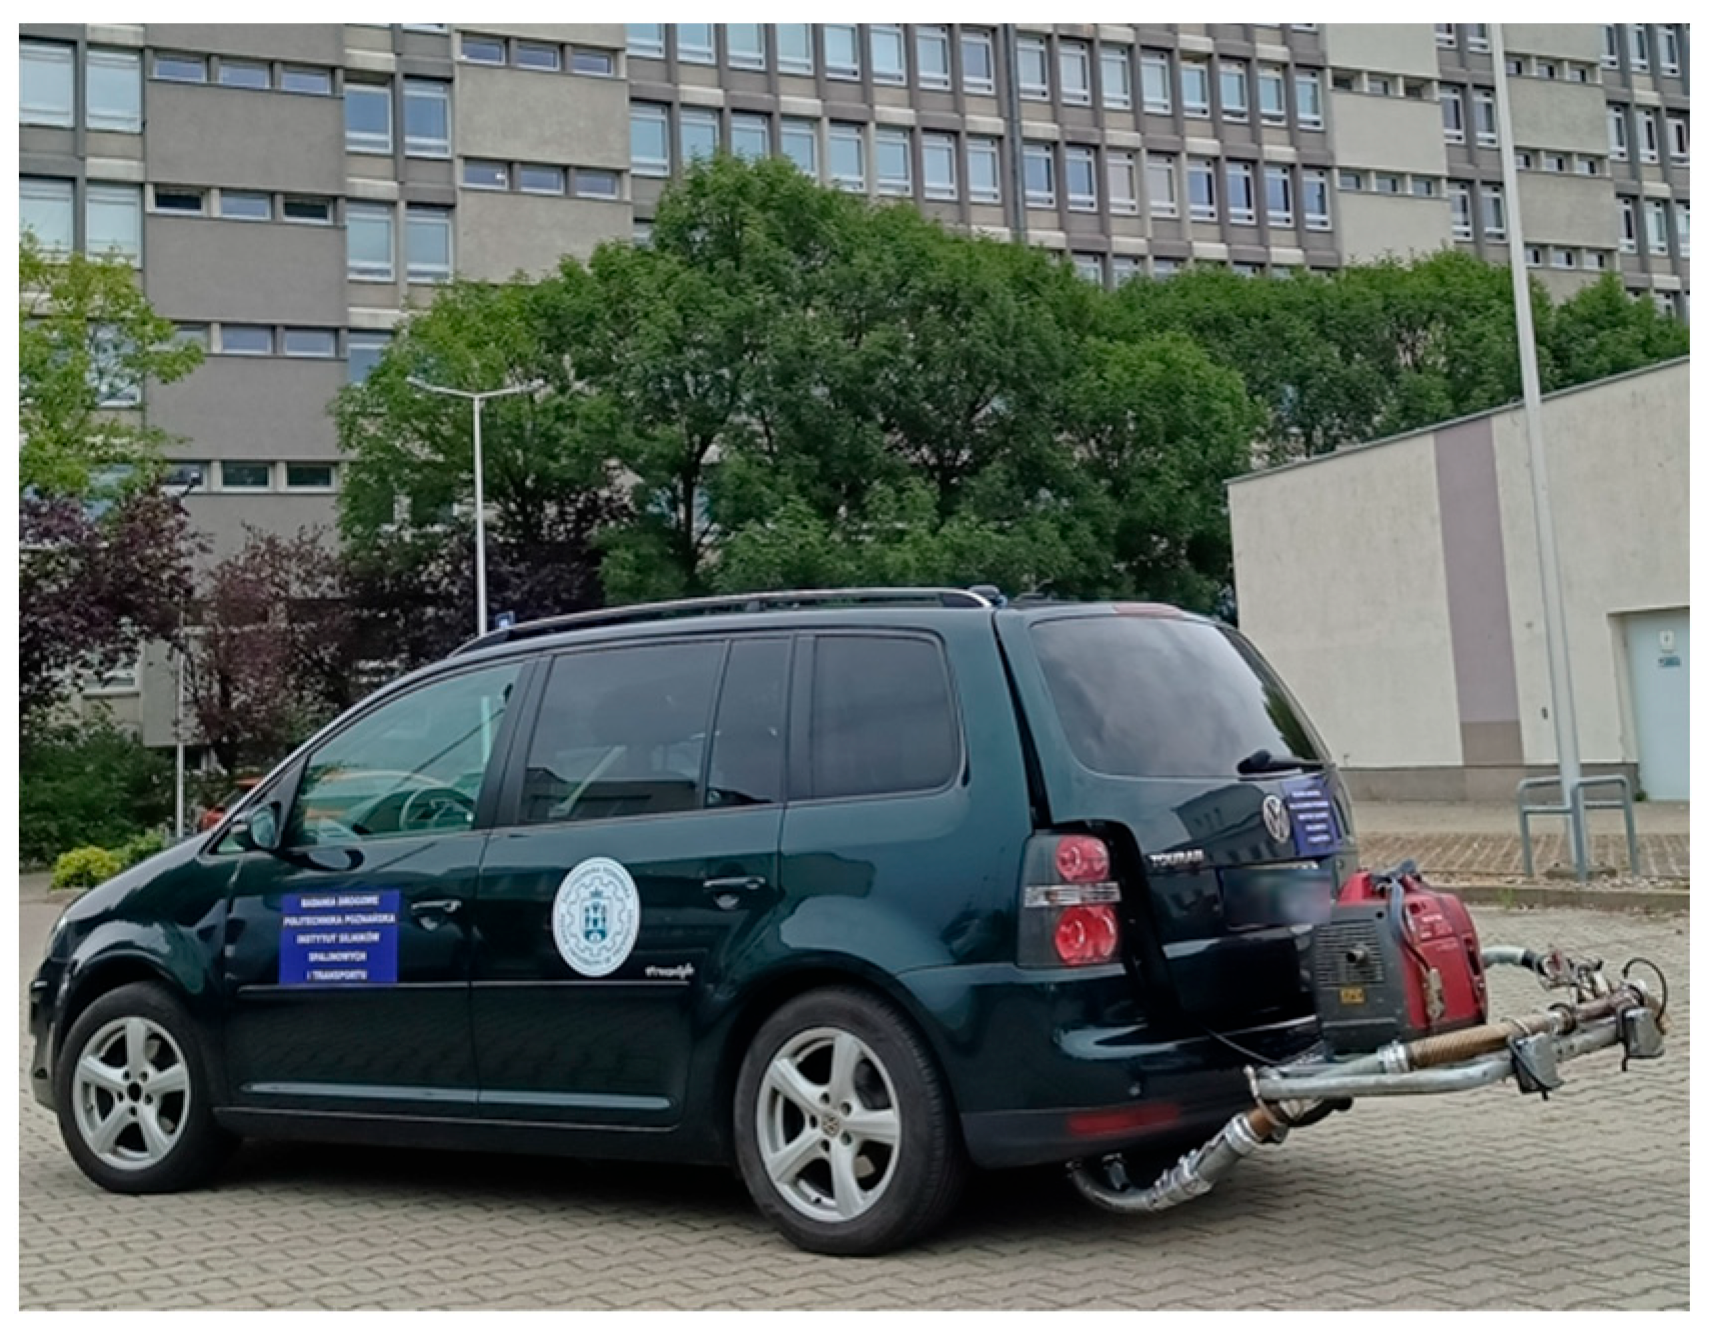
26]. Conventional vehicles, i.e., V3 and V4, had a mileage of 170,000 km (V3) and 317,000 km (V4). The hybrid vehicle (V2) had a mileage of 40,000 km. The test instrumentation mounted on vehicles V3 and V4 is shown in
Figure 8 and
Figure 9.
The combustion vehicles selected as a control group for the test (vehicles V3 and V4) are representative of the population of vehicles in use in Poland due to their mileage and age. The average age of a passenger vehicle in 2023 in Poland is more than 15 years. Poland’s car fleet, which has been aging for many years, is mainly fueled by imports from the secondary market of other countries, mainly including vehicles aged over 10 years. Vehicle age is a significant factor influencing emissions, especially in urban areas [
27]. Nearly 1 million vehicles have been imported into Poland every year in recent years [
28,
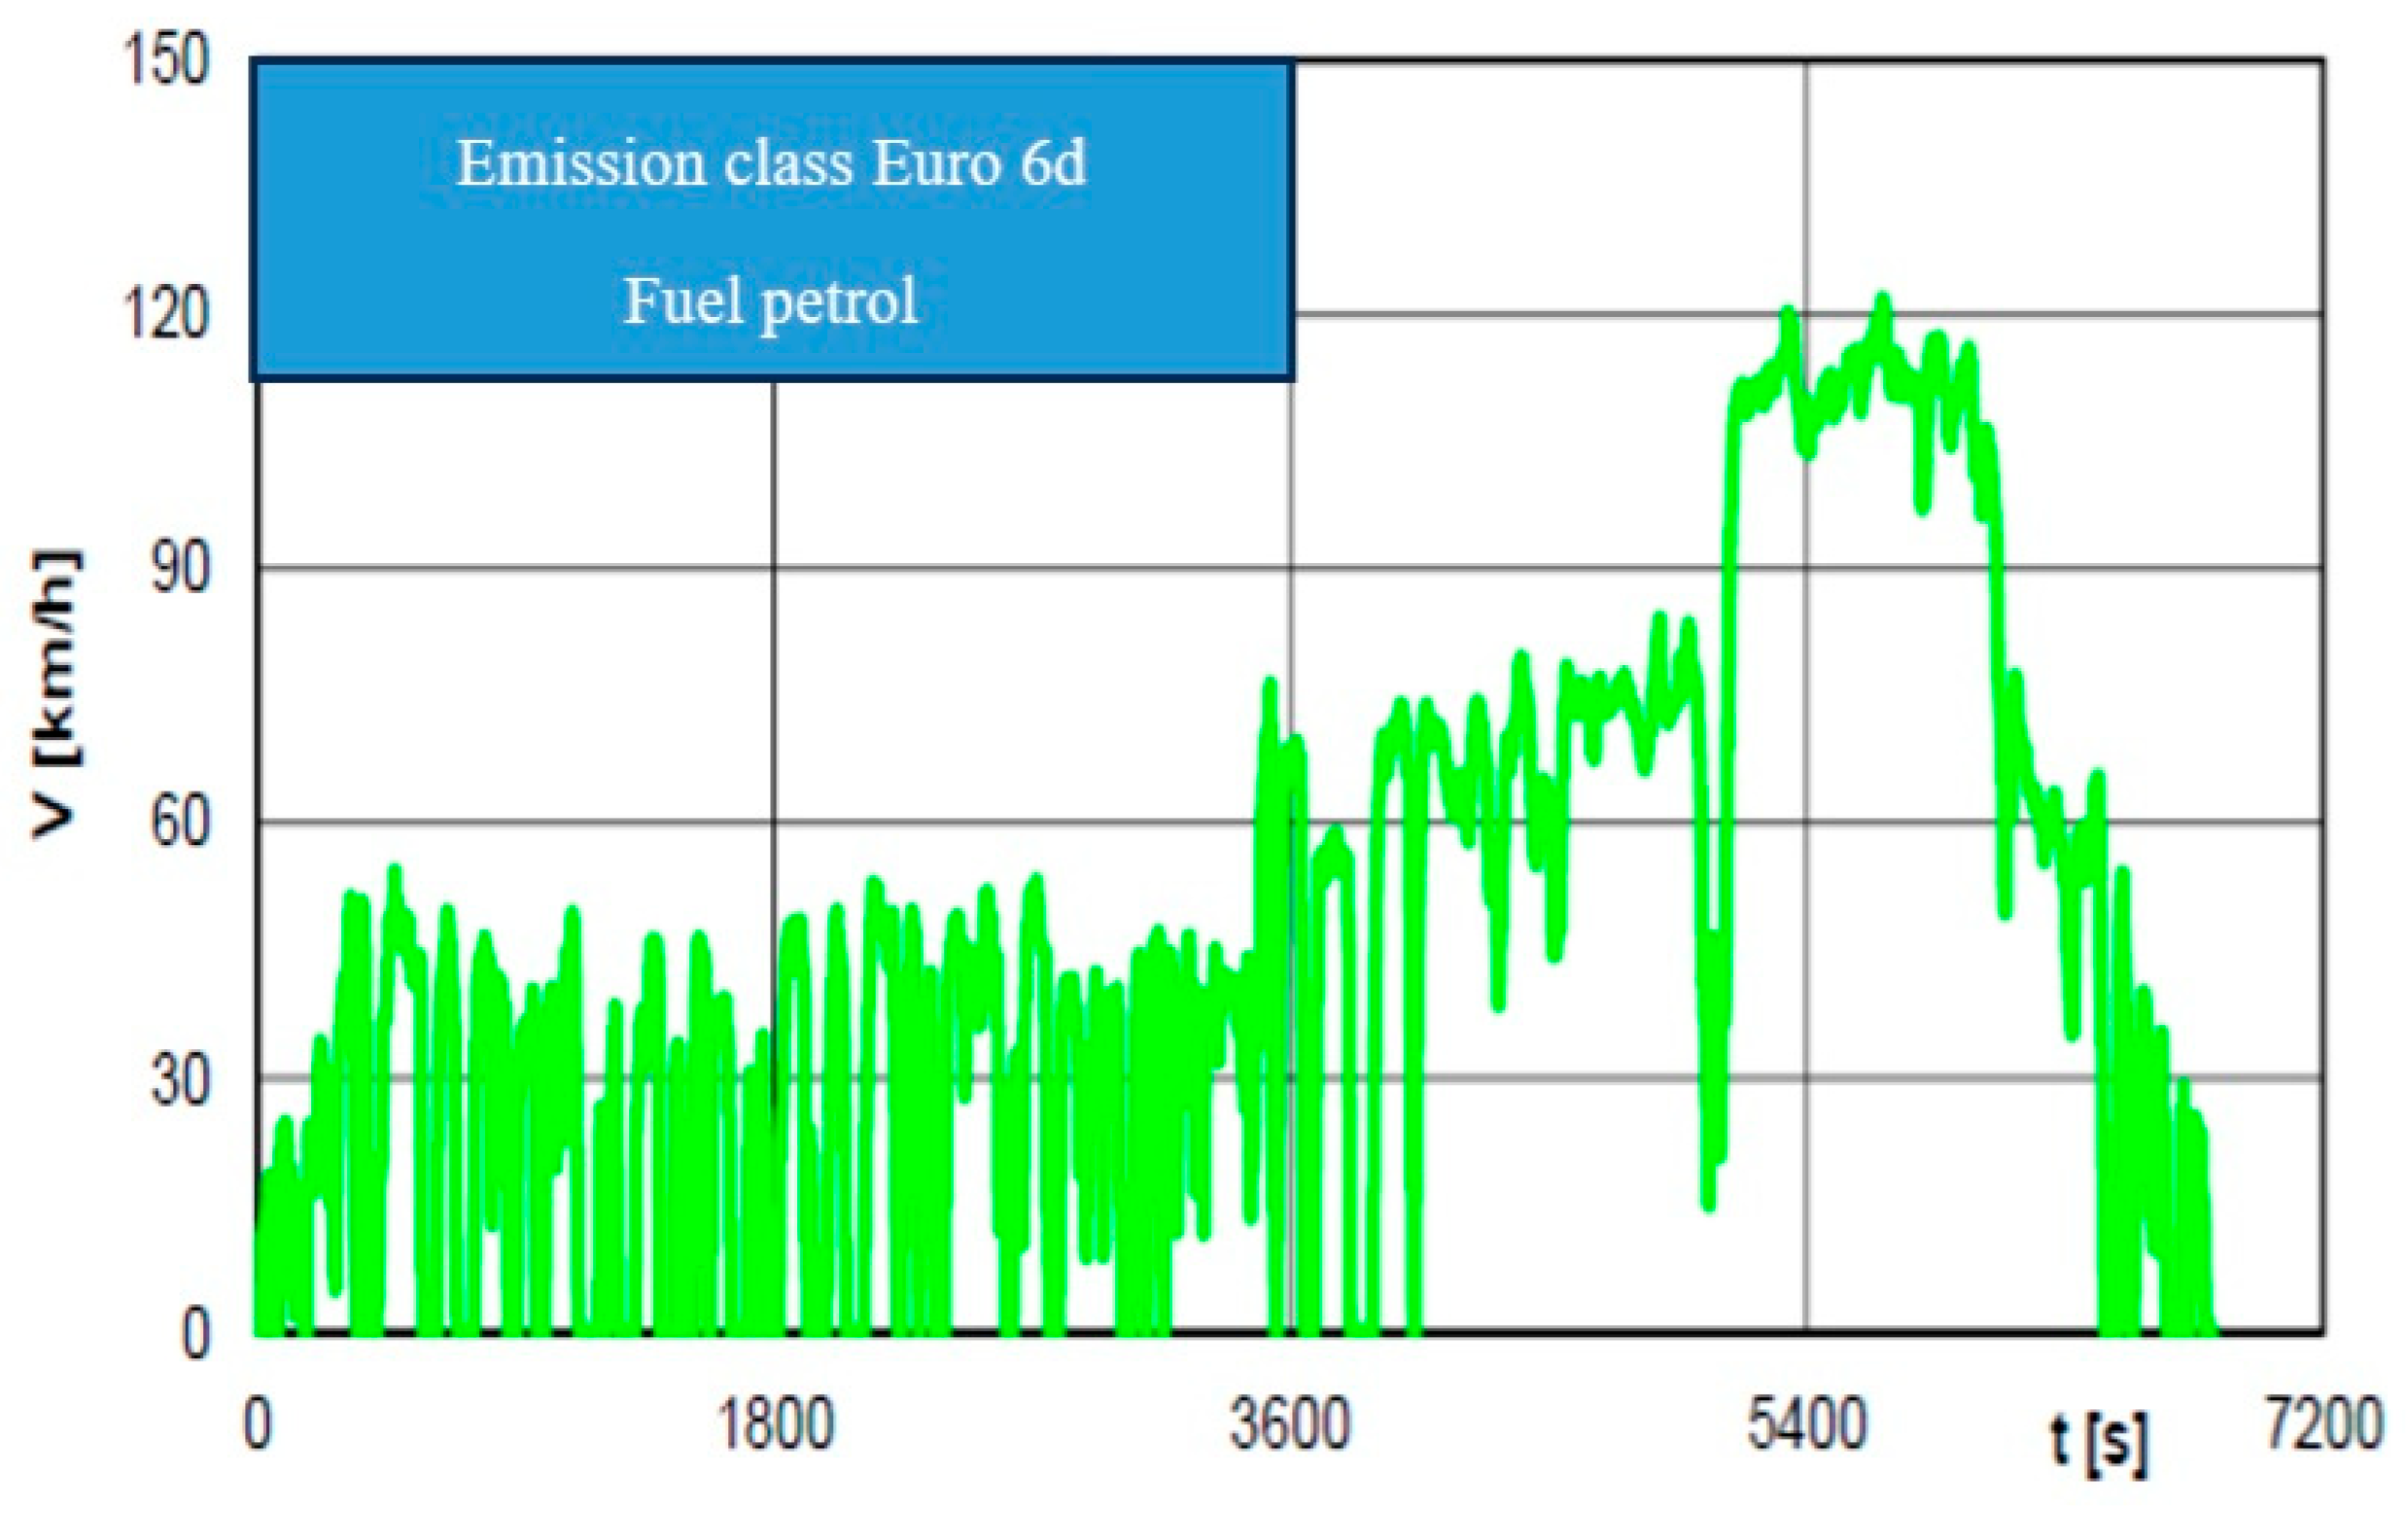
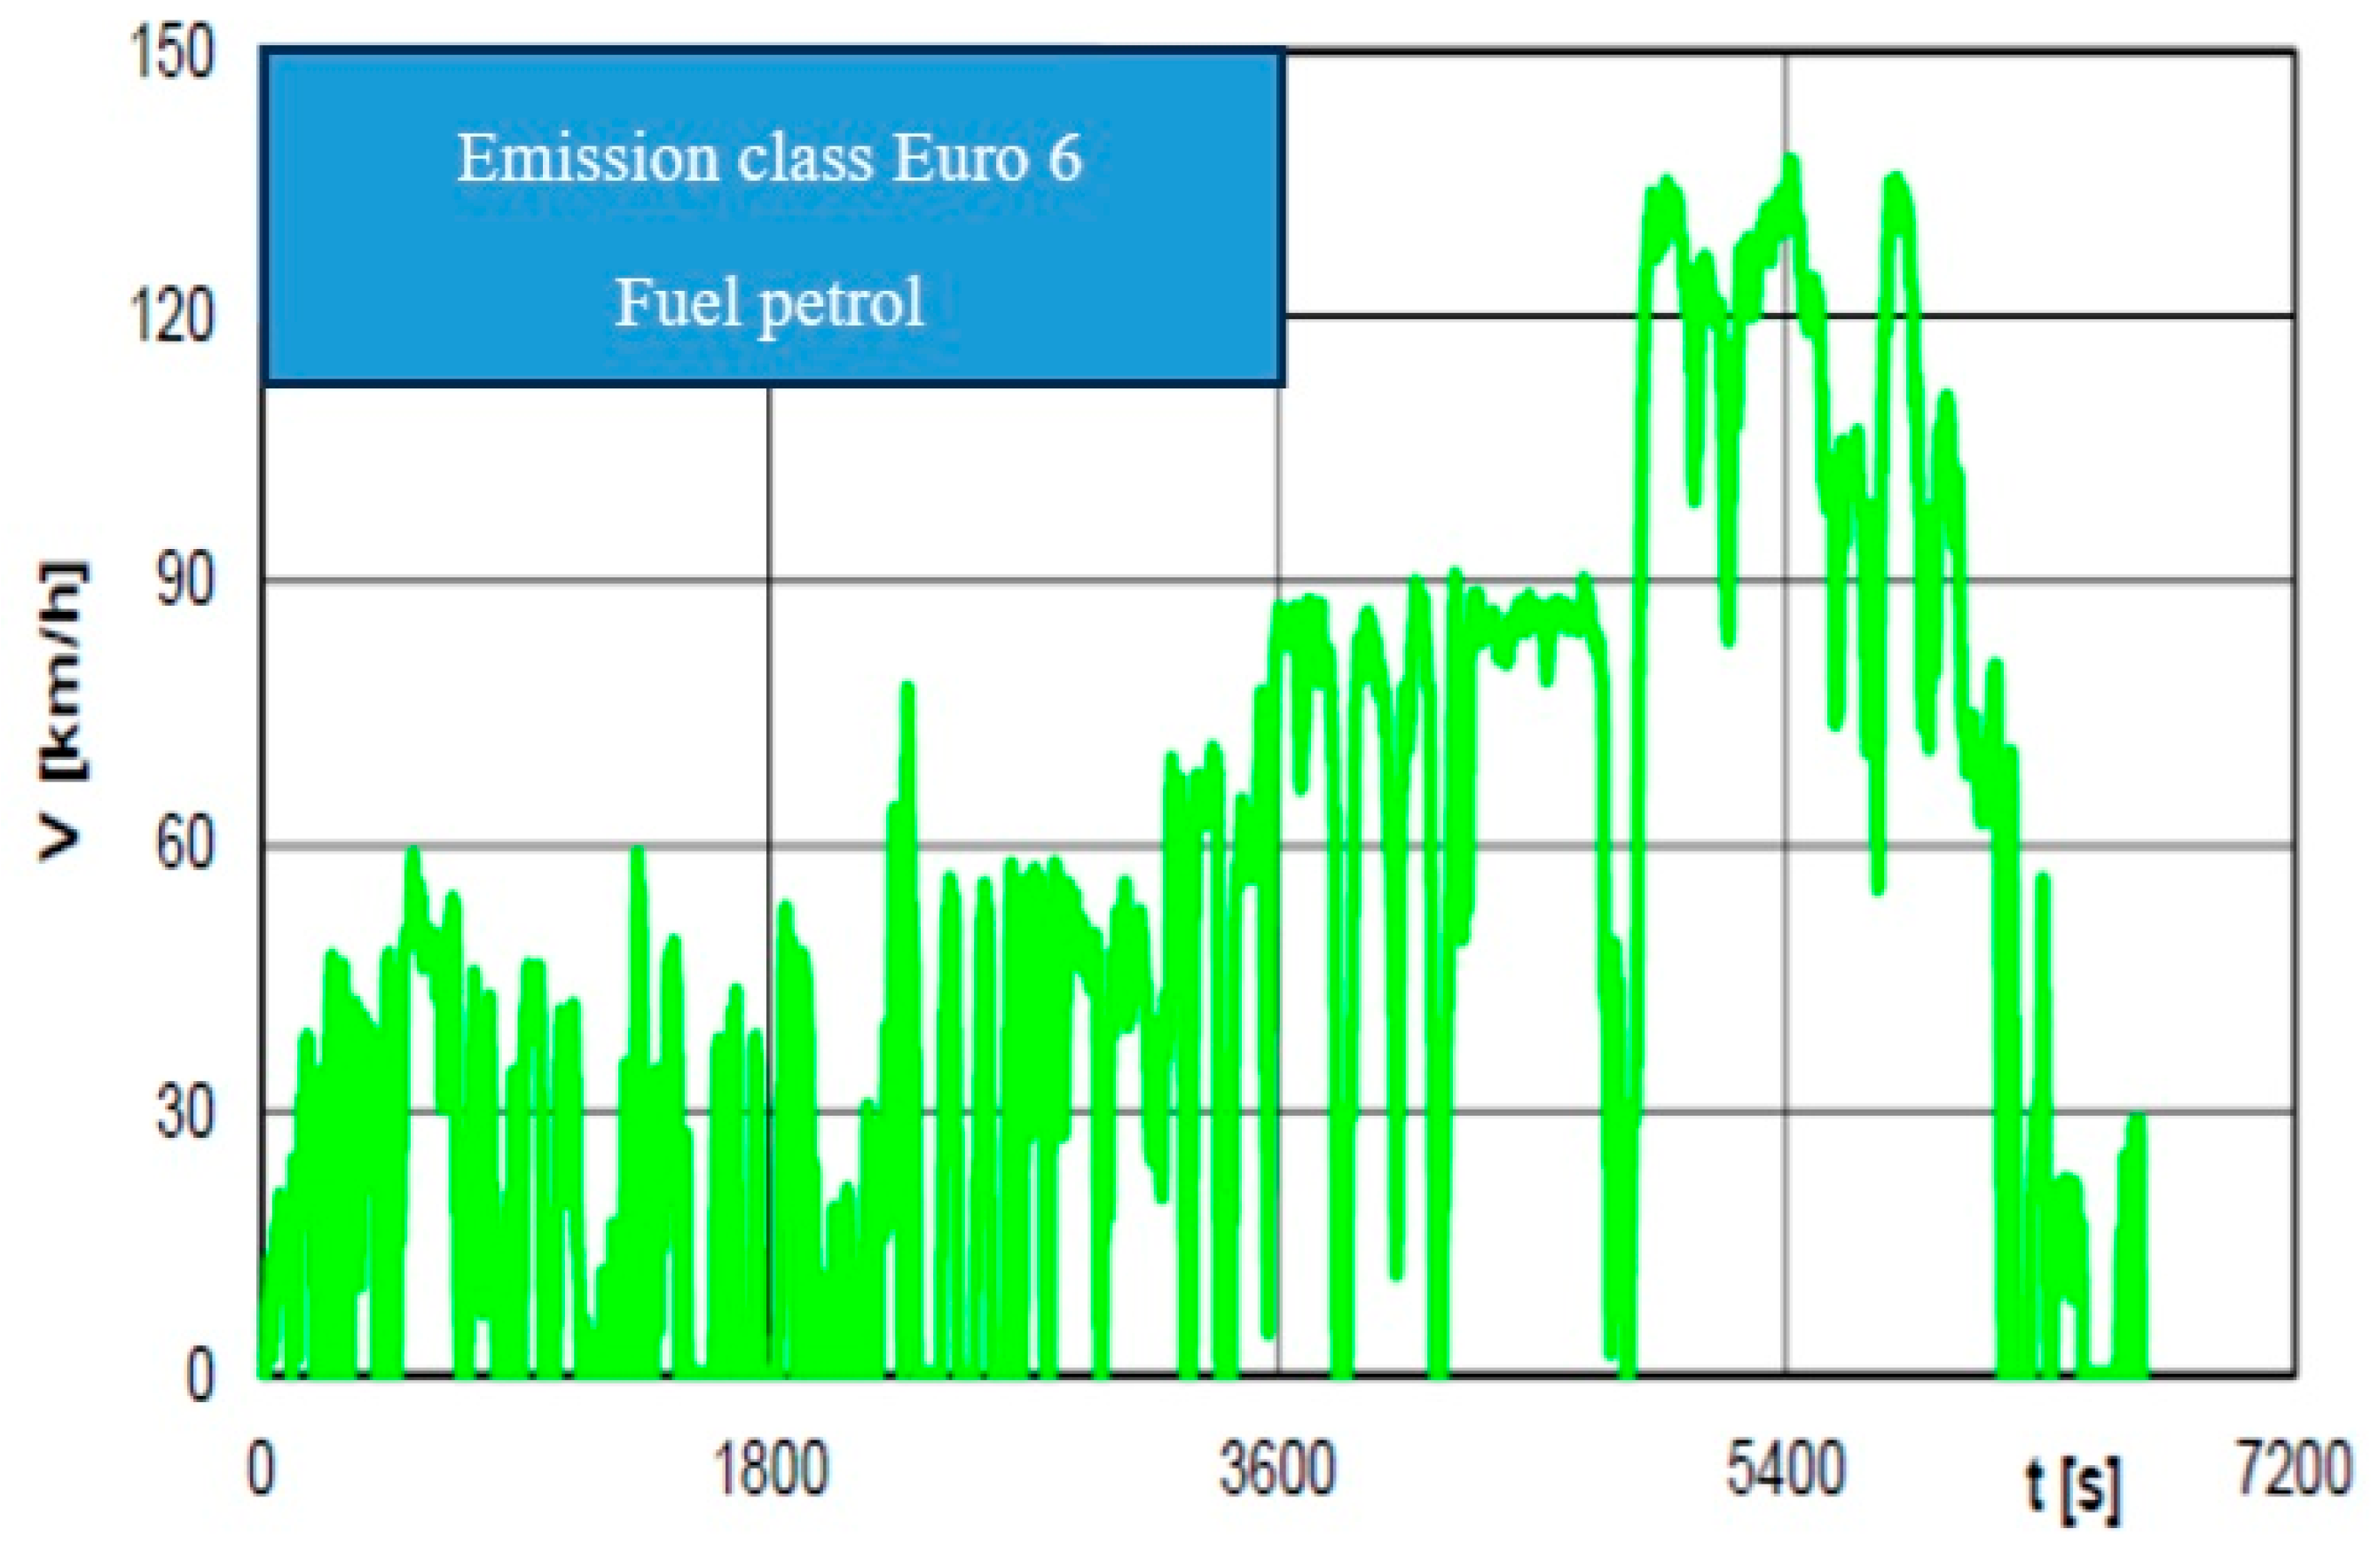
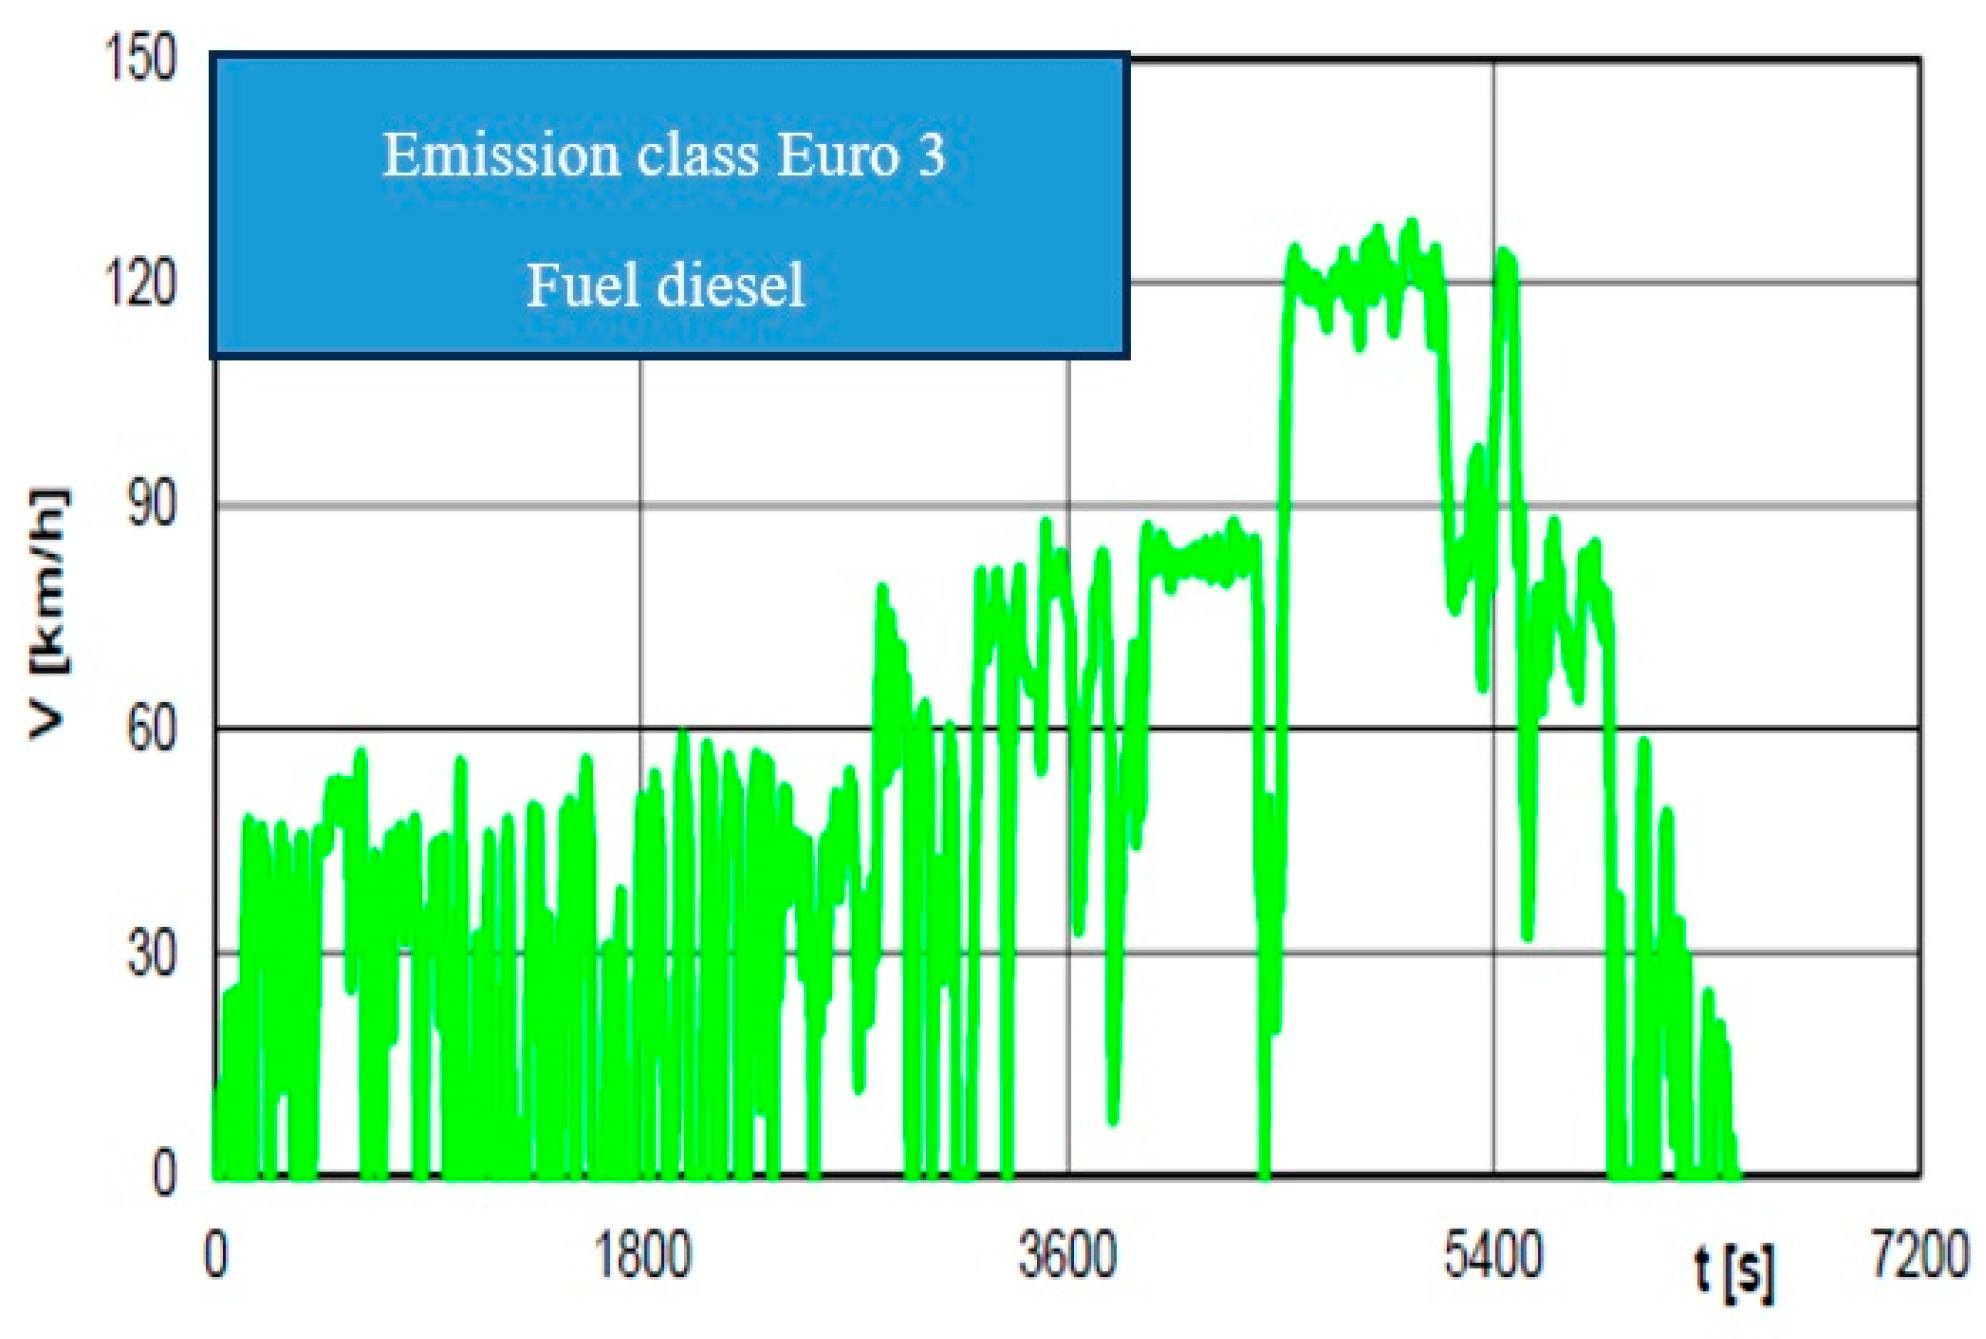
29]. The conventional vehicles V3 and V4, as well as the hybrid vehicle V2, covered the same route in the Poznań agglomeration during the RDEs test. The test route met the requirements of the RDEs test. The RDEs test covered urban, non-urban, and motorway areas. The vehicle speed in each section was adapted to the conditions set out in the standard. The results from the RDEs tests for vehicles V2, V3, and V4 are a novelty and are the basis for comparative analyses with the electric vehicle. A chart of vehicle speeds during the RDEs tests, together with the speed profile as a function of test duration, is shown in
Figure 10,
Figure 11,
Figure 12 and
Figure 13.
Road tests of air pollutant emissions in the form of CO, CO
2, and NO
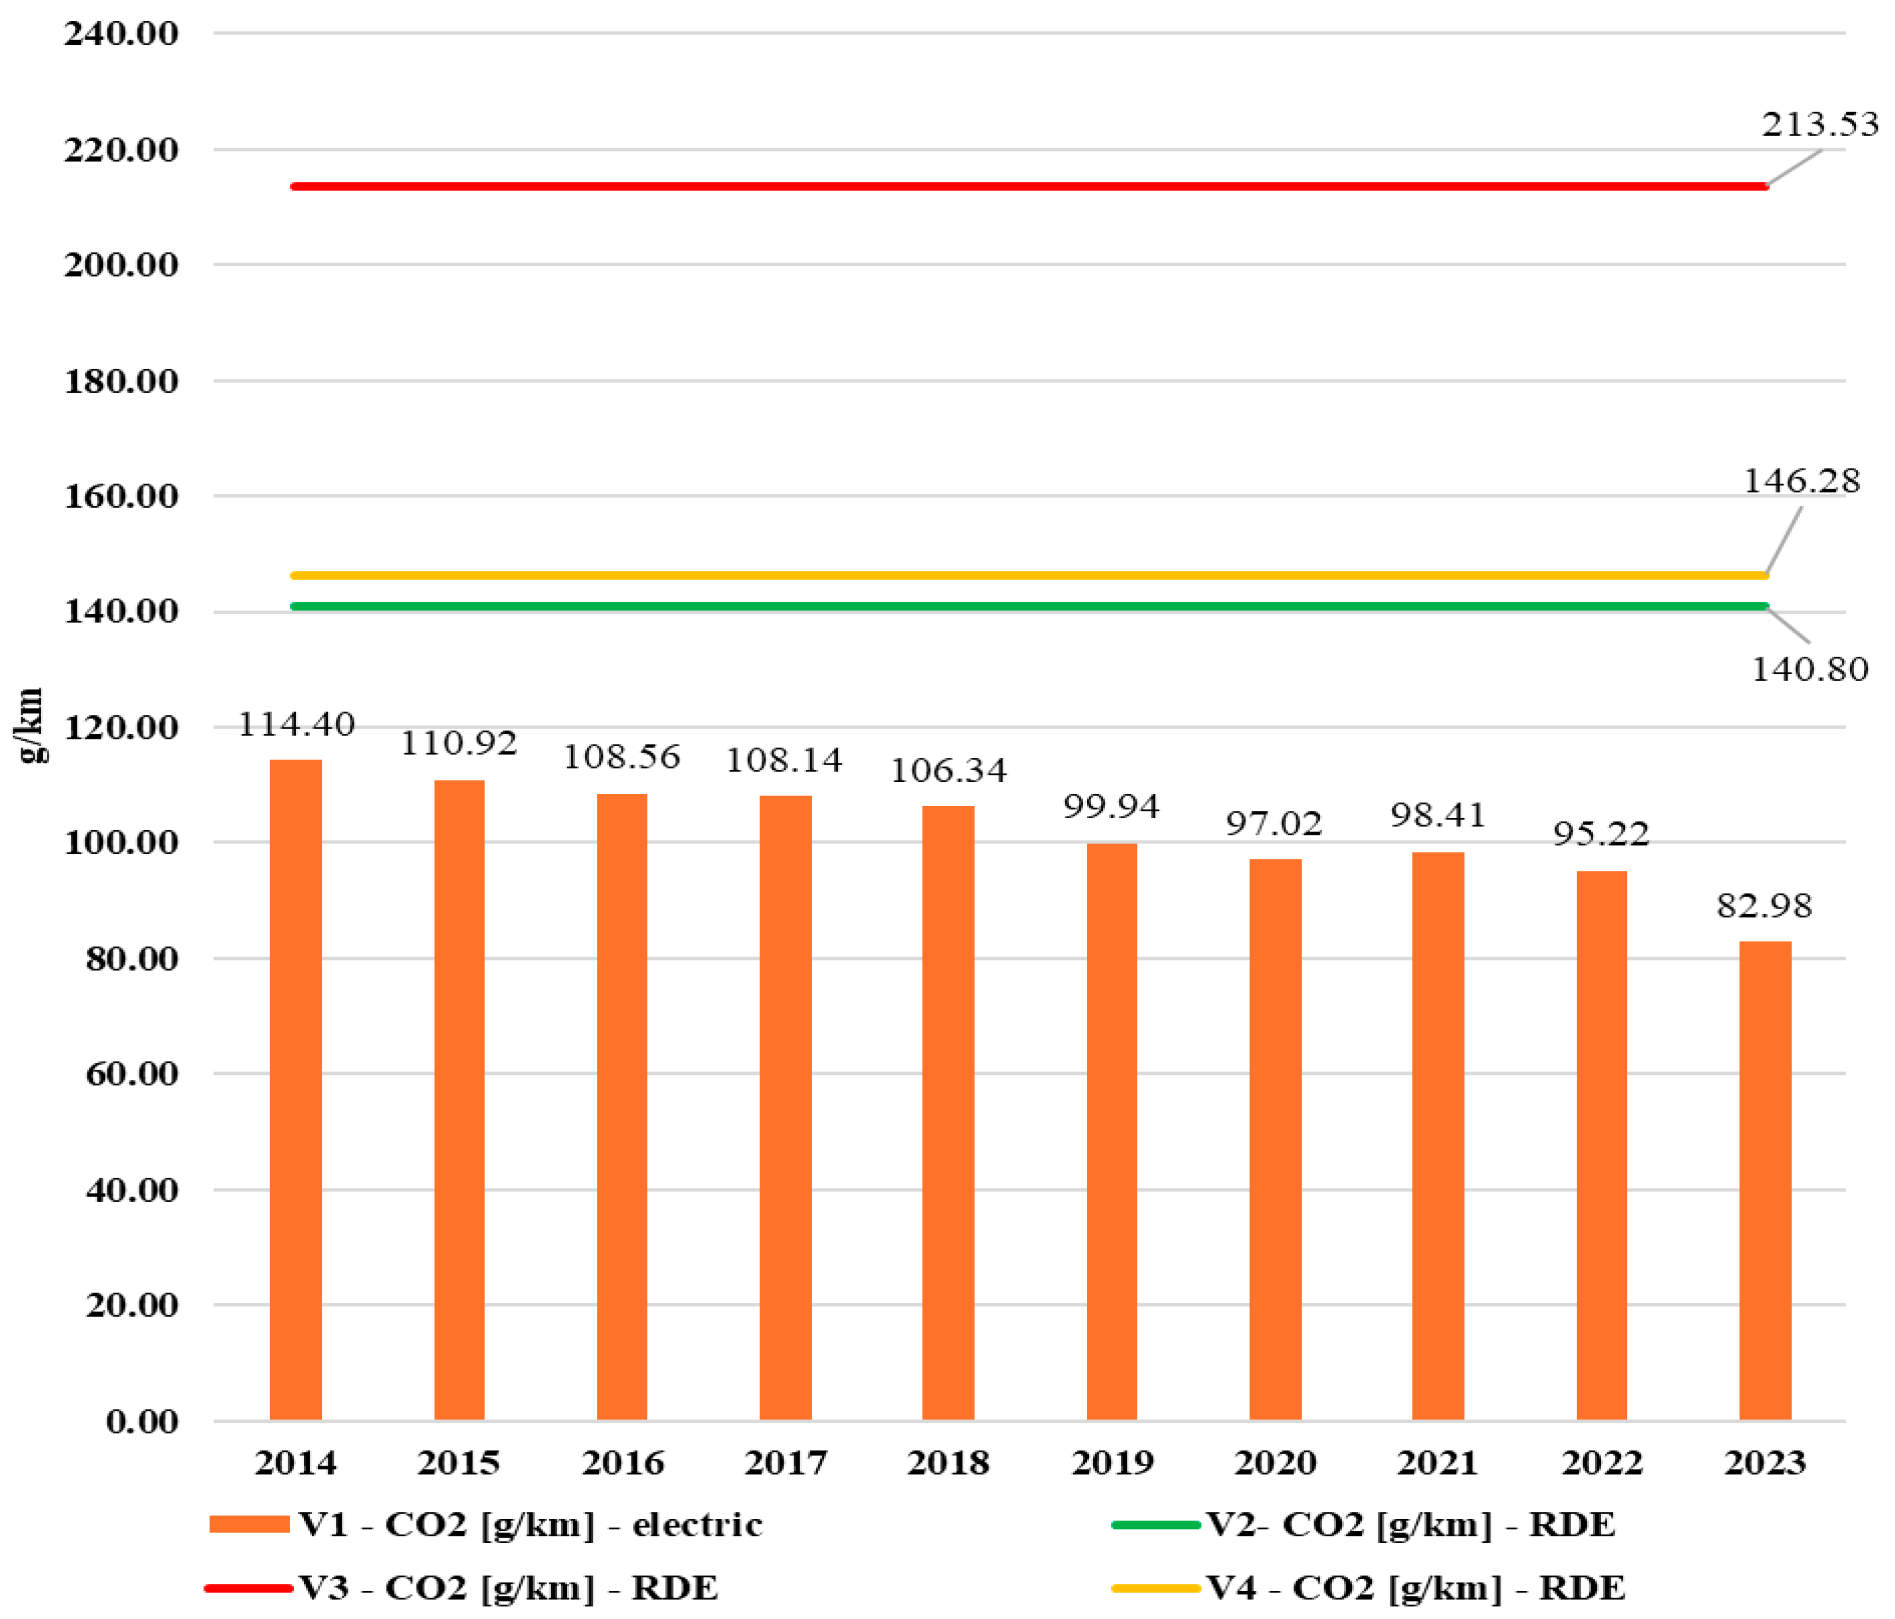
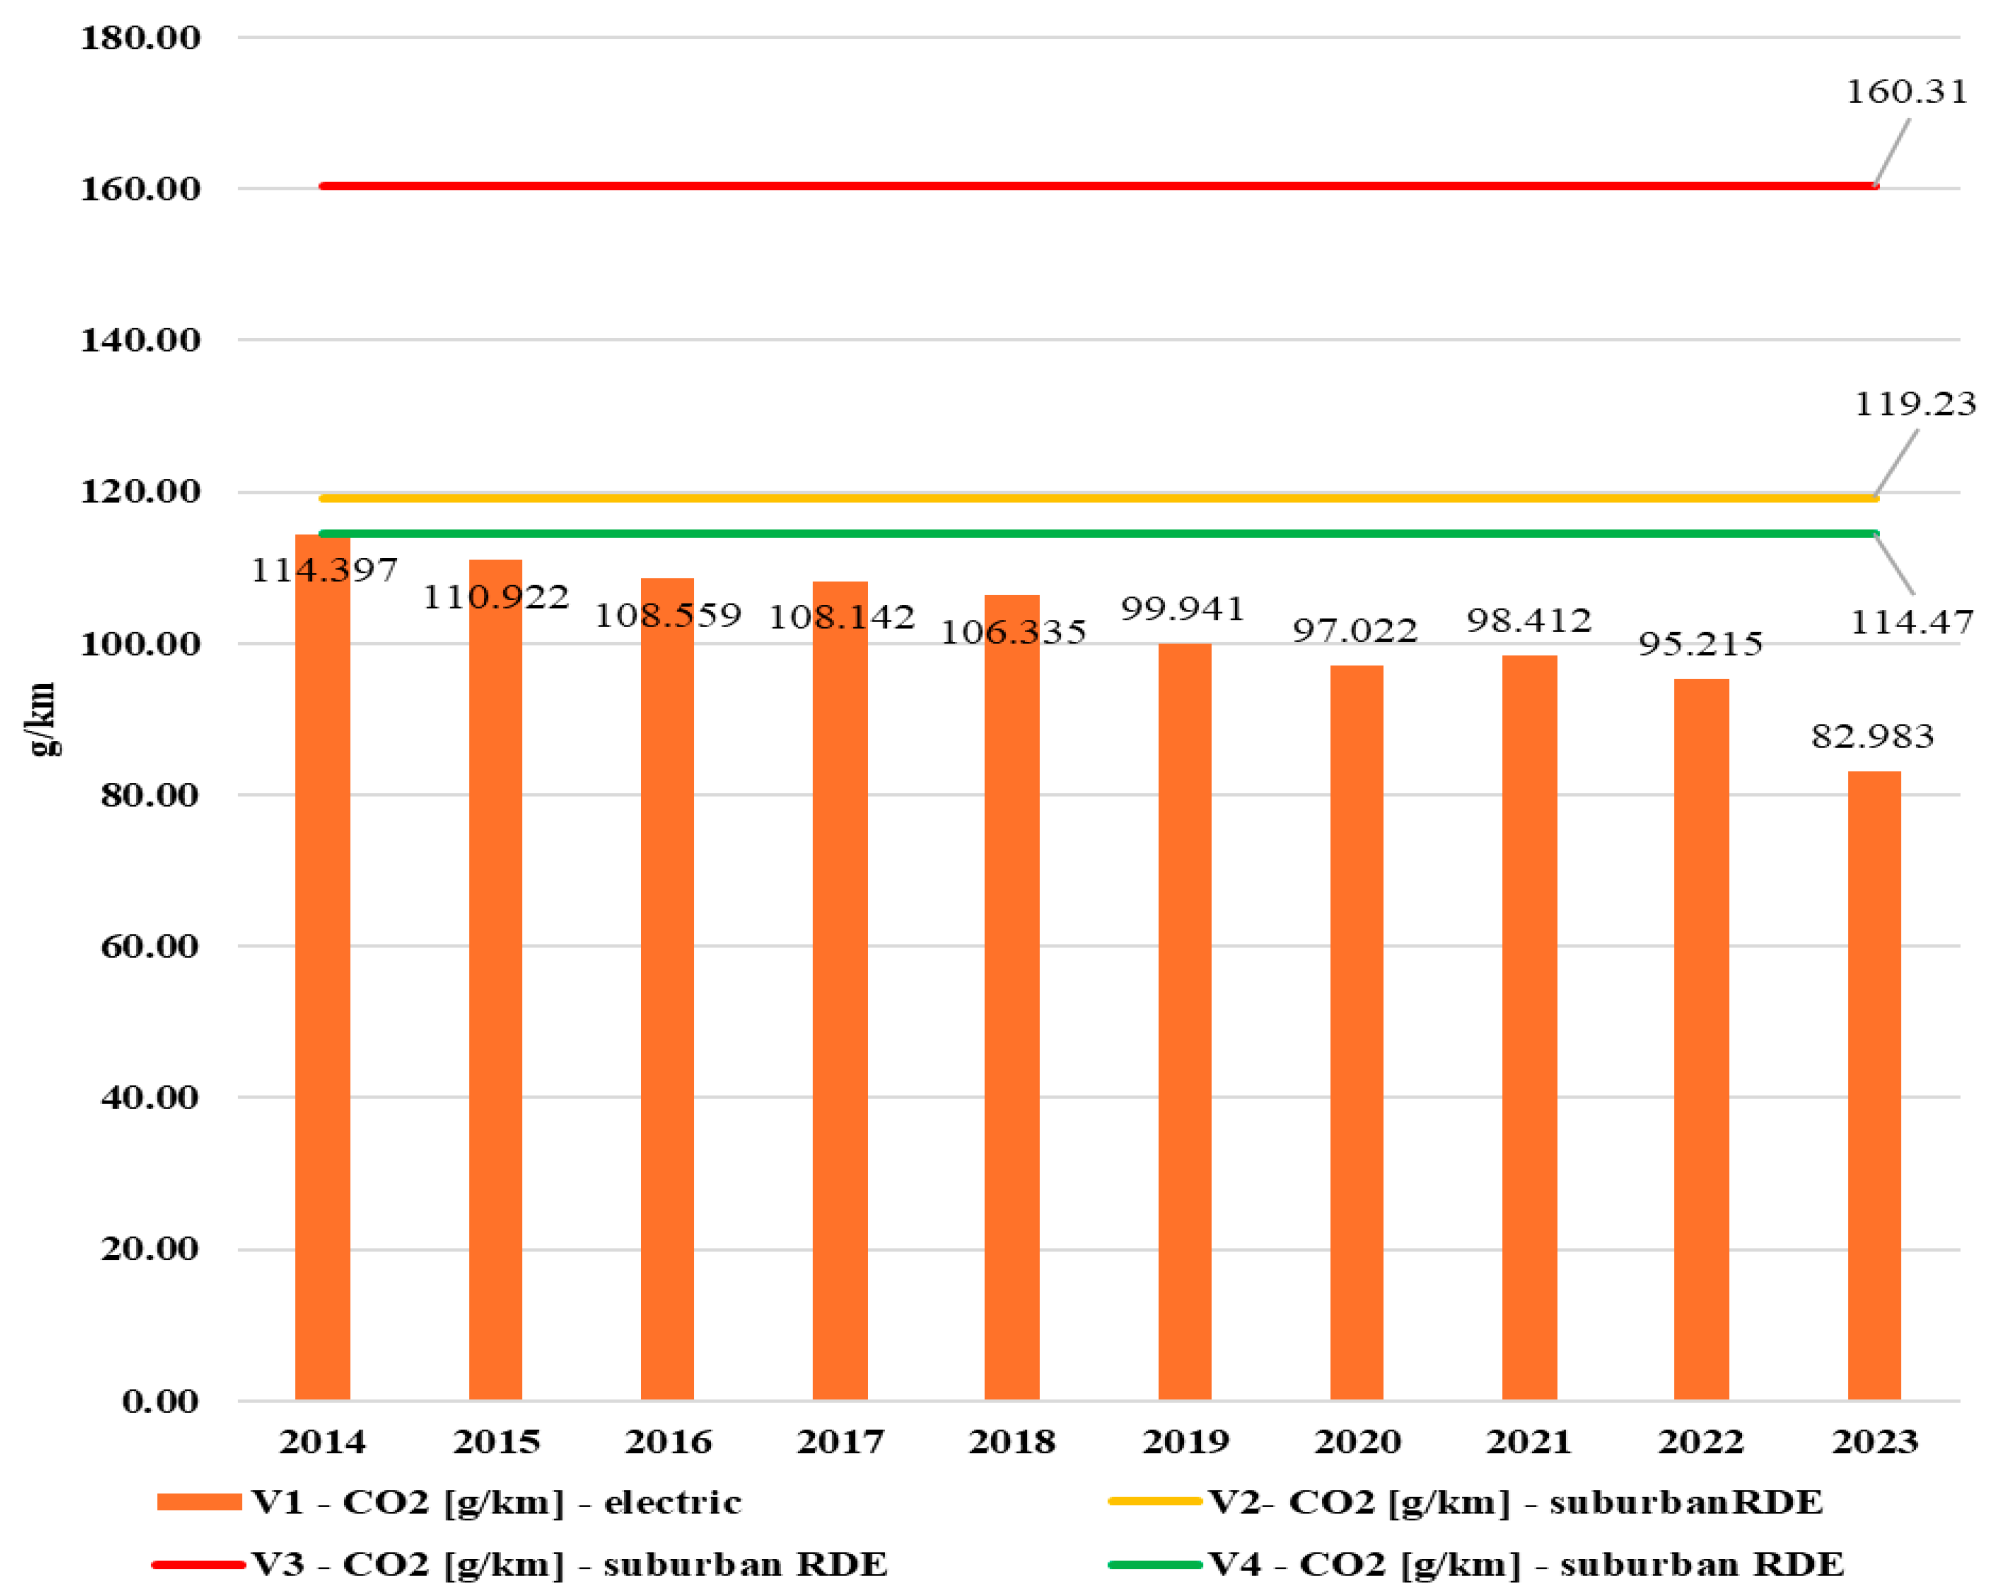
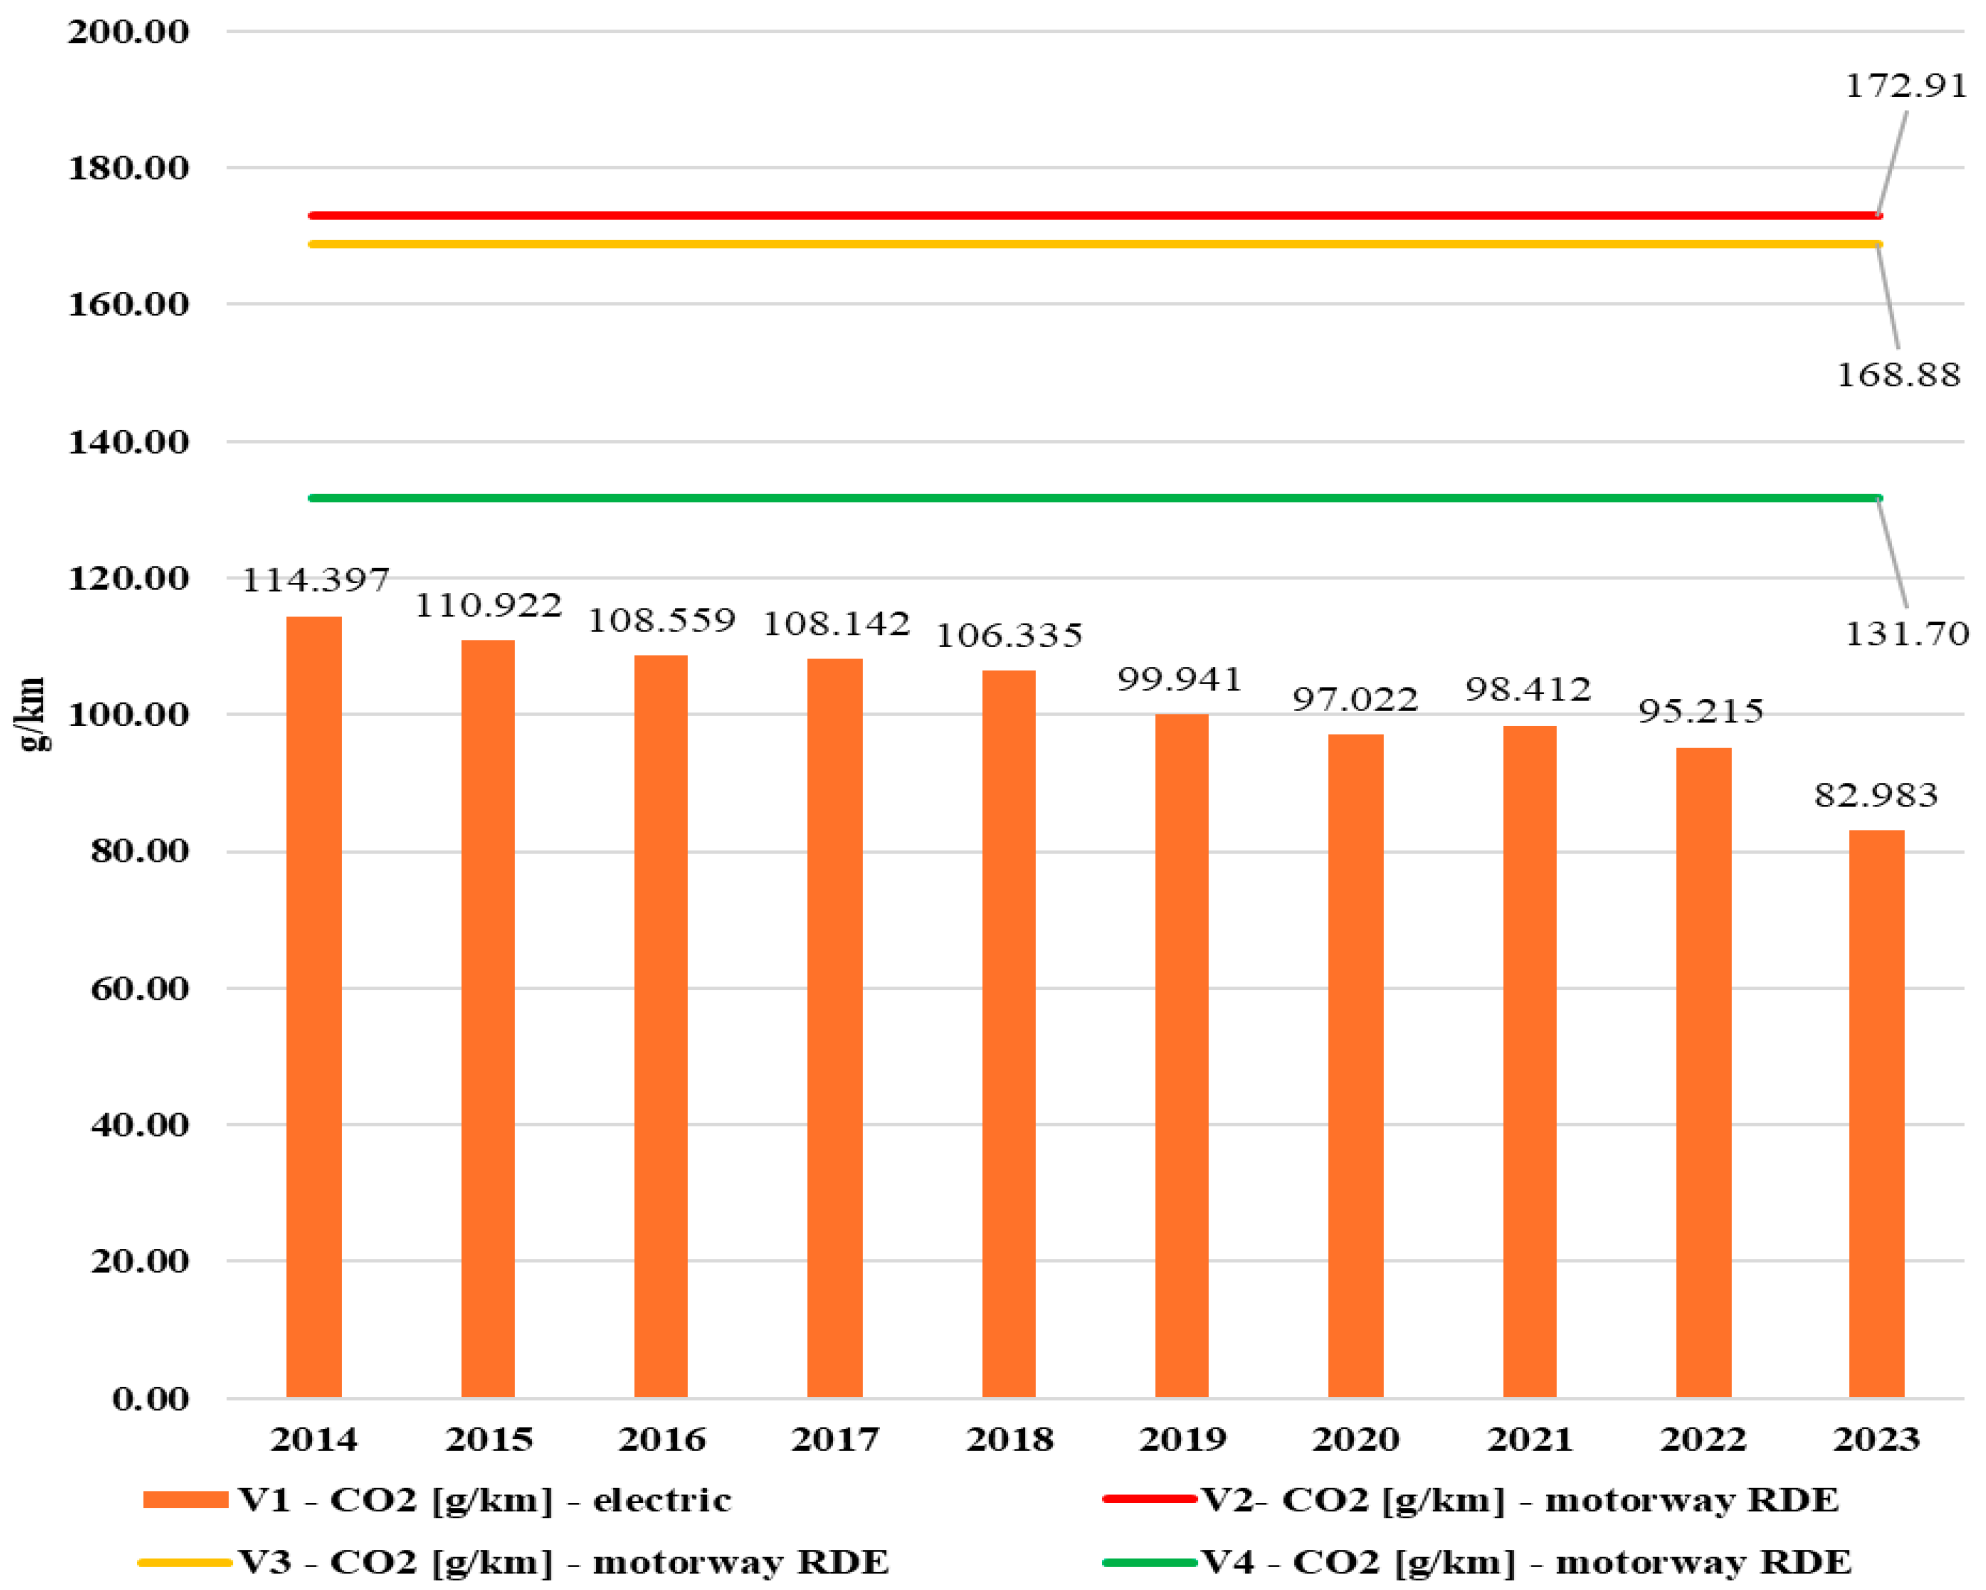
X carried out for vehicles V2, V3, and V4 in the Poznań agglomeration and surrounding areas showed higher air pollutant emissions in relation to those generated by the electric vehicle. Emissions during electricity production were analyzed for the electric vehicle. A certain deviation from the above observation can be seen when analyzing carbon dioxide emissions, especially in the urban area.
Figure 14,
Figure 15,
Figure 16 and
Figure 17 show the CO
2 emissions for vehicles V1–V4. Between 2014 and 2019, the emissions generated by electric vehicles were lower than those from vehicles V3 and V4, but higher than the air pollutant emissions generated by vehicle V2 in urban areas. The above was due to the significant share of fossil fuels in electricity production in Poland, which was close to 80%. Between 2014 and 2019, the share of fossil fuels in Poland’s electricity production amounted to 82% and 70% [
25], respectively. Exceeding 30% renewables in electricity production between 2019 and 2023 resulted in a decrease in the emissions of primary pollutants in vehicle V1 relative to the other vehicles (V2, V3, and V4). Even if the RDEs measurements for vehicle V2 were corrected for the emissions resulting from the use of electricity by vehicle V3, the emissions of vehicle V1 in the urban area were higher between 2014 and 2019. With Poland’s changing energy mix, from 2019 onwards, the emissions of vehicle V1 are noticeably lower in urban, suburban, and motorway traffic conditions.
Figure 14,
Figure 15,
Figure 16 and
Figure 17 show the CO
2 emissions for vehicles V1–V4.
Constant in-service emissions were assumed for vehicles V2, V3, and V4 as a result of RDEs testing. However, vehicle air pollutant emissions change over time. CO
2 emissions for diesel-powered vehicles with mileage greater than 86,000 km can be up to around 60% higher than for vehicles with a mileage up to 86,000 km. Assuming an analogous increase in emissions for hybrid, petrol, and diesel vehicles, the emissions of vehicle V2, V3, and V4 adjusted by the above ratio specified in the literature would be greater than those of vehicle V1 in each test phase, i.e., urban, suburban, motorway conditions, and the cumulative value of the RDEs test. For the sake of simplicity, the charts showing the comparison of emissions of vehicles V1, V2, V3, and V4 demonstrate constant emissions of vehicles V2, V3, and V4 over time. The emissions of vehicle V1 are variable over time due to the change in Poland’s energy mix, associated with the change in the sources from which electricity is produced in Poland. The results are also shown in
Figure 14,
Figure 15,
Figure 16 and
Figure 17 for easier understanding.
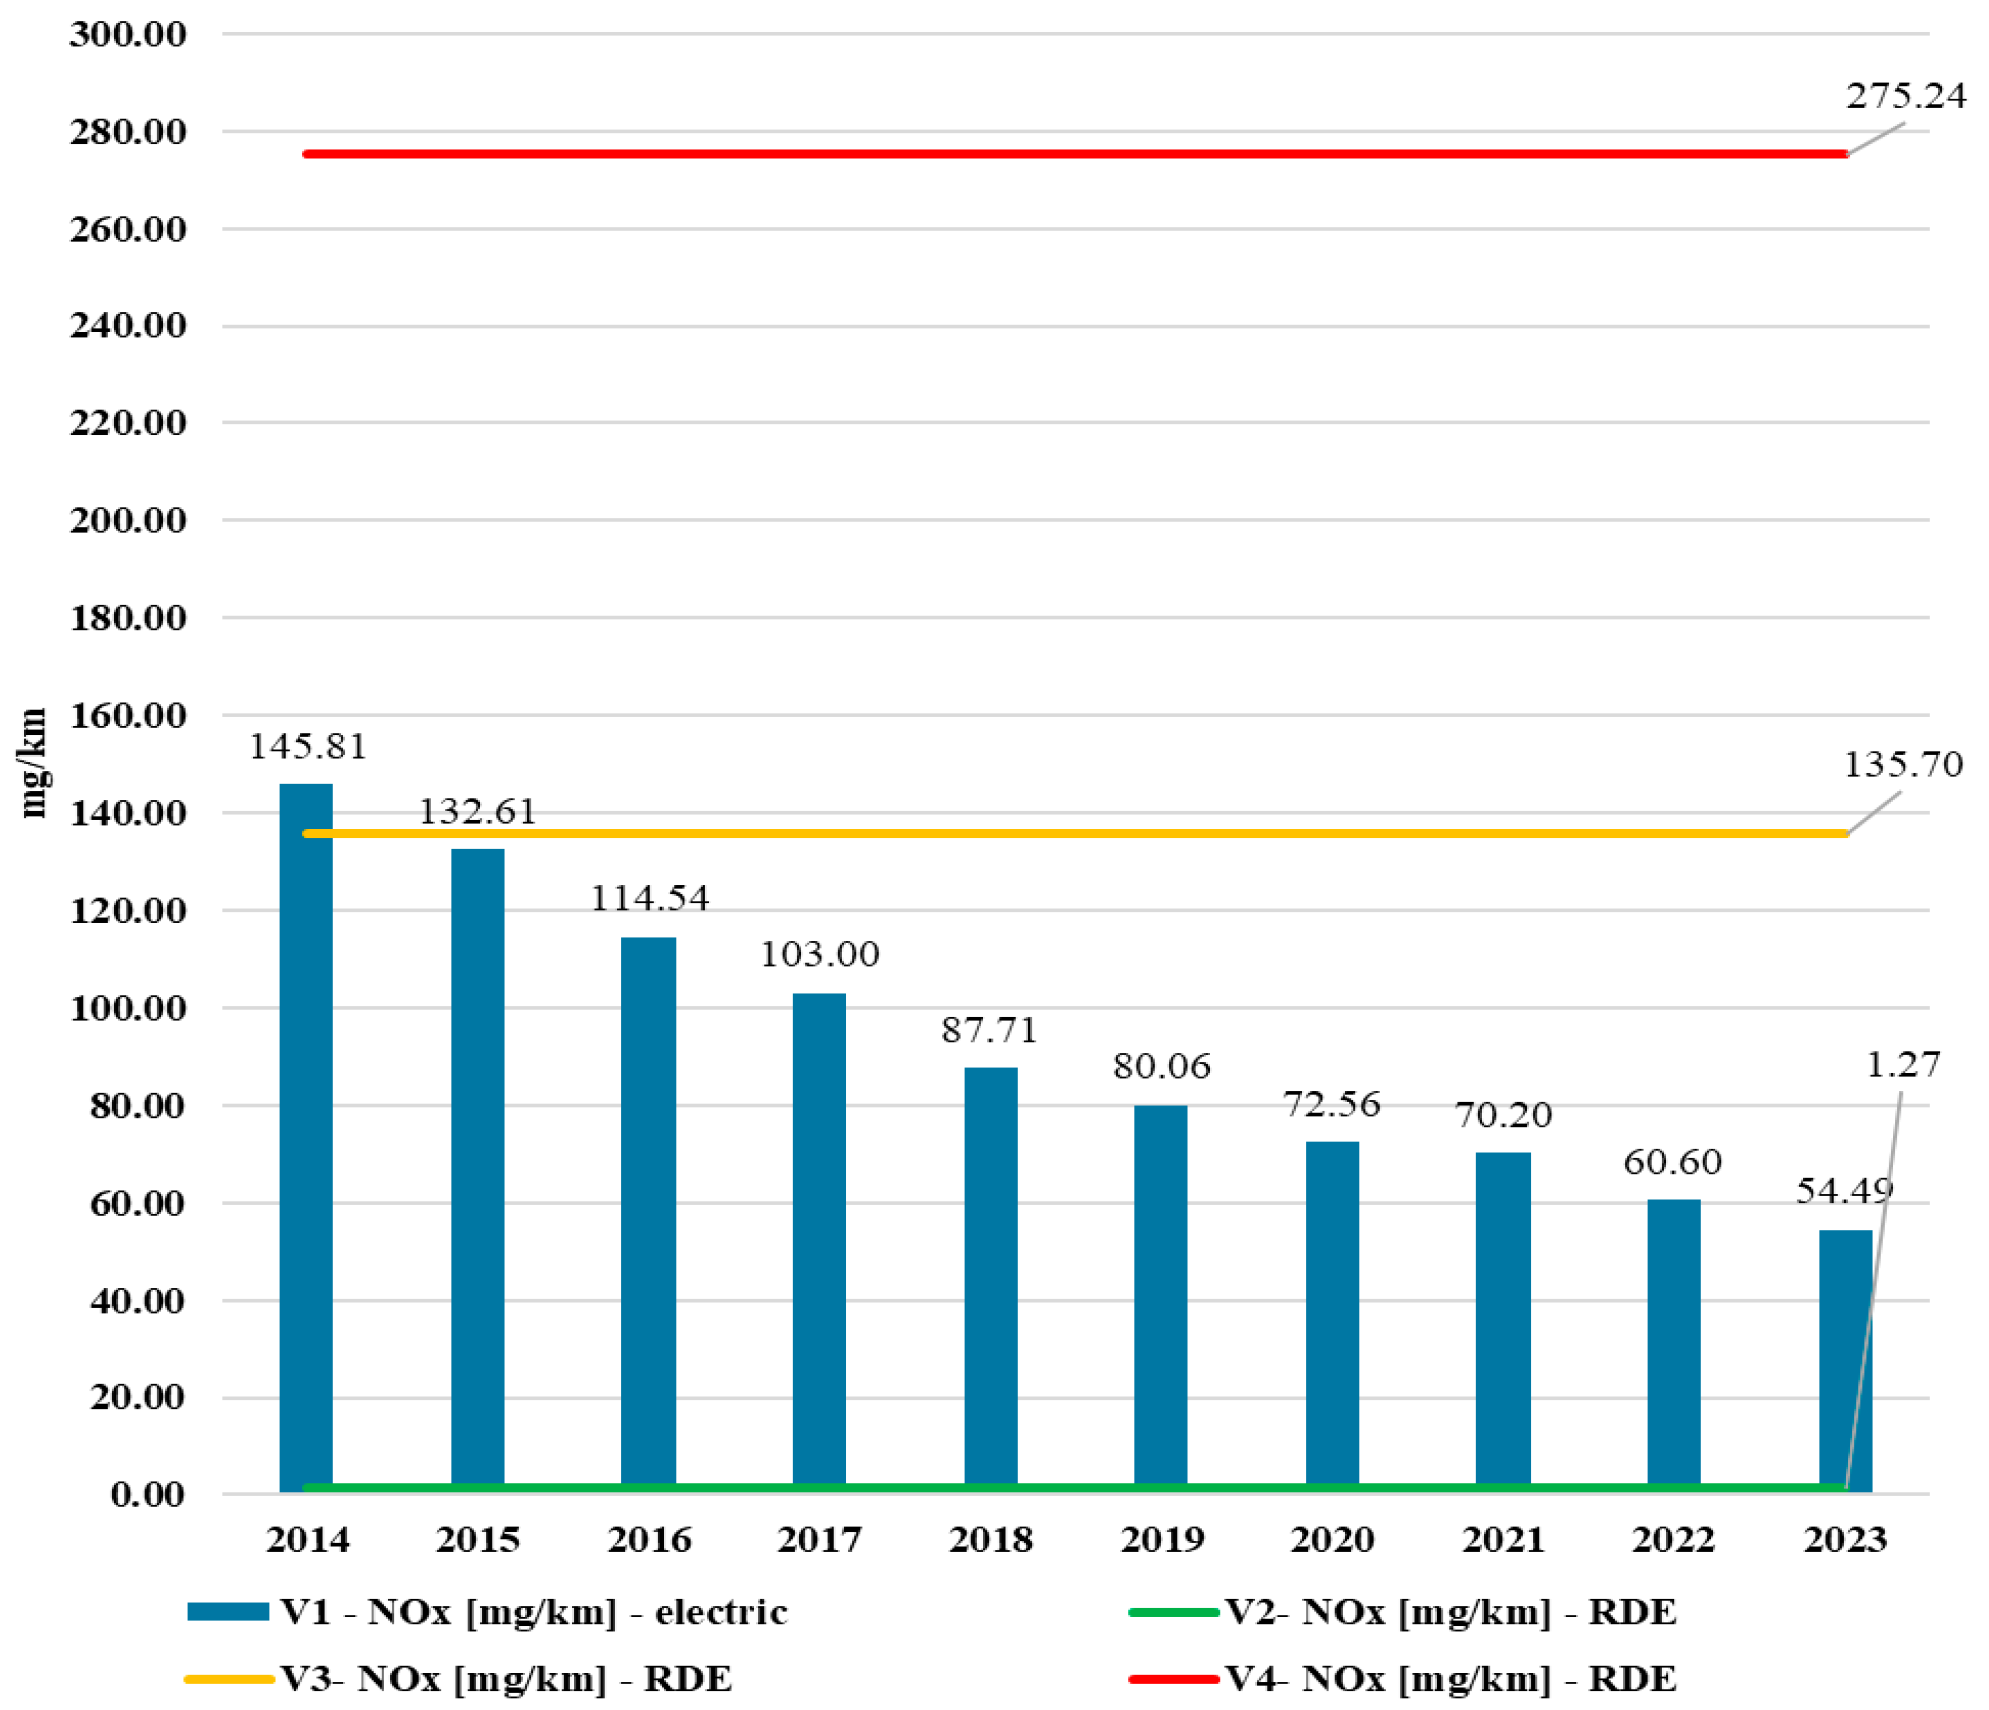
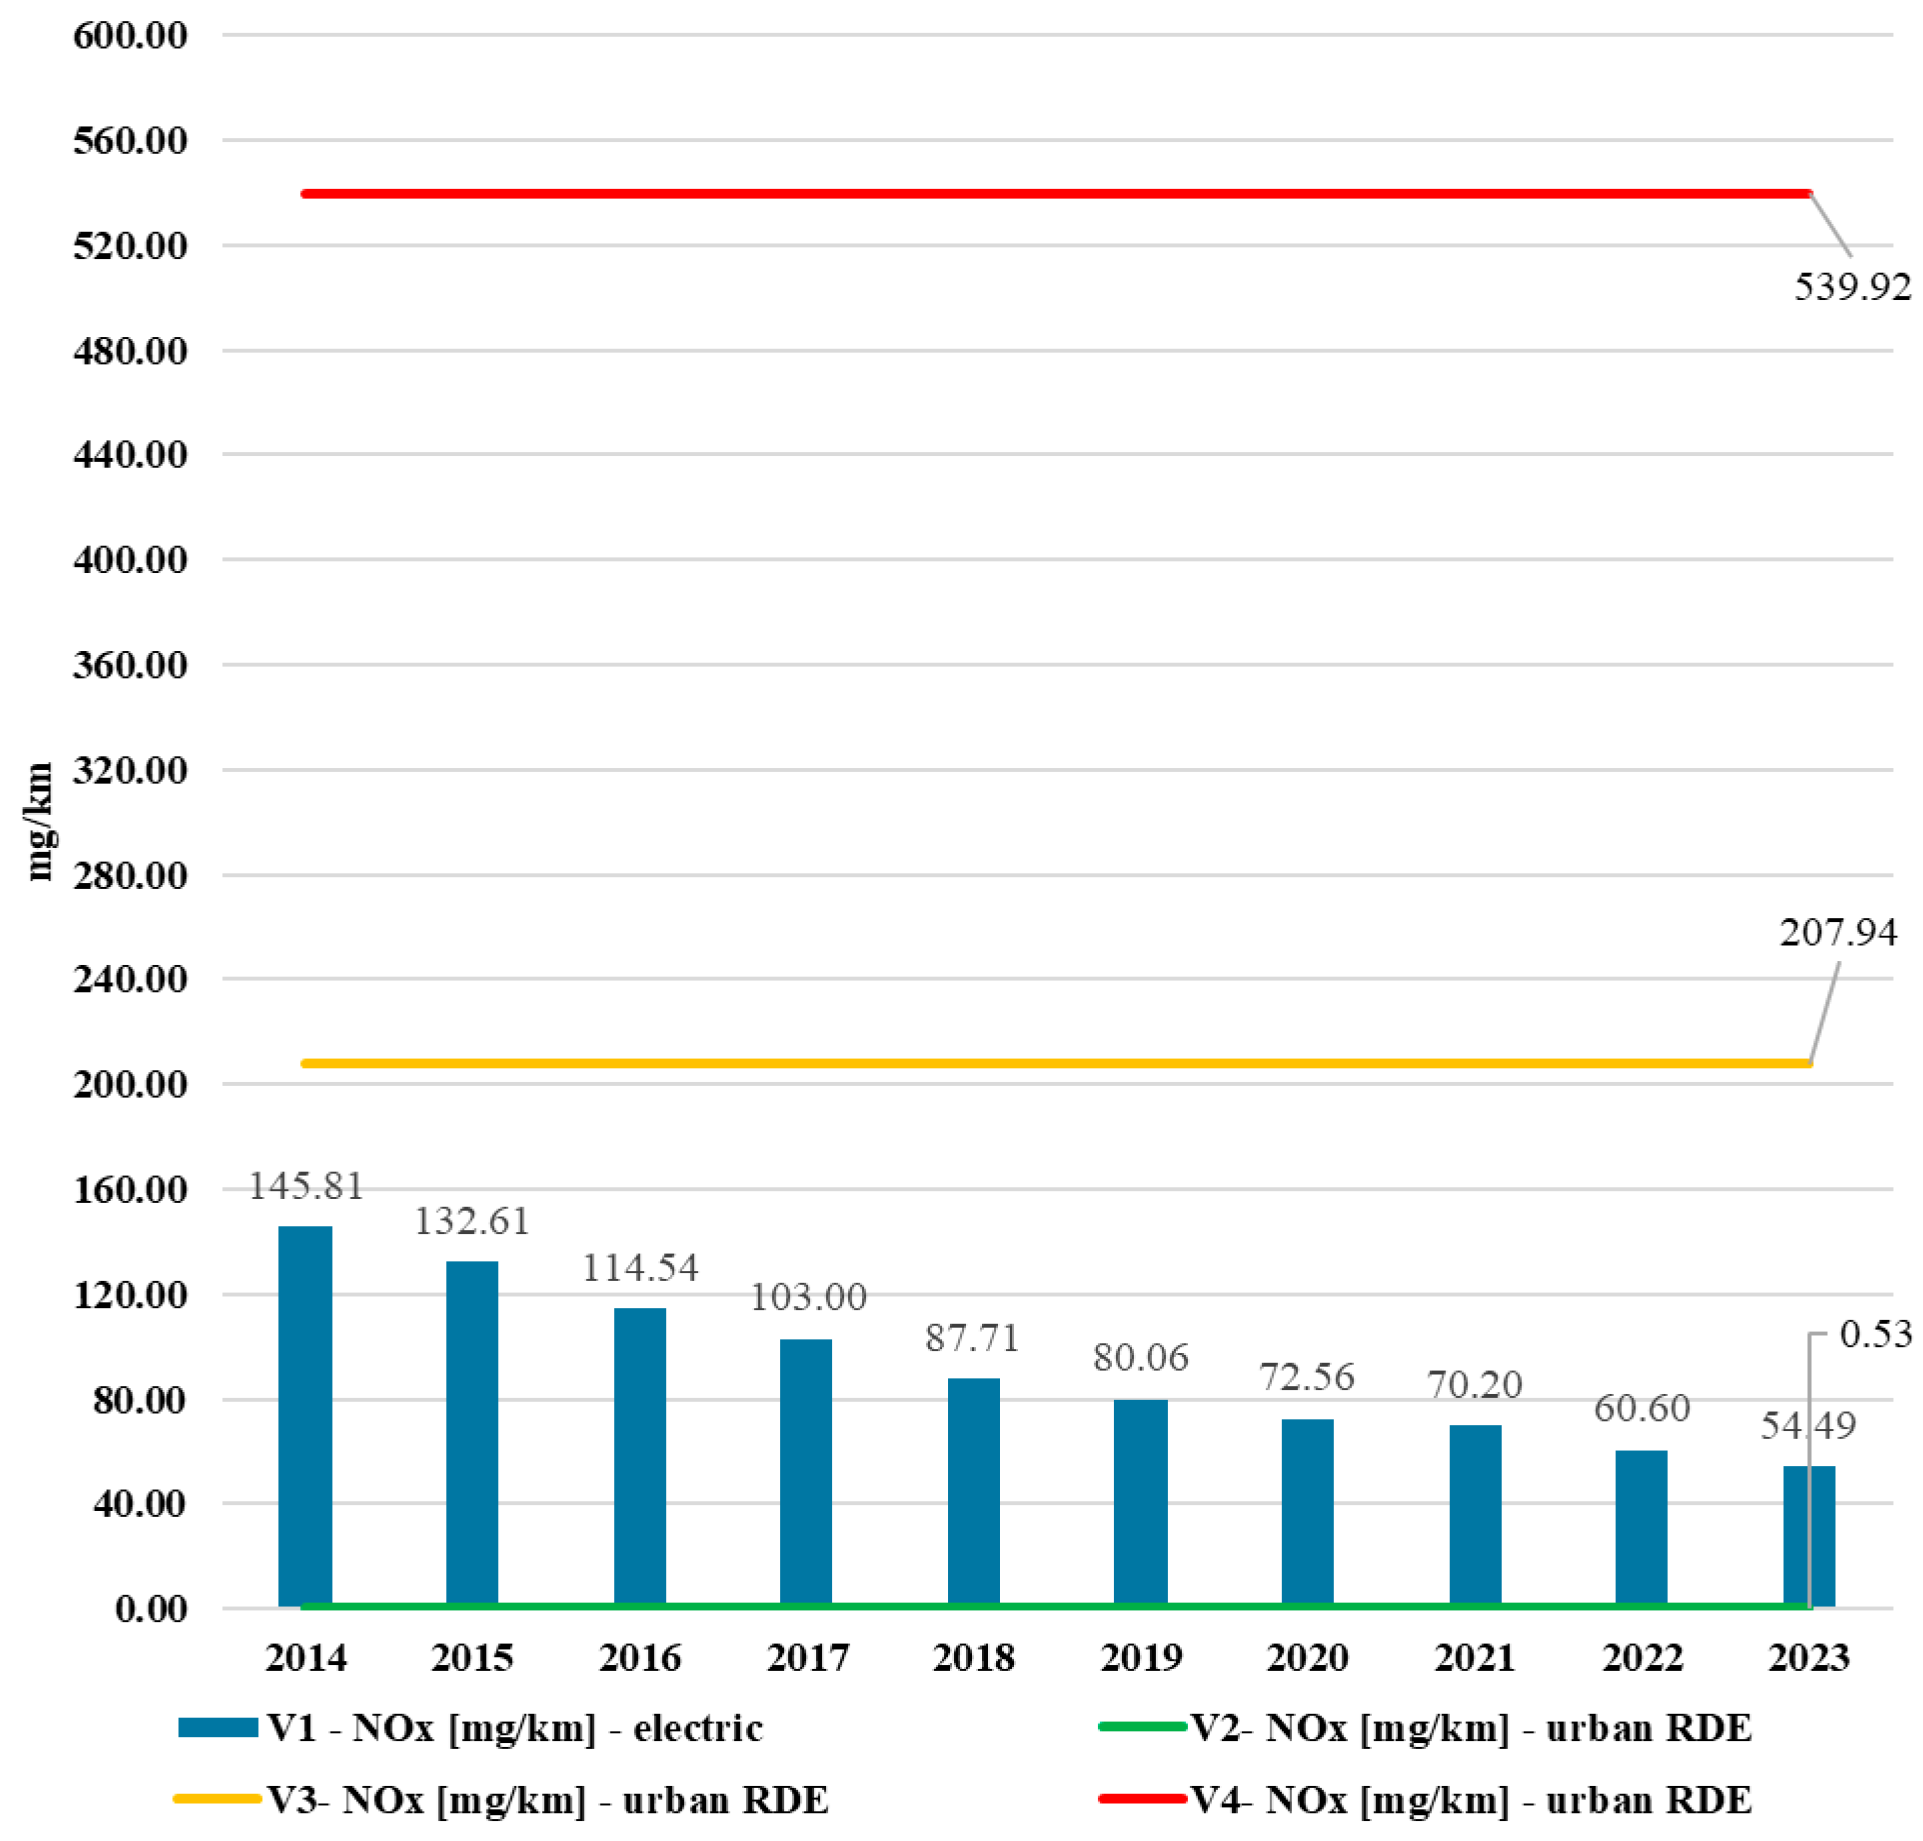
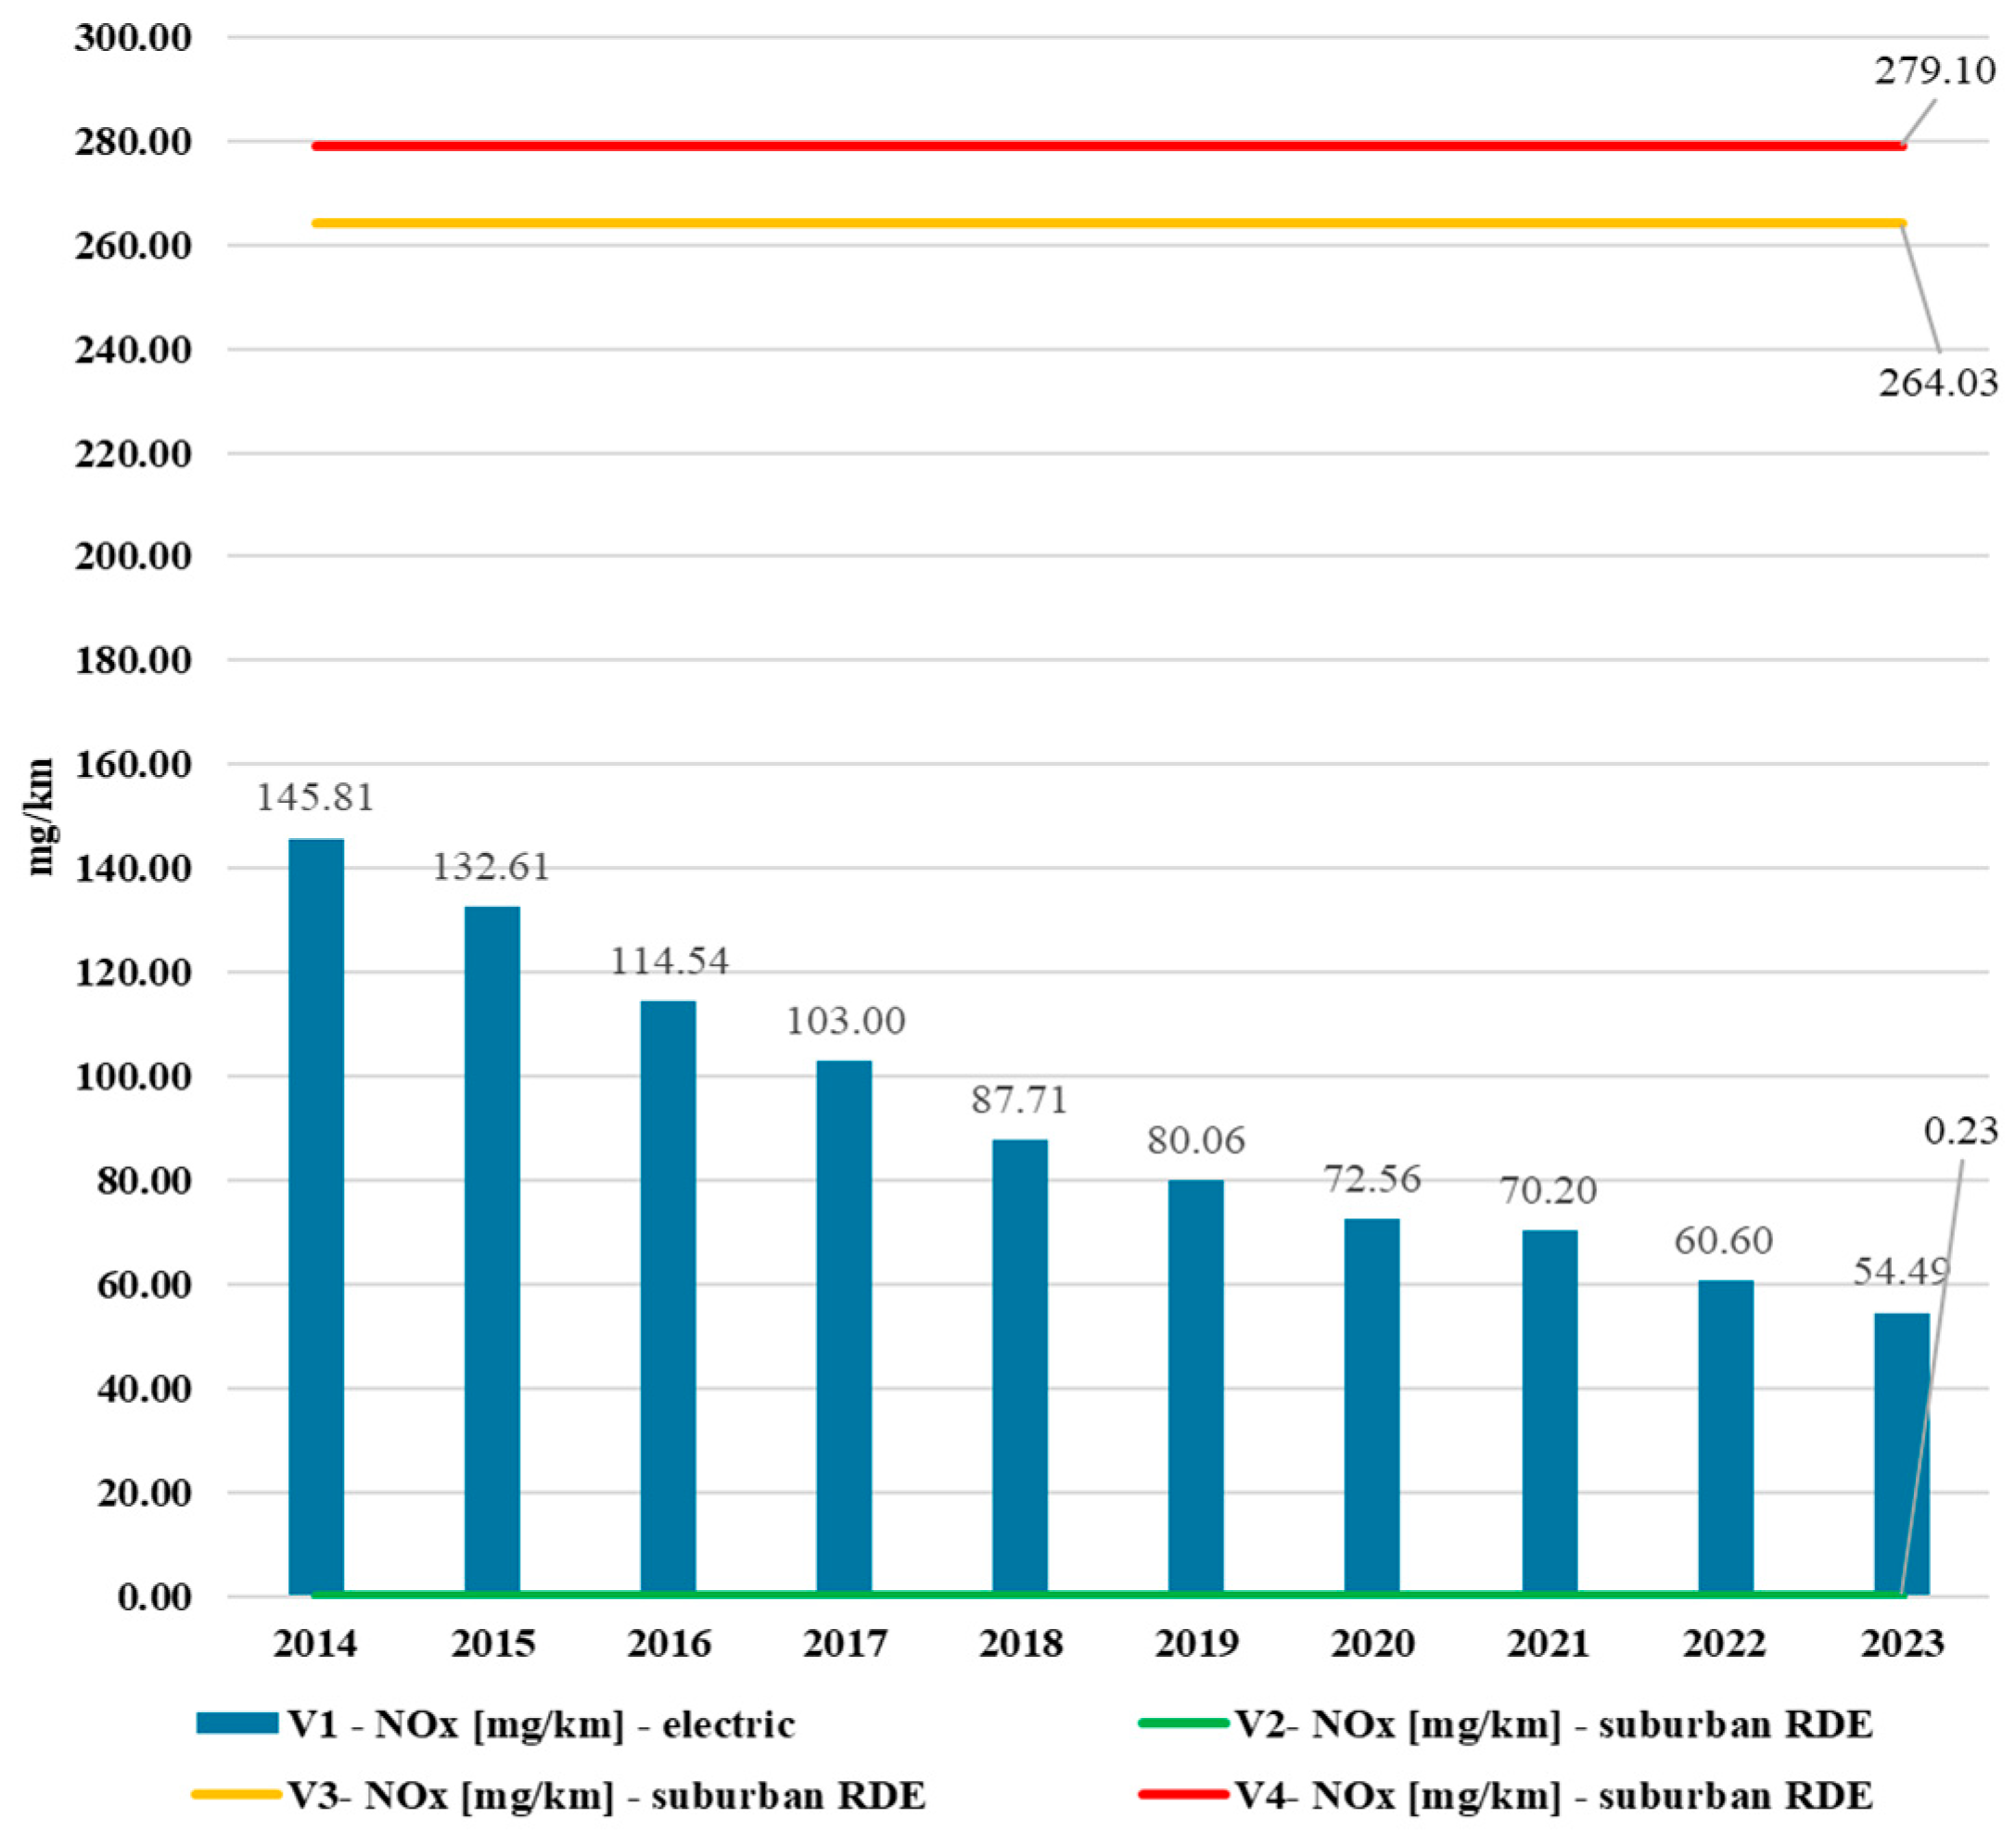
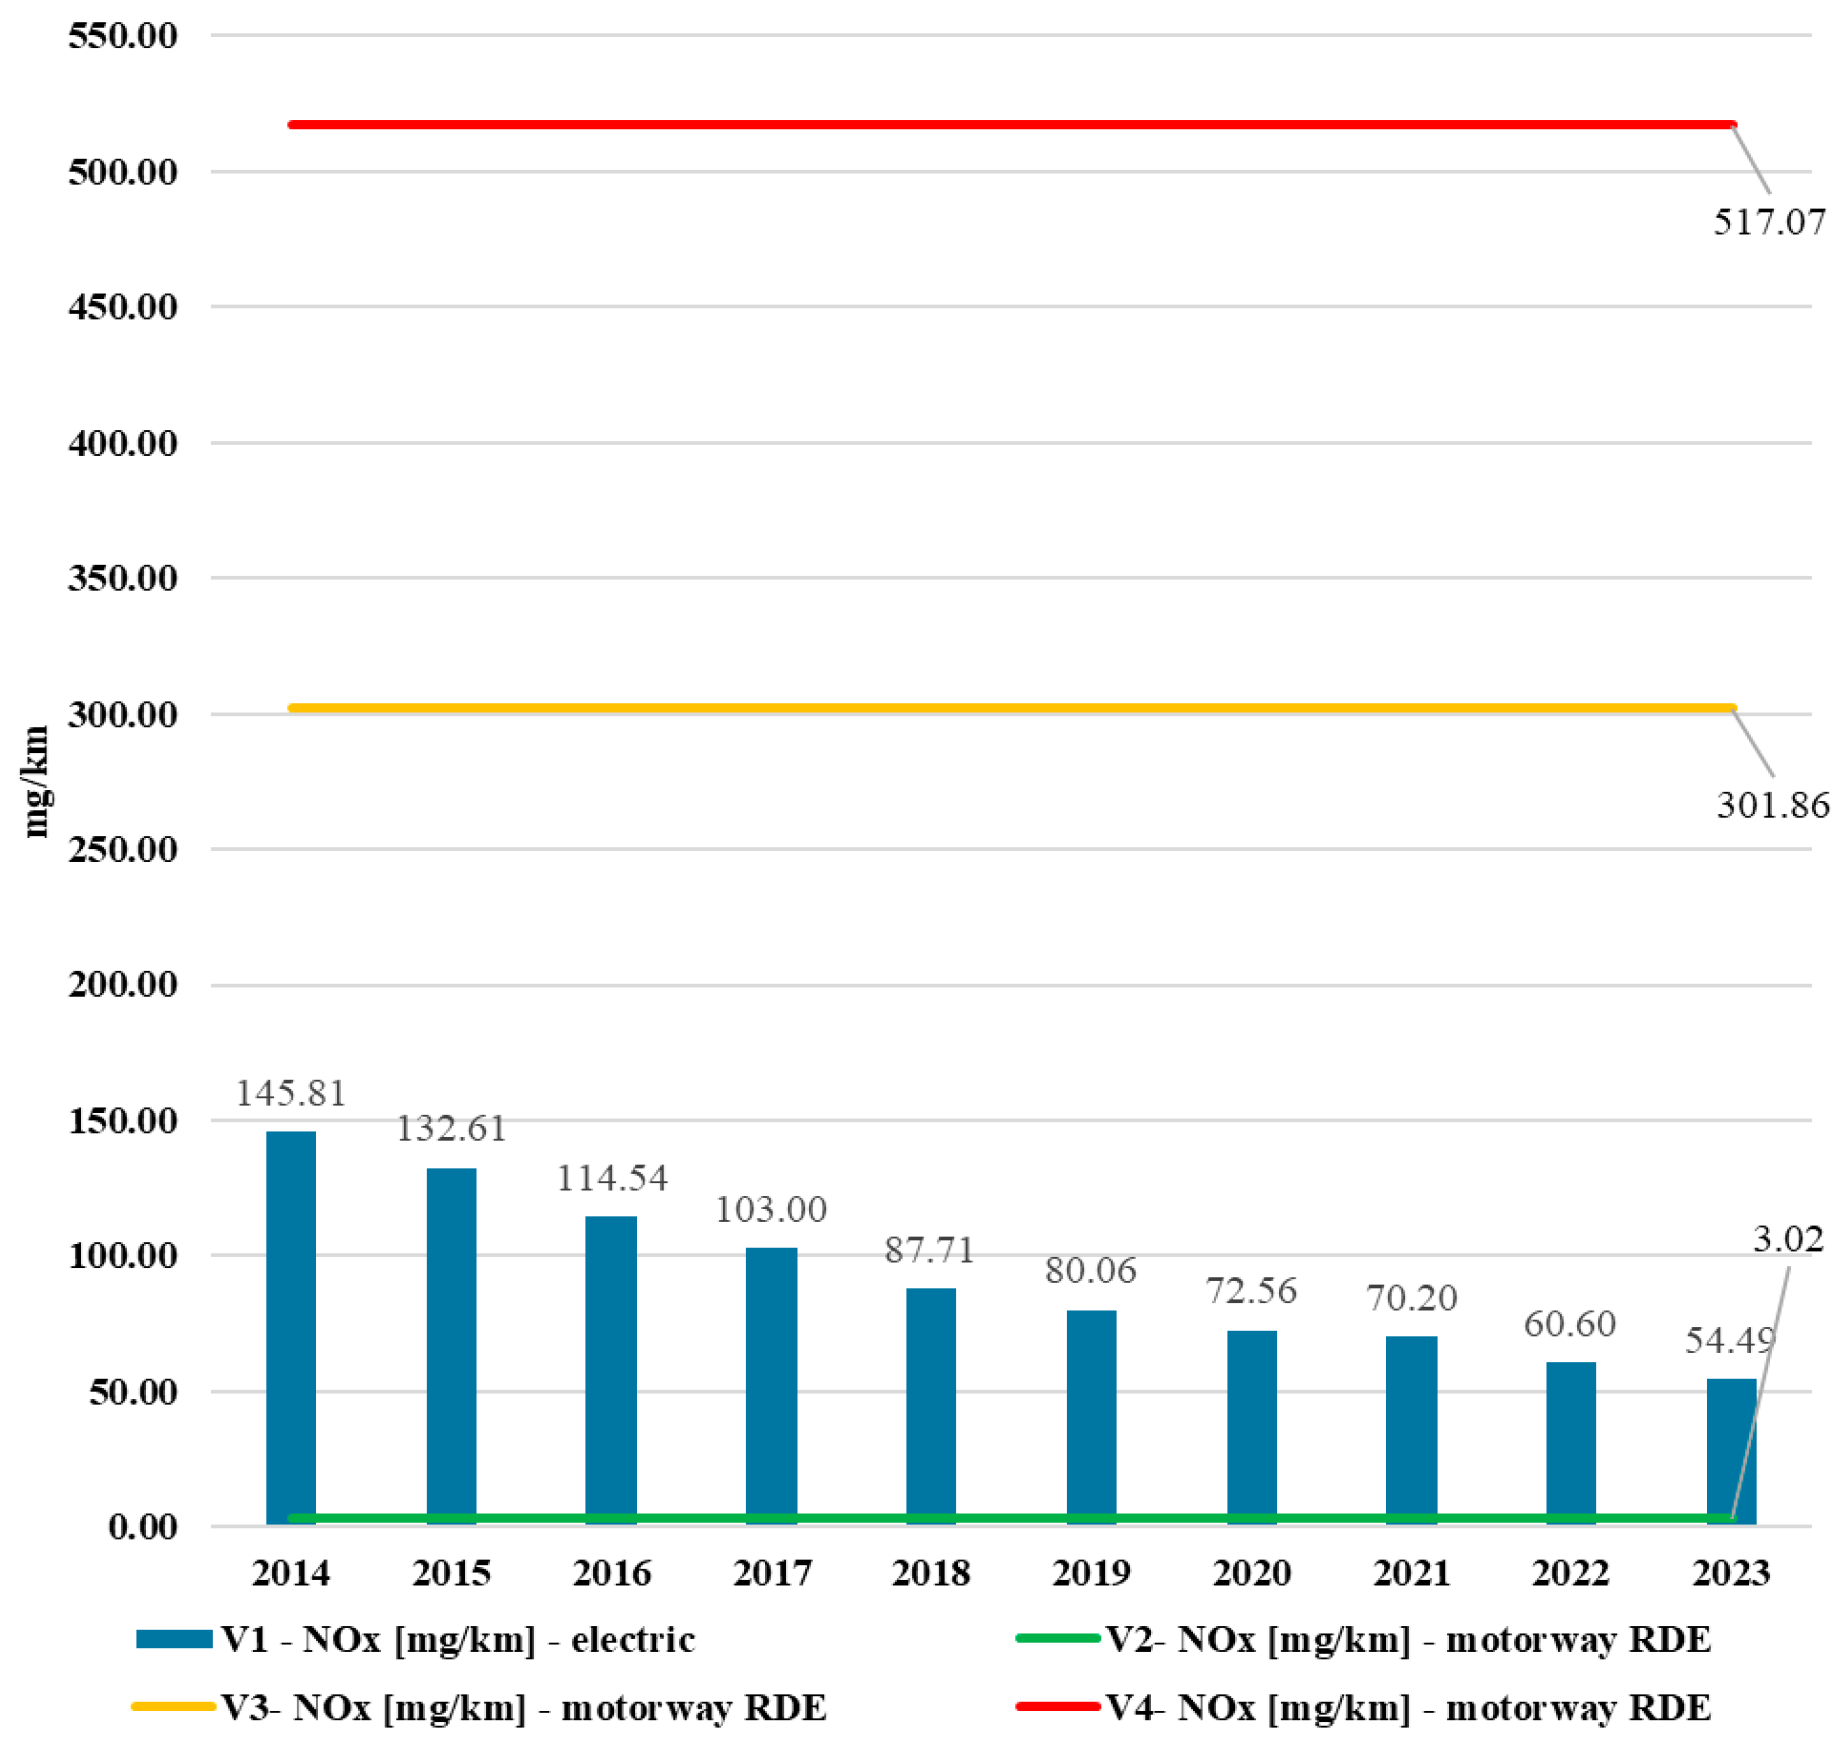
The lowest emissions in each phase of the RDEs test were achieved by vehicle V2 as a result of NO
X emissions testing. NO
X emissions for electric vehicle V1 were not the lowest in each phase of the RDEs test, as was the case for CO
2 emissions. Also of note in the RDEs tests’ cumulative value is the lower NO
X emissions of vehicle V3 relative to the NO
X emissions of vehicle V1 in 2014 and 2015, as well as the higher NO
X emissions in 2014 by nearly 43% for vehicle V3 in urban conditions. With the change in Poland’s energy mix, especially since 2016, NO
X emissions of vehicles V3 and V4 are clearly higher than of vehicle V1.
Figure 18,
Figure 19,
Figure 20 and
Figure 21 show the NO
X emissions for vehicles V1–V4. Due to the low NO
X values observed during the RDEs test for the V2 vehicle, references to the numerical NO
X emission values for the V2 have been added to
Figure 18,
Figure 19,
Figure 20 and
Figure 21 to improve the visualization of the obtained results.
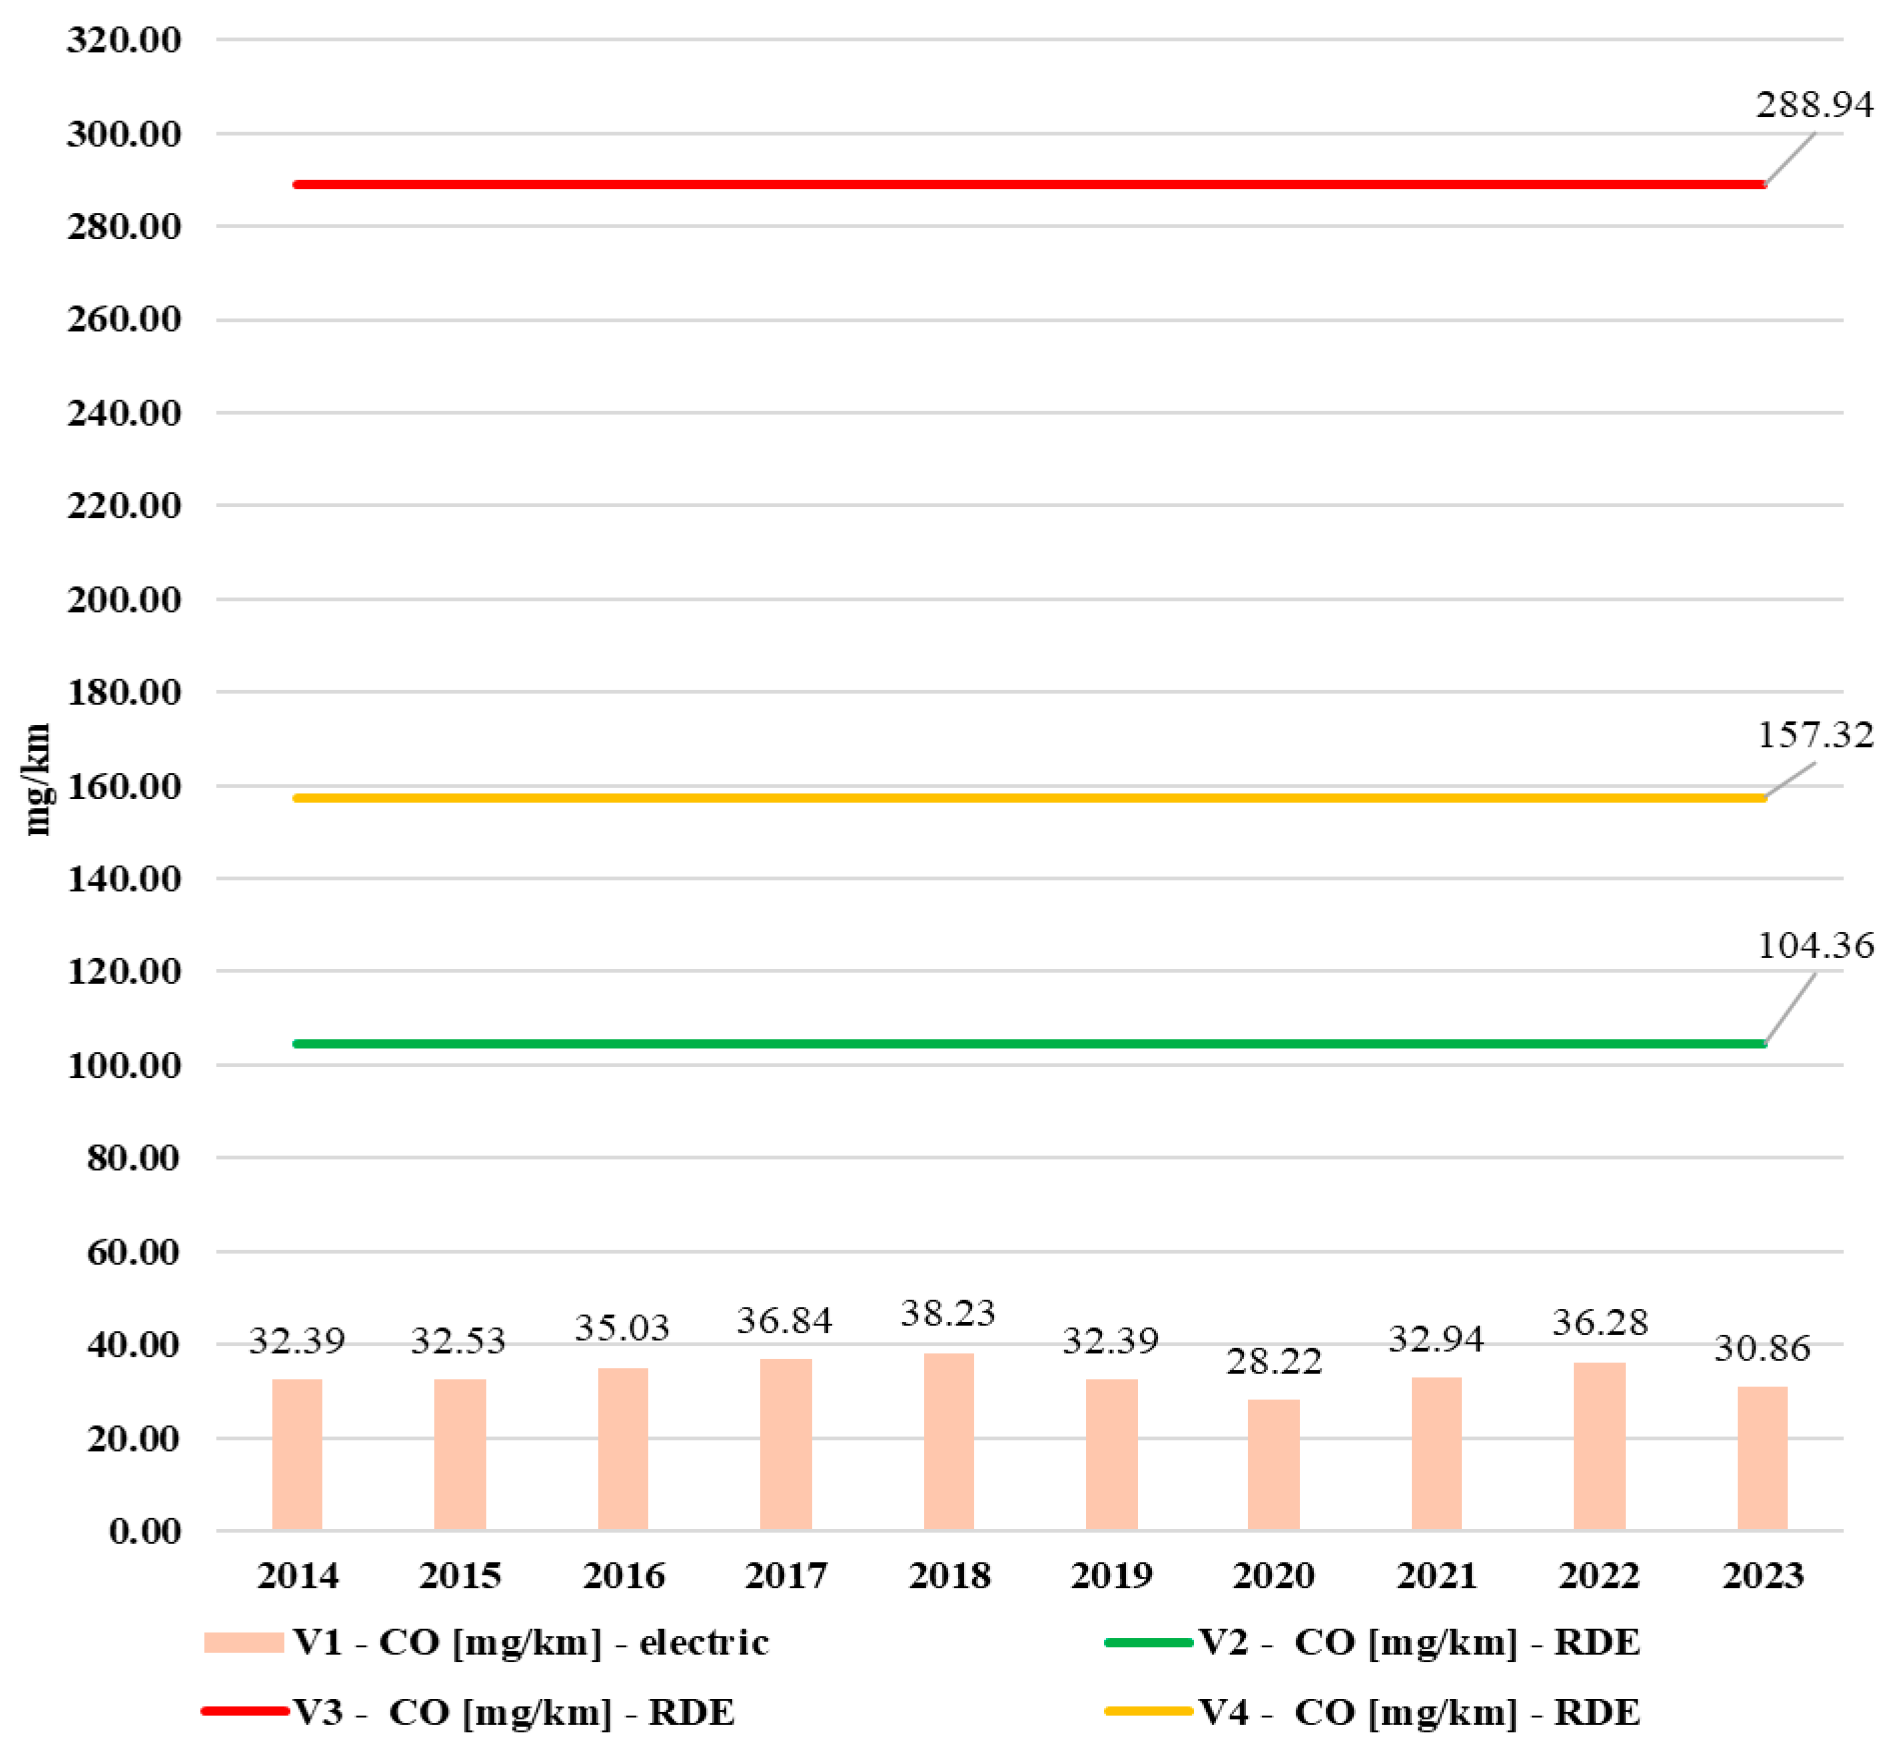
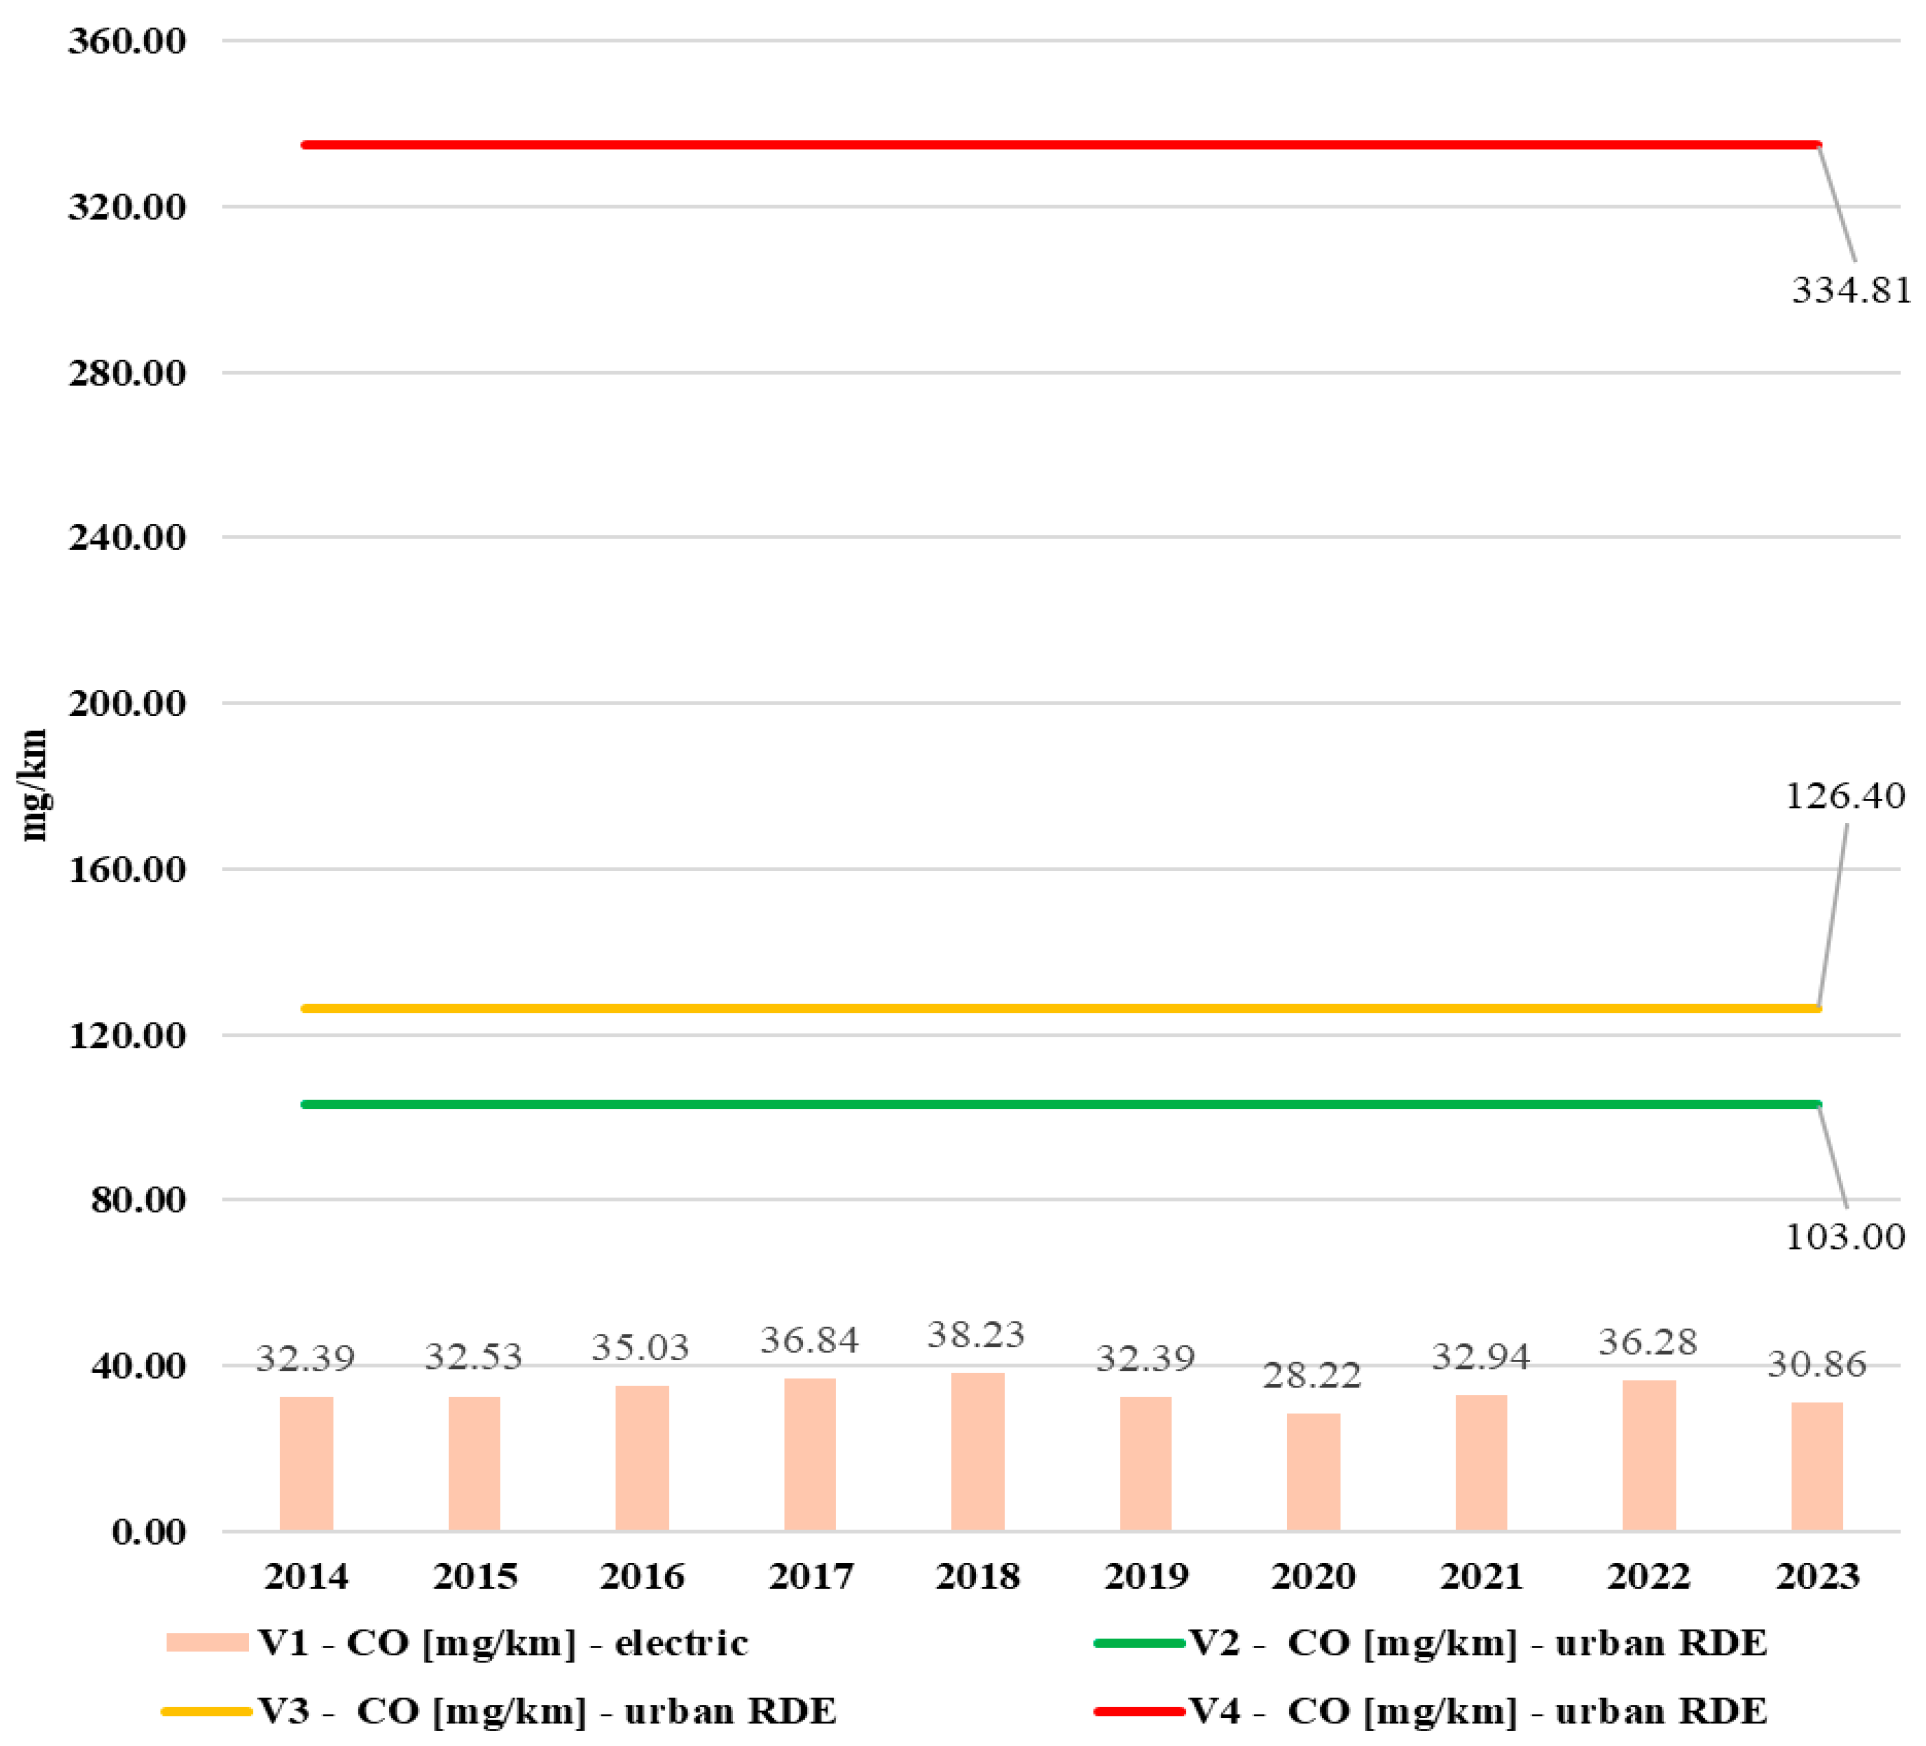
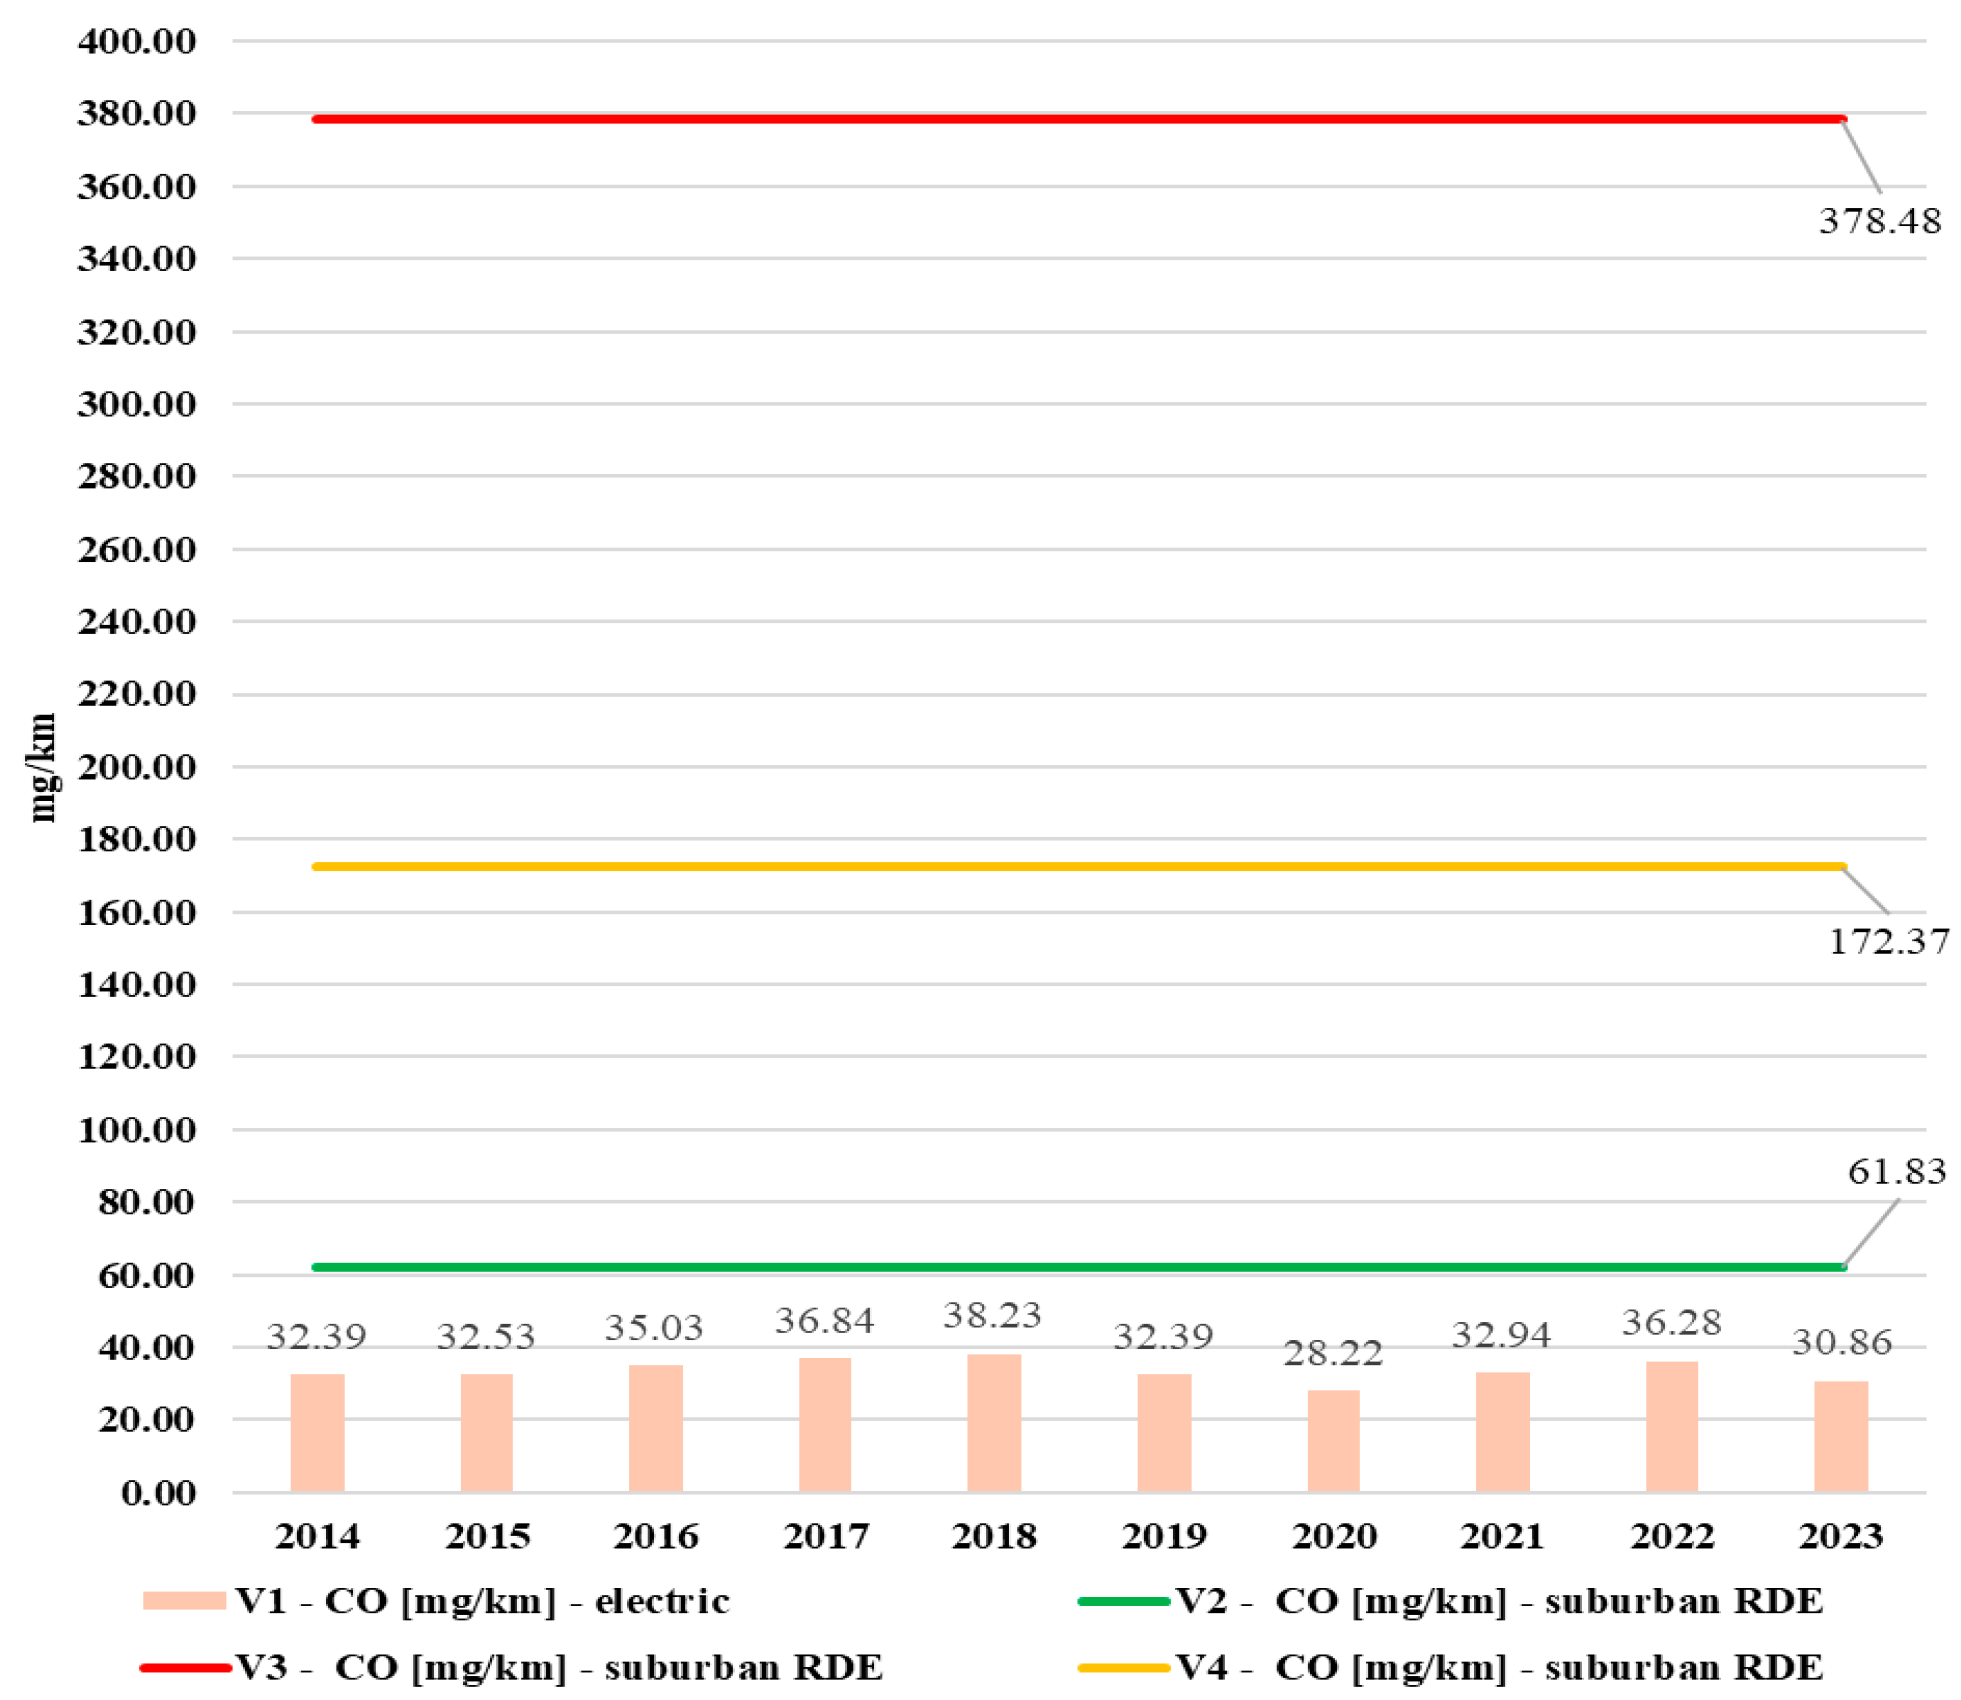
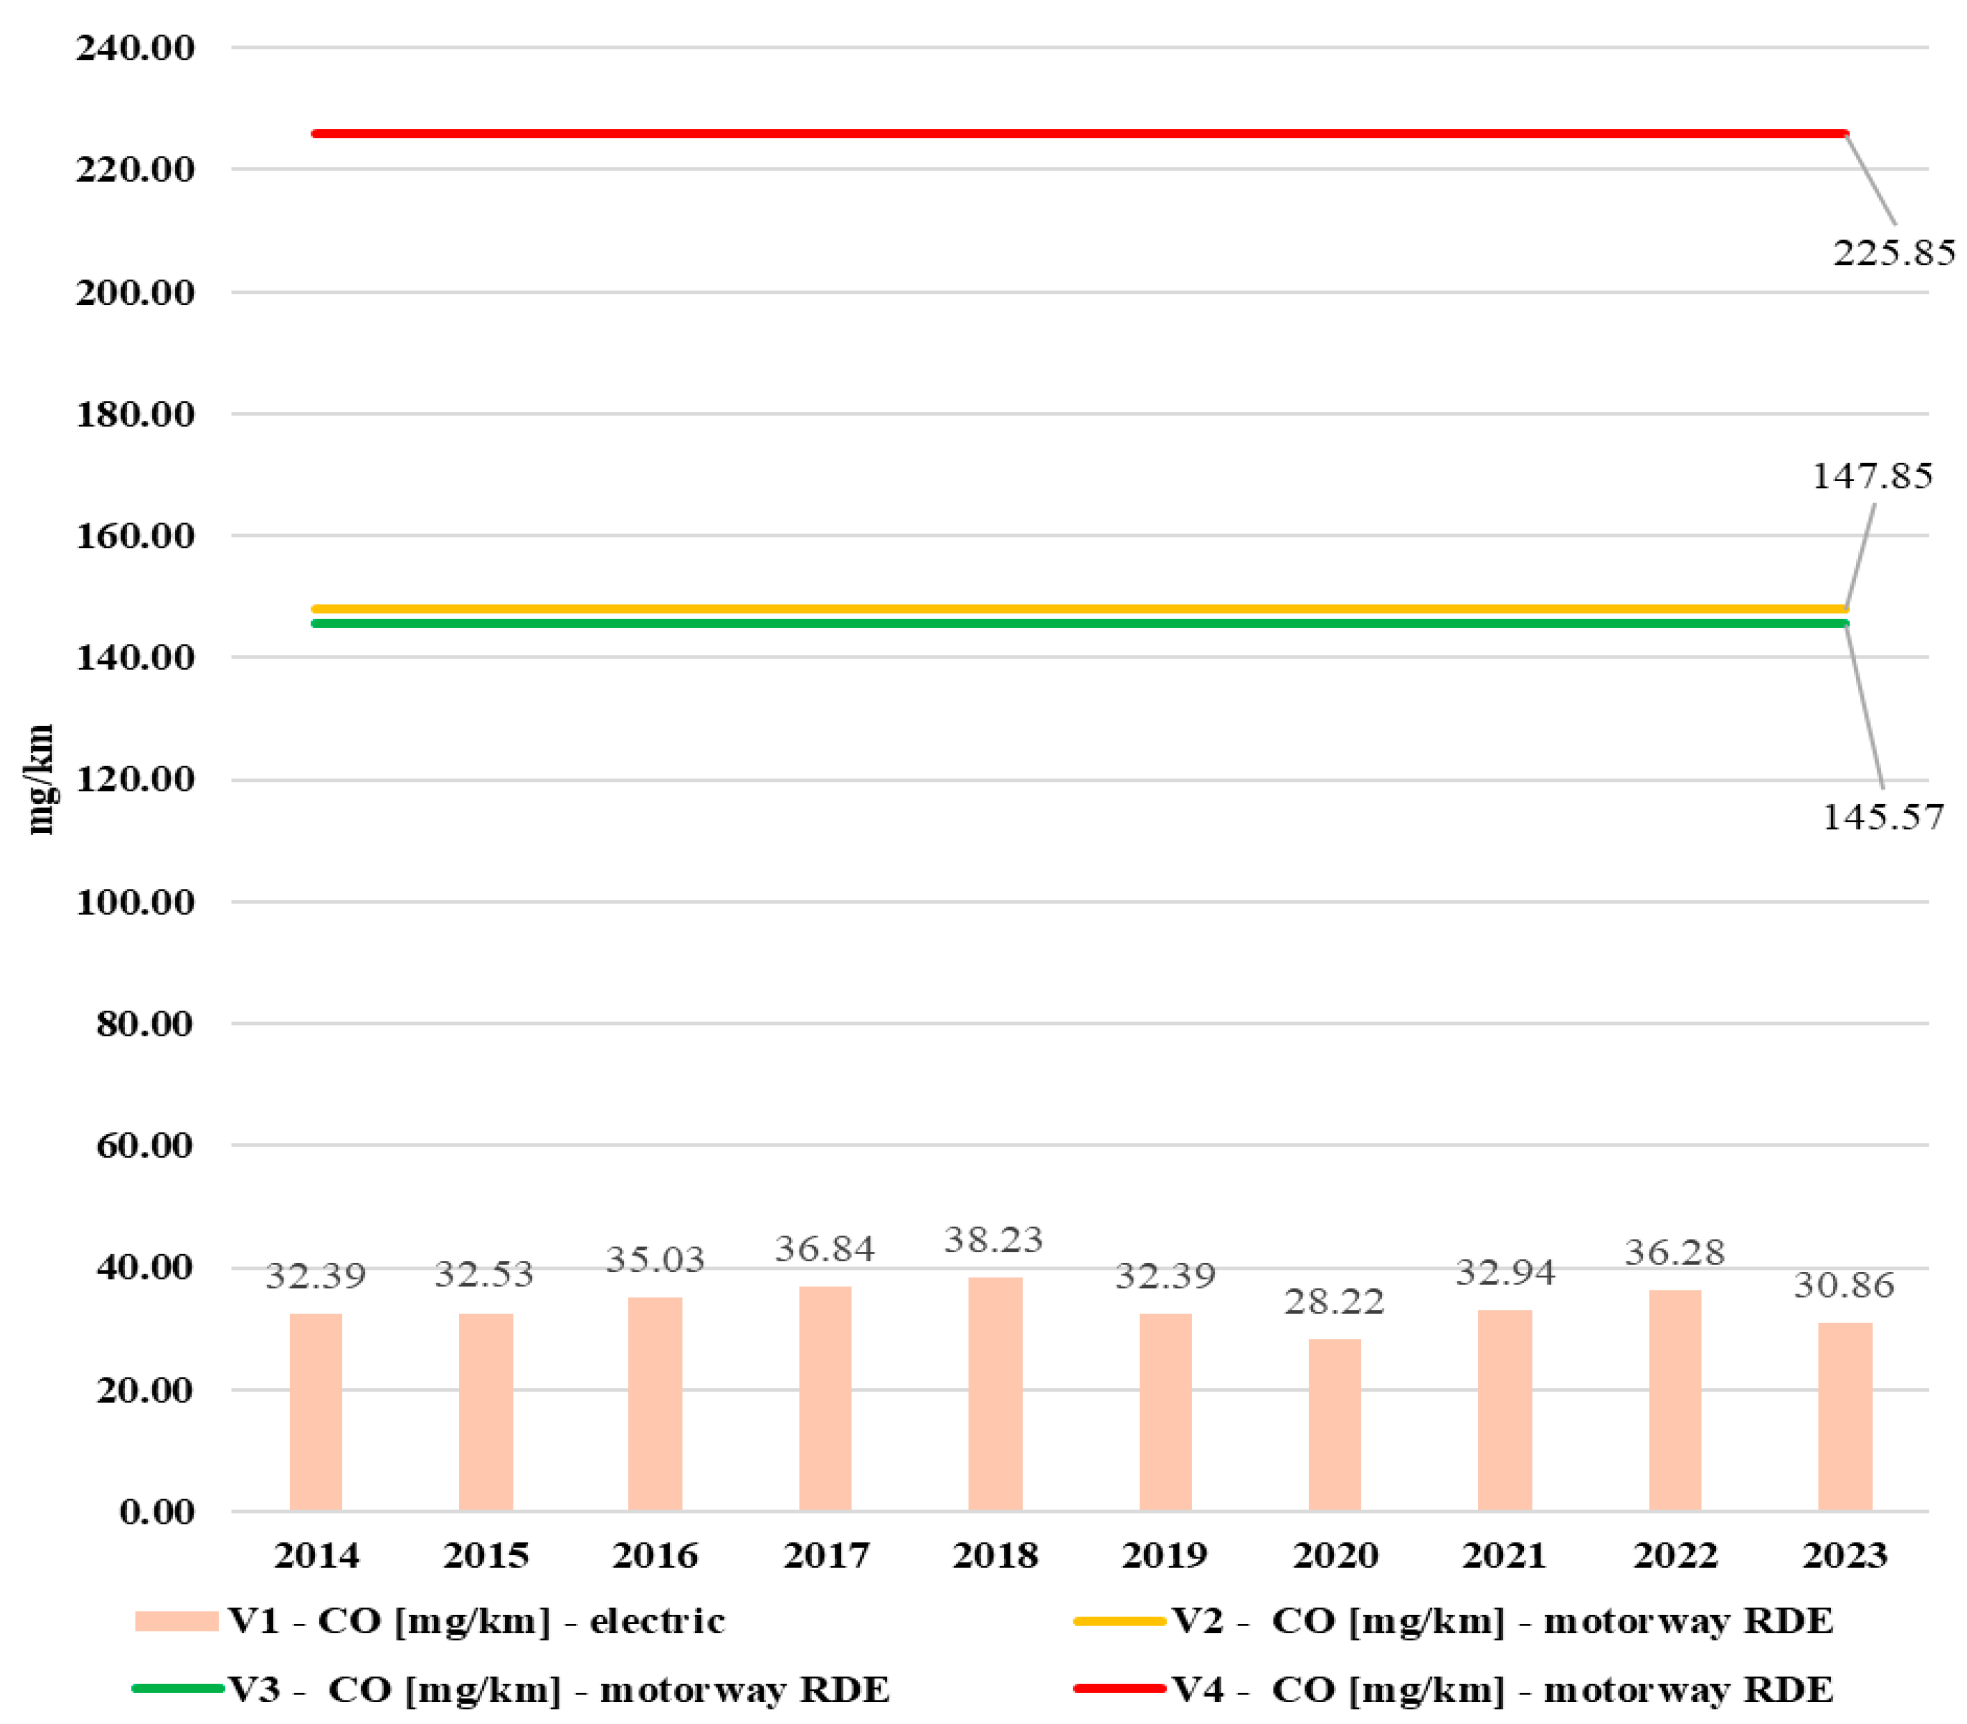
The CO emissions of vehicle V1 between 2014 and 2023 show no clear downward trend. The average CO value over the last decade for vehicle V1 was close to 22.5 mg/km. However, despite the lack of declining CO emissions for vehicle V1, it demonstrated the lowest emissions for each phase of the RDEs test. CO emissions for electric vehicle V1 were the lowest in each phase of the RDEs test, as was the case for CO
2 emissions. In the urban and suburban phases of the RDEs test, the emissions of vehicle V2 were higher than those of vehicle V1 in 2014 by nearly twice as much in the suburban test and nearly three times as much in the urban test. The other vehicles, i.e., V3 and V4, had significantly higher emissions than vehicle V1. CO emissions of vehicles V1, V2, and V3 were comparable in the early years of the past decade, as was the case for CO
2 and NO
X emissions. This was due to the dominance of fossil fuels in electricity production. The CO emissions production is shown in
Figure 22,
Figure 23,
Figure 24 and
Figure 25.
5. Discussion
As a result of the tests, the relationship of CO
2 and NO
X emissions to Poland’s energy mix between 2014 and 2023 was confirmed for vehicle V1. When analyzing CO
2 emissions in the urban area, which is key in terms of the negative impact of CO
2 emissions on the surroundings, vehicle V1 has the lowest emissions. The above results indicate that electric vehicles are a zero-emission solution at their place of use and a lower-emission solution in terms of electricity production relative to hybrid and conventional vehicles in Poland. With the share of renewable energy sources in electricity production in Poland at a minimum of 30%, which has been the case since 2019, significantly lower CO
2 emissions are observed for vehicle V1 relative to vehicles V2, V3, and V4. Of particular note is the result indicating higher CO
2 emissions for vehicle V1 relative to vehicle V2 between 2014 and 2019. The above indicates that hybrid vehicles are a clear alternative to electric vehicles when the electricity to power electric vehicles comes from more than 70% fossil sources. Authors of publications [
30,
31,
32] also present similar claims.
When analyzing NO
X emissions, it is noteworthy that vehicle V2 generates the lowest emissions in each test phase. The above once again indicates that hybrid vehicles are a clear alternative to electric vehicles which do not emit pollutants at the place of use but generate pollution at the fuel production stage. The authors of publication [
33] also report a similar finding. Also noteworthy in the RDEs test’s cumulative value are the lower NO
X emissions for the petrol vehicle relative to the NO
X emissions for the electric vehicle in 2014 and 2015. The above shows once again that, also with regard to NO
X, the 80% share of coal in electricity production makes it environmentally unjustified to develop electric vehicles on a larger scale. This statement is also confirmed by research published in publication [
34].
When analyzing CO emissions, it should be noted that there is no clear downward trend in CO emissions for electric vehicles. The average CO emissions over the last decade for electric vehicles has remained at a comparable level [
12,
35]. However, despite the lack of declining CO emissions over the last decade for electric vehicles, it was vehicle V1 that achieved the lowest emissions in each phase of the RDEs test. CO emissions for the electric vehicle were the lowest in each phase of the RDEs test, as was the case for CO
2 emissions. Measurements and subsequent calculations also confirmed the positive impact of the changing trend in electricity sources in Poland, even compared to research from 2017, in which electric vehicles in Poland were producers of significantly higher amounts of harmful emissions [
36].
Hybrid vehicles offer an alternative to conventional vehicles. They also represent an interesting transitional option in the search for solutions to achieve zero-emission transport. According to the results obtained, the future of transportation may lean towards electric vehicles, especially with ongoing research into high-energy-density batteries. Additionally, transitioning from traditional electricity generation methods to nuclear power and utilizing renewable energy sources can help mitigate the negative environmental impact of transportation. While these efforts could lead to a reduction in emissions, it is essential to recognize that electric vehicles should not be labeled as zero-emission vehicles. The use of electricity from renewable sources and the development of cleaner battery production processes should be promoted. Furthermore, the results suggest that incentivizing the development of modern infrastructure for electricity production from renewable and nuclear sources (cleaner production technologies) could play a key role in reducing the carbon footprint of electric vehicles.
6. Conclusions
Comparing air pollutant emissions generated by hybrid, conventional (internal combustion), and electric vehicles in the context of changing sources of electricity production in Poland is a complex issue which depends on a number of factors, including the energy mix, technical condition and mileage of vehicles, and the share of renewable energy sources in electricity production in Poland. Poland’s changing energy mix, with the share of RESs in electricity production reaching over 40% in 2023, is therefore particularly important. With the prospect of a planned shift away from coal in electricity production and an increased share of nuclear power and RESs, electric vehicles will have lower air pollutant emissions than conventional vehicles in the next decade, which is important, especially in urban areas. Hybrid vehicles can be an alternative to electric vehicles, especially in terms of lower NOX emissions, and significantly lower emissions of individual types of air pollutants relative to conventional vehicles. In the context of the results obtained, it can be concluded that hybrid vehicles represent a transitional technology in the context of the shift towards zero-emission public and private transport in the future. Meeting the targets set by the Green Deal in the context of zero-emission transport will be very difficult to achieve. This applies to passenger vehicles as well as trucks and coaches. However, this is necessary especially in urban areas. Nevertheless, the challenges of reducing air pollutant emissions require the transport industry to set realistic environmental targets. Various methods and models are used to determine air pollutant emissions from transport. We can expect electric vehicles to replace conventional vehicles eventually. However, it is important to note that electric vehicles are not as environmentally friendly as they are often portrayed. The European Union’s proposed timetable for replacing the conventional fleet with a low-carbon fleet seems overly ambitious given the shortage of EV charging infrastructure in Poland and problems with access to power, as well as Poland’s depleted power grid and line system. Modernizing Poland’s energy system will be key to achieving the EU’s climate goals. Operating and charging electric vehicles with renewable energy sources reduces their overall emissions, while charging with fossil fuels can result in higher emissions than internal combustion engine vehicles. The environmental objectives for transport in the EU are forcing cities and larger regions to take initiatives to designate clean transport zones by banning vehicles that do not meet certain emission standards. This represents a legislative attempt to drive the oldest vehicles out of the market. However, the lack of measure harmonization creates numerous difficulties for private users and businesses. In order to accelerate the transformation processes in transport in terms of the uptake of low-emission vehicles, the construction of a minimum charging stations grid for private consumers and businesses along major European routes should be accelerated. Exposure to air pollution from road transport is a health hazard and can result in a range of negative health effects. Living in an area of vehicle emissions is associated with an increased risk of respiratory disease, cardiovascular disease, nervous system disease, diabetes, and premature death, among others. For this reason, the monitoring of air pollutants specific to road transport using remote sensing techniques in the immediate vicinity of traffic routes, among others, appears to be necessary in order to carry out detailed measurements of air pollutant emissions, taking into account the varying structure of vehicles used on the roads.
