Article

Coordination of Multiple BESS Units in a Low-Voltage Distribution Network Using Leader–Follower and Leaderless Control

by
Margarita Kitso
,
Bagas Ihsan Priambodo
,
Joel Alpízar-Castillo
*,
Laura Ramírez-Elizondo
and
Pavol Bauer
DC Systems, Energy Conversion and Storage, Delft University of Technology, 2628 CD Delft, The Netherlands
*
Author to whom correspondence should be addressed.
Energies 2025, 18(17), 4566; https://doi.org/10.3390/en18174566
Submission received: 27 July 2025 / Revised: 24 August 2025 / Accepted: 26 August 2025 / Published: 28 August 2025

Abstract

High shares of photovoltaic energy in low-voltage distribution systems lead to voltage limit violations. Deploying energy storage systems in the network can compensate for the mismatch between the generation and the consumption; nevertheless, the mismatch is unevenly distributed throughout the network, suggesting aggregated control strategies as a solution. This paper proposes two coordination control strategies of batteries to address network overvoltage conditions caused by high penetration of photovoltaic systems. The leader–follower coordination strategy determines a battery’s utilization factor by using the node closest to a voltage violation as a reference. The leaderless control uses a shared utilization factor to avoid excessive usage of a particular agent in the network. We tested both approaches in the 18-node CIGRE network for scenarios when not all agents were available and when they had different starting states-of-charge. Our results demonstrate that both strategies are capable of voltage control; however, the leader–follower control leads to uneven storage usage, ultimately leading to short-time failure to comply with the voltage limits under extreme conditions where neighbouring agents must compensate for the unavailable one. Conversely, the leaderless approach presents more balanced use of the agents thanks to the distributed utilization factor, resulting in a more robust control strategy.

1. Introduction

One of the primary goals set by European countries in the EU Energy Roadmap 2050 and COP28 climate change conference is to achieve carbon-neutral energy production by 2050. According to the IEA, renewable energy capacity is expected to increase by 60% as of 2026 when compared to renewable energy capacity installed in 2020. Solar power is a renewable energy source that has grown in popularity over the years [1]. From 2019 to 2020, the installed capacity worldwide increased by 18% [2]. Globally, an increase of 9% is expected every year for photovoltaic (PV) installations until 2050 [3]. However, the stochastic nature of power generation using renewable energy sources affects grid stability.
The mismatch between local generation and consumption leads to overvoltage when the supply is greater than the demand [4,5]. This issue was studied in [6], demonstrating that uncontrolled distributed renewable energy sources (DRES) within low-voltage distribution networks compromise voltage stability, especially as the distance from the connection to the substation increases. In these nodes, power injection from the DRES into the grid increases voltage, ultimately leading to reverse current flows. Battery energy storage systems (BESS) are accepted by the literature as a solution to reduce the amount of power injected into the grid, thereby compensating for power imbalance [7]. Although geographical proximity of the nodes would produce similar DRES generation profiles, the number of nodes in a residential network and the different load behaviours of users requires coordinated BESS control to minimize the DRES effect on the grid.

1.1. Relevant Literature

The use of energy storage to compensate for the effects of the energy transition has been widely studied in the literature from different perspectives. On the one hand, many researchers have focused on the optimal sizing and location of assets. For instance, [8] used the H2-norm and Kron reduction to simplify a modified version of the IEEE 39-bus system into 13-bus system. This allowed for optimal size and allocation of the BESS, permitting transient frequency support through virtual inertia using Matlab/Simulink. The result was a 77.1 % reduction in the pressure on the generators. However, the inclusion of DRES includes disturbances and uncertainties which represent a challenge for their method. An optimal planning method was proposed by [9] to consider economic and reliability objectives, and was tested in the IEEE 34-node network. The results showed enhanced capacity to absorb distributed PV generation; however, the authors mentioned that existing market conditions create a challenge for enterprise investments in such projects. Similarly, ref. [10] examined the potential of BESS to mitigate transmission network congestion in order to increase the deployment of DRES projects in South Wales. They used the flow decomposition technique to determine the optimal sizes and locations and used DIgSILENT PowerFactory 2024 to model the transmission network for 2024 and 2030. The results suggested that cost of deploying BESS sized and located using the method proposed can reduce the cost of line reinforcement by 38% to 63%. However, the cost–benefit analysis used a simplified model focused on representative peak days; thus, a more complex market analysis is required.
Similar conclusions were obtained by [11,12]. The former studied the optimal placement of shared BESS in urban energy communities considering economic, technical, and environmental performances, resulting in an increase of self-sufficiency rates by up to 17.44% and reducing peak loads by up to 37.19% using a real case study scenario of 191 buildings in Seoul, South Korea. However, the study lacked economic viability and negative net present values. The latter study investigated the use of small-scale BESS in energy-intensive cities in order to maximize electricity self-sufficiency rate while minimizing the grid import from the network and maximizing the net present value. The study achieved good results for the first two objectives, but failed to create an attractive business case. Despite the optimistic results of the previous works in technical terms, actual implementation of such strategies faces a number of roadblocks apart from th load and DRES generation uncertainty, including the need for a framework to allow DSOs their own storage assets, attractive markets for investment and participation, and availability of connections and physical space in the selected nodes.
Other works have focused on the optimal usage of available BESS units distributed throughout the network as response to the challenges of optimal sizing and allocation face. A centralized control for multiple BESS units was implemented in [13], which required information on the voltage imbalance and state of charge ( S o C ) of the batteries at every node. The control was tested in a radial distribution feeder with different starting S o C and phase conditions. Despite showing some success, the method showed unfeasible solutions and slow response. Furthermore, its implementation required a robust communication channel to control and monitor each storage device, making network expansion projects more complex. Although some works, such as [14], have shown good results in off-grid conditions, works such as [15,16] encounter similar challenges as [13] in grid-tied mode, confirming the unsuitability of centralized controllers for DRES-rich distribution networks.
In [17], a droop-based active power curtailment technique was implemented to prevent overvoltage in radial LV feeders. In [18], real-time controllers were used for zonal control, with multiple agents used to communicate between zones. a Fuzzy logic controller was proposed in [19] to control the voltage at every bus. The work in [20] evaluated an adaptive control strategy for a PV-rich network. The authors simulated in a real Australian medium-voltage feeder using smart meter data from the low-voltage network. In [21], a model predictive control approach was detailed using adaptive virtual impedance. The recent literature on electric vehicle (EV) charging stations has focused on using decentralized control [22,23,24]. In this context, decentralized control provides a robust approach to ensure EV charge while minimizing the impact on the grid under high uncertainty conditions and without the need for complex communication infrastructure.
Distributed control is considered more efficient when it comes to the coordination of multiple static storage units. In distributed control, each storage unit of the system is considered an agent, and these agents communicate together. In [25], a method was implemented for secondary frequency response in a real distribution network. The work in [26] used distributed control to provide frequency regulation in low-inertial power systems with high penetration of DRES. In [27], a nonlinear state-of-charge balancing strategy was proposed for voltage regulation. A consensus algorithm was used in [28] as part of a hierarchical framework to manage DRES for frequency control. In [29], a similar algorithm was used to control the frequency and voltage at the common coupling point of multiple BESS units. Similarly, [30] proposed an algorithm to balance S o C using distributed estimators for the average desired power and unit S o C . In [31], distributed control was used to synchronize flexibility providers within a network using BESS. The work in [32] reduced active power usage from the BESS by utilizing reactive power; however, this approach does not provide a way to balance battery utilization, i.e., some batteries will be used more often than others, particularly in distribution networks with evenly distributed topologies.
One common challenge found in most of the literature is scalability due to the complex observability and controllability of numerous assets in larger distribution networks [33,34], especially for centralized systems. For distributed control strategies, the burden of information exchange is influenced by the number of neighbours but is independent of the number of control points in the distribution network. In addition, the majority of works focus on medium- and high-voltage networks, in which voltage stability is often achieved by reactive power compensation [35], leaving the dominantly resistive low-voltage distribution networks outside their scope. In particular, control algorithms based on consensus algorithms aim to agree on the power value the batteries supply; thus, all batteries should contribute the same amount to achieve voltage regulation. However, this means that batteries are not operating efficiently, as they will absorb or produce more power than is needed [26,27].

1.2. Contributions

Based on the literature review, we identified the following research gaps, which are summarized in Table 1:
  • Many works focus on optimal sizing and placing of energy storage systems instead of using available resources; however, most DSOs cannot own energy storage assets due to regulation limitations.
  • Most of aggregation strategies in the literature focus on medium- and high-voltage networks; however, low-voltage networks are particularly critical for the energy transition. They do not have ancillary services providers to support the DSO, and the demand increase caused by heating electrification and electric mobility can potentially cause major voltage challenges. In addition, existing control strategies focus on reactive power-based voltage control. This is because the reactive component in the impedance is dominant in medium- and high-voltage networks, whereas low-voltage networks have mostly resistive line impedances.
  • Existing aggregation strategies require full observability of all assets; in real implementations, this would require complex communication infrastructure and controls, leading to scalability bottlenecks.
In this work, we propose and compare two different distributed control strategies, focusing on low-voltage distribution networks. Both strategies use the consensus algorithm to control BESS units located in a low-voltage distribution network to provide voltage regulation services without requiring all the storage units in the system to collaborate equally. Curtailing PV output to adjust the node power exchange was not considered in this work. In the context of this paper, these strategies refer to the coordination of multiple BESS units in providing or absorbing power in the distribution network in order to prevent voltage deviations outside a particular limit (in our case, ±0.05 power units). The first strategy uses a leader–follower approach for the agents’ power dispatch. The second is a leaderless strategy in which the agents are only required to communicate with their immediate neighbours. We tested methods in overvoltage and undervoltage conditions, different initial S o C conditions, and when not all the agents were available to participate. In this way, the contributions of both methods are as follows:
  • A scalable control strategy that reaches consensus when voltage is regulated within the limits; thus, the algorithm is terminated as soon as voltage is regulated as opposed to when all batteries agree on the same amount of power contribution to the system,
  • The S o C of each battery is controlled locally; when the limit of the S o C is reached, the battery is instantly disconnected. Neighbouring batteries contribute the same amount of power that the battery would contribute if it were available until the battery becomes available for use again. This allows multiple BESS units to be balanced while respecting their SoC constraints.
  • An approach that provides less communication requirements compared to traditional distributed control implementations, as each agent only shares information with its neighbours, thereby reducing the infrastructure requirements and simplifying data privacy management.

2. Consensus Algorithm

In this work, BESS units coordinated in a distributed manner can be analyzed as a multi-agent system (MAS). From this perspective, BESS units are agents which can exchange information with their neighbours. This information exchange can take place in either a unidirectional or bidirectional way. Furthermore, the links by which the agents communicate can be represented as a graph. Such a graph comprises a set of vertices, representing the agents, and a set of edges, representing the communication links in the MAS. This graph can be written in the form of G = ( V , E ) , where V indicates a set of vertices and E denotes a set of edges [36]. Furthermore, ref. [36] demonstrated that for a multi-agent system consisting of n agents, the corresponding graph will be in the form of G = ( V , E ) , where V = 1, 2, 3, ..., n and E V × V . An edge represented as (i,j) E means that agent j has a relationship with agent i, i.e., both agents have access to each other’s information [36]. In our case, the only shared information is the utilization factor, for which the calculation is described in Section 5.1 and Section 4.1 for the leader–follower and leaderless control strategies, respectively. In addition, this means that agent i is a neighbour of agent j.
To describe the number of neighbours that each agent has in a graph, a degree matrix D ( G ) is used. A degree matrix is represented as a diagonal matrix with a size of V × V , where V is the number of vertices in a graph (the agents). The degree matrix of this graph follows the general form shown below.
D G = d 1 , 1 0 0 0 d 2 , 2 0 0 0 0 0 d i , j
The values assigned to elements d i , j (where j = i ) are the number of neighbours of agent i. Another important component in the graph is its adjacency matrix. The adjacency matrix of the graph, denoted as A ( G ) = [ a i , j ] , describes which agents are neighbours. Similar to the degree matrix, the adjacency matrix also has a size of V × V . In general, the following rules apply to the elements of the adjacency matrix ( a i , j ).
a i , j = a i , j = 1 , if agent i and j are connected and i j 0 , Otherwise
This rule means that if agents i and j are neighbours, then a value of 1 is assigned to both (element row i, column j) and to (row j, column i) in the matrix. The last important component of a graph is its Laplacian matrix. The general form of a Laplacian matrix is provided by
L G = D G A G .
A consensus algorithm aims to reach a state consensus among the agents. When consensus is reached, the state difference between neighbouring agents is zero. In the context of power-sharing between multiple BESS units, consensus is reached when all units have the same utilization factor, i.e., the ratio between the injected or discharged power and the rated power of a BESS unit.
To demonstrate consensus effect, let x i ( k ) be the decision variable with node index i at timestep t, with x j ( k ) as the decision vector of an adjacent (neighbour) node indexed by j. The rate of change of x ˙ i ( t ) is the difference between decision variables at node ( i , x i ( t ) ) and neighbour node x j ( t ) multiplied by the adjacency indicator a i , j , as seen in (3):
x ˙ i ( t ) = j N i a i , j x j ( t ) x i ( t ) .
If there are multiple neighbours, then the difference is summed to the number of neighbours N i . Furthermore, if x i ( t = 0 ) and x j ( t = 0 ) are initialized with arbitrary values and updated by going forward in time until t while applying (3), then x i ( k ) and x j ( k ) will reach a same final value x * , which is a constant. The proof is provided in [37]
Moreover, if the communication network is a balanced graph (i.e., the vertices have a similar number of edges), then an average consensus condition [37] will be reached in which the final value is the average of all initial states at time instant t. This can be written as
x * = i x i ( t = 0 ) n .
Because this work involves discrete simulation, the discrete form of (3) is used, which is provided by
x i ( k + 1 ) = x i ( k ) + ϵ j N i a i , j [ x j ( k ) x i ( k ) ] .
In (5), k indicates the k-th step in the simulation, the parameter ϵ indicates the consensus step size, and a ij is the element of the adjacency matrix, which indicates the communication link between agent i and agent j. If there is a connection between agent i and agent j, then a ij = 1; otherwise, a ij = zero.
By applying the consensus algorithm in (3) to a graph, the global dynamics of the system are provided by
x ˙ = L x .
Examples of global dynamics when using consensus algorithms in the form of (6) have been discussed in prior works such as [38,39]; thus, they are omitted here.

3. CIGRE LV Network

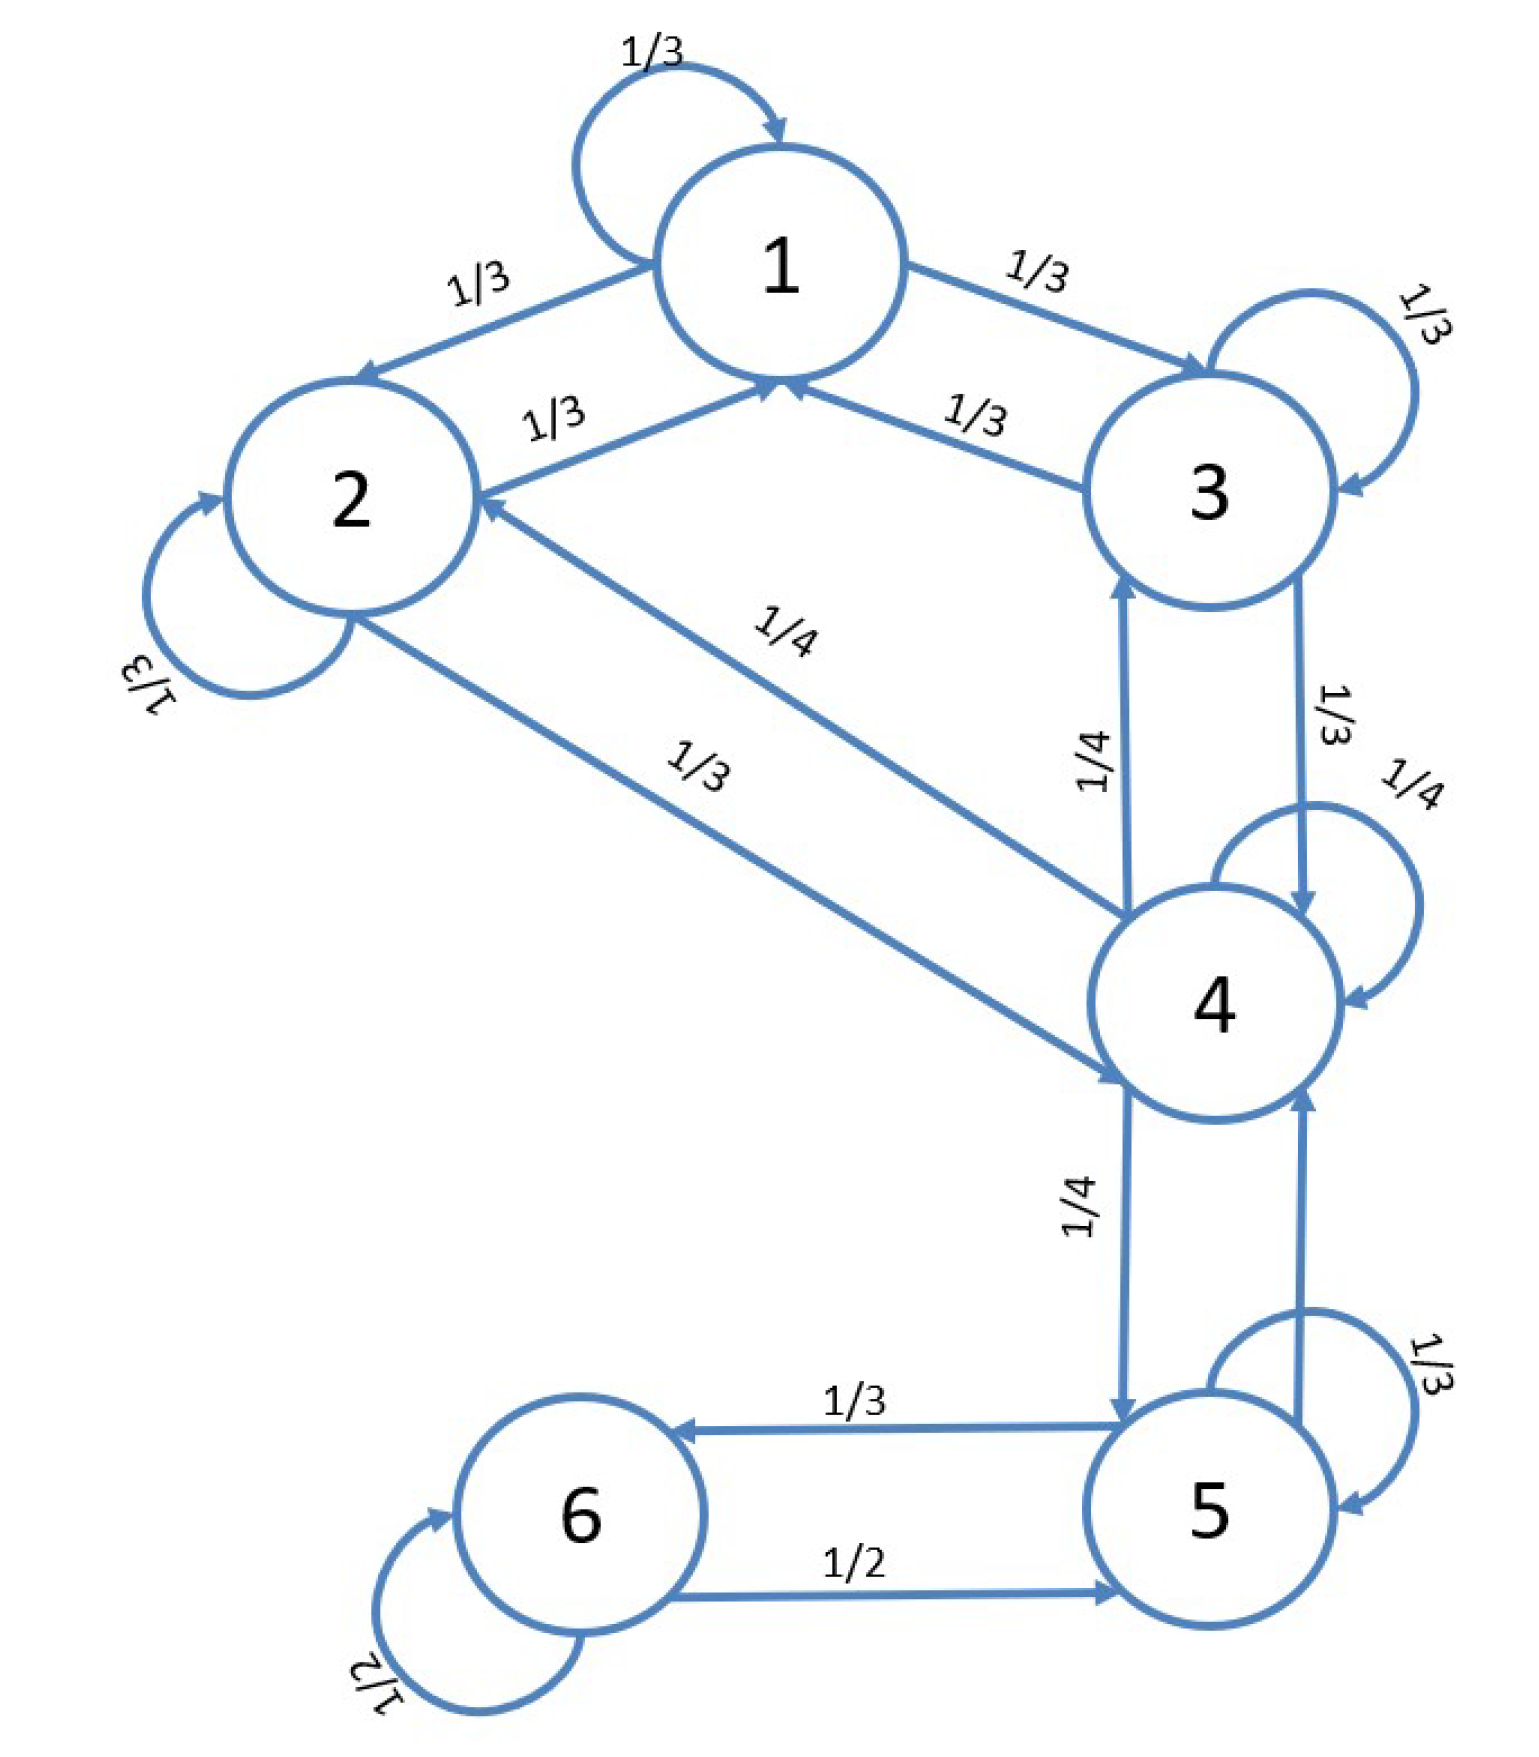
To test the methods proposed in this work, we used the CIGRE LV test distribution network. This test network consists of eighteen buses (see Figure 1), where six PV units and six BESS units are integrated according to the specifications in Table 2. The loads and PV units are placed following typical CIGRE LV benchmark placement; meanwhile, the BESS units are placed at the same bus with PV units and loads, mimicking BESS placement in a residential setting. The PV and BESS units are sized considering a typical four-household apartment building installation, while the size variations are arbitrary. Additionally, the SoC for all batteries is bounded between 0.2 and 0.8 based on the typical usable SoC of batteries. When expressed in the form of a graph, the network can be represented as shown in Figure 2. The numbering ( 1 / n ) on the communication lines shows the communication weights, with n as the number of batteries each BESS unit has as neighbours, including itself. For example, it can be seen that BESS 1 communicates with BESS 2, BESS 3, and itself (n = 3).
The CIGRE LV network was modeled in MATLAB Simulink 2022b using the Specialized Power System (SPS) toolbox [40]. The SPS toolbox has pre-built PV, battery, and variable load models that can be readily used for load flow calculations. More specifically, the PV model is a five-parameter model that utilizes a light-generated current source, a diode, series resistance, and shunt resistance to represent the irradiance- and temperature-dependent I–V characteristics of the modules [41]. The model for battery charging and discharging is empirical and uses a Coulomb counting method to estimate SoC [42]. Readers may refer to the Simulink SPS documentation for detailed descriptions of the models. Finally, the voltage, current, and power at all nodes within the LV network model can be simulated for a given operating condition. Load flow simulations were deemed sufficient for this work, as electromagnetic transient analysis in the millisecond range is not required.

4. Leader–Follower Coordination Strategy

4.1. Control Method and Algorithm

The developed control strategy for coordinating multiple BESS units combines local and distributed control. The distributed control is based on the consensus algorithm, as it reaches an agreement on a certain decision by the agents towards a goal. In our case, the goal is to keep the voltage in the nodes within a desired range. The lines that connect the buses are used as communication links that share the information (the utilization factors) between the neighbouring agents (in our case, BESS units) to achieve consensus when the voltage magnitude of one or more buses is violated. Each of these buses and BESS units has an initial state, and a utilization factor is allocated to each BESS unit. The utilization factor determines how much power each BESS contributes to the voltage regulation. This power is restricted by the available BESS S o C . The consensus algorithm updates the utilization factors until the voltage magnitude does not surpass the limit points, ensuring that all BESS units contribute the necessary amount of power to achieve voltage regulation.
To initialize the consensus algorithm, we define a leader utilization factor ( U leader ) , which is updated until the voltage regulation of the system is achieved. This utilization factor is considered as a leader because it performs as a reference for the utilization factors of the other follower batteries ( U i ) [15]. To achieve voltage regulation of the LV distribution network using the consensus algorithm, the leader utilization factor ( U leader ) represents the battery connected to the leader bus. This can be the bus with the highest voltage (if the higher voltage limit is violated) or the bus with the lowest voltage (if the lower limit is violated). Each BESS agent has observability of the voltage at the node it is connected to, but not of the remaining nodes. The leader utilization factor is updated until the voltage is regulated within limits, and the other utilization factors follow that value. Their value is determined by communication with the neighbouring agents.
The consensus algorithm uses voltage limits as parameters to activate the BESS. In our case, we used the standard ANSI C84.1, which establishes a permitted range of ± 0.05 p.u. for low-voltage distribution networks. In this way, the battery charges if the voltage exceeds the upper limit ( 1.05 p.u.) and discharges if the voltage falls below the lower limit ( 0.95 pu). More specifically, if the voltage of the leader bus exceeds the upper limit (case 1: overvoltage), then the utilization factor increases; if the voltage of the leader bus falls below the lower voltage limit (case 2: undervoltage), then the utilization factor decreases. In all other cases, i.e., when the voltage of the buses does not exceed any limits, the utilization factors are zero and the batteries do not contribute to the system. In this way, the leader utilization factor is as follows:
U leader ( k ) = U leader ( k 1 ) + G ov V n ( k ) 1.05 V n ( k ) > 1.05 0 0.95 < V n ( k ) < 1.05 U leader ( k 1 ) + G un V n ( k ) 0.95 V n ( k ) < 0.95
where k is the time step index, Vn is the node voltage (in power units, p.u.), and G ov , G un are gains that control the speed of overvoltage and undervoltage regulation.
The battery connected to the leader bus is the first to be informed about any changes in the utilization factor. The other batteries are informed about changes in their utilization factor following (5). Here, the decision variable x i ( k ) is substituted by U i , as shown in (8):
U i k = j = 1 n C ij k U i k 1 ,
with
C ij t = A ij k 1 j = 1 n A ij k 1 ,
where A is the adjacency matrix.
Following the proposed control scheme, all batteries contribute to the grid despite their respective limitations and capabilities. Thus, the available capacity of each BESS unit does not affect their power contributions. Each BESS unit’s power contributes based on its utilization factor multiplied by its nominal power ( P nom , i ) in kW. In this way, each BESS provides the necessary power based on
P ref , i = P nom , i × U i ,
where P ref , i is the fraction of the nominal power of the battery delivered or consumed by a particular agent. If the utilization factor is positive, then the BESS charges; on the other hand, a negative utilization factor discharges the BESS. Figure 3 summarizes the algorithm followed by the proposed control. In this way, the ideal resulting S o C of each BESS is estimated by
S o C i k + 1 = S o C i k + P ref , i ( k ) E i Δ t ,
where E i is the energy capacity of the BESS and Δ t is the step length (in this case, 1 s). For constraints, we considered a minimum S o C value of 20% and a maximum of 80%. If the utilization factor requires the BESS to go outside that range, the BESS delivers up to its feasible power to later become unavailable. In such cases, the algorithm ignores the unavailable agent and continues the control with the available agents.

4.2. Results

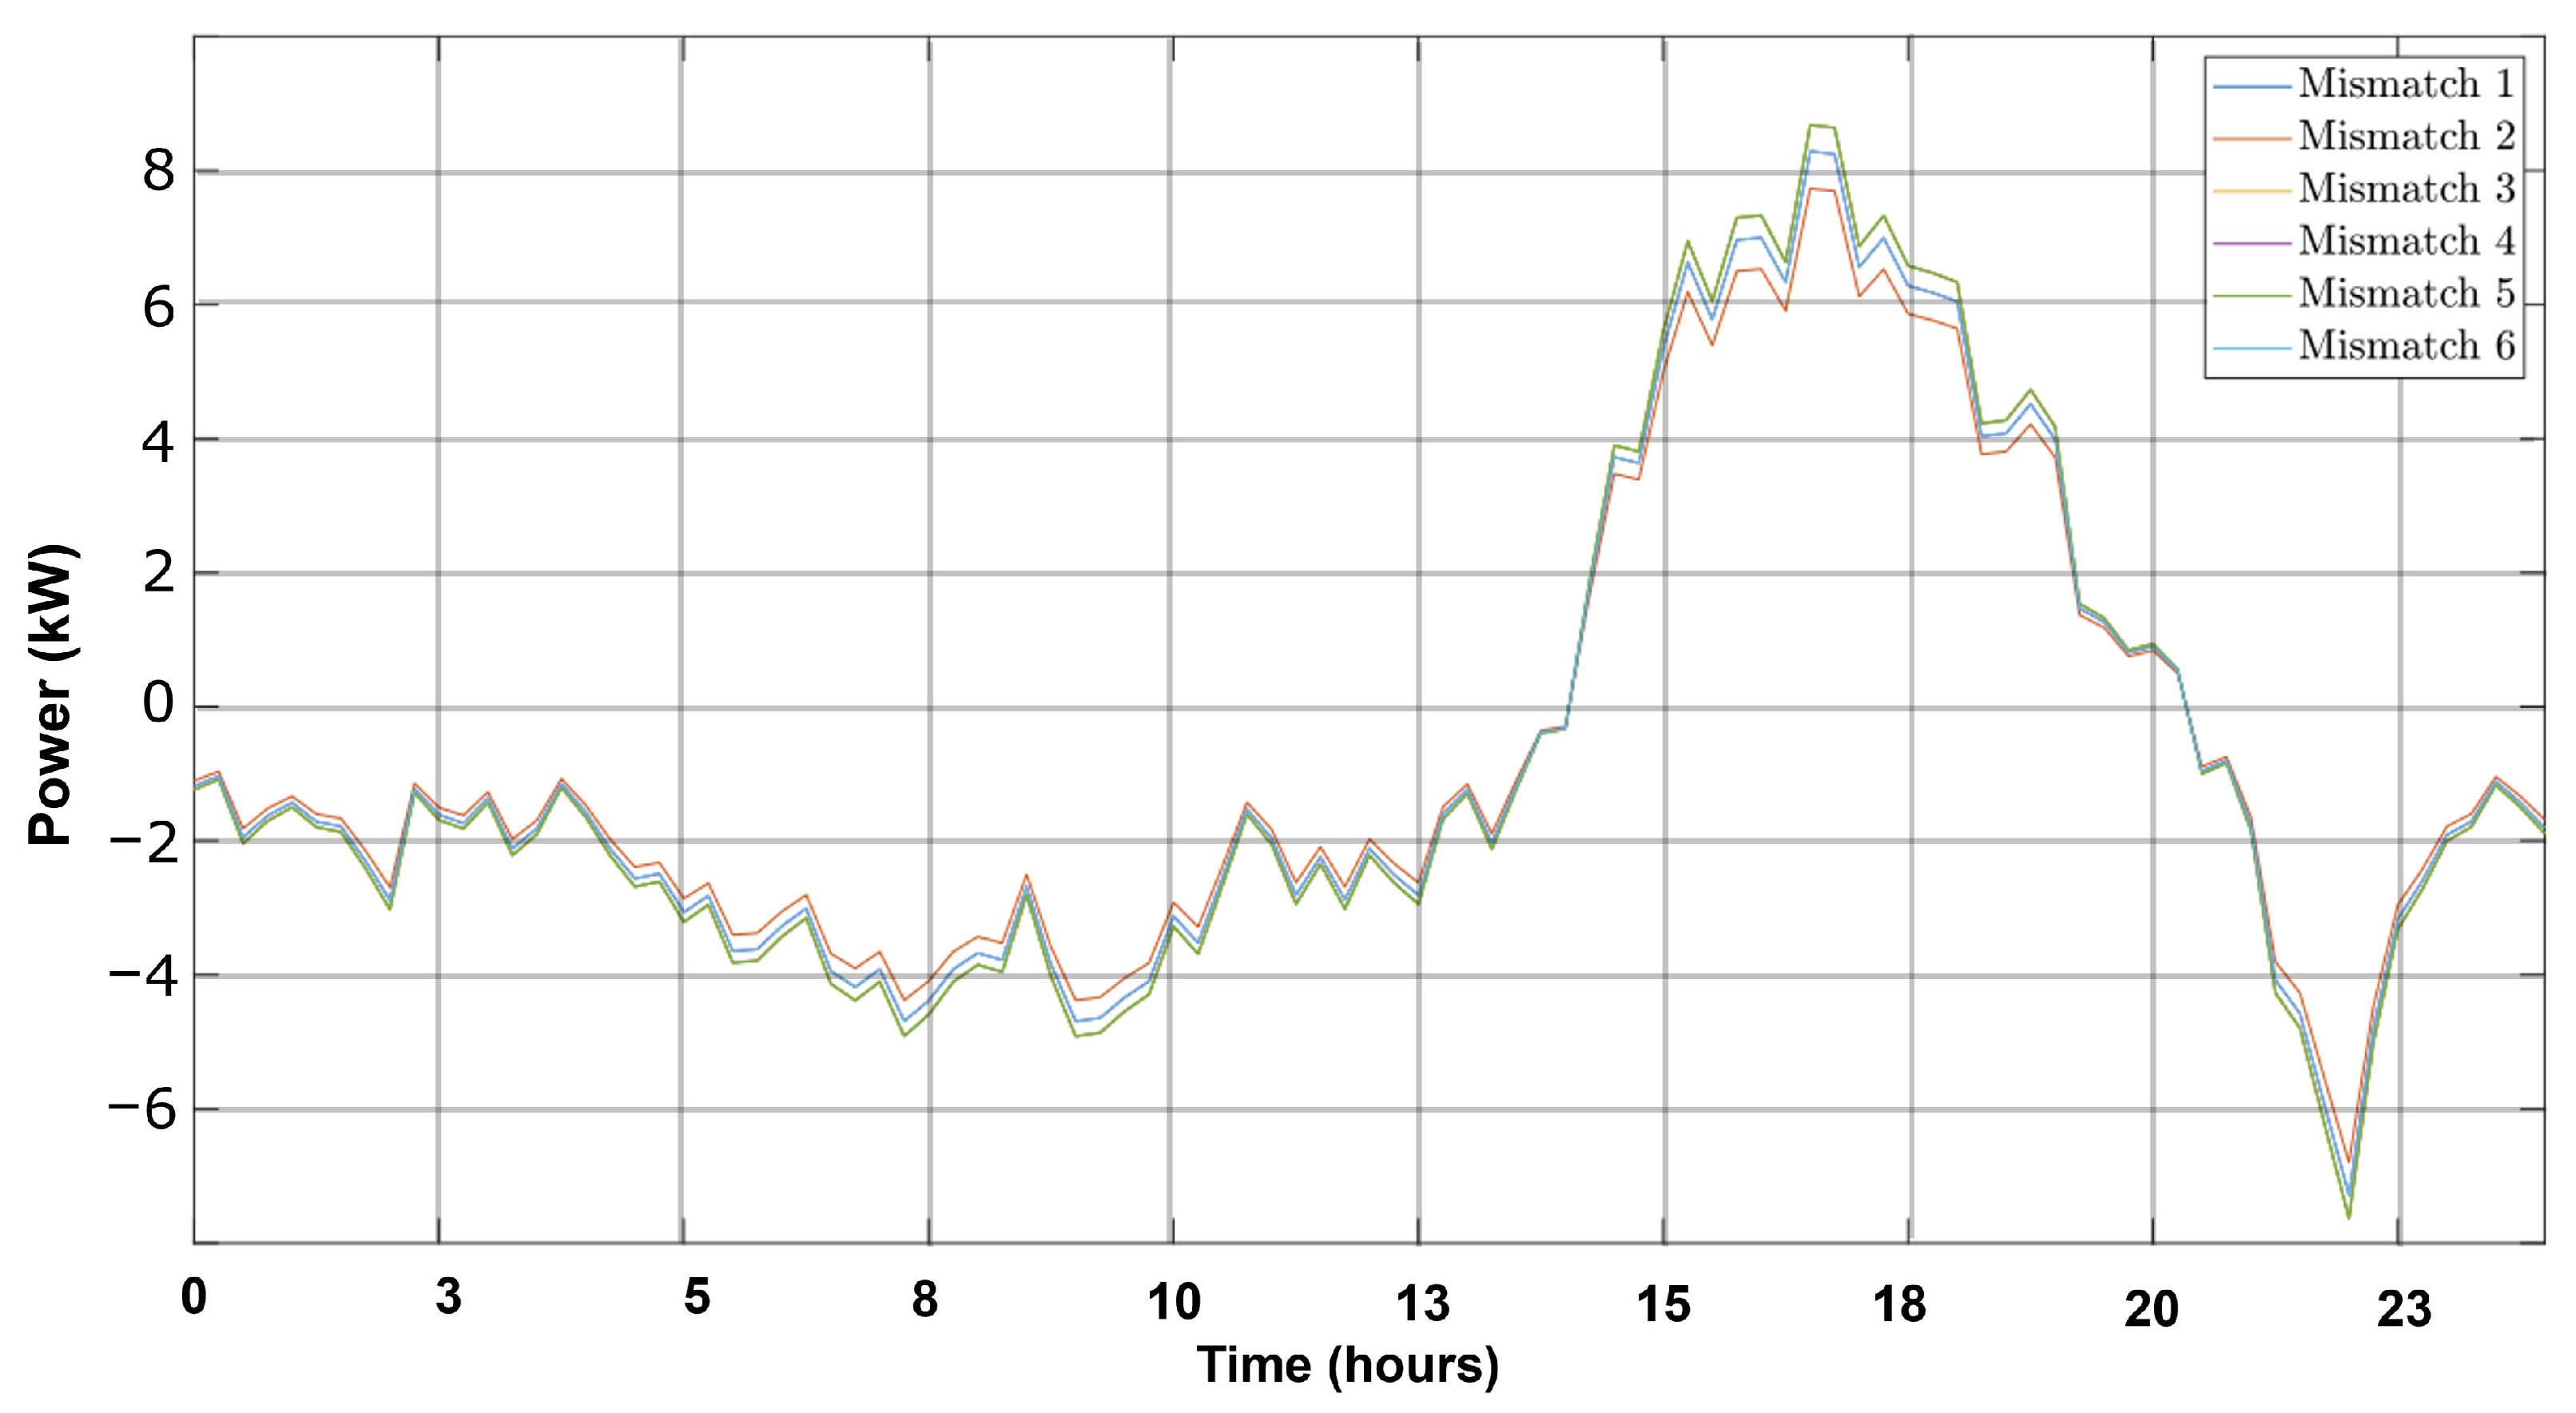
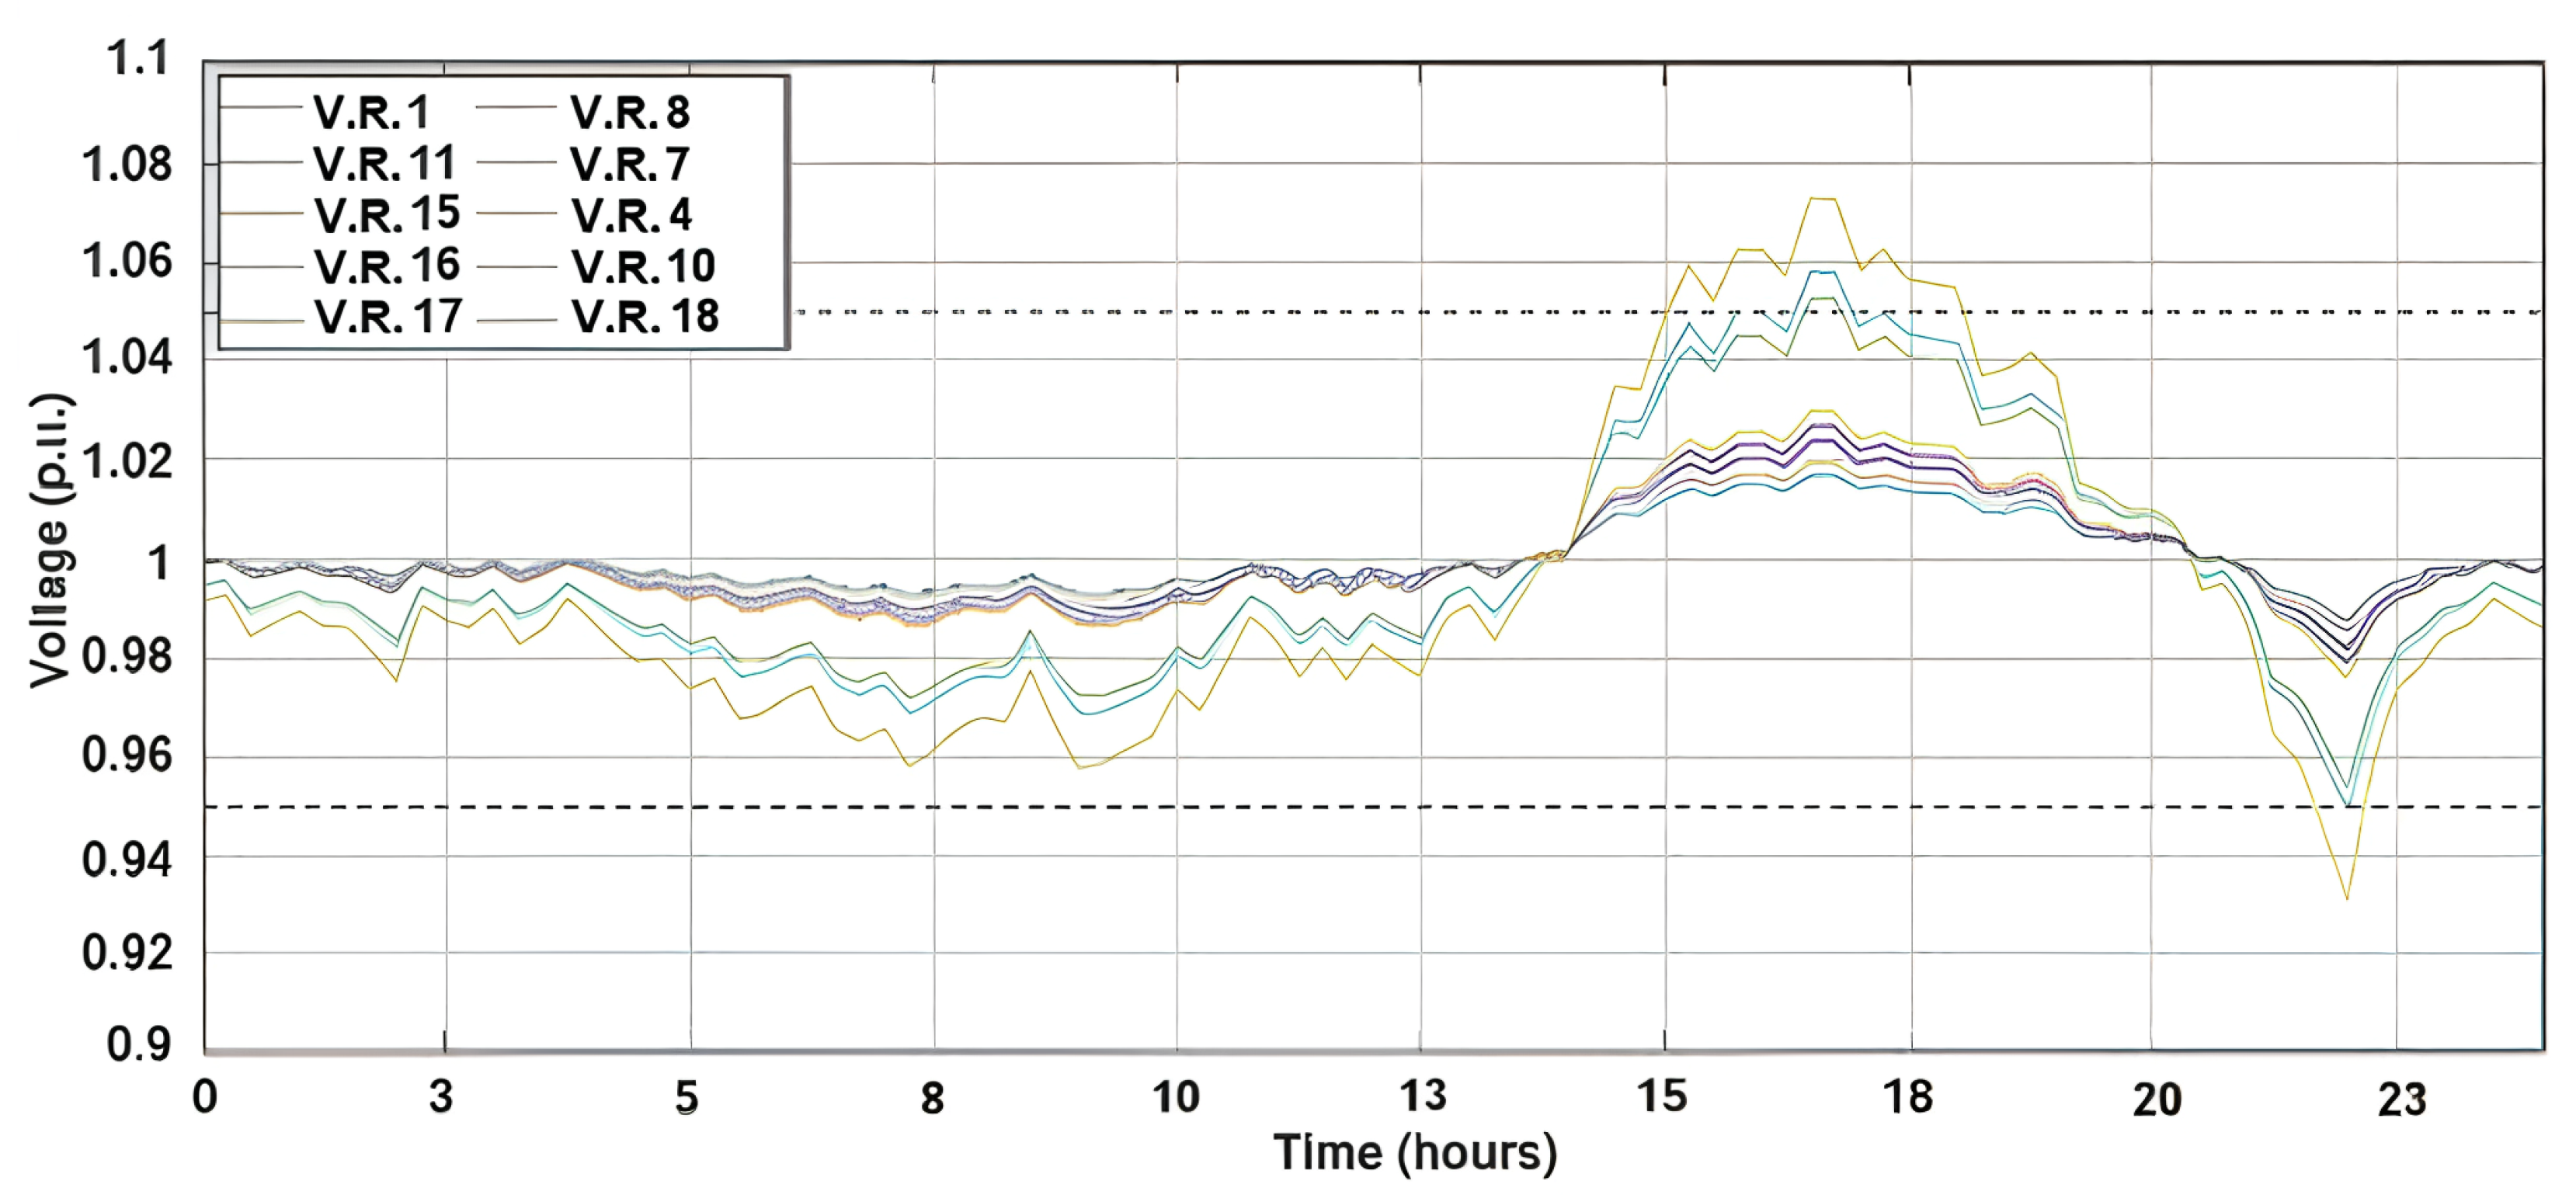
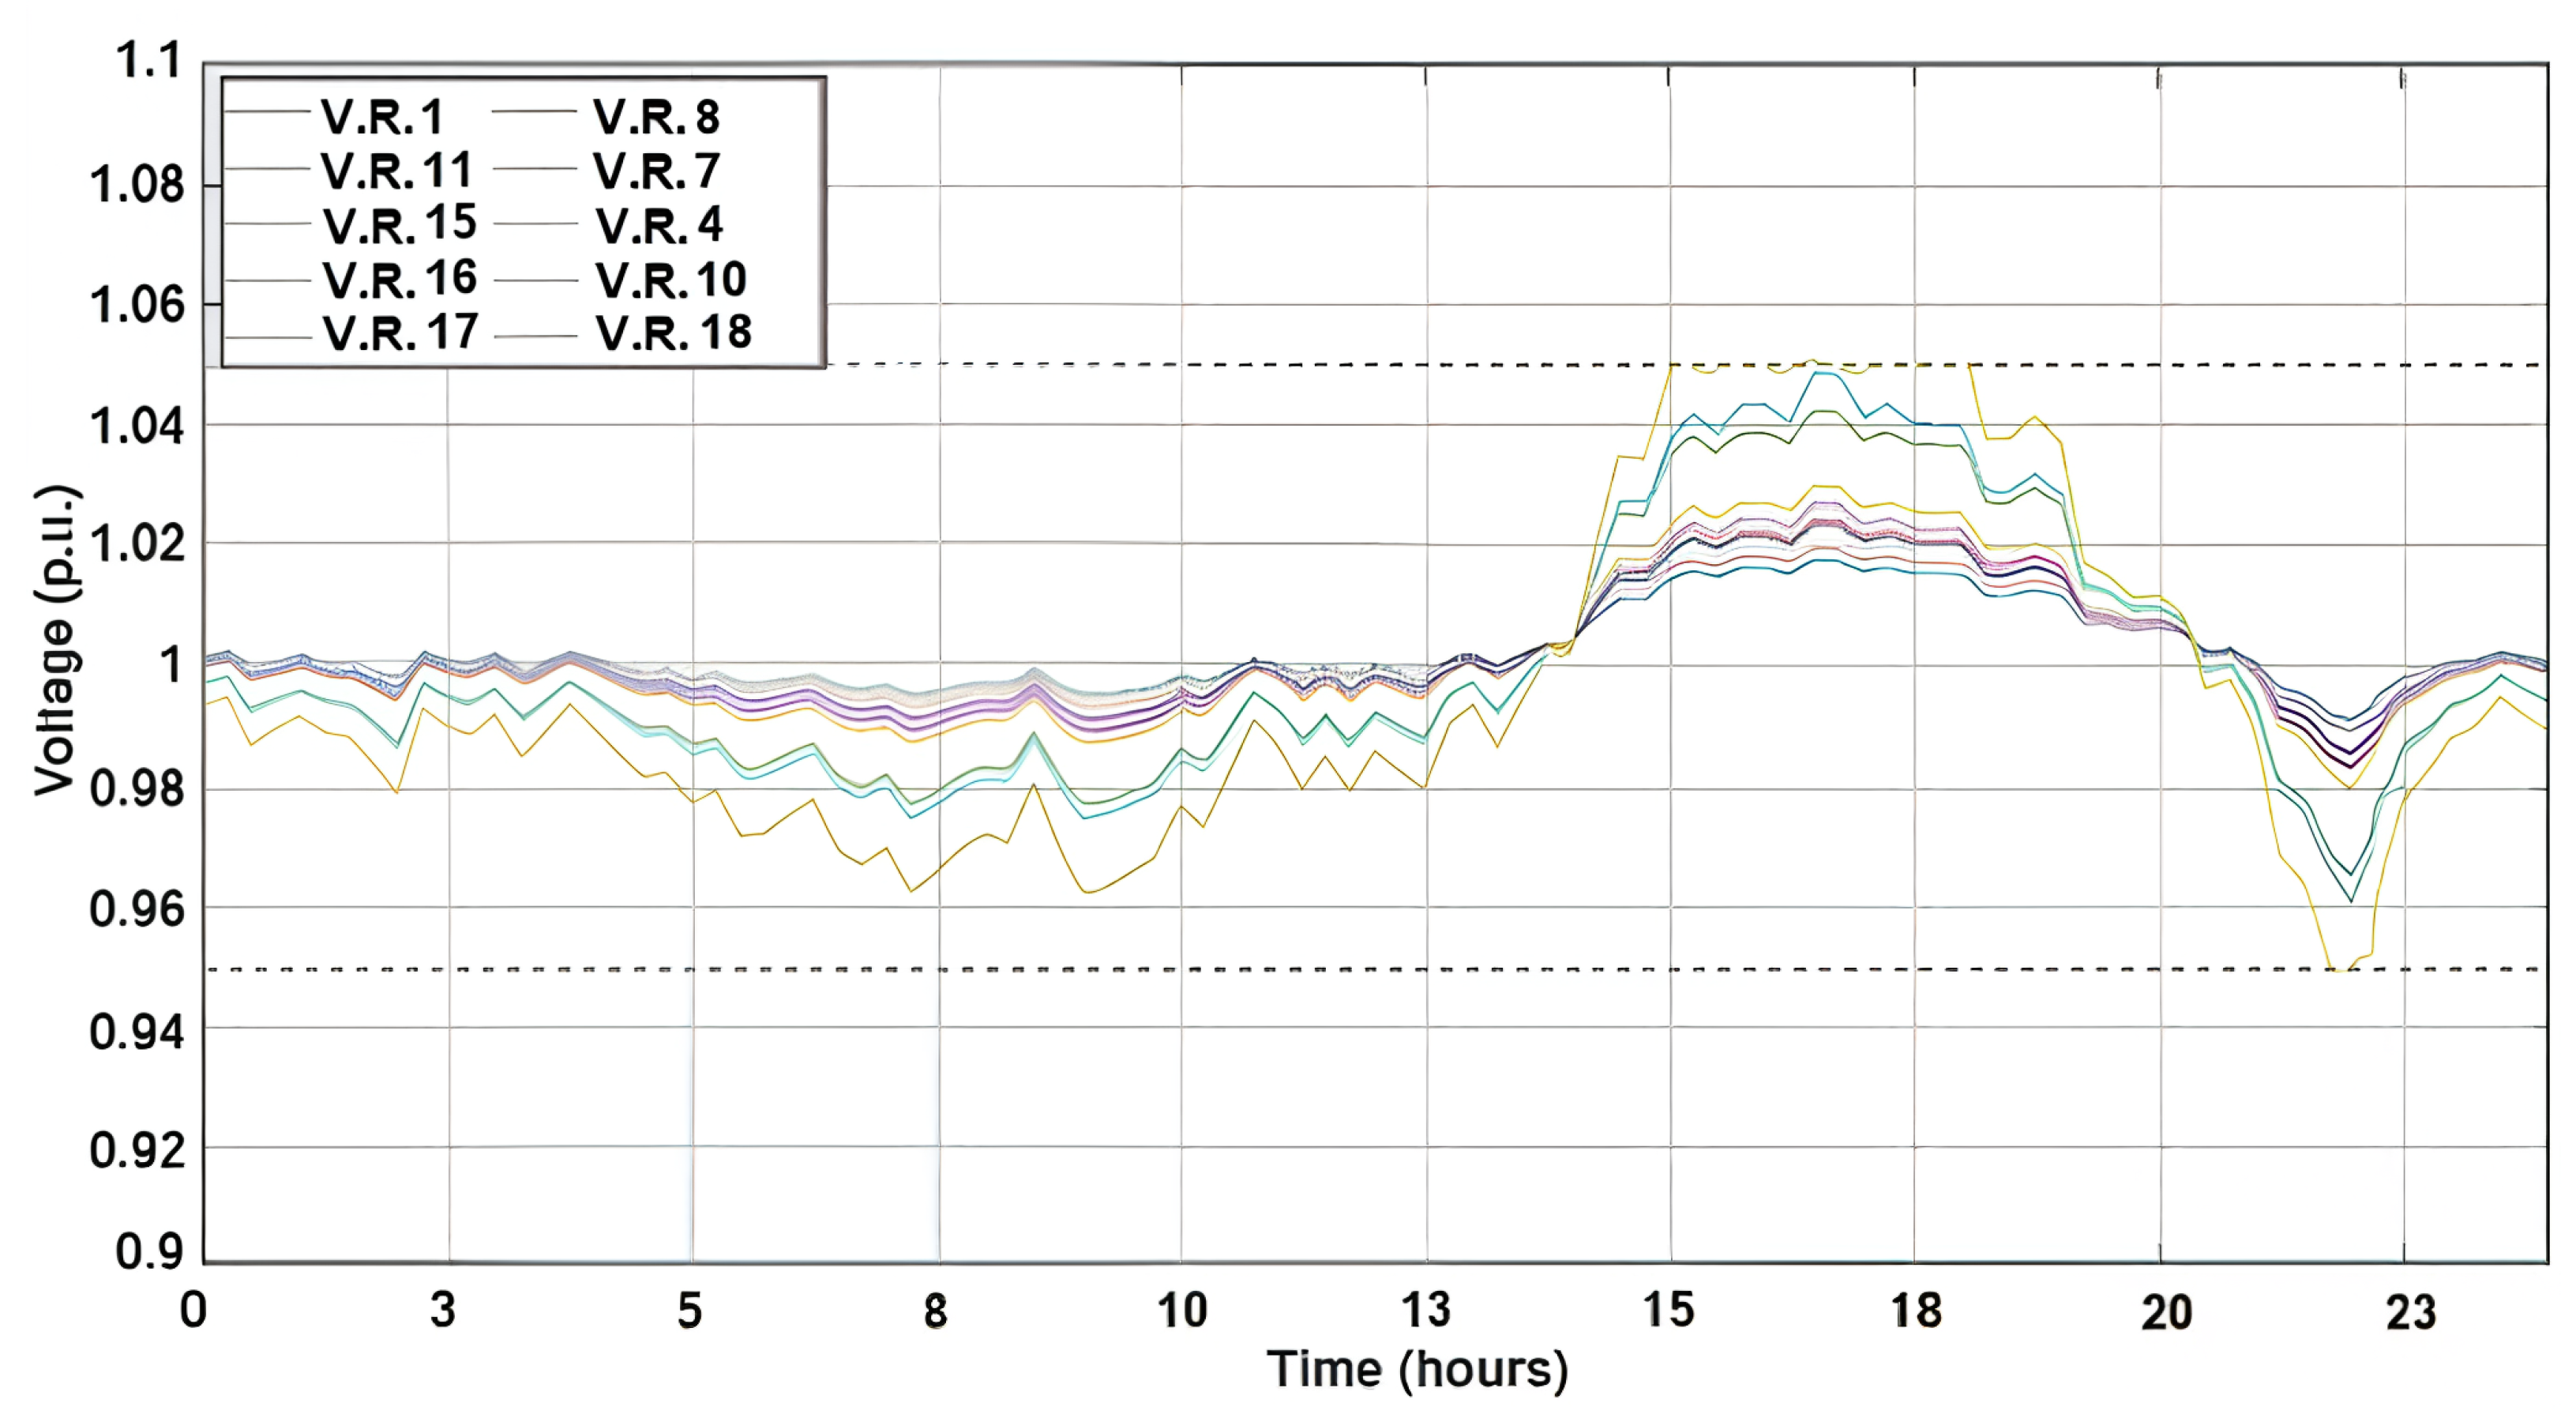
To demonstrate the algorithm’s functionality, a base base case without control is first set up as a reference. Figure 4 shows the magnitude of mismatch between PV generation and load, further defined as net load, while Figure 5 shows the resulting voltage profile from a load flow calculation. The voltage in buses 15, 17, and 18 exceeds the upper limit of 1.05 p.u. between 15:00 and 19:00. Furthermore, between 21:00 and 23:00, the voltage on buses 15 and 18 exceeds the lower limit of 0.95 p.u. The upper voltage limit violation occurs when PV unit production is higher than demand, resulting in large power insertion into the grid. Meanwhile, the lower voltage limit violation occurs at low PV unit production and high demand. By integrating BESS and implementing the developed control, we aim to regulate the over/underpower, helping to limit these violations.
After setting up the base case, we tested our proposed algorithms under two starting S o C conditions. First, we considered the case with the same S o C for all BESS units. Then, we considered the case with different S o C levels for the BESS units. The voltage of the buses after implementing the proposed control strategy in the case with all BESS units having the same starting S o C can be seen in Figure 6. It can be seen that the voltage magnitudes of the buses that exceed the limits are restored to values within the limits. Figure 7 depicts the utilization factors used during the coordination control. These determine how much power each BESS unit should absorb or provide to the network in order to achieve voltage restoration within limits. When overvoltage occurs, the utilization factor of each BESS unit becomes positive; the higher the voltage violation on a bus, the higher the utilization factor of the BESS connected to that bus. As a result, a more significant amount of power must be absorbed from the batteries. When undervoltage occurs, the utilization factors are negative and the batteries must provide power to the network.
The S o C of the batteries is shown in Figure 8. When the utilization factors are equal to zero, the batteries do not contribute to the network and the S o C remains constant; when the utilization factors are positive, the batteries charge and the S o C increases until voltage restoration is achieved. When there is undervoltage and the utilization factors are negative, the batteries discharge to keep the voltage within limits, and the S o C begins to decrease. In this case, because the undervoltage lasts for only a very short period (30 min) and the amount of power needed from the battery is smaller than during overvoltage, the decrease in the S o C is very small compared to the increase during overvoltage.
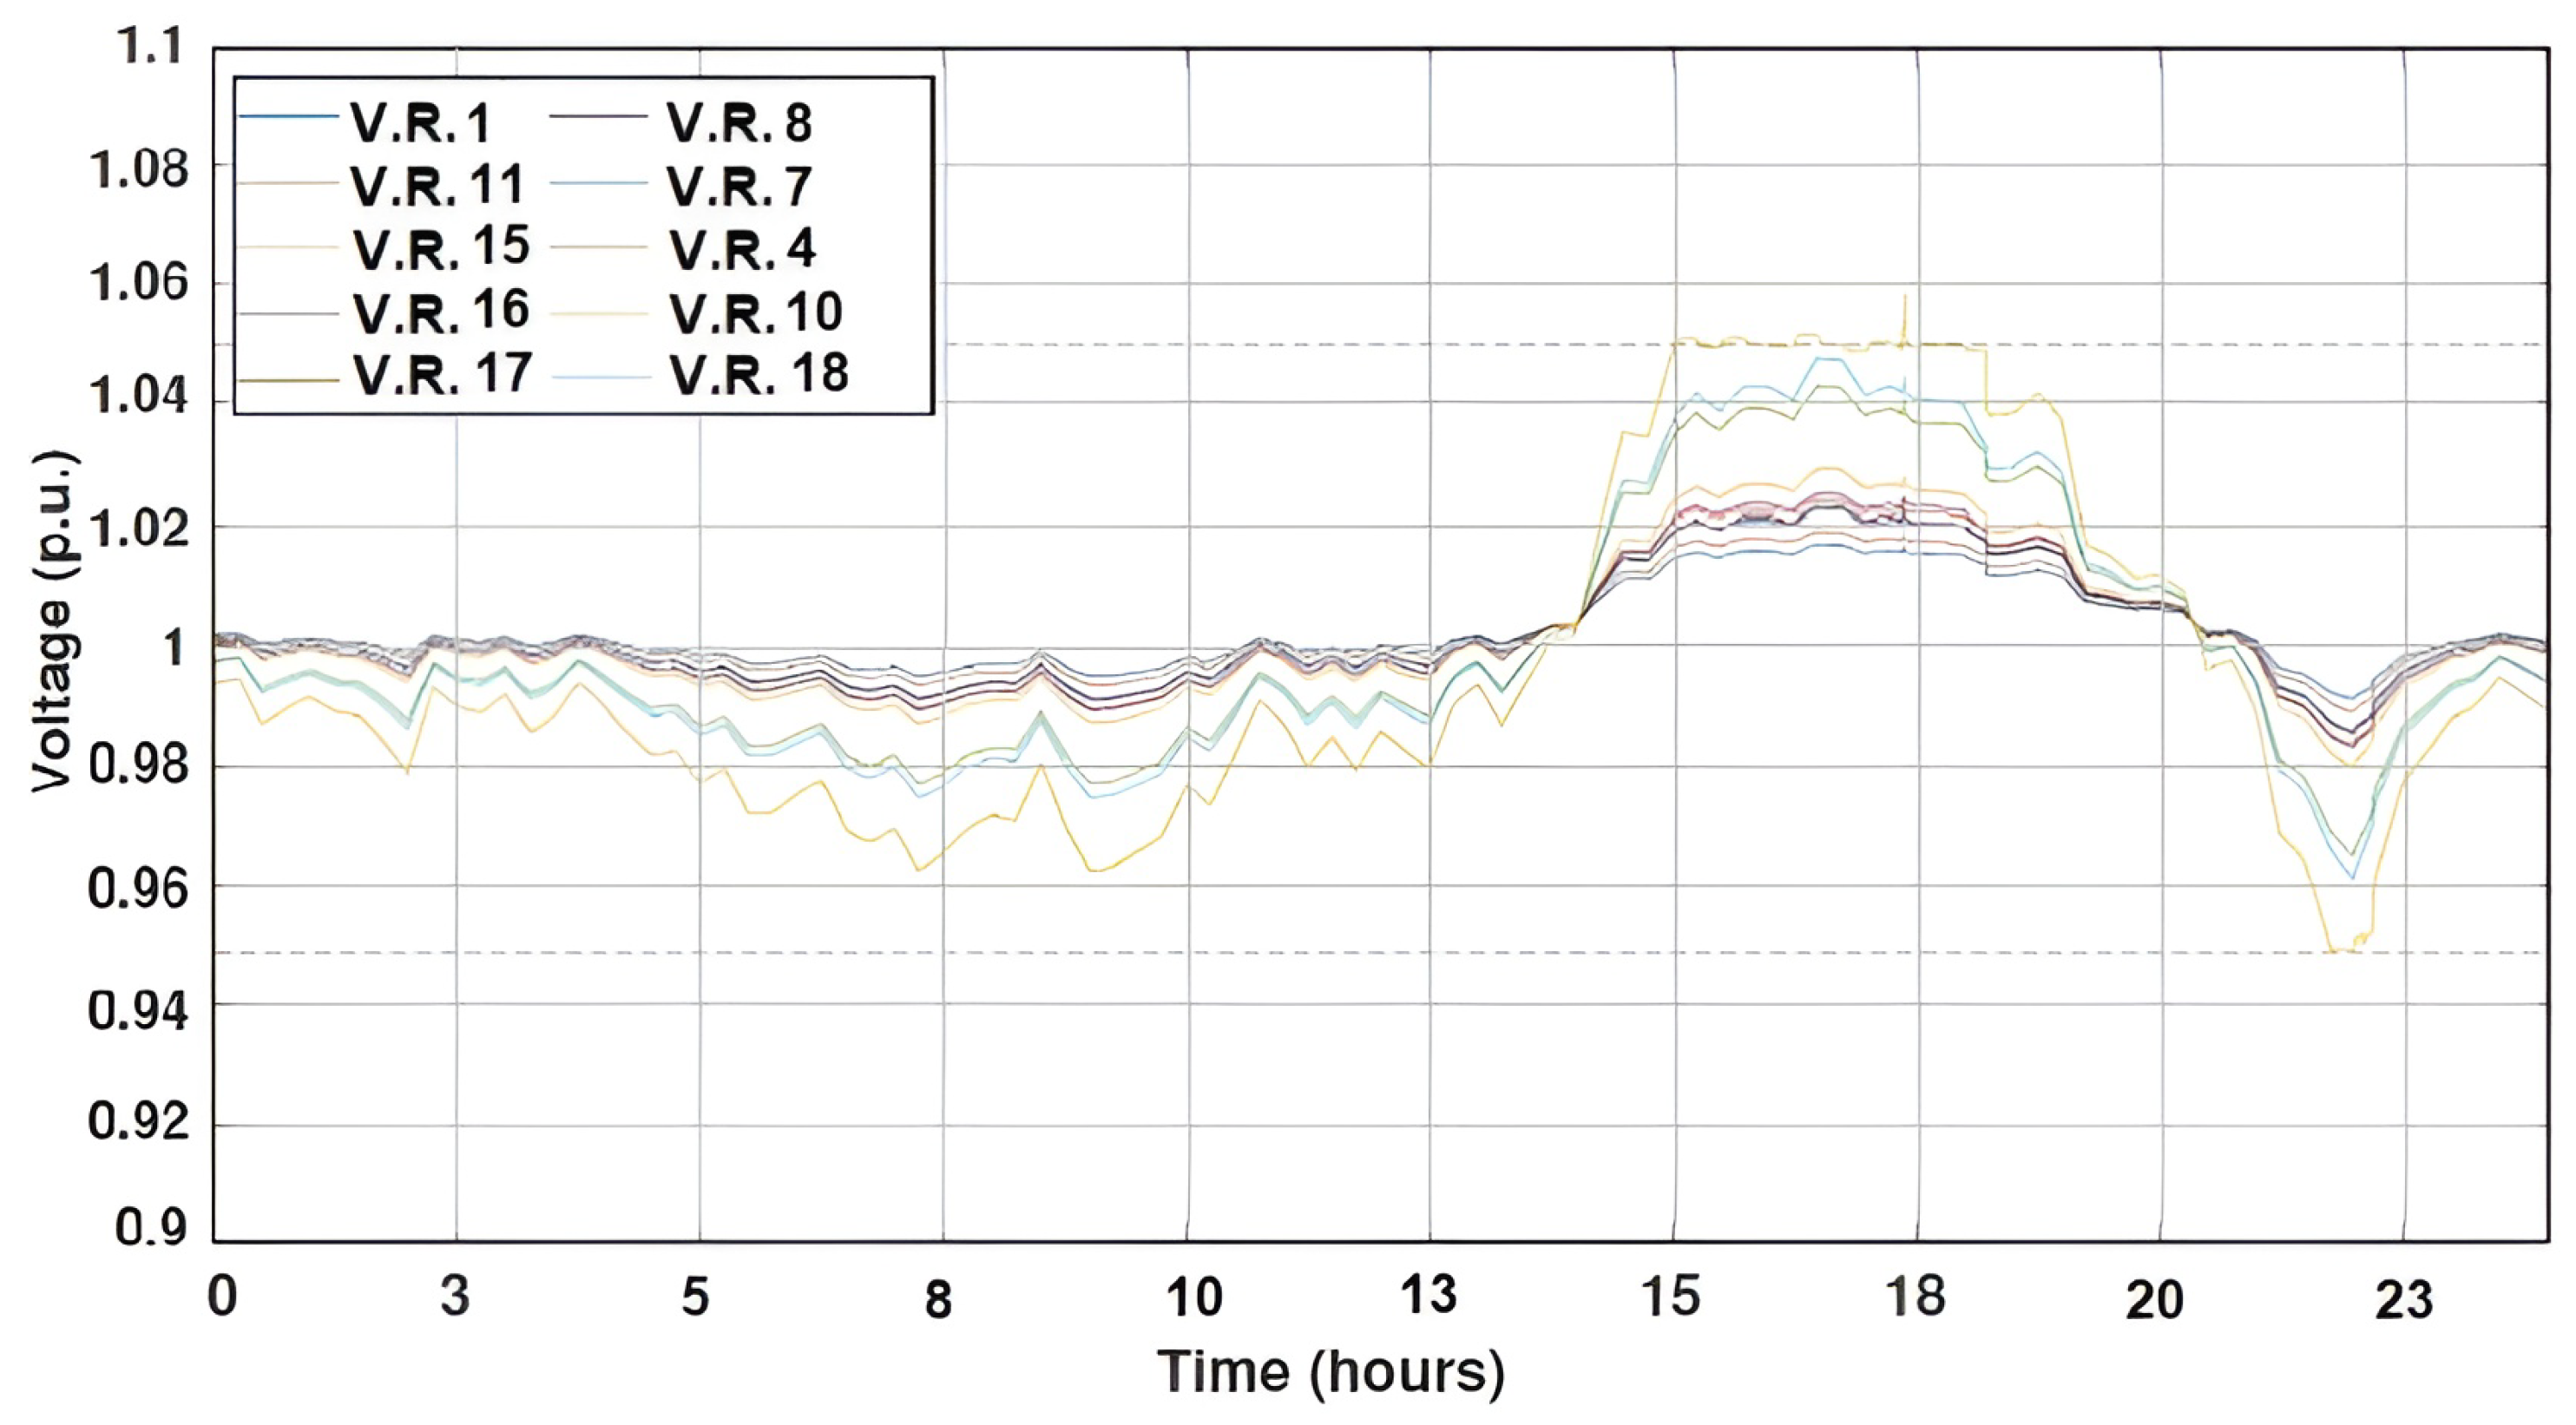
In real scenarios, not all BESS units would have the same S o C ; in some cases, one or more might not even be available. For this reason, we also investigated the operation of the control strategy when one BESS unit is unavailable. In this case, the S o C of BESS 4 is set at 65%; however, at 18:00 the S o C of the battery reaches the limit of 80% (see Figure 9). The developed coordination control distributes the power required from BESS 4 equally to the neighbouring batteries, ensuring voltage stability. Even though one of the batteries is not available for use, the voltage magnitude of the buses is kept within limits, as can be observed in Figure 10. A small peak is observed when the battery is disconnected, but the control strategy manages to regulate the voltage and mitigate this transient voltage change.
When BESS 4 is unavailable, the utilization factors of its neighbouring batteries (BESS 2, BESS 3, and BESS 5) increase compared to the original values, as shown in Figure 11a. More specifically, the utilization factor of BESS 4 is 0.12, which needs to be divided among three neighbouring BESS units. As a result, the neighbouring batteries cover the required power that BESS 4 cannot store. At the highest point, BESS 2 increases from 0.13 to 0.17, BESS 3 increases from 0.16 to 0.2, and BESS 5 increases from 0.08 to 0.12. Figure 11b shows the power contribution of BESS 4 under normal operation when no S o C limit is violated in comparison to the case where the S o C limit is violated. When the S o C reaches 80%, the battery is disconnected until it becomes available again.
To compare the results of the decentralized control strategy with our proposed leader–follower control strategy, the same mismatch profile is used; thus, the voltage magnitude of the buses with no control implemented is the same as in Figure 5. Under decentralized control, each battery is controlled locally, meaning that the amount of power required is determined by the voltage magnitude on the bus to which the battery is connected. Figure 12 depicts the voltage after decentralized control is implemented. Although the voltage is regulated within acceptable limits, multiple fluctuations can be observed, which affect the power quality. It can also be noticed that the voltage fluctuations are higher when the overvoltage is higher. This can be explained by the droop control often having poor transient performance. In the case of the coordination control strategy, the voltage behaviour did not include frequent sudden changes around the limit point.
Furthermore, not all batteries help with voltage regulation. In this study, only BESS 3 (Bus 15) and BESS 6 (Bus 18) contributed; the rest were not operating, as the voltage on their buses does not surpass any limit. Thus, only a battery connected to a bus that exceeds the limits contributes, necessitating larger capacity than with the coordinated control strategy. This is depicted in Figure 13, where it can be noticed that the power provided by BESS 3 is always higher with decentralized control. Moreover, all of the frequent changes in voltage magnitude can be observed in the power contribution of the battery. The frequent changes in voltage affect the power contribution due to the poor performance of the droop control. These frequent changes in the battery’s power output reduce its lifetime, making the decentralized control strategy less appropriate [43].
Finally, if one of the batteries used in voltage regulation reaches an S o C limit or is unavailable due to maintenance, the other batteries cannot provide the necessary power and the voltage cannot be restored to acceptable levels. This is depicted in Figure 14, where BESS 3 is unavailable around 18:00. The voltage is not regulated and exceeds the limit. Using the coordination control strategy avoids this situation.
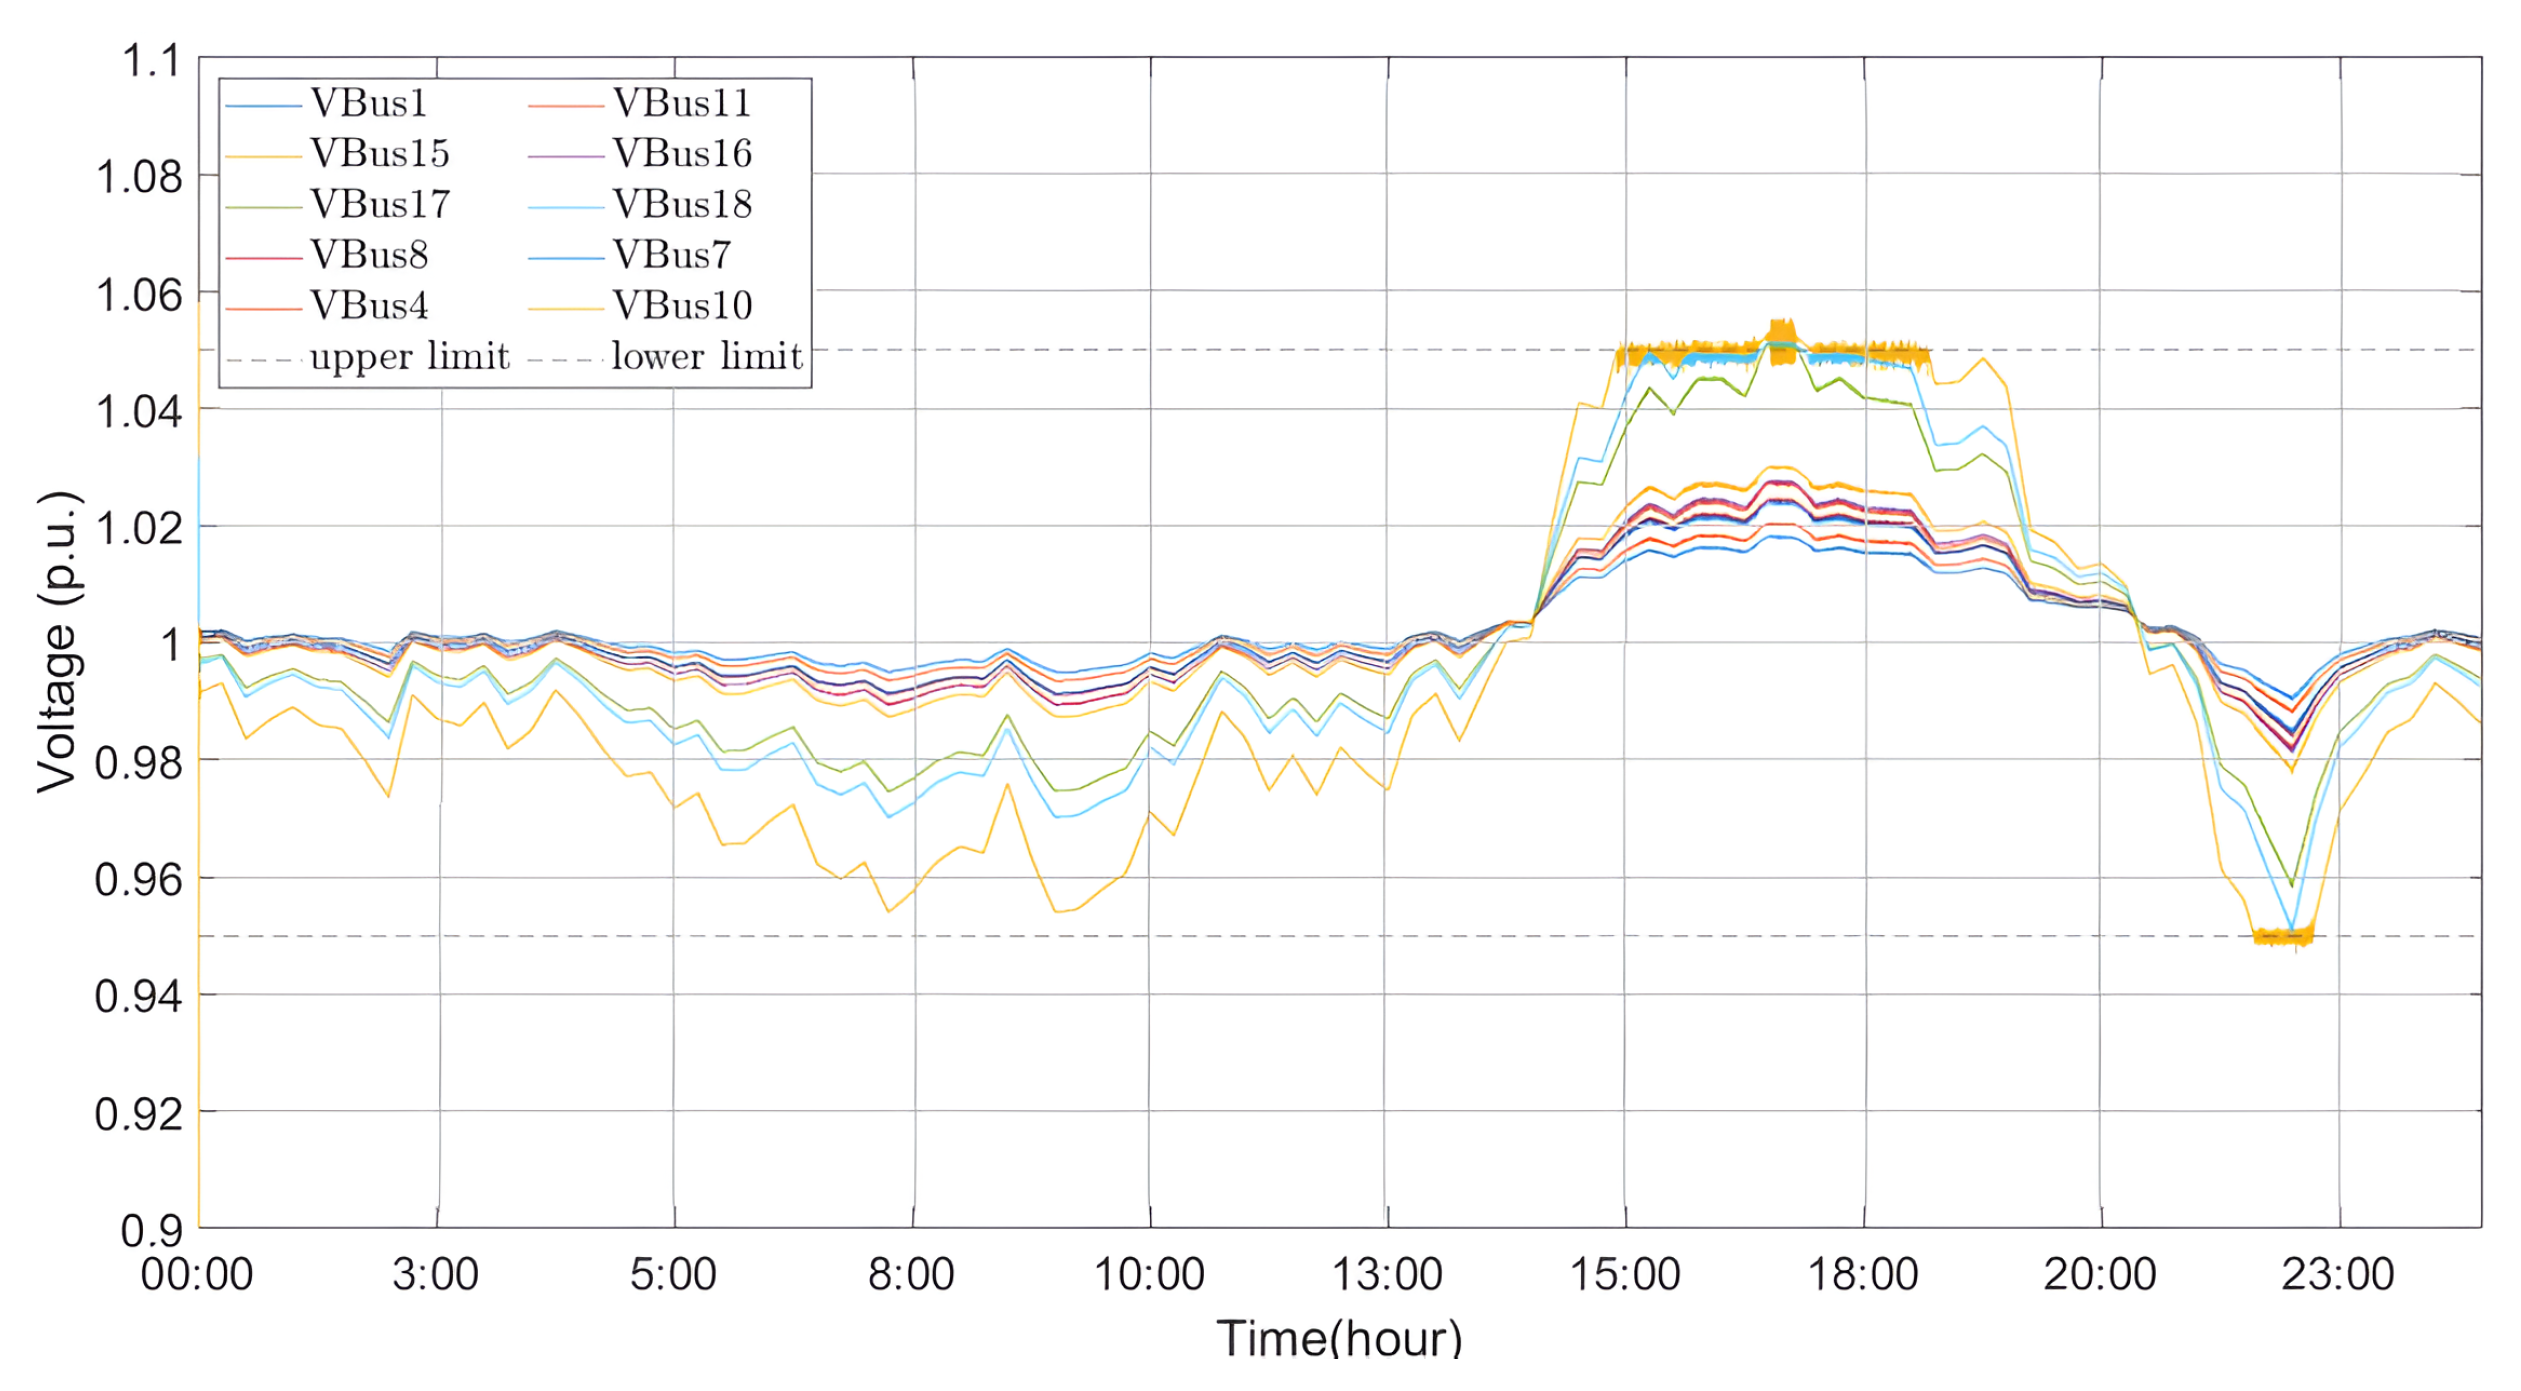
A decentralised droop control strategy was used as reference. In this case, each battery is controlled locally, meaning that the amount of power required is determined by the voltage magnitude on the bus to which the battery is connected. Despite being widely accepted in the literature, this approach results in unbalanced operation among the agents. Figure 15 depicts the voltage after decentralized control is implemented. Although the voltage is regulated within acceptable limits, there are multiple fluctuations that affect power quality. It can be observed that higher overvoltage leads to greater magnitude of the voltage fluctuations. This behaviour is because of the droop control’s poor transient performance, as in the case of the coordination control strategy the voltage behaviour did not include frequent sudden changes around the limit point.
Unlike our proposed strategy, not all batteries help with voltage regulation when using droop control. In this case, only BESS 3 (bus 15) and BESS 6 (bus 18) contribute; the rest are not operating, as the voltage on their buses does not surpass any limit. Thus, only batteries connected to a bus that exceeds the limits contribute, necessitating larger capacity than in the coordinated control strategy case. This is depicted in Figure 16, where it can be observed that the power provided by BESS 3 is always higher with decentralised control; more specifically, in the coordination control case, the S o C of BESS 3 reaches 68 %, while in the case with decentralized control the S o C of the same BESS unit reaches 79% and all frequent changes in voltage magnitude can be observed in the power contribution of the battery. These frequent changes in the power output of the battery reduce its lifetime, making the decentralized control strategy less appropriate [43].

5. Leaderless Coordination Strategy

5.1. Control Method and Algorithm

Our second method uses the consensus algorithm to coordinate the batteries spread out in the network without assigning a leader. This method applies three steps to maintain voltage in the network: local utilization factor calculation, consensus utilization factor calculation, and final utilization factor calculation. Figure 17 illustrates the calculation flow for the three main steps.
In the first step, local utilization factors U i ( k ) are calculated for every bus based on their voltage measurement V i , as follows:
U i ( k ) = 0 , ( t = 0 ) U i ( k 1 ) + U add , i ( k ) 0.5 U i ( k 1 ) , V low < V i ( k ) < V high
where V high and V low are predetermined upper and lower reset limits, respectively. The last term in (12) works as a utilization factor reset function if the measured voltage is between the two predetermined values. An immediate reset to zero is undesirable, as it would cause instability; therefore, a constant value of 0.5 is chosen. Furthermore, (12) can be expanded as follows:
U add , i ( k ) = G ov V i ( k ) 1.05 , V i ( k ) > 1.05 0 , 0.95 V i ( k ) 1.05 G un V i ( k ) 0.95 , V i ( k ) < 0.95
which represents the added or subtracted utilization factor for BESS index i at step k. The above equation implies no addition or subtraction to the utilization factor if the measured bus voltage is within 0.95 and 1.05 p.u. After the local utilization factor is calculated for every bus, the control step moves on to sharing the utilization factors among the batteries using the consensus algorithm.
The local utilization factors shared among the batteries are called the consensus utilization factor. This shared utilization factor is denoted by U cons , i ( k ) and is calculated similar to (5), as shown in (3):
U cons , i ( k ) = U i ( k ) + ϵ j N i a ij [ U j ( k ) U i ( k ) ] .
Within a simulation step k, the consensus utilization factor can be calculated in more than one iteration (e.g., n i t e r = 5 ). The parameter ϵ represents the consensus step size, which determines how quickly the consensus utilization factor is calculated for every iteration. Under steady-state conditions ( n i t e r ), the consensus utilization factor U cons , i ( k ) for all buses will have the same value (i.e, U cons , 1 ( k ) = U cons , 2 ( k ) = ... = U cons , n ( k ) ). After the consensus utilization factor is found, a final modification to the utilization factor is performed in order to control the battery S o C . The BESS units spread across the LV network may not always have the correct amount of charge to absorb or release energy to perform voltage support. Some causes of these include varying initial S o C , unpredictable weather in different buses, and load variations. These variations affect voltage support readiness among the batteries. To ensure readiness, a rule-based control filter that follows (15) is implemented to keep the BESS units within a set S o C limit:
U f , i ( k ) = P net , i ( k ) P nom , i , S o C i ( k ) < S o C lim , C , and 0 < P net , i ( k ) P pos P net , i ( k ) P nom , i , S o C i ( k ) > S o C lim , D , and P neg P net , i ( k ) < 0 U cons , i ( k ) otherwise ,
The control filter described in Equation (15) overrides the calculated U cons , i ( k ) according to the S o C of a BESS ( S o C i ( k ) ) as well as the net power between PV and load at bus i ( P n , i = P PV P Load ) as its input.
If a BESS has an S o C that is less than a predefined limit S o C lim , C and if the net power is between zero and a predefined positive limit P pos , then the BESS is charged using the net power P n , i . A similar rule is applied if the BESS has an S o C that exceeds another predefined limit S o C lim , D and if the net power is between zero and a negative limit P neg ; in this case, the battery is discharged to compensate for the power deficit in the bus. When none of these conditions are met, the BESS retains its consensus utilization factor. The main goal of (15) is to keep the BESS S o C between S o C lim , D and S o C lim , C as much as possible, where 0 < S o C lim , D < S o C lim , C .
The output of the control filter is called the final utilization factor, denoted by U f , i ( k ) . This is multiplied by the rated power of the BESS to become its reference power according to
P ref , i ( k ) = P nom , i × U f , i ( k ) .
The calculation of the resulting S o C and constraints follows the same procedure as with the leader–follower strategy presented in Section 4.1.

5.2. Results

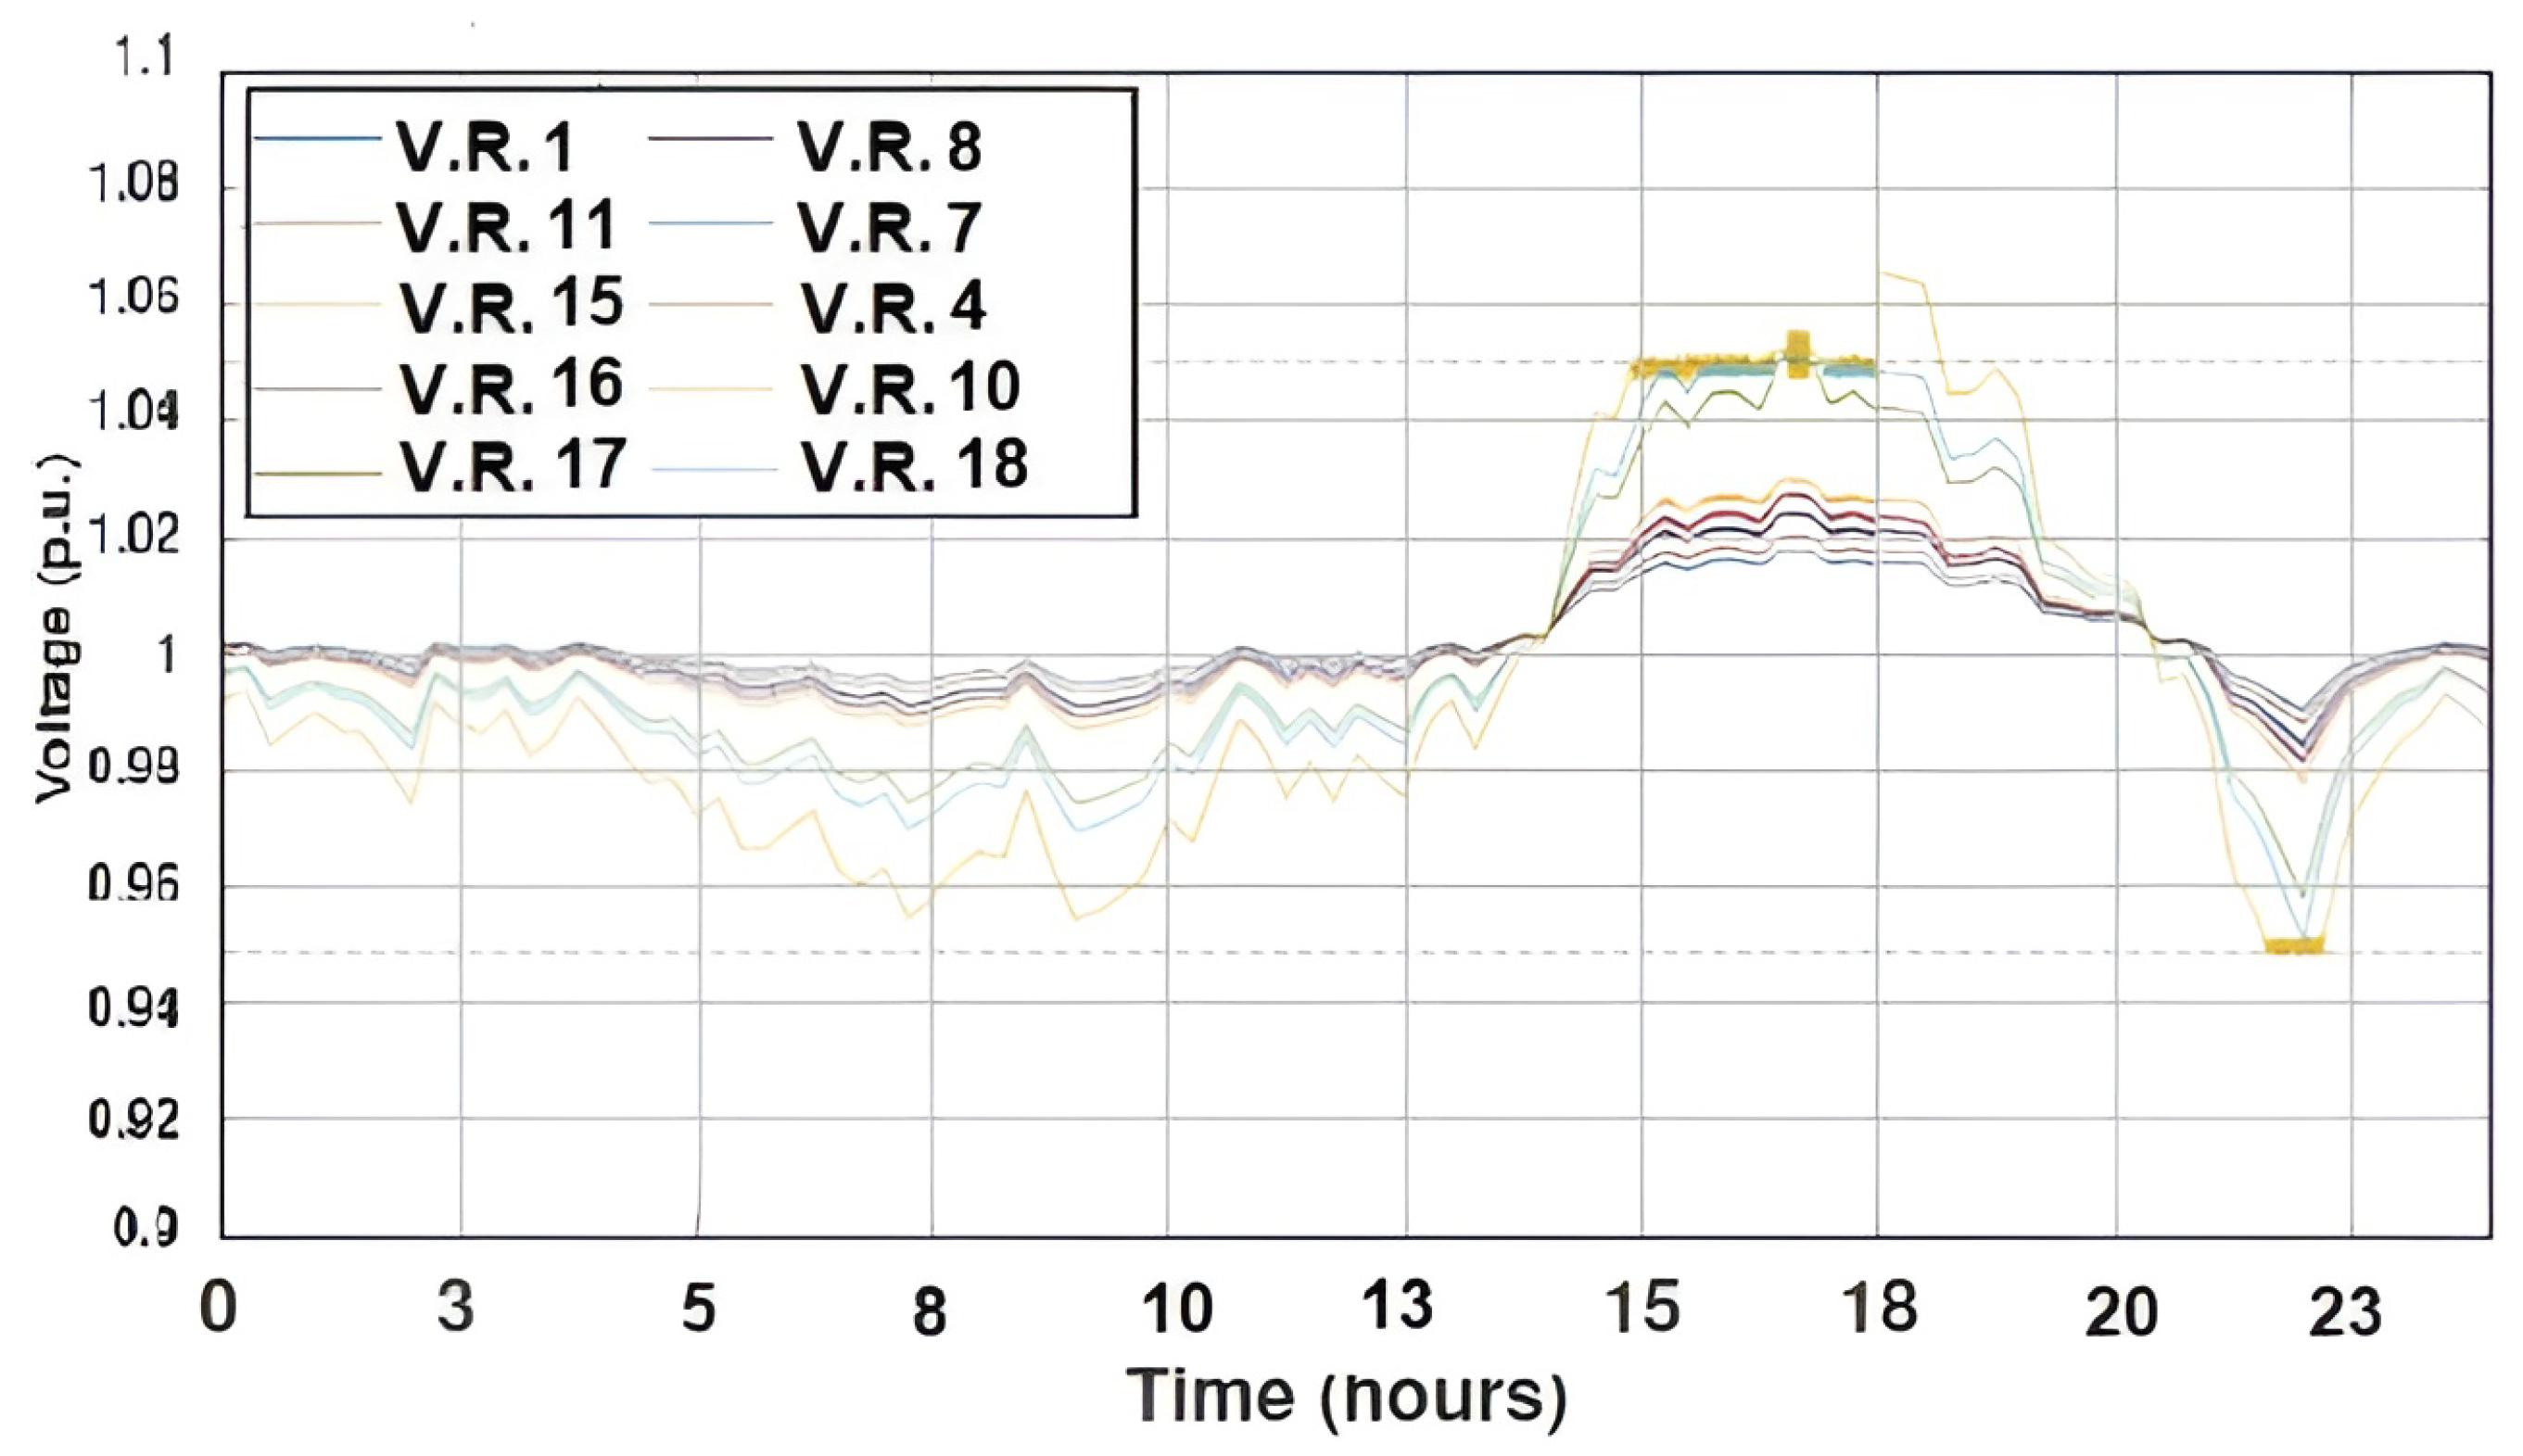
To evaluate the behaviour of the second coordination method, voltage profiles of the buses, utilization factors, and S o C profiles of the batteries can be observed. Generally, this second coordination method can also prevent bus voltage from exceeding the limits while keeping the battery S o C close to uniform throughout the simulation process. The voltage magnitudes can be kept within the limits, as seen in Figure 18. A slight violation can be observed for both overvoltage and undervoltage mitigation; however, the deviation is relatively small with respect to the predefined limit, at only 0.01 p.u.
Similar to the leader–follower algorithm, the utilization factors also increase to positive values when there is overvoltage and decrease to negative values during undervoltage, as seen in Figure 19. The utilization factors of all batteries are the same during overvoltage (16:00 to 20:00) or undervoltage (22:00 to 23:00) periods; thus, the batteries contribute proportionally to their rated power. Meanwhile, between 18:00 and 21:00 for example, the non-zero utilization factors represent the charging or discharging of batteries outside the over/undervoltage period to balance their S o C , as shown in Figure 20. This S o C balancing action is an additional rule on top of the consensus algorithm to ensure uniform voltage mitigation readiness for all batteries and degradation profile.
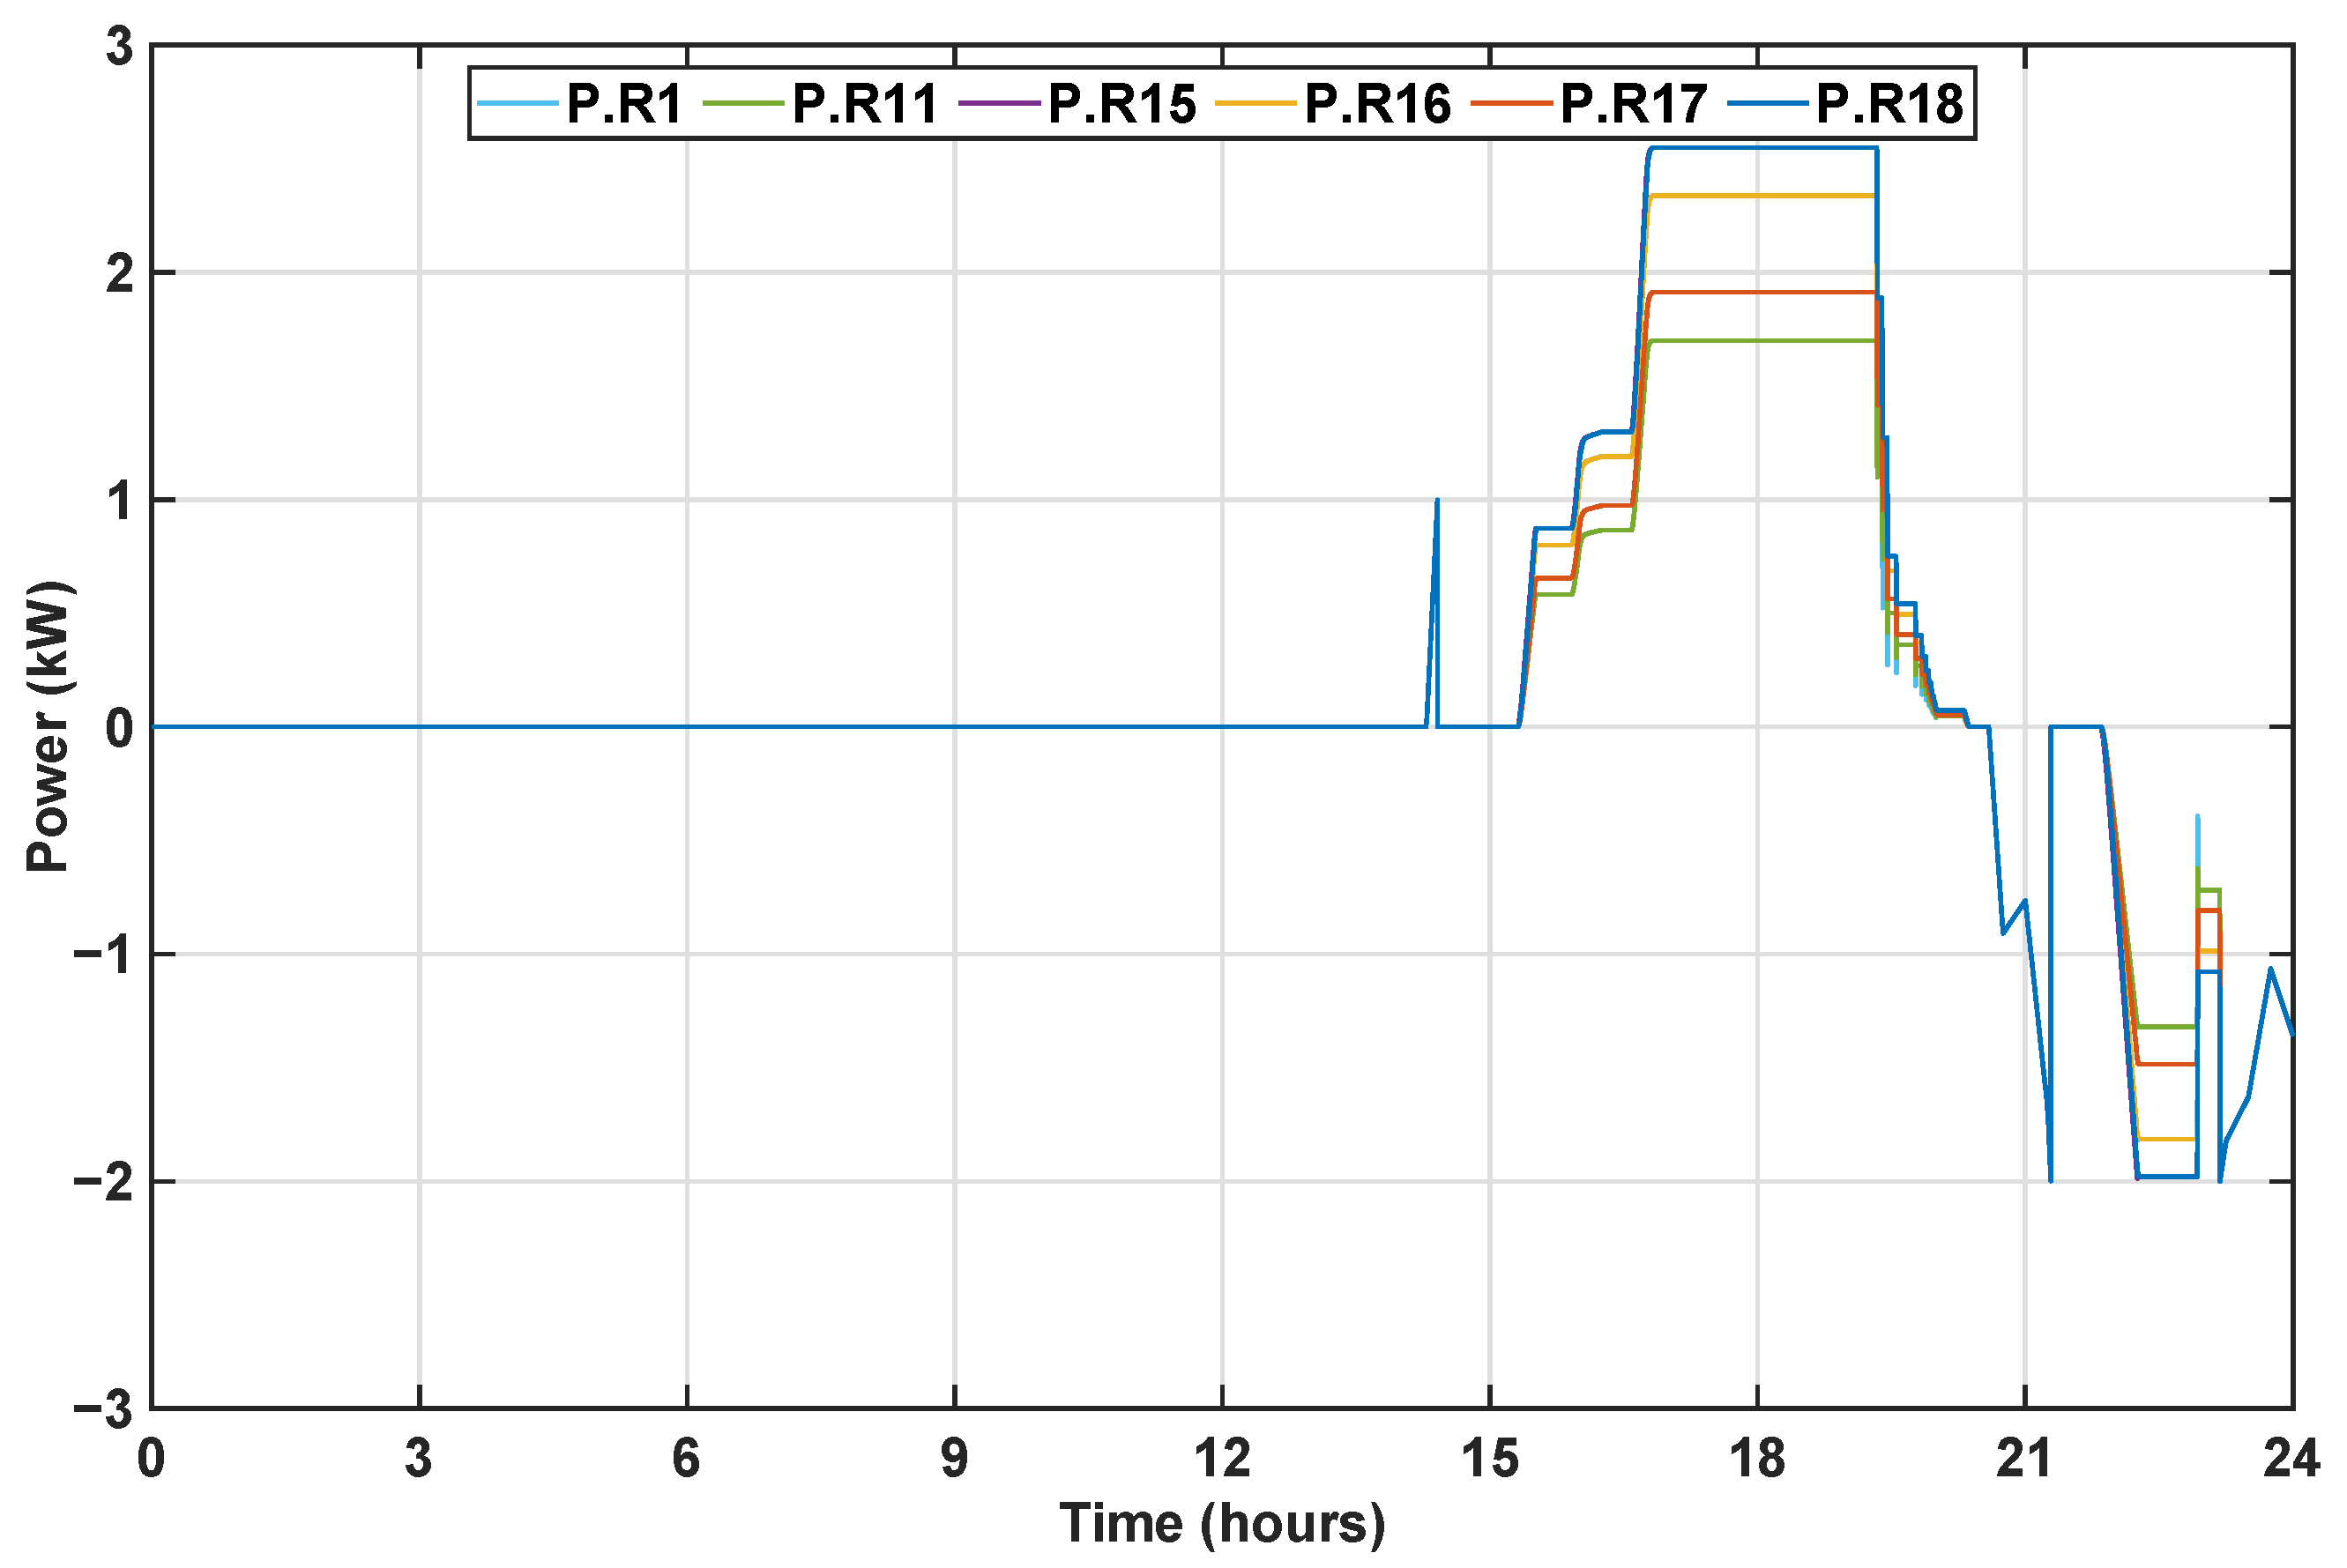
The utilization factors are also reflected in the battery power, as they are similar in terms of their profiles (see Figure 21). One highlight is that the power profiles for all batteries are different when the utilization factors are uniform; in contrast, the power profiles are uniform when the batteries have different utilization factors. This behaviour is due to the variation in the batteries’ nominal power. As indicated earlier in (10), the reference charging/discharging power is determined by the utilization factor and nominal power; therefore, uniform utilization factors do not guarantee similar reference powers.

6. Discussion

This section highlights the key difference between the leader–follower and leaderless control strategies discussed in this work. Three aspects are highlighted, namely, voltage, utilization factors, and S o C of the batteries.
Bus voltages in both the leader–follower and leaderless strategies are kept within the predefined limit, albeit with small differences in the voltage of the non-critical buses. Using the leaderless method, the voltage of the non-critical buses is kept at levels that are further from the predefined limit compared to the leader–follower method, as shown in Figure 10 and Figure 18. This is due to the shared utilization factor. As the leaderless method aims to distribute the required contribution to ensure the limit instead of depending on the leader, it minimizes the under and over-usage of the individual agents. Therefore, the overall S o C of the different agents in the network is more uniform and can react to sudden load or availability changes. The leader–follower method can charge or discharge one single agent at the point that it becomes unavailable under extreme conditions. If this happens, the required compensation is distributed among the neighbouring agents.
In addition, the utilization factor in the leader–follower method is immediately reset after overgeneration or overdemand has receded. In the leaderless method, the utilization factor stays until a reset signal is given. This delayed reset prevents voltage fluctuations following an immediate power reset. In addition to the resetting behaviour, the utilization factor in the leader–follower method is not uniform during voltage control action (see Figure 7), implying that the batteries do not contribute based on their rated capacity ( U i ( k ) = P ref , i ( k ) / P nom , i ). On the other hand, the leaderless method drives the utilization factor to be uniform during voltage control, indicating each battery contributing in proportion to its rated power. If their rated powers are the same, then the power each battery contributes is also the same.
Regarding battery S o C , the leaderless method offers more uniform S o C values across all batteries than the leader–follower method due to the additional S o C control. Figure 22 shows an extended simulation under the same load and PV profile with different initial S o C of the batteries. The box marked “1” in the figure indicates varying initial S o C . The box marked “2” indicates charging before voltage regulation is needed. The box marked “3” indicates discharging after voltage regulation to make the S o C of all batteries uniform. As explained in Section 5, an additional S o C control rule ensures uniform voltage mitigation readiness for all batteries. S o C uniformity is also useful in maintaining the same degradation profile throughout all batteries.
Moreover, the leaderless approach does not require every node to have full observability of the system, only on its neighbouring nodes. In addition to reducing communication congestion and data privacy boundaries, these features provide more robust voltage control.

7. Conclusions

In this paper, we have presented two approaches for coordinated voltage control using the consensus algorithm in the 18-node CIGRE low-voltage distribution network. Both cases rely on a utilization factor defined by the ratio of a battery’s instantaneous power to its nominal power, ensuring that all batteries within the control coverage contribute according to their sizes. In this way, the batteries participate in proportion to their capacity, balancing their degradation rates. In addition, the leader–follower and the leaderless methods both maintain the voltage within the set limits of ±0.05 p.u. However, the leader–follower approach is less robust than the leaderless approach one of the storage agents becomes unavailable. Conversely, the leaderless approach does not require full observability of the network, instead relying on distributing the utilization factor for all the assets. This leads to even usage of the agents, making it more robust to unavailability.

Author Contributions

Conceptualization, M.K. and B.I.P.; methodology, M.K. and B.I.P.; software, M.K., B.I.P. and J.A.-C.; validation, J.A.-C. and L.R.-E.; formal analysis, M.K., B.I.P. and J.A.-C.; investigation, M.K. and B.I.P.; resources, L.R.-E. and P.B.; writing—original draft preparation, M.K., B.I.P. and J.A.-C.; writing—review and editing, L.R.-E.; visualization, M.K. and B.I.P.; supervision, L.R.-E. and P.B.; project administration, L.R.-E. and P.B.; funding acquisition, L.R.-E. and P.B. All authors have read and agreed to the published version of the manuscript.

Funding

The project was carried out with a Top Sector Energy subsidy from the Ministry of Economic Affairs and Climate, carried out by the Netherlands Enterprise Agency (RVO). The specific subsidy for this project concerns the MOOI subsidy around 2020.

Data Availability Statement

The original contributions presented in this study are included in the article. Further inquiries can be directed to the corresponding author.

Conflicts of Interest

The authors declare no conflicts of interest.

References

  1. IEA. Renewable Electricity Growth Is Accelerating Faster than Ever Worldwide, Supporting the Emergence of the New Global Energy Economy; Technical Report; International Energy Agency: Paris, France, 2021. [Google Scholar]
  2. Hemetsberger, W.; Schmela, M.; Chianetta, G. Global Market Outlook For Solar Power; Technical Report; SolarPower Europe: Brussels, Belgium, 2022. [Google Scholar]
  3. Nhede, N. Solar to Cover a Quarter of Global Power by 2050; Technical Report; SolarPower Europe: Brussels, Belgium, 2022. [Google Scholar]
  4. Balasubramanian, S.; Balachandra, P. Effectiveness of demand response in achieving supply-demand matching in a renewables dominated electricity system: A modelling approach. Renew. Sustain. Energy Rev. 2021, 147, 111245. [Google Scholar] [CrossRef]
  5. Mertens, S. Design of wind and solar energy supply, to match energy demand. Clean. Eng. Technol. 2022, 6, 100402. [Google Scholar] [CrossRef]
  6. Alpízar-Castillo, J.; Ramírez-Elizondo, L.; Bauer, P. The Effect of Non-Coordinated Heating Electrification Alternatives on a Low-Voltage Distribution Network with High PV Penetration. In Proceedings of the 2023 IEEE 17th International Conference on Compatibility, Power Electronics and Power Engineering (CPE-POWERENG), Tallinn, Estonia, 14–16 June 2023; pp. 1–6. [Google Scholar] [CrossRef]
  7. Alpízar-Castillo, J.; Ramirez-Elizondo, L.; Bauer, P. Assessing the Role of Energy Storage in Multiple Energy Carriers toward Providing Ancillary Services: A Review. Energies 2023, 16, 379. [Google Scholar] [CrossRef]
  8. Zhu, N.; Hu, P.; Jiang, C.; Yu, Y.; Jiang, D. Comparative analysis and optimal allocation of virtual inertia from grid-forming and grid-following controlled ESSs. IET Renew. Power Gener. 2024, 18, 2416–2429. [Google Scholar] [CrossRef]
  9. Xie, L.; Xiang, Y.; Xu, X.; Wang, S.; Li, Q.; Liu, F.; Liu, J. Optimal Planning of Energy Storage in Distribution Feeders Considering Economy and Reliability. Energy Technol. 2024, 12, 2400200. [Google Scholar] [CrossRef]
  10. Shafiekhani, M.; Qadrdan, M. Addressing electricity transmission network congestions using battery energy storage systems—A case study of great Britain. Appl. Energy 2025, 384, 125418. [Google Scholar] [CrossRef]
  11. An, J.; Hong, T. Multi-objective optimization for optimal placement of shared battery energy storage systems in urban energy communities. Sustain. Cities Soc. 2025, 120, 106178. [Google Scholar] [CrossRef]
  12. An, J.; Hong, T. Optimizing battery energy storage system placement in energy intensive cities for sustainable urban development considering multiple objectives. Sustain. Cities Soc. 2025, 118, 106036. [Google Scholar] [CrossRef]
  13. Nour, A.M.; Helal, A.A.; El-Saadawi, M.M.; Hatata, A.Y. A control scheme for voltage unbalance mitigation in distribution network with rooftop PV systems based on distributed batteries. Int. J. Electr. Power Energy Syst. 2021, 124, 106375. [Google Scholar] [CrossRef]
  14. Samende, C.; Bhagavathy, S.M.; McCulloch, M. Power Loss Minimization of Off-Grid Solar DC Nano-Grids—Part I: Centralized Control Algorithm. IEEE Trans. Smart Grid 2021, 12, 4715–4725. [Google Scholar] [CrossRef]
  15. Wang, L.; Liang, D.H.; Crossland, A.F.; Taylor, P.C.; Jones, D.; Wade, N.S. Coordination of Multiple Energy Storage Units in a Low-Voltage Distribution Network. IEEE Trans. Smart Grid 2015, 6, 2906–2918. [Google Scholar] [CrossRef]
  16. Byrne, R.H.; Nguyen, T.A.; Copp, D.A.; Chalamala, B.R.; Gyuk, I. Energy Management and Optimization Methods for Grid Energy Storage Systems. IEEE Access 2018, 6, 13231–13260. [Google Scholar] [CrossRef]
  17. Tonkoski, R.; Lopes, L.A.C.; El-Fouly, T.H.M. Coordinated Active Power Curtailment of Grid Connected PV Inverters for Overvoltage Prevention. IEEE Trans. Sustain. Energy 2011, 2, 139–147. [Google Scholar] [CrossRef]
  18. Bahramipanah, M.; Torregrossa, D.; Cherkaoui, R.; Paolone, M. A Decentralized Adaptive Model-Based Real-Time Control for Active Distribution Networks Using Battery Energy Storage Systems. IEEE Trans. Smart Grid 2018, 9, 3406–3418. [Google Scholar] [CrossRef]
  19. Nour, A.M.M.; Helal, A.A.; El-Saadawi, M.M.; Hatata, A.Y. Voltage imbalance mitigation in an active distribution network using decentralized current control. Prot. Control Mod. Power Syst. 2023, 8, 20. [Google Scholar] [CrossRef]
  20. Procopiou, A.T.; Petrou, K.; Ochoa, L.F.; Langstaff, T.; Theunissen, J. Adaptive Decentralized Control of Residential Storage in PV-Rich MV–LV Networks. IEEE Trans. Power Syst. 2019, 34, 2378–2389. [Google Scholar] [CrossRef]
  21. Khan, M.H.; Zulkifli, S.A.; Tutkun, N.; Burgio, A. Adaptive Virtual Impedance Control with MPC’s Cost Function for DG Inverters in a Microgrid with Mismatched Feeder Impedances for Future Energy Communities. Sustainability 2024, 16, 525. [Google Scholar] [CrossRef]
  22. Wang, L.; Dubey, A.; Gebremedhin, A.H.; Srivastava, A.K.; Schulz, N. MPC-Based Decentralized Voltage Control in Power Distribution Systems with EV and PV Coordination. IEEE Trans. Smart Grid 2022, 13, 2908–2919. [Google Scholar] [CrossRef]
  23. Then, J.; Agalgaonkar, A.P.; Muttaqi, K.M. Coordinated Charging of Spatially Distributed Electric Vehicles for Mitigating Voltage Rise and Voltage Unbalance in Modern Distribution Networks. IEEE Trans. Ind. Appl. 2023, 59, 5149–5157. [Google Scholar] [CrossRef]
  24. Yu, H.; Xu, C.; Wang, W.; Geng, G.; Jiang, Q. Communication-Free Distributed Charging Control for Electric Vehicle Group. IEEE Trans. Smart Grid 2023, 15, 3028–3039. [Google Scholar] [CrossRef]
  25. Anderson, T.; Muralidharan, M.; Srivastava, P.; Haghi, H.V.; Cortés, J.; Kleissl, J.; Martínez, S.; Washom, B. Frequency Regulation with Heterogeneous Energy Resources: A Realization Using Distributed Control. IEEE Trans. Smart Grid 2021, 12, 4126–4136. [Google Scholar] [CrossRef]
  26. Zhao, T.; Parisio, A.; Milanović, J.V. Location-dependent distributed control of battery energy storage systems for fast frequency response. Int. J. Electr. Power Energy Syst. 2021, 125, 106493. [Google Scholar] [CrossRef]
  27. Morstyn, T.; Savkin, A.V.; Hredzak, B.; Agelidis, V.G. Multi-Agent Sliding Mode Control for State of Charge Balancing Between Battery Energy Storage Systems Distributed in a DC Microgrid. IEEE Trans. Smart Grid 2018, 9, 4735–4743. [Google Scholar] [CrossRef]
  28. Xia, S.; Bu, S.; Wan, C.; Lu, X.; Chan, K.W.; Zhou, B. A Fully Distributed Hierarchical Control Framework for Coordinated Operation of DERs in Active Distribution Power Networks. IEEE Trans. Power Syst. 2019, 34, 5184–5197. [Google Scholar] [CrossRef]
  29. Nguyen, D.H.; Khazaei, J. Unified Distributed Control of Battery Storage with Various Primary Control in Power Systems. IEEE Trans. Sustain. Energy 2021, 12, 2332–2341. [Google Scholar] [CrossRef]
  30. Meng, T.; Lin, Z.; Wan, Y.; Shamash, Y.A. State-of-Charge Balancing for Battery Energy Storage Systems in DC Microgrids by Distributed Adaptive Power Distribution. IEEE Control Syst. Lett. 2022, 6, 512–517. [Google Scholar] [CrossRef]
  31. Engels, J.; Claessens, B.; Deconinck, G. Grid-Constrained Distributed Optimization for Frequency Control with Low-Voltage Flexibility. IEEE Trans. Smart Grid 2020, 11, 612–622. [Google Scholar] [CrossRef]
  32. Zhang, Z.; Dou, C.; Yue, D.; Xue, Y.; Xie, X.; Deng, C.; Zhang, B. Voltage Sensitivity-Related Hybrid Coordinated Power Control for Voltage Regulation in ADNs. IEEE Trans. Smart Grid 2024, 15, 1388–1398. [Google Scholar] [CrossRef]
  33. Gao, Y.; Wang, W.; Yu, N. Consensus Multi-Agent Reinforcement Learning for Volt-VAR Control in Power Distribution Networks. IEEE Trans. Smart Grid 2021, 12, 3594–3604. [Google Scholar] [CrossRef]
  34. Long, Y.; Elliott, R.T.; Kirschen, D.S. Adaptive Coalition Formation-Based Coordinated Voltage Regulation in Distribution Networks. IEEE Trans. Power Syst. 2022, 37, 2005–2018. [Google Scholar] [CrossRef]
  35. Jasim, A.M.; Jasim, B.H.; Aymen, F.; Kotb, H.; Althobaiti, A. Consensus-based intelligent distributed secondary control for Multiagent Islanded Microgrid. Int. Trans. Electr. Energy Syst. 2023, 2023, 6812351. [Google Scholar] [CrossRef]
  36. Amirkhani, A.; Barshooi, A.H. Consensus in multi-agent systems: A review. Artif. Intell. Rev. 2022, 55, 3897–3935. [Google Scholar] [CrossRef]
  37. Olfati-Saber, R.; Fax, J.A.; Murray, R.M. Consensus and Cooperation in Networked Multi-Agent Systems. Proc. IEEE 2007, 95, 215–233. [Google Scholar] [CrossRef]
  38. Zeraati, M.; Hamedani Golshan, M.E.; Guerrero, J.M. Distributed Control of Battery Energy Storage Systems for Voltage Regulation in Distribution Networks with High PV Penetration. IEEE Trans. Smart Grid 2018, 9, 3582–3593. [Google Scholar] [CrossRef]
  39. Wang, Y.; Tan, K.T.; Peng, X.Y.; So, P.L. Coordinated Control of Distributed Energy-Storage Systems for Voltage Regulation in Distribution Networks. IEEE Trans. Power Deliv. 2016, 31, 1132–1141. [Google Scholar] [CrossRef]
  40. Specialized Power Systems. 2025. Available online: https://www.mathworks.com/help/sps/specialized-power-systems.html (accessed on 15 August 2025).
  41. PV Array—Simscape Electrical Specialized Power Systems (Renewables). Available online: https://nl.mathworks.com/help/sps/powersys/ref/pvarray.html (accessed on 19 August 2025).
  42. Battery—Simscape Electrical Specialized Power Systems (Renewables). Available online: https://nl.mathworks.com/help/sps/powersys/ref/battery.html (accessed on 19 August 2025).
  43. Gantenbein, S.; Schönleber, M.; Weiss, M.; Ivers-Tiffée, E. Capacity Fade in Lithium-Ion Batteries and Cyclic Aging over Various State-of-Charge Ranges. Sustainability 2019, 11, 6697. [Google Scholar] [CrossRef]
Figure 1. CIGRE LV test distribution network.
Energies 18 04566 g001
Figure 2. Communication graph of the BESS.
Energies 18 04566 g002
Figure 3. Leader–follower coordination strategy algorithm.
Energies 18 04566 g003
Figure 4. Net grid exchange power (mismatch) per node considering the base load and PV generation.
Energies 18 04566 g004
Figure 5. Voltage magnitude of buses with no control implemented.
Energies 18 04566 g005
Figure 6. Voltage magnitude of buses using leader–follower coordination strategy.
Energies 18 04566 g006
Figure 7. Utilization factors of BESS using leader–follower coordination strategy.
Energies 18 04566 g007
Figure 8. S o C of BESS using leader–follower coordination strategy.
Energies 18 04566 g008
Figure 9. S o C profile of BESS using leader–follower coordination strategy while varying the initial S o C .
Energies 18 04566 g009
Figure 10. Voltage magnitude of buses using leader–follower coordination strategy while varying the initial S o C .
Energies 18 04566 g010
Figure 11. (a) Changes in utilization factor between normal operation and operation with one BESS unit unavailable; (b) power contributed by BESS 4 under normal operation compared to when BESS 4 becomes unavailable.
Energies 18 04566 g011
Figure 12. Voltage magnitude of buses using decentralized control.
Energies 18 04566 g012
Figure 13. Power contribution of BESS 3 with coordinated control (blue) vs. decentralized control strategy (orange).
Energies 18 04566 g013
Figure 14. Voltage magnitude of buses using decentralized control when BESS 4 becomes unavailable.
Energies 18 04566 g014
Figure 15. Voltage magnitude of buses with decentralised droop control implemented.
Energies 18 04566 g015
Figure 16. Comparison between the decentralized droop control strategy and the proposed coordination strategy, showing the power delivered by (a) BESS 3 and (b) BESS 6.
Energies 18 04566 g016
Figure 17. Calculation of the utilization factors in the leaderless approach. The positive utilization factor represents charging, while the negative one represents discharging.
Energies 18 04566 g017
Figure 18. Voltage magnitude of buses using the leaderless coordination method. All bus voltages are kept within limits of 0.95 and 1.05 p.u.
Energies 18 04566 g018
Figure 19. Utilization factors of BESS using the leaderless coordination method. A positive utilization factor represents charging, while a negative utilization factor represents discharging.
Energies 18 04566 g019
Figure 20. S o C profile of BESS using the leaderless coordination method.
Energies 18 04566 g020
Figure 21. Power profiles of BESS using the leaderless coordination method. This profile mimics the utilization factors profile shown in Figure 19.
Energies 18 04566 g021
Figure 22. S o C profile under extended simulation. The differences in S o C between batteries are kept low using (15).
Energies 18 04566 g022
Table 1. Literature review summary.
Identified Research GapReference
DSO Asset OwnershipMV or HV OrientedFull Observability
XXX [8]
XXX [9]
XXX [10]
X X [11]
X X [12]
X X [13]
XXX [14]
XXX [16]
X [17]
XX [18]
X [19]
X [20]
X [21]
XX [22]
XX [23]
X [25]
XX [26]
XXX [28]
X X [29]
X [31]
XX [32]
XXX [33]
Table 2. Per-node sizes considered for the PV and BESS.
NodeBESS AgentPPV [kW]PBESS [kW]EBESS [kWh]
11115.538
1129430
15312640
164115.538
1759.54.532
18612640
Disclaimer/Publisher’s Note: The statements, opinions and data contained in all publications are solely those of the individual author(s) and contributor(s) and not of MDPI and/or the editor(s). MDPI and/or the editor(s) disclaim responsibility for any injury to people or property resulting from any ideas, methods, instructions or products referred to in the content.