1. Introduction
The frequency of an interconnected system is directly related to the instantaneous balance between generation and load. Frequency response is the ability of an interconnected system to arrest decline and stabilize frequency when subjected to disturbances such as sudden loss of generation or load [
1,
2,
3,
4,
5]. To reliably operate a bulk power system, system operators must maintain system frequency within pre-defined limits specified in the relevant grid code. In the West Africa Power Pool (WAPP), the frequency requirement specified in the network standards is a quasi-steady-state frequency deviation of <200 mHz (49.8–50.2 Hz).
Maintaining frequency within acceptable limits requires the system operator to have adequate available generation resources to maintain generation–load balance and to restore system frequency after the occurrence of expected, unexpected, or unplanned events such as generator trips or a major transmission line outage.
In modern power systems, primary frequency response is typically provided by automatic governor action on the prime movers of conventional thermal or hydropower plants; secondary frequency response is provided by automatic generation control (AGC). This frequency control structure is well established in mature grids such as those operated by PJM, CAISO, and the continental European grid, where frequency control provision has been implemented over decades, with ongoing innovations supported by regulatory frameworks and ancillary services markets [
2,
3,
4,
5,
6,
7,
8,
9,
10,
11].
However, in the WAPPITS, there have been persistent challenges with frequency control. The WAPPITS experiences chaotic frequency fluctuations and has a patchwork of country-level regulatory requirements, unlike more developed grid operators. These issues have raised questions about the underlying causes of inadequate frequency control in the WAPPITS. The authors established in [
6,
7,
8] that, due to a lack of primary frequency control reserves in the WAPPITS, operators systematically use under-frequency load shedding as a primary means of regulating frequency. Longer-term plans for the WAPPITS include rapid increase in renewable resources. This increase makes frequency control requirements a topical subject, as the integration of inverter-based resources does not readily provide system inertia and primary frequency response [
12,
13,
14,
15,
16,
17,
18,
19,
20,
21]. Technical and financial partners have strongly encouraged BESS implementations for primary, and in some cases secondary, frequency control in the WAPPITS. These entities commonly reference experience with system operations in developed countries, where primary and secondary frequency control has a long operational history.
While developed grids are now exploring the integration of BESSs to complement or enhance frequency control—often in response to growing shares of inverter-based renewables, the WAPPITS faces a fundamentally different challenge: the absence of frequency control reserves from a grid with predominantly conventional power plants such as hydro and thermal (gas and crude). This context presents a unique opportunity to examine frequency control not as modification of an existing, well-established and functional system, but as a system-defining tradeoff between conventional and storage-based resources such as BESSs.
In [
7], the authors presented a first-order numerical analysis using simplified open-loop models and historic WAPPITS frequency data. That study examined the role and effectiveness of BESSs in providing primary frequency response. The findings suggested that, while BESSs can technically respond quickly to frequency variations, it may not represent a cost-effective solution under current system conditions. The study recommended changes to regulatory and technical frameworks to require conventional power plants to provide sufficient primary frequency control reserves.
This paper builds upon the analytical foundations laid in [
6,
7,
8] using simulations to assess mixes of conventional and BESS primary frequency reserves (PFRs) in the WAPPITS. The study uses PSS
®E simulations of a fully interconnected WAPPITS grid model. The model had been recently tuned using field-test data. The study is restricted to primary frequency response; secondary frequency response is not simulated or analyzed. Simulations provide a first-order analysis of the techno-economic tradeoff between frequency control effectiveness and cost for a range of BESS/conventional mixes.
This approach acknowledges the growing interest in BESSs among development partners and regional stakeholders but also grounds the evaluation in the practical realities of the WAPPITS. Specifically, prior studies of this topic were primarily conducted on developed grids, evaluating BESSs as a new component within well-established frequency control mechanisms. Current research shows that in weak and low-inertia grids, BESSs can offer significant stability benefits. For example, grid-forming and fast-responding BESSs have shown the capability to prevent frequency collapse during disturbances in converter-dominated systems and improve overall frequency response performance [
9,
10,
11,
12]. Similarly, other research findings have also shown that the optimal sizing and placement of BESSs in weak grids can improve both voltage and frequency stability, mitigate sub-synchronous oscillations, and support greater renewable integration [
9,
12,
13].
In this context, we examine BESSs in the context of the WAPPITS: a relatively weak grid characterized by lower energy intensity, constrained investment, and a large and marginally interconnected geographical coverage [
14]. Currently, the WAPPITS has few functioning PFRs. Thus, the study represents a ‘green field’ analysis of how to implement a PFR system: conventional, BESSs, or a mixture of the two?
This study (a) examines the effectiveness of BESSs as PFRs in a grid with limited (practically non-existent) primary frequency control reserves from traditional conventional power plants, and (b) develops the techno-economic tradeoffs between combinations of convention and BESS deployments. The analysis highlights the unique tradeoffs in systems like the WAPPITS, where BESSs alone may not enhance frequency control cost-effectively unless paired with the strategic deployment of conventional PFRs through the implementation of regulatory and market reforms. Finally, the paper provides context-specific recommendations tailored to the WAPPITS to guide realistic and cost-effective pathways for implementing frequency control.
The paper is organized as follows:
Section 2 presents frequency control in the WAPPITS,
Section 3 outlines the methodology,
Section 4 details the results, and, finally,
Section 5 presents the conclusions.
2. Frequency Control in the WAPP Interconnected Transmission
The WAPP interconnected power system is comprised of the power systems of 14 countries: Benin, Burkina Faso, Cote d’Ivoire, Gambia, Ghana, Guinea, Guinea Bissau, Liberia, Mali, Niger, Nigeria, Senegal, Sierra Leone, and Togo. The currently installed generation capacity is approximately 29 GW, with an average generation availability of 17 GW (60%). The WAPP transmission network has more than 42,993 circuit kilometers of high-voltage transmission lines with voltage levels of 90–330 kV.
Prior to having the power system of all fourteen (14) mainland ECOWAS countries interconnected and a single entity (WAPP Information Coordination Center) coordinating regional reliability efforts, national TSOs operated their grids independently, based on their own operational procedures, frequency control practices, and grid codes. Frequency control provision was either non-existent or minimal. Only a few TSOs implemented primary frequency control, while most systems operated without automatic frequency response. The lack of frequency control exposed the WAPPITS to disturbances, often requiring under-frequency load shedding [
6,
7,
8].
The WAPPITS’ inherent challenges are illustrated by comparison to the California ISO. CAISO has a similar length of transmission line (41,850 km) to service a land area 7% of the WAPPITS’ area (340,000 versus 5 million
), with a peak generation three times that of the WAPPITS (88 GW), all within one sub-national political jurisdiction. The WAPPITS’ long lines, widely distributed power plants, and highly dispersed loads produce exceptional grid control challenges. Additionally, CAISO has a well-developed ancillary services market providing the full range of services; the WAPPITS only operates an energy provision market [
6].
3. Methodology
This section discusses the methodology adopted to simulate and analyze frequency control in the WAPPITS.
3.1. Simulation Models
Modified WAPP Interconnected Network Model: For the purposes of this research, the simulations and analysis were performed using a slightly modified static (.sav) and dynamic (.dyr) model of the WAPP Power System. Dynamic data from selected power plants were updated using field test measurements to enhance their dynamic response and bring their dynamic behavior closer to actual operating conditions.
PSS/E Generic Models: To simulate dynamic behavior of the BESSs, a generic generator/converter model (REGC_A), an electrical control model (REEC_C), and an energy plant controller (REPC_A) in the PSS/E Model Library [
15] were used.
3.2. BESS Modeling
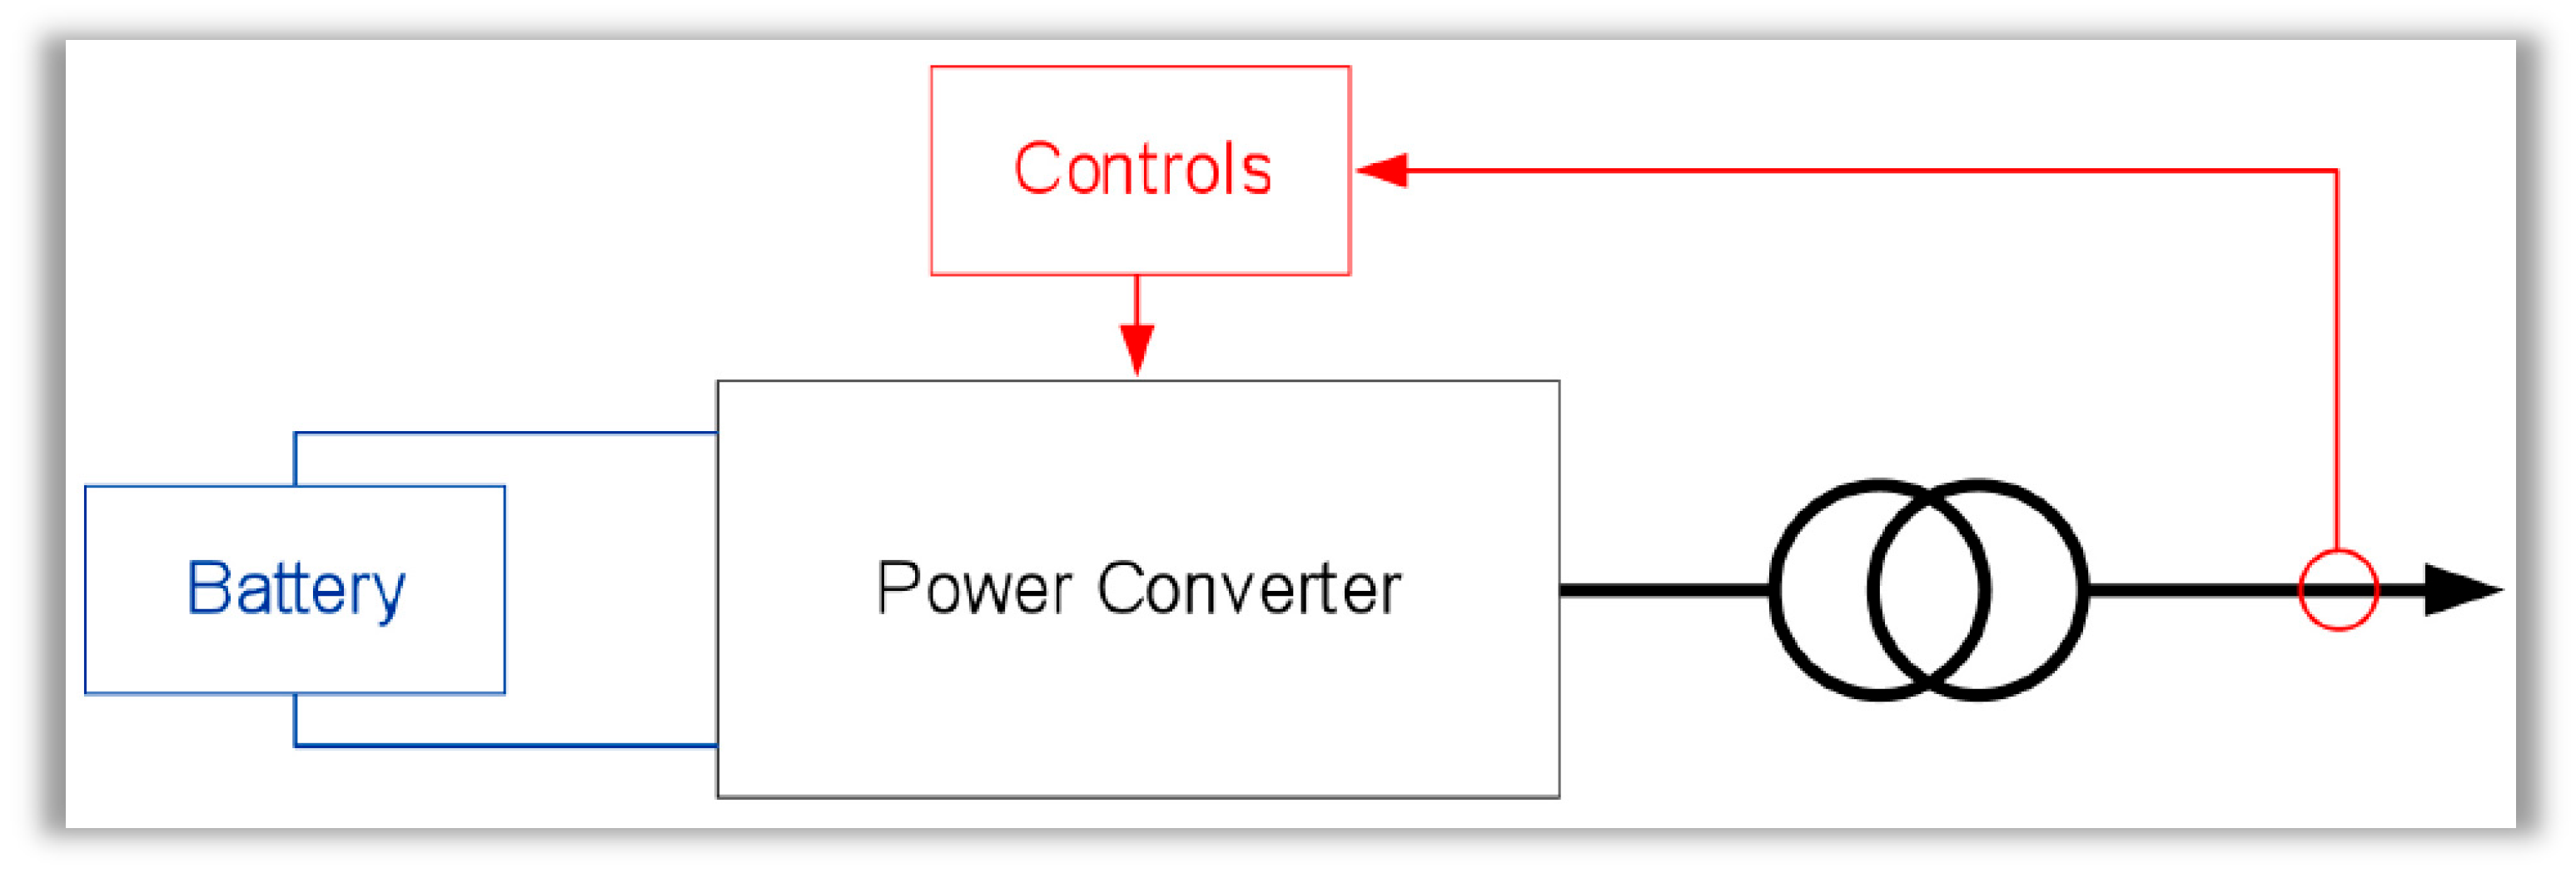
A complete Battery Energy Storage System (BESS) is comprised of three (3) major components, as shown in
Figure 1. The battery module stores electrical energy; the power electronic converter converts DC to AC, which is injected into the grid. The digital controls of the BESS provide the various functionalities of the BESS system.
The BESS was modelled using a single generic renewable machine connected to the grid in steady-state operation.
PSS/E generic models with standard parameters were used to assess BESS dynamic behavior. The model consisted of three (3) modules, namely
REGC_A—the renewable energy generator/converter model, version a.
REEC_C—the renewable energy electrical controls model, version c.
REPC_A—the renewable energy plant controller, version a.
The generator/converter model (REGC_A) in PSS/E processes the currents, Ipcmd and Iqcmd, from the electrical controller (REEC_C), and sends an active output (Ip) and reactive (Iq) currents into the grid. Ipcmd and Iqcmd are used to help simulate how the converter will respond to grid conditions or setpoints in dynamic simulations.
REEC_C is the electrical controller module that can operate in the four quadrants of the P-Q diagram. It receives active (Pref) and reactive (Qref) power reference inputs from the plant controller (REPC_A), with feedback from the generator output and the voltage terminal. Its output is the active (Ipcmd) and reactive (Iqcmd) currents, which are inputs to the generator/converter module (REGC_A).
The plant controller, REPC_A, processes active power and the frequency to model the active power control or the frequency response. It processes the reactive power and the voltage to model the reactive power control or voltage regulation, and then outputs active (Pref) and reactive (Qref) power references to the electrical controller (REEC_C).
All simulations calculated the frequency response using the maximum N-1 contingency scenario for the combined WAPPITS system and the loss of a 400 MW generation unit. Simulations extended after the contingency event until frequency stabilized, typically at a frequency below the grid frequency of 50 Hz. Secondary response was not simulated; secondary response would bring the frequency back to nominal.
3.3. Metrics for Primary Frequency Response Analysis
Common metrics for frequency response were used to assess simulations (see
Table 1): nadir frequency, nadir time, settling frequency, settling time, and rate of change of frequency (ROCOF) [
16,
17,
18,
19,
20,
21,
22,
23,
24,
25,
26,
27,
28,
29].
3.4. Cost Analysis
To evaluate cost-effectiveness over a 5-year period, the study utilized a basic model (first-order model) for utility-scale BESS implementation developed by the U.S. National Renewable Energy Laboratory (NREL). The cost model considered capital investment and operations and maintenance costs for PFR units [
30,
31]. Typically, to fully estimate the cost and performance of a battery storage system, in addition to the capital costs, other parameters such as the operations and maintenance costs (O&M), degradation, lifetime, and round-trip efficiency assumptions are included. The cost model in [
30] allocated all operating costs to the operations and maintenance cost value with the assumption that the battery performance has been guaranteed over the lifetime, such that the battery, while operating, does not incur any costs to the battery operator. The authors [
30] adopted a high O&M value, consistent with providing approximately one SOC cycle per day and based on the assumption that the O&M cost assumptions include degradation, such that the system will be able to perform at rated capacity through an assumed lifetime of 5 years. While longer evaluation periods are possible, a 5-year horizon was selected because it aligns with the expected period during which the BESS can deliver its full technical capability without significant degradation. This timeframe allows for a meaningful cost–performance comparison with conventional technologies, particularly in the context of early-stage deployment scenarios where asset performance and operational certainty are highest.
The cost model used also assumes one cycle per day. This would be correct only if a robust frequency control market has been implemented. If this is not implemented, the batteries cycle more often, and likely multiple times per day, to restore chronic frequency deviations to reasonable levels. In [
7], it was observed that only enormous battery sizes would be able to provide effective frequency control under chronic frequency deviations and many cycles per day. The storage capacities considered here would be insufficient to correct chronic frequency control problems, causing the BESS units to be at at maximum or minimum SOC most of the time. Therefore, a priori for modeling, we assume that some combination of actions will control the frequency to near 50 Hz at all times except for N-1 contingency events considered here. For scenarios with mostly conventional resources and minimal batteries, this reduces the cycling of the battery, resulting in not more than 1 cycle/day, on average. For scenarios with mostly battery resources, this is not the case, and the BESS units may complete partial cycles multiple times per day, as BESS would need to contribute to routine frequency control as well as the N-1 contingency response.
As a result, our assumption about degradation rates underestimates degradation for scenarios with high reliance on BESSs and likely overestimates degradation for scenarios with low reliance on BESSs (i.e., mostly conventional). We have, in effect, picked a ‘middle of the road’ degradation estimate from modeling performed by NREL, i.e., one cycle per day.
Table 2 presents the cost assumptions. The total cost for assets capable of power output of
:
For BESSs, CAPEX is a combination of the battery storage costs, which scales by hours at full power (storage duration), plus the cost of the inverter power unit, which scales by the maximum power output.
3.5. Description of Scenarios Analyzed
Scenarios were defined to change the mix of PFR assets while holding the total PFRs available to the N-1 contingency requirement of 400 MW. The reference case (Scenario 0, case 0) is the current conditions in the WAPPITS—approximately 150 MW of conventional PFRs, with the remaining 250 MW provided by under-frequency load shedding (UFLS). Scenario 1, Cases 1–5, simulates a mix ranging from fully conventional to full BESS resources, under the assumption that pre-disturbance frequency was near 50 Hz. Scenario 2, Cases 6–10, repeats the mix of PFR assets, under the current condition where the pre-disturbance frequency is chaotically different from 50 Hz. Scenarios are summarized in
Table 3.
4. Results and Analysis
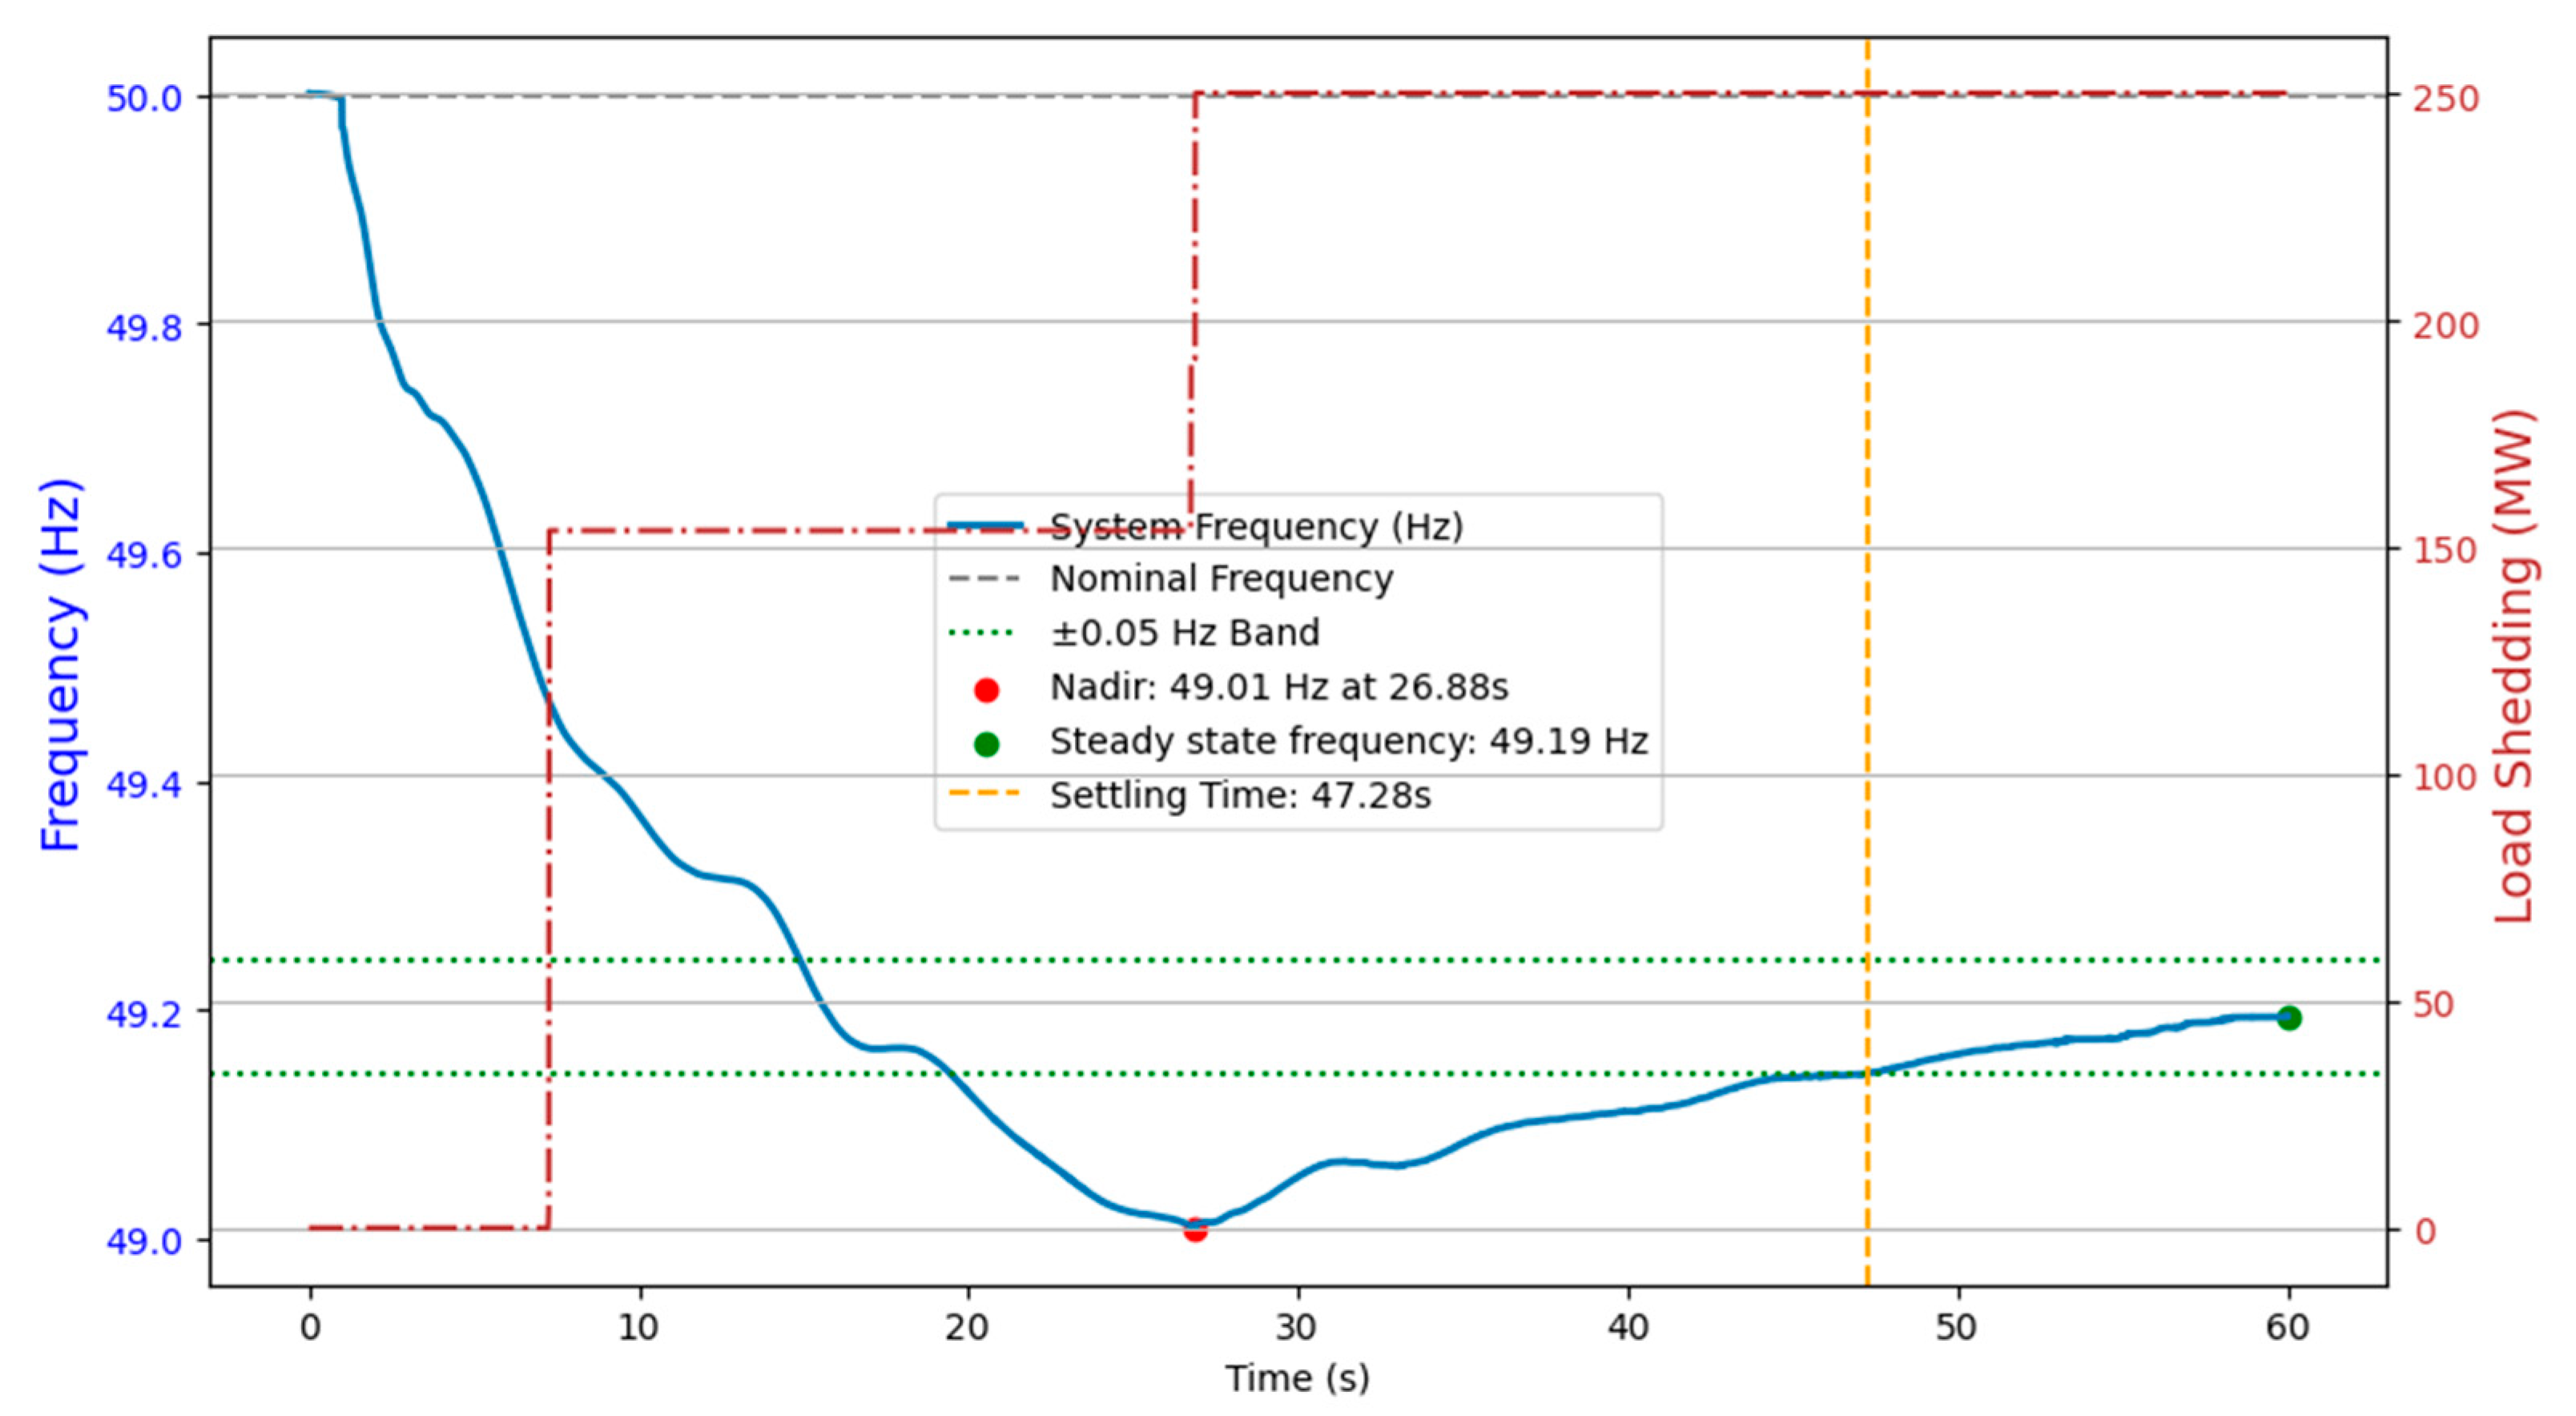
Figure 2 below shows the frequency response and load shedding (MW) for Case 0, status quo with limited primary frequency control reserves. The lack of sufficient primary frequency control reserves caused frequency to drop quickly after the disturbance, and it reached the UFLS threshold of 49.5 Hz. At this point, automatic under-frequency load shedding relays triggered to shed 250 MW in two stages (shown by red dot line in
Figure 2), which arrested the arrest frequency decline at 49 Hz.
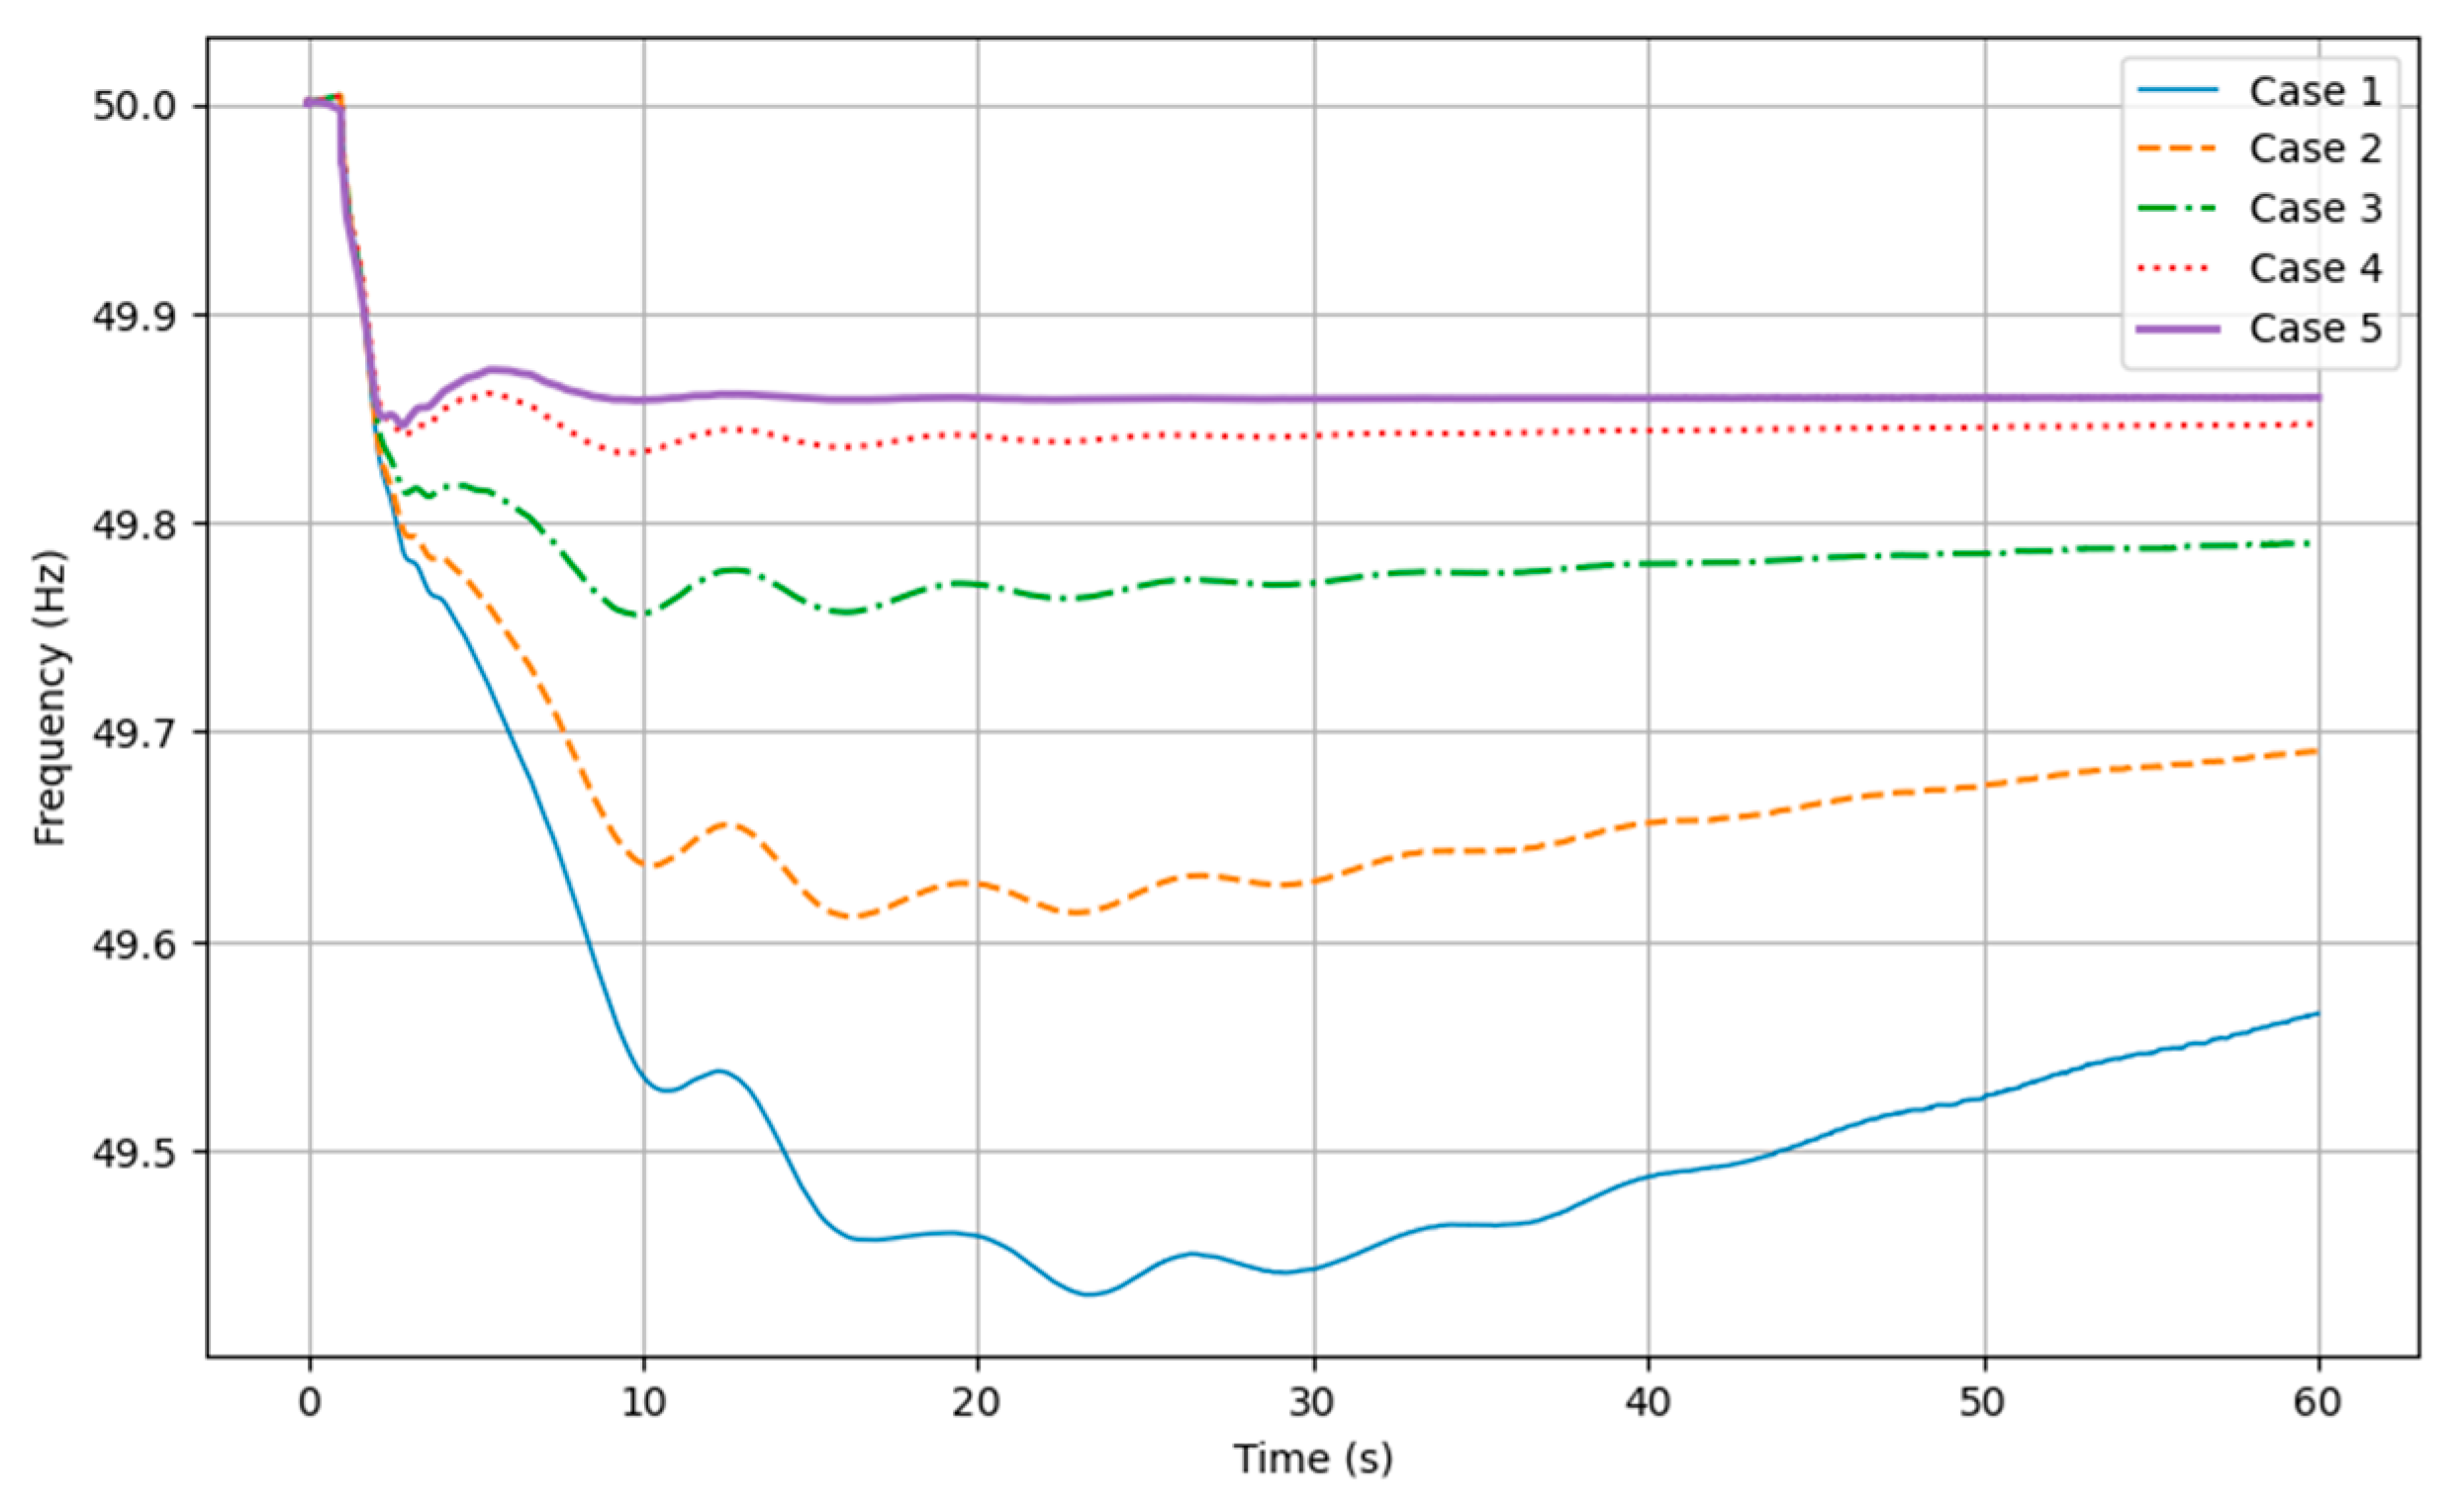
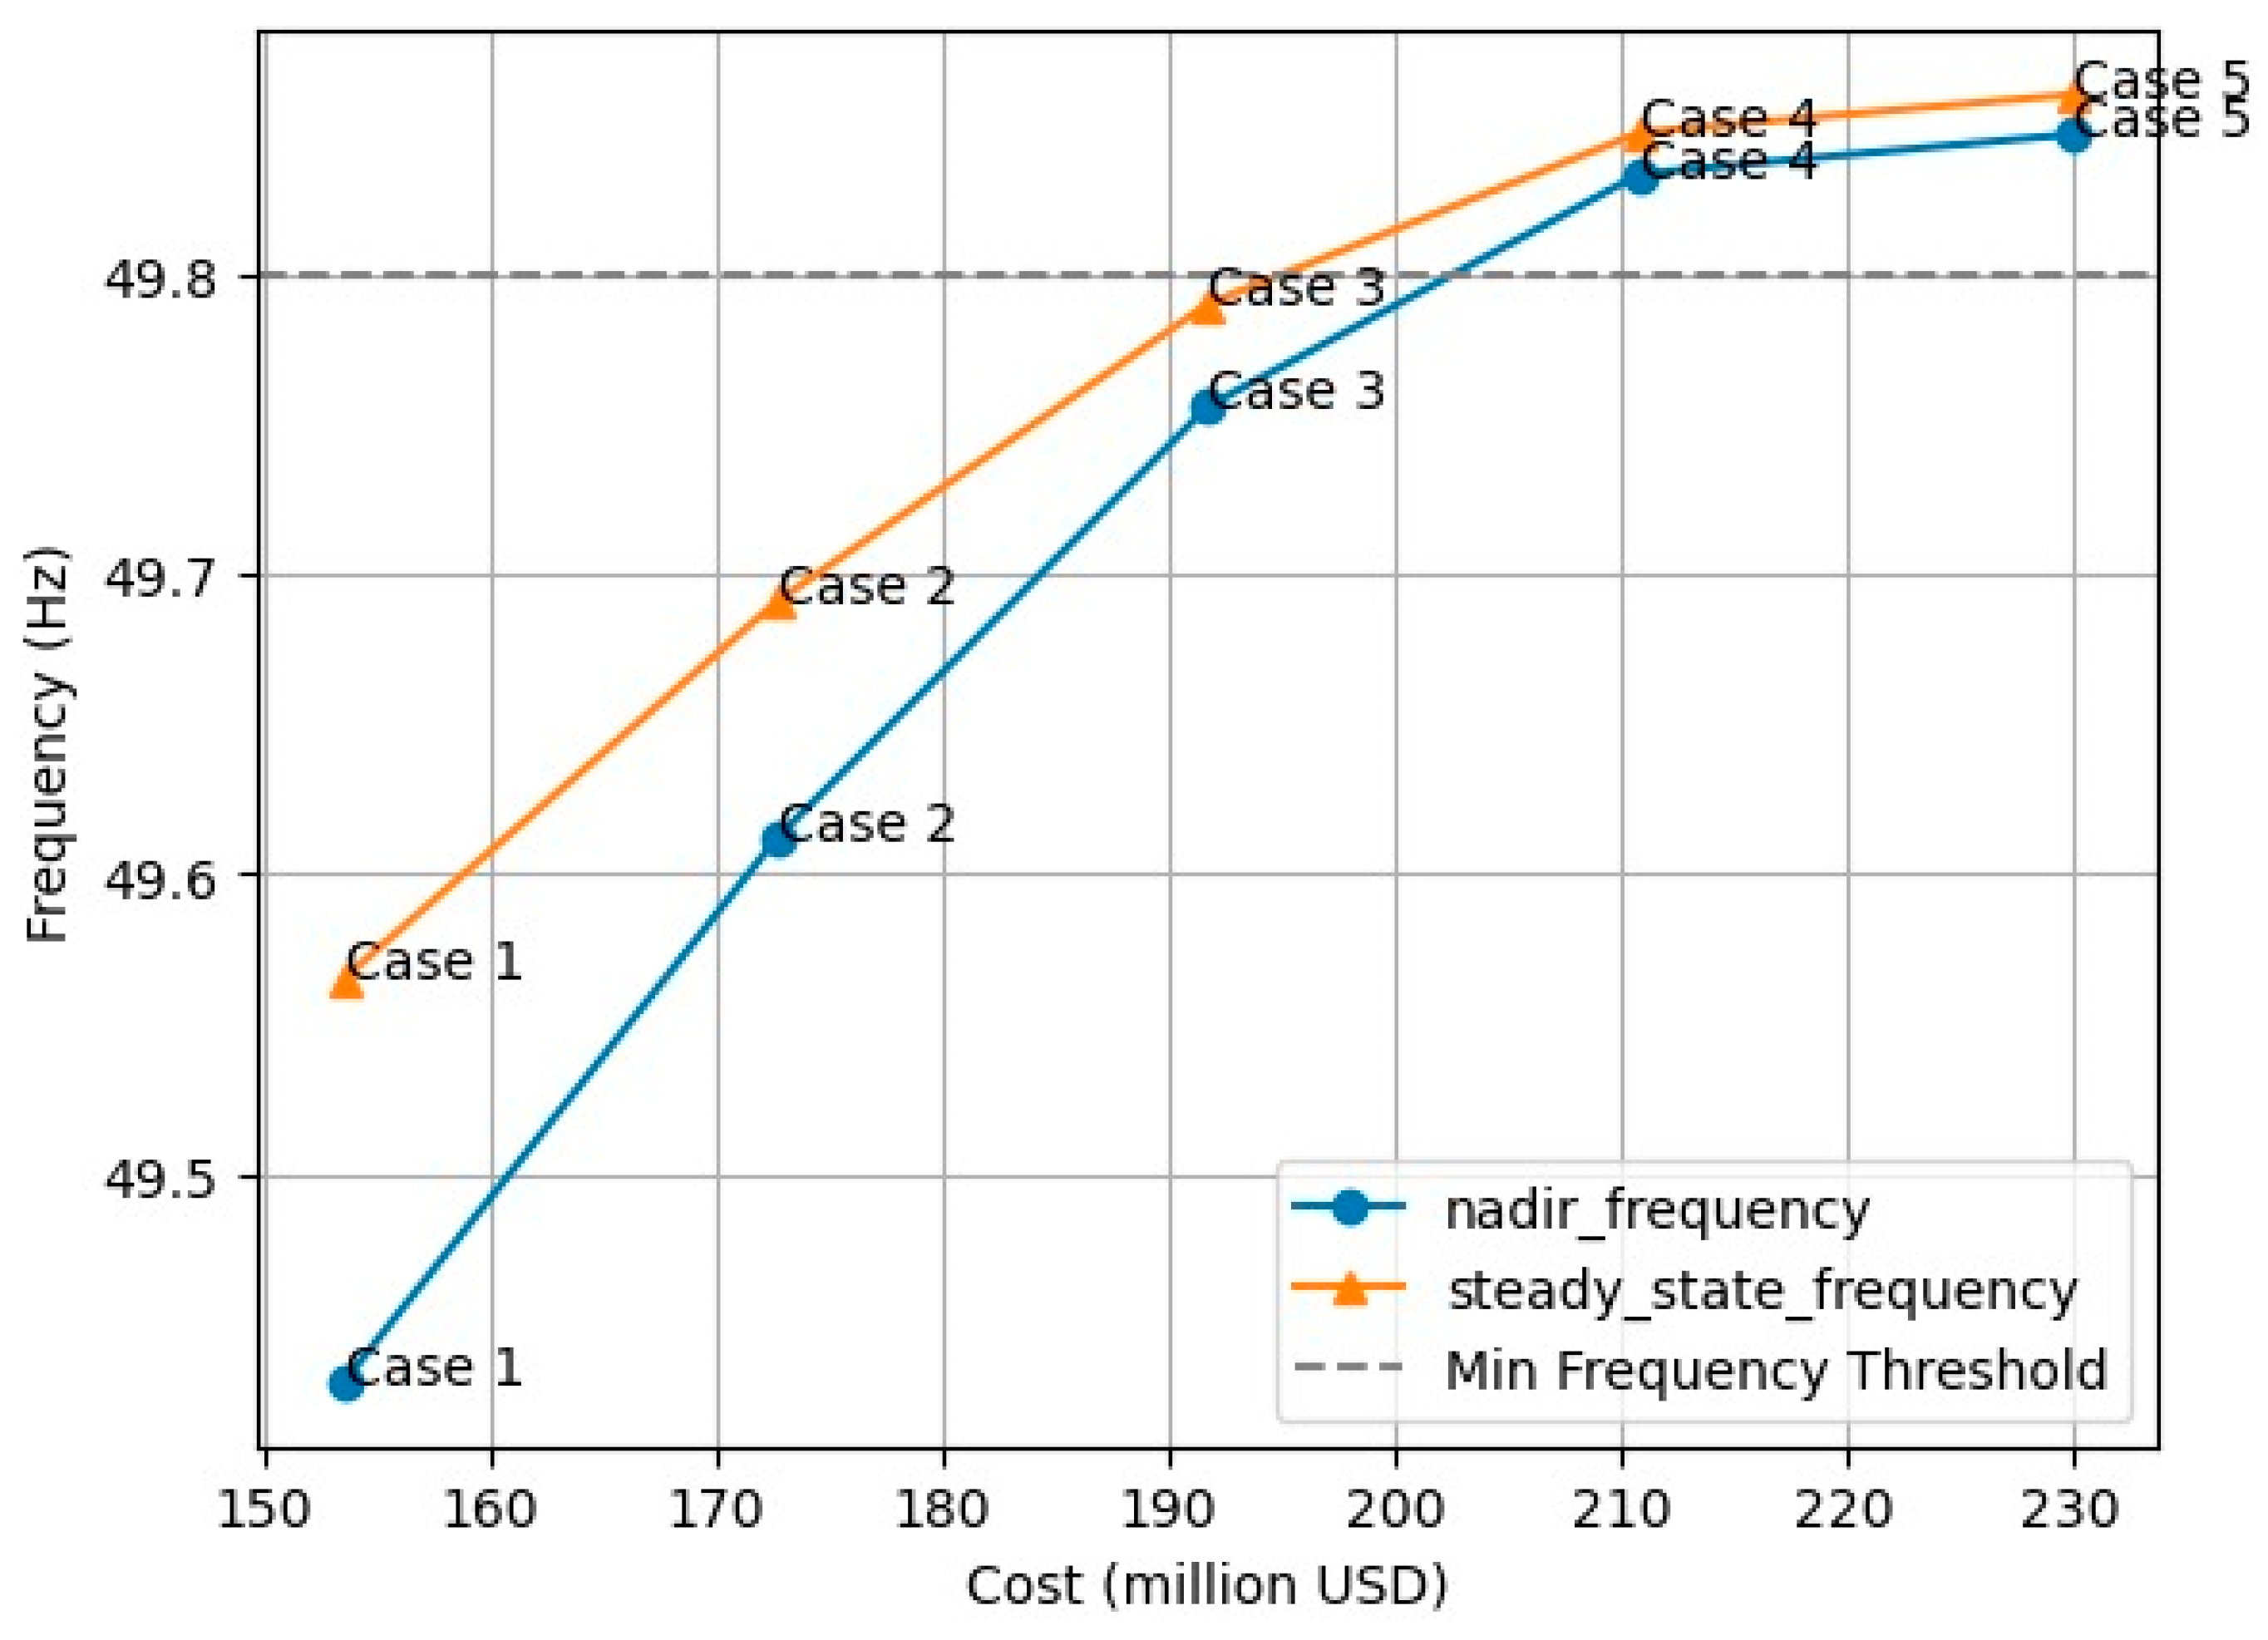
Figure 3 illustrates the frequency response and system performance for different mixes of PFRs for Cases 1–5, extreme mixes: Case 1, all conventional PFRs, and Case 5, all BESS PFRs. The metrics in
Table 1 were extracted from these results and compiled into
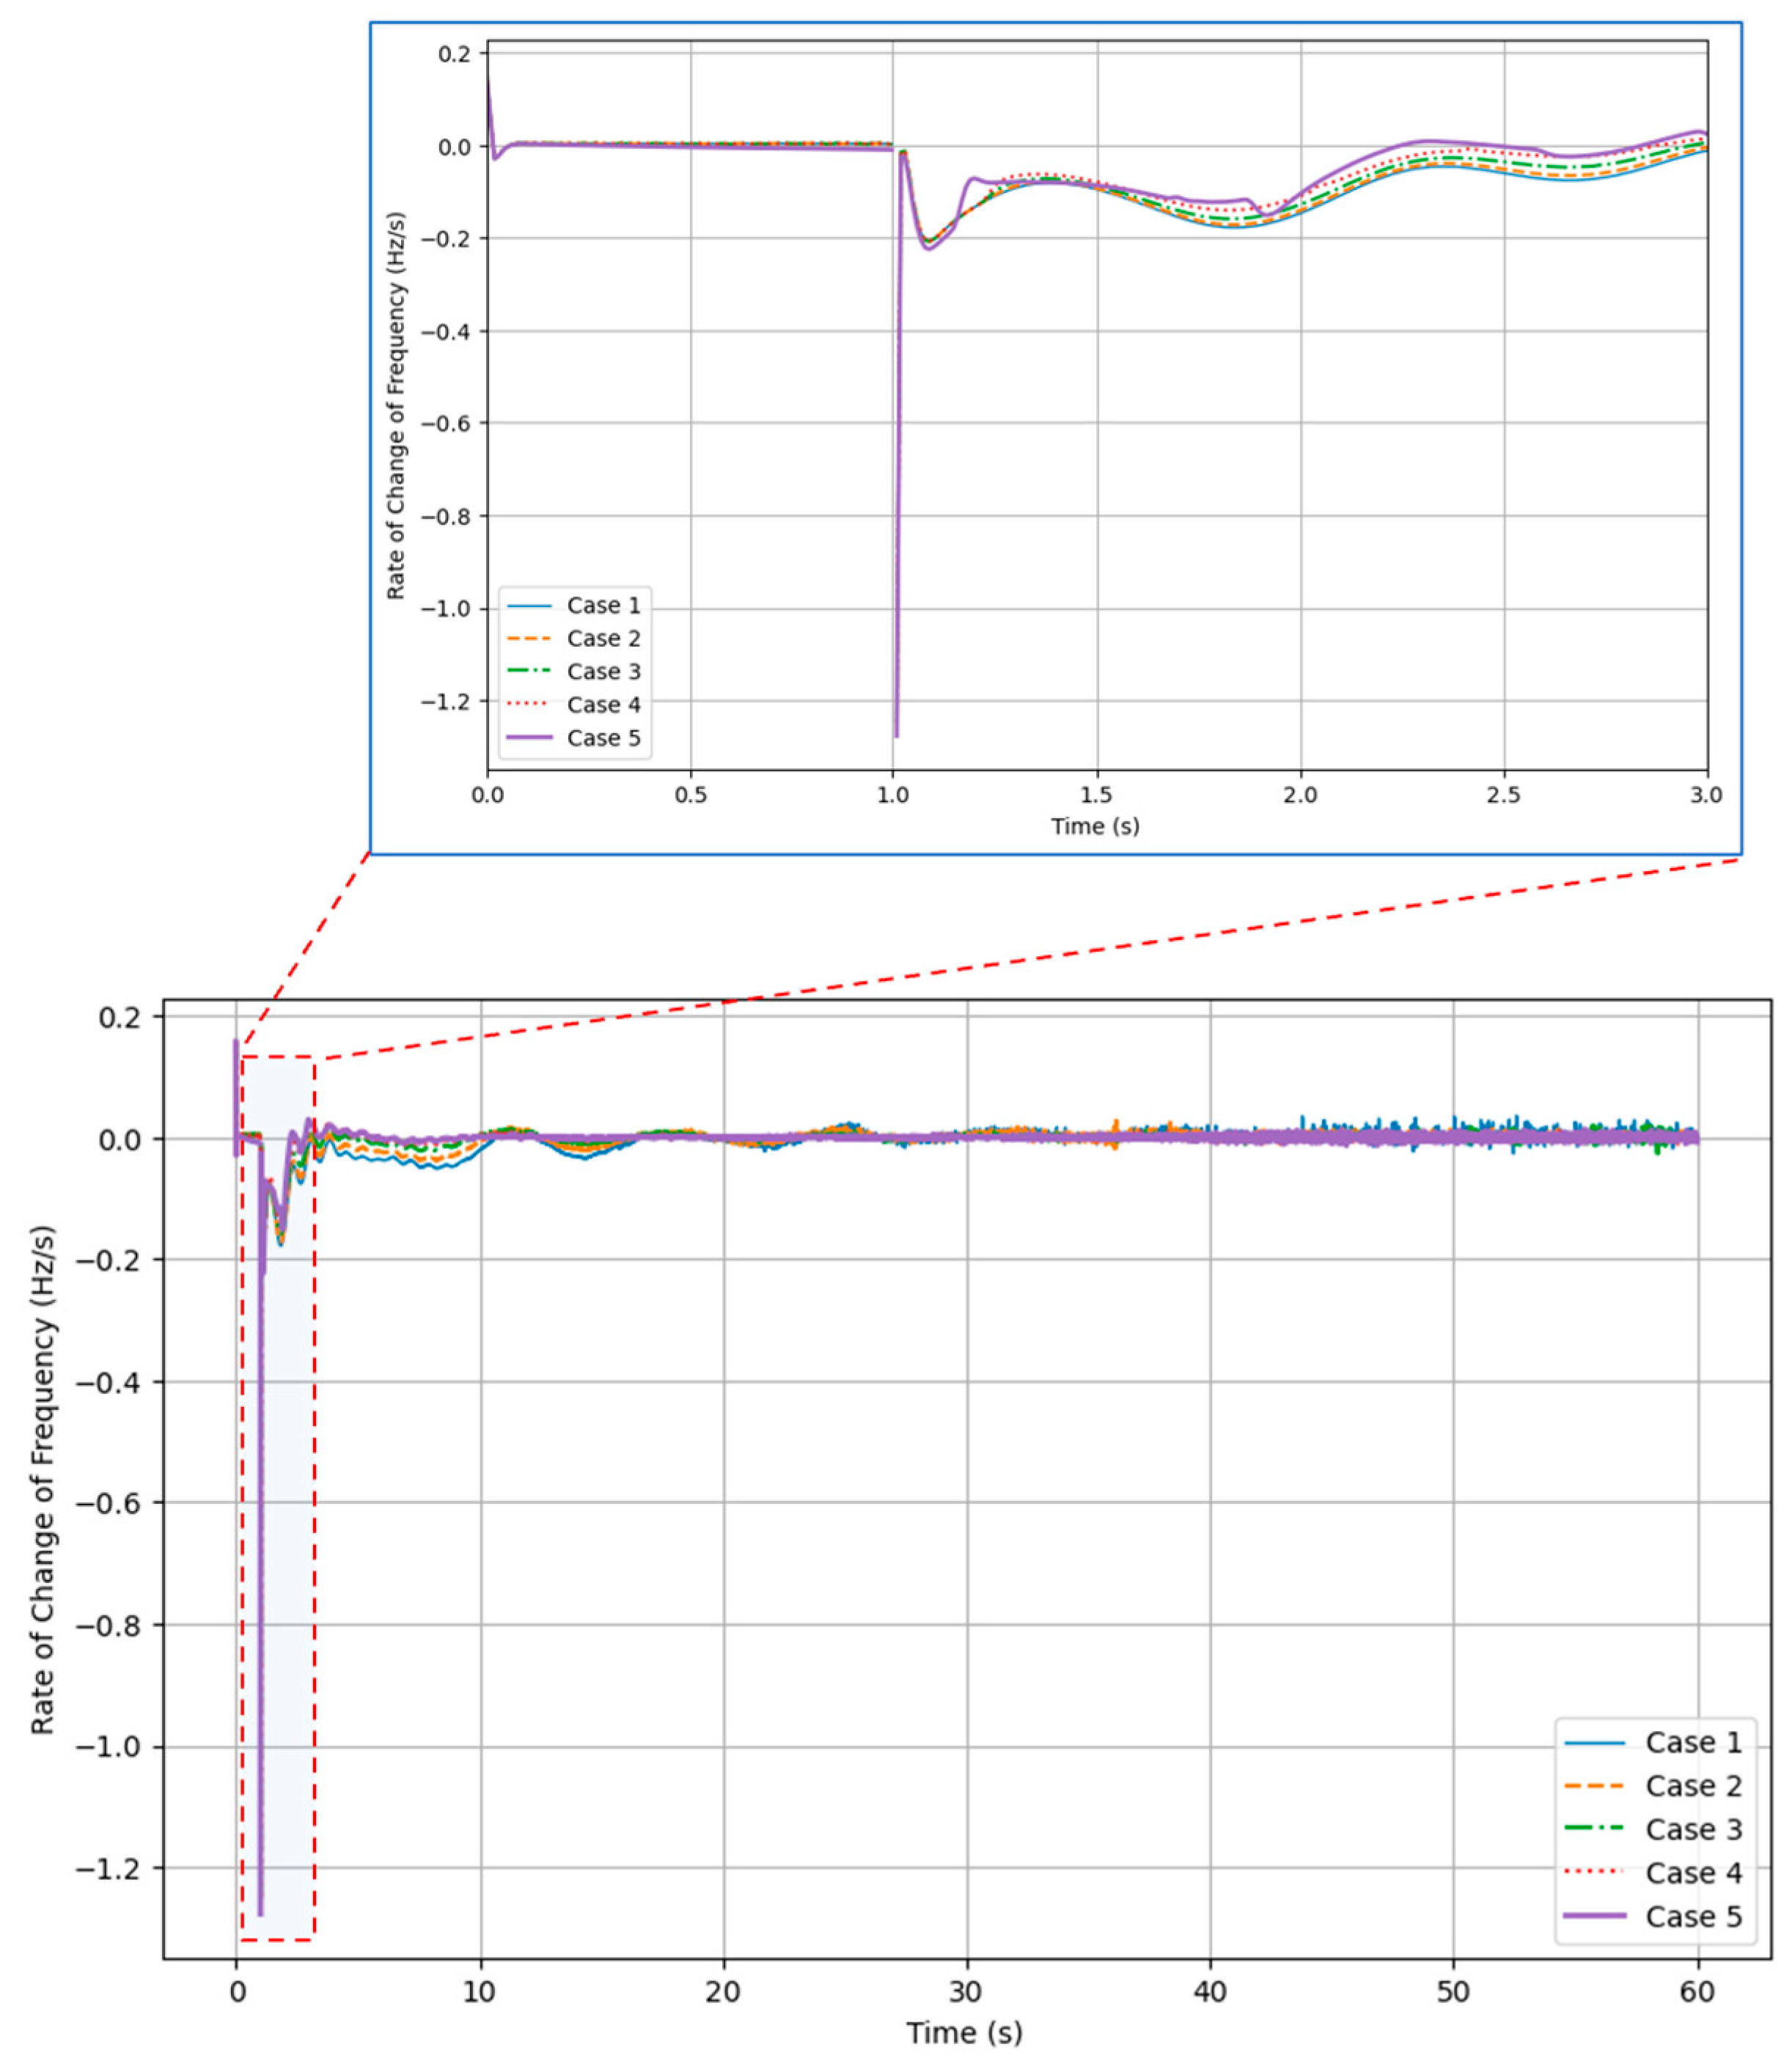
Table 4. Similarly,
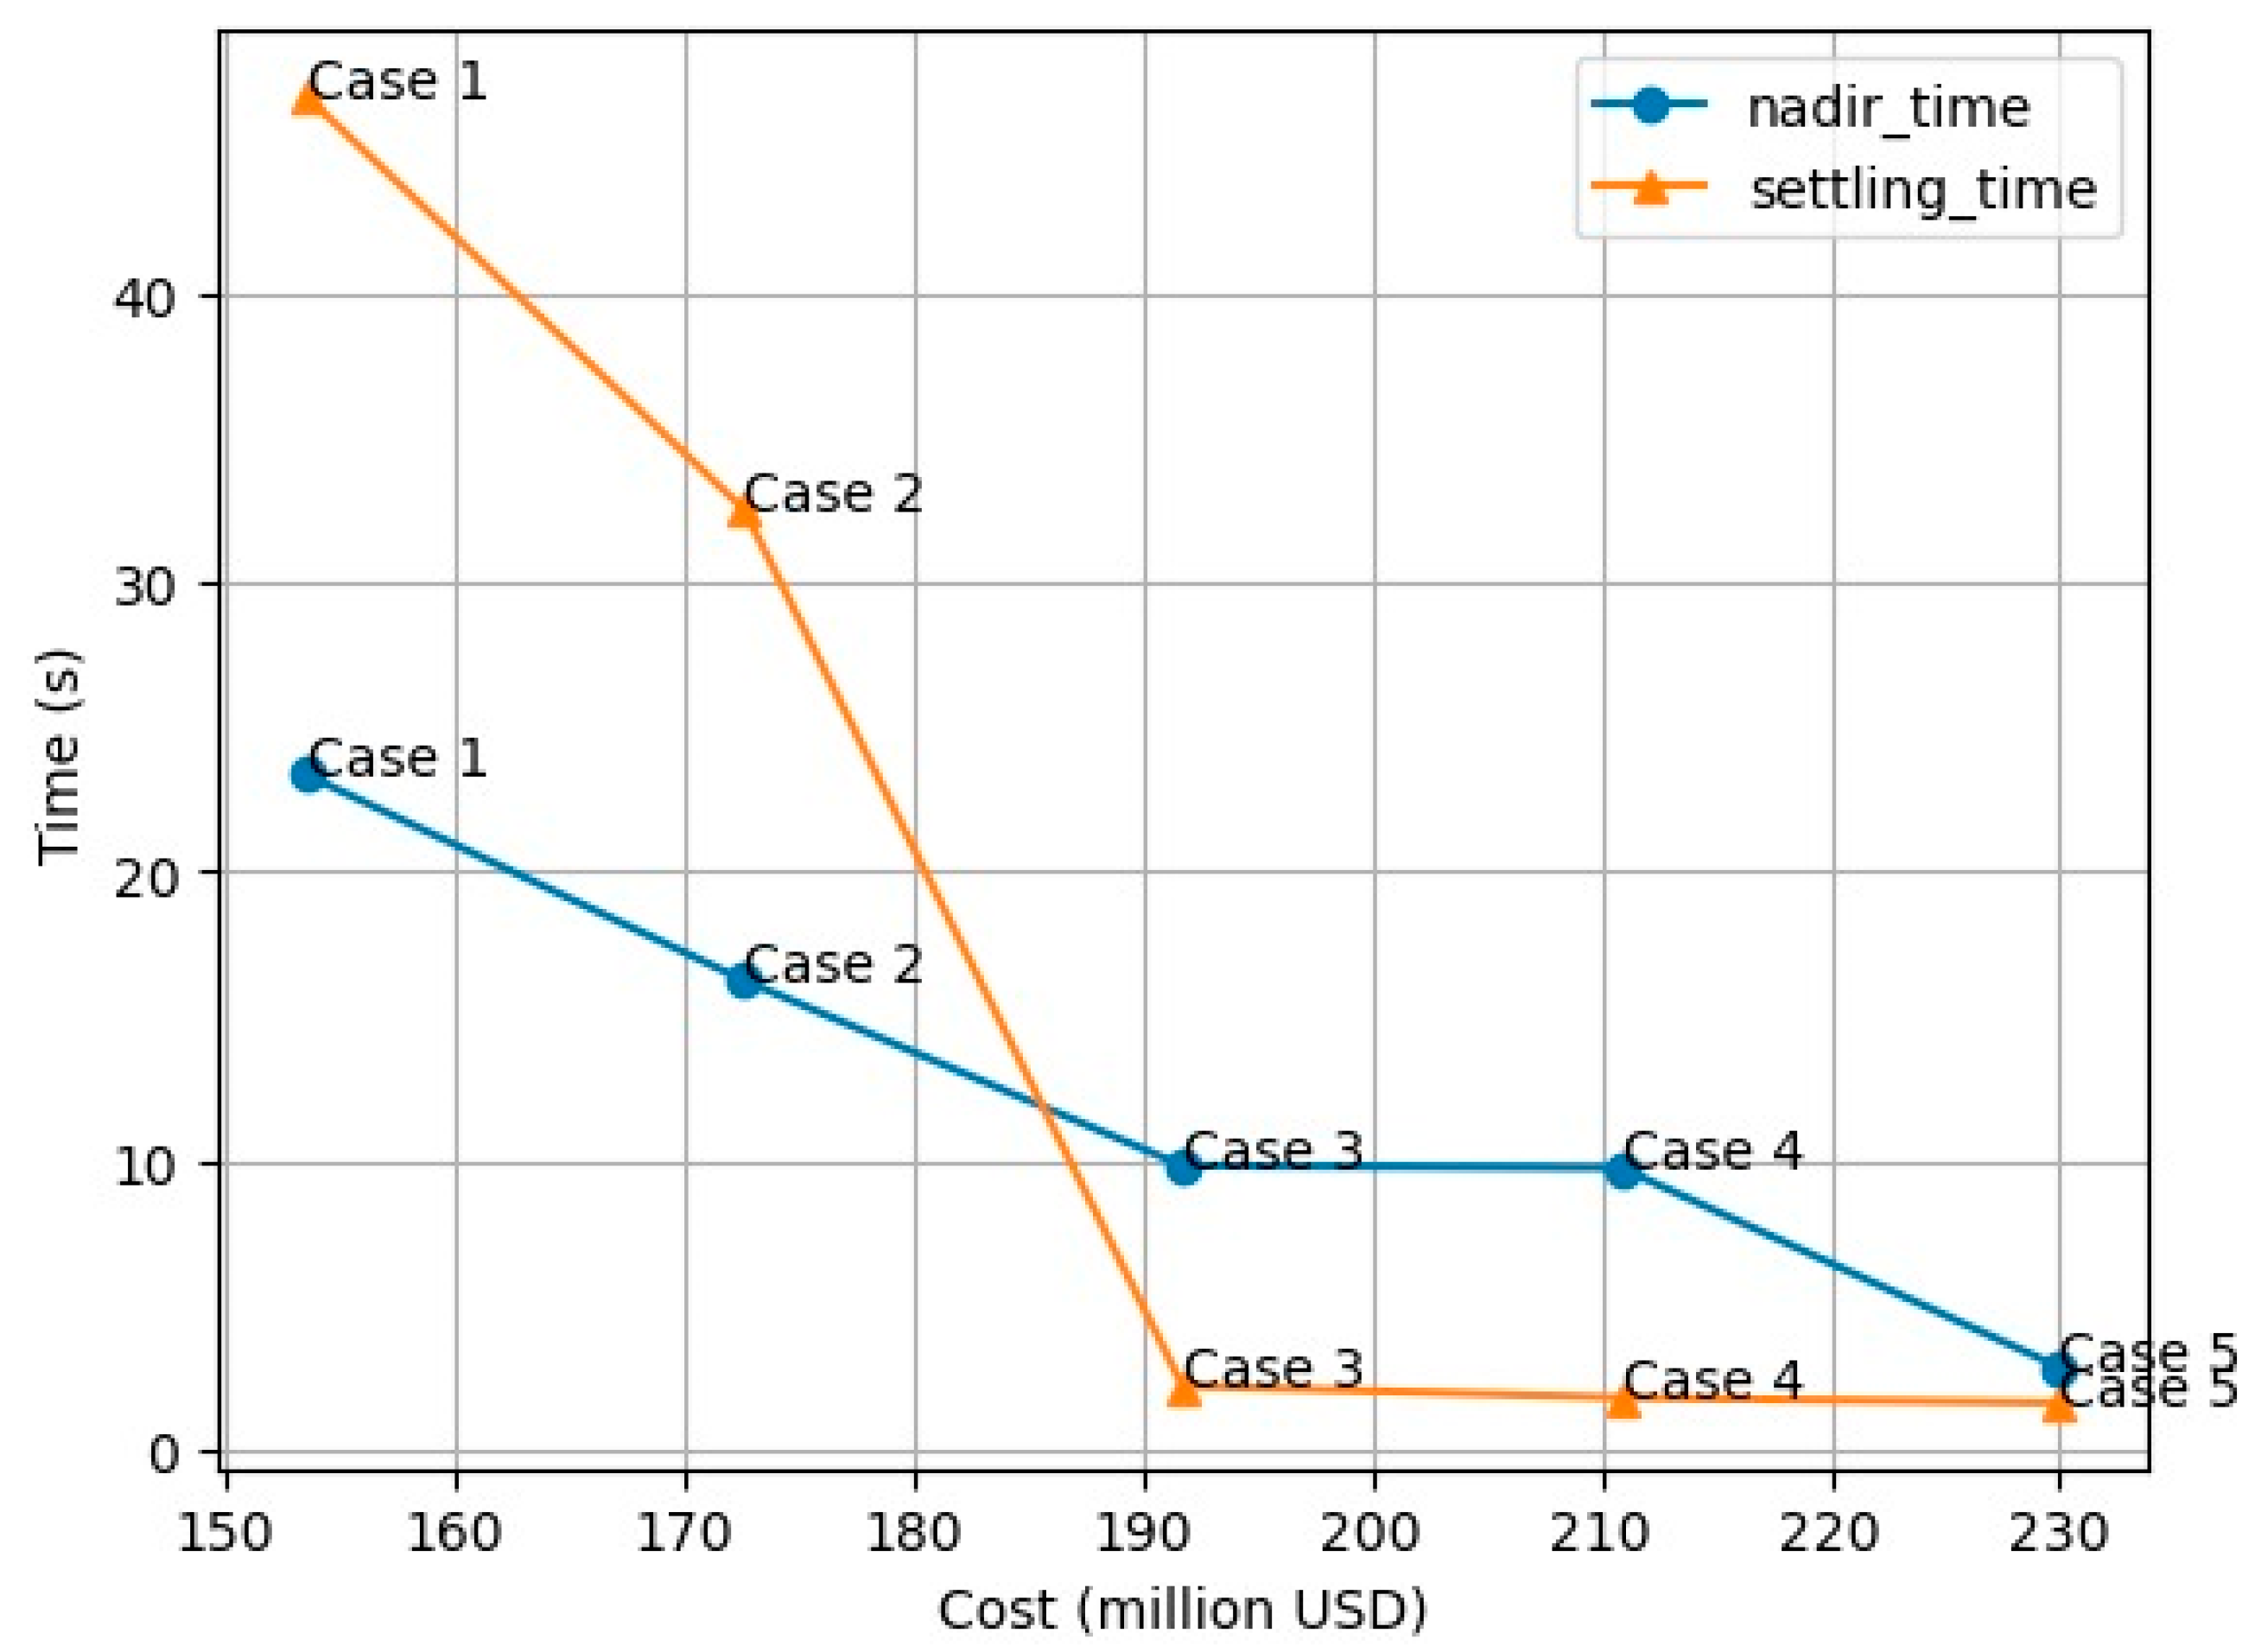
Figure 4 illustrates the RoCof for Cases 1–5. Selected results are also plotted against system cost in
Figure 5 and
Figure 6.
Frequency response curves for Cases 1–5 under Scenario 1 show that as the fraction of PFRs from BESS assets increases, all relevant metrics improve, as expected. This is unsurprising, as a fast reaction to the disturbance tends to improve all metrics, and the primary attractive attribute of BESS assets is the BESS’s capability to respond faster and more accurately than conventional units. The faster response is driven by BESSs’ use of inverters coupled to low-impedance energy storage, compared to conventional power plants, which are limited by mechanical inertia and shock limits for hydropower and governor response delays for thermal units.
From Case 1 to Case 5: nadir frequency improves (rises) from 49.43 Hz (Case 1) to 49.85 Hz (Case 5), and all are substantially better than the status quo of 49 Hz. The nadir time decreases from 23.36 s (Case 1) to 2.84 s (Case 5). The settling time reduces significantly from 46.86 s (Case 1) to 1.61 s (Case 5)—in Cases 3 through 5, the fast-acting BESS causes the frequency to start settling even before reaching its nadir.
Steady-state frequency improves progressively, from 49.57 Hz (Case 1) to 49.86 Hz (Case 5). The BESS asset’s ability to rapidly arrest frequency decline tends to stabilize system frequency faster, closer to 50 Hz than conventional plants. This arrest is fast enough in Cases 4 and 5 to settle system frequency within the regulatory-prescribed 49.8–50.2 Hz margin. However, it is important to note that the battery system is limited to 1 h capacity; the secondary response must replace battery output within that time.
Finally, all cases show similar, high, initial RoCoF values; this metric degrades from 1.25 Hz/s in Cases 1–4 to 1.28 Hz/s for the 100% BESS Case 5. This is due to the inertia of the online generation units, which are predominantly synchronous machines. While these machines do not exhibit governor response (i.e., PFR), they provide inertial response. Case 5, with no conventional PFR assets, has a higher RoCoF due to a reduction in the online inertia.
Figure 4 and
Figure 5 captures these metric trends against a cost estimate for the PFR assets. As previously indicated, Case 5 (all BESSs) offers the best technical performance. However, the marginal improvement from Case 3 to Case 5 is significantly smaller than the improvement from Case 1 to Case 3. The zeroth increment, from Case 0 to Case 1, eliminates use of load shedding for PFRs—a requirement for the WAPPITS moving forward—at an incremental cost of USD ≈ 150 M. Each subsequent case represents a 12% increase in the total cost of providing PFRs. Considering the nadir frequency, the first and second investment increments (Case 1 to 2, and Case 2 to 3) reduce the frequency drop by similar amounts (43% and 36% of the total possible improvement). The final two increments together provide 22% of the possible improvement (17% and 5%, respectively). Case 3 also brings the system response close to, but slightly below, the target frequency nadir (0.2 Hz). Similar observations can be made for the other metrics in
Figure 3 and
Figure 4.
These results indicate that a hybrid solution with a balance of conventional and BESS assets likely produces the best cost–benefit performance for acquiring PFR assets. A hybrid solution provides a cost-effective strategy for primary frequency response without compromising significantly on reliability or stability.
In practical terms, converting existing conventional assets to PFRs would require both regulatory changes and, likely, an ancillary services market to pay for these reserves. BESS implementation could be developed directly by the WAPPITS or provisioned using an ancillary services market; in either case, these represent new assets that need to be financed, constructed, and maintained. The current study makes one assumption about the location of PFR assets. A fully developed plan would acquire PFR assets strategically positioned within the WAPPITS system, which may impact cost and operational control strategies.
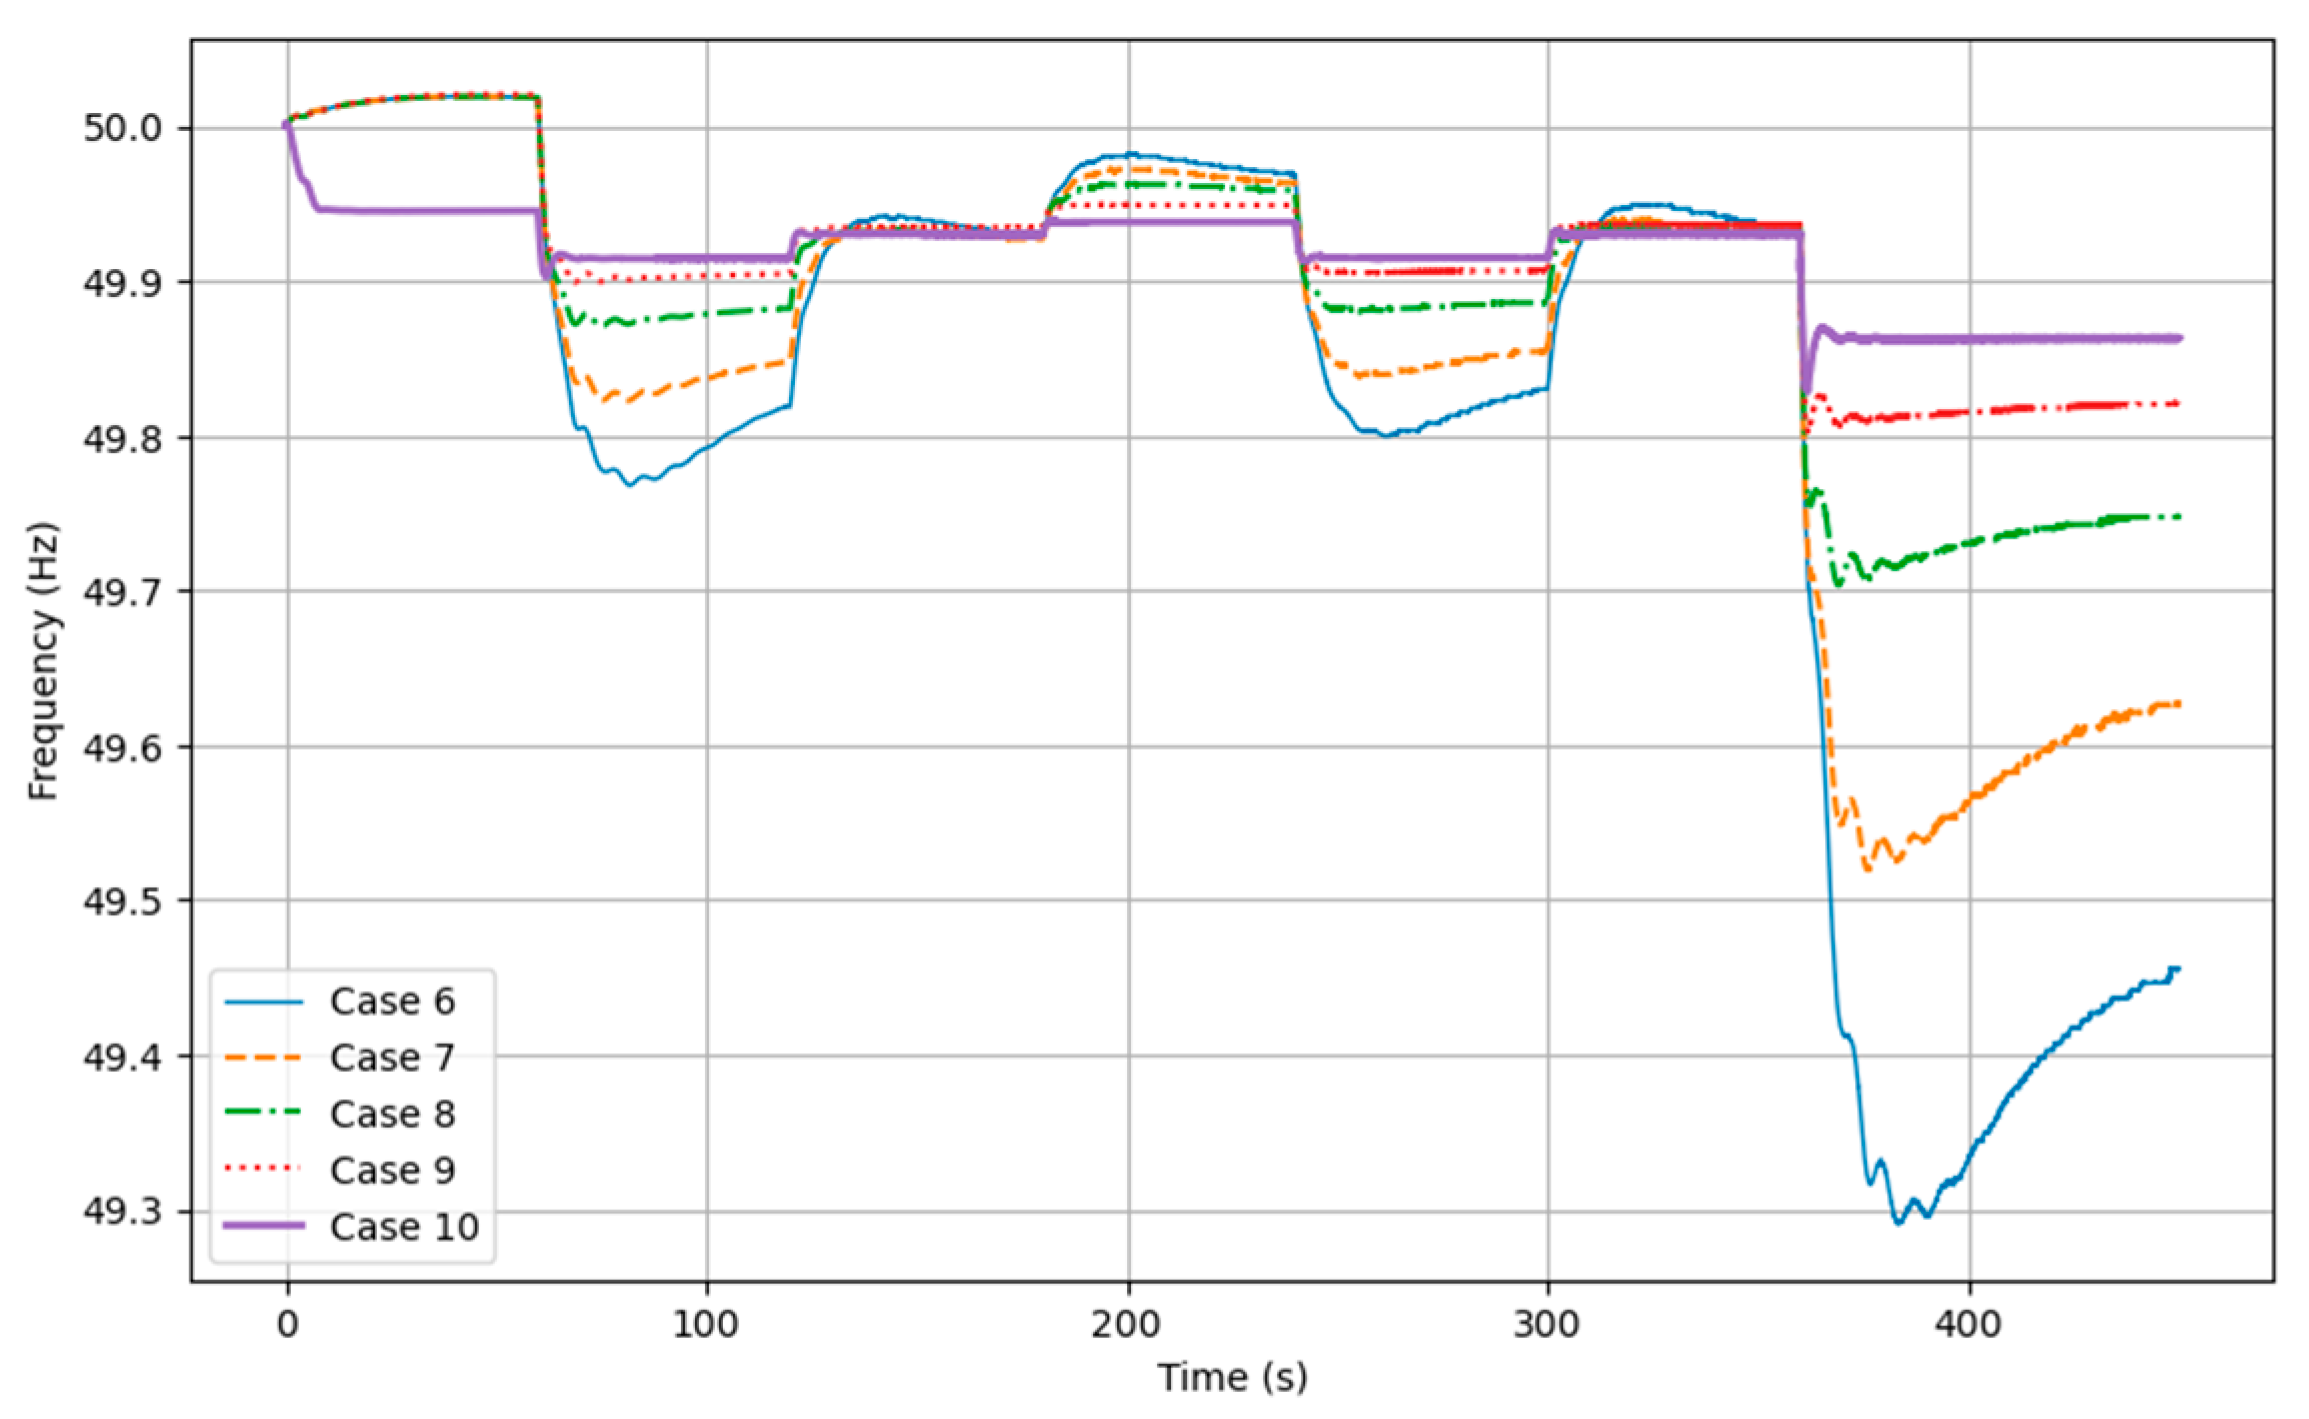
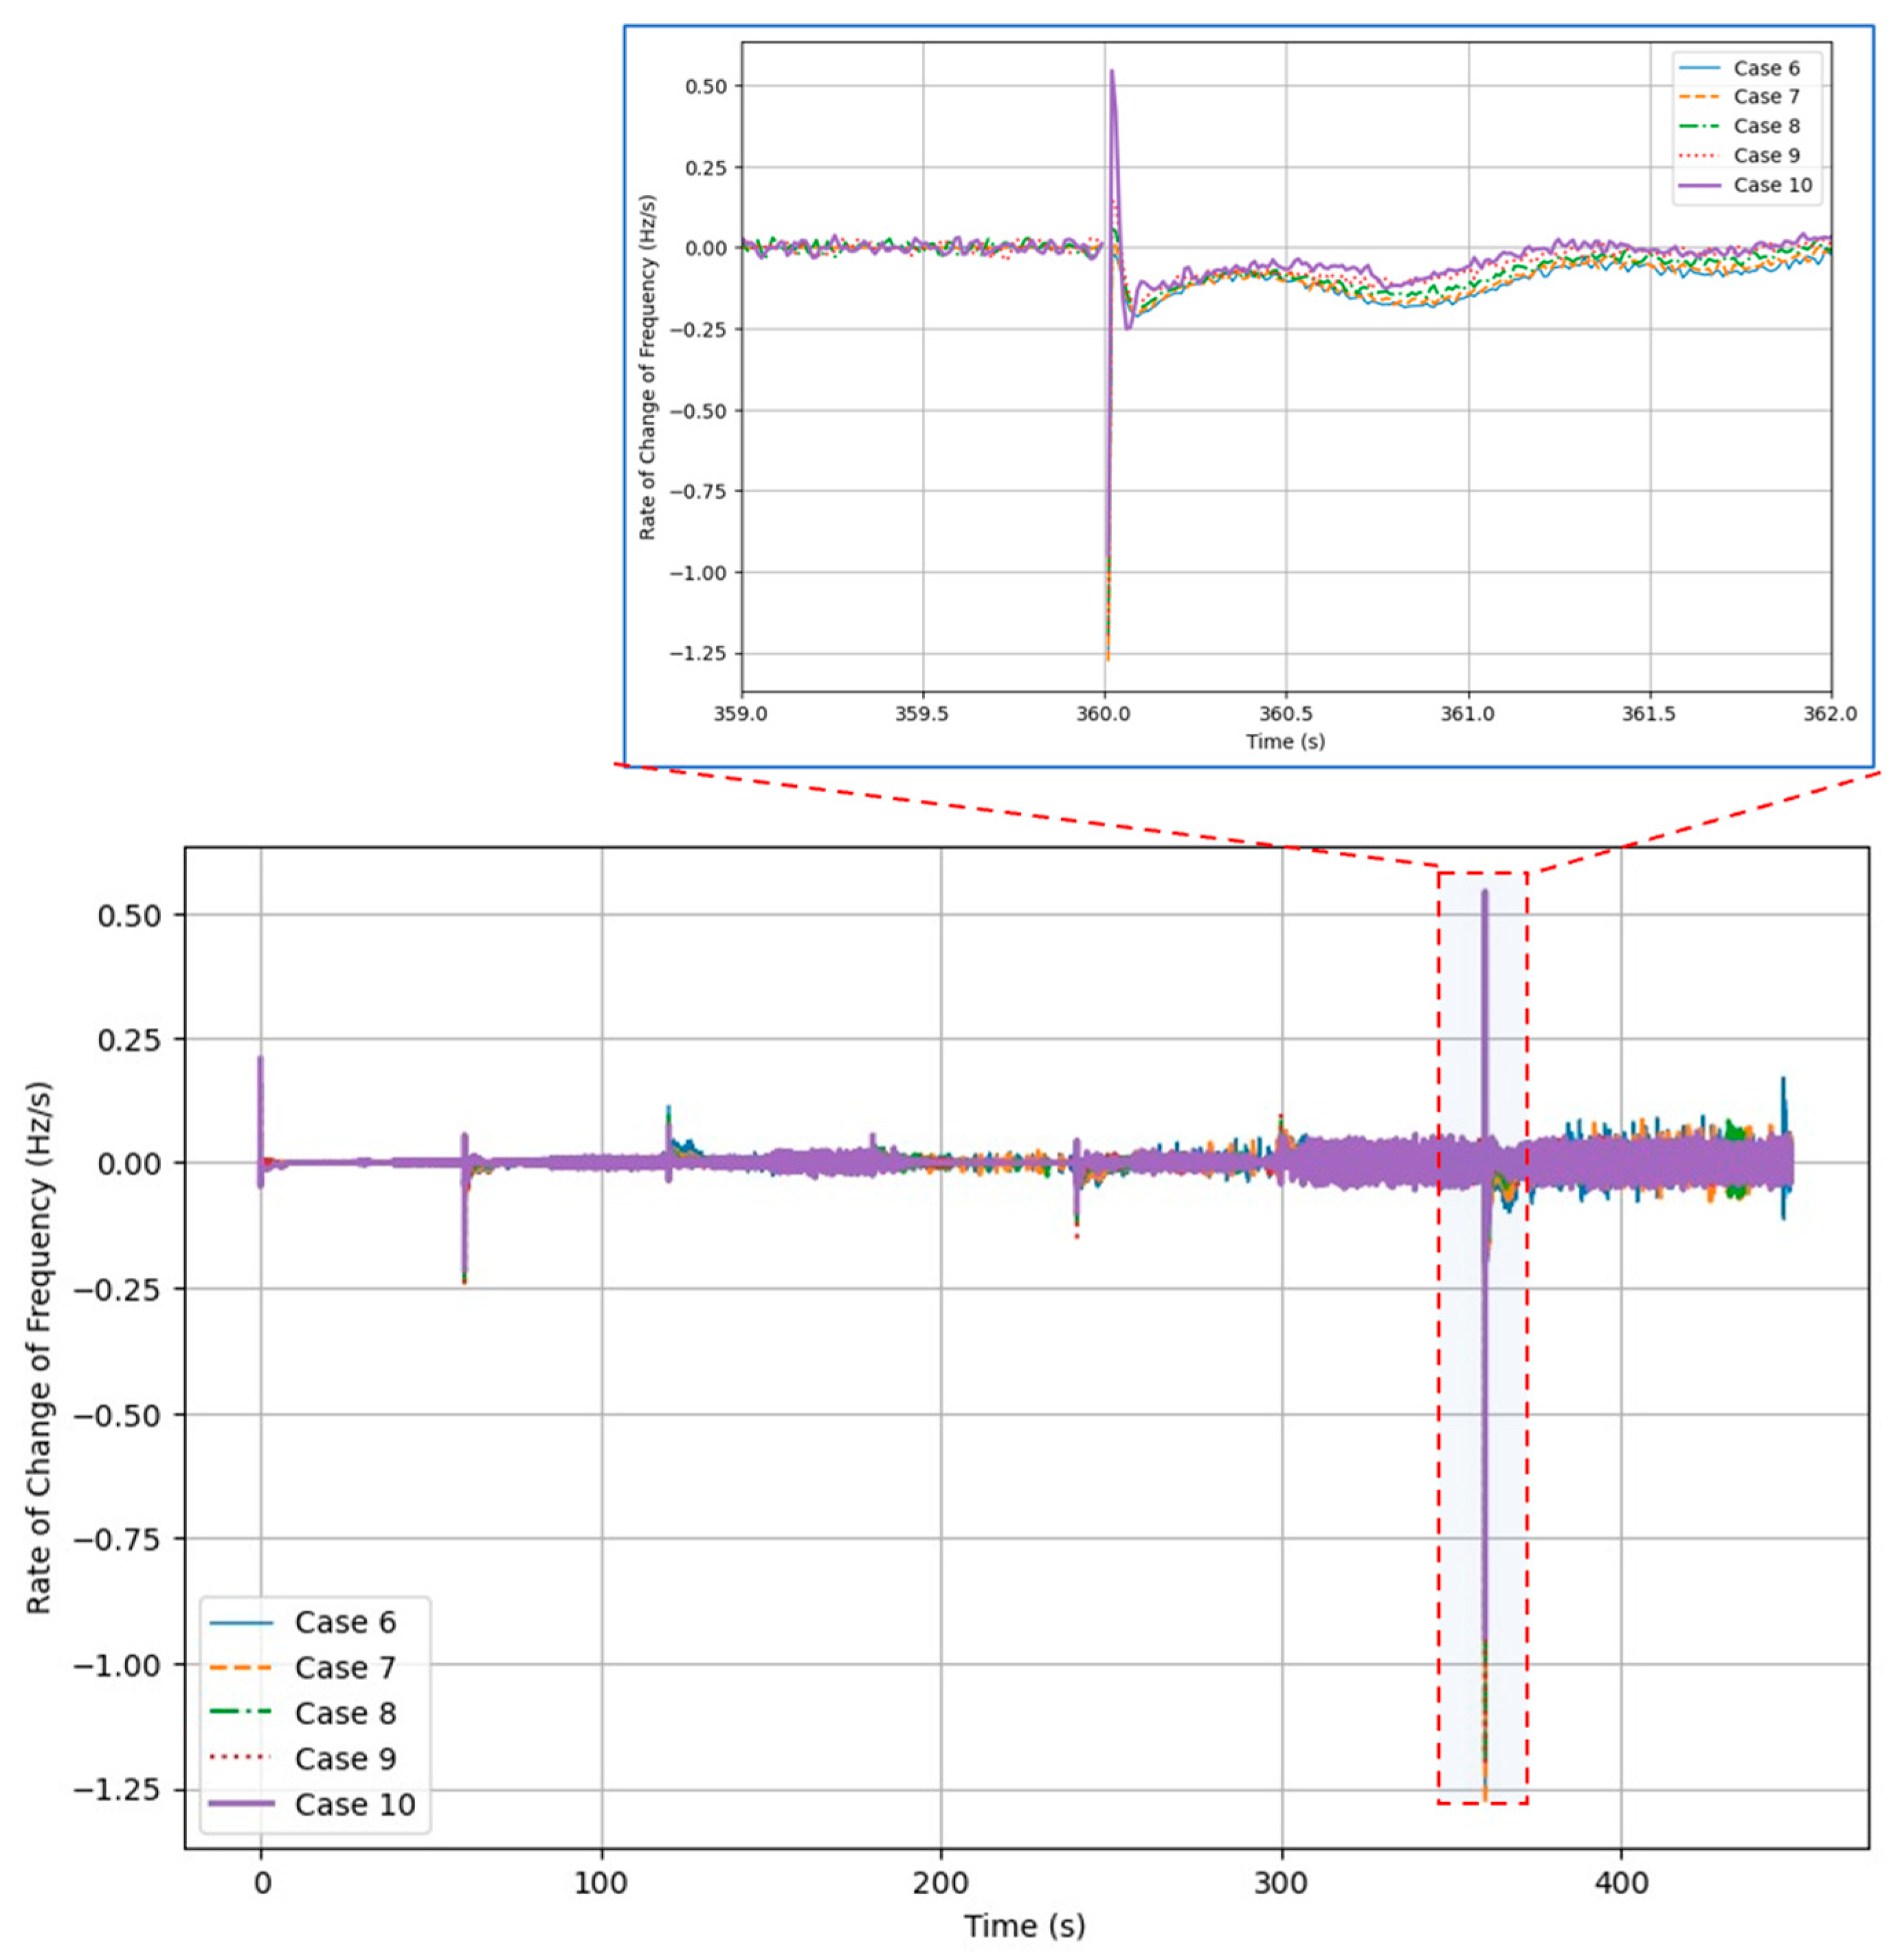
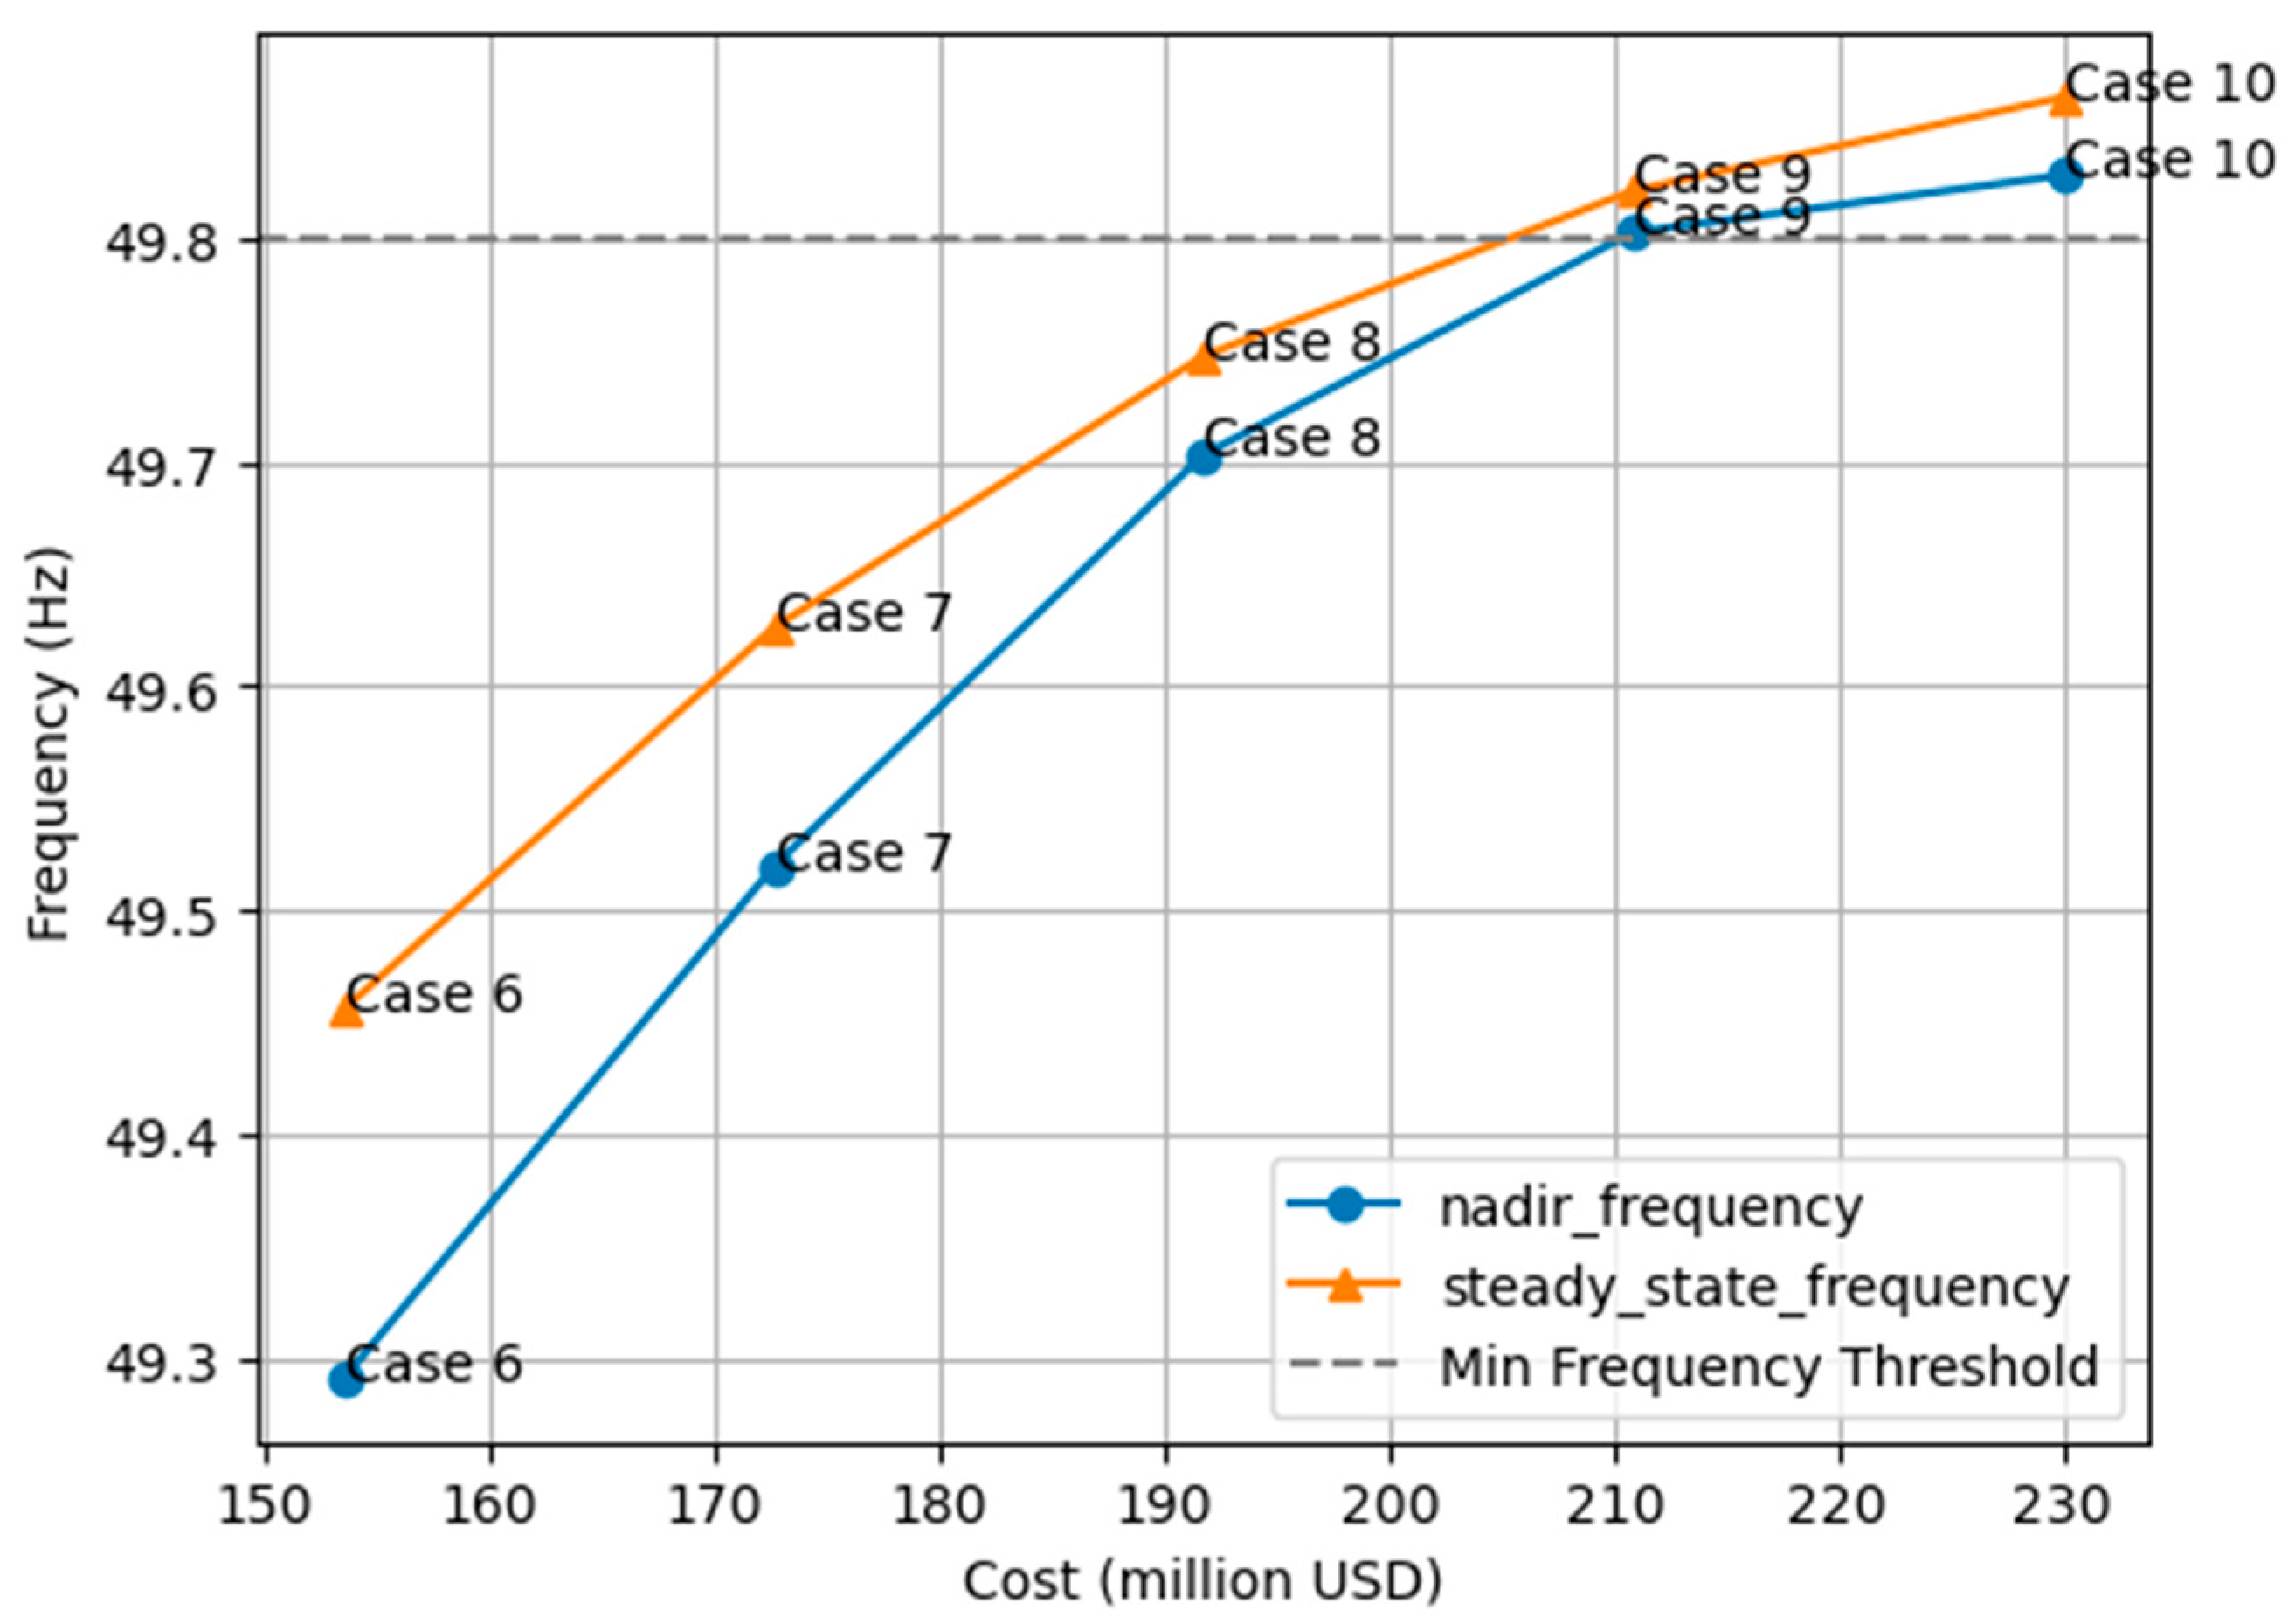
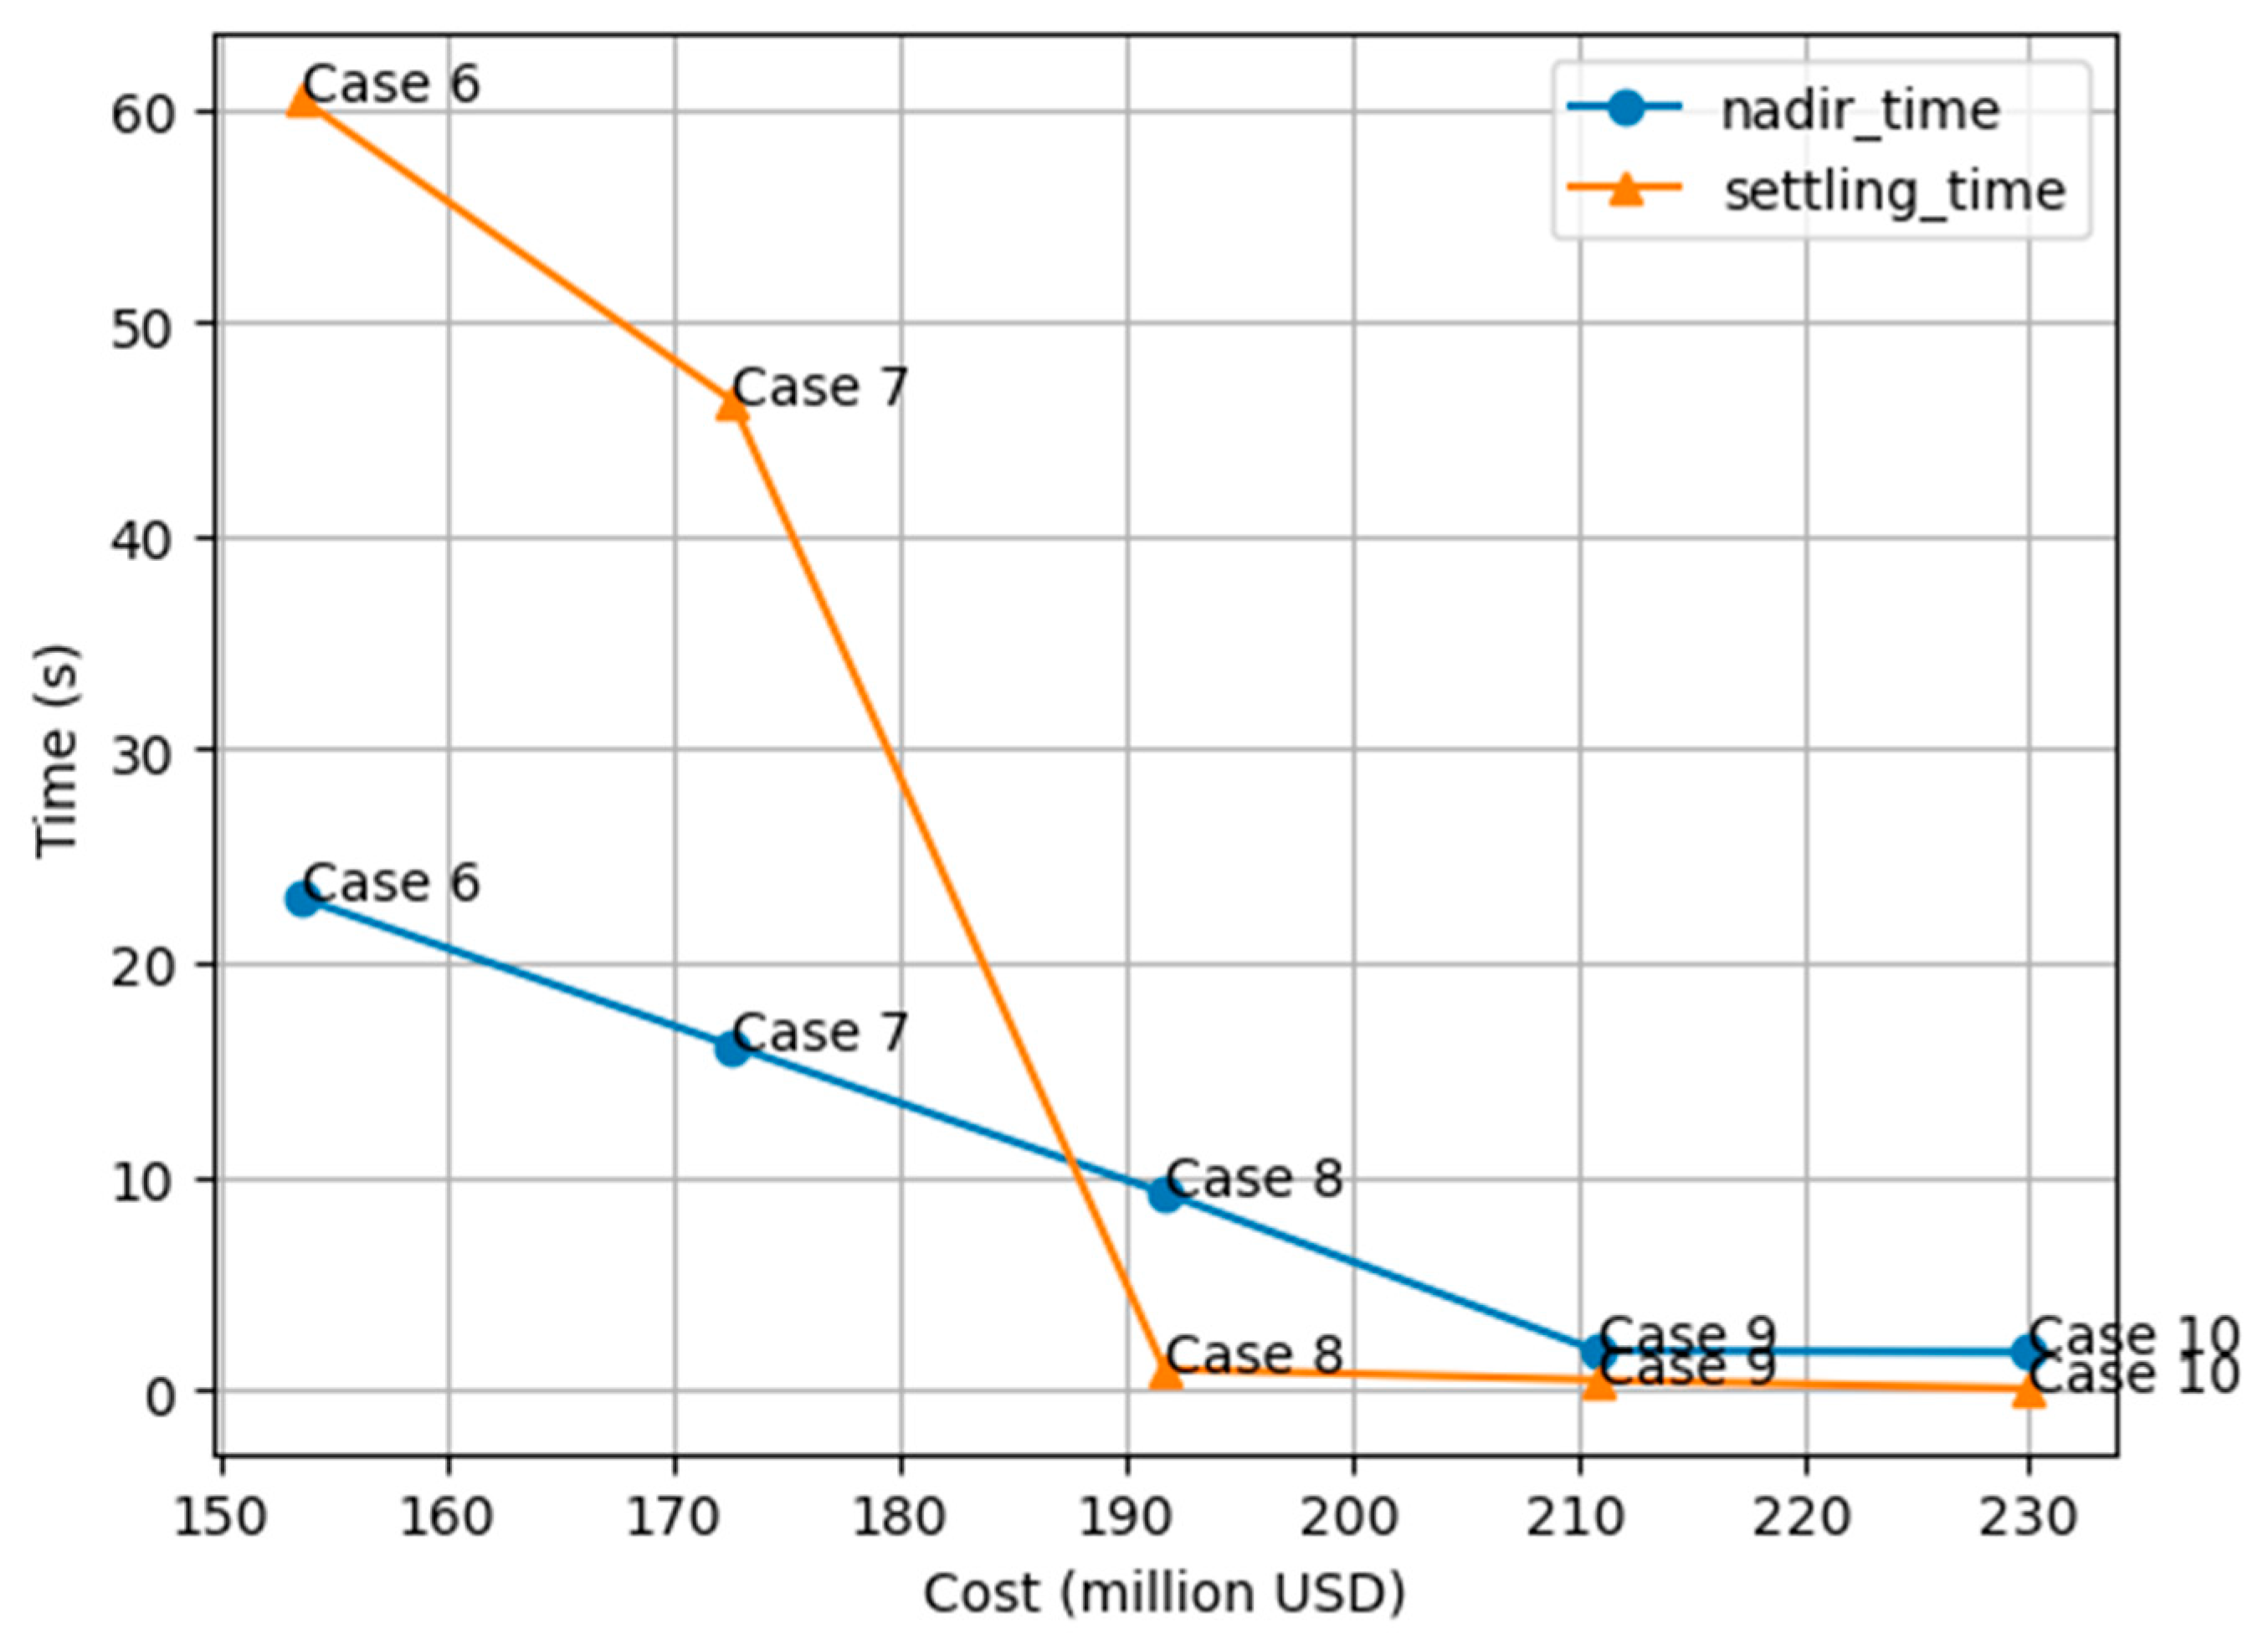
In Scenario 2, we mimic a typical variable-frequency condition observed currently in the daily operation of the WAPPITS. By considering a chaotic frequency condition, the simulation stresses the operation of the PFR assets prior to the N-1 contingency trip at 360 s. As with the previous scenario,
Figure 7 shows the frequency response and
Figure 8 shows the RoCof for Scenario 2, Cases 6–10, respectively—Case 6, all conventional, and Case 10, all BESSs.
Table 5 documents the metrics extracted from the simulations, and
Figure 9 and
Figure 10 show those metrics plotted against total cost.
A quick inspection of the figures and table indicates that the system response after the disturbance in Scenario 2 closely resembles that of Scenario 1. Nadir frequency and settling time are somewhat worse for the fully conventional scenario (Case 6 compared to Case 10). The remaining metrics are essentially unchanged. These data indicate that the introduction of variable frequency does not impact the PFR performance, assuming the BESS system has not been pushed toward either full charge or full discharge prior to the event. Maintaining BESS capacity will likely require additional control design, as well as the implementation of a robust secondary response (AGC) system.
Given similar metrics, the incremental improvement for incremental investment in Scenario 2 tracks that of Scenario 1. Again, a PFR system design with a Case 8 (50/50 split) and Case 9 (25/75 BESS) split provides control that meets the target nadir of 0.2 Hz while minimizing total cost. These data indicate a balanced reserve mix (approximately 50% BESS, 50% conventional) and provide the best compromise between technical and economic feasibility, provided that secondary frequency reserve resources are available to sustain and improve the frequency recovery, as is common in developed grid systems.
5. Conclusions
The WAPPITS represents a unique environment to design, from basic assumptions, primary and secondary frequency response systems for a large, complex, interconnected grid system. In developed systems, large investments in conventional resources represent sunk costs with well-understood ancillary services costs. In that environment, BESS investments must compete against established players and known costs.
In contrast, conventional units in the WAPPITS could provide a primary response but are not currently incentivized to do so. The required incentive payments, likely in the form of an ancillary services market, represent a significant operational cost that is not yet committed by the grid operator and therefore do not represent a current contractual or political commitment. No BESS units exist currently; all require significant CAPEX but have lower O&M costs than conventional assets.
These competing costs establish a classic cost–benefit optimization between conventional and BESS investments that would be difficult to consider in established, highly developed grid systems. As a result, in developed systems, BESSs have been primarily considered as a solution to stabilize problem areas within the grid or to compensate for high penetrations of variable renewable energy sources.
The analysis performed here does not consider all possible variables. Significant design constraints were not considered, including the location and interconnection of BESS units, the availability and location of conventional units willing to participate in PFRs, local and corridor capacity, and stability issues. The study also did not consider a future with a higher penetration of variable renewable generation sources. However, this high-level analysis provides a reasonably clear answer to a fundamental question: What mix of PFR resources would likely produce adequate control while minimizing cost over a 5-year study period?
The results indicate that (a) a hybrid approach, near a 50/50 split between conventional and BESS assets, would likely provide adequate frequency control at minimum total cost. Such a hybrid solution would provide significant advantages to the WAPPITS. Contracting for fewer conventional assets would make an ancillary services market more competitive, potentially lowering the cost of services and/or providing more flexibility in the selection of those resources. Due to the large size and limited interconnection of the WAPPITS, location will be a significant factor in designing primary response systems.
Also, BESS units could be contracted through an ancillary services market or implemented directly by the WAPPITS in selected substations throughout the grid. These options provide additional design and operational flexibility for the WAPPITS.
The results presented here are highly reliant on the implementation of an active secondary frequency control system, commonly referred to as automatic generation control. AGC services would also need to be contracted via an ancillary services market. AGC services will compete with the PFR services in those markets. Generation assets in the WAPPITS vary in age, control system quality, and other factors. Currently, it is not entirely clear how readily units can be adapted for both PFRs and AGC. A hybrid approach provides flexibility to tradeoff between conventional and BESS assets in response to market offers when those markets initiate.
The findings from this research provide a starting point for system-level planning by identifying a cost-effective hybrid approach for PFR provision. This can inform reserve sizing and investment strategy in the WAPPITS. The proposed PFR mixes provide both operational reliability and economic flexibility, guiding decisions on where and how to allocate limited capital for maximum grid impact.
Considering that the system model used relies on a single disturbance scenario and omits the impact of grid topology on BESS placement, this study should be considered a first-order study to guide the non-trivial investments in potential detailed scenario planning prior to investment decisions. Scenario planning should explore the following key areas to provide a deep understanding of BESS integration in the WAPP Interconnected Transmission System (WAPPITS):
- i.
Develop simulation models taking into account grid topologies, seasonal variations, and multiple contingency scenarios on a system-wide basis.
- ii.
Optimize the sizing and placement of BESS units to enhance system resilience, economic efficiency, and frequency regulation effectiveness.
- iii.
Assess different VRE penetration levels to determine the corresponding impact on BESS performance, stability requirements, and system inertia.
- iv.
Analyze BESS degradation given additional data on the number and intensity of SOC cycles and otherwise improve lifecycle cost modeling. These studies should include the potential for high cycling frequency if BESSs play a role in primary frequency control without sufficient conventional resources, as well as include scenarios with higher VRE penetration, potentially spread unevenly across WAPPITS countries and TSOs.


