Abstract
Oil consumption brings both energy security risks and environmental responsibilities. While traditional studies assign environmental responsibility primarily to oil producers, our research uncovers a geographical displacement of accountability: substantial oil volumes are embedded in traded goods and ultimately consumed in distant regions. Although China’s “dual control” policy regulates fossil energy use, it fails to account for the complexities of embodied oil flows. This oversight leads to imbalanced interregional responsibility allocation and resource exploitation issues. Adopting the “consumer pays” principle, this study makes methodological advances by innovatively combining multi-regional input–output (MRIO) modeling with geographically and temporally weighted regression (GTWR) analysis. The integrated approach provides spatial–temporal resolution in tracking embodied oil flows and their drivers across China’s provinces. Key findings include (1) strong concentration of oil inflows in developed eastern and central provinces, alongside rapid growth in southwestern regions; (2) evolving temporal patterns where economic growth and distance remain persistent drivers, while green technology and urbanization emerge as growing mitigating factors; (3) spatially, northwestern regions rely heavily on external supplies due to economic growth and urbanization, southeastern areas face rising transport costs, while green technologies in coastal regions have yet to significantly curb inflows due to rebound effects. These insights provide a new analytical framework for energy policy, supporting region-specific solutions to balance development and sustainability from a consumption perspective.
1. Introduction
As the “lifeblood” of industrial production, oil remains the cornerstone of global energy supply. China, the world’s top importer, imported 553 million tons of crude oil in 2024, with external dependence reaching 74% (Data source: https://www.cpnn.com.cn/news/yq/202501/t20250123_1769065.html, accessed on 25 August 2025). Given China’s limited domestic oil reserves and the high carbon intensity of oil production and consumption, the dual pressures of energy security and environmental sustainability are intensifying. In addition, the frequent occurrence of geopolitical events, such as the Russia–Ukraine conflict in recent years, has exacerbated volatility in global oil prices, further destabilizing the energy landscape. These factors collectively heighten the fragility of China’s oil supply chain, demanding urgent policy and strategic responses.
Oil has become a crucial factor in national economic security and sustainable development. Traditional research has primarily focused on direct oil consumption in production, neglecting the embodied oil flows in trade—the total direct and indirect oil used in manufacturing, transportation, and other stages of product supply chains [1]. Through trade, this embodied oil shifts from production regions to consumption regions, creating a spatial disconnect between where oil is consumed and where its environmental impacts occur. As a result, regions importing oil-intensive products effectively outsource their energy conservation pressures and emission reduction responsibilities to exporting regions [2], leading to an imbalanced allocation of environmental accountability.
China has explicitly established policies to control fossil energy consumption through its “dual control” system, which regulates both the total volume and intensity of energy use. While recent improvements to this system have strengthened fossil energy oversight, a critical gap remains: these measures fail to account for embodied oil flows in interregional trade [3]. Studying embodied oil flows from the consumption perspective can clarify regional responsibilities [4], assess interregional oil demand linkages, and reveal China’s true oil consumption structure. Such an approach also facilitates regional energy cooperation and supports coordinated efforts toward emission reduction.
Meanwhile, the scale of embodied oil flows on the consumption side is jointly shaped by multiple factors, including economic development level, industrial structure, and consumption patterns, exhibiting significant temporal and spatial disparities [5]. An in-depth analysis of the spatiotemporal mechanisms of these influencing factors can yield valuable insights: from a temporal perspective, it helps clarify the phased characteristics and long-term trends of embodied oil flows; from a spatial perspective, it enables the identification of key driving factors behind such flows in different regions. Such insights hold strategic importance for developing region-specific oil consumption policies, fostering sustainable energy transitions, supporting high-quality economic growth, and mitigating global climate change.
The objectives of our study are threefold: (1) to quantify interprovincial embodied oil flows in China using a consumer-responsibility multi-regional input–output (MRIO) modeling approach; (2) to analyze the spatiotemporal heterogeneity of key driving factors through geographically and temporally weighted regression (GTWR); (3) to develop regionally differentiated policy recommendations that balance energy security and carbon mitigation objectives. In addition, while this study examines the environmental impacts of embodied oil flows, key sectors such as agriculture rely on petroleum-based inputs (e.g., fertilizers). Such critical uses should be exempt from strict zero-carbon rules to balance sustainability and food security.
2. Literature Review
In the context of global trade specialization, the exchange of goods and services has facilitated the cross-regional flow of resources and energy. To better understand material cycles and energy transfers within economic systems, scholars developed the embodied analysis framework [6], which includes embodied energy, emissions, materials, and water analysis. Among these, energy, as the foundation of economic production, has become a key research focus. Embodied energy represents the total direct and indirect energy inputs needed to manufacture products or provide services throughout an economic system. Unlike conventional direct energy consumption measurements, it accounts for not only the immediate energy used in production but also all upstream energy inputs across supply chains. Embodied oil, a specific application of this concept, focuses exclusively on petroleum consumption.
With shifting global energy dynamics and growing challenges in the oil trade, research on embodied oil flows has gained increasing academic attention. Current studies primarily examine three key aspects: measurement methodologies, influencing factors, and the economic–environmental impacts of embodied oil flows.
For quantifying embodied oil in trade, input–output analysis (IOA), developed by Leontief in 1936, serves as the fundamental framework for analyzing economic system linkages [7]. Researchers typically employ either single-region input–output (SRIO) or multi-region input–output (MRIO) models. The SRIO approach operates under the simplifying assumption of uniform production technologies across regions, whereas the MRIO model overcomes this limitation by incorporating technological heterogeneity and region-specific oil consumption patterns. By integrating inter-regional trade data with sector-specific economic structures, the MRIO model more accurately captures regional differences in production efficiency and energy use, making it the preferred method for embodied oil research [8].
The expansion of interregional trade has facilitated not only the flow of final products but also the transfer of ecological factors such as energy and resources. To better understand this phenomenon, researchers have developed the environmentally extended input–output (EEIO) models. This methodology combines environmental accounting with conventional economic input–output analysis, providing an effective tool for tracing economy–environment interactions and uncovering the environmental consequences of economic activity. Numerous studies have employed this approach to examine how trade redistributes environmental burdens and to develop more equitable environmental responsibility frameworks [9,10].
Environmental responsibility refers to the obligation of economic entities to account for energy consumption and pollution emissions throughout production chains [11]. In today’s interconnected economy, each entity’s production decisions ripple through the entire system via input–output linkages, creating shared responsibility for environmental impacts.
Current academic research primarily adopts two accounting frameworks for environmental responsibility. The first one is the producer responsibility principle (territorial approach), which assigns responsibility based on direct production emissions. While straightforward, this approach neglects transboundary environmental transfers through trade, potentially leading to carbon leakage and resource exploitation issues [3,12]. In contrast, the consumer responsibility principle adopts a supply-chain perspective, assigning environmental impacts to final demand by calculating embodied energy and emissions across entire production networks [13]. This method better reflects trade-related ecological transfers and helps address the “pollution haven” effect overlooked by producer-based accounting.
Although the existing literature has thoroughly investigated pollution and carbon emissions, research gaps persist in studying oil consumption patterns and their corresponding environmental responsibility attribution under consumer-based accounting. This knowledge gap hinders policymakers’ capacity to optimize oil resource allocation across China’s regions, while minimizing trade-related environmental costs.
Previous studies on the influencing factors of embodied oil flows have primarily focused on analyzing their aggregate magnitude and structural characteristics, with limited investigation into the spatiotemporal heterogeneity of these factors. As the dominant analytical approaches in this field, structural decomposition analysis (SDA) and index decomposition analysis (IDA), however, have been increasingly recognized for their methodological constraints: (1) limited flexibility in modeling qualitative factors, (2) inadequate treatment of spatial dimensions in trade flow analysis, and (3) rigid functional forms that cannot adequately capture endogenous effects [14]. In this context, econometric methods present a valuable alternative, as they enable more precise measurements of the relationship between embodied oil flows in trade and their key drivers while addressing several of these methodological gaps [5,15].
Research that combines input–output models with econometric analysis to evaluate the determinants of embodied flows in trade has mainly concentrated on embodied energy and embodied carbon [16,17,18]. Recognizing that geographical factors play a crucial role in shaping regional disparities in embodied energy patterns, some studies have adopted geographically weighted regression (GWR) to examine the factors that affect domestic embodied energy flows [19]. The geographically and temporally weighted regression (GTWR) model extends GWR by incorporating the temporal dimension, thereby capturing the dynamic evolution of coefficient patterns across both geographical and temporal scales. Nevertheless, the application of these advanced methods in the field of embodied oil research remains underdeveloped.
To overcome the methodological gaps and empirical limitations identified in prior research, our study makes two contributions to the field of energy–environmental analysis.
First, we develop an environmentally extended multi-regional input–output (EE-MRIO) model based on the consumer responsibility principle. This model improves the accuracy and coverage of China’s embodied oil consumption estimates. Unlike earlier studies, which depended on production-based accounting or oversimplified trade data, our approach tracks oil use across domestic supply chains more precisely.
Second, we introduce the geographically and temporally weighted regression (GTWR) model to rigorously analyze the spatiotemporal heterogeneity of factors influencing embodied oil consumption. Most existing research ignores regional and time-based differences by using static or broad regression methods. In contrast, our GTWR model detects location-specific and time-varying effects, revealing how economic, industrial, and policy drivers shape oil use in different Chinese provinces. This method strengthens our analysis and helps generate customized policy suggestions based on local conditions and resource limits.
3. Methodology
3.1. Measurement of Consumption-Side Embodied Oil Flows
The multi-regional input–output (MRIO) model comprehensively captures regional differences in production technologies and spatial heterogeneity, enabling systematic quantification of embodied oil flows through trade. In this study, we construct an MRIO framework to measure and compare the scale and trends of embodied oil flows across 30 provinces, both in domestic and international trade. In this way, we can gain a thorough understanding of the spatiotemporal patterns of these flows. The specific methodology is as follows:
In the MRIO model, the same type of products from different economies are treated as entirely distinct products, with different regions interconnected through interregional trade matrices. Based on the MRIO tables and input–output theory [7], the row-wise balance relationship between provincial economies can be expressed as follows:
Here, is the column vector of total input (or total output), where superscripts indicate provinces. represents the flow of intermediate goods from industries in province s to those in province r, while denotes the flow of final goods from industries in province s to province r. EX and IM are, respectively, column vectors of sectoral exports and row vectors of sectoral imports by province, and V is the row vector of value-added by sector and province. The elements of the block matrix A, defined as , represent the direct input coefficient matrix for interprovincial intermediate goods. The Leontief inverse matrix (or total requirement matrix) is given by .
The row-wise balance in Equation (1) assumes homogeneous sectoral outputs, linear production technology, proportional imports, no stock changes, and equilibrium conditions. These standard MRIO assumptions ensure consistency in tracking embodied oil flows across regions while balancing total output with intermediate and final demand.
Let the block matrix of embodied oil consumption coefficients for each province be as shown in Equation (2), where the diagonal elements represent the diagonal matrix of oil consumption intensity coefficients for each sector in province i:
The diagonal elements of the block matrix represent the diagonal matrix of oil consumption intensity coefficients for each sector across provinces. The embodied oil consumption in final goods traded between provinces can be calculated as follows:
By multiplying the block matrix of oil consumption intensity coefficients, the total requirement matrix, and the diagonalized export matrix of each province, we can derive the embodied oil consumption in provincial exports as follows:
We employ the concept of import-induced oil savings [20] to quantify the embodied oil in provincial imports; that is, the amount of domestic oil consumption avoided due to imports. The calculation is given by Equation (5).
Aligning with the UNFCCC’s (United Nations Framework Convention on Climate Change) principle of “common but differentiated responsibilities,” the consumer responsibility principle reflects a “who consumes, who pays” approach [13]. Following this principle, we define a region’s petroleum footprint as all embodied oil, whether from local or imported sources, required to support its consumption. By summing column vectors from Equation (3) and Equation (5), we obtain province i’s total consumption-based embodied oil.
Based on Equation (6), Province i’s consumption-based embodied oil can be decomposed into three pathways:
Local supply: oil consumed to meet domestic final demand, representing province i’s direct consumption responsibility;
Interprovincial inflow: oil inflows from other provinces to satisfy local consumption, reflecting province i’s transfer responsibility to other regions;
Imports: embodied oil in imports, indicating province i’s consumption responsibility from imports.
These pathways correspond to local, interprovincial, and foreign consumption scopes, respectively.
Figure 1 shows the specific accounting framework. Given that interprovincial embodied oil flows can reflect the complexity of regional economic linkages and energy distribution patterns in China, research on this topic helps identify disparities in regional development and energy consumption; therefore, this study focuses on embodied oil flows in domestic trade, particularly those under Pathway 2, to evaluate provincial energy consumption responsibilities and inform regional energy policymaking for coordinated development.

Figure 1.
Consumption-based embodied oil accounting framework for Province i.
3.2. Geographically and Temporally Weighted Regression (GTWR)
Our study investigates the factors driving China’s consumption-side embodied oil flows in domestic trade, focusing on their spatial heterogeneity and temporal variations. Using a geographically and temporally weighted regression (GTWR) model, we analyze how these factors exhibit spatiotemporal non-stationarity across provinces.
This study selects variables based on the gravity model framework, where economic scale and geographic distance are key determinants of interregional trade [16]. While these factors help explain embodied oil flows, the classical gravity model risks omitted-variable bias due to its limited scope. To address this, we expand the model by incorporating two additional variables: green technology level and urbanization level [19,21]. Green technology is included because both classical and new trade theories emphasize its role in trade development [22]. Urbanization, meanwhile, is critical because cities generate 70% of global carbon emissions, a share that is growing [23], and urban population growth significantly drives energy demand [24]. We analyze interprovincial embodied oil flows and their determinants using a GTWR model with distance-based spatial weights, as specified in Equation (7).
In Equation (7), represents consumption-based embodied oil inflows to province i from other regions; denotes the spatiotemporal coordinates of province i; is the intercept; represents the regression coefficient for the j-th independent variable in province i; is the error term; indicates the j-th influencing factor for province i; n is the total number of factors.
The study examines four determinants: economic development level, geographic distance, green technology level, and urbanization rate. The optimal bandwidth was determined using the cross-validation (CV) criteria, with detailed measurement methods for each factor provided in Table 1.

Table 1.
Variable description.
4. Data and Empirical Results
4.1. Data Sources
This study utilizes interregional input–output tables that are typically updated at intervals exceeding five years, with the latest available data currently being for 2017. Due to these data limitations, our analysis focuses on the period from 2007 to 2017. The input–output data draws from two main sources: Liu Weidong’s 30-province, 30-sector tables for 2007 and 2010 [25,26], and CEADs’ (Carbon Emission Accounts and Datasets) 31-province, 42-sector tables for 2012, 2015, and 2017. Provincial oil consumption figures are collected from energy statistical yearbooks (2007 and 2010) and from CEADs’ energy inventories (2012, 2015, and 2017), with Tibet excluded due to data unavailability. For the GTWR model analysis, the explanatory variables are primarily sourced from AutoNavi Maps, China Statistical Yearbook, and provincial statistical yearbooks. All variables are standardized using the standard deviation method to eliminate scale-related biases.
The sector classification was consolidated into 28 standardized categories, as shown in Table 2, to resolve inconsistencies across source datasets (which used 30–42 sectors) and maintain temporal comparability. This level of aggregation provides an optimal balance between detail and analytical practicality, emphasizing energy-intensive industries relevant to China’s policy priorities without over-fragmenting smaller sectors.

Table 2.
Sector classification.
The term “oil” in this research adopts a broad definition, encompassing the aggregate of crude oil, gasoline, diesel, kerosene, fuel oil, liquefied petroleum gas, and other petroleum products as specified in the energy emissions inventory.
4.2. Spatiotemporal Patterns of China’s Embodied Oil Flows Based on Consumption
The “who consumes, who pays” principle suggests that a region’s demand can drive oil consumption in other areas through domestic supply chains. Although not directly consumed locally, this embodied oil transfer implies shared environmental responsibility. Analyzing these flows reveals China’s interregional economic ties and energy distribution patterns, highlighting development imbalances and consumption disparities. This study adopts a consumption-based perspective to quantify embodied oil flows in China’s domestic trade. By comparing interprovincial inflow volumes across different time points, we can assess the spatiotemporal evolution patterns of these flows. Figure 2 illustrates the scale and trends of consumption-side embodied oil inflows across China’s 30 provinces from 2007 to 2017. The key findings are as follows.
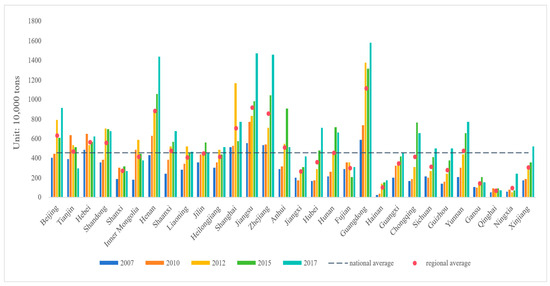
Figure 2.
Embodied oil inflows (unit: 10,000 tons) in China’s domestic trade: provincial patterns and trends (2007–2017).
Between 2007 and 2017, most Chinese provinces exhibited growing consumption-side embodied oil inflows, with Guangdong, Jiangsu, Zhejiang, and Henan emerging as the dominant recipients. In 2017, Guangdong received 15.80 million tons of embodied oil inflows, ranking first nationally, while Jiangsu, Zhejiang, and Henan followed closely, each receiving approximately 14 million tons. These figures all significantly exceeded the provincial average of 6.195 million tons. Notably, Henan and Zhejiang showed the largest increments among all provinces, increasing by 10.1 and 9.2 million tons, respectively. Yunnan demonstrated the most dramatic increase, jumping from 2.07 to 7.72 million tons and ranking sixth nationally. Tianjin was the only province to record a slight decline during this period.
This study further investigates the spatial distribution characteristics of China’s consumption-side embodied oil inflows, which are shown in Figure 3. During the study period, the spatial pattern of these flows exhibited significant dynamic evolution trends.
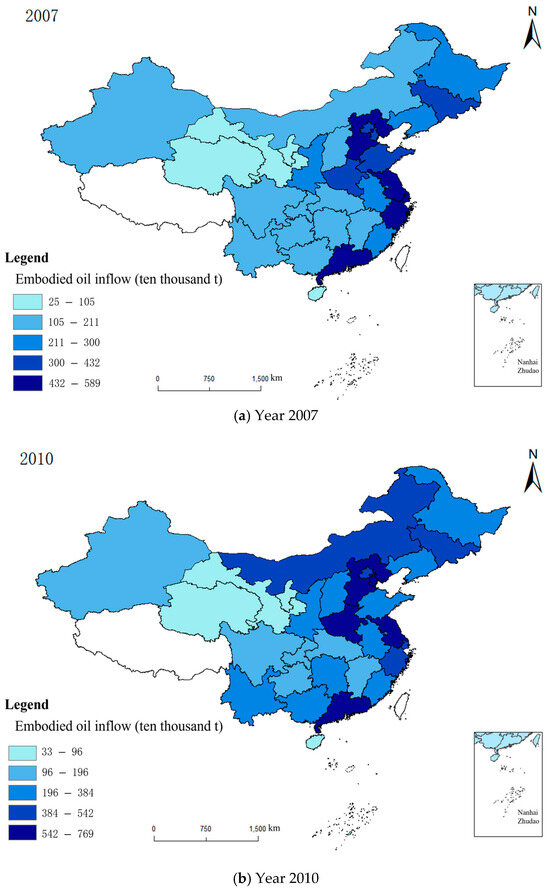
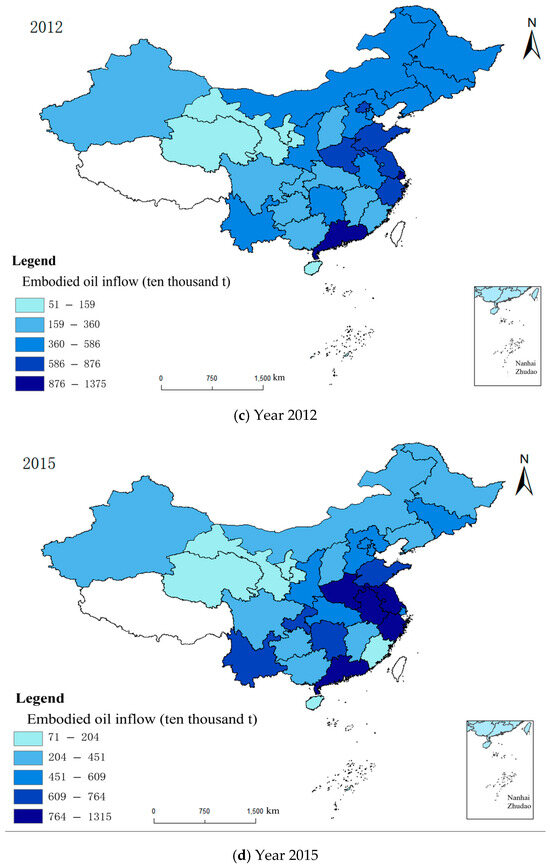
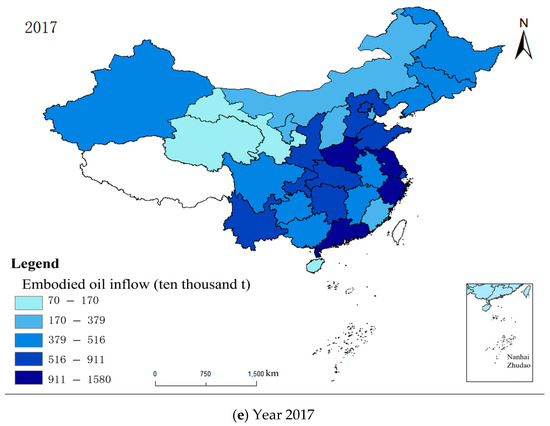
Figure 3.
Spatial distribution of consumption-side embodied oil inflows in China (2007–2017). Note: (1) Created based on China’s standard map GS(2024)0650 [27] with unaltered borders; (2) provincial inflows classified into 5 tiers via GIS Natural Breaks, with darker hues indicating larger volumes.
In 2007, while embodied oil inflows were still relatively dispersed spatially, coastal provinces such as Guangdong, Jiangsu, and Zhejiang already demonstrated significantly higher inflow levels due to energy demand from their manufacturing boom.
By 2010, embodied oil inflows continued to expand in eastern coastal regions, while central provinces such as Henan emerged as new growth poles. This shift mirrored central China’s economic rise and industrial–consumption synergy, strengthening their role in the national energy landscape.
In 2012, while eastern and central regions maintained high embodied oil inflows, southwestern provinces such as Yunnan entered a rapid growth phase. This trend aligned with accelerated economic development and elevated strategic importance in national policies, where infrastructure investments spurred energy-intensive consumption, directly boosting embodied oil inflows.
By 2015, the spatial distribution of embodied oil inflows became more entrenched, with core regions experiencing sustained growth, and interregional disparities widening. This pattern underscored how China’s uneven regional development shaped energy flows: economically advanced areas retained strong demand, while less-developed regions consistently recorded lower inflow levels.
In 2017, spatial divergence intensified further: core provinces of Guangdong, Jiangsu, Zhejiang, and Henan dominated embodied oil inflows, substantially outpacing others, while several western regions maintained stable but minimal levels.
These spatiotemporal patterns clearly reveal how China’s phased and uneven regional economic development has profoundly influenced embodied oil flows. The findings provide critical references for optimizing the regional distribution of embodied oil flows from the consumption side.
4.3. Factors Influencing China’s Consumption-Side Embodied Oil Flows
This study further employs a geographically and temporally weighted regression (GTWR) model to systematically examine the spatiotemporally heterogeneous effects of key determinants on consumption-side embodied oil flows in domestic trade.
4.3.1. Descriptive Statistics
Table 3 presents the descriptive statistics of the four key determinants influencing China’s provincial consumption-side embodied oil flows. To ensure comparability and model stability, all variables are standardized to eliminate dimensional and scale differences.

Table 3.
Variable descriptive statistics.
4.3.2. Model Fitting Results
The GTWR model effectively captures the spatiotemporal variations of regression coefficients by incorporating both temporal and spatial information. Unlike the OLS model, which assumes constant coefficients, GWR accounts for spatial non-stationarity through spatial weighting. GTWR further extends this capability by simultaneously modeling temporal and spatial heterogeneity [28]. Therefore, this study first applies the OLS model to estimate nationwide regression results, then compares the performance of OLS, GWR, and GTWR to identify the optimal model for subsequent analysis.
Table 4 presents the OLS regression results. All four influencing factors were statistically significant, with variance inflation factors (VIFs) all below 10, confirming no multicollinearity issues in this model. The model’s R2 was 0.478, and the adjusted R2 was 0.465, suggesting that the OLS regression model accounted for 46.5% of the variability in embodied oil flows. Additionally, the model’s Koenker (BP) statistic passed the 1% significance test, as the p-value was 0.003, indicating heteroskedasticity, which suggests varying error variances across spatiotemporal units. While heteroskedasticity does not bias OLS’s coefficient estimates, it invalidates standard error estimates, undermining the reliability of hypothesis testing. GTWR addresses this issue by incorporating spatiotemporal weights, which inherently account for heterogeneous variances through localized modeling. This approach improves estimation efficiency and provides more reliable coefficient estimates in the presence of spatial or temporal non-stationarity. Consequently, we employed GWR and GTWR models to better capture the spatiotemporal heterogeneity in the data [29], allowing for more precise characterization and analysis of these variations.

Table 4.
OLS model estimation.
Building upon the global OLS analysis, we implemented GWR and GTWR models in ArcGIS to estimate local coefficients. Model performance was evaluated using R2, adjusted R2, and AICc (corrected Akaike’s information criterion) metrics. Table 5 presents the results. The OLS model without spatiotemporal considerations showed the poorest fit. By incorporating spatial relationships, the GWR model showed improvement over OLS; however, the GTWR model, which accounts for both spatial and temporal dimensions, achieved superior goodness-of-fit with the highest adjusted R2 (0.905). These results confirm GTWR as the optimal approach for capturing the spatially varying effects of determinants and consequently adopted for our subsequent analysis.

Table 5.
Model performance comparison (OLS/GWR/GTWR).
4.4. Temporal Variation Analysis of Key Factors Affecting Consumption-Side Embodied Oil Flows in China
This study employs Kernel Density Estimation (KDE) [30] to visualize the distribution dynamics and evolutionary trends of variable coefficients, revealing temporal variations in how key factors influence consumption-side embodied oil flows in China.
Figure 4 reveals significant temporal evolution in the economic development coefficient’s impact on embodied oil flows. The coefficient distribution shifted from predominantly negative values before and including 2015, to positive values by 2017, showing a distinct rightward trend. Specifically, in 2007, the peak of the economic development level coefficient occurred at −2.97, indicating that for most provinces, each unit increase in economic development level corresponded to a 2.97-unit decrease in consumption-side embodied oil inflows. This pattern reflected the synergistic effects of energy conservation policies and industrial restructuring, which decoupled economic growth from oil demand. However, by 2017, this trend reversed fundamentally: each growth unit now added 2.4 inflow units, indicating greater interprovincial burden transfer and higher oil costs of development.
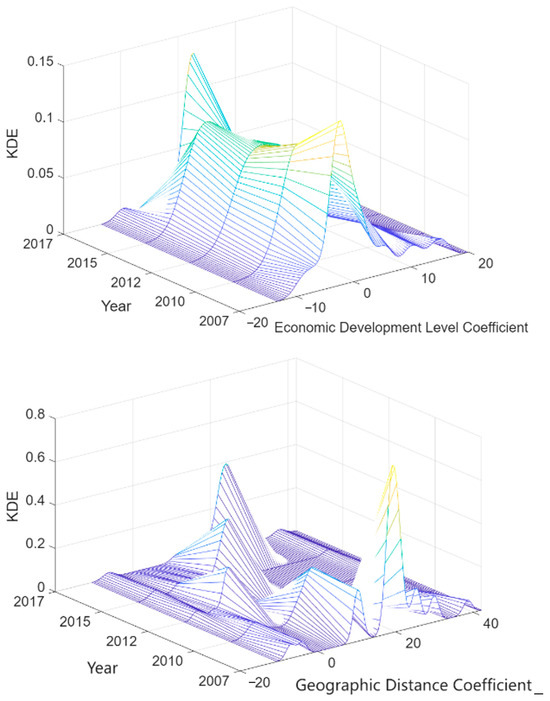
Figure 4.
Spatiotemporal patterns of economic development level and geographic distance effects on embodied oil flows in China’s domestic trade.
Geographic distance predominantly exerted positive effects on embodied oil flows, as shown in Figure 4. The coefficient distribution evolved from a multi-peak pattern in 2007 to a single-peak concentration in 2017. In 2007, the highest peak occurred at 19.7, indicating that for most provinces, each unit increase in geographic distance corresponded to a 19.7-unit rise in cross-provincial embodied oil inflows. Secondary peaks were observed at 10.2 and 25.2. In 2017, the peak value rose to 24.0. Compared with 2007, this indicates that a one-unit increase in geographic distance led to a 24.0-unit growth in cross-provincial embodied oil inflows for most provinces. These findings demonstrate a persistent intensification of distance effects over the decade, highlighting the growing significance of transportation-related oil consumption in interprovincial trade.
Figure 5 shows that the green development coefficient shifts from positive to negative over time, with its negative impact growing stronger. This transformation demonstrates green technology’s evolving role in reducing China’s embodied oil flows. In 2007, the positive coefficient peaked at 2.5, indicating that for every unit improvement in green technology, embodied oil flows rose by 2.5 units. This paradoxical relationship suggests that early-stage green technologies were either insufficiently developed or implemented to achieve meaningful oil savings. Over time, however, the coefficient shifted from positive to negative, clear evidence of emerging energy-saving effects from maturing green technologies. By 2017, the coefficient distribution exhibited multiple peaks, mostly concentrated in the negative range, with the strongest effect reaching −17.9. This represents a dramatic shift where each unit of green technology advancement reduced embodied oil inflows by 17.9 units in most regions. The pronounced leftward shift in coefficient distribution throughout the study period underscores both the improving efficiency of green technology adoption and its increasingly potent oil conservation effects at regional scales.
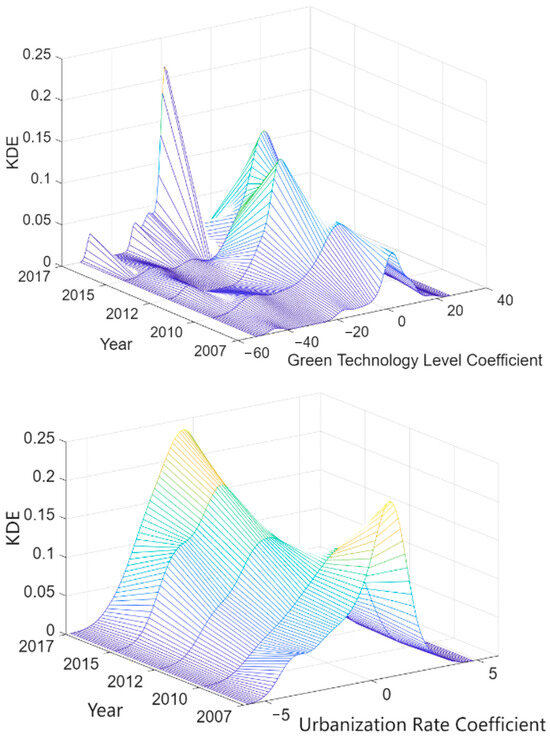
Figure 5.
Spatiotemporal patterns of green technology level and urbanization rate effects on embodied oil flows in China’s domestic trade.
As illustrated in Figure 5, the urbanization rate coefficient displayed clear phase-dependent characteristics, undergoing a complete transition from positive to negative values. In 2007, the coefficient peaked at 0.8, revealing that urbanization initially served as a driver of interprovincial embodied oil flows, with each unit increase in urbanization corresponding to a 0.8-unit rise in oil inflows for most regions. By 2010, the peak coefficient declined to 0.5 but remained positive, indicating that urbanization still strongly correlated with rising oil inflows. The post-2012 period marked a fundamental shift, with coefficients entering negative territory and exhibiting a persistent leftward trend. By 2017, the peak coefficient had reached −0.3, demonstrating that urbanization had become a mitigating factor for external oil inflows. This reversal suggests that mature urbanization patterns, coupled with effective urban planning and clean energy policies, can ultimately reduce regional oil dependency.
4.5. Spatial Heterogeneity Analysis of Key Factors Affecting Consumption-Side Embodied Oil Flows in China
The year 2017 marked a pivotal stage in China’s supply-side structural reform, witnessing significant economic restructuring that substantially altered the spatiotemporal patterns of embodied oil flows. We select 2017 for its representativeness and data availability, as it is the latest year with complete interprovincial input–output tables. Using ArcGIS, we visualize the GTWR model coefficients and analyze spatial heterogeneity by mapping province-specific regression coefficients.
As Figure 6 indicates, economic development generally increased embodied oil inflows across regions. The strongest effects occurred in Xinjiang and Ningxia (Northwest China), where a 1-unit increase in economic growth increased inflows by over 13.5 units. This highlights their reliance on energy-intensive development models and a slower transition to sustainable consumption patterns. In contrast, Sichuan (Southwest), Gansu (Northwest), and eastern coastal regions, including Shanghai, Zhejiang, and Jiangsu, had negative coefficients. Here, each unit of economic growth reduced embodied oil inflows by more than 1.2 units. This contrast reflects two distinct scenarios: inland provinces with weaker consumption capacity and coastal regions with more advanced economic structures. The latter benefit from technology-driven, service-oriented development and higher energy efficiency, enabling more sustainable growth. A closer examination of major inflow hubs reveals further divergence: while Guangdong’s economic growth increases embodied oil inflows, Jiangsu, Zhejiang, and Henan experience reductions.
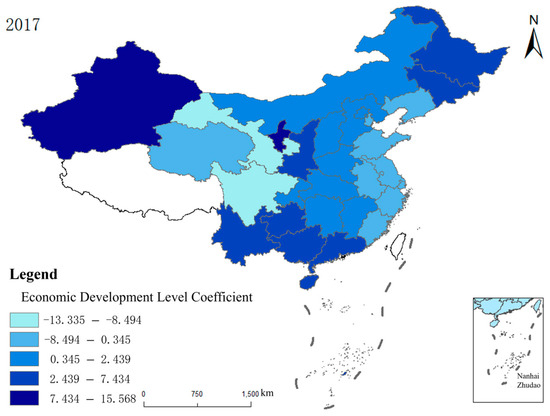
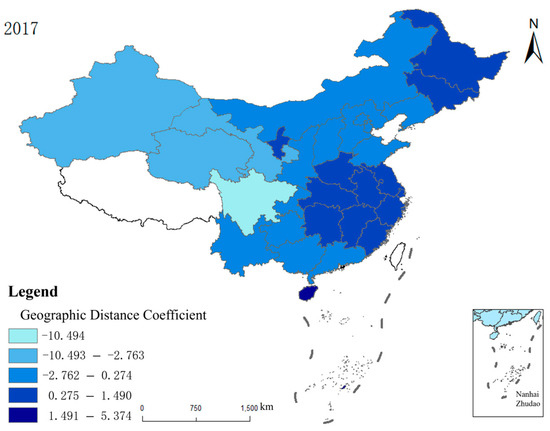
Figure 6.
Spatial distribution of economic development level and geographic distance coefficients affecting embodied oil flows across China’s 30 provinces. Note: (1) Created based on China’s standard map GS(2024) 0650 with unaltered borders; (2) coefficients classified into 5 tiers via GIS Natural Breaks, with darker hues indicating stronger positive effects.
Geographic distance generally has a positive effect on embodied oil inflows in domestic trade, as greater distances increase interregional transport costs for these flows. This effect is most pronounced in eastern and southern coastal regions, where longer distances lead to higher embodied oil inflows. Rather than restricting resource acquisition, increased distance in these areas elevates energy consumption costs associated with transporting goods to meet local final demand. On the contrary, southwestern and northwestern regions show mostly negative coefficients, meaning greater distances reduce embodied oil inflows due to transport infrastructure limitations and geographical constraints. Among major inflow hubs, Guangdong and Henan display slight negative distance effects, while Jiangsu and Zhejiang exhibit positive ones.
Figure 7 shows that higher green technology levels generally reduce embodied oil inflows in domestic trade. This inhibitory effect is particularly strong in southern coastal areas, the Yellow River midstream region, and southwestern China, where each unit of green technology advancement decreases inflows by over 0.4 units. However, eastern coastal areas exhibit the most significant energy rebound effect [31], where efficiency gains from technological improvements paradoxically increase energy demand through expanded production and consumption, with one-unit technological improvement actually increasing inflows by 1.9 units, on average. Similar but weaker positive effects are observed in northern coastal (+1.4 units) and northeast (+0.7 units) regions. Notably, all major hubs (Guangdong, Jiangsu, Zhejiang, and Henan) experience reduced inflows through green technology, with Guangdong demonstrating the strongest effect, highlighting its exceptional capacity to limit external inflows.
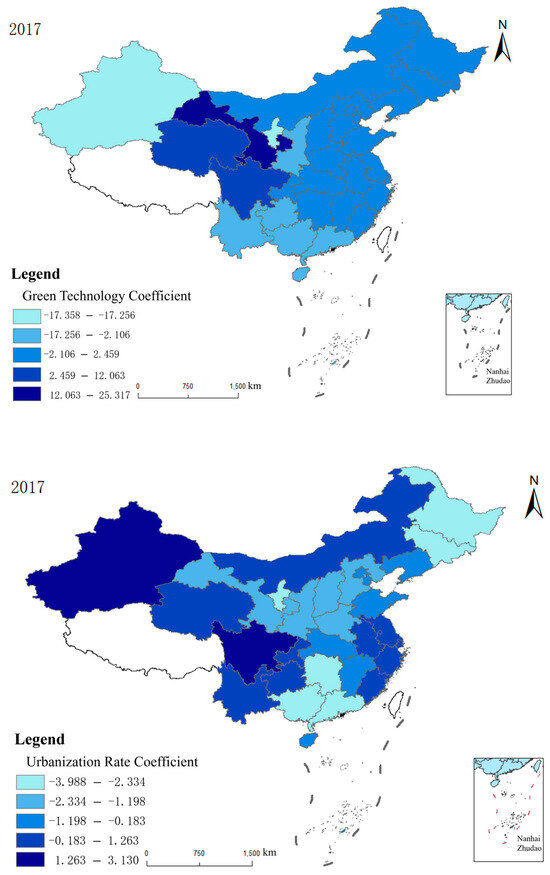
Figure 7.
Spatial distribution of green technology level and urbanization rate coefficients affecting embodied oil flows across China’s 30 provinces. Note: (1) Created based on China’s standard map GS(2024) 0650 with unaltered borders; (2) coefficients classified into 5 tiers via GIS Natural Breaks, with darker hues indicating stronger positive effects.
Urbanization typically decreases embodied oil inflows in domestic trade, with negative effects observed in over two-thirds of provinces; specifically, a 1-unit increase in urbanization rate reduces embodied oil by at least 0.07 units. However, several regions exhibit the opposite pattern, including Xinjiang and Qinghai in the northwest, Sichuan and Yunnan in the southwest, as well as coastal provinces such as Zhejiang and Shanghai in the east. In these areas, each unit of urbanization increases inflows by more than 0.27 units, indicating its driving effect on external embodied oil consumption.
5. Discussion
5.1. Imbalanced Spatial Pattern of Embodied Oil Inflow in China
The analysis reveals distinct regional patterns in China’s embodied oil flows, with consumption-side inflows heavily concentrated in economically developed eastern coastal and central provinces, including Guangdong, Zhejiang, Jiangsu, and Henan. This spatial concentration stems from growing domestic consumption demand resulting from rising incomes, which has transformed consumption patterns from basic necessities to development-focused and leisure-oriented expenditures [32].
Regional economic structures clearly explain these patterns. Guangdong boasts strong manufacturing foundations, while Jiangsu and Zhejiang balance high-tech industries with traditional manufacturing. Henan functions as both a major industrial base and a densely populated province. As these developed regions drive consumption, they consequently shoulder greater responsibility for managing the associated resource and environmental impacts. These findings highlight the complexity of China’s embodied oil flows and offer valuable insights into their underlying drivers.
The analysis shows that economically developed provinces in the eastern coastal and central regions exhibit significantly higher embodied oil inflows. This phenomenon stems directly from three key factors: (1) their advanced economic development, (2) specialized industrial composition, and (3) distinctive consumption patterns. Their rapid economic growth and substantial demand for energy-intensive goods and services have directly shaped this spatial distribution.
In contrast, western regions in China maintain stable yet minimal inflow levels. Ningxia and Qinghai provinces, for instance, average below 2 million tons of embodied oil inflows, significantly lower than eastern regions. This spatial disparity underscores how China’s uneven regional development governs energy flows: economically advanced areas sustain strong demand, while less-developed regions persistently record lower inflow volumes.
5.2. Temporal Trend of the Effects of Key Factors on the Embodied Oil Flows in China
The influence of key factors on consumption-side embodied oil flows varies over time, as summarized below.
Firstly, before 2015, economic development generally suppressed embodied oil consumption, as indicated by negative coefficients. After 2017, however, the coefficient turned positive, suggesting that rising living standards and expanded commercial activities drove up demand for interprovincial embodied oil. This shift ultimately increased consumption-side energy burdens.
Secondly, the geographic distance coefficient remained consistently positive but evolved from multiple peaks to a single, higher peak over time. This trend reflects regional disparities in infrastructure and transport systems, which contributed to uneven resource flows and higher cross-region embodied oil consumption [18]. As economic activity intensified and regional integration advanced, the influence of distance grew stronger, further elevating the coefficient’s peak value.
Thirdly, the peak coefficient of green technology shifted from positive to negative during the study period, showing a clear leftward trend. In the initial phase, surprisingly, green technology advancements actually increased embodied oil consumption. This occurred because energy demands from capital intensification and output growth offset the potential savings [33]. Over time, however, the energy conservation effects became dominant.
Finally, urbanization’s coefficient transitioned from positive to negative, showing an overall leftward trend. This indicates that although urban expansion initially boosted cross-province embodied oil flows, China’s 2012 introduction of stricter energy efficiency standards and renewable energy policies reversed this pattern. Ultimately, these measures reduced external embodied oil inflows associated with urban development.
5.3. Spatial Pattern of Key Factors Affecting the Embodied Oil Flows in China
The impact of economic development on embodied oil inflows varies significantly by region. Resource-dependent northwestern areas such as Xinjiang and Ningxia exhibit increased reliance due to extensive growth patterns. In contrast, more advanced economies such as Sichuan and Gansu, along with coastal provinces (Shanghai, Zhejiang, Jiangsu), show reduced dependence, benefiting from their transition to technology- and service-driven models and superior energy efficiency.
The influence of geographic distance similarly shows regional variation. In relatively prosperous eastern and southern coastal areas, especially the Yangtze River Delta, a greater distance correlates with increased inflows. This pattern reflects these areas’ active interprovincial trade networks and advanced infrastructure. Conversely, the southwest and northwest face clear distance barriers due to underdeveloped transportation systems and limited market integration. In these regions, increased distance consistently suppresses embodied oil inflows.
The effect of green technology varies regionally: while technological improvements in the southern coast, mid-Yellow River region, and southwest successfully reduce embodied oil inflows, they produce the opposite effect in eastern coastal areas. This counterintuitive result likely reflects eastern areas’ limited innovation capacity, where high costs and poor adoption undermine energy efficiency [31].
The relationship between urbanization and embodied oil flows exhibits distinct regional patterns. In over two-thirds of provinces, increased urbanization helps reduce embodied oil inflows, suggesting that urbanization decreases these regions’ reliance on external embodied oil. However, three exceptions emerge: (1) northwestern and southwestern regions, where rapid urbanization and concentrated populations escalate infrastructure demands, thereby increasing embodied oil consumption; (2) eastern coastal areas, where changing residential consumption patterns, particularly growing demand for energy-intensive goods, have driven higher inflows.
6. Conclusions
This study innovatively combines a multi-regional input–output (MRIO) model with geographically and temporally weighted regression (GTWR) to track China’s interprovincial embodied oil flows from 2007 to 2017. This integrated approach not only quantifies consumption-side oil transfers but also reveals the spatiotemporal evolution of driving factors across provinces, providing new insights for regional energy policymaking. Key findings demonstrate significant variations in oil flow patterns and their determinants over time and space.
- (1)
- Regional disparities in embodied oil inflows are evident, with eastern coastal and central areas dominating, but southwestern regions growing faster. Most provinces saw rising oil inflows, mainly in developed eastern coastal and central provinces, such as Guangdong, Zhejiang, and Henan. Meanwhile, southwestern provinces such as Sichuan and Yunnan experienced faster growth in inflows.
- (2)
- Economic growth and geographic distance drive embodied oil flows, while green technology and urbanization increasingly mitigate them. Temporal analysis shows that economic expansion and geographic distance generally boosted oil flows, whereas green technology’s suppressing effect has strengthened. Recently, urbanization has also started to exert negative influences.
- (3)
- Spatial patterns reveal regional differences in embodied oil dependencies and their driving factors. Northwestern regions such as Xinjiang and Ningxia remained heavily dependent on external embodied oil due to economic growth. In contrast, distances increased inflow costs in the southeast. Although green technology has advanced in coastal eastern and northern regions, it has not yet significantly curbed embodied oil inflows. At the same time, urbanization in the northwest and southwest continues to rely substantially on external oil resources.
7. Policy Implications
One key policy implication is optimizing trade structures and balancing environmental responsibilities. Developed eastern and central provinces, such as Guangdong, Jiangsu, Zhejiang, and Henan, should implement targeted measures to reduce reliance on energy-intensive goods. This includes (1) industrial restructuring through tax incentives for advanced manufacturing and penalties for high-oil-intensity sectors; (2) energy efficiency innovation programs, involving government-backed demonstration projects for cutting-edge technologies and performance-based subsidies for enterprises verifying energy intensity reductions; and (3) regional coordination mechanisms, such as cross-provincial clean energy partnerships and subsidies for low-carbon logistics. These steps align with the “dual control” system and address spatial disparities in embodied oil flows.
The second is to establish a scientifically grounded environmental responsibility accounting system. An environmental accountability system based on the “consumer pays” principle should be implemented to clarify regional responsibilities. Fiscal subsidies, tax incentives, and other policy tools can encourage green technology adoption and sustainable consumption, thereby reducing demand for energy-intensive products. These targeted measures would help optimize regional embodied oil flows, fostering a virtuous cycle between economic growth and environmental protection.
Third, region-specific oil conservation policies should be implemented. In northwest provinces such as Xinjiang and Ningxia, where economic development drives high embodied oil consumption, priorities should include transitioning to clean energy and strengthening regional energy cooperation to decrease dependence on external oil inflows. Southeast areas facing high transport costs should optimize logistics networks and diversify energy supply sources. Coastal areas require enhanced policy and financial support to mitigate the “energy rebound” effect of green technologies and ensure their full effectiveness. In northwestern and southwestern regions, where urbanization remains heavily dependent on external embodied oil, urban development strategies should fully integrate green principles. This includes implementing eco-friendly upgrades to urban infrastructure throughout the urbanization process.
Author Contributions
Conceptualization, C.Z., P.W. and S.Z.; Methodology, C.Z. and P.W.; Software, C.Z. and P.W.; Validation, C.Z. and P.W.; Formal analysis, P.W. and S.Z.; Resources, C.Z.; Data curation, S.Z.; Writing—original draft, P.W.; Writing—review & editing, S.Z.; Visualization, C.Z.; Supervision, C.Z.; Project administration, C.Z.; Funding acquisition, C.Z. All authors have read and agreed to the published version of the manuscript.
Funding
This research is supported by the National Social Sciences Fund of China (No. 24AJL007).
Data Availability Statement
The data presented in this study are available on request from the corresponding author due to the restrictions on data publication.
Conflicts of Interest
The authors declare no conflict of interest.
References
- Ding, M.-M.; Feng, L.-Y.; Li, S.-Q.; Tang, X.; Zhang, B.-S. Analysis of Passive Net Oil Exports through “Made in China” Products. Resour. Sci. 2012, 34, 295–300. [Google Scholar]
- Chen, Z.-M.; Chen, G.-Q. Demand-driven energy requirement of world economy 2007: A multi-region input–output network simulation. Commun. Nonlinear Sci. Numer. Simul. 2013, 18, 1757–1774. [Google Scholar] [CrossRef]
- Liu, H.-G.; Liu, W.-D.; Fan, X.-M.; Liu, Z.-G. Carbon emissions embodied in value added chains in China. J. Clean. Prod. 2015, 103, 362–370. [Google Scholar] [CrossRef]
- Peng, S.-J.; Zhang, W.-C.; Sun, C.-W. China’s Production-Based and Consumption-Based Carbon Emissions and Their Determinants. Econ. Res. J. 2015, 50, 168–182. [Google Scholar]
- Zhang, C.-G.; Yu, X.-X.; Zhou, J.-C. China’s embodied oil outflow in GVC participation: Patterns and drivers. Resour. Policy 2024, 91, 104893. [Google Scholar] [CrossRef]
- Odum, H.T. Environment, Power, and Society; John Wiley & Sons Inc: Hoboken, NJ, USA, 1971. [Google Scholar]
- Leontief, W. Air pollution and the economic structure: Empirical results of input-output computations. Input-Output Tech. 1972, 7, 236–239. [Google Scholar]
- Zhang, C.-G.; Dong, M.-F. China’s embodied oil outflow: Estimation and structural path analysis. Environ. Dev. Sustain. 2022, 25, 14861–14885. [Google Scholar] [CrossRef]
- Ding, Z.-L.; Duan, X.-N.; Ge, Q.-S.; Zhang, Z.-Q. Evaluation of International Greenhouse Gas Emission Reduction Schemes and Discussion on China’s Long-term Emission Rights. Sci. China Ser. D Earth Sci. 2009, 39, 1659–1671. [Google Scholar]
- Peng, S.-J.; Zhang, W.-C.; Wei, R. National Carbon Emission Responsibility. Econ. Res. J. 2016, 51, 137–150. [Google Scholar]
- Zhang, Y.-G. Research on Benefit-based Regional Energy Consumption Responsibility. China Popul. Resour. Environ. 2014, 24, 75–83. [Google Scholar]
- Feng, K.-S.; Hubacek, K.; Sun, L.-X.; Liu, Z. Consumption-based CO2 accounting of China’s megacities: The case of Beijing, Tianjin, Shanghai and Chongqing. Ecol. Indic. 2014, 47, 26–31. [Google Scholar] [CrossRef]
- Peters, G.P. From production-based to consumption-based national emission inventories. Ecol. Econ. 2008, 65, 13–23. [Google Scholar] [CrossRef]
- Wang, H.; Ang, B.W.; Su, B. Assessing drivers of economy-wide energy use and emissions: IDA versus SDA. Energy Policy 2017, 107, 585–599. [Google Scholar] [CrossRef]
- Duarte, R.; Pinilla, V.; Serrano, A. Factors driving embodied carbon in international trade: A multiregional input–output gravity model. Econ. Syst. Res. 2018, 30, 545–566. [Google Scholar] [CrossRef]
- Aichele, R.; Felbermayr, G. Kyoto and Carbon Leakage: An Empirical Analysis of the Carbon Content of Bilateral Trade. Rev. Econ. Stat. 2015, 97, 104–115. [Google Scholar] [CrossRef]
- Zhong, S.; Goh, T.; Su, B. Patterns and drivers of embodied carbon intensity in international exports: The role of trade and environmental policies. Energy Econ. 2022, 114, 106313. [Google Scholar] [CrossRef]
- Xu, J.-J.; Yang, X.-J.; LI, R. The spatial and temporal heterogeneity of carbon emission and its driving forces in urban households. China Environ. Sci. 2024, 44, 1732–1742. [Google Scholar]
- Deng, G.-Y.; Chen, H.-H. Estimating China’s regional embodied energy trade from the perspective of value-added trade and its influencing factors. Resour. Sci. 2022, 44, 1036–1050. [Google Scholar]
- Dong, B.-Y.; Xu, Y.-Z. Welfare spillover effects of interprovincial carbon emission transfer in China. China Popul. Resour. Environ. 2022, 32, 58–69. [Google Scholar]
- Deng, G.-Y. Analysis of Regional Differences in Carbon Emissions from Energy Consumption and Their Influencing Factors. Stat. Decis. 2023, 39, 56–60. [Google Scholar]
- Chen, C.-F.; Chen, X.; Wang, Z. Theoretical Mechanism and Measurement of Energy Rebound Effect. Stat. Decis. 2021, 37, 52–56. [Google Scholar]
- Chen, W.-X.; Wang, G.-Z.; Xu, N.; Ji, M.; Zeng, J. Promoting or inhibiting? New-type urbanization and urban carbon emissions efficiency in China. Cities 2023, 140, 104429. [Google Scholar] [CrossRef]
- Gu, C.-L.; Ye, X.-Y.; Cao, Q.-W.; Guan, W.-H.; Peng, C.; Wu, Y.-T.; Zhai, W. System dynamics modelling of urbanization under energy constraints in China. Sci. Rep. 2020, 10, 9956. [Google Scholar] [CrossRef]
- Liu, W.-D.; Tang, Z.-P.; Chen, J.; Yang, B. Theory and Practice of Compiling the 2007 Interregional Input-Output Table for 30 Provinces, Municipalities, and Autonomous Regions in China; China Statistics Press: Beijing, China, 2012. [Google Scholar]
- Liu, W.-D.; Tang, Z.-P.; Chen, J.; Yang, B. 2010 Interregional Input-Output Table for 30 Provinces, Municipalities, and Autonomous Regions in China; China Statistics Press: Beijing, China, 2014. [Google Scholar]
- GS(2024)0650; Standard Map of China. Ministry of Natural Resources of the People’s Republic of China: Beijing, China, 2024.
- Ma, X.-W.; Ji, Y.-J.; Yuan, Y.-F.; Van Oort, N.; Jin, Y.-C.; Hoogendoorn, S. A comparison in travel patterns and determinants of user demand between docked and dockless bike-sharing systems using multi-sourced data. Transp. Res. Part A Policy Pract. 2020, 139, 148–173. [Google Scholar] [CrossRef]
- Tang, S.-S.; Zhou, J.; Xu, Q.-Q.; Lin, L.-Y.; Deng, Y.-H. Population distribution evolution and influencing factors of city-town-rural area in Jiangsu Province from 2010 to 2020. Prog. Geogr. 2024, 43, 993–1007. [Google Scholar]
- Parzen, E. On Estimation of a Probability Density Function and Mode. Ann. Math. Stat. 1962, 33, 1065–1076. [Google Scholar] [CrossRef]
- Wang, J.-H.; Xie, Q.-Y.; Shi, D. Research on the Impact of Green Technology Innovation on Energy Efficiency. Financ. Trade Econ. 2024, 45, 143–159. [Google Scholar]
- Chen, J.-D.; Xu, C.; Cui, L.-B.; Huang, S.; Song, M.-L. Driving factors of CO2 emissions and inequality characteristics in China: A combined decomposition approach. Energy Econ. 2019, 78, 589–597. [Google Scholar] [CrossRef]
- Xie, L.; Chen, Y. Can energy-saving innovation help reduce energy consumption?—The re-examination of the Jevons’ paradox. J. Manag. Sci. China 2021, 24, 77–91. [Google Scholar]
Disclaimer/Publisher’s Note: The statements, opinions and data contained in all publications are solely those of the individual author(s) and contributor(s) and not of MDPI and/or the editor(s). MDPI and/or the editor(s) disclaim responsibility for any injury to people or property resulting from any ideas, methods, instructions or products referred to in the content. |
© 2025 by the authors. Licensee MDPI, Basel, Switzerland. This article is an open access article distributed under the terms and conditions of the Creative Commons Attribution (CC BY) license (https://creativecommons.org/licenses/by/4.0/).